
Tourism Pressure at the Regional Level in the Context of Sustainable Development in Romania


1
Department of Statistics and Econometrics, Bucharest University of Economic Studies, 15-17 Dorobanti St., Sector 1, 010552 Bucharest, Romania
2
Department of Geography, Valahia University of Targoviste, 130105 Targoviste, Romania
3
Department of Business Administration, Petroleum-Gas University of Ploiesti, 100680 Ploiesti, Romania
*
Author to whom correspondence should be addressed.
Sustainability 2017, 9(5), 698; https://doi.org/10.3390/su9050698
Submission received: 7 December 2016
/
Revised: 19 April 2017
/
Accepted: 21 April 2017
/
Published: 28 April 2017
(This article belongs to the Special Issue Paradigm Changes in Contemporary Sustainable Hospitality Entrepreneurship)
Abstract
:Tourism, through its components, can be found in all areas that relate to sustainable development principles. Although it should be encouraged due to the multiplier effect that it has in the development of a region, it creates pressure on the surrounding environment like any other economic activity in the process of specific potential capitalization. This paper is aimed at determining the degree of tourism pressure, its trend and impact on tourism’s sustainable development and the Romanian economy. When this pressure exceeds the ecological support capacity, negative effects occur, both on the landscape in general, and on certain tourist objectives, in particular. The assessment of this pressure and its most accurate quantification imply the use, calculation, correlation and interpolation of indicators that may summarize certain aspects related to the density of tourist fittings, tourist traffic intensity and capitalization level. Hence, the approach would be considered regionally and in terms of tourism pressure dynamics, depending on the structure of available statistical data, as well as to get a clearer picture. The authors used methods specific to geography, as well as statistical and econometric methods. The interdependence between tourism, tourism pressure and sustainability is described in the Central region. The results and observations determined with reference to the factors and indicators shown underlie the coordination of the tourism activity in the other regions according to the processes of sustainability and tourism pressure mitigation.
1. Introduction
Romania’s tourism potential, the international trend of promoting and practicing tourism under sustainable conditions, high quality, and responsibility are prompting a change in the attitude of tourists. This change will be directed towards the consumption of tourism products resulting from the organization of holidays that are cheaper and more sustainable holidays than other known types of holiday, and will be based on information related to the promotion of sustainable holiday types [1].
The analysis of regional tourism pressure is necessitated by the extent of the supply and demand relationship, by the interdependence of the indicators of tourist demand and by the absorption capacity of the region. In this context, problems arise concerning environmental protection and quality, with respect to processes of economic growth, human population growth or poverty, as well as variations in political conditions. Various human activities, including tourism, can cause major losses of natural assets. At the same time, the emergence of tourism activity in various forms can lead to negative effects related to air pollution, land use, availability and quality of water resources, and biodiversity. This two-way relationship emphasizes that erosion and salinization, along with pollution and climate change, may be important factors in the degradation of ecosystem quality. It is clear that all these issues are strongly connected, in terms of both cause and effect. There is a direct relationship between tourism impact and sustainability on the structures of a given area. Based on this argument, successful long-term sustainable tourism developments can only be achieved by removing the negative impacts of tourism [2]. The close relationship between tourism and the environment is based on: the physical-geographical environmental elements considered to be tourist attractions; facilities and tourism infrastructure belonging to the man-made environment; and the environmental impacts generated by tourism development and tourist use of regions [3].
Taking into account the sustainability process, environmentally-interrelated tourism can be approached in two forms: a reduced form and an extended/broad form. The reduced form includes two directions: environment-sensitive tourism and environment-dependent tourism [4]. Environment-sensitive tourism targets the pollution, the conservation of nature, respectively the protection of the build environment, and the environment-dependent tourism refers to the “green sector” of the tourism industry that offers a nature experience. The broad form includes the occurrence of tourism events in the context of local culture and improvements in the economic profitability of the tourism industry.
Accelerated tourism development, a feature of human society over the last 50–60 years, raises the question of the balance between meeting the demand for tourism and its ability to be absorbed by the environment. The pressure that occurs may be addressed in two ways: one connected to tourist resources or the tourist potential component (both natural and anthropogenic); and another related to the social component, meaning the impact on the resident population in those areas. Basically, exceeding the maximum visitation capacity (by direct tourism pressure on the landscape or other touristic attractions through the incorrect capitalization of touristic attractions) leads to a series of negative effects, starting with the tourist attractions and the tourists’ satisfaction, and ending with the residents’ perception [5]. “The residents compete with those temporarily visiting the city (tourists, visitors, commuters, migrant workers) for the use of the space and the services. The competition takes place especially when using buildings, due to the increased demand for non-residential uses. Since there is a demand excess, it generates higher prices in the real estate and products markets, leading to an increase in the cost of living. Tourism usage can help improve the economic and social conditions of some of the residents, but it can also cause an increase of the environmental issues (...). In addition, these make the residents’ access to public transport difficult” [6]. The negative impacts may be related to spa mineral degradation, water, air, noise, visual pollutions, waste disposal, ecological risk, environmental risk, the impact on architectural or historic sites, as well as land use as a whole [7,8].
We start this research based on the assessment, the dynamics, and the intensity of tourism pressure in the Carpathian-Danubian-Pontic space, which is useful in view of the fact that Romania, compared to other developed countries in Europe, still has many areas with great potential, free from pollution, excessive urbanization or irreversible human intervention. Such areas could become truly unique on the continent if their current balance is preserved. We would like to highlight the growing tourism pressure density, which, on one hand, is beneficial to the tourism sector and the country’s economy but which, on the other hand, increases the care for the future sustainability of this phenomenon. “Such a study should provide local authorities and managers with a standardized model for making decisions on managing their visitors in protected areas” [9]. This assessment should not be seen as a special feature to be used in difficult times, but rather as part of the program cycle [10]. “The trend is to achieve a balance between development and preservation, to find the best forms of tourism for an area, taking into account its ecology and culture. To achieve this balance, the limit or even the termination of the extensive development may be necessary, requiring a wide range of tourism management measures” [11].
Sustainable tourism should also maintain a high level of tourist satisfaction and ensure a meaningful experience to the tourists, raising awareness about sustainability issues and promoting sustainable tourism practices amongst them. Worldwide tourist flow intensity reaches very high values in Europe—especially in countries like France, Italy or Spain.
The goal of this research was to determine the tourism pressure, trend and impact on the sustainable development of Romanian tourism and the economy. Considering this, the paper was structured in five sections as follows: a brief introduction on the importance of the pressure analysis from the sustainable development plan; a second section comprising a literature review that highlights the concepts of sustainability, sustainable tourism and ecotourism; a third section on the methodology and the data used in the analysis carried out in the article; a fourth section analyzing the tourism pressure assessment indicators for the period 1992–2014, divided into two sub-sections covering, on the one hand, the trends of the indicators in Romania and, on the other hand, their regional trends, meaning the macro-regions and the country’s regions. The article ends with a concluding section that summarizes the results of the analysis with proposals and a vision for future research.
2. The Concepts of Sustainability and Sustainable Tourism
The concept of sustainability was first brought to the attention of the public by WCS (World Conservation Strategy), in 1980. The notion of sustainable development highlighted the relationship between economic growth and the preservation and conservation of natural resources [12]. One of the most quoted definitions of sustainable development is the one proposed by the World Commission on Environment and Development, led by Gro Harlem Brundtland, Prime Minister of Norway, in 1987. According to the Brundtland Report (Our Common Future), sustainable development involves “the commitment to a development that allows fulfilling the needs of current generations, without compromising the ability of future generations to fulfil their own” [13].
The World Conference on the Environment in Rio de Janeiro, in 1992, focused on this concept, which implies a balance between economic growth and environmental protection and finding alternative resources. The synonym sustainable development is used mainly when referring to the overall economic growth of a country or region. International concerns have continued, such as the Monterey Conference on Development Finances, the Doha Ministerial Conference, and the World Summit on Sustainable Development held in Johannesburg in 2002, organized by the UNO (Rio + 10). On this occasion, the manner of achieving the goals set in 1992 at the conference in Rio de Janeiro was analyzed. The Johannesburg Declaration was adopted, and the collective responsibility was undertaken to advance and strengthen the three interdependent pillars of sustainable development: economic growth, social development and environmental protection at the local, national, regional and global levels. Also, the UNO organized the 2012 United Nations Conference on Sustainable Development (Rio + 20), also held in Rio de Janeiro, where, among other things, innovative guidelines on ecological economic policies were adopted.
Sustainable development implies that the interaction between the economy, society and the environment (ecology) should be acceptable, viable, sustainable and fair. “Within the context of sustainability, to develop oneself does not mean to grow indefinitely. At one point, a sustainable community stops growing, but continues to change effectively using the existing resources” [14].
The reference to the needs of current and future generations focuses on two aspects of fairness: fairness within generations (within a generation) and fairness between generations (between different generations) [15].
A very important element for sustainable development and environmental improvement is “eco-efficiency”—it may allow us to use nature for those economic activities needed to satisfy human needs (welfare) and to maintain the conservation capacity to ensure a fair access to environment use by current and future generations [16].
Sustainable tourism is a specific term used to describe the application of sustainable development principles to the particular context of tourism [17]. Sustainable tourism should ensure and reflect three aspects—quality, continuity and balance—and refers to three fundamental directions: economic growth, environmental sustainability and social fairness. For example, in a study published in 1990, the authors [18] stated that the analysis of regional sustainable development must take into account and assess biophysical elements (climate, water, vegetation, fauna, soils), behavioral elements (related to the resident population and tourists) and economic facilities (services, accommodation, the work force employed); basically, three categories of indicators. In other studies [19], the conceptual framework of social sustainability is complete if it consists of four interrelated concepts: Equity with three sizes (recognition—which “capitalizes unjustly devalued identities”; redistribution—“remedy for injustice is some form of economic restructuring”; parity of participation—“promotes substantive public involvement in the production of space”); Safety—interweaving sustainability in general, and social sustainability in particular; Eco-presumption—the achievement of values in a socially- and environmentally-responsible manner; Urban Forms—represented by social and physical forms requiring a feeling of safety, of community, and of attachment to the tourist place. Each concept has a distinctive function and incorporates major social issues [19].
Tourism, more than any other field, depends on the environment, which represents the “raw material”, the object and the space for its activities. Environmental quality may be a favorable or a restrictive factor when conducting tourism activities.
Sustainable tourism, based on respect for the environment, can make an important contribution not only to the prosperity of the tourism industry, but also to the surrounding areas, ensuring social and economic growth in peripheral areas [20]. Tourism practiced in a sustainable manner gives rise to various activities and allows the economically and environmentally sustainable growth of tourist activities [21].
Sustainable development principles refer to the environmental, economic, socio-cultural and touristic development issues, and a proper balance must be determined between these three aspects to guarantee long-term sustainability [22]. Sustainable tourism has the potential to positively influence the natural and social environment in which it is carried out. At the same time, it may be as harmful as mass tourism if it is not properly organized [23].
The phenomenon of tourism takes place in a more or less anthropogenic geographical environment, under the influence of its natural geographical, economic and social factors; and geography, as a science of space and the environment formed on the earth’s surface, aims at contributing to this field of research and the improvement of this phenomenon by its own means [24].
While it may seem somewhat surprising, the concept of accommodation capacity has a long history, and the implementation and the development of this concept in socio-cultural fields and tourism activities have been intentional for the last 30–40 years [25].Ecological support or load capacity issues differ depending on the three types of touristic areas [26]: areas issuing tourists, not having a special tourist potential, but, due to a high economic level and a better standard of living, they drive tourists to other tourist destinations; transit areas, which may face the congestion and the overloading of the means of transport and the existing touristic structures; receiving areas, which face the highest number of problems related to environment deterioration over time and in terms of space.
The concept of reception capacity has a long history and has been applied in biology, wildlife ecology and management. However, considerable efforts have been made in the implementation and development of this concept in the socio-cultural field and the touristic activities for 25 years [27]. In this regard, a number of authors have issued several definitions of reception capacity, such as: (number of individuals that may be supported by a given territory without the degradation of the biological and social systems) [28]; (type of operation supported to a certain extent by a developed area, during a certain time period, without causing excessive damage to the environment or the visitor’s experience) [29]; (maximum number of people that can use a leisure area without an unacceptable alteration of the physical environment and without a significant decline in the quality of the recreational experience) [30]; (physical, biological, social and psychological abilities as a support for the touristic activity, without diminishing the quality of the environment or the visitor’s satisfaction) [31]; (maximum number of guests that may be accommodated without causing excessive damage or a decline in the visitor’s satisfaction) [32] or (the number of visitors supported by an area without reaching a negative impact on the physical environment, on the tourists’ (psychological) attitude or on the social acceptance level of the guests) [33].
The concept is closely linked to that of tourism pressure both in terms of its excess or compliance and the elements to which they relate. This capacity is determined by measurable criteria relative to quantitative elements (rates), balanced with the concepts of time, space, and tourism [26]. Overall, tourism pressure assessment indicators depend on the analyzed habitat features. “The touristic capacity assesses the ability of a region to incorporate new data following the area development and helps to establish an approved tourism development plan of the region studied” [34].
3. Materials and Methods
Tourism and environmental issues are interrelated and dynamic; therefore, some are not completely solved when new ones occur. In this context, analysis indicators should be treated as a system, and the research process has to be done at various assessment stages. Adriaanse [34] defines an indicator as “a quantitative model and a type of information that allows the perception of a certain phenomenon that is not immediately detectable”. Therefore, the indicators provide a simpler and clearer type of complex information than statistics or complex phenomena. The three main functions of the indicators are: quantification, streamlining and communication [35]. Qualitative analysis has been used in tourism for a long time. This is particularly useful when tourism-related phenomena are imperceptible, and the data to be addressed are difficult to collect [36]. The concepts of sustainability and sustainable development have become very important within tourism policy [37]. Since tourism involves the tourists’ interaction with both the local economy and the community or the environment, applying the concept of sustainable development is very useful [38]. But, to achieve an effective communication between experts and decision makers, a common language is necessary, providing easy ways of comparison, which should be suitable for fast understanding and use, and which may be provided by a number of synthetic indicators.
The concept of sustainable development in tourism has been discussed for about 25–30 years, the academic research focusing on defining the limits of growth and responsibility in tourism. The issue is very complex, and thus is quite difficult to operate/implement in practice [37]. The United Nations Environment Program (UNEP) and the World Tourism Organization (WTO) [39] has defined sustainable tourism as “tourism that takes into account its full current and future economic, social and environmental impact”, meaning, that correlates the needs of the visitors, the industry, the environment and the host communities. It is a definition that allows multiple interpretations and perspectives on sustainability and how growth limits may be defined in tourism.
In order to assess tourism pressure in Romania, three synthetic indicators have been determined and analyzed. These indicators are: Indicator I1—is determined by comparing the number of tourist arrivals in tourist accommodation facilities on the Romanian territory (km2) and highlights the pressure density applied by the tourists at a territorial level; Indicator I2—renders the tourism pressure duration and intensity by comparing the number of overnight stays on the surface (km2), the indicator determines the time period during which the tourists remain in that area; Indicator I3—highlights the pressure applied socially by the tourists, and is determined by dividing the number of tourist arrivals in tourist accommodation facilities by the permanent total population (number of residents). The selection of these indicators was determined by the need to compare the number of tourists (which is the main factor of pressure for our analysis) with the spatial and social components (which are the main elements that support this pressure); the high level of comparability that they offer; the possibility of providing a true picture of the tourist activity intensity in the territory; and, last but not least, the unitary methodology for recording statistics, respectively the availability of these data sets from authorized sources.
The indicators are calculated based on the available statistics at the National Institute of Statistics [40]. The resulting values are grouped into six categories for each indicator (six categories in all three cases to allow further comparison and synthesis)—Table 1.
The three indicators measuring tourism pressure (I1, I2, I3) have been approached considering that they include components that are interrelated with the three fundamental directions: economic growth, environmental sustainability and social fairness.
This analysis was intended to be clearer and more accurate than existing analyses, incorporating the study of the trends of these three indicators at a regional level and translated to the macro-regions and the Romanian regions.
The macro-region corresponds to the NUTS level 1 in the hierarchy of the Member States of the European Union. At the heart of the regional statistics, there is the NUTS classification—the classification of territorial units for statistics. This is a regional classification for the EU Member States based on a hierarchy of regions: the NUTS classification subdivides each Member State into regions at three different levels; covering NUTS levels 1, 2 and 3 from larger to smaller areas [41]. In Romania, there are four macro-regions, each grouping two development areas: Macro-region 1, which includes the NW and Central regions; Macro-region 2, which includes the NE and SE regions; Macro-region 3, which includes the South-Muntenia and Bucharest-Ilfov regions; and Macro-region 4, which includes the SW and W regions.
The initial data on the arrivals, the area, and the number of residents for the Bucharest-Ilfov region led to much higher values for the indicators assessing density, tourism pressure duration, and social extent, than those for the other regions, leading to their separate analysis. This occurs due to the smaller surface area of the region compared to others.
Setting the trends of the tourism pressure assessment indicators in Romania was based on the mean indicators of the dynamic series and the application of a linear regression model [42]. The model validity was tested using ANOVA and the Fisher test [43].
The trend stages of the indicators characterizing the tourism pressures were shown by region, in comparative charts for 1992, 2008, 2010 and 2014. This presentation considered the evidence of differences occurring during the respective year compared to the first year, as well as the influence of the economic crisis on the tourism pressure phenomenon.
The analysis carried out in this article also aimed to study the existence (alternative hypothesis) or nonexistence (null hypothesis) of significant differences between the development regions in terms of tourism pressure, which is important for regional sustainable development, and is assessed through each indicator. This included the use of the ANOVA—Single Factor method.
The thorough analysis of tourism pressure aimed at identifying an econometric model based on cointegration analysis, using panel-type data on GDP, VH, and tourism pressure indicators (I1, I2, I3), for the period 1992–2014 in economic growth regions of Romania (North-West, Central, North-East, South-East, South-Muntenia, Bucharest-Ilfov, South-West, West).
The model development started from the idea that a stable relationship between the variables mentioned implied the description of each variable trend during the analysis period as a cointegrated chronological series.
The determination of cointegration models was based on the two-stage Engle-Granger algorithm. The first stage included the initial testing of variable integration order (the series must be integrated in the same order). Studying and testing the existence of a unit root in the level series and the differentiated variable series considered the null hypothesis: Unit root (assuming the common unit root process). The second stage estimated the linear relationship over the long term by applying the Johansen test [44]. It was used for the cointegration and the estimation of a vector model for error correction (VEC).
Applying statistical and econometric methods and models allowed, on the one hand, a much clearer description of the trends, and, on the other hand, the connection to the application part. The theory-practice interdependence was proved not only by explaining the results, but was visible in the future shaping of a developmental direction that was similar to the trend and corresponded to the previous trend, which could enable the development of trend-appropriate measures, taking into account the sustainability issues.
4. Results and Discussion
The study of the tourism pressure impact in Romania was carried out both territorially and socially for the period 1992–2014. The trend analysis of the three assessment indicators (density, duration and pressure level) at a regional level (by macro-regions and regions) was also more relevant because the more accurate the regions of more intense pressure, the easier mitigating action, in order to maintain the sustainability conditions in order to carry out tourism activities.
4.1. Tourism Pressure Assessment Indicator Trends in Romania
By analyzing the trends of the three indicators assessing tourism pressure in Romania, the indicator for tourism pressure density (I1—Figure 1a) and the indicator for social pressure (I3—Figure 1b) were found to have a similar trend.
In the period 1992–2014, the trends of the indicators assessing tourism pressure in terms of density and at the social level in Romania (I1, I2) varied, showing an almost continuous decline until 2002. The indicator I1 decreased from 39.05 arrivals/km2 in 1992 to 23.62 arrivals/km2 in 2002 (from category IV to category III), while the decrease of the indicator I3 recorded a value fluctuation from 0.35 arrivals/capita (1992, category IV) to 0.21 arrivals/capita (2002, category III). Since 2003, each indicator varied from year to year, having a growth trend which settled after 2012. The maximum values were recorded the year 2014, at 41.25 arrivals/km2 and 0.38 arrivals/capita for the first and second indicators, respectively. The main reason was related to the decrease in the number of arrivals in the first years of the period being examined.
Regarding the trend of the indicator used to highlight tourism pressure duration and intensity (I2), Figure 2 shows a slightly different trend from the other two indicators. The maximum value of 127.06 overnight stays/km2 was reached in 1992, and the minimum one was 78.21.
The indicator I2 was part of the same dynamic curve trend, but with broader inflections because the indicator value variation occurred within a greater numerical range.
For Romania, the general trend of the three indicators analyzed in the period 1992–2014 was interpreted as follows: tourism pressure density at a territorial level (I1) recorded an average increase of 0.1 arrivals/km2 annually, meaning an average increase of 0.25% per year; tourism pressure duration at a territorial level (I2) recorded an annual average decrease of 1.14%, meaning an absolute average decrease of 1284 overnight stays/km2 per year; regarding the indicator highlighting the social pressure implied by the tourists (I3), it showed an annual average increase of 0.001 arrivals/capita, thus with an average of 0.37% per year.
The analysis results show that the tourism pressure at territorial and social levels did not have such a significant impact that issues of the sustainable development of tourism are raised. Rather, the variations that occurred in two aspects of the analysis are quite low, which allows for the adoption of strategic decisions for the tourism implementation under the spectrum of sustainability.
4.2. Tourism Pressure Assessment Indicator Trends at Regional Level in Romania
The determination of tourism pressure difference by region in Romania began with an analysis of the indicator trend assessment at the level of macro-regions.
By analyzing the trends of the three indicators highlighting tourism pressure in the four macro-regions, considering the minimum and maximum values (Table 2), we may state that: regarding the pressure density indicator (I1), the MR. 4 macro-region, where the fewest arrivals (13.77 arrivals/km2, in 2002) were recorded, and MR. 2, with the highest density of 66.68 arrivals/km2, in 1992, stood out; at the level of the same macro-regions, the lowest and the highest values of the density and the duration of tourism pressure (I2) were shown: MR. 4 with the fewest overnight stays (45.64 overnight stays/km2, in 2010) and MR. 2 with 257.61 overnight stays/km2, in 1992; the lowest pressure at social level was recorded in 2002, in the MR.4 macro-region (0.19 arrivals/capita), and the highest in 2014, in MR. 1.
Macro-region 1 (MR. 1), with the NW and Central regions, represents the only macro-region of the four in Romania which recorded positive mean values in terms of the trends of all the three indicators during the period analyzed (Table 3). The explanation was the particularly complex and varied tourism potential, good tourist infrastructure both in terms of quantity and quality, and also an overall economic growth above the average of the other macro-regions. It is the macro-region joining the highest number of counties (NUTS level 3) with tourism pressure values exceeding the average.
Macro-region 2 (MR. 2), with the NE and SE regions, recorded negative values for all three indicators analyzed. The vast majority of counties fell within the category of low pressure ones, after the interpolation of the three indicators. The main reason was related to the lower tourism potential of these administrative units, which caused a more modest capitalization.
Macro-region 3 (MR. 3) is analyzed by centralizing the data on the South-Muntenia and Bucharest-Ilfov regions. The results showed annual negative mean values of the trend only for indicator I2. Although it is an area with great tourism potential, the tourist flow was characterized by a low duration of stay. A significant distortion occurred here due to Bucharest, which attracted a large number of tourists, but, according to the specific types of tourism, it was associated with a very low duration of the stay.
Macro-region 4 (MR. 4), with the SW and W regions, like MR. 2, recorded negative trend values of the mean indicators, for all the indicators assessing tourism pressure. The tourist potential available for this macro-region required the capitalization of tourism types mainly defined by the short duration of the stay.
The conclusion drawn for all the macro-regions was that the trends of the indicators assessing tourism pressure in the period 1992–2014 were affected by the impact of the economic crisis of 2008. The recovery has been highlighted in most cases since 2011. This process unfolded differently in the sense that the only macro-region exceeding the level before the crisis (even over 1992) was macro-region 1, defined by very good economic growth (comparable only to the Bucharest-Ilfov region) and by a quantitative and qualitative diversification of tourism-specific infrastructure (too much even in the case of accommodation structures)—Figure 3a–c.
The analysis of the regional tourism pressure trend would be much clearer if we continued the research on the action change of the three indicators in the eight development regions of Romania that make up the macro-regions.
Compared to the other seven development regions of Romania, the values of the indicators assessing tourism pressure territorially and socially for the Bucharest-Ilfov region required a separate analysis.
The Bucharest-Ilfov region faced a “suffocation” process in terms of the territorial tourism pressure. This phenomenon was the result of the number of arrivals and overnight stays, which was so high, relative to the small size of the region, that it generated a density and an intensity over 10 times higher than the tourism pressure duration. The explanation was that the region comprises mainly the capital, and most tourists practiced business tourism.
In this context, the region underwent a trend of average growth in terms of all three indicators determined during the analyzed period from 1992 to 2014.
The indicator I1 had an overall average increase with about 23 arrivals/km2 annually, with 3.86% per year, respectively. Thus, from 389.05 arrivals/km2 in 1992, the tourist density was to be much-reduced by 2001, when it would reach a minimum of 267.94 arrivals/km2. In terms of tourism pressure, the decrease process was favorable, although it was set on the reduction of the tourists’ numbers, with a negative impact on the tourism activity and, therefore, the economic activity of the region. Since 2002, the indicator of tourist density has increased every year, even after the crisis of 2008 (with a small exception in 2004 when it decreased insignificantly), reaching a maximum value of 895.26 arrivals/km2 in 2014.
The same trend pattern was shown by the second indicator assessing the intensity of tourism pressure duration, only this increase was of 1.35% per year, actually about 17 overnight stays/km2 annually. However, from 1088.41 overnight stays/km2 in 1992, it decreased to 531.32 overnight stays/km2 in 2001, while the subsequent increase would lead, over time, to the maximum recorded for the indicator of 1461.23 overnight stays/km2 (2014).
The trend values of the two indicators clearly highlight not only their classification into the last category (VI), but also a surplus beyond what fits within the set categories. This reveals the acute issues of the region in terms of sustainable development.
Considering the fact that this region includes Romania’s capital, with the largest number of people, we may explain why the values of the last indicator fell within the categories mentioned and do not create problems for the sustainability process seen through its social dimensions. The average increase with 3.8% annually, interpreted effectively as 0.017 arrivals/capita per year, was determined based on a trend ranging from a minimum of 0.20 arrivals/capita (2001) to a maximum of 0.65 arrivals/capita, in 2014.
Regarding the other seven regions, the analysis of the tourism pressure trend included the emphasis of the three indicator dynamics for each region and the study of the significant differences per indicator existing between the regions included in the study.
For a much clearer emphasis of the trend stages of the indicator of tourism pressure density (I1), we built comparative figures (Figure 4a–d) representing its values for years prior to the global financial crisis (1992 and 2008), as well as for years after the crisis (2010 and 2014). The indicator values showed that the greatest change over time in reducing tourism pressure density was recorded in the NE region until 2010. One explanation is that there is quite a high number of local interest resorts experiencing big setbacks, some of them being practically decommissioned.
The overall dynamic of tourist density per region in the period 1992–2014 was: regions experienced a progressive decrease in the density of tourism pressure; decreases ranging on average from a minimum of −0.448 arrivals/km2 annually (the South-Muntenia region) and −0.079 arrivals/km2 annually (the Western Region), meaning average rates of −1.77% per year for the first region and −0.33% for the second one. Other regions that experienced this process of decrease were: SE, NE and SW-Oltenia; only two regions recorded average increases: the NW region with 0.083 arrivals/km2 annually (0.30%) and the central region with 0.888 arrivals/km2 per year (1.91%).
Another approach to the trend stages of the indicator I1 was the analysis of the differences between the tourism pressures on the number of arrivals/km2, whether significant or not, among the eight development regions of Romania.
The hypothesis H1 (the ANOVA Single Factor) was supported by the results of the variance analysis. Thus, the significant difference between the tourism pressures in the regions was highlighted by the Fisher test, whose value of 10.15 was significantly higher than its critical value of 2.16. Also, this aspect was rendered through the value p-value = 1.9 × 10⁻⁹, determined as being significantly lower than the significance threshold of 0.05 corresponding to the result guarantee probability of 95%.
The major differences were given, to a greater extent, by the infrastructure and accessibility compared to the tourist potential.
The tourism pressure duration determined for the number of overnight stays/km2 (I2) aimed to complete the tourism pressure picture because the introduction of the overnight stays in the quantification of this process reduced the influence of one-day visitors. The pressure exercised by tourists spending the night in the studied area was higher.
The distribution of this indicator in the development regions, Figure 5b, showed a different situation from the previous ones, the explanation being related to the influence of health tourism (a type of tourism that involves a greater duration of stay) and seaside tourism. The highest values occurred in the South-East and Central regions, where most spa and seaside resorts are located.
The values of the indicator for 1992, 2008, 2010 and 2014 are shown in Figure 5a–d. The South-East region clearly stood out, followed by the Central region, represented in all years of the period, the reason being connected, as previously stated, to the presence of the seaside (which implies a greater duration of stay) and the spa resorts.
In the first case, the explanation was connected to the high density of spa resorts, and, in the second case, to a small area. We should also state that the maximum values in both cases were recorded in 2014.
The situation of these regions is not very favorable, considering the values of more than 100 overnight stays/km2, which classified them within category VI and described the increased tourism pressure in terms of the pressure duration faced by them, which would have serious repercussions on the sustainable development process.
In the case of the other regions, the maximum values were recorded either at the beginning or at the end of analyzed period.
The analysis of these indicator dynamics during 1992–2014 revealed an average increase of tourist density only in the Central region, by 0.596 overnight stays/year (0.51%).
The most significant decrease of the indicator I2 was determined for the South-East region (by 4.254 overnight stays/km2, representing a decrease of 2.59% annually). The regress was triggered by the significant flow of Romanian tourists for the summer holidays to other countries (Bulgaria, Greece, Turkey, etc.), while the number of foreign tourists in Romania dropped sharply as a consequence of the low quality of the services offered.
The assessment of the differences between the seven development regions of Romania (significant or not), in terms of tourism pressure duration (overnight stays/km2), was also achieved by applying the ANOVA Single Factor function.
The results of the ANOVA Single Factor function application on the data series of I2 in the seven development regions in Romania, in the period 1992–2014, supported the regional manifestation of the significant differences between their tourism pressure duration. The viability of the alternative hypothesis H1 is evidenced by the Fisher test, and its value of 135.62 is significantly higher than the critical value of 2.16. The value p-value = 7.54 × 10−59 was determined as being significantly lower than the significance threshold of 0.05, corresponding to a result guarantee probability of 95%.
Although the differences are significant, the issues raised are felt only for regions with spa and seaside resorts, which have a proper specific organization that does not affect sustainable development too much.
The regional analysis of the third indicator trend (social impact of tourism)—I3, determined by the number of tourist arrivals/capital ratio, also began with an analysis of its dynamics during the period specified.
The values of the indicator for 1992, 2008, 2010 and 2014 are shown in Figure 6a–d. The first three places were shared between the SE, Central and West regions. We noticed the effects of the economic crisis for the years 2008 and 2010 in the case of this indicator, as well. The highest values were recorded in the South-East (1992) and Central regions (2010 and 2014). Like in the previous case, the Central region showed the most significant increase after 2010.
Regarding the region development (NUTS level 2), Figure 6b, we identified the Central region to have values of between 0.43 arrivals/capita and 0.74 arrivals/capita, which classified it in categories V and VI, thus with a high level of tourism pressure at a social level, which can create problems for the future sustainable development process of the region. Values above the national average (0.32 arrivals/capita) also occurred in the West region.
At the other end of the scale, there was the South-West Oltenia region with indicator values ranging between 0.15 arrivals/capita (2010) and 0.26 arrivals/capita (1992).
The first three categories, Figure 6c, below the national average, totalled 64%.
Further analyzing the dynamics of this indicator during the period 1992–2014 and pursuing the same issues, it may be noted that the same regions, Central and North-West, showed overall increases (by 0.012 arrivals/capita, and 0.002 arrivals/capita, or 2.03% and 0.50% per year, respectively), as with the first indicator.
The other regions showed average decreases of the indicator I3 between 0.005 arrivals/capita per year (South-East), and 0.0005 arrivals/capita per year (West Region).
Following the ANOVA Single Factor function application on the data series of I3 during 1992–2014, the results obtained for the seven development regions of Romania led to the conclusion that there were significant differences between the development regions of Romania in terms of tourism pressure, given by the number of arrivals/population.
The alternative hypothesis H1 was supported by the dispersion analysis results shown by the Fisher test, whose value of 72.78 was significantly higher than its critical value of 2.16. The result was confirmed by the value p-value = 1.89 × 10−42 determined as being significantly lower than the significance threshold of 0.05, corresponding to the result guarantee probability of 95%.
In areas with high values, there were issues with sustainable development, the residents’ perception not being a favorable one.
The results led to the conclusion that there were significant differences between the eight development regions of Romania, both in terms of tourism pressure, given the number of arrivals/country surface, the number of arrivals/population and the duration of tourism pressure (number overnights/km2).
The policies and strategies approached at the national level regarding regional development aimed at the settling and the reduction of disparities between regions. However, in terms of tourism pressure, the decrease process was not very widely visible.
To highlight the tourism pressure on the fundamental directions (economic growth, environmental sustainability and social equity), the existence of long-term relationships was tested. The variables were considered significant and included in the analysis, representing both tourism pressure (through the three comparison indicators: I1, I2, I3) and the regional development process (GDP and VH).
The econometric model was based on the cointegration analysis including the aforementioned indicators, during 2000–2014, and within the eight development regions of Romania. The first stage of the cointegration test aimed at testing the integration order of each variable, considering that all the series should be integrated by the same order. The analysis was initially aimed at the level series study, the results being shown in Table 4.
The critical probability values (Prob. **) corresponding to the Augmented Dickey Fuller Test (ADF) test for each variable (I1, I2, I3, GDP, VH) were greater than 0.05 (Table 4). These results led to the conclusion that the risk was greater than the standard threshold of 5%, thus the unit root hypothesis for level series of each variable was accepted. These results led to further testing the series by testing if there was a unit root within the differentiated variable series.
The analysis of the series result differences on all five variables (Table 5), through the critical probability values (Prob. **) of the ADF test, which was lower than 0.05 (the standard threshold of 5%), produced the risk that the unit root of the series D(I1), D(I2), D(I3), D(GDP), D(VH) could be lower than 5%. Consequently, the analyzed series on the development regions of Romania was considered to be integrated by the order I.
The conclusion of the first stage allowed the application of the Johansen Cointegration Test. This test was applied while the GDP and VH were endogenous variables.
Of the three cointegration models (Table 6) the first one was selected (associated with the lowest critical probability value Prob. ** = 0.00 < 0.05, meaning that the risk was the lowest compared to the standard threshold of 5%), which included all three exogenous variables.
The Johansen test indicated a cointegration relationship between the variables analyzed (Table 7), within a trendless model, without entailing an equation emphasizing the long-term stable relationship between the GDP endogenous variable and the tourism pressure variables (I1, I2, I3).
GDPt = 601.76 I1t + 83.6068 I2t + 36757.28 I3t
The cointegration model equation coefficients (1) indicated very clearly, through their positive signs (they always occurred with the opposite sign to that shown in the table), the stable long-term relationship, in view of a GDP growth under tourism pressure increase.
Of the two cointegration models tested (Table 8) and analyzed, the first one was selected (associated with the smallest value of the critical probability Prob. ** = 0.00 < 0.05, meaning that the risk was the lowest compared to the standard threshold of 5%), which included the two exogenous variables (I1, I2).
The same Johansen test indicated, in this case as well, the existence of a cointegration relationship between the variables analyzed (Table 9) in a trendless model. An equation was thus obtained, highlighting the stable long-term relationship between the VH endogenous variable and the tourism pressure variables (I1, I2, I3).
VHt = 1704.2830 + 57.0691 I1t + 1.2744 I2t
The positive signs of the cointegration model equation coefficients (2) showed the existence of a long-term stable relationship, meaning an increase of VH under tourism pressure increase.
The conclusion was that an increase in tourism pressure indicators (I1, I2, I3) entailed the modification in the same path of GDP and VH, while leading over time to results with significant impact on the regional economic growth. Tourism pressure may be a very important component of the regional development of Romania over time, but great attention should be paid to the policies and strategies adopted, because a component with a positive impact could become one with a negative impact if actions are not carried out to ensure the sustainable development of tourism while it intensifies.
The econometric model based on the cointegration analysis highlighted the long-term existence of a steady relationship as a trend analogy during 2000–2014, taking into account the distribution in all the eight development regions of all indicators at the level of Romania.
It was a manifestation of regional policy, which paid special attention to the planning and management of location conditions, distributing the tourist activities. In these circumstances, it is necessary to focus on how development should take into account the sustainability process.
The conclusion was that the implementation of Regional Development Policy of Romania was extended and included all the fields of activity, implicitly including tourism, but the results of the analysis showed that the impact of territorial imbalances was quite significant on regional development and over time should be subjected to the sustainability process, which should be more visible in Romania.
In this context, the drafting of strategic measures required the application of selection criteria of economic, environmental and regionally sustainable policies to allow a permanent structural adaptation and a significant contribution of tourism to the sustainable regional development.
5. The Tourism Pressure Trend in the Central Region
As a conclusion of the results presented in the previous chapters, compared to the other seven tourist regions, we may highlight that the Central region competed with the SE region for the first two places. In the period 1992–2014, compared to the other six regions, the Central region showed high indicator values defining tourism pressure, meaning that the tourism pressure was high. In this context, this region was selected for a deeper analysis of the tourism pressure trend.
Throughout the analyzed period, the tourism pressure density trend was similar to its intensity and duration (Figure 7a,b), and, with a small exception in 1996, to the pressure at social level (Figure 8).
In the Central region, however, between 1992 and 2002, there was an overall significant reduction of the tourism pressure, with 15.66 arrivals/km2 (except for 1995 and 1996, when the indicator rose slightly) and, for the entire period of analysis, there was an average increase in arrivals by 0.88/km2 annually, representing an annual average gain of 1.91%. An exception to the rising trend of the indicator in the 2002–2014 period was recorded in 2008, 2009 and 2010, when the number of tourist arrivals in tourist accommodation structures decreased compared to 2007.
In terms of tourism pressure intensity and duration in the Central region, except for the same years 1995 and 1996, a decrease of the indicator with 0.20 nights/km2 between 1992 and 2002 was noticed. The indicator growth trend in the following period 2002–2014 was also interrupted in 2008, 2009 and 2010 by a significant decrease in the number of overnight stays. Considering the entire period of analysis, we may determine an average increase of 1.99% per annum, meaning an absolute value by an average increase of the tourism pressure and intensity of 0.0118 overnight stays/km2 annually.
The pressure at the social level in the Central region recorded a slightly different trend (Figure 7) in the sense that the indicator value increased only in 1995, the period from 1992 to 2002 faced a decrease of 43.46 arrivals/capita. Based on the increase from the period 2002–2014, another significant decline was recorded in 2008, 2009 and 2010 while, during the period 1992–2014, an average increase with 0.596 arrivals/capita annually was recorded, representing an annual average gain of 0.48%.
If pressure decreased in the period 1992–2002, this was the result of the decreasing tourist flow amid economic conditions, as well as the tourism restructuring. The economic and financial crisis of 2008 was felt at a regional level through the low values of the tourism pressure in the period 2008–2010.
A particular and deep approach of the trend stages of the assessment indicators of tourism pressure in the context of sustainable development, considered the economic, social and environmental situation in the Central region.
This development region held 14.31% of Romania’s territory and included the following counties: Alba, Brasov, Covasna, Harghita, Mureș and Sibiu.
The specific relief forms, the soil and subsoil riches and the human resources were important assets in each of the three plans approached.
The economic activities were highly diversified, given that crafts had a secular tradition, and had structurally experienced significant changes over the past 25 years. The structural changes considered emphasizing structural activities in metal processing, chemistry, and all branches of the food and light industries, instead of those related to mining (gold, silver, coal and salt). Agriculture was evidenced by the activities primarily focused on industrial crops, potato crops, livestock and viticulture.
The tourist potential variety was the result of the interconnection of natural attractions with anthropogenic ones, highlighted mainly by historical and cultural components.
The Central region comprises 17 tourist resorts fitted for winter sports, including three internationally famous resorts (Poiana Braşov, Păltiniş, Predeal), four spa resorts of national interest (Sovata, BăileTușnad, Covasna, Predeal), and 11 resorts of local interest. This region includes the highest density of spas in Romania.
The promotion of rural tourism interrelates with the offer of cultural tourism based on the offer range of households in the villages of the region that, given the isolation and underdeveloped infrastructure, have perpetuated traditional culture with folk architecture and technique (construction of houses, gates, religious buildings), with materials and technical facilities (mills, filling mills) used, and with specific techniques used in wood processing etc.
The historical sites, the medieval cities and the fortified churches (some examples of the UNESCO international heritage sites), are very well preserved, represent the tourism offerings of the Central region, the basis of the tourism activity performance leading to receiving a primary role in the trend of Romania’s national tourism.
The material base of the Central region comprised, in 1992, approximately 19% of the total of tourist accommodation units in the country and, in 2014, around 28.50%. Throughout the period of analysis, the material basis was unevenly distributed on the territory so that, in 2014, the highest concentration was recorded in Brașov county (787 units representing 45.10% of the regional total and 24.02% of the country’s tourist units, total), followed by Harghita county (321 units, i.e., 18.40% of the regional total), Mureș (273 units, representing 11.9% of the regional total) and Sibiu (i.e., 119, meaning 11.9% of the regional total). On the contrary, Alba County recorded only 140 units, representing 8.02% of the regional total, and Covasna county only 105 units, i.e., 6.02% of the regional total.
The accommodation and leisure industry represents an important economic component for both the tourist flow and for the workforce employment.
The rich and varied tourist offer of the Central region represents a prerequisite for carrying out a significant tourist flow. This is shown by the relatively high proportions (Table 10) determined at the Central regional level in relation to the totals for Romania of the two indicators assessing the tourist flow.
It should also be noted that the majority of the workforce involved in tourism activities is the local population, thus representing an important indicator in assessing tourism pressure. The workforce employed in tourism in the Central region is also quite significant, given the proportions determined for the population employed in tourism compared to that employed in Romania (Table 10).
The tourism pressure caused an increase in the demand for public services (transport, electricity supply, water, sewage), mainly in the summer and winter months. Thus, as an essential geographical factor, the relief influences or restricts the development of road and rail transport networks. Regarding the landscape fragmentation, which in turn prompted the organization and expansion of settlements, progress has been recorded for the extension of the transport, the power supply, water, and sewage networks, with a significant direct impact on the tourism pressure emphasis at the Central region level.
The complex extent of the tourism industry’s interdependence with its sustainable development and tourism pressure that may trigger negative effects at a regional level, and should not exclude the biunivocal relationship with the economic growth. The GDP represents the most relevant indicator of economic growth.
The estimation of the tourism ecological pressure in the Central region takes into account factors and indicators aiming at the sustainability issue. The Central region has a potential of valuable biomass. At the same time, of the whole micro-hydrological potential of Romania, 30% represents the micro-hydrological potential of the communities in the mountain areas. At the level of this region, expertise providers, with experience in the field, contribute to the development of renewable energy sub-sectors, especially for the built environment.
Regarding the work of public institutions, we mention the Transylvania University of Brașov. This institution considered the sustainability concept a major priority, which was reflected both in the research and development process and the education process. Solutions were, thus, implemented in the built environment for energy efficiency and energy mixes based on renewable energy. At the same time, there are concerns regarding the use of waste biomass as energy sources. Some companies are extensively involved in the development of sustainable communities through specific products (organic textiles, organic food) that include them in the circuit of waste recycling as an energy source.
The tourist flows arriving in the Central region create a rather significant tourism pressure on the natural, social and economic elements of the Central region. Considering the three directions (economic, social and environmental), econometric models were designed targeting the trend of the employed population in the tourism sector, the regional GDP and the waste of the region, in relation to the number of arrivals and the number of overnight stays during the period 1992–2014. The results obtained led to the following conclusions: the increase in tourist arrivals to 1 million tourists triggers increases in the population employment, with approximately 11 thousand people; in the GDP of RON 50.90 billion; and in waste volume, with 1.86 kg/capita. An increase of overnight stays by 1 million overnight stays leads to increases in the population employment by approximately 5 thousand people; in the GDP by RON 30.13 billion; and in waste by 1.06 kg/capita.
At first glance, these results are not significant, but, by carefully studying the issue of the relationship between tourism, tourism pressure and sustainability, we may first note the need to outline the tourists’ behavior. The core and essence of the relationship between the three components was the carrying out of behavioral educational programs.
The increasing age of the population, the high level of poverty, and the isolation levels of some areas in the Central region determined the occurrence of the depopulation process. This process influenced the disappearance of some villages, the negative effects being emphasized at economic and social levels. This phenomenon also negatively affected tourism pressure because those localities would be important attraction sources that would lead to decongestion of other tourist areas with intense tourist circulation.
At the same time, the expansion of tourism practice to less accessible areas would require strategic measures to solve problems related to the modernization of the local transport infrastructure, particularly in the mountainous areas in the north-west region (including the poor public transport network).
The modernization of the educational and sanitary infrastructure and poor sanitation in many isolated mountain villages would alleviate the tourism pressure incurred, as we have mentioned before, taking over some of the intensive tourist circulation in some areas of the Region. Concurrently, the local establishment of themed tourism networks should interrelate with those at regional or even international level. In this context, it is necessary to increase the quality of tourism services and information in these areas.
The issues raised in this region, which is experiencing a high level of tourism pressure due to the considerable potential at its disposal, are also generally the issues of other regions, and may be solved starting with the approach and the solutions presented in this case study.
6. Conclusions
The concerns about tourism pressure assessment are internationally numerous and diverse, starting with studies, methodologies and regulations developed by the World Tourism Organization (UNWTO), through to individual or team studies, and institutional studies, as well as being the subject of projects financed from European funds. UNWTO supports the maximization of positive effects of tourism in the economic, social and cultural levels, but amid the mitigation of negative effects on the environment and local culture.
Sustainable tourism aims to channel tourism to the advantage of all stakeholders—destination places and communities, tourists and all the associated activities and services. This requires integrated planning to put tourism in a balanced relationship in the context of overall development. Basically, because tourism is dependent on the value of the environment (with all its natural, social and cultural components), there should be constant concern to ensure their sustainability [45]. Instead, policies and strategies for tourism development do not always take into account or sufficiently consider these issues. This is one of the main reasons why the research on the development and sustainable tourism is important and topical.
The indicators used combine, integrate and weigh the tourist flow to quantify and analyze the tourism pressure through the intensity of tourist flows. It is the cornerstone of tourism capitalization, which makes it relevant both geographically and economically [46,47].
Nationally, the first part of the period under review was defined by negative dynamics, and the second part by a trend of increase in the indicators used. At the macro-region level, MR. 1 and MR. 2 were in a position to raise issues regarding the sustainability of tourism activities. The first indicator recorded increased in MR. 1, MR. 2 and MR. 3, with small decreases in MR. 4. The second indicator showed a small increase in MR. 1, a decrease in MR. 2 and MR. 3 (but the values were above average, fell in the higher categories and raised problems locally or, at least, required attention in the general perspective of sustainable development), with a significant decrease (basically not raising sustainability issues) in MR. 4. The third indicator suggested a high pressure in MR. 1, an acceptable pressure in MR. 2 (which was falling), and opportunities for sustainable development in MR. 3 (growing) and MR. 4 (decreasing, but not significantly).
Regarding the regions, the one containing the capital stood out—although the first part of the period recorded a decrease, subsequently the increase exceeded the maximum values for the prior period. This may be explained by the fact that the second part of the period began with Romania’s adherence to NATO and integration into the European Union.
The very high values of tourism pressure (I1) were also due to the urban, business and congress and cultural tourism from big cities, coastal tourism, as well as high values for health tourism. In these areas, the density of tourists exceeded the average population density at a national level, or even the average population density in some of the territorial administrative units forming them. The most significant trend occurred in the Central region, while the most significant regress occurred in the South-East region.
Against the background of general decrease, I2 recorded the highest increases in the Central region. If the minimum values in 2010 may be attributed to the economic crisis, which determined fewer and shorter tourist trips; the overall trend may be explained by the general European trend to divide the holidays, leading to increases in urban and cultural tourism segments, but to decreases in overnight stays, i.e., the average duration of stay. In terms of sustainability, this was a positive aspect because it involved the dissipation of pressure from tourism activities, both in terms of time and space. The presence of the seaside in the South-East explained its rank in terms of values compared to other regions.
The analysis of the third indicator, linked to the social impact, revealed significant differences at a national level. The regions recording maximum values (well above the threshold of category VI) include the seaside area (7.01) followed by the health resort (2.94) area, where the number of tourists arriving during a year exceeds the number of residents of the area. The mountainous regions were found to be below the national average (0.34). In terms of regions, the most spectacular revival after the economic crisis also occurred in the Central region.
In other cases, the values were below average relative to the tourist density, as well as the population density, the tourism activities not raising significant problems with negative impact, except in specific cases related to certain tourist objectives.
A mitigation of this pressure may be achieved by offering alternatives in neighboring regions, sufficiently valuable in terms of potential, but lacking the infrastructure (both general and specific). A necessary first step in addressing this situation might be to attempt the optimization of existing infrastructures, which may only be achieved by encouraging and stimulating certain types of investments and activities. The lack of balance, the link, the correlation between the components of tourist activity cause local disparities which subsequently lead to regional differentiation [48].
The interdependence issue between tourism, tourism pressure, and sustainability, addressed in this case study of the Central region, is the starting point in analyzing and solving decisions taken by other development regions.
The Central region needs behavioral educational programs for tourists. The implementation of investment strategies considering demographic trends were also considered.
Many of the issues raised may be addressed through European programs to rehabilitate/modernize various infrastructures (business, social, education).
In close interdependence with educational activities, research and measurement activities focus on the priorities of pollution control, emission reduction activities, or the sector of environmental goods and services [49].
Under these circumstances, we may state that the tourism pressure in Romania as a whole is relatively low compared to Europe, but high compared to what is recorded, on average, throughout the world. This situation is quite good and should be preserved. We should note that there are large differences within the country, an issue that requires a different treatment in terms of tourism and environmental management. At the same time analyses, on the one hand, by regions, areas, centers and even tourist spots, and, on the other, by the natural relief units, on the other, would be necessary.
Using econometric models based on the cointegration analysis revealed the existence of linear relationships of long-term balance as a trend analogy during 2000–2014, considering the distribution in those eight development regions of all the indicators in Romania. It should also be pointed out that these long-term relationships occur only when considering that the application of the Regional Development Policy of Romania is closely interrelated with sustainability, which should be carried out at the level of Romania as well.
The econometric models highlight the impact of tourism pressure on the economic and social levels, as represented by the indicators for GDP and household income. On the other hand, since the data series on waste in the development regions of Romania is not significant at the moment, only a cross-sectional analysis could be made. Our concern is the analysis of the impact of tourism pressure on the environment, this representing the goal of independent research.
Acknowledgments
Publishing costs for Adrian Aurel Baltălungă and Daniela Dumitrescu co-authors were covered by Valahia University of Targoviste, Romania.
Author Contributions
All the authors contributed to the analysis and discussion of results.
Conflicts of Interest
The authors declare no conflict of interest.
References
- Andrei, D.R.; Gogonea, R.M.; Zaharia, M.; Andrei, J.V. Is Romanian Rural Tourism Sustainable? Revealing Particularities. Sustainability 2014, 6, 8876–8888. [Google Scholar] [CrossRef]
- Vehbi, B.O. A Model for Assessing the Level of Tourism Impacts and Sustainability of Coastal Cities. In Strategies for Tourism Industry—Micro and Macro Perspectives; InTech Publishing: Rijeka, Croatia, 2012. [Google Scholar]
- Inskeep, E. Tourism Planning-An Integrated and Sustainable Development Approach; John Wiley and Sons Inc. Publishing House: New York, NY, USA, 1991. [Google Scholar]
- Aall, C. Sustainable Tourism in Practice: Promoting or Perverting the Quest for a Sustainable Development? Sustainability 2014, 6, 2562–2583. [Google Scholar] [CrossRef]
- Baltălungă, A.A. Tourism in Romania; Valahia University Press: Târgovişte, Romania, 2008. [Google Scholar]
- Montanari, A.; Barbara, S. Rome: A Difficult Path between Tourism pressure and Sustainable Development. Rivista di Scienze del Turismo 2010, 2, 301–316. [Google Scholar]
- Dezsi, Ş.; Ciangă, N.; Rotar, G. Considerations on the Impact of Tourism on the Environment and Risks Induced by Tourism Activities. In Risks and Catastrophes; Sorocovschi, V., Ed.; The Publishing House of the Book of Science: Cluj-Napoca, Romania, 2002; pp. 155–165. [Google Scholar]
- Popescu, G.; Andrei, J. From industrial holdings to subsistence farms in the Romanian agriculture. Analyzing the subsistence components of the CAP. Agric. Econ. Zemed. Ekon. 2011, 57, 555–564. [Google Scholar]
- Hadwen, W.; Arthington, A.; Boon, P. Tourism Pressure Index (TPI): Predicting the Spatial Distribution of Visitors within Protected Areas; Sustainable Tourism Cooperative Research Centre: Gold Coast, Australia, 2008. [Google Scholar]
- Fennell, D.A. Ecotourism Programme Planning; CAB International: Wallingford, UK, 2002. [Google Scholar]
- Năstase, C. Sustainable Development and Sustainable Tourism. Tour. J. Stud. Res. Tour. 2007, 3, 54–57. [Google Scholar]
- Hall, M.; Lew, A. Sustainable Tourism—A Geographical Perspective; Prentice Hall, Pearson Education Limited: Essex, UK, 1998; pp. 2–3. [Google Scholar]
- Brundtland Report. Our Common Future; Commission on Environment and Development, Oxford University Press: Oxford, UK, 1987. [Google Scholar]
- Romanian Institute for Sustainable Development. Available online: http://www.irds.ro/static/ro/ro-activitati/studiicercetarimonitorizari.html (accessed on 7 March 2016).
- Suciu, M.C.; Suciu, N. Sustainable Development—The Key Problem of the Twentieth Century. AGIR J. 2007, 1, 124–125. [Google Scholar]
- European Environment Agency. Making Sustainability Accountable: Eco-Efficiency, Resource Productivity and Innovation; European Environment Agency: Copenhagen, Denmark, 1999; Available online: http://www.eea.europa.eu/publications/Topic_report_No_111999 (accessed on 20 September 2015).
- Butler, R.W. Tourism—An Evolutionary Perspective. In Tourism and Sustainable Development: Monitoring, Planning, Managing; Nelson, J.G., Butler, R., Wall, G., Eds.; University of Waterloo: Waterloo, ON, Canada, 1993; pp. 27–44. [Google Scholar]
- Nijkamp, P.; van den Bergh, C.J.M.; Soeteman, F.J. Regional Sustainable Development and Natural Resource Use. Proceeding of the World Bank Annual Conference on Development Economics 1990, Washington, DC, USA, 26–27 April 1991; pp. 153–188. [Google Scholar]
- Eizenberg, E.; Jabareen, Y. Social Sustainability: A New Conceptual Framework. Sustainability 2017, 9, 68. [Google Scholar] [CrossRef]
- National Agency for Environmental Protection. Available online: http://www.anpm.ro/upload/16087_11%20PRESIUNI%20ASUPRA%20MEDIULUI%20.pdf (accessed on 21 September 2015).
- UNEP; UNWTO. Making Tourism More Sustainable—A Guide for Policy Makers. 2005. Available online: http://sdt.unwto.org/content/about-us-5 (accessed on 19 September 2015).
- Mazilu, M. Sustainable Tourism and Development; Universitaria Publishing House: Craiova, Romania, 2011. [Google Scholar]
- Nedelcu, A. Tourism Geography, 2nd ed.; University Publishing House: Bucharest, Romania, 2015. [Google Scholar]
- Muntele, I.; Iaţu, C. Tourism Geography. Concepts, Methods and Forms of Spatial and Temporal Manifestation; SedcomLibris Publishing House: Iași, Romania, 2003; pp. 63–70. [Google Scholar]
- Gartner, W.; Lime, D. Trends in Outdoor Recreation, Leisure and Tourism; CABI Publishing: Cambridge, UK, 2000; pp. 125–126. [Google Scholar]
- Cândea, M.; Erdeli, G.; Simon, T. Romania-Tourism Potential and Tourism; University Publishing House: Bucharest, Romania, 2000; pp. 259–261. [Google Scholar]
- Ielenicz, M.; Comănescu, L. Tourism-Theory and methodology; University Publishing House: Bucharest, Romania, 2013; pp. 59–67. [Google Scholar]
- Dasmann, W. A Method for Estimating Carrying Capacity of Range Lands. J. For. 1945, 43, 400–403. [Google Scholar]
- Lime, D.W.; Stankey, G.H. Carrying capacity: Maintaining outdoor recreation quality. In Proceedings of the Forest Recreation, Syracuse, NY, USA, 12–14 October 1971; pp. 174–184. Available online: https://www.nrs.fs.fed.us/pubs/other/recsym/recreation_symposium_proceedings_174.pdf (accessed on 5 February 2017).
- Mathieson, A.; Wall, G. Tourism: Economic, Physical and Social Impacts; Longman: New York, NY, USA, 1982. [Google Scholar]
- Lindsay, J.J. Carrying Capacity for Tourism Development in National Parks of the United States. Ind. Environ. 1986, 9, 17–20. [Google Scholar]
- O’Reilly, A.M. Tourism Carrying Capacity: Concept and Issues. Tour. Manag. 1986, 7, 254–258. [Google Scholar] [CrossRef]
- Martin, B.S.; Uysal, M. An examination of the relationship between carrying capacity and the tourism life cycle: Management and policy implications. J. Environ. Manag. 1990, 31, 327–333. [Google Scholar] [CrossRef]
- Adriaanse, A. Environmental Policy Performance Indicators: A Study of the Development of Indicators for Environmental Policy in The Netherlands; SDU Publishers: The Hauge, The Netherlands, 1993; p. 175. [Google Scholar]
- Montanari, A.; Staniscia, B. Culinary Tourism as a Tool for Regional Re-equilibrium. Plan. Stud. 2009, 17, 1463–1483. [Google Scholar] [CrossRef]
- Dumitrescu, D. Romania. Development Regions. Socio-economic Disparities; Cetatea de Scaun Publishing House: Târgovişte, Romania, 2008. [Google Scholar]
- Saarinen, J. Critical Sustainability: Setting the Limits to Growth and Responsibility in Tourism. Sustainability 2014, 6, 1–17. [Google Scholar] [CrossRef]
- Paunović, I.; Jovanović, V. Implementation of Sustainable Tourism in the German Alps: A Case Study. Sustainability 2017, 9, 226. [Google Scholar] [CrossRef]
- United Nations Environment Programme (UNEP). Making Tourism More Sustainable: A Guide for Policy Makers; UNEP: Paris, France, 2005. [Google Scholar]
- National Institute of Statistics. Statistical Yearbook of Romania. Bucharest, Romania. 2014. Available online: http://www.insse.ro/cms/sites/default/files/field/publicatii/anuarul_statistic_al_romaniei_1.pdf (accessed on 21 September 2015).
- Eurostat Regional Yearbook. 2014. Available online: http://ec.europa.eu/eurostat/statistics-explained/index.php/Tourism_statistics_at_regional_level (accessed on 20 September 2015).
- Boboc, C.; Țițan, E.; Ghiță, S. Labour Market Inequalities and Economic growth. Econ. Comput. Econ. Cybern. Stud. Res. 2012, 46, 49–64. [Google Scholar]
- Zaharia, M.; Popescu, C. Comparative Analysis on the Influence of the Economic Crisis on Education in some European Countries. Int. J. Synerg. Res. 2015, 4, 63–83. [Google Scholar] [CrossRef]
- Simionescu, M. Econometric Modelling in Matlab R. and EViews; ASE: Bucharest, Romania, 2014. [Google Scholar]
- Dobroteanu, C.; Ladaru, R. Elements for a national strategy on agriculture and rural development. Metal. Int. 2010, 3, 137–141. [Google Scholar]
- Baltălungă, A.A.; Dumitrescu, D. Romania’s Touristic Regionalization—Touristic Development Indicator. 2011. Available online: https://fsu.valahia.ro/images/avutgs/1/2011/2011111210.pdf (accessed on 17 September 2015).
- Andrei, J.V.; Darvasi, D. Perspectives and challenges in financing the new Common Agricultural Policy, a new paradigm. J. Food Agric. Environ. 2012, 10, 904–907. [Google Scholar]
- Baltălungă, A.A.; Dumitrescu, D. The Role of Infrastructure and Touristic Traffic in Romania’s Touristic Regionalization. Forum Geogr. 2013, 12, 81–88. [Google Scholar] [CrossRef]
- Davidescu, A.A.; Paul, A.M.V.; Gogonea, R.M.; Zaharia, M. Evaluating Romanian Eco-Innovation Performances in European Context. Sustainability 2015, 7, 12723–12757. [Google Scholar] [CrossRef]
Figure 1.
The trends of indicators I1 (a), and I3 (b) in Romania (1992–2014).

Figure 2.
The trend of indicator I2 in Romania (1992–2014).

Figure 3.
Romania—(a) the pressure density applied by tourists—I1, (b) the tourism pressure duration and intensity—I2, (c) the pressure applied by tourists socially—I3 at NUTS 1 level, 2014.
Figure 3.
Romania—(a) the pressure density applied by tourists—I1, (b) the tourism pressure duration and intensity—I2, (c) the pressure applied by tourists socially—I3 at NUTS 1 level, 2014.

Figure 4.
Trend of tourism pressure density (I1) per region (a) in 1992; (b) in 2008; (c) in 2010; (d) in 2014.
Figure 4.
Trend of tourism pressure density (I1) per region (a) in 1992; (b) in 2008; (c) in 2010; (d) in 2014.

Figure 5.
The trend of the tourism pressure duration (I2) by regions (a) in 1992; (b) in 2008; (c) in 2010; (d) in 2014.
Figure 5.
The trend of the tourism pressure duration (I2) by regions (a) in 1992; (b) in 2008; (c) in 2010; (d) in 2014.

Figure 6.
The I3 dynamics by region (a) in 1992; (b) in 2008; (c) in 2010; (d) in 2014.

Figure 7.
The trend of indicator I1 (a), and I2 (b) in the Central region (1992–2014).

Figure 8.
The trend of indicator I3 in the Central region (1992–2014).
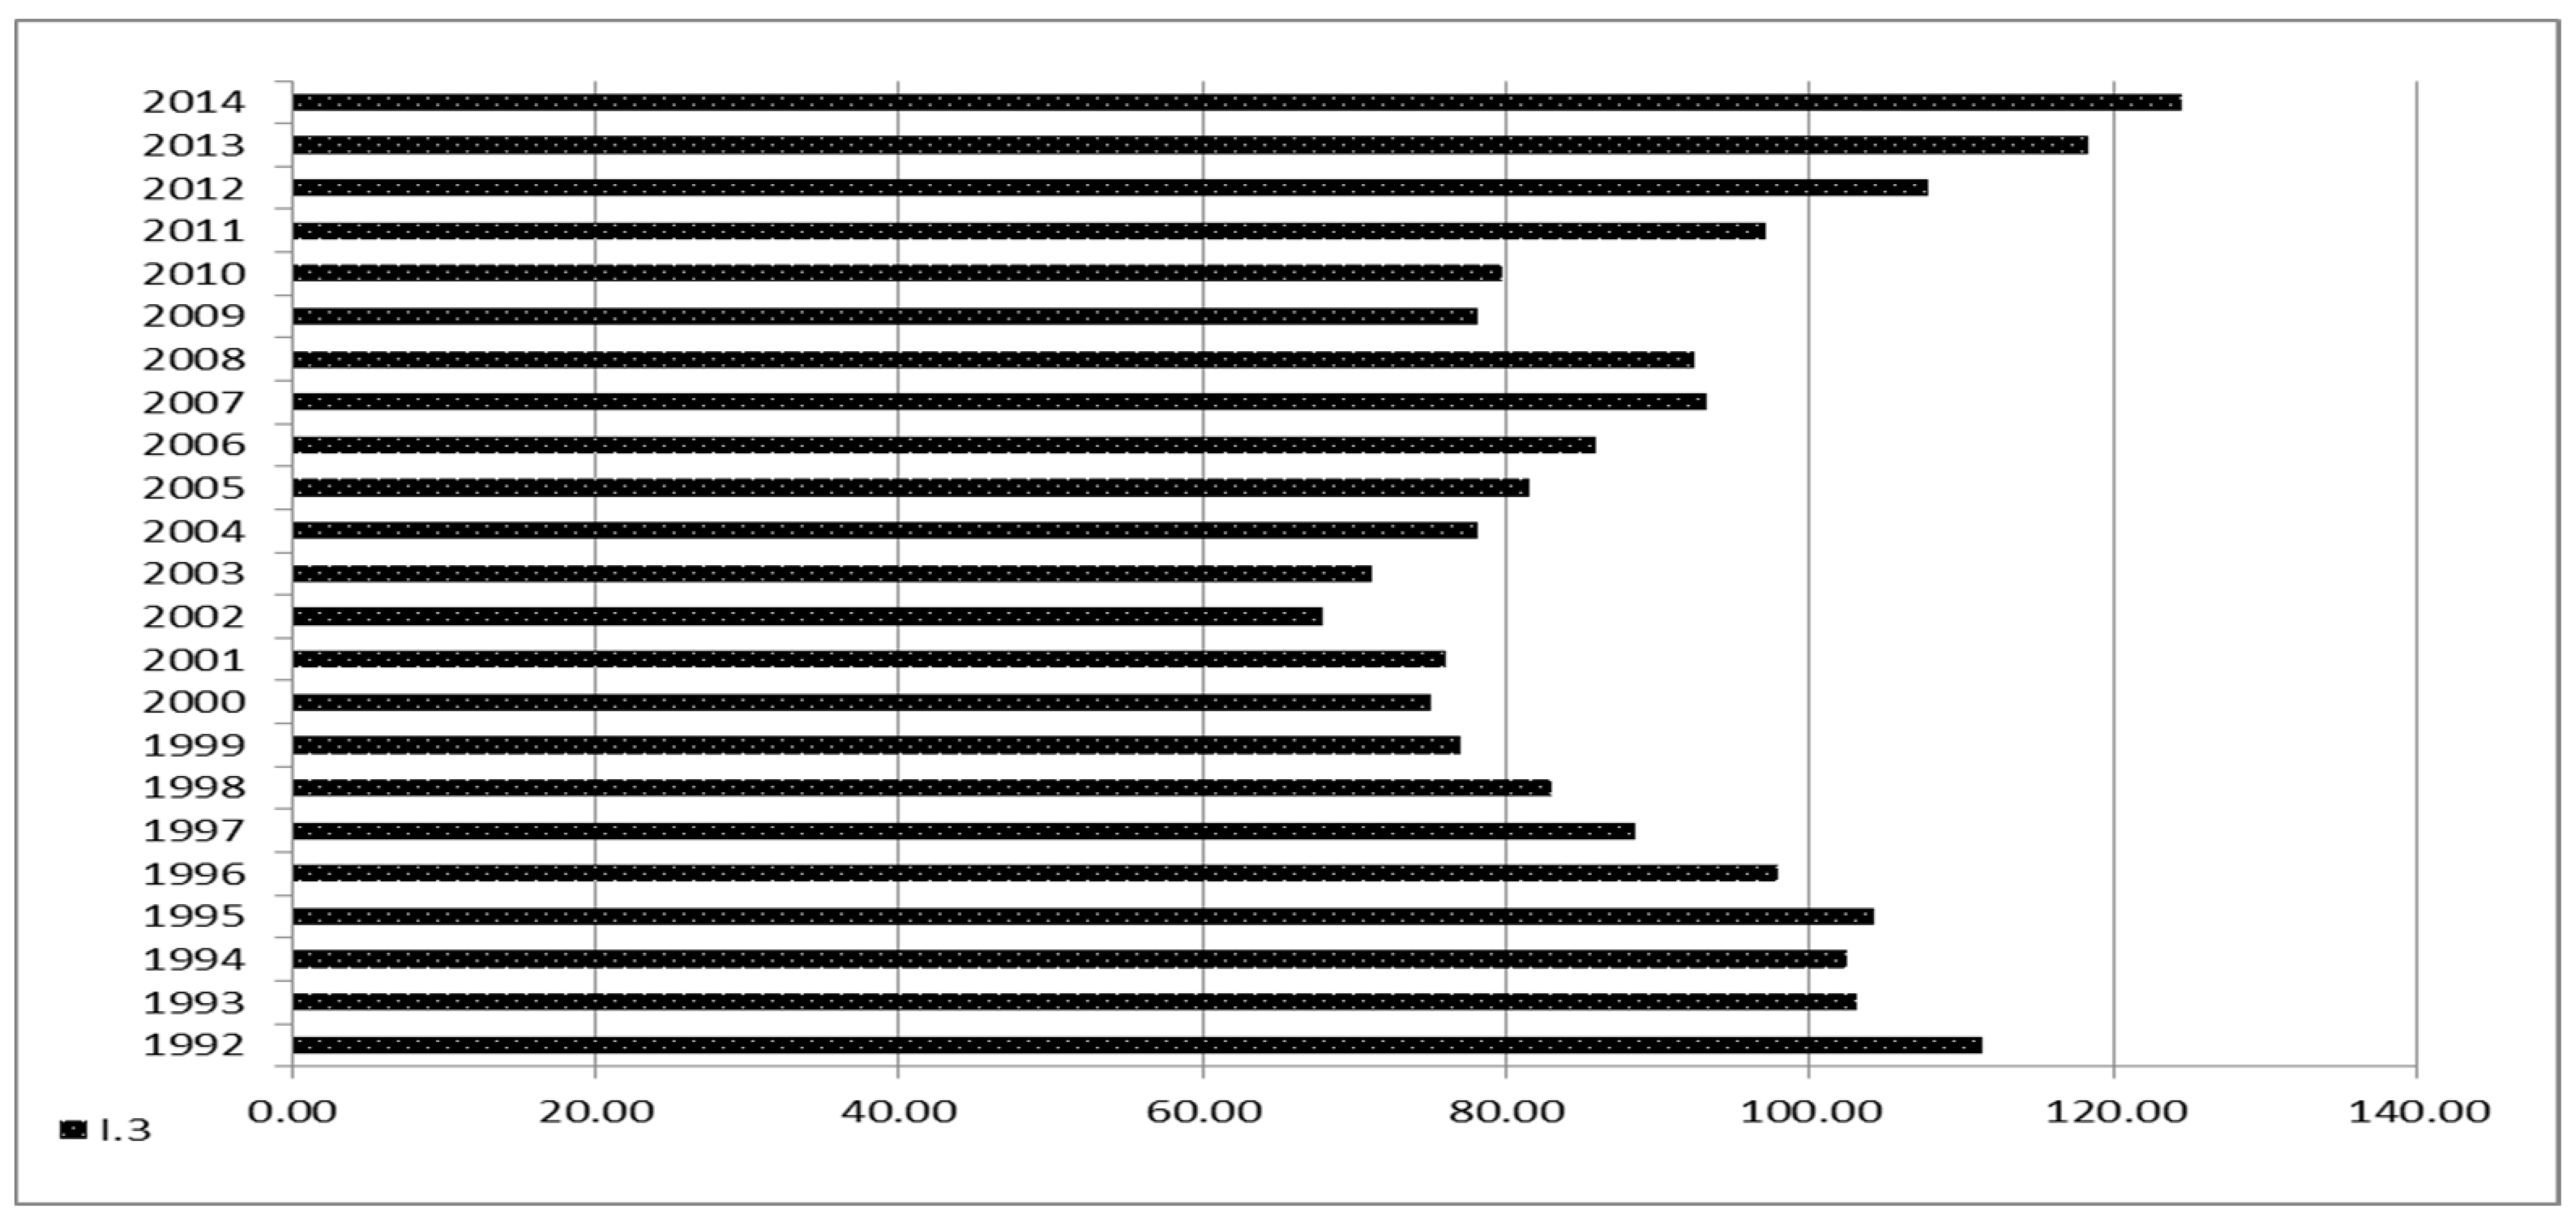

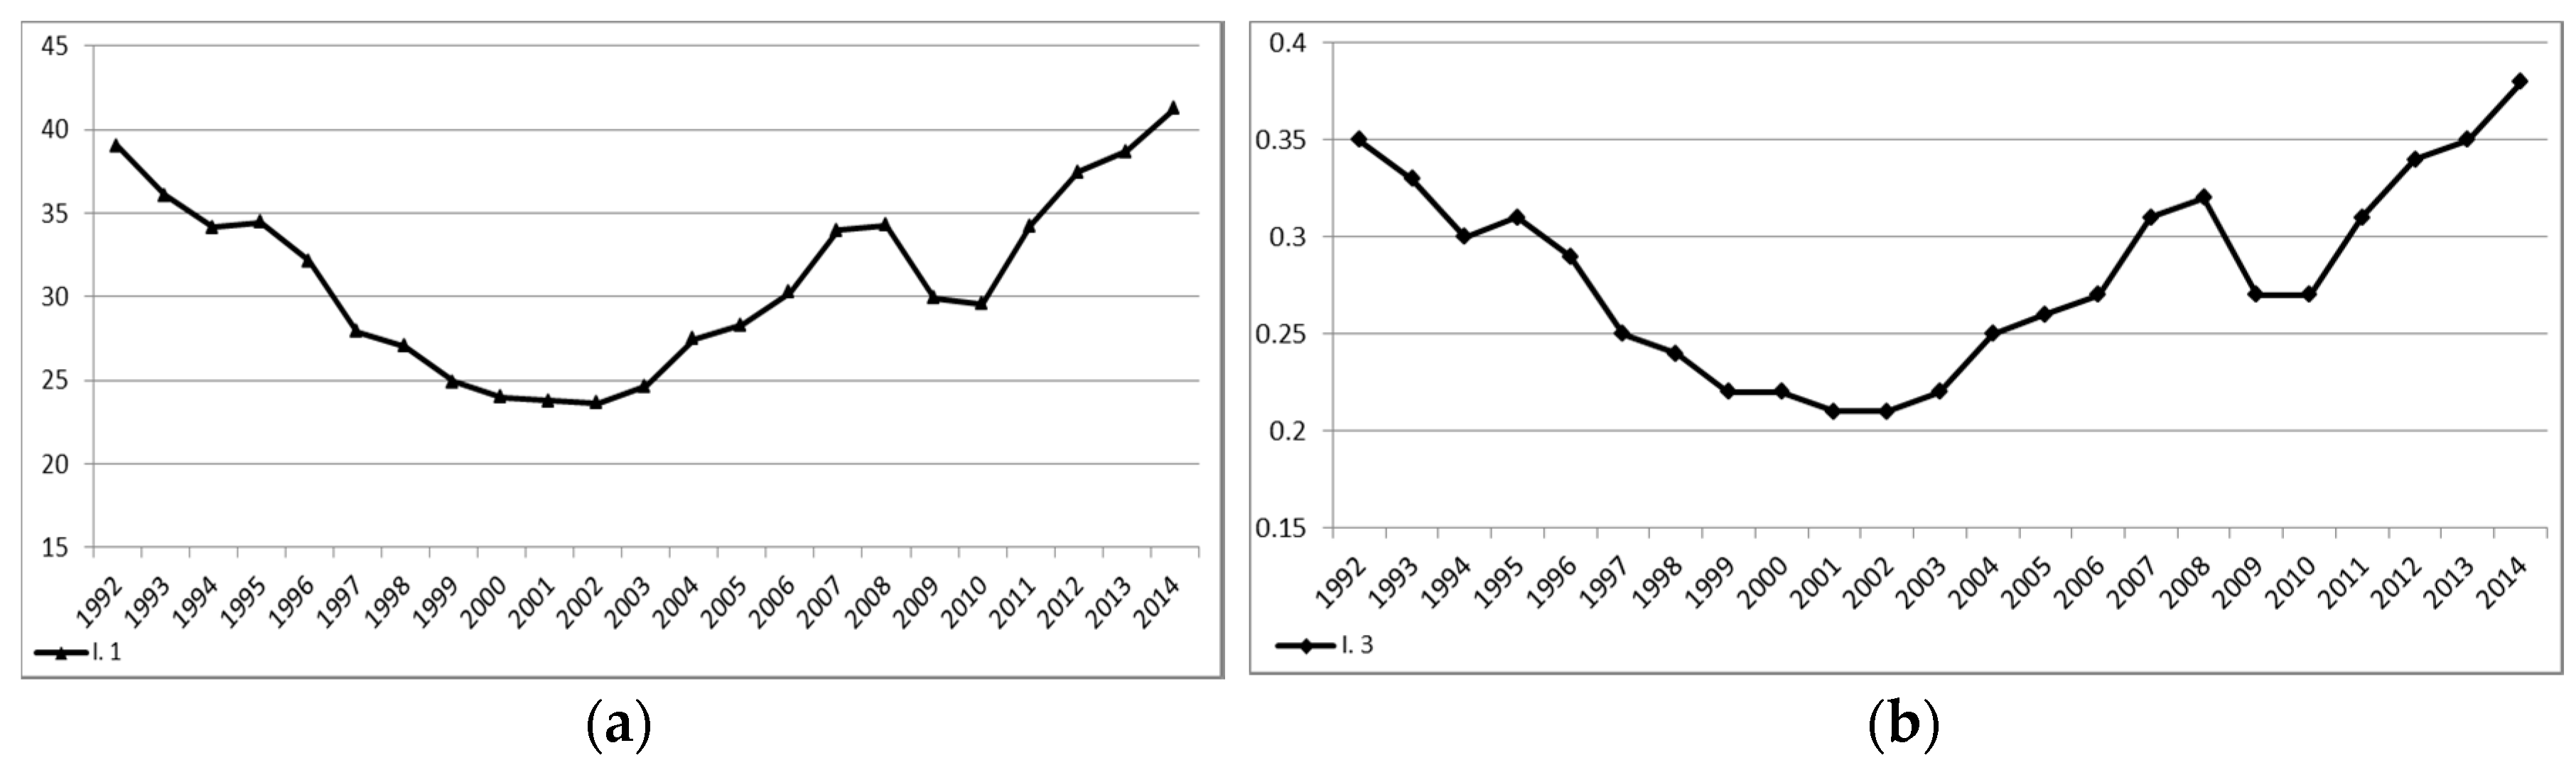
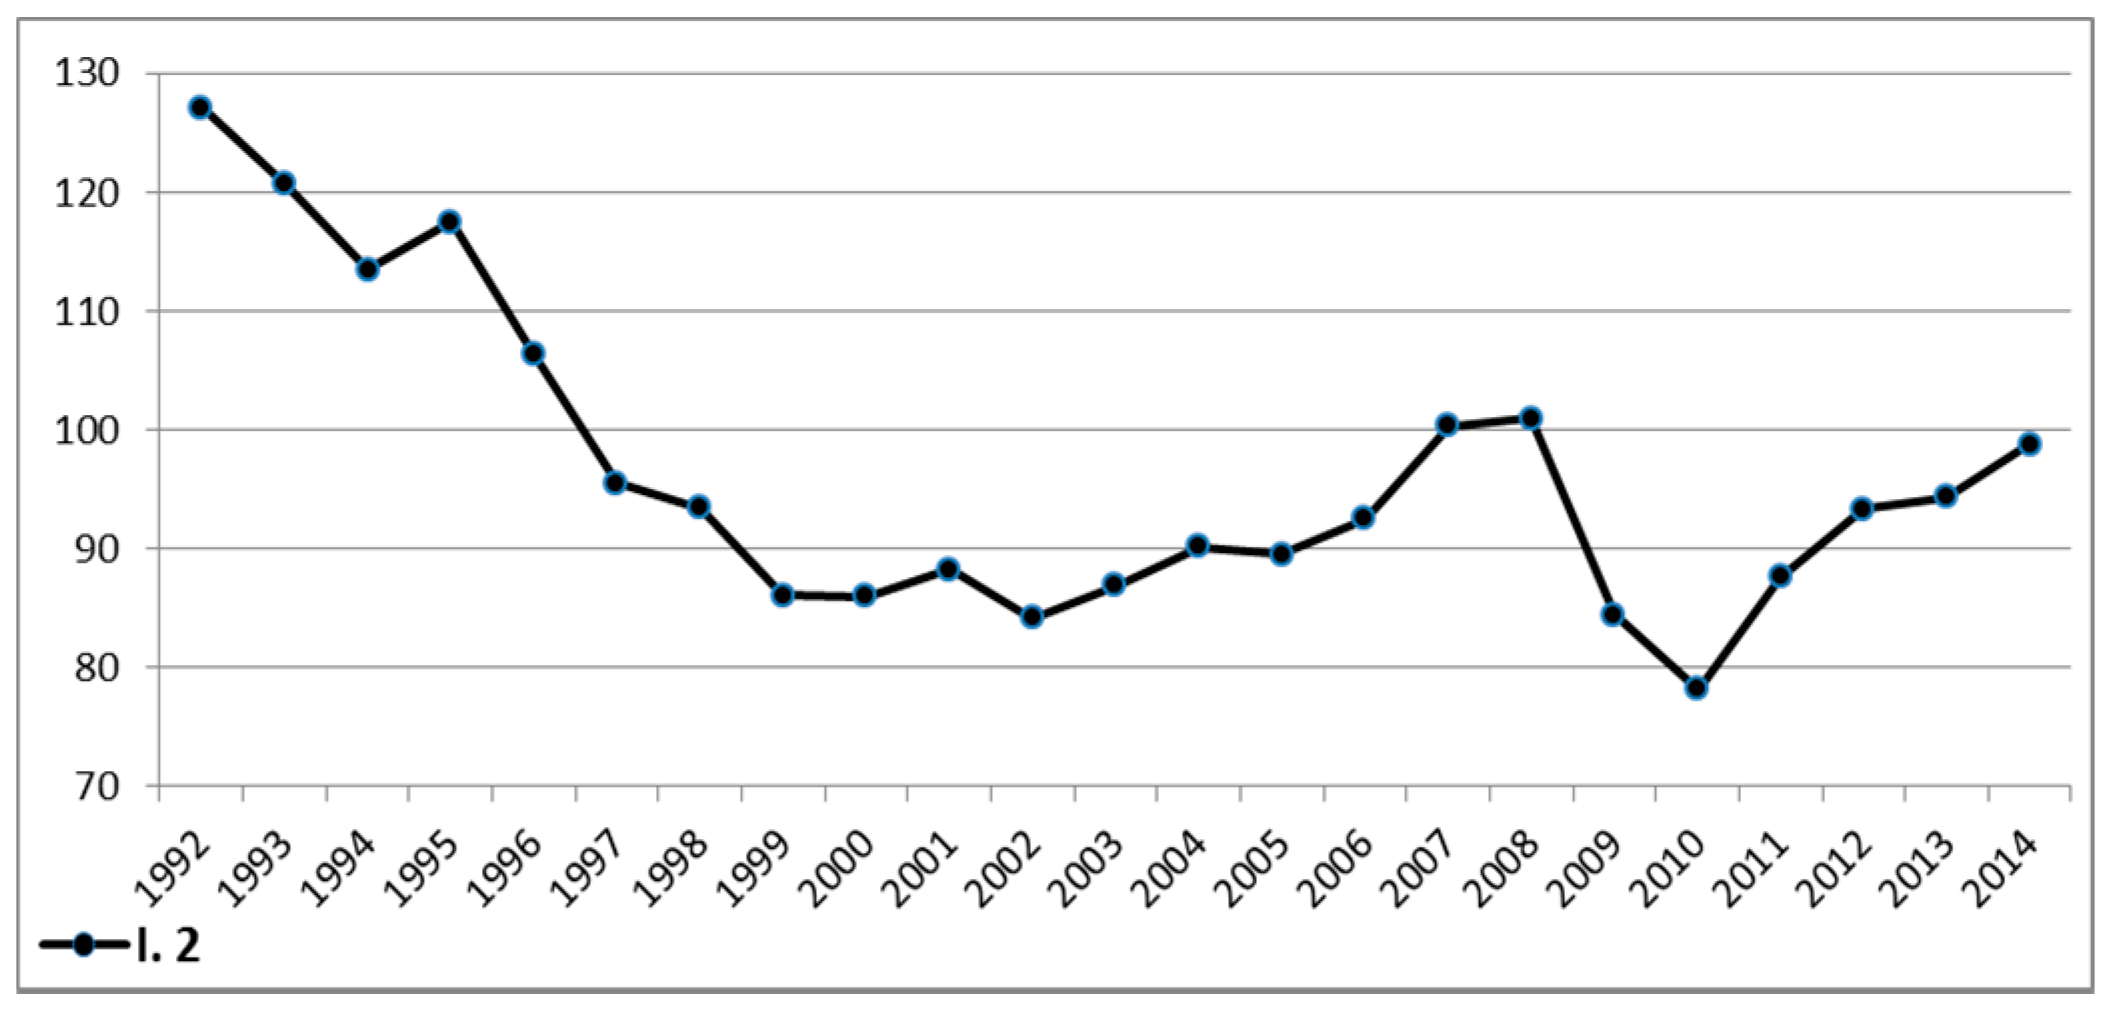
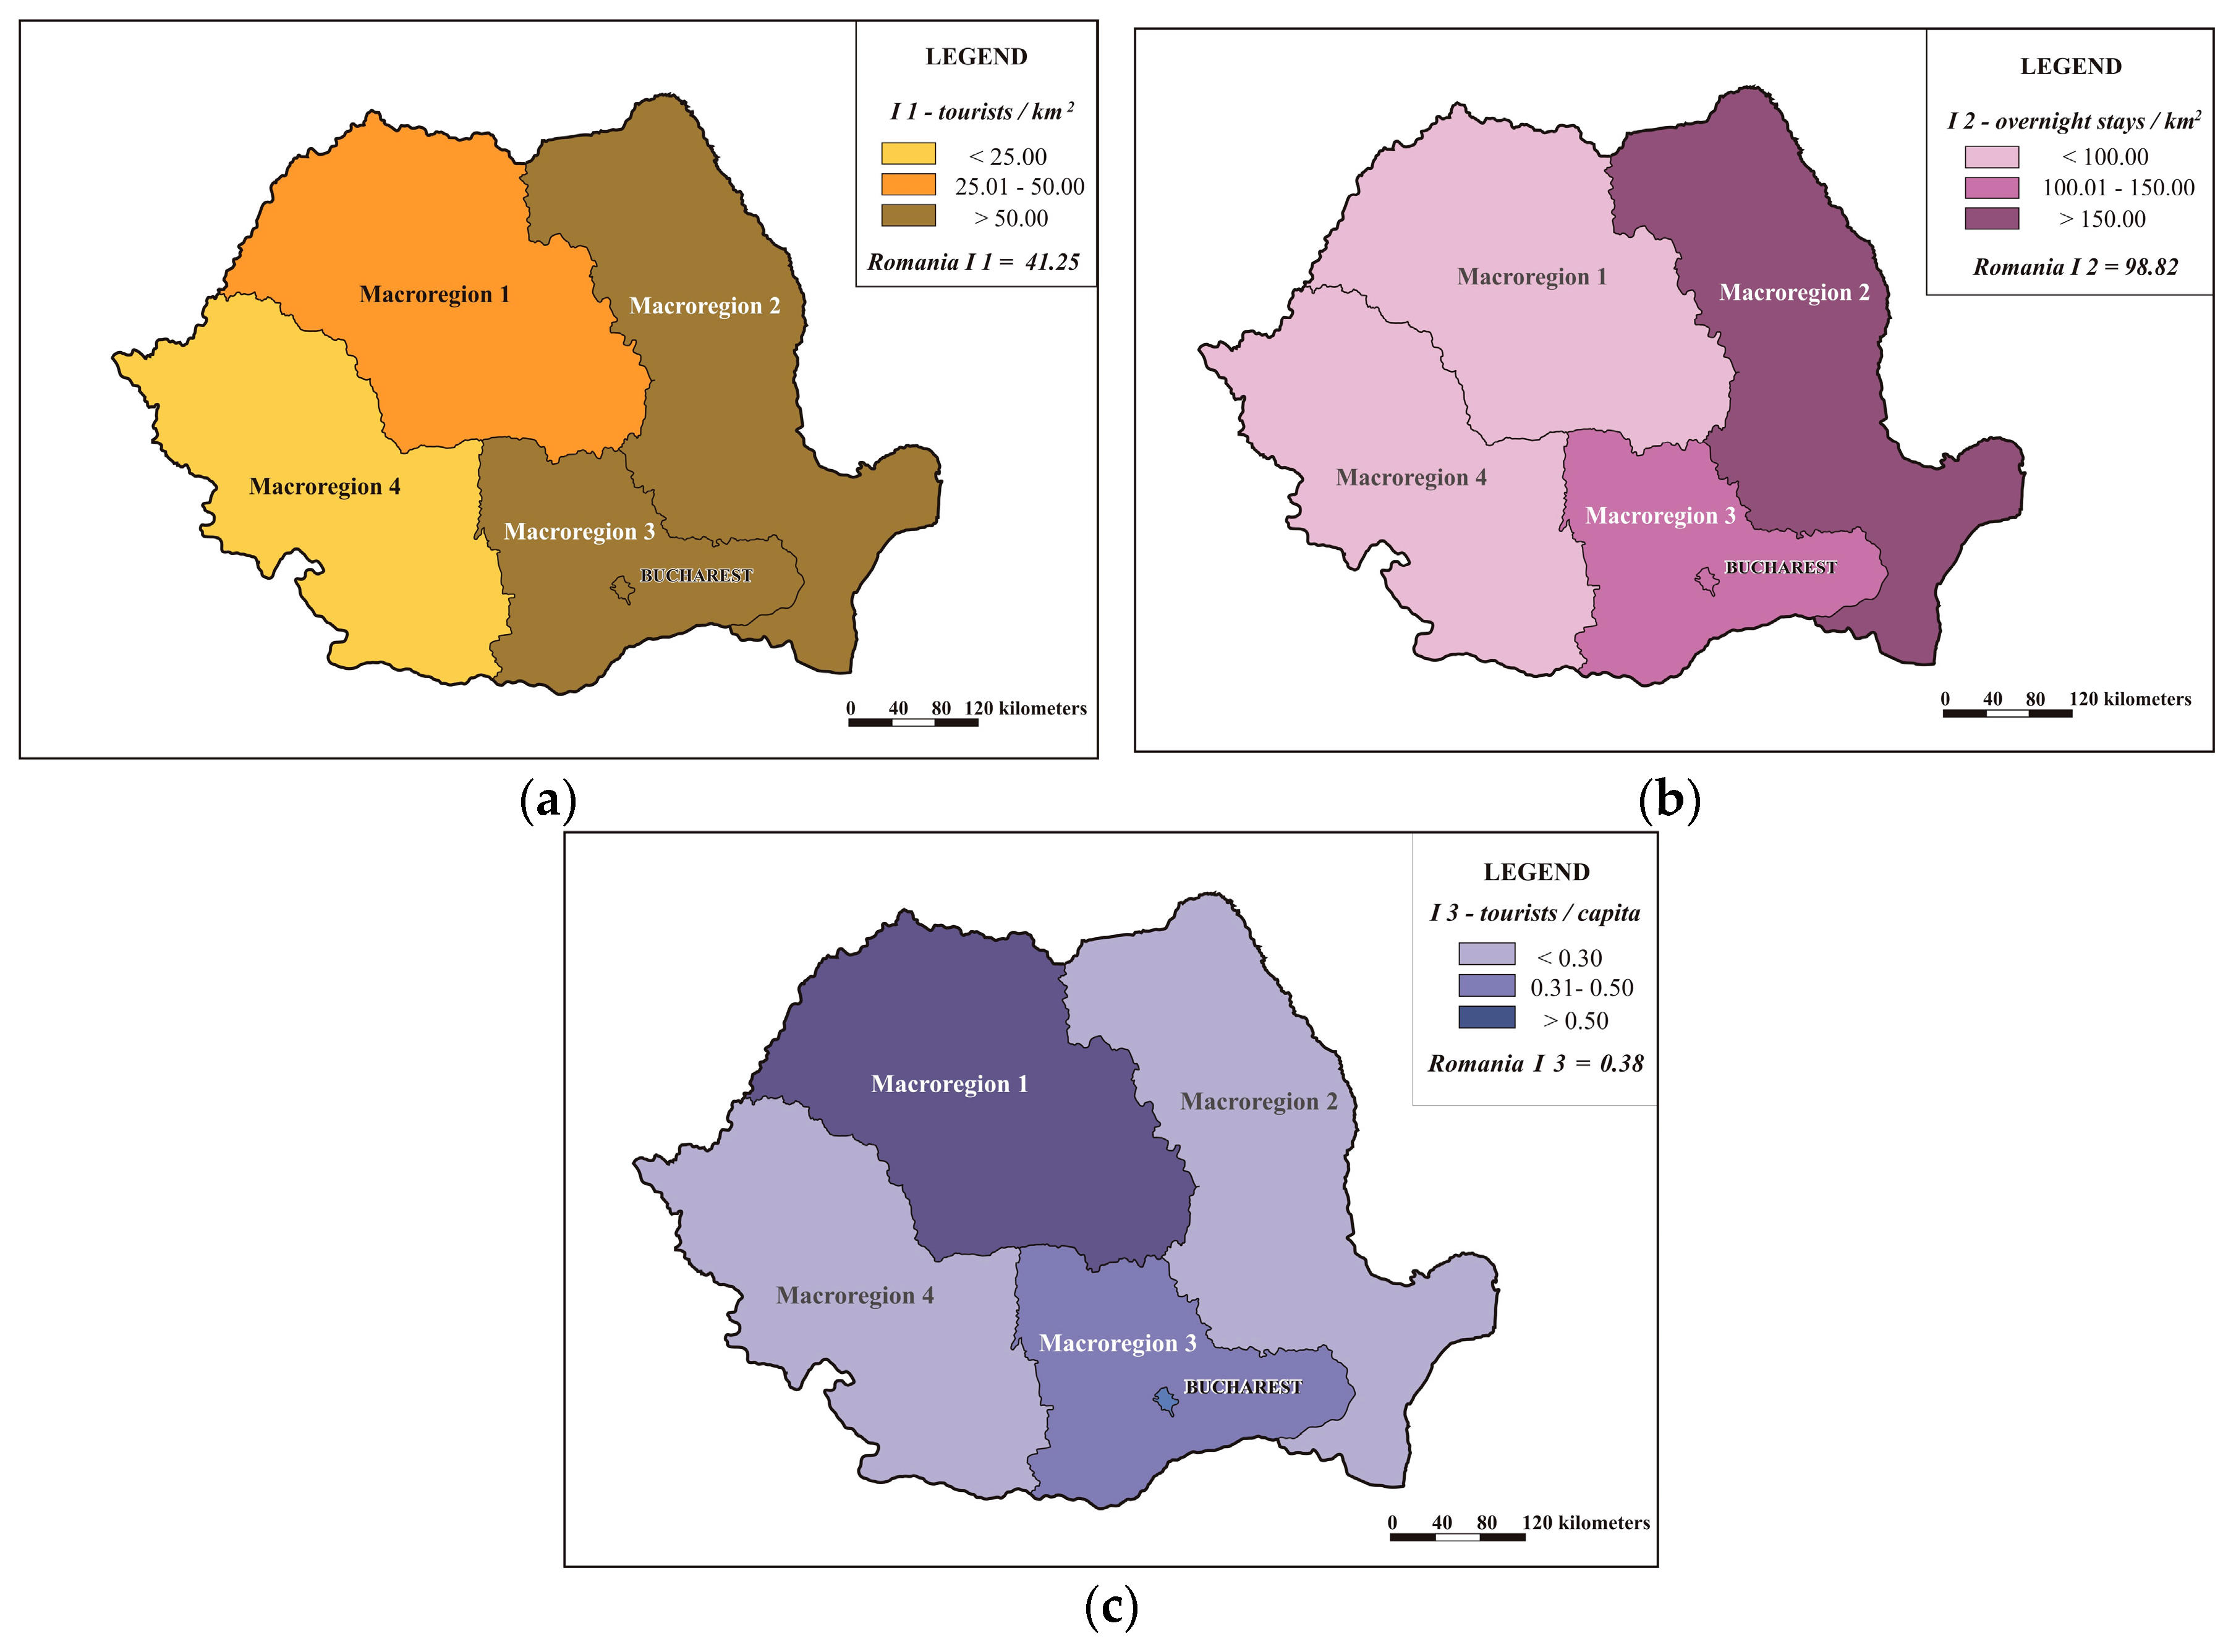
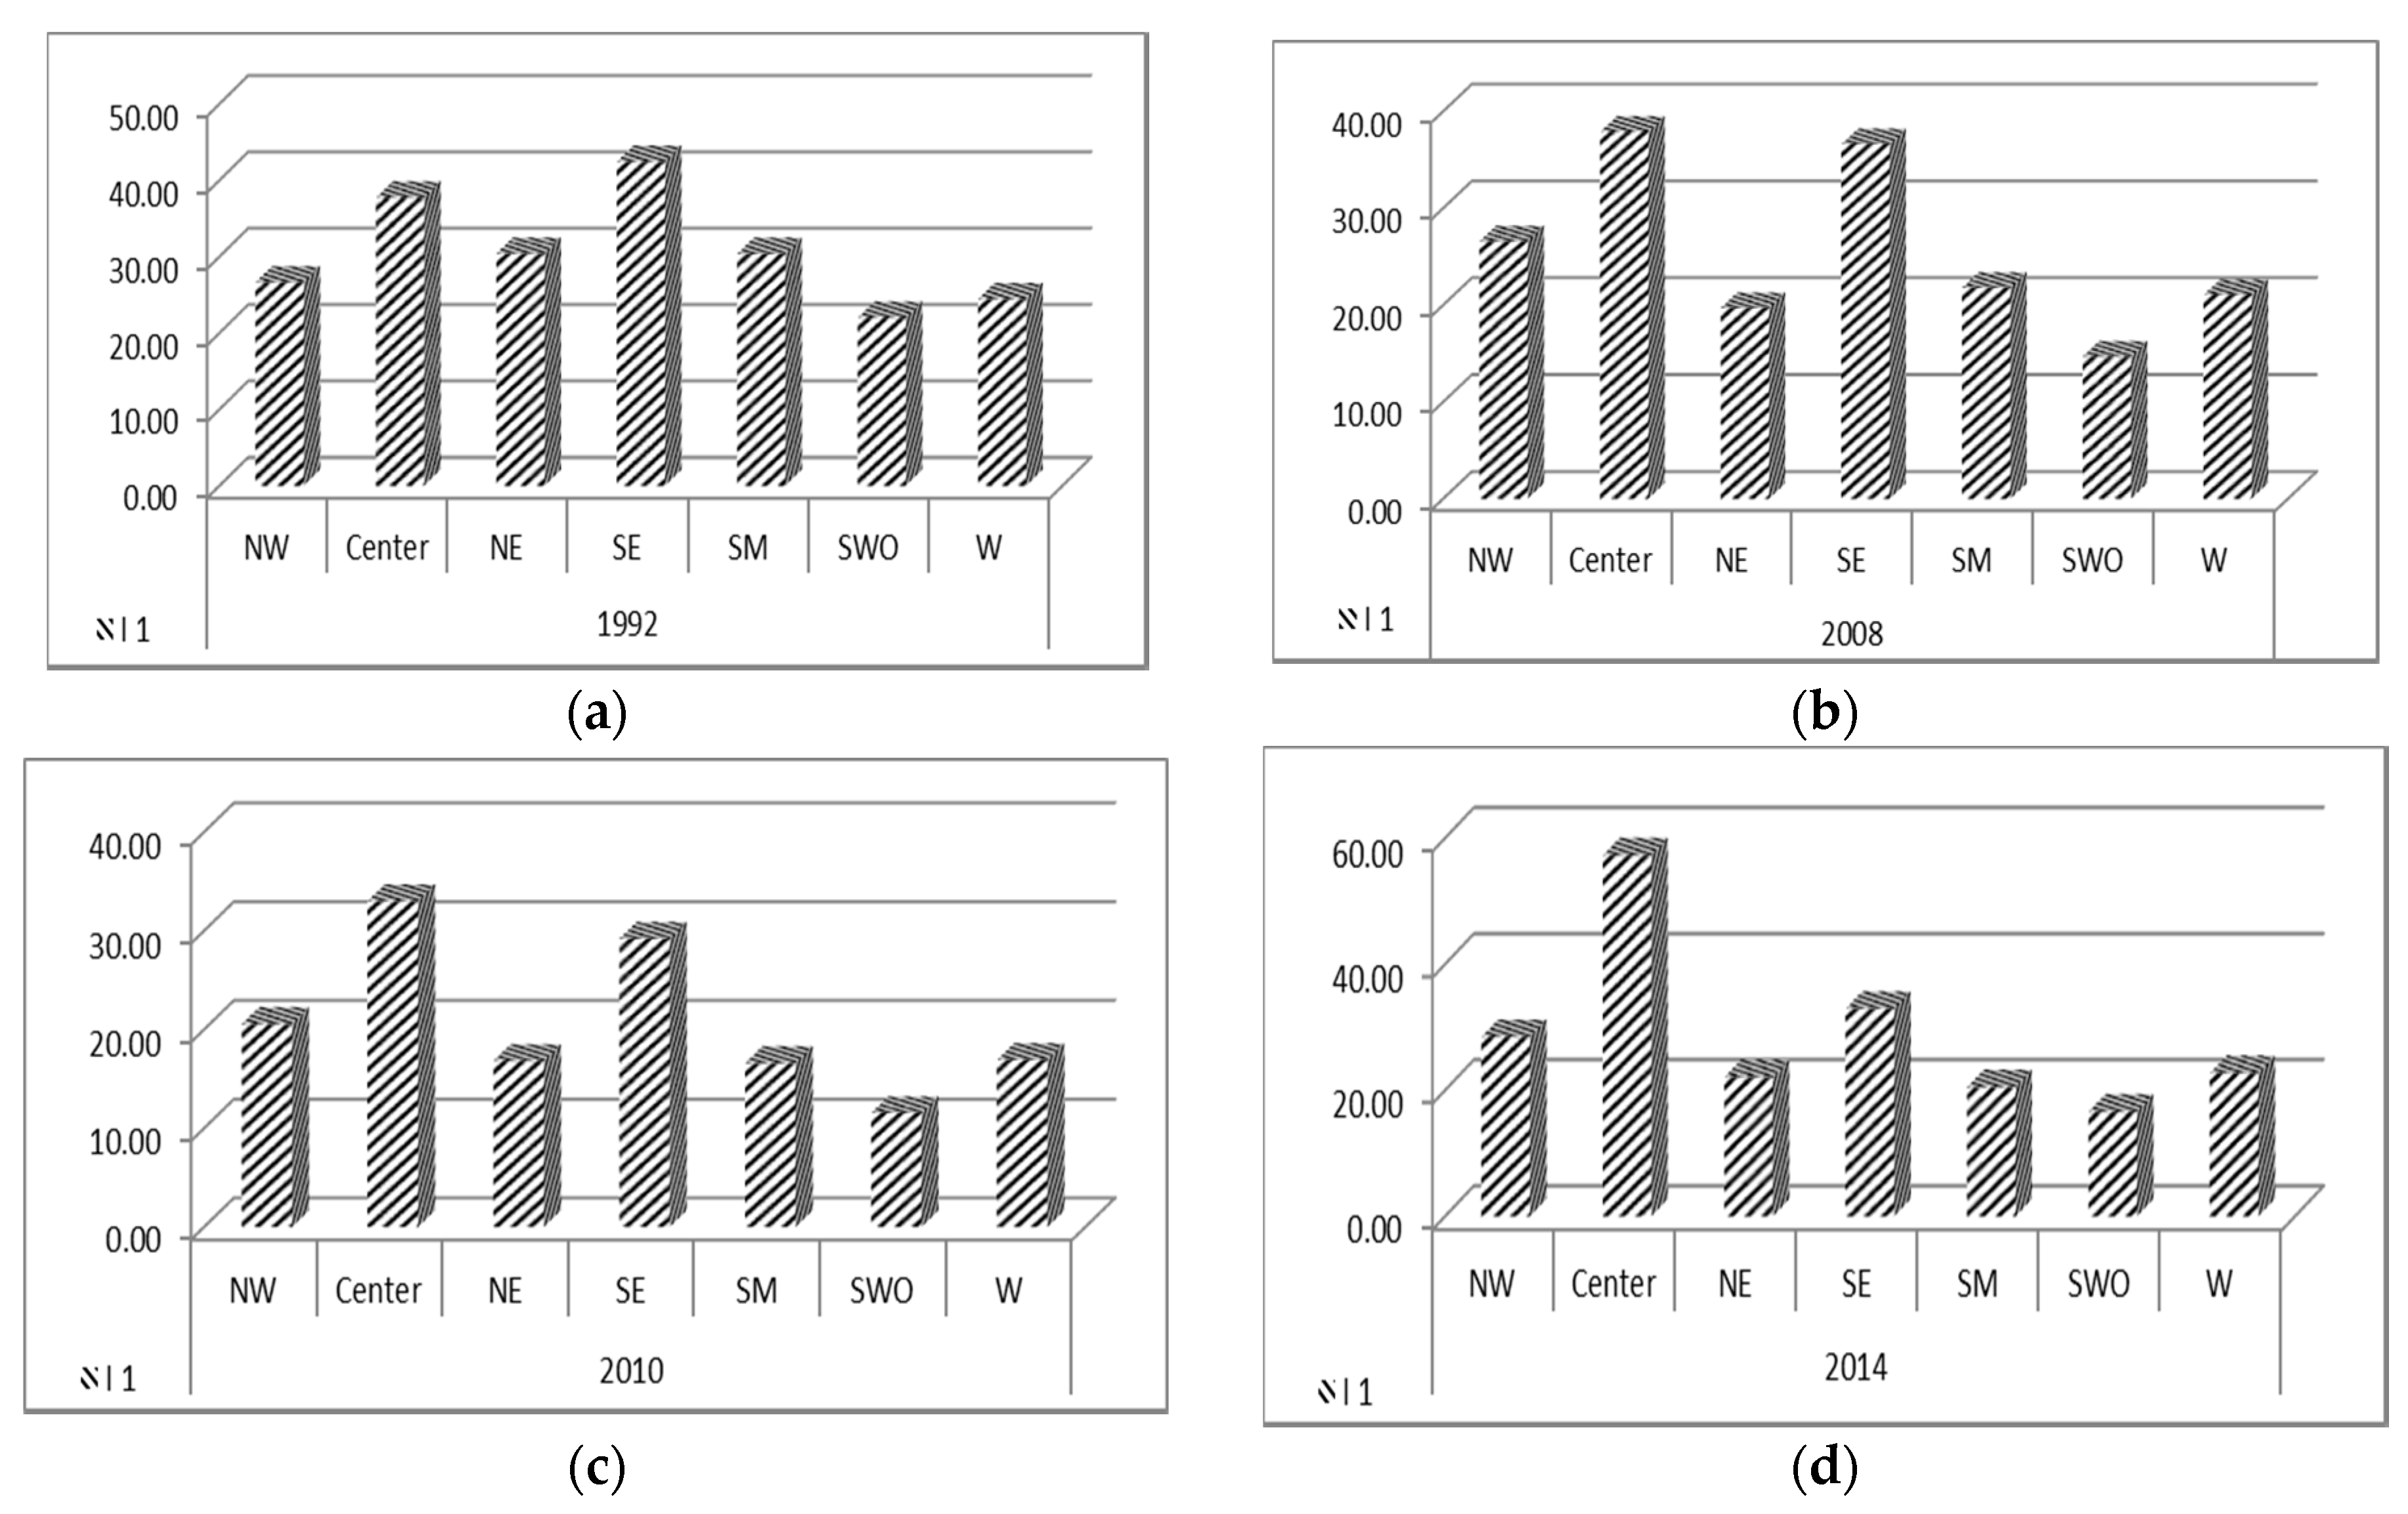
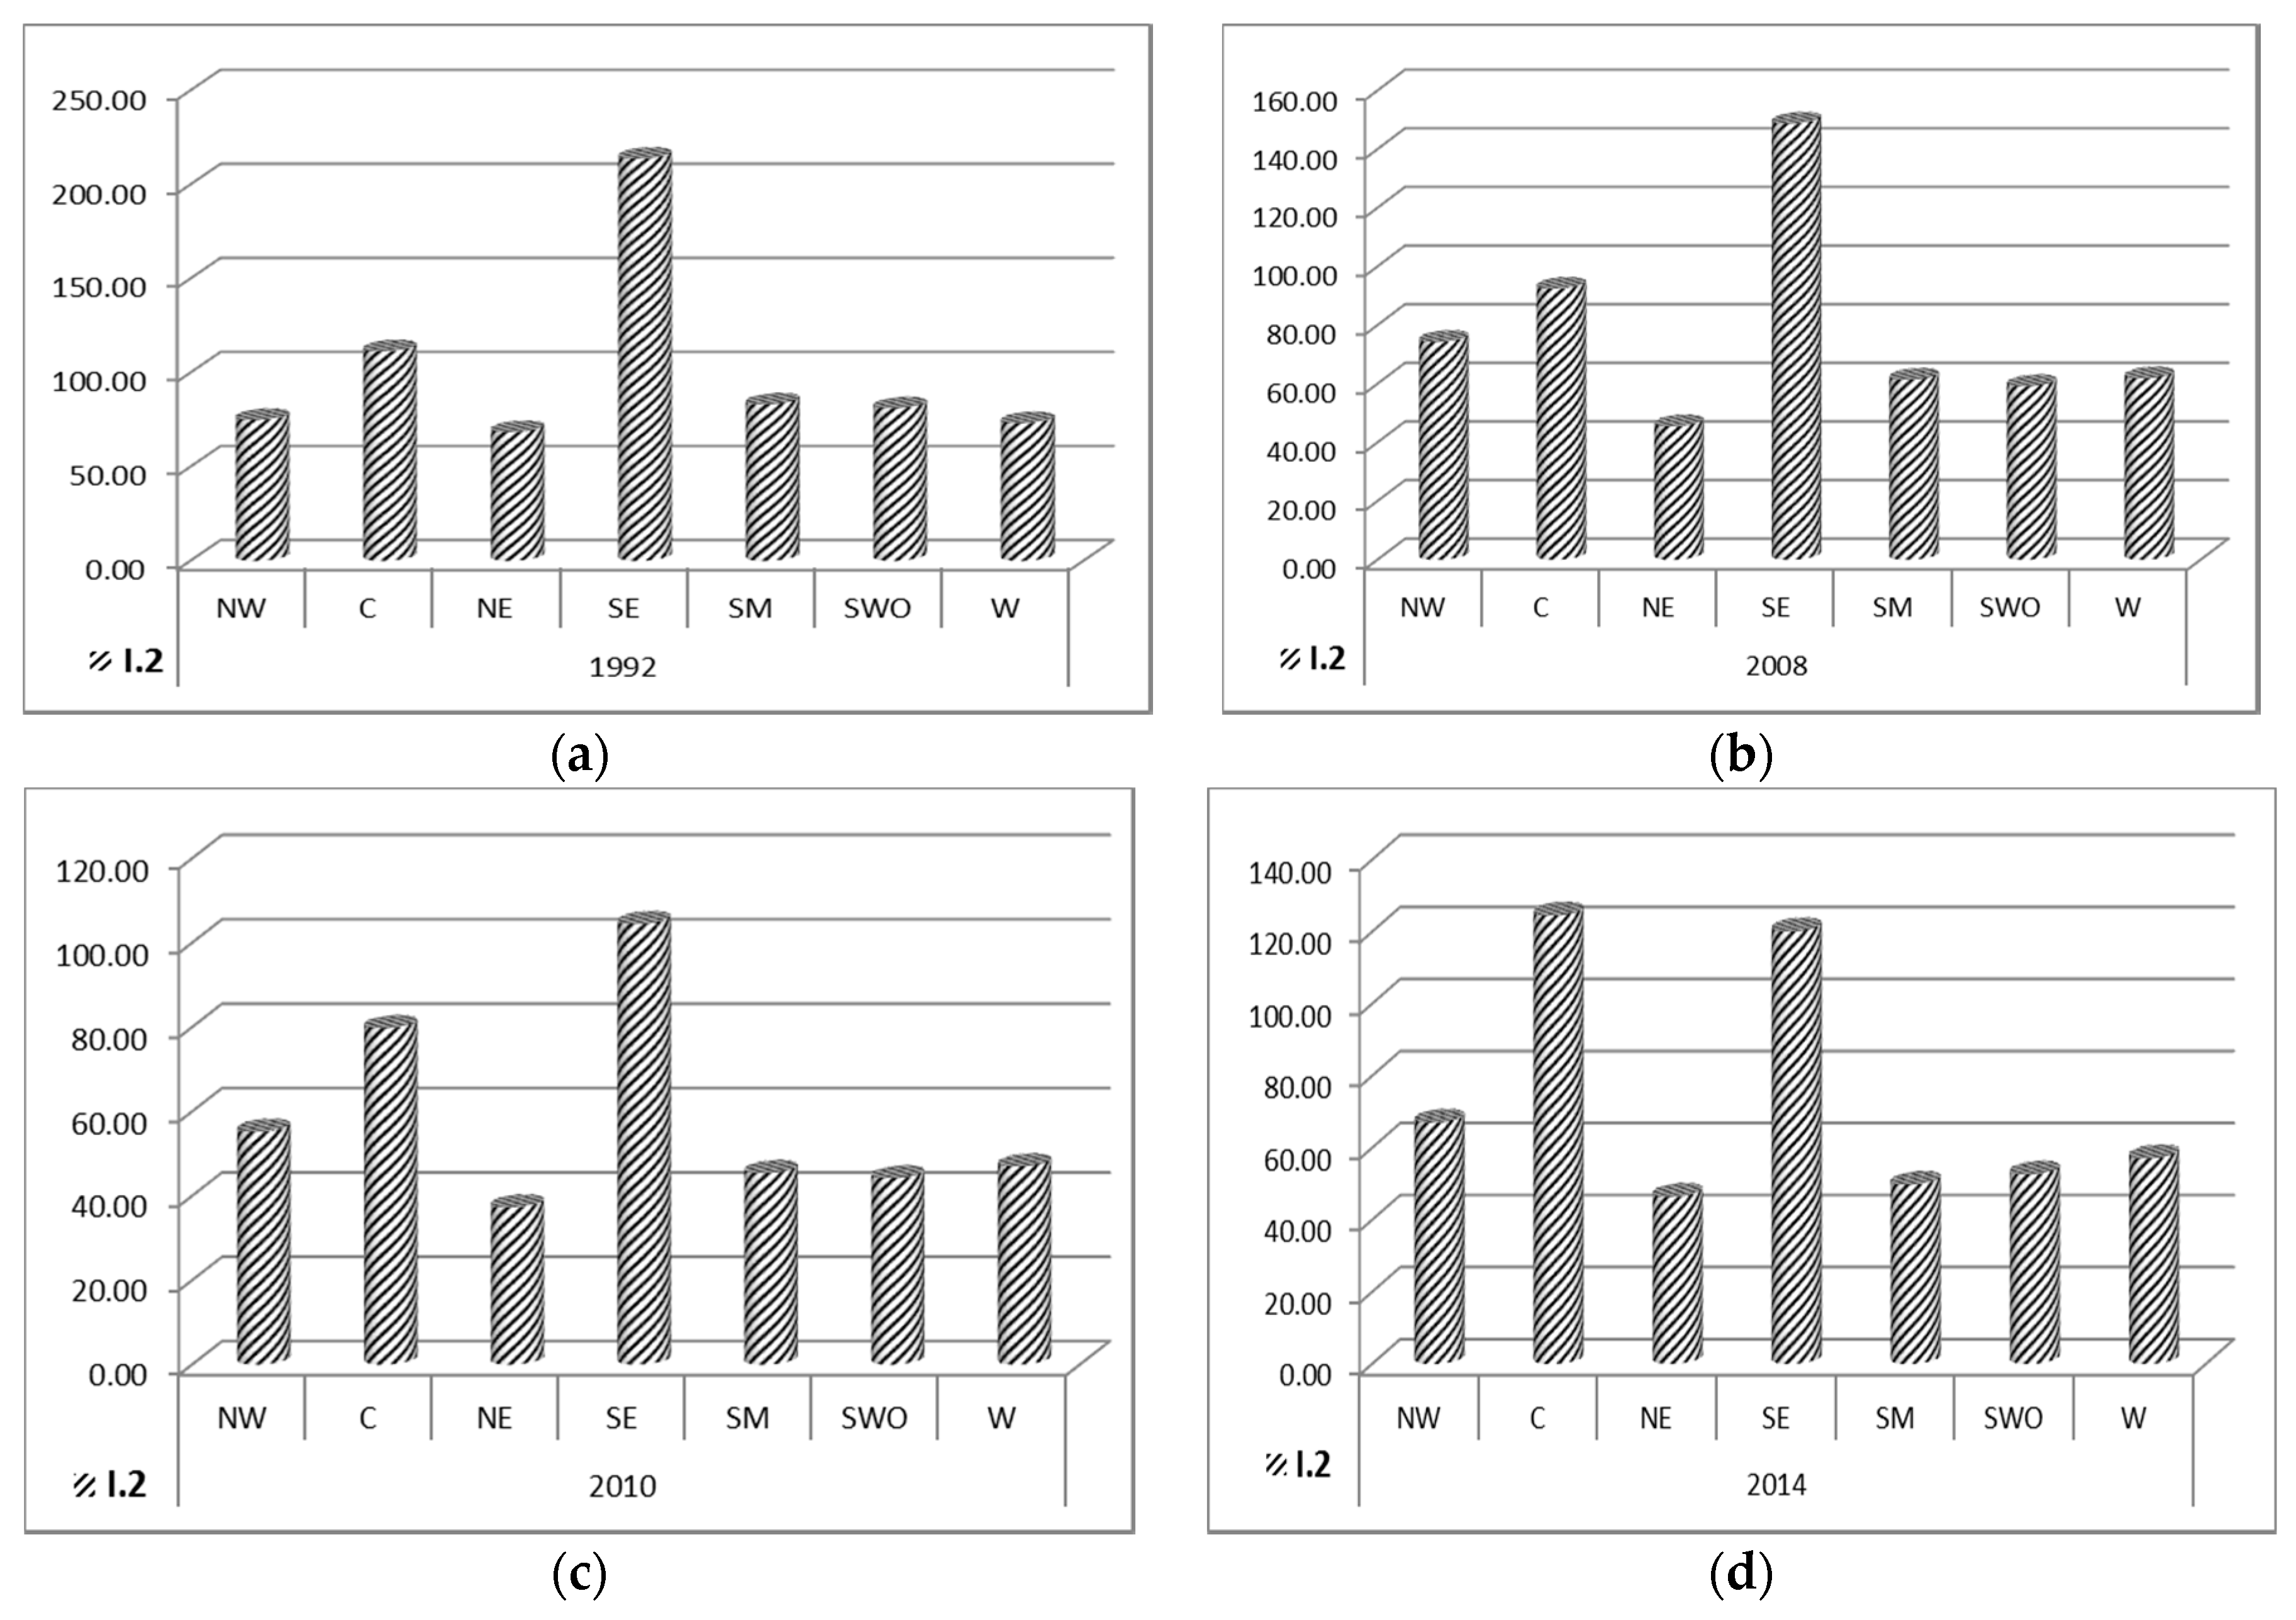
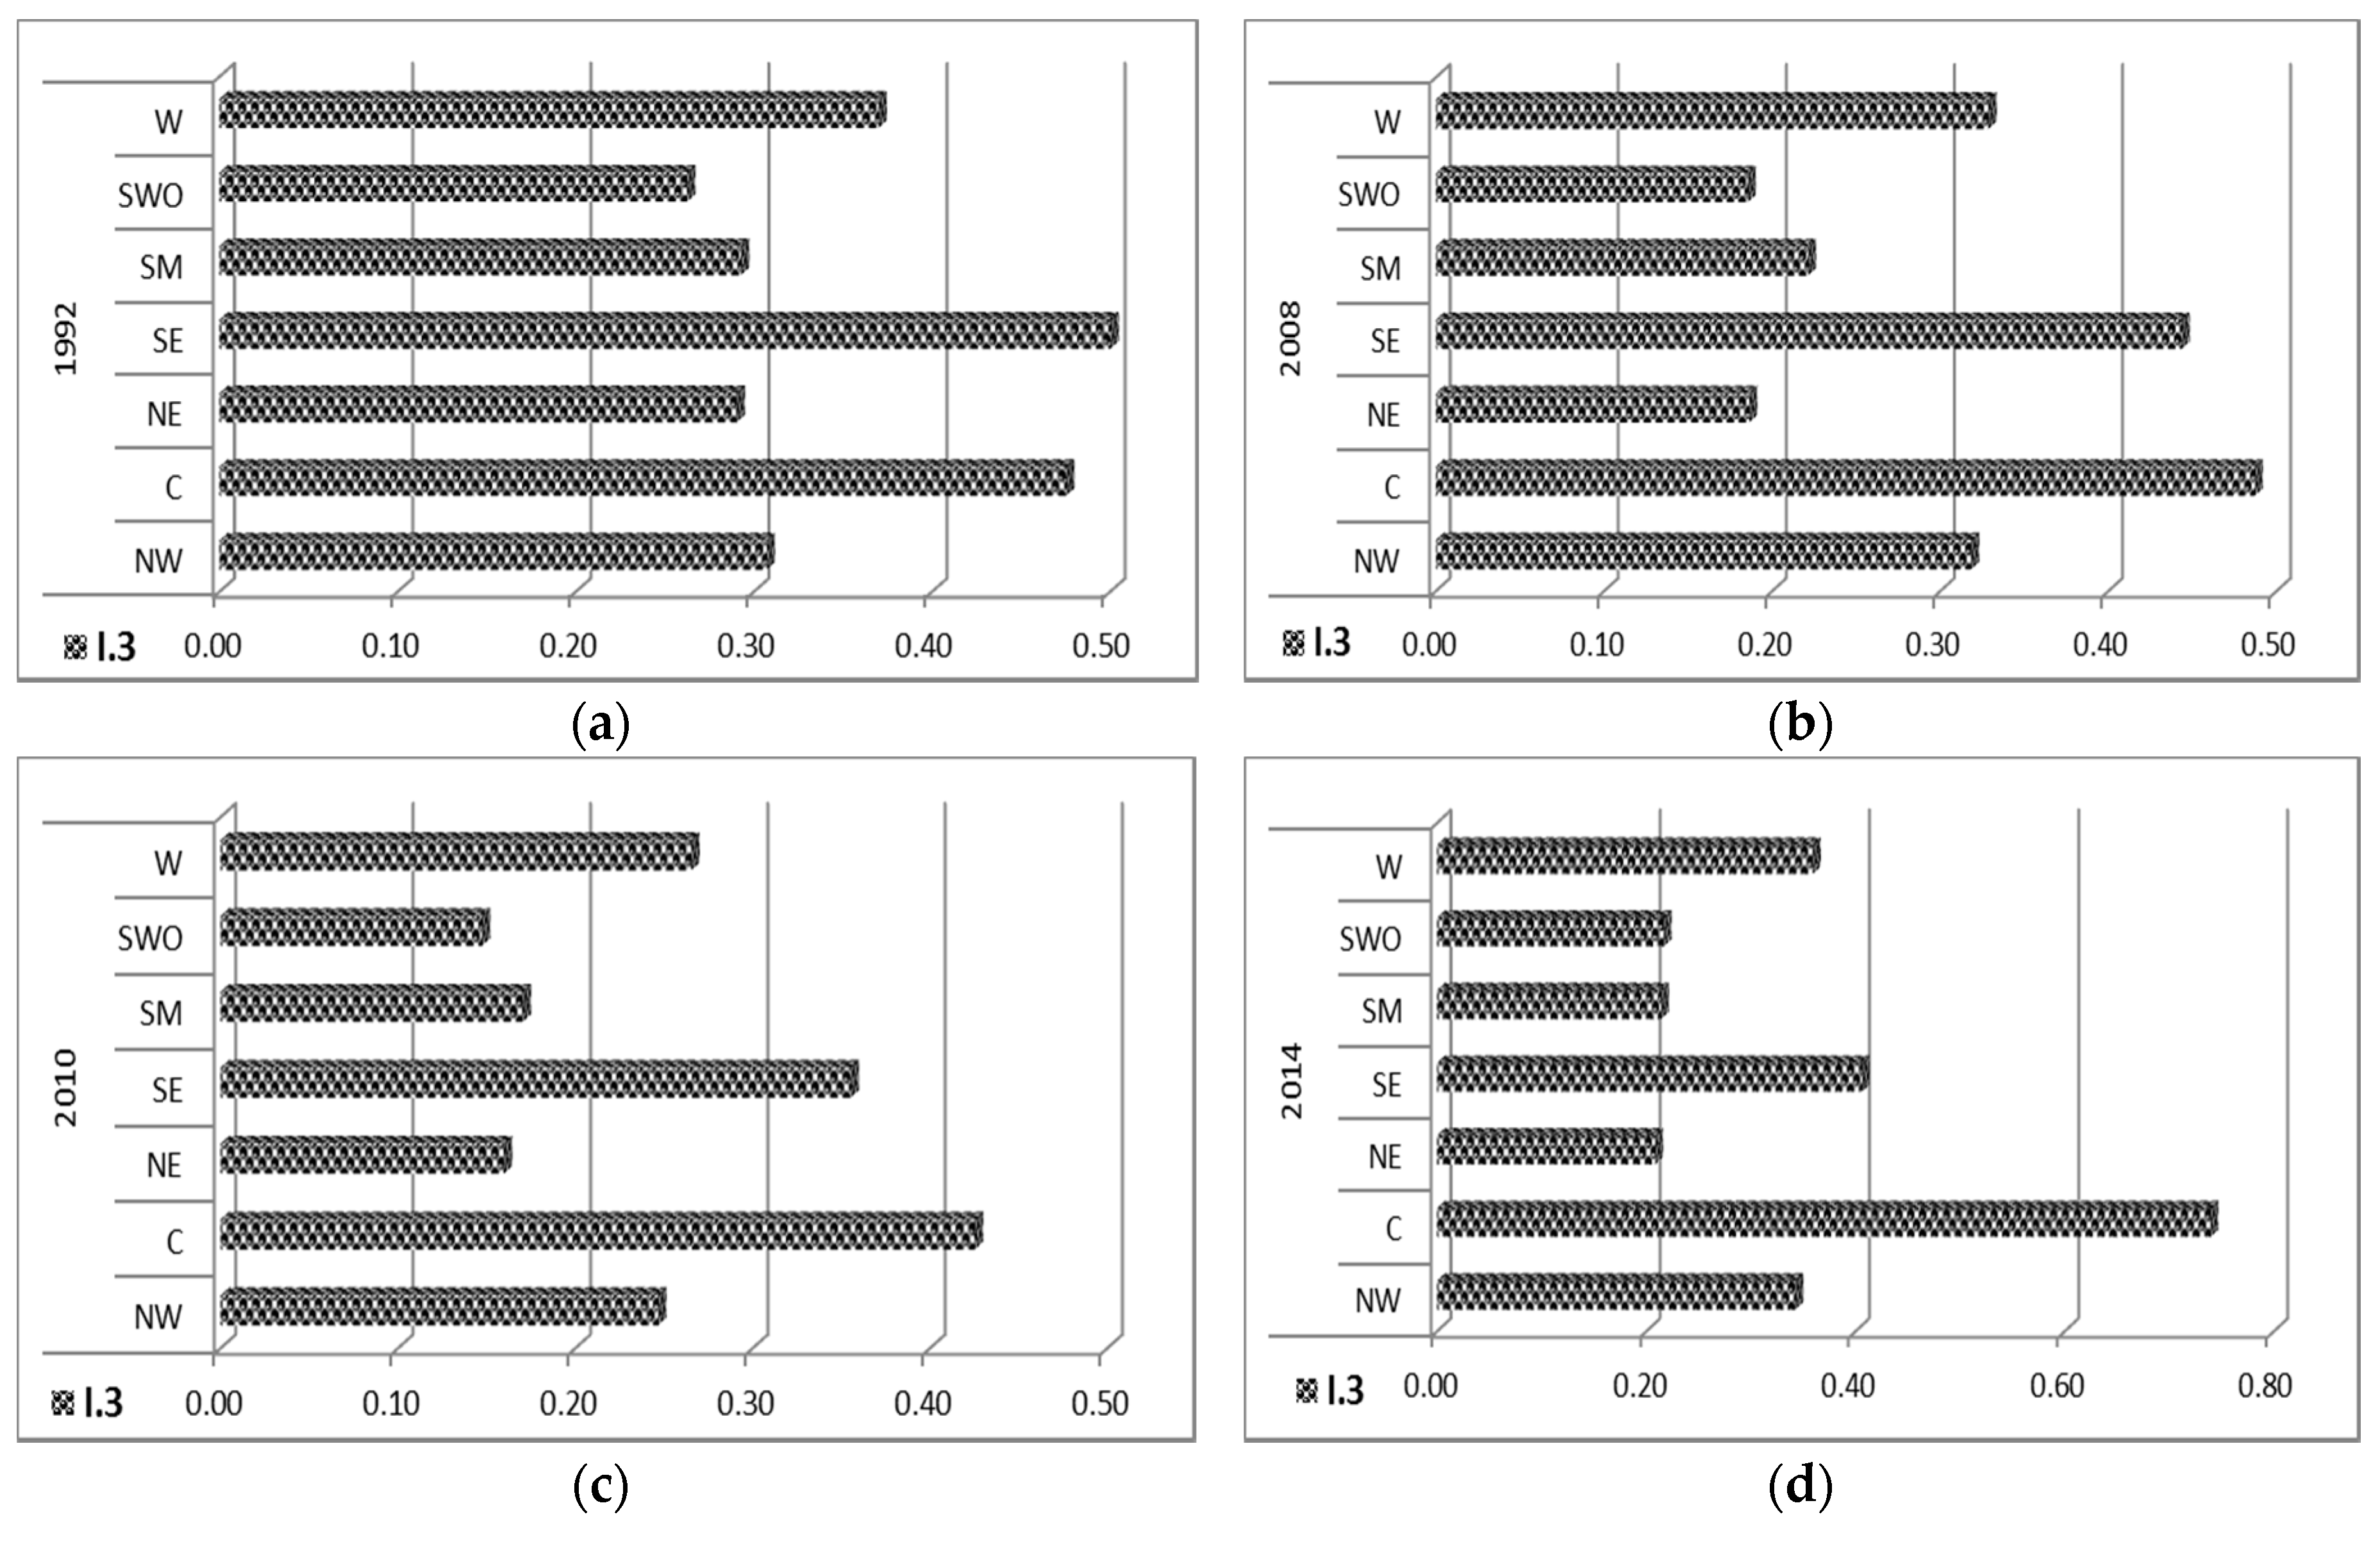
Table 1.
Grouping by categories of indicator value ranges.
| Category | I1 (Tourists/km2) | I2 (Overnight Stays/km2) | I3 (Tourists/Capita) |
|---|---|---|---|
| I | <10.00 | <20.00 | <0.10 |
| II | 10.01–20.00 | 20.00–40.00 | 0.10–0.20 |
| III | 20.01–30.00 | 40.00–60.00 | 0.20–0.30 |
| IV | 30.01–40.00 | 60.00–80.00 | 0.30–0.40 |
| V | 40.01–50.00 | 80.00–100.00 | 0.40–0.50 |
| VI | >50.00 | >100.00 | >0.50 |
Table 2.
Maximum and minimum values of indicators assessing the tourism pressure by macro-regions.
| Macro-Regions | I1 (Arrivals/km2) | I2 (Overnight Stays/km2) | I3 (Arrivals/Capita) | |||
|---|---|---|---|---|---|---|
| Min. (Year) | Max. (Year) | Min. (Year) | Max. (Year) | Min. (Year) | Max. (Year) | |
| MR. 1 | 20.25 | 42.86 | 65.17 | 95.70 | 0.25 | 0.53 |
| (2002) | (2014) | (2002) | (2014) | (2002) | (2014) | |
| MR. 2 | 38.52 | 66.68 | 129.46 | 257.61 | 0.22 | 0.38 |
| (2002) | (1992) | (2010) | (1992) | (2002) | (1992) | |
| MR. 3 | 28.50 | 58.36 | 73.96 | 133.99 | 0.36 | 0.29 |
| (2001) | (2014) | (2002) | (1992) | (2014) | (1992) | |
| MR. 4 | 13.77 | 23.28 | 45.64 | 76.95 | 0.19 | 0.31 |
| (2002) | (1992) | (2010) | (1992) | (2002) | (1992) | |
Table 3.
Mean indicators assessing tourism pressure by macro-regions.
| MR | I1 | I2 | I3 | |||
|---|---|---|---|---|---|---|
| Mean Value (Arrivals/km2 per Year) | Mean Rhythm (%) | Mean Value (Overnight Stays/km2 per Year) | Mean Rhythm (%) | Mean Value (Arrivals/Capita per Year) | Mean Rhythm (%) | |
| MR. 1 | 0.485 | 1.31 | 0.118 | 0.13 | 0.006 | 1.40 |
| MR. 2 | −0.004 | −1.22 | −4.79 | −2.36 | 0.745 | −1.27 |
| MR. 3 | 0.455 | 0.86 | −0.95 | −0.77 | 0.003 | 0.99 |
| MR. 4 | −0.158 | −0.73 | −0.999 | −1.52 | −0.001 | −0.46 |
Table 4.
The results of the unit root existence test in the variable series.
| Panel Unit Root Test: Summary | ||||
|---|---|---|---|---|
| Sample: 2000 2014 | ||||
| Exogenous variables: Individual effects | ||||
| User-specified lags: 1 | ||||
| Newey-West automatic bandwidth selection and Bartlett kernel | ||||
| Null: Unit root (assumes common unit root process) | ||||
| Method: ADF—Fisher Chi-square | ||||
| Series | Statistic | Prob. ** | Cross-sections | Comments |
| I1 | 10.2287 | 0.8544 | 8 | 104 |
| I2 | 19.8671 | 0.2263 | 8 | 104 |
| I3 | 8.54484 | 0.9310 | 8 | 104 |
| GDP | 6.05759 | 0.9875 | 8 | 104 |
| VH | 1.53449 | 0.9997 | 8 | 104 |
** Probabilities for Fisher tests are computed using an asymptotic Chi-square distribution. All other tests assume asymptotic normality.
Table 5.
The results of the unit root existence test in the differentiated variable series.
| Panel Unit Root Test: Summary | ||||
|---|---|---|---|---|
| Sample: 2000 2014 | ||||
| Exogenous variables: Individual effects | ||||
| User-specified lags: 1 | ||||
| Newey-West automatic bandwidth selection and Bartlett kernel | ||||
| Null: Unit root (assumes common unit root process) | ||||
| Method: ADF—Fisher Chi-square | ||||
| Series | Statistic | Prob. ** | Cross-sections | Comments |
| D (I1) | 61.9750 | 0.0000 | 8 | 96 |
| D(I2) | 57.7525 | 0.0000 | 8 | 96 |
| D(I3) | 61.7723 | 0.0000 | 8 | 96 |
| D(GDP) | 27.8343 | 0.0331 | 8 | 96 |
| D(VH) | 27.4150 | 0.0371 | 8 | 96 |
** Probabilities for Fisher tests are computed using an asymptotic Chi.-square distribution. All other tests assume asymptotic normality.
Table 6.
The results of the Johansen cointegration test with GDP as endogenous variable.
| Johansen Cointegration Test | ||||
|---|---|---|---|---|
| Sample (adjusted): 2003 2014 | ||||
| Included observations: 96 after adjustments | ||||
| Trend assumption: No deterministic trend | ||||
| Series: GDP I1 I2 I3 | ||||
| Lags interval (in first differences): 1 to 2 | ||||
| Unrestricted Cointegration Rank Test (Trace) | ||||
| Hypothesized | Trace | 0.05 | ||
| No. of CE(s) | Eigenvalue | Statistic | Critical Value | Prob. ** |
| None * | 0.614040 | 146.1088 | 40.17493 | 0.0000 |
| At most 1 * | 0.299735 | 54.71479 | 24.27596 | 0.0000 |
| At most 2 * | 0.172417 | 20.51029 | 12.32090 | 0.0017 |
| At most 3 * | 0.024108 | 2.342689 | 4.129906 | 0.1486 |
Trace test indicates 3 cointegratingeqn(s) at the 0.05 level. * denotes rejection of the hypothesis at the 0.05 level. ** MacKinnon-Haug-Michelis (1999) p-values.
Table 7.
The results of the cointegration equation (GDP as endogenous variable).
| Cointegrating Equation(s) | Log Likelihood | −1359.951 | |
|---|---|---|---|
| Normalized Cointegrating Coefficients | |||
| GDP | I1 | I2 | I3 |
| 1.000000 | −601.7610 | −83.60678 | −36757.28 |
Table 8.
The results of the Johansen cointegration test application with VH as endogenous variable.
| Johansen Cointegration Test | ||||
|---|---|---|---|---|
| Sample (adjusted): 2003 2014 | ||||
| Included observations: 96 after adjustments | ||||
| Trend assumption: No deterministic trend (restricted constant) | ||||
| Series: VH I1 I2 | ||||
| Lags interval (in first differences): 1 to 2 | ||||
| Unrestricted Cointegration Rank Test (Trace) | ||||
| Hypothesized | Trace | 0.05 | ||
| No. of CE(s) | Eigenvalue | Statistic | Critical Value | Prob. ** |
| None * | 0.623578 | 145.7287 | 35.19275 | 0.0000 |
| At most 1 * | 0.302560 | 51.93241 | 20.26184 | 0.0000 |
| At most 2 * | 0.165251 | 17.33992 | 9.164546 | 0.0012 |
Trace test indicates 3 cointegratingeqn(s) at the 0.05 level. * denotes rejection of the hypothesis at the 0.05 level. ** MacKinnon-Haug-Michelis (1999) p-values.
Table 9.
The results of the cointegration equation (VH as endogenous variable).
| Cointegrating Equation(s) | Log Likelihood | −1359.951 | |
|---|---|---|---|
| Normalized cointegrating coefficients | |||
| VH | I1 | I2 | C |
| 1.000000 | −57.06906 | −1.274356 | −1704.283 |
Table 10.
The share of arrivals, overnight stays and employment in tourism for the Central region from the total registered in Romania.
Table 10.
The share of arrivals, overnight stays and employment in tourism for the Central region from the total registered in Romania.
| % Arrivals | % Overnight Stays | % Economically Active Civil Population | |
|---|---|---|---|
| 1992 | 16.06 | 14.57 | 11.87 |
| 2014 | 23.07 | 20.93 | 12.17 |
© 2017 by the authors. Licensee MDPI, Basel, Switzerland. This article is an open access article distributed under the terms and conditions of the Creative Commons Attribution (CC BY) license (http://creativecommons.org/licenses/by/4.0/).
Share and Cite
MDPI and ACS Style
Gogonea, R.-M.; Baltălungă, A.A.; Nedelcu, A.; Dumitrescu, D. Tourism Pressure at the Regional Level in the Context of Sustainable Development in Romania. Sustainability 2017, 9, 698. https://doi.org/10.3390/su9050698
AMA Style
Gogonea R-M, Baltălungă AA, Nedelcu A, Dumitrescu D. Tourism Pressure at the Regional Level in the Context of Sustainable Development in Romania. Sustainability. 2017; 9(5):698. https://doi.org/10.3390/su9050698
Chicago/Turabian StyleGogonea, Rodica-Manuela, Adrian Aurel Baltălungă, Adrian Nedelcu, and Daniela Dumitrescu. 2017. "Tourism Pressure at the Regional Level in the Context of Sustainable Development in Romania" Sustainability 9, no. 5: 698. https://doi.org/10.3390/su9050698
Note that from the first issue of 2016, this journal uses article numbers instead of page numbers. See further details here.