
Effects of an Energy Tax (Carbon Tax) on Energy Saving and Emission Reduction in Guangdong Province-Based on a CGE Model


School of Environmental Science and Engineering, Sun Yat-Sen University, Guangzhou 510275, China
*
Authors to whom correspondence should be addressed.
Sustainability 2017, 9(5), 681; https://doi.org/10.3390/su9050681
Submission received: 25 February 2017
/
Revised: 13 April 2017
/
Accepted: 20 April 2017
/
Published: 25 April 2017
(This article belongs to the Section Energy Sustainability)
Abstract
:Guangdong, as China’s most affluent province, which is representative in terms of its industrial and energy consumption structure, will deal with an important issue about how to change its environmental management policies from command-and-control strategies to incentive-based ones and how to exert its effects to the greatest extent possible in the new situation of the impending imposition of an environmental tax. By establishing an energy Computable General Equilibrium (CGE) model for Guangdong Province, and setting up various taxation and tax refund scenarios, this research simulates the energy saving and emission reduction effects imposed by the imposition of an energy tax or carbon tax at various tax rates in Guangdong Province, and analyzes the mitigation effects upon an economic system by various tax refund plans. The research proves that when the energy tax rate is at 100–200 yuan/tce (ton coal equivalent) or carbon tax at 50–100 yuan/t CO2, the energy consumption of Guangdong Province is reduced by 5.8–11.21%, and carbon emission is reduced by 5.94–11.61%. The energy saving and emission reduction effects of the carbon tax surpasses that of the energy tax under the equivalent tax revenue with even fewer significant negative impacts upon the economy, contributing to the capital transfer towards non-energy intensive industries; thus, appropriate and accurate tax refund plans can alleviate the negative impacts of taxation upon the economy in Guangdong Province.
1. Introduction
It has been 20 years since the implementation of top-down environmental protection management policies, of which a core policy was controlling the total amount of pollutants. The Chinese government has realized that the environmental protection management policies executed in an imperative style can no longer fit the contemporary social and economic development, and the policies’ one-fold attribute can never fundamentally solve the problem compounded by the great discrepancies in the environmental resources and economic technology, complex causes for pollution, and solutions for remediation among different provinces. Consequently, new environmental protection management policies with economic incentives, including emission trading and environmental protection taxes, are being issued in succession [1,2]. However, those policies formulated by the central government only belong to basic and guiding regulations and policies so that each province is more empowered to establish relevant regulations and policies of their own. It can be predicted that the environmental protection management policies with economic incentives customized by each province in accordance with its own situation will better facilitate the realization of energy saving and emission reduction goals [3].
As the leading province in terms of economy (up to 2016, its GDP has ranked first in China for 28 years), and one of the largest energy-consuming provinces in China, Guangdong Province altogether attained a final energy consumption of 26,344.85 104 tce [4] in 2010. In the meanwhile, Guangdong Province is also confronted with the highest target for energy savings and emission reduction (the Work Program of “12th Five-Year Plan” on the Control of Greenhouse Gas Emission issued by the State Council in 2011 demanded that Guangdong Province should reduce, respectively, by 18% and 19.5% [5] the energy intensity and carbon intensity during the 12th Five-Year Plan period). Despite the fact that the low-carbon energy development policies and total carbon policies [6] formulated by Guangdong Province can achieve the energy saving and emission reduction target to a certain extent in the short term, their features of high execution costs, unsatisfactory sustainability, and lack of incentives are significantly dwarfed by economic incentive policies, such as tax imposition. The energy tax (carbon tax) on the basis of environmental protection tax, as a comparatively mature economic policy, does have preferable effects on energy saving and emission reduction. Under the new situation of environmental protection tax collection, it is of great necessity for Guangdong Province to deeply explore the influences on the economy and the effects upon energy saving and emission reduction target imposed by taxation of energy tax or carbon tax, especially in terms of the methods of taxation, tax levels, and compensations.
The taxation of energy tax (carbon tax), as one of the major taxes in some developed countries, aims to guide enterprises to internalize the outer environmental costs for energy use by means of a price-conducting mechanism, with significant functions in the aspects of environmental protection, tax revenue increase, and energy mix improvement. Since most of the energy policies can exert influences upon economic systems in various aspects, a coherent and systematic tool is needed to analyze the influences of energy polices on the economy and environment. The computable general equilibrium (CGE) model can desirably describe the complexity of economic entities and analyze the influences of energy polices on the economy and environment, and is widely utilized in the analysis of energy-environmental-economic fields [7].
A large amount of quantitative research on energy taxation (carbon taxation) has been conducted abroad, basically focusing on the tax rate, tax base, and compensations. For instance, Scrimgeour et al. [8] set the tax rate at 0.6% of base-year GDP, and utilized the CGE model to conduct simulation analysis on the influences of the three taxations (energy tax, carbon tax, and petroleum tax) on the economy and social welfare of New Zealand. Wissema et al. [9] utilized the CGE model to simulate and analyze the emission of CO2, proving that it can be reduced to the target value when the carbon tax rate is at 10–15 euros/t CO2. Labandeira et al. [10] simulated and analyzed the influences on the economy, environment, and social welfare of Brazil by means of the CGE model when the tax rate was set to 23 euros/t CO2 and the tax revenue is used for the reduction of the equivalent labor tax. Meng et al. [11] conducted research on the influences of taxing at 23 $/t CO2 under the two cases of compensation and without compensation in Australia. In summary, those studies have reached a universal conclusion that energy taxes or carbon taxes can be a very effective measure for emission reduction, in spite of their negative impacts upon the social economy, to a certain extent. Therefore, decision-makers should take the comprehensive influences of society, economy, and environment into consideration, when setting the tax rate and providing proper compensation.
There are also some research cases in China. For instance, Zhang et al. [12] analyzed the influences of different carbon taxes (20 yuan/t, 40 yuan/t, 60 yuan/t) on Henan, Fujian, and Chongqing provinces, and proposed two compensation plans, compensating residents’ income and reducing enterprises’ indirect tax. Lu et al. [13] established the CGE model based on the data from China’s input-output table in 2010, and forecasted the influences of tax rate, respectively, at 50 yuan/t, 100 yuan/t, 200 yuan/t, and 300 yuan/t on the economy. Liang et al. [14,15] analyzed the influence of a carbon tax on China’s economy, proving that a carbon tax can affect energy-intensive and export-oriented departments enormously, which can be compensated by a properly-reduced tax rate and subsidy. Guo et al. [16] divided the energy department into eight sub departments, and explored the influence of four tax rates at 17.18 yuan/t, 36.49 yuan/t, 81.08 yuan/t, and 132.01 yuan/t corresponding to the CO2 emission reduction by 5%, 10%, 20%, 30% on the economic environment by means of the CGE model. Based on the CGE model, Hu [17] simulated that under the energy tax plan of 27 yuan/tce, energy intensity can be lowered by 6.9% and 6.99%, respectively, in the short and long run. The simulation analysis conducted by Yang et al. [18] revealed that the taxation of energy tax can exert trivial influence on the growth of national economic aggregate, while energy tax policies can be beneficial to the reduction of energy demand, energy intensity, and the share of coal in energy synthetics, thus improving the energy mix and promoting the industrial structure adjustment, and can facilitate the reduction of CO2 and SO2 emission, thus enhancing the environmental quality. He et al. [19] held the idea that the simple implementation of an energy tax and environmental protection tax for the realization of pollution reduction targets would bring negative impacts upon the macro-economy, and the taxation on pollutants would exert fewer negative influences on economic activities than that on energy consumption. If combined with corresponding supporting policies (such as reducing the business tax on the service industry to promote its development), the negative impacts caused by the implementation of an energy tax/environmental tax can be offset, along with a dual bonus.
Even though research cases and actual experiences on energy taxation are abundant, the discrepancies of economic and social structure among various countries and districts make it impossible to completely replicate any of the research and experience. As a test field for national new economic policies, Guangdong Province is obligated to utilize a more effective energy saving and emission reduction policy to tackle the arduous emission reduction task. By establishing the energy CGE model for Guangdong Province, this thesis analyzes the effects of the taxation of an energy tax (carbon tax) on energy savings and emission reduction, the macro influences on the national economy of the whole province, the impacts of different tax rate policies, and the effects of compensations by quantitative comparison, attempting to provide references for government decision-making.
2. Methods and Data
2.1. Construction of Economy and Energy Social Accounting Matrix (SAM) of Guangdong Province
2.1.1. Energy Consumption Statistics and Carbon Emission Calculation for Guangdong Province
Based on the energy balance table [20] of Guangdong Province in the China Energy Statistical Yearbook 2013 [20], and calculated as four major energy types, including coal, petroleum, natural gas, and power and heating and others, and seven major departments, the final energy use of Guangdong Province in 2012 can be seen in Table 1. Detailed forms of each type of energy are shown in Table A1.
Guangdong Statistics Yearbook 2013 [21] has counted the total energy consumption (measured by standard coal), consumption quantity of raw coal, and electricity of the industries by sector [21]. Based on the above statistics and by means of bi-proportional scaling (RAS), the column target vector is set as the final total energy consumption of industries by sector, the row target vector as the total consumption of various types of energy in the industries, and the initial condition refers to the energy consumption allocating ratio of various energy types in various industrial sectors of Guangdong Province. After repeated iterative computations, the energy consumption amount of various types in various industrial sectors of Guangdong Province can be calculated. The carbon emission coefficient of coal is set as 2.81 t/tce, petroleum 2.15 t/tce, natural gas 1.64 t/tce, and coal power 2.46 t/tce, all of which are derived from Bian’s research [22].
2.1.2. Construction of the Energy Input-Output (IO) Table
On the basis of the department features of the input-output (IO) table for 42 departments in 2012, considering the key departments for energy conservation and emissions reduction in Guangdong Province, 30 departments are selected as the object departments of this study, which are shown in Table A2, and the structure of the energy IO table is shown in Table A3.
2.1.3. Construction of the Energy Social Accounting Matrix (SAM) Table
Considering the research purpose of this thesis, the accounts of the SAM table are divided into several major types, such as activities, commodities, elements, energy tax (carbon tax), residence, enterprise, government, investment and deposits, other provinces, and foreign countries, supposing that one activity only produces one commodity. The energy resources are classified into four types, namely: coal, petroleum, natural gas, and electricity measured by standard coal. The CO2 emission of each department can be determined according to the emission coefficient of various energy types to compile the macro SAM table, which can be broken down by various production departments and commodity departments into a micro SAM table.
2.2. Model Structure
2.2.1. Production Module
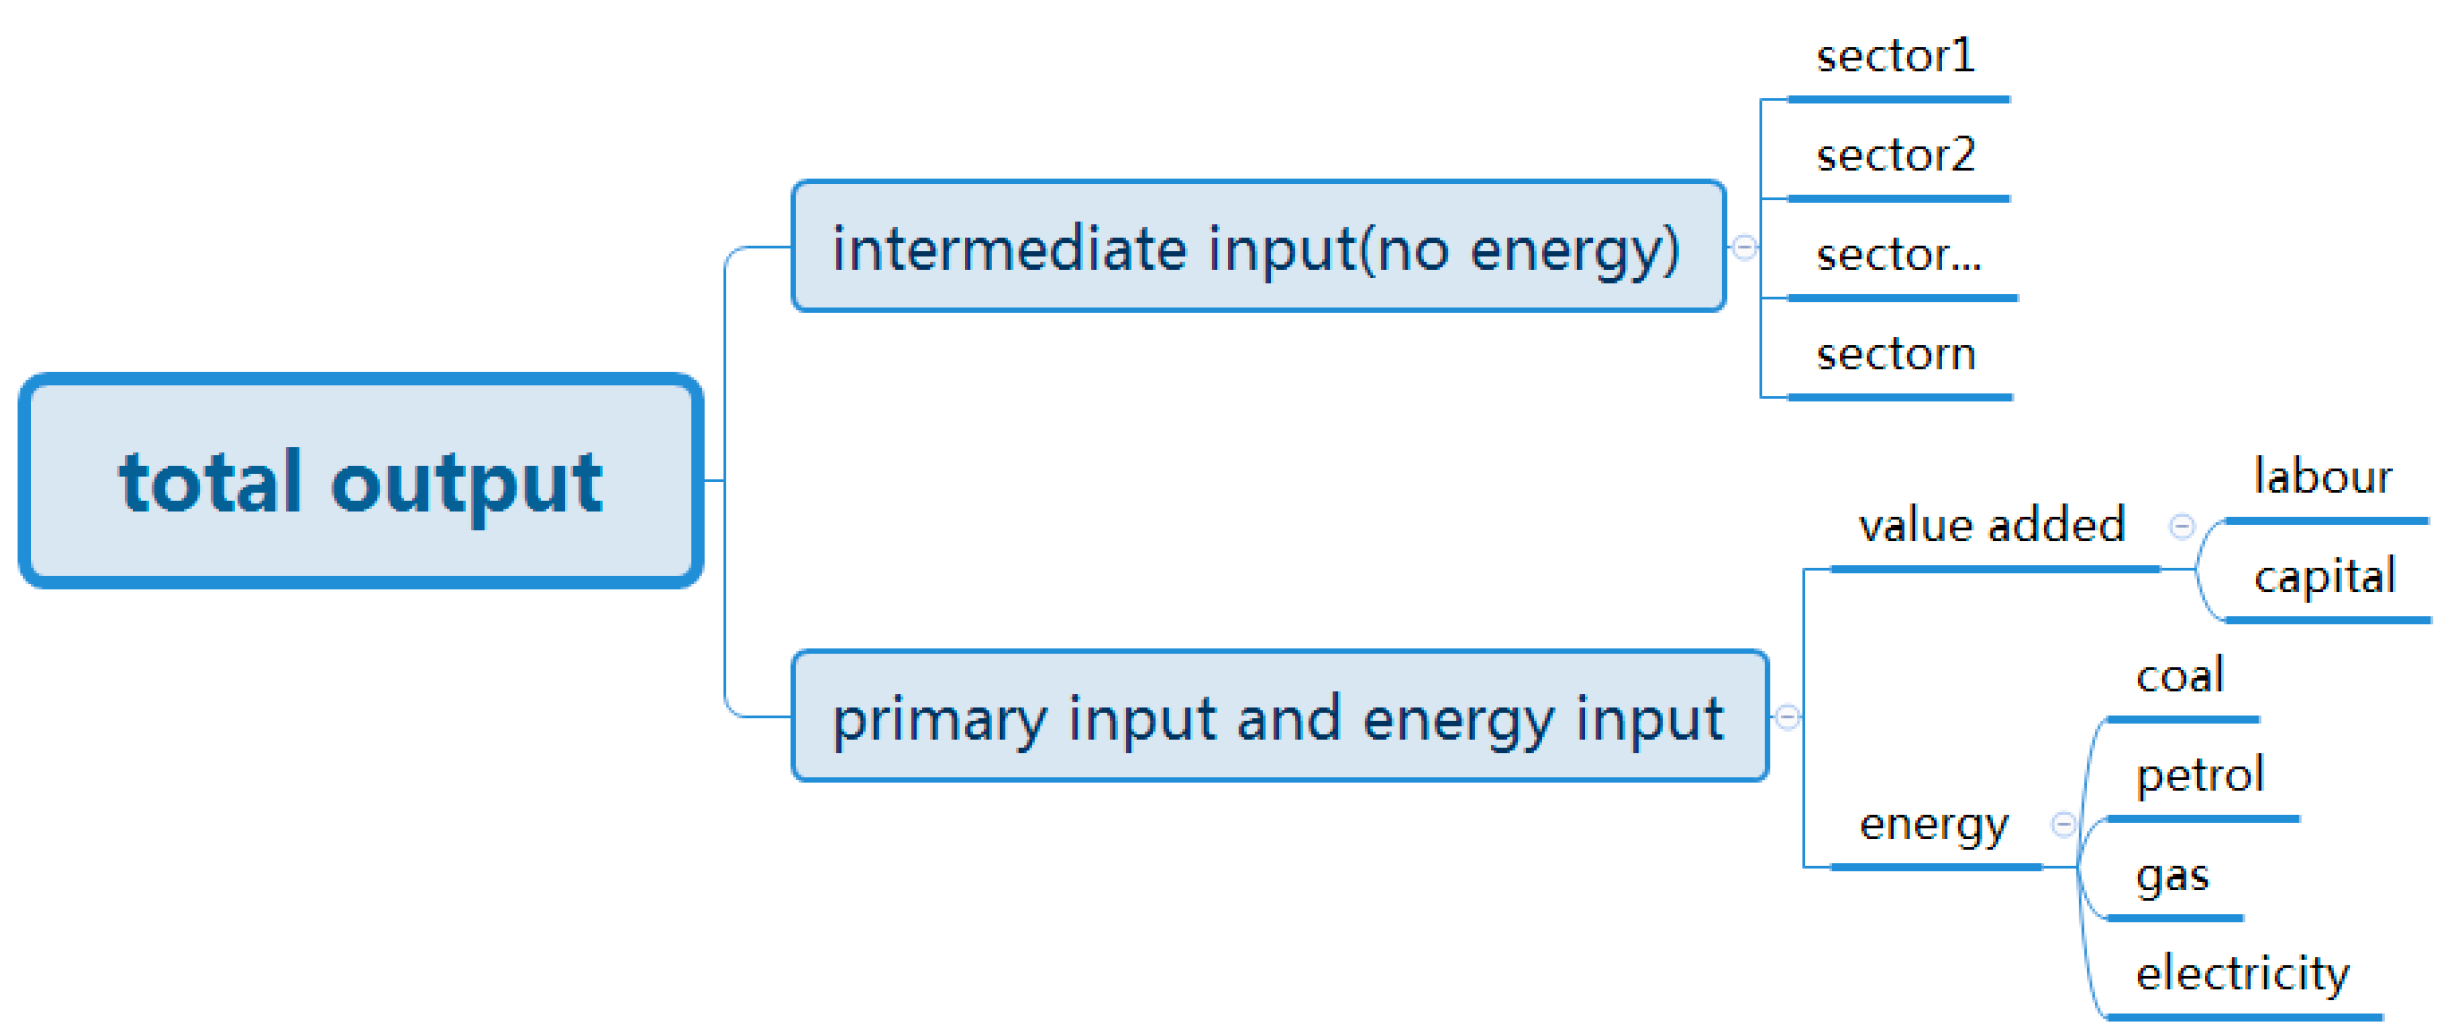
The gross output adopts the three-level CES production function nested structure seen as Figure 1, and the model equation and variables can be borrowed from Zhang’s research [4]. The first level is composed of anon-energy intermediate input (QINTA) and energy-added value (QEVA) synthesis bundle; the non-energy intermediate input in the second level utilizes a Leontief production function, and the energy-added value synthesis bundle combined by an energy input (QE)and labor-capital synthesis bundle (QVA); the labor-capital synthesis bundle in the third level is combined with labor (QLD) and capital (QKD), and the energy input also adopts a Leontief production function, combined by the five energy departments of the 42 departments in the input-output table.
2.2.2. Trade Module
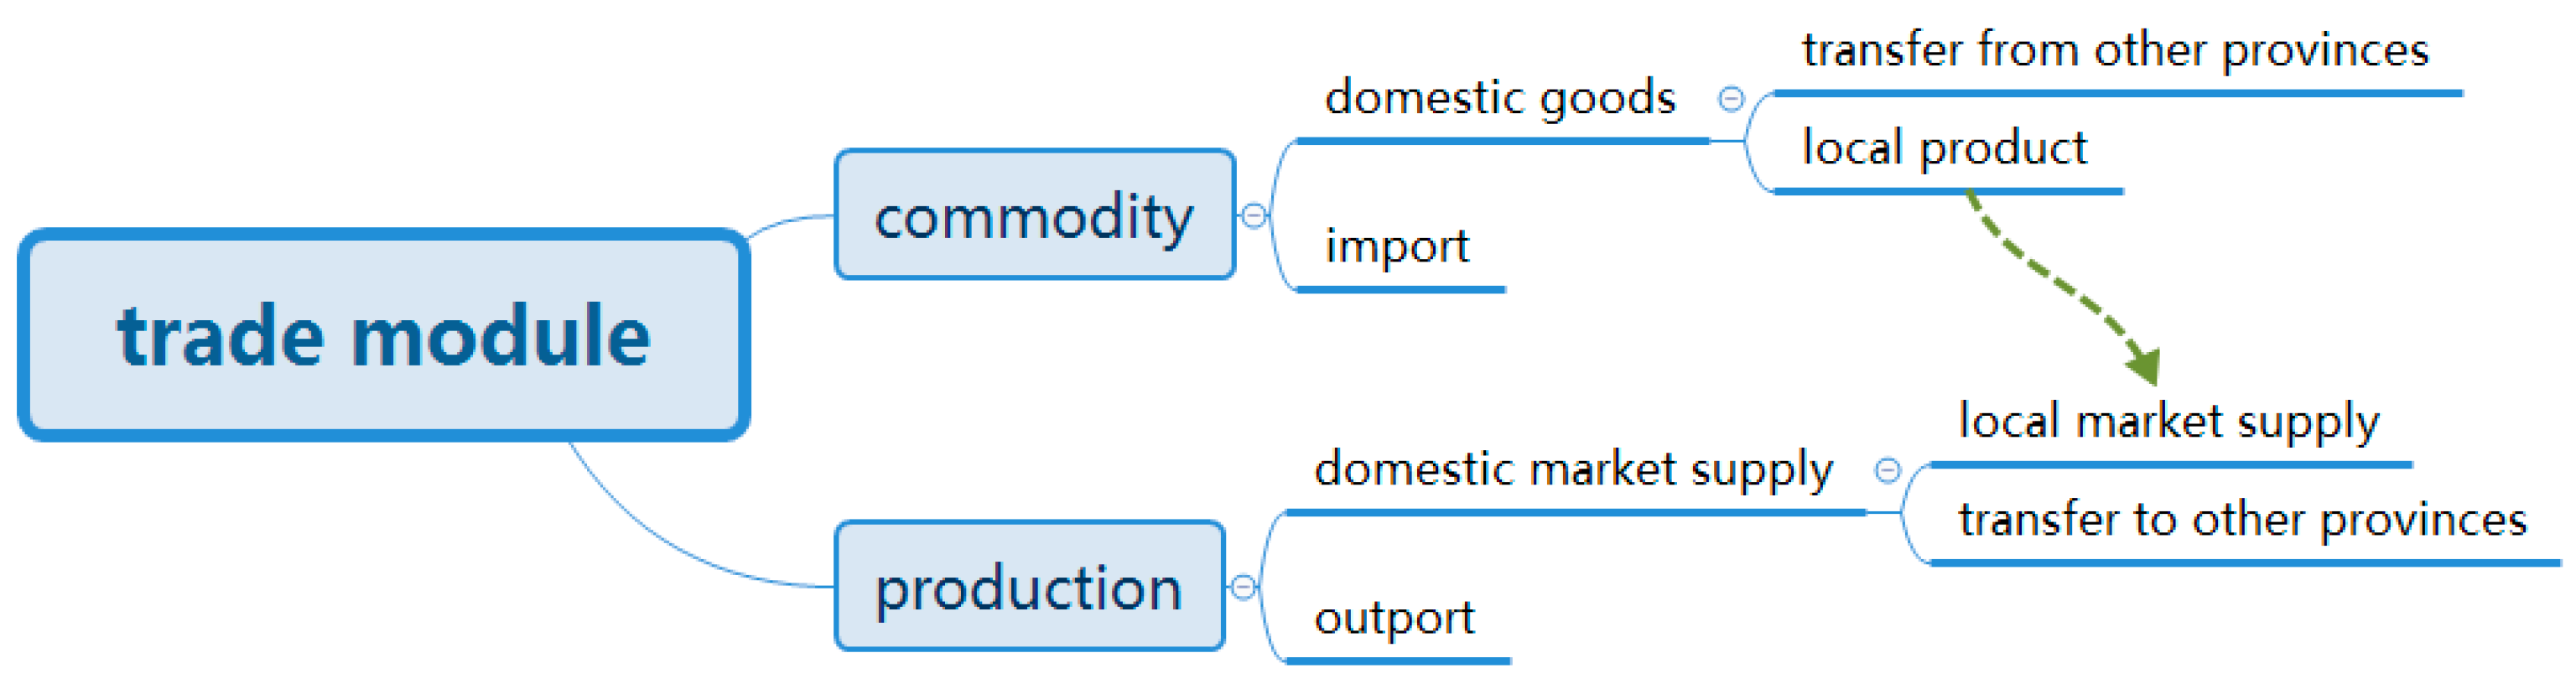
The trade module refers to the description of the market commodity source and the distribution of the department output seen in Figure 2. The commodity source follows the Armington hypothesis, a two-level nested CES function. The first level refers to the CES combination of domestic commodities (QDC) and imported commodities (QM), and the domestic commodities in the second level refer to the CES combination of the local production in Guangdong Province (QDCL) and the transported commodities from other provinces (QDCP). The department output is distributed by the principle of profit maximization, based on the two-level CET function, one of which refers to the selection from supplying the domestic market (QDA) and export (QE), and the other refers to the selection from supplying the local market (QDAL) and transporting to other provinces (QDAP).
2.2.3. Income and Expenditure Module
The income and expenditure module describes the income and consumption of each economic subject seen in Figure 3. Residents’ income (YH) comes from labor remuneration, and transfer payment (transfrhg), etc., referring to the total of labor factor income from each department, the transfer payment from government to the residents, and enterprises’ profit distributing to residents. Residents’ expenditure includes the commodity consumption (QH), individual income tax payment and deposits, for which the commodity consumption is to be derived from the Cobb-Douglas function. Enterprises’ incomes (YENT) mainly come from capital return and the transfer payment from government (transfrentg), and their expenditure refers to income tax payments and deposits. Government income (YG) includes the added-value tax and energy tax on production departments, tariffs on commodity departments, and the income tax on residents and enterprises, while the expenditure included government’s consumption of commodities (QG), and the transfer payment to residents and enterprises.
2.2.4. Equilibrium and Macro Closed Module
Suppose all of the commodity markets are cleared at a certain price, the actual expenditure (QG0) of the government is exogenous, as is the total investment; all of the tax rates and transfer payments are certain, the value of deposits of residents and enterprises (ENTSAVE) is endogenous; the actual value of government deposits (PSAV) is endogenous, as is the value of the deposits of other provinces (PSAV), while the price of other provinces (PDCP, PDAP) is exogenous; the value of abroad deposits (FSAV) is exogenous, and the exchange rate is endogenous. The model adopts the neoclassical closure principle.
All of the above model equations, parameters, and varieties are as described in Appendix B.
2.2.5. Tax Imposition Module
This module takes two methods of tax imposition into account, one of which is an energy ad valorem tax (ETAX) levied by the energy heat value that the production department consumes, and the other is a carbon ad valorem tax (CTAX) levied by the carbon emission quantity the production department produces. Since the input-output table shows the value quantity of the energy usage amount while the taxation is based on the energy consumption amount and CO2 emission amount, the energy consumption amount and carbon emission amount per unit value energy of each department can be figured out by the energy consumption amount and carbon emission amount from actual statistics in Section 2.1.1 of this thesis, thus defining the tax rate tve or tvc on the basis of the energy value quantity.
The calculation formulas for the tax rates of each department are as follows.
where tve(a) is the tax rate of each department by the energy consumption quantity; tvc(a) is the tax rate of each department by the carbon emission quantity; ET(a) and CT(a)are the energy consumption (t/104 yuan), and carbon emission (t/104 yuan) of each department by per unit value energy; ETAX and CTAX are various ad valorem tax rates (yuan/t) set by this thesis.
tve(a) = ET(a) × ETAX
tvc(a) = CT(a) × CTAX
2.2.6. Parameter Setting and Model Test
Parameter Calibration
Based on the SAM table in the base year (2012), the scale coefficient, share coefficient, added-value tax rate, individual income tax rate, enterprise income tax rate, residents’ consumption propensity, government’s transfer payment to the residents, and government’s transfer payment to the enterprises are estimated.
Determination of Elastic Coefficients
The substitution elasticity data in the model are valued as follows by relatively conservative estimation, which is shown in Table 2.
Model Test
Comparing the present values of the base year (2012) with the simulated values, and the comparison results are shown in Table 3.
Judging from Table 3, the model can basically reproduce the situation in the base year, which proves the reliability of the model for the predictive analysis of energy policies.
3. Simulation Analysis for the Imposition of an Energy Tax (Carbon Tax)
3.1. Setting of Scenarios
This model is only concerned with the imposition of an energy tax and carbon tax in production departments, and the simulated taxation scenarios are displayed in Table 4.
3.2. Simulation Results and Analysis
3.2.1. Effects of the Energy Tax upon Energy Saving and Emission Reduction and Influences upon the Social Economy
An energy tax raises the energy price and impacts the energy usage amount of the production departments, thus achieving the effect of energy saving and emission reduction. Different tax rates have different results, which are shown in Table 5.
As can be seen from Table 5, when the energy tax rate is set at 100 yuan/tce, the energy consumption will reduce by 5.80% and the CO2 emission will reduce by 5.94%. The impact on social and economic performance is that the residents’ consumption decreases by 0.48%, the goods transferred out and in decrease by 1.33% and 1.29%, respectively, imports and exports decrease 0.11% and 0.08%, respectively, enterprise revenue decreases by 0.73%, and government revenue increases by 1.84%. The energy tax revenue is 24 billion yuan, and the reduction cost is 146 yuan/t of CO2.
It also shows that with the increase of tax rates, negative effects will increase, and the reduction cost will increase accordingly. The tax rate should be set on account of the comprehensive effect of the emission reduction target and the social impact.
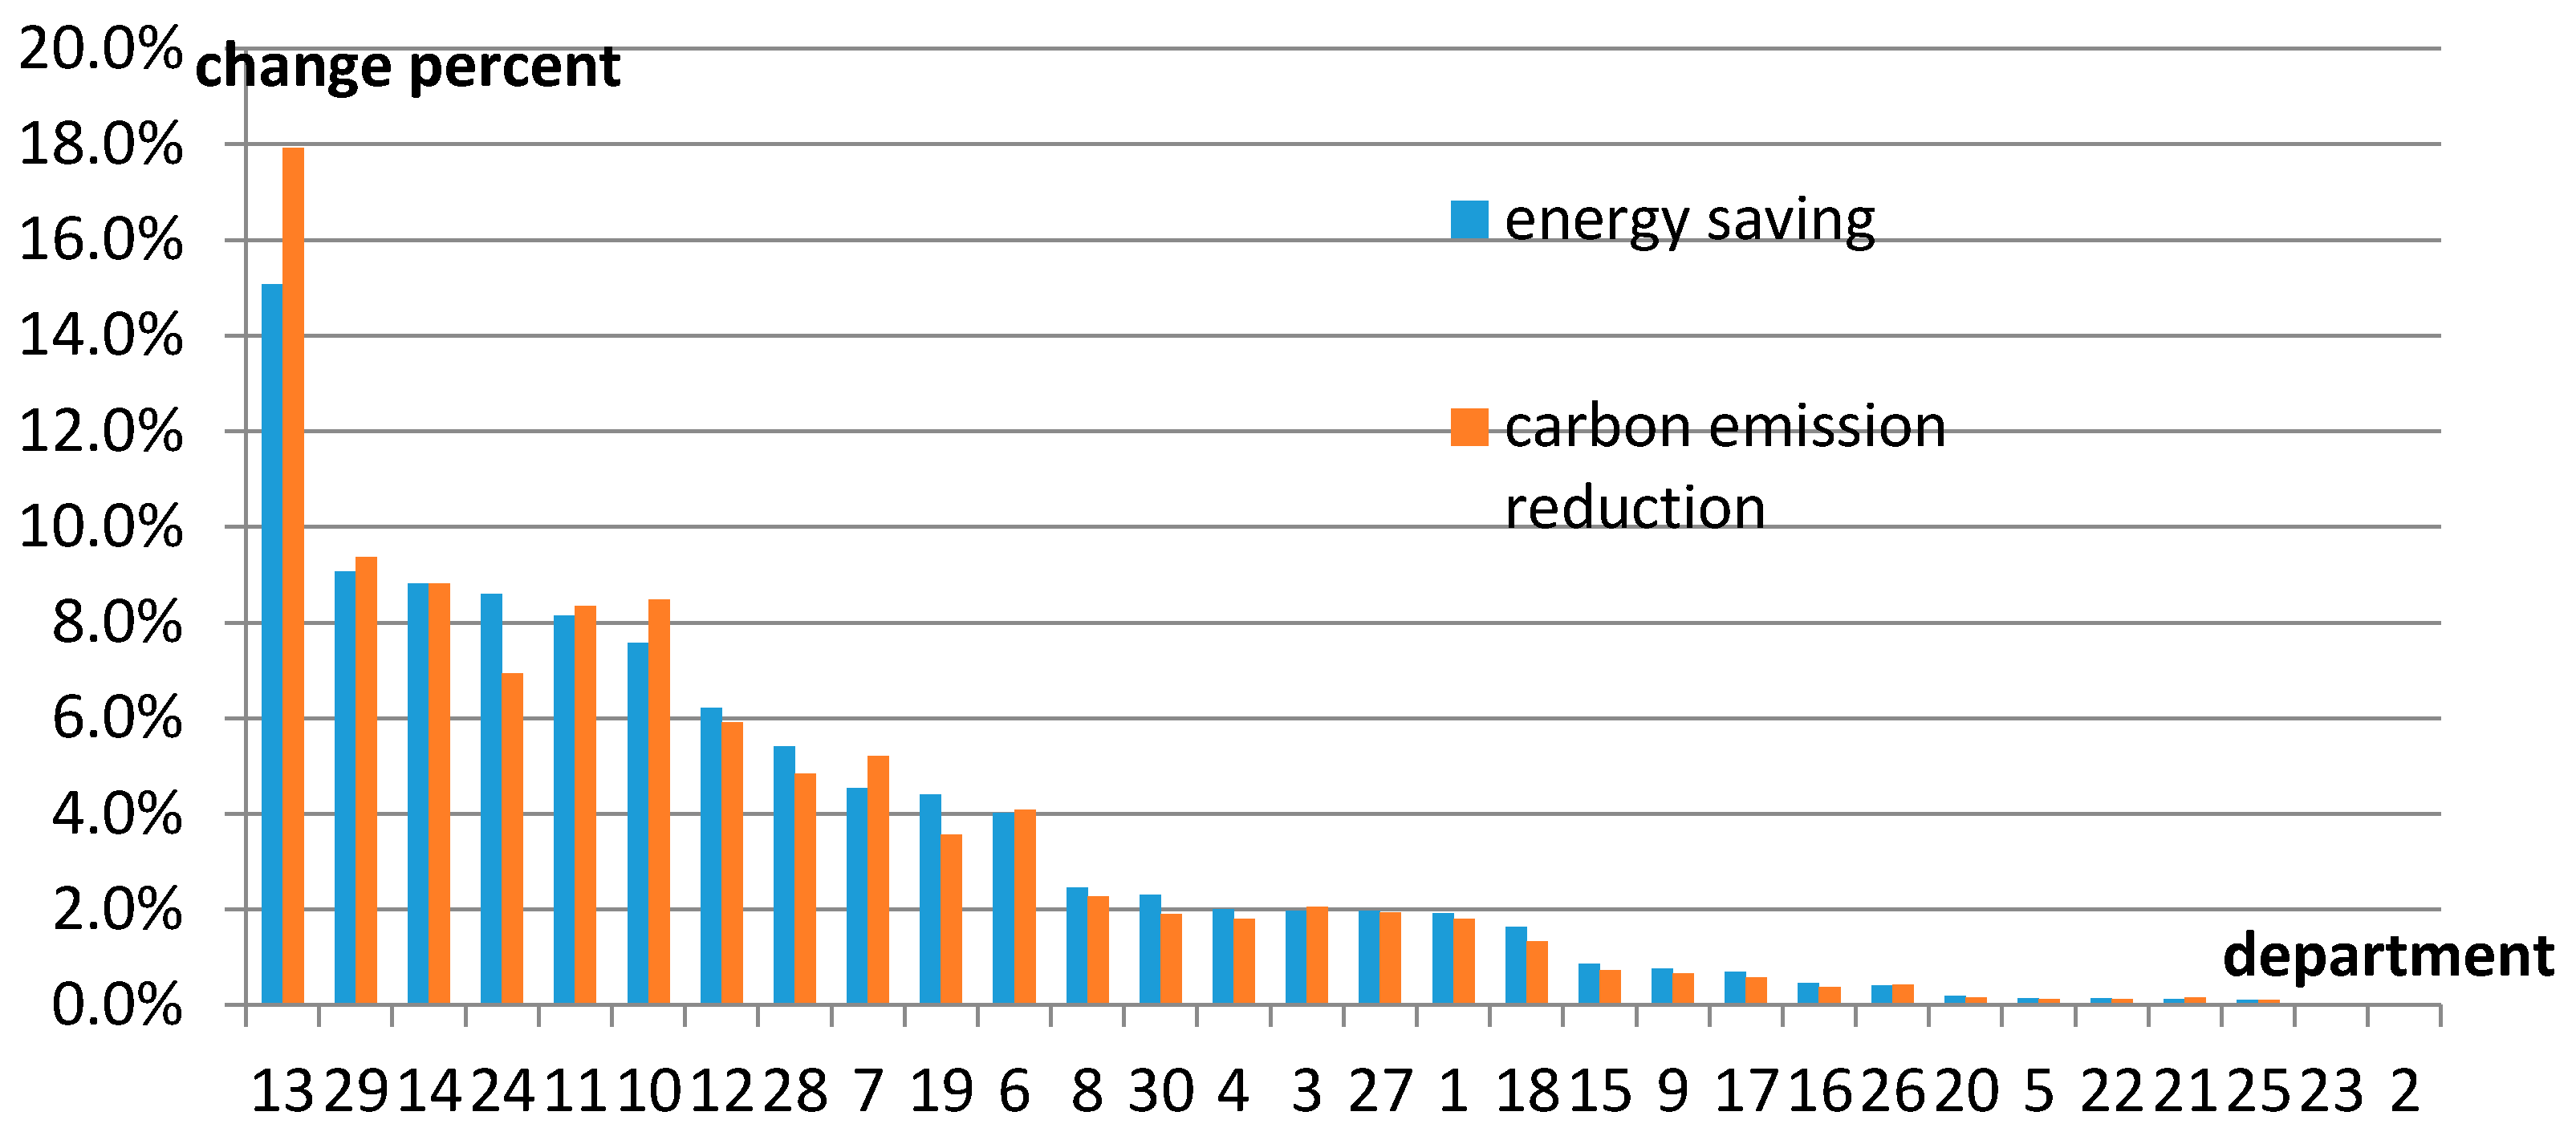
Taking the energy tax of ETAX150 as an example, we illustrate the effect of an energy tax on each department, as shown in Figure 4.
It can be seen from Figure 4 that the top five departments with reduced energy consumption are non-metal mineral products (13), communication and transportation (29), metal smelting (14), power (24), and petroleum coking products (11), with respective energy saving ratios of 15.08%, 9.00%, 8.80%, 8.57%, and 8.13%; the top five departments with reduced CO2 emission are the departments of non-metal mineral products (13), communication and transportation (29), metal smelting (14), papermaking and printing (10), and petroleum coking products (11), with respective emission reduction ratios of 17.92%, 9.29%, 8.80%, 8.53%, and 8.31%.
It is obvious that the departments with large energy consumption are the major potential departments for energy saving and emission reduction.
The impacts on the output, goods transferred out, goods transferred in, export, and import of each department are shown in Table 6.
As Table 6 shows, the departments most affected are metals mining and dressing (4), petroleum coking (11), petroleum exploitation (3), power (24) and papermaking and printing (10), with respective reduced output ratios of 42.3%, 11.7%, 9.9%, 7.3%, and 3.9%, goods transferred out, goods transferred in, export, and import of each department reduce with the same trend as that of the output.
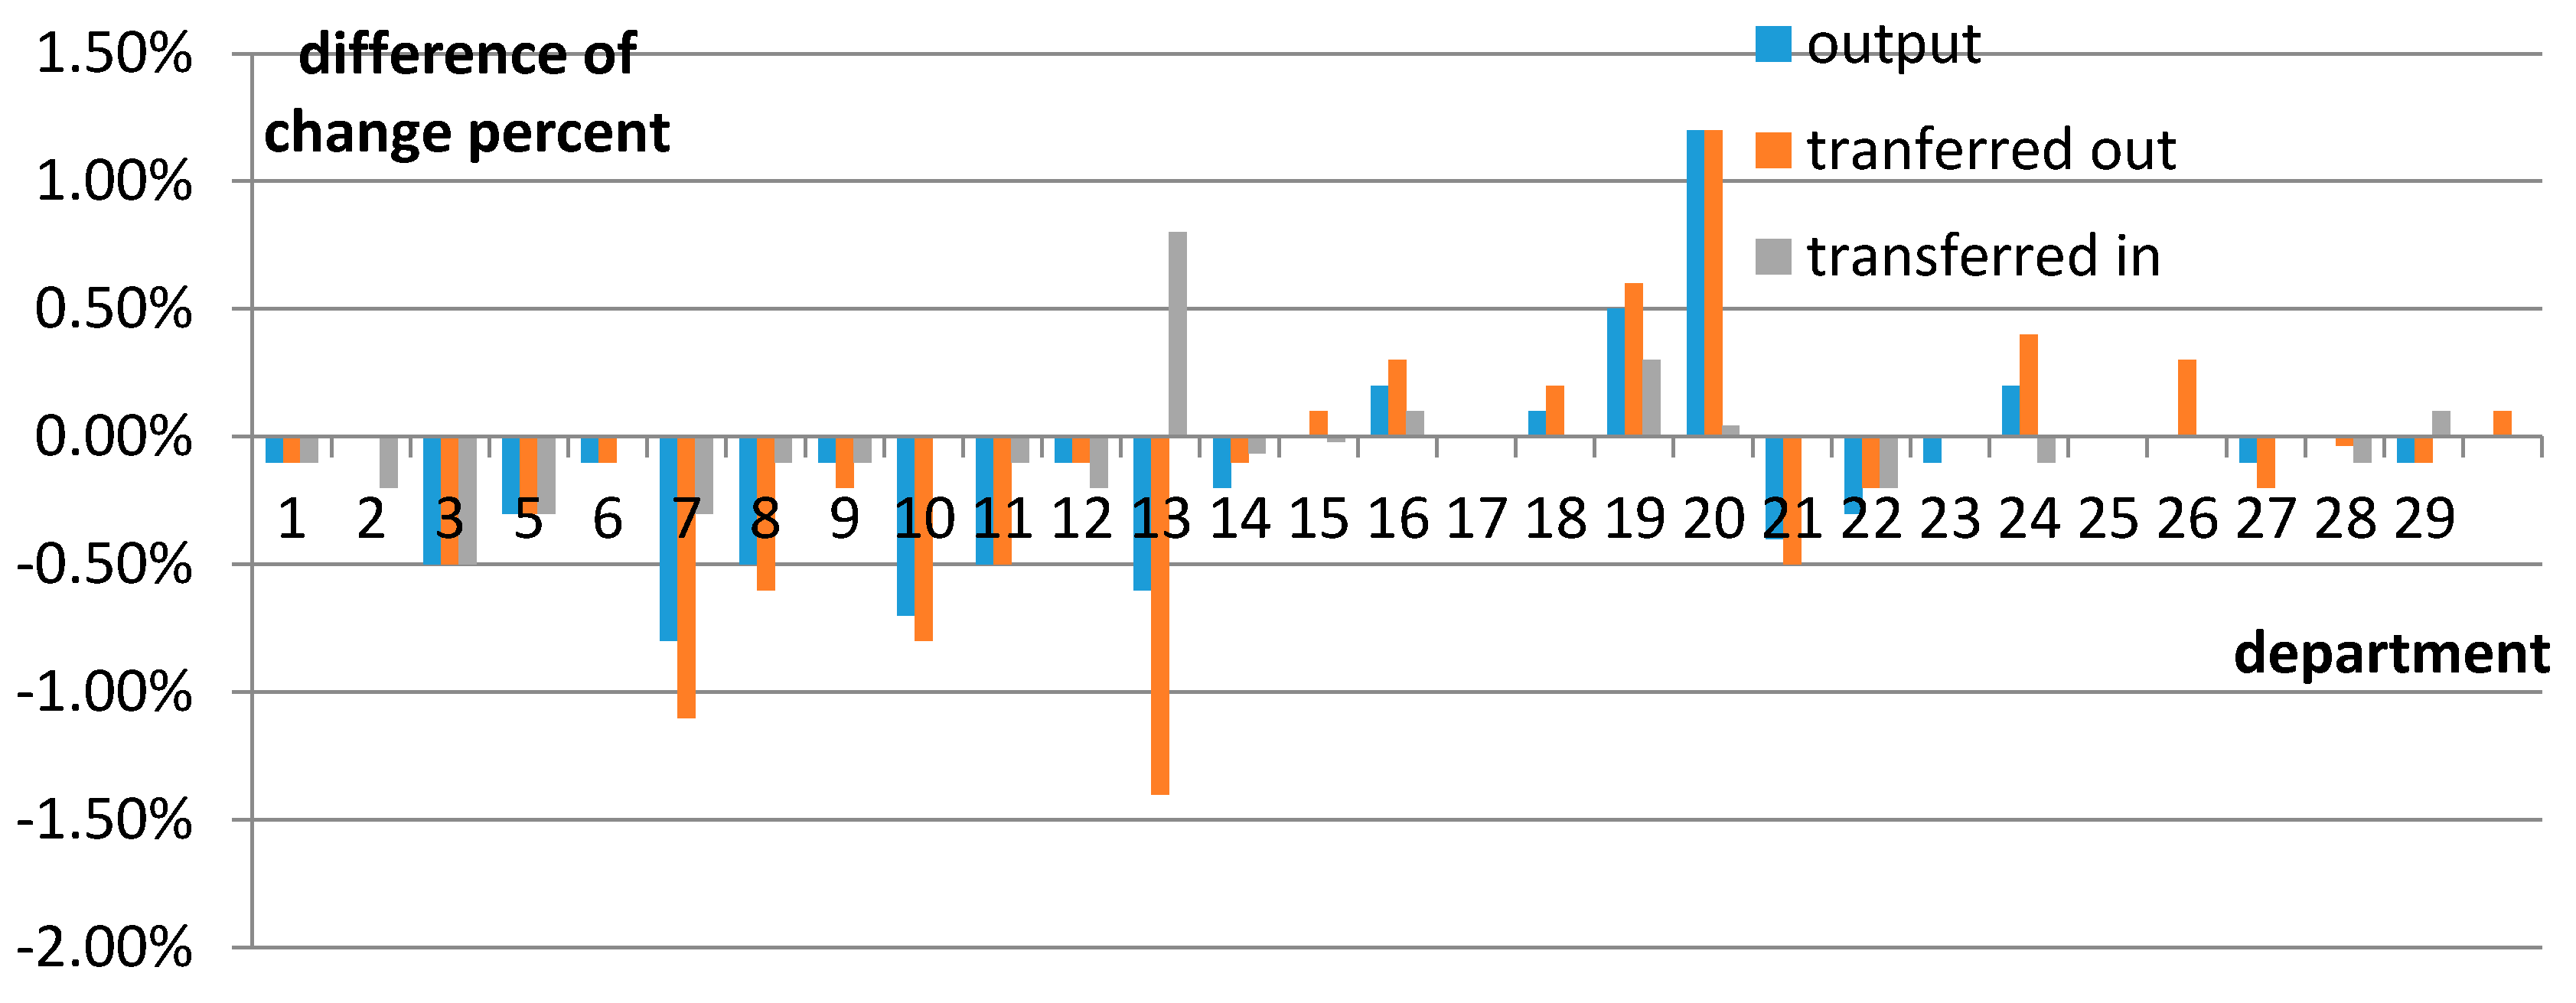
The departments, except the top five, undergo comparatively small influences. The departments of the manufacture of transport equipment (17), manufacture of communication equipment, and computers (19), manufacture of electrical machinery and equipment (16), and manufacture of instruments and meters (20) even show increases in their output and goods transferred out (seen in Figure A1),which indicates the transfer of labor and capital from high-energy intensity departments to low-energy intensity ones, and the change trends of output, goods transferred out, and goods transferred in most departments are the same.
The above results illustrate that, driven by the energy tax, the social economy undergoes a chain of reactions. For departments of high energy consumption, the energy tax improves department prices and thus reduces foreign and domestic demand, finally leading to the reduction of output and trade. For the low energy consumption departments, the changing trend is the opposite: department prices decrease, thus stimulating foreign and domestic demand, with the final result being the increase of output and trade. Among the heavily-influenced departments, most are energy-intensive departments, on consulting the IO-table, we know that some departments are also trade-intensive, like the departments of metals mining and dressing (4), petroleum exploitation (3), papermaking and printing (10), and petroleum coking products (11), whose final demands from other provinces and abroad exceed 90% of the total final demand. We can see that the department of metals mining and dressing (4) is not the most energy-intensive department, but suffers the greatest influence by the imposition of an energy tax because this department relies heavily on goods outside the province and goods overseas, and so is very sensitive to the price change. This kind of department should be paid special attention to and needs to adopt some mitigation measures when the imposition of an energy tax is practiced.
3.2.2. Comparison between a Carbon Tax and an Energy Tax
This thesis selects three various carbon tax rates, respectively, of 100 yuan/t, 75 yuan/t, and 50 yuan/t, which correspondingly equals the energy tax rates, respectively, at 200 yuan/t, 150yuan/t, and 100 yuan/t in the tax level. The influences of each carbon tax on energy saving and the social economy are listed in Table 7.
As Table 7 indicates, when the carbon tax rate is at 50–100 yuan/t, the energy saving ratio reaches 5.95–11.21%, CO2 emission reduction achieves 6.17–11.61%, GDP decreases by 0.08–0.18%, residents’ income decreases by 0.45–0.88%, enterprises’ income decreases by 0.72–1.39%, imports decrease by 0.04–0.07%, and exports decrease by 0.03–0.06%, while government revenue increases by 1.83–3.41% and social emission reduction cost is 141–169 yuan/t CO2. It is obvious that the energy saving and emission reduction effect of a carbon tax surpasses that of an energy tax under equivalent tax revenue, bringing fewer impacts upon social economy, as well.
Taking the carbon tax rate at 75 yuan/t and energy tax rate at 150 yuan/t, for instance, a comparison of the difference in the influence of a carbon tax and energy tax on the output, goods transferred out, and goods transferred in to each department is shown in Table 8.
The values in Table 8 are the difference of the influence caused by a carbon tax and an energy tax. We can see that Department 4 is greatly improved by a carbon tax, though it is still heavily influenced. The differences among other departments are comparatively small, between the range of −1.4% and −1.2%.
We can determine that the carbon tax strengthens the performance of the departments of the manufacture of instruments and meters (20), manufacture of communication equipment (19), manufacture of general-purpose and special-purpose machinery (16), manufacture of electrical machinery and equipment (18) (seen in Figure A2), which are low energy density, but further reduces the economic indices of those with higher energy density, which demonstrates that a carbon tax can further deepen the inter-departmental influences, which is more beneficial for the transfer of social labor and capital towards non-energy intensive industries.
The different influences of a carbon tax and an energy tax stem from the fact that an energy tax is levied by the energy consumption amount and a carbon tax by the carbon emission of the enterprise. For a certain department, the energy mix is comparatively fixed, as is the proportional relation between its energy consumption and carbon emission; however, the energy mix varies from department to department, leading to the different proportional relations between the energy consumption and carbon emission among various departments, as seen in Figure A3. Therefore, the energy tax and the carbon tax represent different tax bases, which will produce different effects to each department. In general, under the same tax revenue, a carbon tax works better in energy conservation and emissions reduction, but shows less influence on the social economy.
3.2.3. Analysis of the Mitigation Measures
Despite the prominent effects of an energy tax and carbon tax on energy saving and emission reduction, the negative influences on social economy cannot be ignored. Therefore, mitigation measures need to be discussed to relieve the negative effects. Several compensation measures are introduced to compare and analyze the effects when the carbon tax rate is set at 75 yuan/t CO2.
Reducing or Remitting the Tax of Energy Departments
The difference of influences of the three mitigation measures are calculated in Table 9.
Judging from Table 9, the exemption of a carbon tax can boost all other economic indices compared with the control value, apart from energy consumption and carbon emission. Specifically speaking, GDP increases by 0.09%, government revenue increases by 0.04%, residents’ income increases by 0.03%, enterprises’ income increases by 0.11%, imports increase by 0.09%, and exports increase by 0.06%. However, the energy consumption and carbon emission increase, respectively, by 0.7% and 0.73% compared with the control values. Meanwhile, the carbon emission reduction cost is reduced to 53 yuan/t from the previous 158 yuan/t. In conclusion, the exemption of a carbon tax for energy departments can be a desirable mitigation measure, and can achieve remarkable outcomes if the department whose tax is to be reduced and the reduced tax rate are properly determined in the implementation process.
The differences of influences on each department are listed in Table 10.
As can be found in Table 10, some of the energy departments, like petroleum exploitation (3) and petroleum coking products (11), are improved under the exemption measure. The output, the amount of petroleum exploitation transferred out, and the amount transferred in (3) are improved by 9.7%, 10.10%, and 9.1%, respectively, and those of petroleum coking products (11) are improved by 10.40%, 11.70%, and 1.10%, respectively. The other two factors, power (24) and gas production (25), are less improved. This is because departments of (3) and (11) are traded departments; more than 90% of the final demands are from the outside, and the tax-free prices can maintain the demand, while the final demands of (24) and (25) are from the province itself and, thus, indirectly influenced by those taxable departments, the tax break will not bring improvements to the two departments.
It is worth noting that (4) suffers a greater impact under tax exemption for energy department; the output, the amount transferred out, and the amount transferred in fell by 36.20%, 36.20%, and 9.50%, respectively. This is because the exemption of energy departments improves the relative price of (4), further reducing the final demand from outside.
For the rest of the departments, we can see that most departments are further reduced by output and goods transferred out, but increased by goods transferred in (as seen in Figure A4).
To summarize, from the point of view of macroeconomic indicators, the tax cuts for energy departments have some relief. Energy sectors are directly benefited, but in the complexity of the supply and demand relations of the social economy, different energy departments also have different effects. For most of the non-energy sector, the overall effect is negative, but the impact is not large. For the trade departments which are sensitive to price, they need to be paid special attention with respect to the significant influence caused by the fluctuations of the prices. Thus, when implementing tax cuts on the departments that are greatly influenced by the energy tax, the tax exemption sectors and the reduction rate should be carefully decided in order to obtain an ideal effect.
Subsidizing the Residents
As can be seen from Table 9, subsidizing the residents with the tax revenue can enhance residents’ income, but simultaneously raise the commodity price, thus decreasing the departments’ output. It can further lower the energy consumption and CO2 emission amount, but the actual GDP is 0.02% lower than the control value, government revenue is 4% lower, imports and exports are 0.21% and 0.17% lower, while the residents’ income and enterprises’ income are 1.47% and 0.13% higher, and the carbon reduction cost increases from 158 yuan/t to 182 yuan/t. Therefore, subsidizing the residents needs to be replaced by a more direct compensation plan.
The differences between the influences of CTAXM2 and CTAX75 on each department are listed in Table 11.
This shows that subsidies to residents aggravate the impact on department metal mining (4); the output, amount transferred out, and amount transferred in are respectively, decreased by 49.60%, 49.70%, and 13.40%. Subsidies for residents cause the commodity price to rise further, so as to make the demand decline further.
Impacts on other departments are generally smaller, but with different influences on different departments (as seen in Figure A5). Output, amount transferred out, and amount transferred in of the departments of farming (1), manufacture of food (6), textiles (7), manufacture of clothes (8), metal products (15), and gas production (25) are increased, while the output and transferred out of other departments are falling, with the departments of manufacture of machinery (16), manufacture of transport equipment (17), and manufacture of communication equipment (19) are the most greatly influenced. The amount transferred in to almost all of the departments is improved.
So, although the compensation measures of subsidizing the residents may increase the demand for some commodities, it also raises commodity prices and, thus, curbs demand for most of the departments, with the overall result being that the social output decreases and there is greater dependence on goods outside the province. Thus, the mitigation effect of this measure is questionable.
Subsidizing the Enterprises
Subsidizing the enterprises with the tax revenue fails to bring tangible effects upon the social production, imposing no variations on GDP, residents’ income, import and export, energy consumption, and carbon emission. The tax revenue is simply transferred between government revenue and enterprises’ income. While the government revenue declines by 4.06%, enterprises’ income increases by 2.42%. Consequently, no virtual mitigation effect has been exhibited by this measure.
3.2.4. Sensitivity Analysis
When the carbon tax rate is at 75 yuan/t CO2, a sensitivity analysis is conducted on each elastic coefficient in which each substitution coefficient is increased or decreased by 50%, and their influences on GDP and carbon emission can be seen in Table 12.
Judging from Table 12, GDP is not sensitive to all of the elastic coefficients, while carbon emission only displays slight sensitivity towards certain parameters, such as rh0QDC and rh0QDA, which proves the steadiness of the simulated results of the model.
Table 12 also shows that the higher the substitution coefficient is valued, the larger the carbon emission reduction gets, while the CET elastic coefficient proves otherwise. Moreover, the elastic coefficients selected in this thesis are comparatively small, so the results tend to be conservative.
4. Conclusions and Suggestions
On the basis of the energy SAM matrix of Guangdong Province in 2012, by establishing the energy CGE model for Guangdong Province, this thesis simulates and analyzes the energy saving and emission reduction effects and social economic impacts imposed by the imposition of an energy tax or carbon tax. The major conclusions and suggestions are as follows.
- The taxation of the energy tax or carbon tax can achieve a preferable energy saving and emission reduction effect. When the energy tax rate is at 100–200 yuan/tce or carbon tax at 50–100 yuan/t CO2, the energy consumption of Guangdong Province reduces by 5.8–11.21%, and carbon emissions by 5.94–11.61%. Nonmetallic mineral products, communications and transportation, electric power, petroleum coking, and papermaking and printing are the major potential departments for energy saving and emission reduction. Since the implementation of energy saving and emission reduction will incur a series of adverse impacts upon the social economy, and the increase of the tax rate will aggravate the adverse impacts along with an increase of emission reduction costs, it is of great significance to setup appropriate tax rates on the basis of comprehensive impact factors.
- A carbon tax can produce better effects on energy savings and emission reduction than that of the energy tax under the equivalent tax revenue, and pose fewer influences on the social economy than the latter. Therefore, a carbon tax can be conducive to the transfer of social capital towards the non-energy-intensive industries.
- To relieve the negative impacts caused by an energy tax or carbon tax, some supporting mitigation measures or compensation measures can be taken into consideration, such as appropriately reducing the energy tax or carbon tax of those departments which consume energy in a large amount. As a matter of fact, Guangdong Province has enlisted the departments with large energy consumption into its carbon emission permission management system and constructed carbon emission trading pilots. If the price of carbon emission permits equals that of the carbon tax, it can achieve the same energy saving and emission reduction effects, but with fewer social emission reduction costs than the latter. If the tax revenue is returned to the residents, their income can be increased in the short term, but GDP, government revenue, transferred amount, imports, and exports will all be decreased while the carbon emission costs will be aggravated, which proves to be ineffective. If the tax revenue is returned to the enterprises, no virtual improvement will be brought about to the social production, resulting only in the revenue transfer between government revenue and the enterprises’ income.
- The sensitivity analysis indicates that GDP shows no sensitivity towards each elastic coefficient, and the carbon emission amount shows slight sensitivity towards certain parameters, showing that the higher the substitution coefficient is valued, the larger the carbon emission amount becomes. Since the values of the elastic coefficients are relatively small, the predicted results also tend to be conservative. With the social economic development, the elastic coefficients will increase to a certain extent, and the energy saving and emission reduction effect will be better when the energy tax or carbon tax is levied, facilitating the transfer of social capital towards low-energy and low-carbon departments.
- When considering the combination of total energy, this model adopts a fixed proportion method by energy, unable to simulate the substitution effect among different types of energy and failing to subdivide the values of elastic coefficients into each department, which may lead to a slightly rough prediction. Therefore, further in-depth studies can be carried out in these regards for the sake of a more accurate prediction.
Acknowledgments
The authors would like to thank the Administration of Ocean and Fisheries of Guangdong Province for its funding for this research. The projects numbers are “yuehaiyuhan (2013)855”, “2013380007300189”. The authors would also like to thank the reviewers for their valuable comments.
Author Contributions
Wei Chen, Jin-Feng Zhou, Shi-Yu Li, and Yao-Chu Li conceived and designed the methodologies; Wei Chen collected and analyzed the data; Jin-Feng Zhou wrote the program code; and Wei Chen wrote the paper.
Conflicts of Interest
The authors declare no conflict of interest. The founding sponsors had no role in the design of the study; in the collection, analyses, or interpretation of data; in the writing of the manuscript; or in the decision to publish the results.
Appendix A

Table A1.
Departments and the codes.
| Department | Order in This Paper | Order in IO Table |
|---|---|---|
| Farming, Forestry, Animal Husbandry, and Fisheries | 1 | 01 |
| Mining and Washing of Coal | 2 | 02 |
| Extraction of Petroleum and Natural Gas | 3 | 03 |
| Mining and Dressing of Metal Ores | 4 | 04 |
| Mining and Dressing of Nonmetal Ores | 5 | 05 |
| Manufacture of Food and Tobacco | 6 | 06 |
| Textile Industry | 7 | 07 |
| Manufacture of Textile Garments, Footwear and Leather, Fur, and Feather Goods | 8 | 08 |
| Manufacture of Furniture, Timber Processing, Bamboo, Cane, Palm Fiber Goods | 9 | 09 |
| Papermaking, Printing and Manufacture of Cultural, Educational and Sports Goods | 10 | 10 |
| Petroleum Refining, Coking, and Nuclear Fuel | 11 | 11 |
| Manufacture of Chemical Products | 12 | 12 |
| Nonmetal Mineral Products | 13 | 13 |
| Smelting and Pressing of Metals | 14 | 14 |
| Metal Products | 15 | 15 |
| Manufacture of General-purpose and Special-purpose Machinery | 16 | 16, 17 |
| Manufacture of Transport Equipment | 17 | 18 |
| Manufacture of Electrical Machinery and Equipment | 18 | 19 |
| Manufacture of Communication Equipment, Computers, and Other Electronic Equipment | 19 | 20 |
| Manufacture of Instruments and Meters | 20 | 21 |
| Handicraft and Other Manufactures | 21 | 22 |
| Recycling and Disposal of Waste | 22 | 23 |
| Manufacture of Metal Products, Machinery, and Equipment Maintenance | 23 | 24 |
| Production and Supply of Electric Power and Heat Power | 24 | 25 |
| Production and Supply of Gas | 25 | 26 |
| Production and Supply of Water | 26 | 27 |
| Construction | 27 | 28 |
| Transport, Storage and Post | 28 | 29, 30 |
| Wholesale, Retail Trade and Hotel, Restaurants | 29 | 31 |
Table A2.
Classification of the main types of energy.
| Main Types | Detailed Types |
|---|---|
| Coal | Cleaned coal, other washed coal, briquette, gangue, coke, coke oven gas, blast furnace gas, converter gas and other gas |
| Petroleum | Bitumen asphalt, petroleum coke, LPG, refinery gas, other petroleum products |
| Natural gas | Natural gas, LNG |
| Power, heat and others | Heat, electricity, other energy |
Table A3.
The structure of energy IO table.
| Output | Intermediate Demand | Final Demand | Total Product | ||||||
|---|---|---|---|---|---|---|---|---|---|
| Input | 1 | 2 | ... | n | Consumption | Investment | Net Out-Port | ||
| Intermediate input | 1 | ||||||||
| 2 | |||||||||
| ... | |||||||||
| n | Zij | fi | Xi | ||||||
| Primary input | labor | ||||||||
| Fix assets depreciation | |||||||||
| Net production tax | Vj | ||||||||
| Retained earnings | |||||||||
| Energy | Nkj | ||||||||
| Total input | Xj | ||||||||
Where Zij indicates direct consumption of product i by sector j; fi indicates final demand of product i; Vj indicates added value of sector j; Xi indicates production of sector j; Nij indicates quantity of energy k consumed by sector.
Table A4.
The structure of energy SAM.
| Sector | Commodity | Elements | Enterprise | Resident | EnergyTax | Government | Save-Investment | Province | Abroad | Total | |||||
|---|---|---|---|---|---|---|---|---|---|---|---|---|---|---|---|
| Labor | Capital | Depreciation | |||||||||||||
| 1 | 2 | 3 | 4 | 5 | 6 | 7 | 8 | 9 | 10 | 11 | 12 | 12 | |||
| Sector | 1 | QDAL | tec | QDAP | QE | QA | |||||||||
| Commodity | 2 | QINTA | QH | GH | QINV | ||||||||||
| Element | Labor | 3 | QLD | QLD0 | |||||||||||
| Capital | 4 | QKD | QKD0 | ||||||||||||
| Depreciation | 5 | ||||||||||||||
| Enterprise | 6 | shifentk | transfrentg | YENT | |||||||||||
| Resident | 7 | QLD | transfrhg | YH | |||||||||||
| Energy tax | 8 | ETAX | |||||||||||||
| Government | 9 | TVA | tmc | tiENT | tih | ETAX | YG | ||||||||
| Save-investment | 10 | DEPR | ENTSAV | HSAV | GSAV | QINV0 | |||||||||
| Province | 11 | QDCP | QDCP | ||||||||||||
| Abroad | 12 | QM | QM | ||||||||||||
| Total | 13 | QA | QLD0 | QKD0 | DEPR0 | YENT | EH | EG | QINV0 | QDAP | QM | ||||
For the meanings of all of the symbols in the grid, refer to Appendix B.
Figure A1.
Economical influences by department under ETAX150.
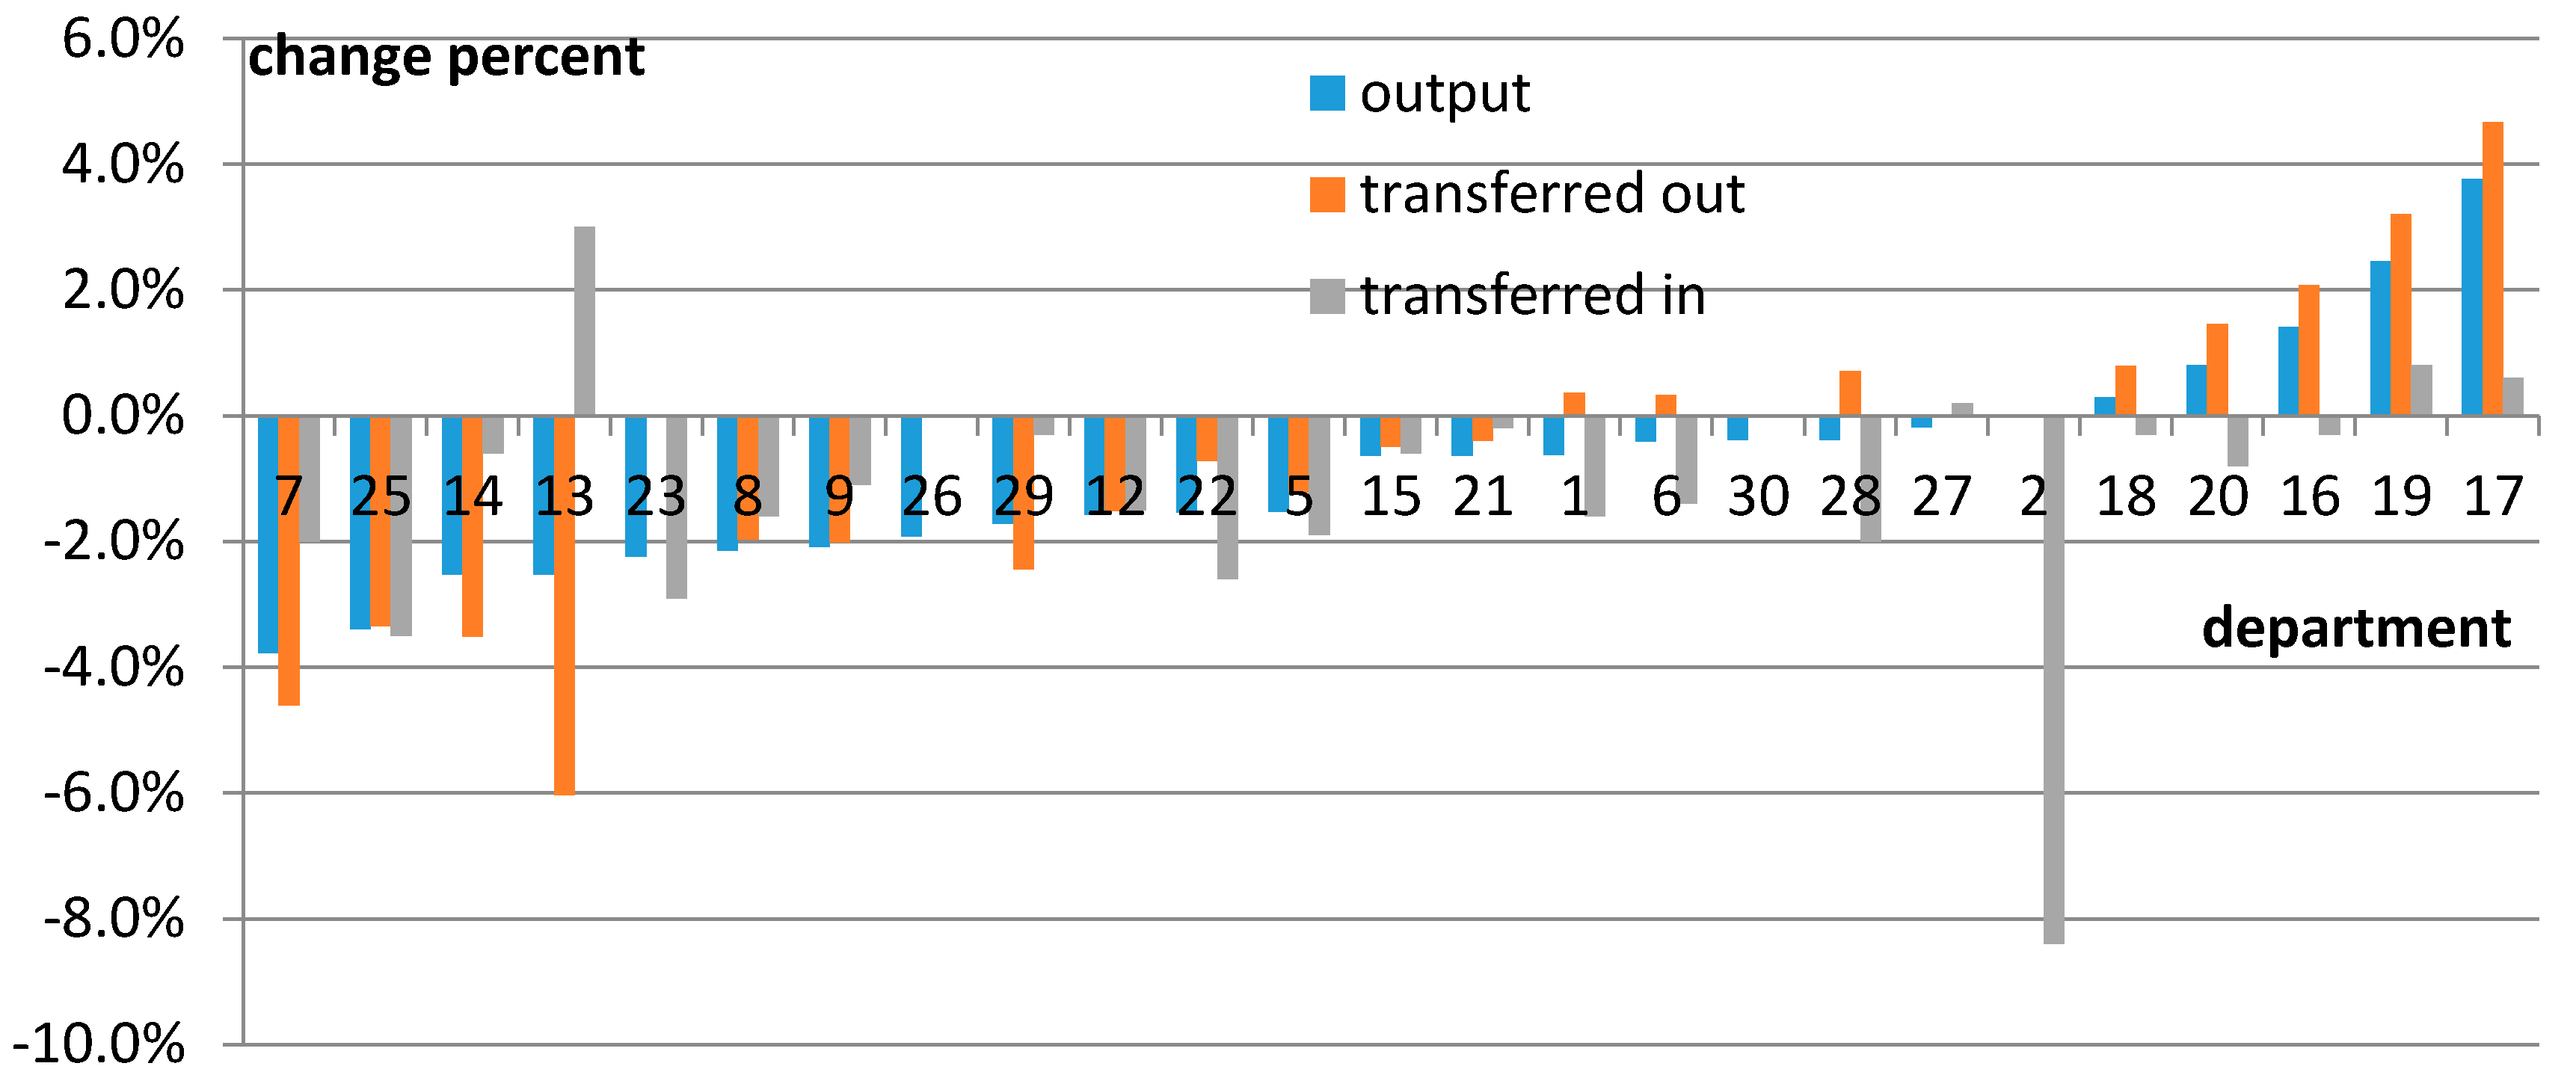
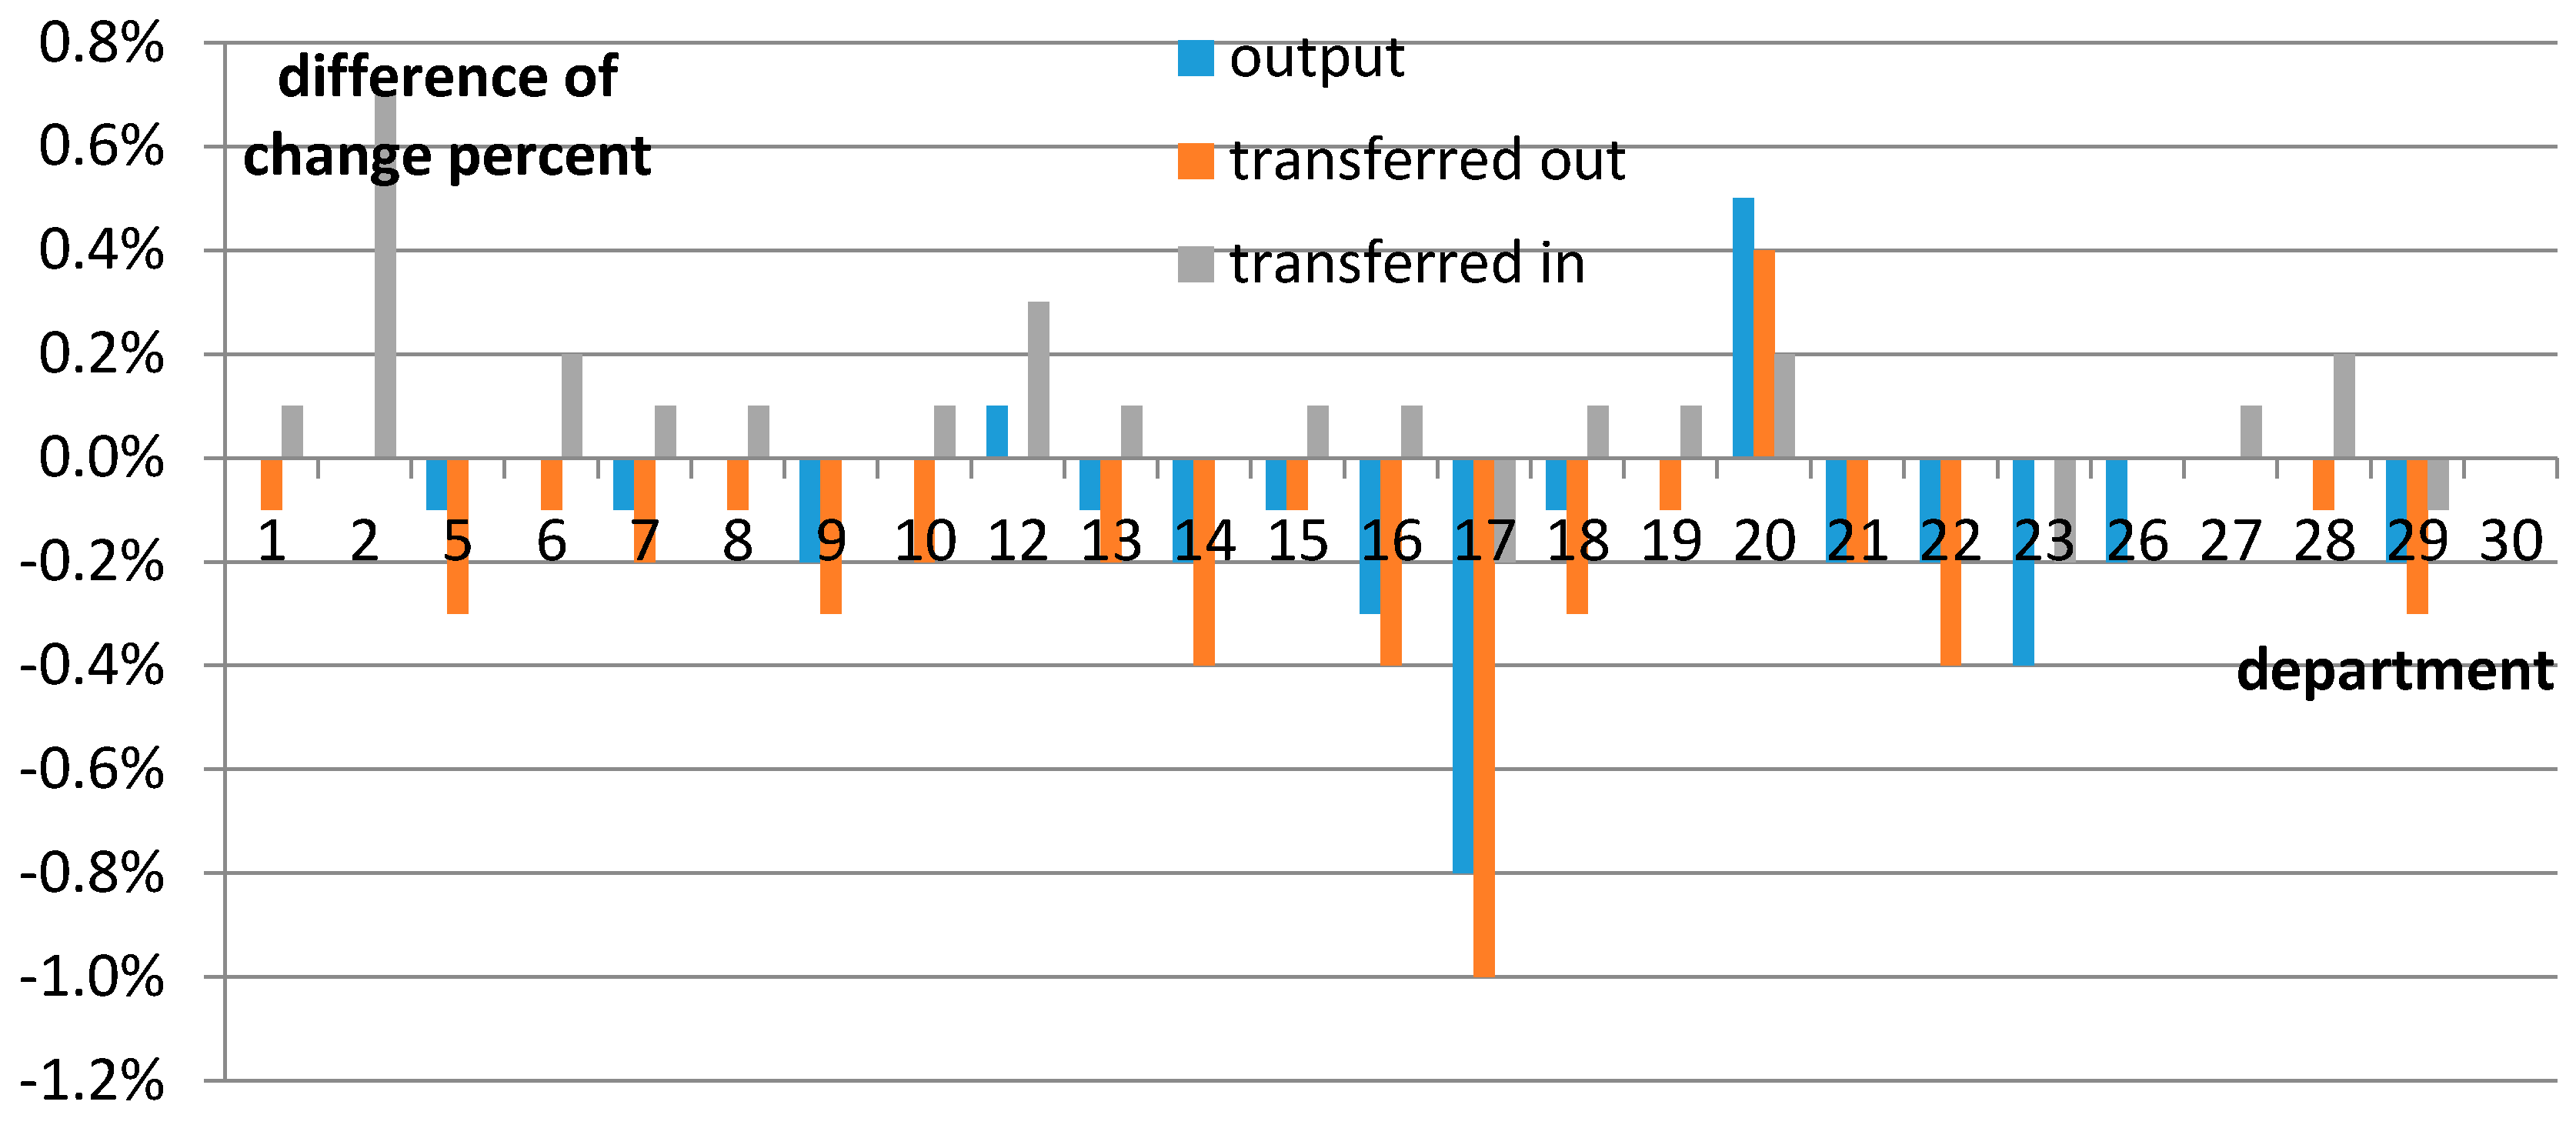
Figure A2.
The differences of influences by department between CTAX75 and ETAX150.

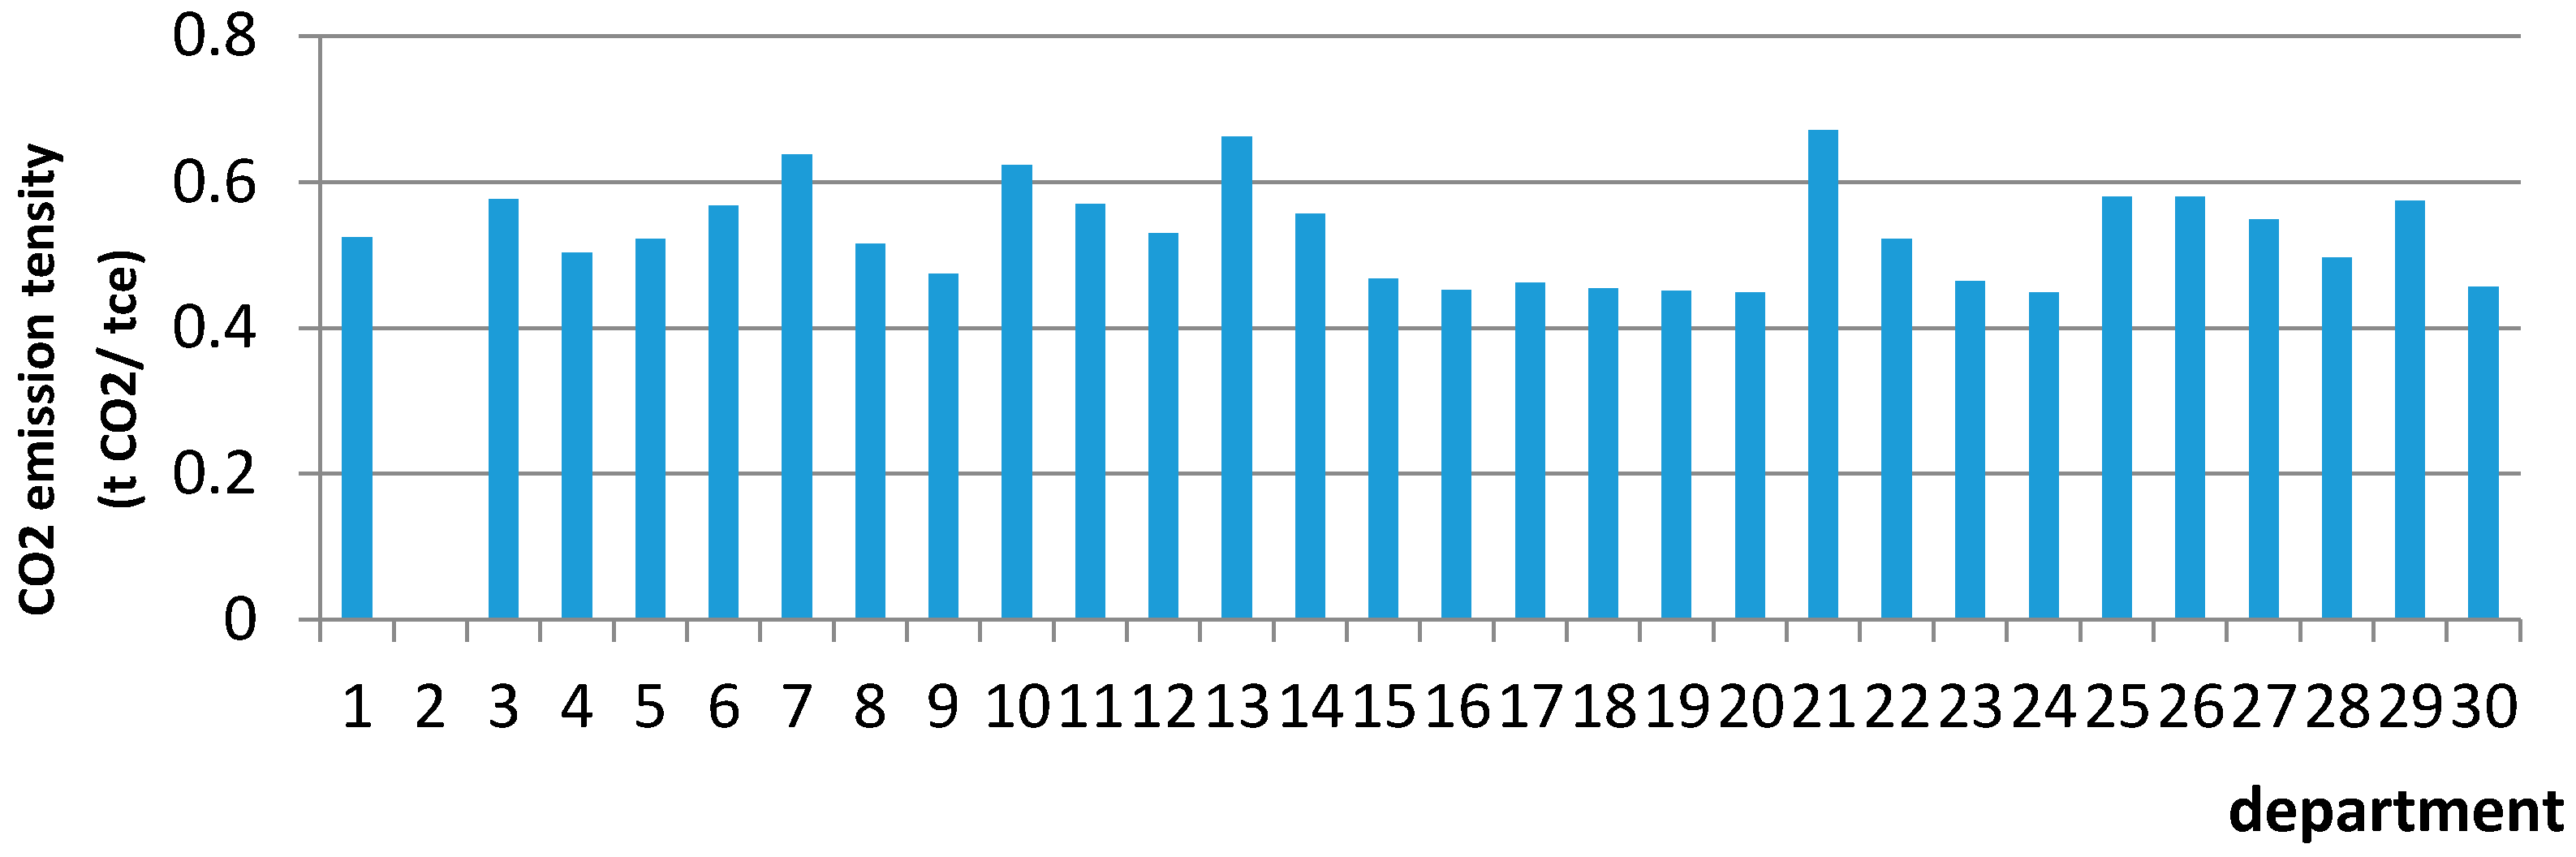
Figure A3.
Carbon emission of per unit energy consumption by each department.

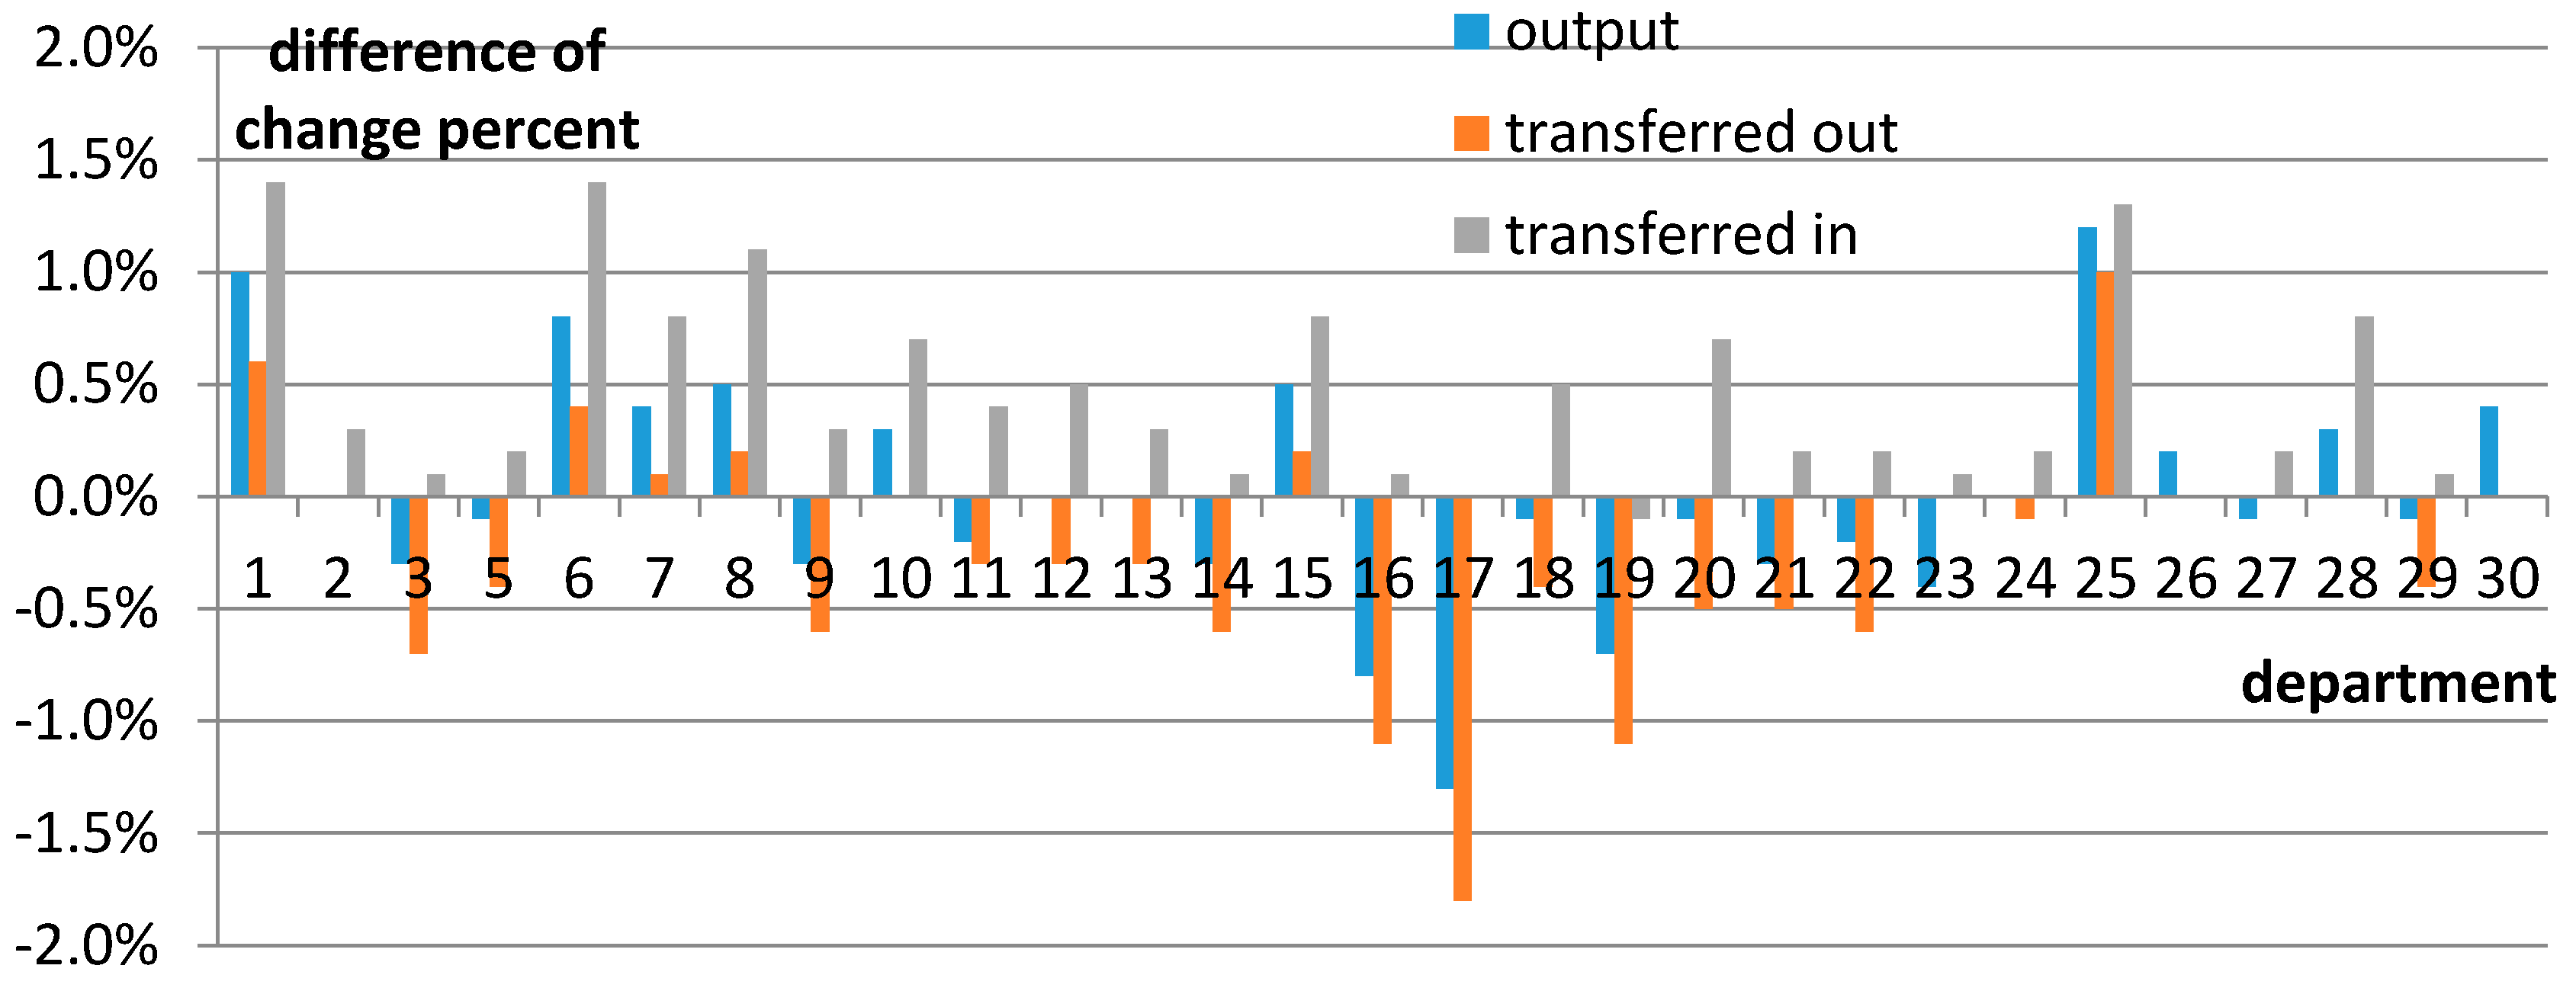
Figure A4.
The differences of influences made by CTAXM1 and CTAX75.

Figure A5.
The differences of influences made by CTAXM2 and CTAX75.

Appendix B. Equations
QA(a) = scaleAa(a) × (deltaAa(a) × QEVA(a)**rh0Aa(a) + (1 − deltaAa(a)) × QINTA(a)**rh0Aa(a))**(1/rh0Aa(a))
PEVA(a)/PINTA(a) = (deltaAa(a)/(1 − deltaAa(a))) × (QINTA(a)/QEVA(a))**(1 − rh0Aa(a))
PA(a) × QA(a) = PEVA(a) × QEVA(a) + PINTA(a) × QINTA(a)
QEVA(a) = scaleEVA(a) × (deltaEVA(a) × QVA(a)**rh0EVA(a) + (1 − deltaEVA(a)) × QED(a)**rh0EVA(a))**(1/rh0EVA(a))
PVA(a)/((1 + tvc(a)) × WE) = (deltaEVA(a)/(1 − deltaEVA(a))) × (QED(a)/QVA(a))**(1 − rh0EVA(a))
PEVA(a) × QEVA(a) = PVA(a) × QVA(a) + ((1 + tvc(a)) × WE) × QED(a)
QVA(a) = scaleVA(a) × (deltaVA(a) × QLD(a)**rh0VA(a) + (1 − deltaVA(a)) × QKD(a)**rh0VA(a))**(1/rh0VA(a))
WL/WK = (deltaVA(a)/(1 − deltaVA(a))) × (QKD(a)/QLD(a))**(1 − rh0VA(a))
PVA(a) × QVA(a) = WL × QLD(a) + WK × QKD(a) + tva(a) × PVA(a) × QVA(a)
QINT(c1, a) = ic1a(c1, a) × QINTA(a)
PINTA(a) = sum(c1, ic1a(c1, a) × PQ(c1))
QINT(c2, a) = ic2a(c2, a) × QED(a)
QA(a) = scaleCET(a) × (deltaCET(a) × QDA(a)**rh0CET(a) + (1 − deltaCET(a)) × QE(a)**rh0CET(a))**(1/rh0CET(a))
PDA(a)/PE(a) = (deltaCET(a)/(1 − deltaCET(a))) × (QE(a)/QDA(a))**(1 − rh0CET(a))
PA(a) × QA(a) = PDA(a) × QDA(a) + PE(a) × QE(a)
QDA(a) = scaleQDA(a) × (deltaQDA(a) × QDAL(a)**rh0QDA(a) + (1 − deltaQDA(a)) × QDAP(a)**rh0QDA(a))**(1/rh0QDA(a))
PDAL(a)/PDAP(a) = (deltaQDA(a)/(1 − deltaQDA(a))) × (QDAP(a)/QDAL(a))**(1 − rh0QDA(a))
PDA(a) × QDA(a) = PDAL(a) × QDAL(a) + PDAP(a) × QDAP(a)
QQ(c) = scaleQq(c) × (deltaQq(c) × QDC(c)**rh0Qq(c) + (1 − deltaQq(c)) × QM(c)**rh0Qq(c))**(1/rh0Qq(c))
PDC(c)/PM(c) = (deltaQq(c)/(1 − deltaQq(c))) × (QM(c)/QDC(c))**(1 − rh0Qq(c))
PQ(c) × QQ(c) = PDC(c) × QDC(c) + PM(c) × QM(c)
QDC(c) = scaleQDC(c) × (deltaQDC(c) × QDCL(c)**rh0QDC(c) + (1 − deltaQDC(c)) × QDCP(c)**rh0QDC(c))**(1/rh0QDC(c))
PDCL(c)/PDCP(c) = (deltaQDC(c)/(1 − deltaQDC(c))) × (QDCP(c)/QDCL(c))**(1 − rh0QDC(c))
PDC(c) × QDC(c) = PDCL(c) × QDCL(c) + PDCP(c) × QDCP(c)
YH = WL × QLS + shifhk × WK × QKS + transfrhg0
PQ(c) × QH(c) = PQ(c) × shrh(c) × mpc × (1 − tih) × YH
YENT = shifentk × WK × QKS + transfrentg0
ENTSAV = (1 − tiENT) × YENT
YG = sum(a, tva(a) × QVA(a) × PVA(a)) + tih × YH + tiENT × YENT + sum(c, tm(c) × pwm(c) × QM(c) × EXR) + sum(a, tvc(a) × QED(a) × WE)
EG = sum(c, PQ(c) × QG(c)) + transfrhg + transfrentg + sum(a, te(a) × pwe(a) × QE(a) × EXR)
QQ(c) = sum(a, QINT(c, a)) + QH(c) + QINV0(c) + QG(c)
sum(a, QLD(a)) = QLS
sum(a, QKD(a)) = QKS
sum(a, QED(a)) = QES
GSAV = YG − EG
sum(c, PDCP(c) × QDCP(c)) = sum(a, PDAP(a) × QDAP(a)) + PSAV
sum(c, pwm(c) × QM(c)) = sum(a, pwe(a) × QE(a)) + FSAV
FSAV = FSAV0
QLS.fx = QLS0
QKS.fx = QKS0
WE.FX = 1
Parameters and Variables
| Symbol | Description |
| a | Activity department |
| c | Commercial department |
| c1 | No-energy commercial department |
| c2 | energy commercial department |
| deltaAa(a) | Share parameter of CES function of QA |
| deltaEVA(a) | Share parameter of CES function of QEVA |
| deltaVA(a) | Share parameter of CES function of QVA |
| deltaCET(a) | Share parameter of CET function of QA |
| deltaQDA(a) | Share parameter of CET function of QDA |
| deltaQq(c) | Share parameter of Armington function of QQ |
| deltaQDC(c) | Share parameter of Armington function of QDC |
| EG | Government expend |
| EH | Habitant expend |
| EINV | investment |
| ENTSAV | Enterprise saving |
| EXR | Exchange rate |
| FSAV | Foreign saving |
| GDP | Real gross domestic product |
| GSAV | Government saving |
| ic1a(c1, a) | Consumption coefficient of non-energy product |
| ic2a(c1, a) | Consumption coefficient of energy product |
| mpc | Marginal propensity to consume |
| PA(a) | Price of product a |
| PDA(a) | Price of domestic product for domestic use |
| PDAL(a) | Price of provincial product for use in the province |
| PDAP(a) | Price of provincial product for use out of the province |
| PDC(c) | Price of domestic commodity for domestic use |
| PDCL(c) | Price of provincial commodity for use in the province |
| PDCP(c) | Price of provincial commodity for use out of the province |
| PE(a) | Price of domestic product for export |
| PM(c) | Price of import commodity |
| PGDP | Price index of GDP |
| PINTA(a) | Price of intermediate input |
| PQ(c) | Price of domestic commodity |
| PVA(a) | Price of the added value |
| PEVA | Price of the bundle of energy and added value |
| pwe(a) | World price of product for out-port |
| pwm(c) | World price of commodity for in-port |
| QA(a) | Quantity of product a |
| QE(a) | Quantity of product a for export |
| QED(a) | Demand of fixed energy |
| QES | Total supply of energy |
| QG(c) | Demand of government for commodity c |
| QH(c) | Demand of habitant for commodity c |
| QINT(c, a) | Department quantity of intermediate input |
| QINTA(a) | Total quantity of intermediate input |
| QINV(c) | Final demand of investment for commodity c |
| Symbol | Description |
| QDA(a) | Quantity of domestic product used in the country |
| QDAL(a) | Quantity of provincial product used in the province |
| QDAP(a) | Quantity of provincial product used out of the province |
| QDC(c) | Quantity of domestic commodity used in the country |
| QDCL(c) | Quantity of provincial commodity used in the province |
| QDCP(c) | Price of provincial commodity used out of the province |
| QKD(a) | Demand for capital |
| QKS | Supply of capital |
| QLD(a) | Demand for labor |
| QLS | Supply of labor |
| QM(c) | Quantity of import |
| QQ(c) | Quantity of commodity in domestic market |
| QVA(a) | Quantity of added value |
| QEVA | Quantity of the bundle of energy and added-value |
| rhoAa(a) | Power parameter of CES function of QA |
| rhoEVA(a) | Power parameter of CES function of QEVA |
| rhoVA(a) | Power parameter of CES function of QVA |
| rhoQq(c) | Power parameter of Armington function of QQ |
| rhoQDC(c) | Power parameter of Armington function of QDC |
| rhoCET(c) | Power parameter of CET function of QA |
| rhoQDC(c) | Power parameter of CET function of QDA |
| scaleAa(a) | scale parameter of CES function of QA |
| scaleEVA(a) | scale parameter of CES function of QEVA |
| scaleVA(a) | scale parameter of CES function of VA |
| scaleCET(c) | scale parameter of CET function of QA |
| scaleQDA(c) | scale parameter of CET function of QDA |
| scaleQq(c) | scale parameter of Armington function of QQ |
| scaleQDC(c) | scale parameter of Armington function of QDC |
| shifentk | Share of capital revenue to enterprise |
| shifhk | Share of capital revenue to habitant |
| shrh(c) | Expanding share of habitant revenue to commodity c |
| te(c) | Export subsidy rate |
| tiEnt | Income tax of enterprise |
| tih | Income tax of habitant |
| tm(c) | Tariff of commodity c |
| transfrentg | Transferred revenue from government to enterprise |
| transfrhg | Transferred revenue from government to habitant |
| tva(a) | Indirect tax for department a |
| tvc(a) | Energy tax for department a |
| VBIS | Dummy variable for saving-investment check |
| WE | Price of fixed energy |
| WK | Price of capital |
| WL | Price of labor |
| YENT | Enterprise revenue |
| YG | Government revenue |
| YH | Habitant revenue |
References
- Legislative Affairs Office of the State Council. Notice on Soliciting Public Opinions about Environmental Protection Tax Law of the People’s Republic of China (Exposure Draft). Available online: http://www.gov.cn/xinwen/2015-06/11/content_2877863.htm (accessed on 12 February 2017). (In Chinese)
- General Office of the State Council of the People’s Republic of China. Instruction about Further Promoting Paid Use and Trading Pilots of Emission Permit. Available online: http://www.gdep.gov.cn/zwxx_1/zfgw/shbtwj/201404/t20140415_169011.html (accessed on 12 February 2017). (In Chinese)
- People’s Government of Guangdong Province. Regulations on the Paid Use of Emission Permits and Trading Pilots in Guangdong Province. Available online: http://www.gov.cn/zhengce/content/2014-08/25/content_9050.htm (accessed on 12 February 2017). (In Chinese)
- Zhang, X. Principles of Computable General Equilibrium (CGE) Modeling and Programming; Shanghai People’s Publishing House: Shanghai, China, 2010. (In Chinese) [Google Scholar]
- Statistics Bureau of Guangdong Province. Guangdong Statistical Yearbook 2011. Available online: http://www.gdstats.gov.cn/tjsj/gdtjnj/ (accessed on 12 February 2017). (In Chinese)
- People’s Government of Guangdong Province. Outline of the Twelfth Five-Year Plan for National Economic and Social Development of Guangdong Province. Available online: http://zwgk.gd.gov.cn/006939748/201105/t20110513_86534.html (accessed on 12 February 2017). (In Chinese)
- Development and Reform Commission of Guangdong Province. 12th Five-Year Plan for Energy Development of Guangdong Province. Available online: http://zwgk.gd.gov.cn/006939748/201105/t20110513_86534.html (accessed on 12 February 2017). (In Chinese)
- Scrimgeour, F.; Oxley, L.; Fatai, K. Reducing carbon emissions? The relative effectiveness of different types of environmental tax: The case of New Zealand. Environ. Model. Softw. 2005, 20, 1439–1448. [Google Scholar] [CrossRef]
- Wissema, W.; Dellink, R. AGE analysis of the impact of a carbon energy tax on the Irish economy. Ecol. Econ. 2007, 61, 671–683. [Google Scholar] [CrossRef]
- Labandeira, X.; Labeaga, J.M.; Rodríguez, M. Green tax reforms in Spain. Eur. Environ. 2004, 14, 290–299. [Google Scholar] [CrossRef]
- Meng, S.; Siriwardana, M.; McNeill, J. The environmental and economic impact of the carbon tax in Australia. Environ. Resour. Econ. 2013, 54, 313–332. [Google Scholar] [CrossRef]
- Zhang, X.P.; Guo, Z.Q.; Zheng, Y.H.; Zhu, J.C.; Yang, J. A CGE analysis of the impacts of a carbon tax on provincial economy in China. Emerg. Mark. Financ. Trade 2016, 52, 1372–1384. [Google Scholar] [CrossRef]
- Lu, C.Y.; Tong, Q.; Liu, X.M. The impacts of carbon tax and complementary policies on Chinese economy. Energy Policy 2010, 38, 7278–7285. [Google Scholar] [CrossRef]
- Liang, Q.M.; Fan, Y.; Wei, Y.M. Carbon taxation policy in China: How to protect energy and trade intensive sectors? J. Policy Model. 2007, 29, 311–333. [Google Scholar] [CrossRef]
- Liang, Q.M.; Wei, Y.M. Distributional impacts of taxing carbon in China: Results from the CEEPA model. Appl. Energy 2012, 92, 545–551. [Google Scholar] [CrossRef]
- Guo, Z.Q.; Zhang, X.P.; Zheng, Y.H.; Rao, R. Exploring the impacts of a carbon tax on the Chinese economy using a CGE model with a detailed disaggregation of energy sectors. Energy Econ. 2014, 45, 455–462. [Google Scholar] [CrossRef]
- Hu, Z.Y.; Cai, W.B. The study on the impacts of energy intensity imposed by the taxation of energy taxes: A CGE approach. J. Hunan Univ. Soc. Sci. 2001, 21, 57–61. (In Chinese) [Google Scholar]
- Yang, L.; Mao, X.Q.; Liu, Q.; Liu, Z.Y. Impact assessment for energy taxation policy based on a Computable General Equilibrium (CGE) model. China Popul. Resour. Environ. 2009, 19, 24–29. (In Chinese) [Google Scholar]
- He, J.W.; Li, S.T. The impact of energy tax and environmental tax on China’s economy. J. Quant. Tech. Econ. 2009, 1, 31–44. (In Chinese) [Google Scholar]
- State Statistics Bureau. China Energy Statistical Yearbook 2013; China Statistical Press: Beijing, China, 2013. (In Chinese)
- Statistics Bureau of Guangdong Province. Guangdong Statistical Yearbook 2013. Available online: http://www.gdstats.gov.cn/tjsj/gdtjnj/ (accessed on 12 February 2017). (In Chinese)
- Bian, J. The Analysis of the Influence Factors and Forecast of Carbon Emission in Guangdong Province; Jinan University: Guangzhou, China, 2013. (In Chinese) [Google Scholar]
- Editorial Board of China Tax Year Book. Tax Year Book of China 2013; China Tax Publishing House: Beijing, China, 2013. (In Chinese)
Figure 1.
Structure of production module.

Figure 2.
Structure of trade module.

Figure 3.
Structure of income and expenditure module.
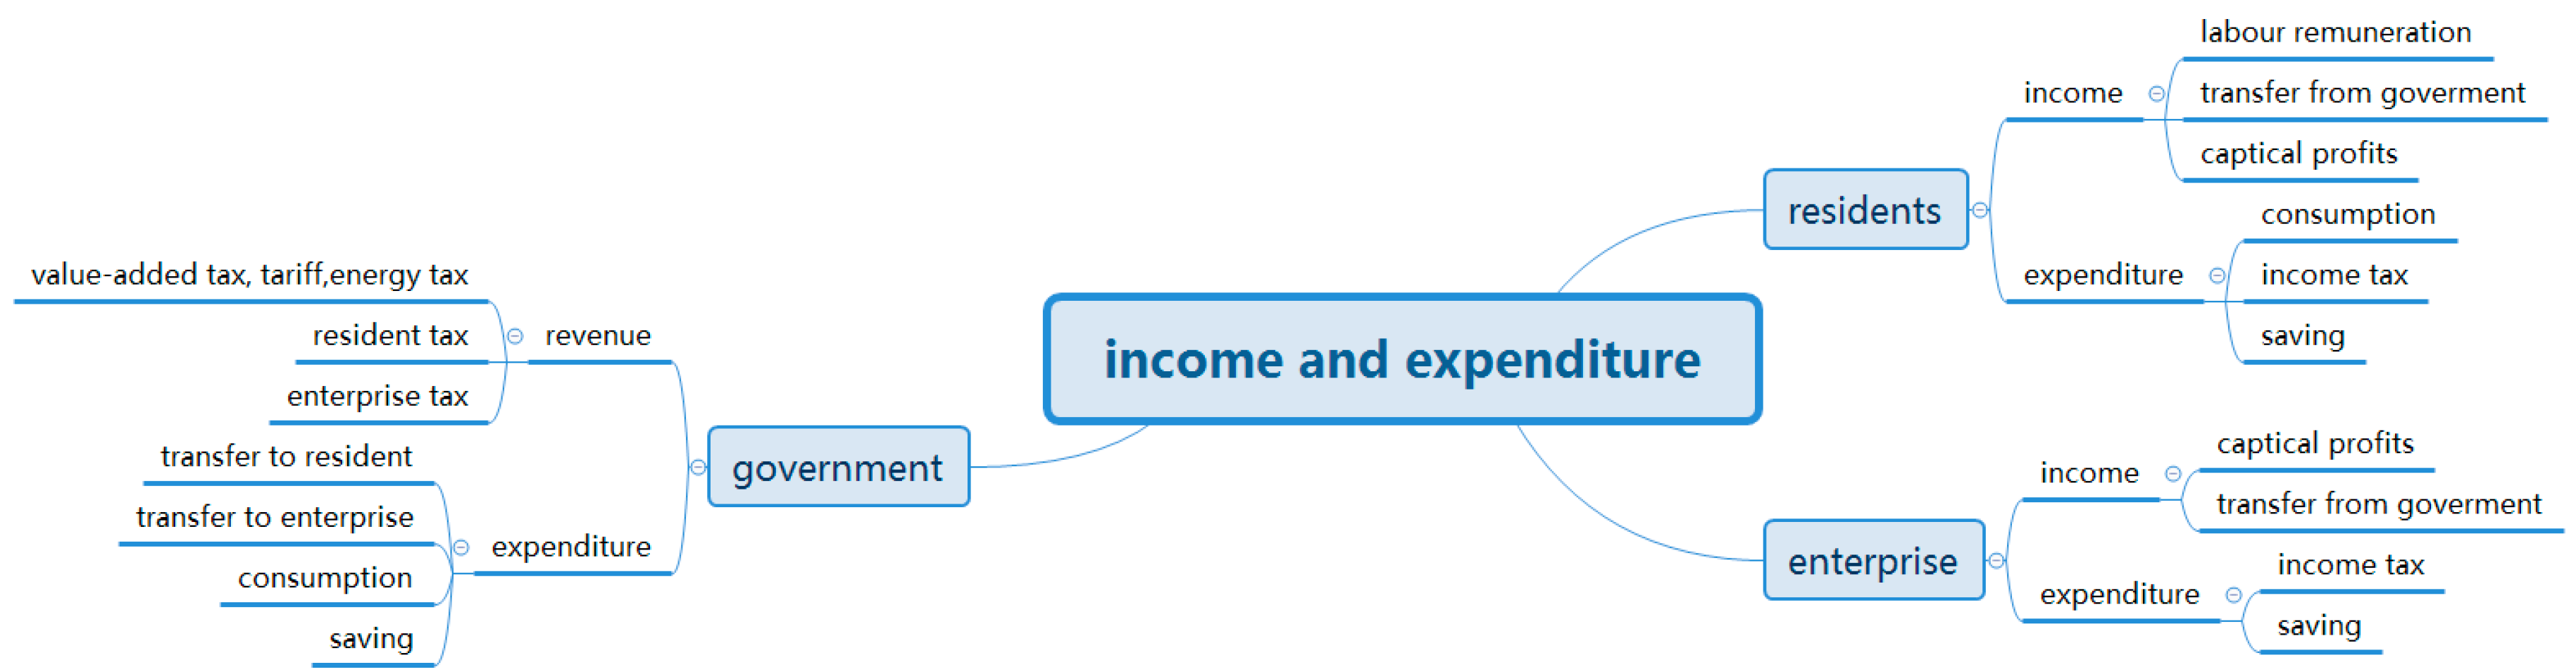
Figure 4.
Energy saving and emission reduction by energy tax by department.

Table 1.
Final energy consumption in Guangdong Province in 2012.
| Sectors | Coal/(104 tce) | Petroleum/(104 tce) | Natural Gas/(104 tce) | Power, Heat and Others/(104 tce) |
|---|---|---|---|---|
| Agriculture, forestry, animal husbandry and fisheries | 43.79 | 166.43 | 0.00 | 272.77 |
| Manufacturing industry | 4868.95 | 2376.40 | 455.05 | 10,708.41 |
| Industry | 2.23 | 526.79 | 0.00 | 199.43 |
| Transport, Storage and Post | 1.73 | 2731.68 | 0.00 | 234.16 |
| Wholesale and retail | 59.26 | 351.39 | 97.09 | 879.79 |
| Other service industries | 0.00 | 92.47 | 0.00 | 1479.65 |
| Living consumption | 118.52 | 1407.44 | 161.60 | 2371.60 |
Table 2.
Elastic coefficients in the model.
| Parameters | Value | Description |
|---|---|---|
| rh0Aa(a) | 0.3 | Substitution elasticity of intermediate input and labor-capital-energy bundle. |
| rh0EVA(a) | 0.2 | Substitution elasticity of labor-capital bundle and energy. |
| rh0VA(a) | 0.2 | Substitution elasticity of labor and capital. |
| rh0Qq(cc) | 0.6 | Substitution elasticity of domestic commodity and import commodity under the Armington condition. |
| rh0QDC(cc) | 0.6 | Substitution elasticity of local commodities and commodities from other provinces under the Armington condition. |
| rh0CET(a) | 1.4 | Substitution elasticity of domestic commodity and export commodity in the CET function. |
| rh0QDA(a) | 1.4 | Substitution elasticity of local commodities and commodities from other provinces in the CET function. |
Table 3.
Base year equilibrium test.
| Index | Present Values | Simulated Values |
|---|---|---|
| Energy consumption/(104 t) | 25,547 | 25,553.96 |
| Carbon emission/(104 t) | 13,902 | 13,899.78 |
| Actual GDP/(108 yuan) | 55,462.15 | 55,463.20 |
| Government revenue/(108 yuan) | 8276.15 | 8313.93 |
| Residents’ income/(108 yuan) | 27,713.06 | 27,720.92 |
| Enterprises’ income/(108 yuan) | 14,364.85 | 14,369.78 |
| Imports/(108 yuan) | 30,860.73 | 30,848.66 |
| Exports/(108 yuan) | 39,985.67 | 39,973.55 |
| Labor remuneration/(108 yuan) | 27,239.83 | 27,239.83 |
| Capital/(108 yuan) | 20,839.41 | 20,839.41 |
Table 4.
Designs of taxation scenarios.
| Scenarios | Setting |
|---|---|
| BASE | No energy tax |
| ETAX | Levy energy tax by the heat value of the final energy consumption at three tax rates: 100 yuan/tce, 150 yuan/tce, 200 yuan/tce |
| CTAX | Levy carbon tax by the carbon emission of the final energy consumption at three tax rates: 50 yuan/t CO2, 75 yuan/t CO2, 100 yuan/t CO2 |
| CTAXM1 | Levy carbon tax at the tax rate of 75 yuan/t CO2, excluding energy department |
| CTAXM2 | Levy carbon tax at the rate of 75 yuan/t CO2 and subsidize the residents |
| CTAXM3 | Levy carbon tax at the rate of 75 yuan/t CO2 and subsidize the enterprises |
Table 5.
Energy saving, emission reduction effect, and social economic impact by the energy tax.
| Index | Base | ETAX200 | ETAX150 | ETAX100 |
|---|---|---|---|---|
| Energy consumption/(104 t) | 25,553.96 | −10.97% | −8.46% | −5.80% |
| CO2 emission/(104 t) | 50,976 | −11.22% | −8.65% | −5.94% |
| Actual GDP/(108 yuan) | 55,463.20 | −0.17% | −0.12% | −0.08% |
| Government revenue/(108 yuan) | 8313.93 | 3.45% | 2.67% | 1.84% |
| Residents’ income/(108 yuan) | 27,720.92 | −0.91% | −0.70% | −0.48% |
| Enterprises’ income/(108 yuan) | 14,369.78 | −1.40% | −1.08% | −0.73% |
| Goods transferred out/(108 yuan) | 21,434.55 | −2.58% | −1.97% | −1.33% |
| Goods transferred in/(108 yuan) | 27,238.89 | −2.45% | −1.89% | −1.29% |
| Imports/(108 yuan) | 30,848.66 | −0.20% | −0.16% | −0.11% |
| Exports/(108 yuan) | 39,973.55 | −0.16% | −0.12% | −0.08% |
| CO2 emission reduction costs/(yuan/t) | / | 165 | 151 | 146 |
| Tax revenue/(108 yuan) | / | 455 | 351 | 240 |
Table 6.
Economical influences by department under ETAX150.
| Code | Output | Transferred out | Transferred in | Export | Import |
|---|---|---|---|---|---|
| 4 | −42.33% | −73.51% | −12.60% | −42.80% | −12.00% |
| 11 | −11.69% | −14.19% | −6.10% | −13.00% | −5.40% |
| 3 | −9.88% | −8.92% | −12.30% | −8.80% | −11.70% |
| 24 | −7.27% | −8.55% | −6.60% | −8.50% | −6.00% |
| 10 | −3.93% | −4.43% | −0.80% | −4.90% | −0.10% |
| 7 | −3.77% | −4.61% | −2.00% | −5.10% | −1.30% |
| 25 | −3.39% | −3.35% | −3.50% | 0.00% | 0.00% |
| 14 | −2.53% | −3.51% | −0.60% | −4.10% | 0.10% |
| 13 | −2.52% | −6.03% | 3.00% | −6.30% | 3.80% |
| 23 | −2.24% | 0.00% | −2.90% | 0.00% | 0.00% |
| 8 | −2.14% | −1.96% | −1.60% | −2.60% | −0.90% |
| 9 | −2.09% | −2.01% | −1.10% | −2.60% | −0.50% |
| 26 | −1.92% | 0.00% | 0.00% | 0.00% | 0.00% |
| 29 | −1.71% | −2.44% | −0.30% | −3.10% | 0.40% |
| 12 | −1.57% | −1.51% | −1.50% | −2.20% | −0.80% |
| 22 | −1.54% | −0.72% | −2.60% | −1.40% | −2.00% |
| 5 | −1.53% | −1.22% | −1.90% | −1.90% | −1.20% |
| 15 | −0.63% | −0.49% | −0.60% | −1.20% | 0.10% |
| 21 | −0.63% | −0.40% | −0.20% | −1.10% | 0.50% |
| 1 | −0.62% | 0.37% | −1.60% | −0.30% | −0.90% |
| 6 | −0.41% | 0.33% | −1.40% | −0.40% | −0.70% |
| 30 | −0.39% | 0.00% | 0.00% | 0.40% | −1.40% |
| 28 | −0.38% | 0.71% | −2.00% | 0.02% | −1.30% |
| 27 | −0.18% | 0.00% | 0.20% | −1.20% | 0.90% |
| 2 | 0.00% | 0.00% | −8.40% | 0.00% | −7.70% |
| 18 | 0.29% | 0.79% | −0.30% | 0.10% | 0.40% |
| 20 | 0.80% | 1.46% | −0.80% | 0.80% | −0.10% |
| 16 | 1.41% | 2.08% | −0.30% | 1.40% | 0.30% |
| 19 | 2.46% | 3.21% | 0.80% | 2.60% | 1.50% |
| 17 | 3.77% | 4.67% | 0.60% | 4.20% | 1.30% |
Table 7.
Energy saving, emission reduction effect and social economic impacts by the carbon tax.
| Index | CTAX100 | CTAX75 | CTAX50 | CTAX100 |
|---|---|---|---|---|
| Energy consumption/(104 t) | −11.21% | −8.66% | −5.95% | −11.21% |
| CO2 emission/(104 t) | −11.61% | −8.97% | −6.17% | −11.61% |
| Actual GDP/(108 yuan) | −0.18% | −0.13% | −0.08% | −0.18% |
| Government revenue/(108 yuan) | 3.41% | 2.65% | 1.83% | 3.41% |
| Residents’ income/(108 yuan) | −0.88% | −0.67% | −0.45% | −0.88% |
| Enterprises’ income/(108 yuan) | −1.39% | −1.06% | −0.72% | −1.39% |
| Goods transferred out/(108 yuan) | −2.50% | −1.90% | −1.29% | −2.50% |
| Goods transferred in/(108 yuan) | −2.35% | −1.80% | −0.96% | −2.35% |
| Imports/(108 yuan) | −0.07% | −0.06% | −0.04% | −0.07% |
| Exports/(108 yuan) | −0.06% | −0.04% | −0.03% | −0.06% |
| CO2 emission reduction costs/(yuan/t) | 169 | 158 | 141 | 169 |
| Tax revenue/(108 yuan) | 451 | 348 | 239 | 451 |
Table 8.
The differences of influences made by CTAX75 and ETAX150.
| Code | Output | Transferred out | Transferred in | Code | Output | Transferred out | Transferred in |
|---|---|---|---|---|---|---|---|
| 1 | −0.10% | −0.10% | −0.10% | 16 | 0.20% | 0.30% | 0.10% |
| 2 | 0.00% | 0.00% | −0.20% | 17 | 0.00% | 0.00% | 0.00% |
| 3 | −0.50% | −0.50% | −0.50% | 18 | 0.10% | 0.20% | 0.00% |
| 4 | 11.80% | 11.80% | 3.00% | 19 | 0.50% | 0.60% | 0.30% |
| 5 | −0.30% | −0.30% | −0.30% | 20 | 1.20% | 1.20% | 0.04% |
| 6 | −0.10% | −0.10% | 0.00% | 21 | −0.40% | −0.50% | 0.00% |
| 7 | −0.80% | −1.10% | −0.30% | 22 | −0.30% | −0.20% | −0.20% |
| 8 | −0.50% | −0.60% | −0.10% | 23 | −0.10% | 0.00% | 0.00% |
| 9 | −0.10% | −0.20% | −0.10% | 24 | 0.20% | 0.40% | −0.10% |
| 10 | −0.70% | −0.80% | 0.00% | 25 | 0.00% | 0.00% | 0.00% |
| 11 | −0.50% | −0.50% | −0.10% | 26 | 0.00% | 0.30% | 0.00% |
| 12 | −0.10% | −0.10% | −0.20% | 27 | −0.10% | −0.20% | 0.00% |
| 13 | −0.60% | −1.40% | 0.80% | 28 | 0.00% | −0.04% | −0.10% |
| 14 | −0.20% | −0.10% | −0.06% | 29 | −0.10% | −0.10% | 0.10% |
| 15 | 0.00% | 0.10% | −0.02% | 30 | 0.00% | 0.10% | 0.00% |
Table 9.
Comparison of impacts made by different mitigation measures.
| Index | CTAX75 | CTAXM1 | CTAXM2 | CTAXM3 |
|---|---|---|---|---|
| Energy consumption/(104 t) | −8.66% | −7.96% | −8.67% | −8.66% |
| CO2 emission/(104 t) | −8.97% | −8.24% | −8.98% | −8.97% |
| Actual GDP/(108 yuan) | −0.13% | −0.04% | −0.15% | −0.13% |
| Government revenue/(108 yuan) | 2.65% | 2.69% | −1.45% | −1.41% |
| Residents’ income/(108 yuan) | −0.67% | −0.64% | 0.77% | −0.67% |
| Enterprises’ income/(108 yuan) | −1.06% | −0.95% | −0.93% | 1.36% |
| Imports/(108 yuan) | −0.06% | 0.03% | −0.27% | −0.06% |
| Exports/(108 yuan) | −0.04% | 0.02% | −0.21% | −0.04% |
| reduction costs/(yuan/t) | 158 | 53 | 182 | 158 |
| Tax revenue (108 yuan) | 348 | 300 | 348 | 348 |
Table 10.
The differences of influences made by CTAXM1 and CTAX75.
| Code | Output | Transferred out | Transferred in | Code | Output | Transferred out | Transferred in |
|---|---|---|---|---|---|---|---|
| 1 | 0.00% | −0.10% | 0.10% | 16 | −0.30% | −0.40% | 0.10% |
| 2 | 0.00% | 0.00% | 0.70% | 17 | −0.80% | −1.00% | −0.20% |
| 3 | 9.70% | 10.10% | 9.10% | 18 | −0.10% | −0.30% | 0.10% |
| 4 | −36.20% | −36.30% | −9.50% | 19 | 0.00% | −0.10% | 0.10% |
| 5 | −0.10% | −0.30% | 0.00% | 20 | 0.50% | 0.40% | 0.20% |
| 6 | 0.00% | −0.10% | 0.20% | 21 | −0.20% | −0.20% | 0.00% |
| 7 | −0.10% | −0.20% | 0.10% | 22 | −0.20% | −0.40% | 0.00% |
| 8 | 0.00% | −0.10% | 0.10% | 23 | −0.40% | 0.00% | −0.20% |
| 9 | −0.20% | −0.30% | 0.00% | 24 | 0.20% | 1.20% | −0.80% |
| 10 | 0.00% | −0.20% | 0.10% | 25 | 0.30% | 0.60% | −0.10% |
| 11 | 10.40% | 11.70% | 1.10% | 26 | −0.20% | 0.00% | 0.00% |
| 12 | 0.10% | 0.00% | 0.30% | 27 | 0.00% | 0.00% | 0.10% |
| 13 | −0.10% | −0.20% | 0.10% | 28 | 0.00% | −0.10% | 0.20% |
| 14 | −0.20% | −0.40% | 0.00% | 29 | −0.20% | −0.30% | −0.10% |
| 15 | −0.10% | −0.10% | 0.10% | 30 | 0.00% | 0.00% | 0.00% |
Table 11.
The differences of influences made by CTAXM2 and CTAX75.
| Code | Output | Transferred out | Transferred in | Code | Output | Transferred out | Transferred in |
|---|---|---|---|---|---|---|---|
| 1 | 1.00% | 0.60% | 1.40% | 16 | −0.80% | −1.10% | 0.10% |
| 2 | 0.00% | 0.00% | 0.30% | 17 | −1.30% | −1.80% | 0.00% |
| 3 | −0.30% | −0.70% | 0.10% | 18 | −0.10% | −0.40% | 0.50% |
| 4 | −49.60% | −49.70% | −13.00% | 19 | −0.70% | −1.10% | −0.10% |
| 5 | −0.10% | −0.40% | 0.20% | 20 | −0.10% | −0.50% | 0.70% |
| 6 | 0.80% | 0.40% | 1.40% | 21 | −0.30% | −0.50% | 0.20% |
| 7 | 0.40% | 0.10% | 0.80% | 22 | −0.20% | −0.60% | 0.20% |
| 8 | 0.50% | 0.20% | 1.10% | 23 | −0.40% | 0.00% | 0.10% |
| 9 | −0.30% | −0.60% | 0.30% | 24 | 0.00% | −0.10% | 0.20% |
| 10 | 0.30% | 0.00% | 0.70% | 25 | 1.20% | 1.00% | 1.30% |
| 11 | −0.20% | −0.30% | 0.40% | 26 | 0.20% | 0.00% | 0.00% |
| 12 | 0.00% | −0.30% | 0.50% | 27 | −0.10% | 0.00% | 0.20% |
| 13 | 0.00% | −0.30% | 0.30% | 28 | 0.30% | 0.00% | 0.80% |
| 14 | −0.30% | −0.60% | 0.10% | 29 | −0.10% | −0.40% | 0.10% |
| 15 | 0.50% | 0.20% | 0.80% | 30 | 0.40% | 0.00% | 0.00% |
Table 12.
Sensitivity analysis of elastic coefficients.
| Parameter | Change Rate of Elastic Coefficient/(%) | Change Rate of GDP/(%) | Change Rate of Carbon Emission/(%) |
|---|---|---|---|
| rh0Aa | 50 | 0 | −0.08 |
| −50 | 0 | 0.05 | |
| rh0EVA | 50 | 0 | 0 |
| −50 | 0 | 0 | |
| rh0VA | 50 | −0.01 | −0.04 |
| −50 | 0 | 0.64 | |
| rh0Qq | 50 | −0.02 | −0.56 |
| −50 | 0 | 0.08 | |
| rh0QDC | 50 | −0.08 | −2.34 |
| −50 | 0.01 | 0.37 | |
| rh0CET | 50 | 0 | 0.09 |
| −20 | −0.02 | −0.71 | |
| rh0QDA | 50 | 0.02 | 0.58 |
| −20 | −0.07 | −2.13 |
© 2017 by the authors. Licensee MDPI, Basel, Switzerland. This article is an open access article distributed under the terms and conditions of the Creative Commons Attribution (CC BY) license (http://creativecommons.org/licenses/by/4.0/).
Share and Cite
MDPI and ACS Style
Chen, W.; Zhou, J.-F.; Li, S.-Y.; Li, Y.-C. Effects of an Energy Tax (Carbon Tax) on Energy Saving and Emission Reduction in Guangdong Province-Based on a CGE Model. Sustainability 2017, 9, 681. https://doi.org/10.3390/su9050681
AMA Style
Chen W, Zhou J-F, Li S-Y, Li Y-C. Effects of an Energy Tax (Carbon Tax) on Energy Saving and Emission Reduction in Guangdong Province-Based on a CGE Model. Sustainability. 2017; 9(5):681. https://doi.org/10.3390/su9050681
Chicago/Turabian StyleChen, Wei, Jin-Feng Zhou, Shi-Yu Li, and Yao-Chu Li. 2017. "Effects of an Energy Tax (Carbon Tax) on Energy Saving and Emission Reduction in Guangdong Province-Based on a CGE Model" Sustainability 9, no. 5: 681. https://doi.org/10.3390/su9050681
Note that from the first issue of 2016, this journal uses article numbers instead of page numbers. See further details here.