
Energy Conservation in China’s Cement Industry

1
Collaborative Innovation Center for Energy Economics and Energy Policy, China Institute for Studies in Energy Policy, School of Management, Xiamen University, Xiamen 361005, Fujian, China
2
The School of Energy, Xiamen University, Xiamen 361005, Fujian, China
3
State Grid Anhui Electric Power Company, Hefei 230061, Anhui, China
*
Author to whom correspondence should be addressed.
Sustainability 2017, 9(4), 668; https://doi.org/10.3390/su9040668
Submission received: 20 March 2017
/
Revised: 18 April 2017
/
Accepted: 19 April 2017
/
Published: 22 April 2017
(This article belongs to the Section Energy Sustainability)
Abstract
:China, as the world’s largest cement producer, accounts for more than 60% of global cement production. With the continuous development of the Chinese economy, resource and environmental constraints are becoming increasingly serious, and energy saving and emission reduction has become one of the choices with which all industries are faced in the process of development. The cement industry is one of the major sources of China’s carbon dioxide emissions and its effect on energy saving and emissions’ reduction determines the realization of the national goals of energy conservation and emissions reduction. Taking China’s cement industry as the main focus, this paper carries out quantitative analysis of the relationship between energy consumption in the cement industry and a number of variables: energy structure, energy prices, energy efficiency and total output value of the cement industry based on a cointegration model. The study further analyzes the energy saving potential of the cement industry by assuming different scenarios. The research results show that the energy saving potential of the cement industry is 19.06% and 33.69%, with medium and high energy efficiency, respectively.
1. Introduction
Cement is one of the important sectors of China’s national economy, and is the artery of national economic and social development. Since the 1990s, China’s cement industry has experienced an enormous upswing (cement output witnessed 936% growth, soaring from 61 billion Yuan in 1991 to 571 billion Yuan in 2010). With sustainable growth of China’s economy and gradual improvement towards the future, the cement industry has the capacity for further expansion. At the same time, the improvement of people’s livelihood, social stability, national security, etc., puts a higher pressure on cement demand security. In addition to the important supporting role played by cement industry in economic growth, it should also be noted that the current essential features of China’s cement industry are high energy consumption, high pollution and high emissions. Lin and Zhang [1] argue that China’s cement industry has become one of the sectors with the most significant harm to energy security and climate change, due to the large coal consumption and carbon dioxide emissions as well as the lack of alternative fuels. As one of the major countries of cement production, China’s cement production has ranked first in the world since 1985, and at present China’s cement production accounts for about 60% of total world output. As China’s macro-economic development relied much on heavy infrastructure investments, the relationship between the growth of cement industry and the general national economy is relatively high. In recent years, the sustainable and rapid development of the national economy as well as the rapid growth of investment in fixed assets has led to a year-on-year increase of China’s cement production. In 2010, China’s cement production continued to maintain rapid growth, and the total output reached 1.88 billion tons, 14.4% year-on-year growth. In 2011, China’s economy slowed down, but due to the 12th Five-Year Plan of various industries introduced one after another, the willingness to invest in all industries and regions was prompted and the growth of fixed assets investment remained at a high level. China’s cement output still maintained a 10.8% year-on-year growth, with total production of 2.09 billion tons, despite influence by the regulation of real estate market, the slowdown of construction of infrastructure (such as road and rail) as well as the structural adjustment of the cement industry since the fourth quarter of 2011. The growth rate of cement production declined slightly and the annual output of the cement industry was 2.414 billion tons in 2013, with year-on-year growth of 9.57% in 2014, boosted by the “stabilizing growth” policy. In 2015, the economic development of China, entering “New Normal”, a stage with “3 periods overlapping”, namely the periods of growth rate adjustment, the throes of structural adjustment and the digestion phase of early stimulus packages, the slowing-down economy, the tighter State’s macro-economic policies, and a big push to supply-side structural reform contributed to the decline of market demand in the cement industry, which exacerbated the overcapacity in the cement industry. This resulted in a drop in sales volume and price. In 2015, the national cement output was 2.348 billion tons, 122 million tons less than that in 2014, and a drop of up to 165 million tons compared with an increase of 43 million tons from 2013 to 2014. The annual growth rate fell from 1.8% in 2014 to −5.0% in 2015, which was the first annual contraction since 1990. The national cement industry achieved a profit of 32.97 billion Yuan in year 2015, down 58% year-on-year, which was less than half of the previous year’s profit and even lower than the profit level of the year between 2007 to 2014. The proportion of losing enterprises in the cement industry was about 35%, a 10% increase compared with 2014; the loss amounted to 21.536 billion Yuan, more than double that of the previous year.
The cement industry is a capital-intensive industry, with fixed assets such as production facilities and plants taking up a large proportion, while the fixed assets ratio (fixed assets/total assets) of a cement enterprise is more than 40% in general. At the same time, because much investment is spent on the procurement and maintenance of equipment as well as the procurement of raw material and fuel in the process of production, the investment by a cement enterprise in the process of construction and production is huge, and the effective management of capital expenses is critical. At present, China’s cement industry has a high degree of automation, the manufacturing process is relatively mature, most enterprises have adopted the new dry process for cement production, and the process, technology as well as patent are no longer the fundamental problems of enterprise development, which makes products more standardized and homogeneous. Consequently, market competition focuses on price and service, while a good brand and reputation is also the key to win in the market competition.
In addition, the cement industry is an energy-intensive industry. Due to the large proportion of coal and electricity cost in the process of cement production (Figure 1) [1], energy price changes have a large impact on the cost of cement. Moreover, the giant energy consumption of the cement industry has brought a series of problems, which make the cement industry one of the key areas of energy saving and emission reduction. The total cost of cement includes the cost of raw materials, the cost of coal, the cost of electricity, depreciation and other costs. Big cement enterprises in most cases have their own mines, the cost of raw materials has changed little and depreciation and wages are relatively fixed, thus the cost of cement is mainly influenced by the price of coal and electricity. Even by the new dry process for cement production, the cost of coal and electricity accounts for about 60% of the production cost of cement clinker.
The cement industry belongs to the traditional energy-intensive industry, huge amounts of energy resources such as coal, electricity and so on are consumed in the process of production, while air pollutants such as dust, etc., in the cement industry are also main culprits of China’s recent particulate matter emergency. As the resource and environmental constraints faced by China in the process of development become increasingly serious, the subject of energy conservation and emissions reduction in the cement industry is becoming more and more important. In recent years, large-scale cement enterprises are gradually equipped with the waste-heat power generation system, and waste heat power generation could provide about 50% of the electricity per unit of production of cement, which effectively reduces the energy consumption of the cement industry.
Therefore, under the background of energy scarcity and global warming, it presents practical significance to study the carbon dioxide emissions problem and the energy issues in China’s cement industry which has been characterized by high energy consumption and high emissions. Effective energy saving and emissions reduction in the cement industry will be conducive to the realization of China’s economic transition and the construction of a resources-economical society. Since China’s cement industry is particularly highly dependent on oil energy, the oil demand forecast in the cement industry could be helpful to ensure the security of energy supply. The analysis on the influencing factors of oil demand would help formulate corresponding policies to reduce the oil consumption of the cement industry.
The purpose of this paper is to forecast and estimate the energy demand and energy saving potential in China’s cement industry. As Cointegration can establish long-run relationship among factors and can be used to estimate energy saving potential through analyzing the impacts of various factors and estimating corresponding elasticity coefficients, cointegration methods have been used to determined the relationships among the energy consumption in China’s cement industry and a group of variables including energy efficiency, total output value of the cement industry, energy structure, as well as energy prices. Data are from China Statistical Yearbooks, China Energy Statistical Yearbooks, and CEIC database. The period from 1991 to 2014 was chosen for the robustness of statistics. The definition of the target industry in this paper is given by China’s National Bureau of Statistics in Classification of National Economic Industries (GB/T 4754-2011). The adjustment of statistical coverage has been considered.
2. Literature
Since Engle and Granger [2] suggested theorem proving the operable frameworks of cointegration, many scholars have used this method to discuss the influencing factors of energy demand. In reality, economic time series are often non-stationary. Linear combination of these variables, however, is likely to be stationary. If there is a group of stationary linear combination, it proves that there are cointegration relationships between (among) the series and long-term equilibrium relationships between (among) them. It must be pointed out here that the cointegration relationship could exist only if the variables in a model are time series of the same integrated orders. The cointegration theory could be used to forecast the demand for energy, and the estimated results also show the impacts (i.e., elasticity) of the change in each influencing factor on energy demand.
The cointegration theory has been widely used to study influencing factors of energy demand. Galindo [3] established a model for Mexico’s energy demand by using cointegration theory. Türkekul and Unaktan [4] established a model for Turkey’s energy demand by using the same theory. Kulshreshtha and Parikh [5] established a model for India’s coal demand. Park and Zhao [6] established a model for gasoline demand in the U.S. Rao and Rao [7] established a model for gasoline demand in Fiji. Ramanathan [8] established a model for India’s gasoline demand. Alves and Bueno [9] established a model for Brazil’s gasoline demand. Akinboade et al. [10] established a model for gasoline demand in South Africa. Amarawickrama and Hunt [11] established a model for electricity demand in Sri Lanka.
In regard to China’s research, Lin [12] came to the conclusion that economic growth is the major factor affecting the electricity demand in China based on the cointegration model. Through cointegration model for electricity demand and taking urbanization into consideration, He et al. [13] argued that some characteristics appeared in the process of urbanization of developed countries would also appear in China’s demand for electricity. Lin and Xie [14] used cointegration model to study the energy demand of China’s road transport. Lin and Xu [15] estimated the energy conservation of China’s electrolytic aluminum industry. Other similar studied including Lin and Xie [16] and Lin and Yang [17] were also carried out in different industires. Wen et al. [18] valuated the potential for energy conservation and CO2 emissions mitigation in China’s iron and steel industry during 2010 and 2020, based on scenario analysis.
3. Methods and Methodology
3.1. Unit Root Test
Unit root test is mainly used to verify whether or not there is a unit root in a time series. The presence of a unit root will be set as the null hypothesis. Alternatively, the hypothesis can be set as stationarity, trend stationarity or explosive root depending on the methods adopted. If the time series has unit roots, it will lead to spurious regression. Therefore, unit root test is very necessary.
If one of the roots of the characteristic equation is 1, then the stochastic process has a unit root. The process is non-stationary. Otherwise, the characteristic equation is in the unit circle, that is to say, modules of other roots are all less than 1, and the series could be turned into stationary series after the first order difference.
First, give the definition of unit root. is a discrete-time random processes, which is written as p-order autoregressive process:
Here, is not a correlation sequence, its mean is 0, and its variance is a constant . For convenience of calculations, it is assumed that .
If , that is to say, a root of this equation is 1, the stochastic process has only one unit root, and this process is Integrated of order one, namely I (1). If this process has r unit root, this process is Integrated of order r, namely I (r).
At present, the most popular methods of unit root test are as follows: ADF Test (Dickey and Fuller) [19], P Test (Phillips and Perron) [20], KPSS Test (Kwiatkowski et al.) [21], ER Test (Elliot, Rothenberg and Stock) [22] and NP Test (Ng and Perron) [23]. Given the limited space available, only ADF Test and PP Test are introduced.
After first order difference, sequence equations commonly:
Here, ; ; t is time trend; and p is lag length.
Here, the estimated value for could be obtained by using Ordinary Least Square (OLS). The n judge whether the estimated value of is significant based on confidence intervals.
The formulas of PP Test and ADF Test are the same, but ADF Test introduces high-order lagged variables to ensure the random disturbance term without autocorrelation, while PP Test still uses first-order autoregressive. PP Test, which also has disadvantages: it is not sensitive to heteroscedasticity and error autocorrelation. Thus, to improve the accuracy of the test, this paper uses both methods.
3.2. Cointegration Test
Although some economic variables are non-stationary time series, their linear combination is stationary. In other words, these economic indicators are from the same economic system, and there is a long-term equilibrium relationship among them. This equilibrium relationship is called a cointegration relationship.
Engle and Granger [2], for the first time, put forward the concept of cointegration, and gave the definition: a combination of time series is a cointegration of order d only if it meets the following conditions: there is a vector combination that satisfies the condition ~ I(d-b), b > 0, and the vector combination is called a cointegration vector combination .
In other words, if two or more time series have the same order d and the order of their linear combinations are smaller than that of these time series, these time series have the cointegration relationship.
It can be seen from the above definition that the cointegration only involves non-stationary variables, and these non-stationary variables should have the same order. The application of classical regression analysis or time series analysis is based on stationary variables, and few economic variables have an order that is greater than 1, so most economic research on cointegration focuses on the condition that each variable only has one unit root, that is to say the variables are integrated of order one. When a group of non-stationary time series only has one stationary linear combination, this linear combination represents a long-term equilibrium relationship.
In order to understand the concept further, this paper gives a simple example to illustrate this concept. Assume there are two time series of the same order. First, to establish their linear combination , least square method is used to estimate, and then to gain coefficients and the residual error sequence. After that, ADF Test and PP Test are carried out on the residual error sequence to determine whether it is a stationary series. If it is, then these two series have a cointegration relationship, and vice versa.
Now the EG two-step method and Johansen test are the popular cointegration methods. Johansen test could judge more cointegration relationships. However, the main concern of this paper is not the number of the cointegration relationships, while the impact of these variables on energy consumption is the key point, so the EG two-step method has been chosen for convenience.
3.3. Error Correction Model
Davidson, Hendry, Srba and Yero put forward the error correction model in 1978, so this model is also known as DHSY model. The cointegration relationship represents a long-term equilibrium relationship among variables, while most of the economic data are in a state of disequilibrium. Generally, dynamic disequilibrium data would be used to approximate the state of long-term equilibration, and his is called the autoregressive distributed lag model (ADL model). Next, the ADL (1,1) model is introduced.
Move the item , on the right side of this formula, to the left side, plus and minus the item on the right side at the same time, and get:
This equation is called error correction model, wherein the error correction term is:
Error correction model focus on the speed of the dependent variable Y returning to equilibrium after the changes in the independent variable X. It could reflect the long-term and short-term effects of a sequence on another sequence very well, which could give a good explanation of political and social phenomena and make up for the shortcomings of long-term equilibrium model.
3.4. Granger Causality Test
Granger [24] proposed the Granger causality test. He found that regression could only reflect the correlation among variables, and could not reflect some economic causality. The role of the Granger causality test is to determine whether time series Y is useful to the forecast of time series X.
If the time series is a stationary stochastic process, the Granger causality test could be carried out directly; if it is not a stationary stochastic process, difference operation is a prerequisite. When testing, lag length should be determined. Information criteria are generally used when determining lag length, such as Akaike information criterion (AIC) and Schwarz information criterion (SIC). The determination of lag length of variables is normally based on the following ideas: (1) the t test is meaningful; and (2) the order could improve the explaining power of the regression equation according to the F test [25].
4. Variables and Data
The purpose of this paper is to depict short-term and long-term equilibrium relationship among the energy consumption in China’s cement industry and a group of variables including energy efficiency, total output value of the cement industry, energy structure and energy prices, and then to forecast and estimate the energy demand and energy saving potential in China’s cement industry. There are many factors that could affect the energy demand in an industry, and taking economic meaning and data availability into consideration, this paper selects the total output value (TVP) in China’s cement industry, fuel prices (P), energy efficiency (EE), labor productivity (LP) and energy structure (ES) from 1980 to 2014 as explanatory variables to analyze the impact of these variables on the energy consumption during the same period in the cement industry. The meaning of each variable is as follows.
4.1. Energy Consumption in the Cement Industry (EC)
This paper selects the energy consumption (unit: standard coal) in the cement industry of calendar year in China Statistical Yearbook, China Energy Statistical Yearbook and China Cement Statistical Yearbook as the total fossil energy consumption of the corresponding year.
4.2. Total Output Value of the Cement Industry (TVP)
The increase of energy demand in the cement industry is mainly due to the increased cement demand boosted by the development of the construction industry. There are many variables that could reflect the development degree of the cement industry, such as the total output value of the cement industry, the sales revenue of the cement industry, industrial added value of the cement industry and so on. Here, the total output value of the cement industry is chosen, mainly because it could represent the development status of the whole cement industry, while sales revenue cannot fully represent the total production of one year and industrial added value cannot represent the situation of intermediate inputs. In general, the higher is gross industrial output value, the greater are the demand for cement products and the corresponding energy demand. That is to say, the energy demand is positively correlated with the total output value of the cement industry. The gross industrial output value in this paper is drawn from China Cement Statistical Yearbook.
4.3. Fuel Price Index (P)
For any commodities, the price is an important variable that could affect its supply and demand, and energy products are no exception. The energy price is the most important economic variable that affects the energy consumption, and therefore it also affects the energy saving. Based on the demand theory in economics, it could be predicted that there is a negative correlation between energy demand and fuel price index. When the energy prices fall, chemical enterprises tend to consume more energy; when the energy prices rise, these tend to conserve energy in order to reduce cost. Though China’s energy prices are regulated by the government, which cannot fully reflect the scarcity of resources and the true cost of energy consumption, this paper still introduces the energy price as a variable in order to get some information from it to provide some guidance to the formulation of China’s future energy policy. Because there are so many energy products such as oil, coal, electricity, etc., this paper selects the fuel price index as the price cost of the energy consumption to reach uniform standards. The source of these data is the China Statistical Yearbook.
4.4. Energy Efficiency (EE)
Energy efficiency refers to how much economic benefits could be brought by one unit of energy, namely the issue of energy utilization efficiency. Energy efficiency is closely related to the energy consumption, specifically a negative correlation. The improvement of energy efficiency could reduce the energy consumption producing the same output, and vice versa. At present, the extensive style of economic growth in China’s cement industry led to the energy inefficiency. This paper introduces improvements in energy efficiency, which is represented by industrial added value/primary energy consumption of the industry. All of these data are drawn from China Statistical Yearbook and China Cement Statistical Yearbook.
4.5. Labor Productivity in the Cement Industry (LP)
In this paper, the labor productivity is defined as:
Labor productivity = industrial added value/the number of employees in the industry
The relationship between labor productivity and energy consumption demand in the same industry is complicated. The labor input is reduced through the research and development (R&D) as well as the introduction of advanced equipment. The improvement of labor productivity indicates the increase of energy demand given the same output, and thus there is a positive correlation relationship between energy demand and labor productivity. However, with the increase of workers’ technical proficiency, labor productivity is further improved, and the improvement of labor productivity indicates the decline of energy demand with unchanged output, namely a negative correlation relationship between labor productivity and energy demand. Despite this, energy demand per unit of output increases compared with no introduction of advanced technology. The purpose of the introduction of labor productivity in the industry is to explore the behavioral choices of China’s cement industry between R&D investment and equipment investment through the relationship between labor productivity and energy demand in the cement industry. Industrial added value and employment is drawn from China Industry Statistical Yearbook.
4.6. Industry Concentration (IS)
Scale economies effect exists in the cement industry (Norman) [26], and the expansion of enterprise scale is helpful to improve the utilization efficiency of equipment and energy. Enterprise scale would influence business decisions through the understanding of energy saving technology and information about future external risk for the management, which could affect the enterprise production energy efficiency (Enrico Cagno) [27].
The distinguishing features of China’s cement industry are the great numbers and small scale of the enterprises, and there is a large gap in production capacity between China and developed countries. In 2011, there are 3808 cement enterprises in China in total, and the production centralization of top ten cement enterprises is only 25%; the average output of cement clinker and cement by a single enterprise is 5% and 16% of that of Japan, respectively. The gap in enterprise scale is one of the important causes for the relatively high energy consumption of energy-using products in China’s cement industry. For example, the comparable comprehensive energy consumption of large cement companies (with a daily output of more than 4000 tons) is less than 105 kg/t, while the comparable comprehensive energy consumption of small cement companies (with a daily output of less than 1000 tons) is 118 kg/t. Due to the complexity of the building materials and the limitations on statistical data, this paper measures the industry concentration by the total output value of the enterprises divided by the number of the enterprises.
4.7. Other Variables
Other variables have a great impact on fossil energy consumption, such as energy saving investment and product structure, but these variables were abandoned due to the unavailability of data. Increased investment in energy conservation could develop more equipment with high efficiency, and thus realize the goal of energy saving. However, the data for this variable are only available for a few years, so this variable is excluded. Product structure has an important impact on energy saving and environmental protection. However, this variable is also ignored due to incompleteness of the product structure data in the cement industry.
Based on the above analysis, this paper uses energy efficiency, labor productivity, industry concentration, fuel price index and gross industrial output value as explanatory variables, and the total energy consumption as the explained variable (Table 1 shows the general information of data and variables). The Granger test is applied to reflect the relationship among the five explanatory variables. The results are shown in Table 2. All explanatory variables are the Granger reason of the total energy consumption, and all selected variables have important influence on the energy consumption in the cement industry.
Therefore, the function of the energy consumption in China’s cement industry can be denoted as follows:
Here, EC represents the energy consumption in the cement industry, IS represents the industry concentration in the cement industry, LP represents the labor productivity, P represents fuel price index, EE represents energy efficiency, and TVP represents the total output value of the cement industry.
In this paper, same production function as that in Lin et al. [28] had been chosen. Based on the above analysis, the form of the production function is:
This paper defines the energy saving potential as the difference between energy consumption of the cement industry in the situation of benchmark and that in the situation of energy saving. The energy saving potential could be expressed by the following formula:
PEt = EC−ECmin
Here, PE represents energy saving potential, ECt represents fossil energy consumption of China’s cement industry in year t, and ECmin represents the energy consumption level of China’s cement industry in the situation of energy saving. Using the above equation, the energy saving potential of China’s cement industry could be derived.
5. Empirical Results
5.1. Unit Root Test
Table 3 shows the unit root test on the time series of level and their first-order difference series for all five variable.
According to Table 3, all three kinds of tests all indicate that the time series of level of each variable cannot reject the null hypothesis that unit roots exist. Though the results of these three test methods are not completely consistent, there are good reasons for believing that the time series of level of all five variables is non-stationary according to the Hondroyiannis [29] and Peri and Baldi [30]. Moreover, for the difference series of each variable, all these three tests reject the null hypothesis that unit roots exist. Therefore, it proves that all five variables are first-order stationary.
5.2. Johansen–Juselius Cointegration Test
According to Belloumi [31], to analyze the cointegration relationship between variables, the VAR model, constituted by LnEC, LnIS, LnP, LnEE, LnLP and LnTVP, is constructed. To do this, the optimal lag length of each variable should be determined according to six criteria: LogL, LR, FPE, AIC, SC and HQ. Table 4 presents the selected VAR lag length according to these criteria.
The selected lag length of LogL, LR, FPE, AIC, SC and HQ is 2, so the selected lag length of VAR is 2. After determining that the time series of all variables is integrated of order one and the optimal lag length is 2, this paper estimates the cointegration relationship.
Table 5 presents the result of the cointegration test. The estimates assume that the VAR model includes unconstrained intercept and unconstrained trend. Trace test statistic (Table 6) and maximum eigenvalue statistic (Table 7) indicates similar results: reject the hypothesis of no cointegration vector and support the alternative hypothesis of one cointegration vector in the system at the 0.05 level.
Based on the standardized coefficients of the cointegration vector, the corresponding cointegration equation can be established:
LnEC = −0.008LnIS − 0.0121LnP − 1.026LnEE + 0.017LnLP + 1.002LnTVP − 1.150
First, the cointegration equation shows that there is a long-term equilibrium relationship between the variables during 1980–2014.
Second, the coefficients of the variables lnP, lnIS, and lnEE on the right side of the equation are negative, while the coefficients of lnTVP and lnLP are positive, which conform with basic theories of economics and the actual conditions of the industry development.
Third, the cement demand and building materials’ demand increase as the total output value of the cement industry increases. A large number of investments on infrastructure construction and real estate in China boost the social demand for cement, and thus lead to the increase of energy consumption in the industry. The elasticity coefficient shows that the energy consumption in cement industry goes up by 1.002% as the total output value of the industry increases 1%, and the elasticity coefficient is around 1, which is in line with general results of research on energy consumption in the industry. The elasticity coefficient of total output value is the largest among all influencing factors, which indicates that the major reason for the rapid growth of energy demand in China’s cement industry is the growing demand for cement in the most recent twenty-five years.
Fourth, compared with other variables, the elasticity coefficient of lnLP is 0.017, which indicates that the energy consumption in cement industry goes up by 0.017% as the labor productivity of the industry increases 1%, with positive total effects from energy consumption caused by labor productivity improvement.
The new capacity in China’s cement industry started in recent years, and resulted in high technical content, high automation and high wages (according to the data in 2009, 13% higher than the average level in the whole industry). Improved labor productivity would greatly save the capital taken up by labor, reduce production cost, increase investment in other factors, increase the production, and thus increasing energy consumption. This effect is greater than the decrease of energy consumption caused by the improvement of labor productivity keeping production unchanged.
It is observed that reducing energy consumption by improving labor productivity in China’s cement industry is impractical. To achieve the energy saving target of the industry, supplementary methods are expected, such as the constraint on the total energy consumption of the whole industry and energy consumption per unit output value.
Fifth, the elasticity coefficient of the price of raw materials, fuel and power lnP is negative and relatively small, which indicates that the increase of the price of raw materials and energy would lead to a decline in energy demand, though the range is limited. China’s economy is in rapid development stage, especially the rigid demand for energy in the cement industry caused by the industrialization and urbanization. Moreover, under the circumstances of energy-price controls by the government, price has little impact on the energy consumption. If the government could relax energy-price controls, then the price could reflect the laws of supply and demand in the market, and the impact of price on energy consumption would be magnified.
Sixth, industry concentration has significant effects on energy consumption, and specifically energy consumption in cement industry goes up by 0.008% as the industry concentration increases 1%. Therefore, adjusting industry structure and promoting enterprise merger and reorganization for the growing scale effect could greatly improve the energy efficiency in the industry and reduce energy consumption.
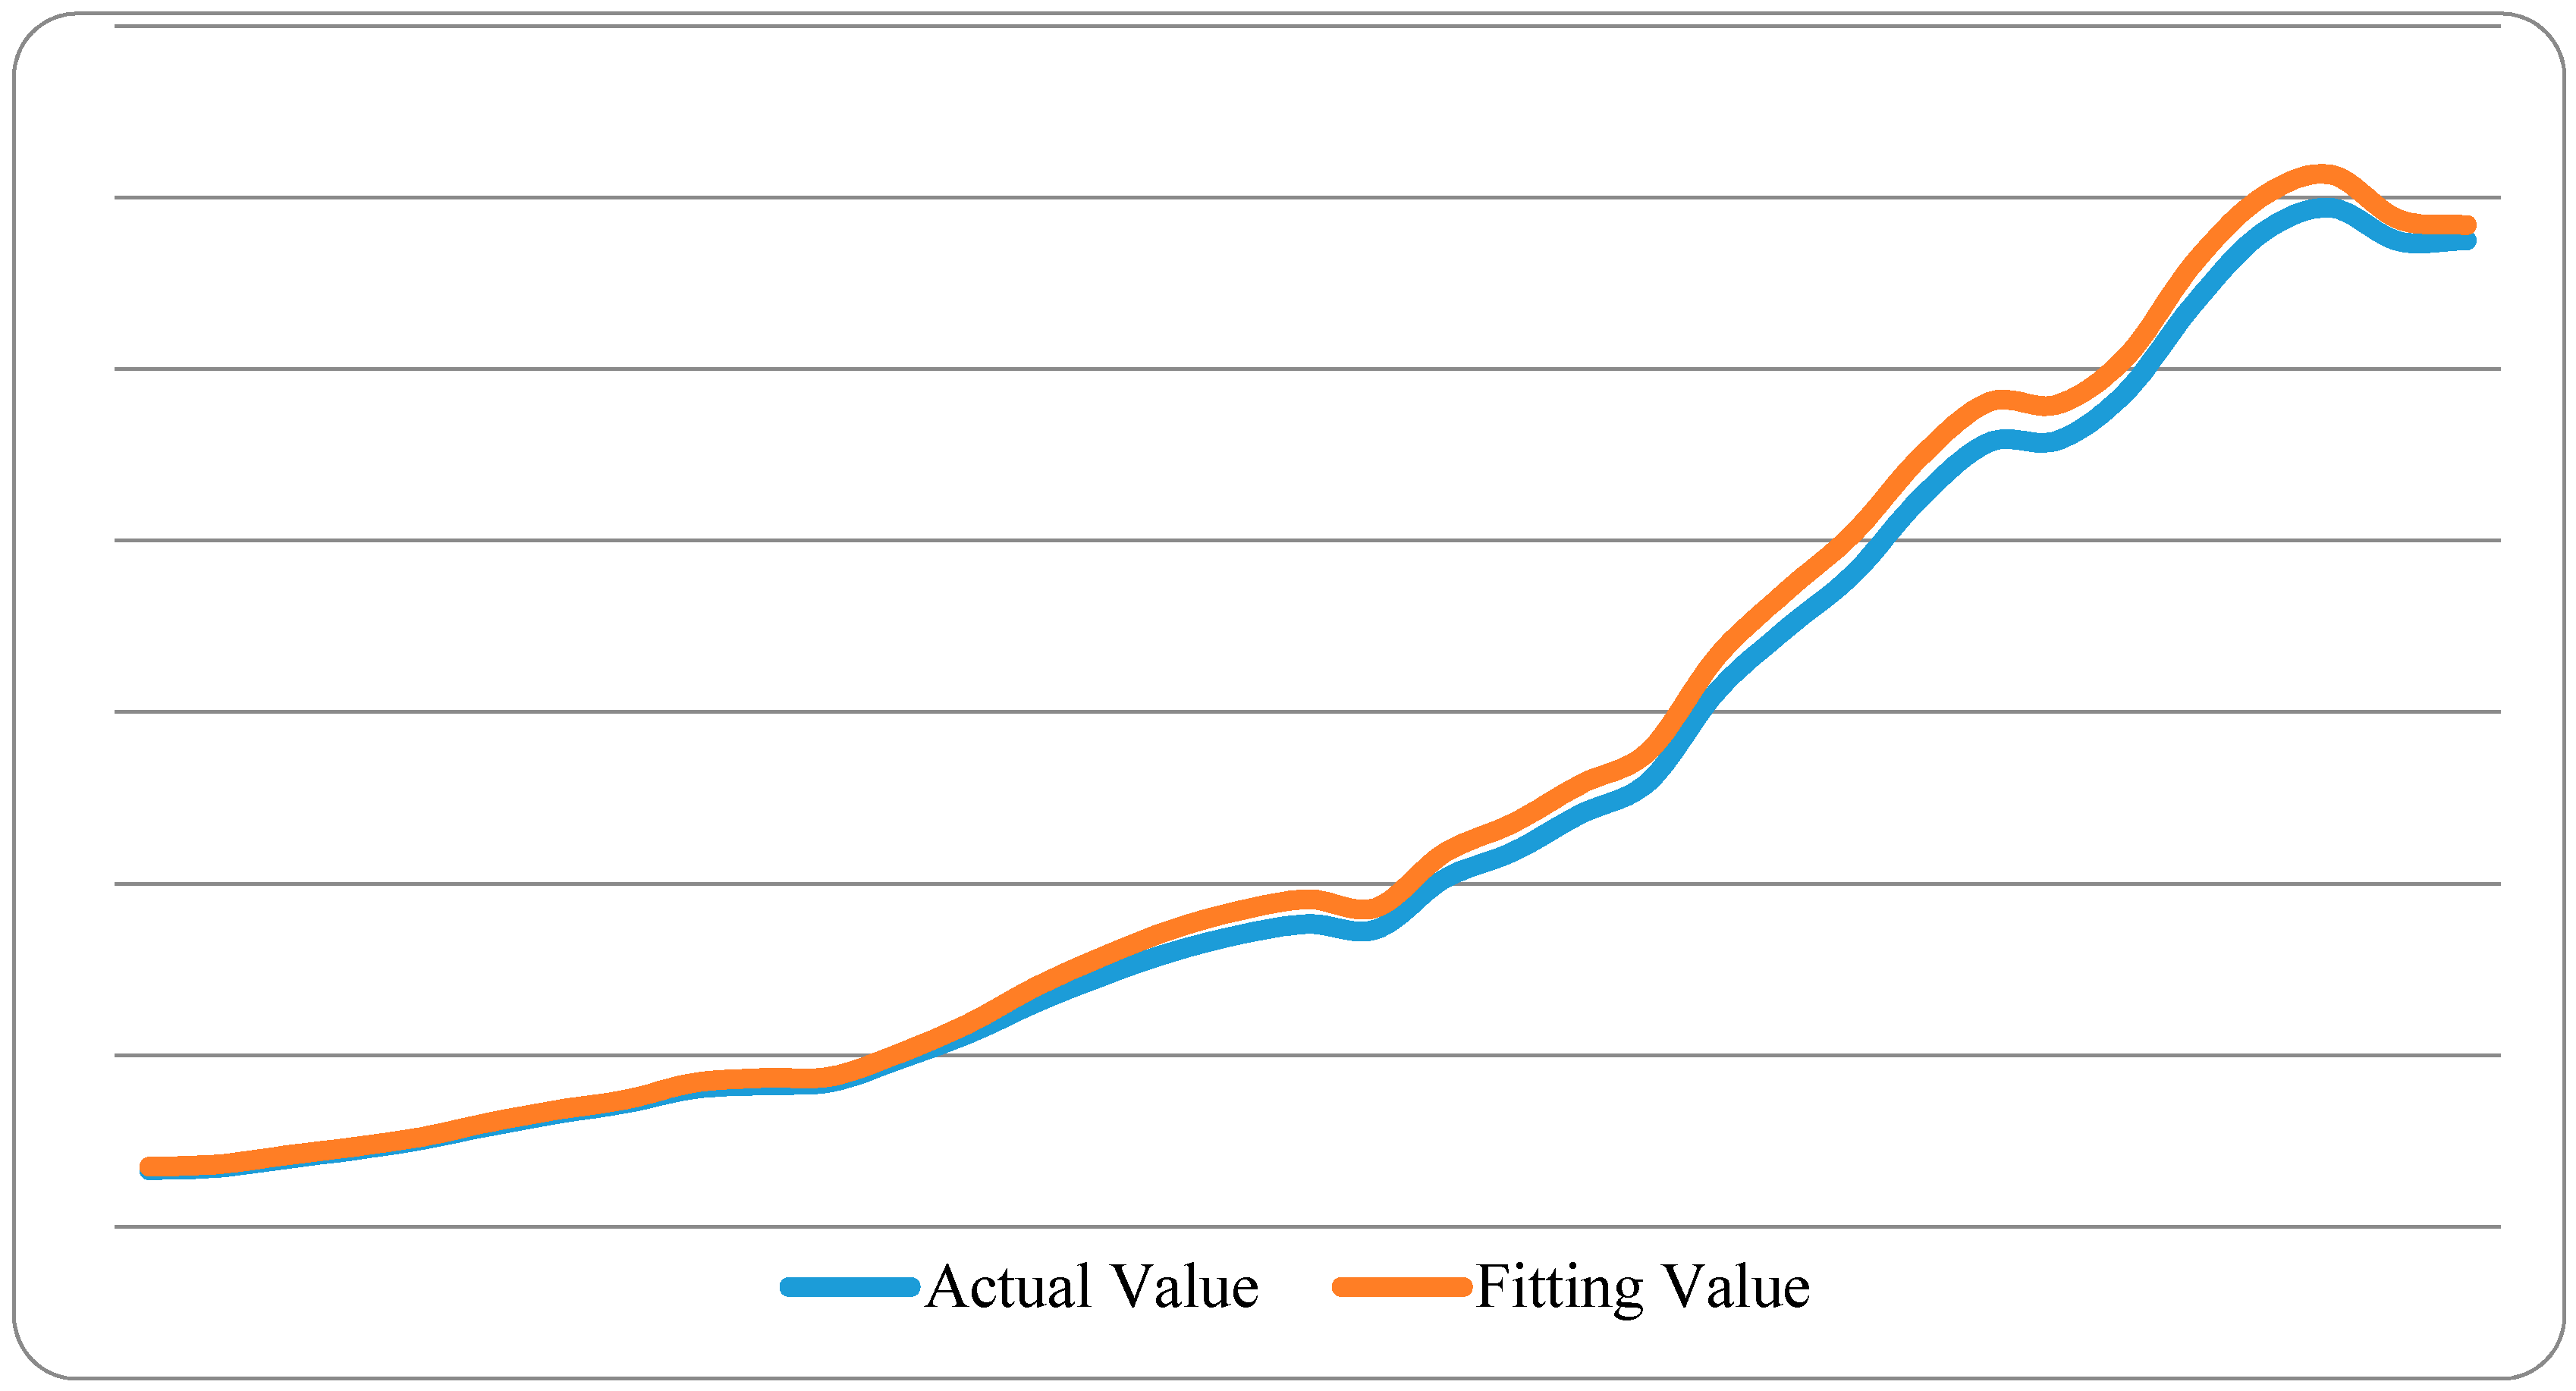
The final step is to test prediction accuracy of the cointegration equation. The actual value of each parameter during 1980–2014 is plugged into the equation, and then the errors between fitting value and actual value of energy consumption in the cement industry are obtained. The fitting results in Figure 2 show that Equation (3) has good prediction accuracy, and further predictions could be made.
6. Robustness Test
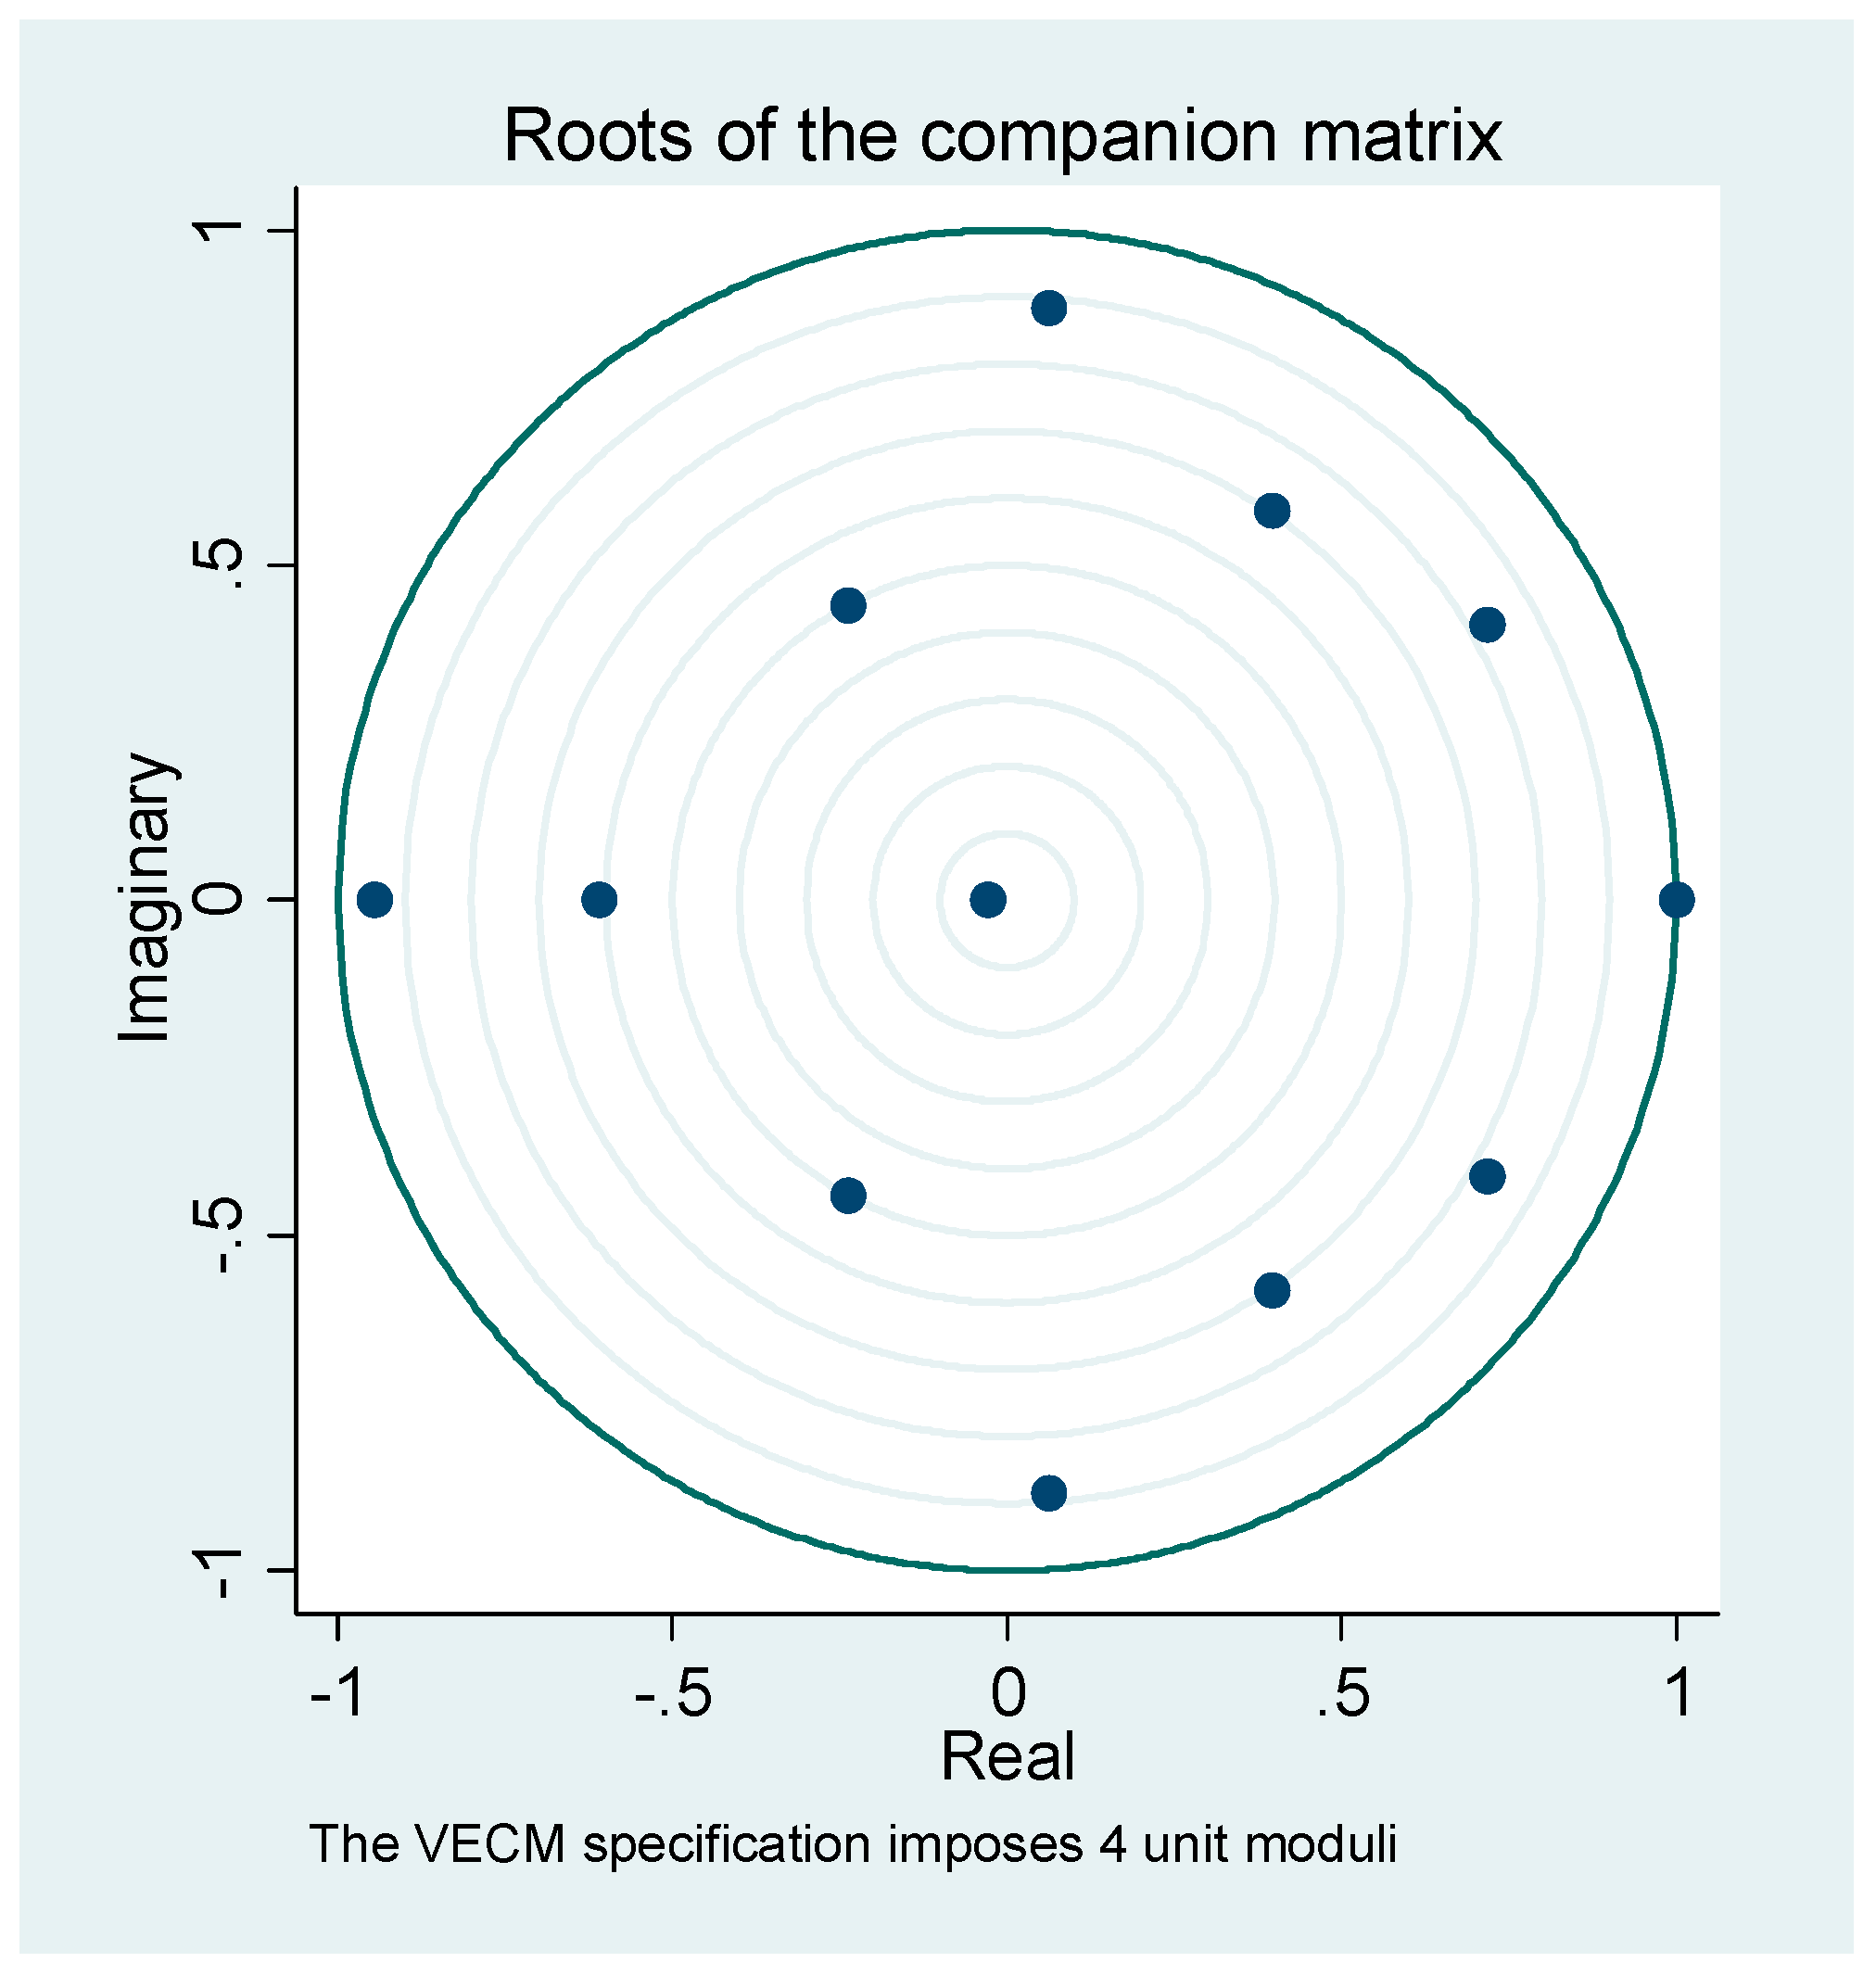
Model misspecification or parameter instability could lead to serious consequences on inference, and could even result in wrong conclusions. Therefore, to ensure the stability of the above cointegration equation, it is necessary to test the stability of the VAR model and to judge whether the estimated parameters have the characteristics of time variation. This part uses the eigenvalue method of coefficient matrix to carry out robustness test. The test results are shown in Figure 3.
The results show that all eigenvalues of the companion matrix areless than 1 and there are no eigenvalues outside the unit circle, thus the system is stable. Therefore, the cointegration equation obtained through the VAR model is effective.
7. Energy Demand Forecast and Energy-Saving Potential Analysis
China has become the world’s largest energy consumer, and to fulfill its due international obligations, China’s government has made a preliminary decision: to increase the share of non-fossil fuels in primary energy consumption to more than 15% in 2020 from 12% in 2015 during the 13th Five-Year Plan; to reduce 16% of the energy consumption per unit of GDP in total in five years; and to control the national energy consumption in 2020 within five billion tons of standard coal, i.e., an annual energy growth rate of 5% needs to support the annual economic growth rate of 7%. From the perspective of the present situation of the cement industry, both the products and their production process are far from the above requirements of the national economy. The current production efficiency, energy efficiency and environmental protection performance is generally lower than the international advanced level, and this kind of extensive development pattern would not only fail to support the transformation and upgrading of the national economy, but also fail to adapt to the situation of market competition in the open environment, and cannot guarantee the sustainable development of the industry.
During the 13th Five-Year Plan, the cement industry would fully implement the strategic tasks proposed by the outline of the 13th Five-Year Plan, and focus on the work in the following several aspects: to focus on strengthening independent innovation and enhancing core competitiveness of the industry; to promote energy saving and emission reduction as well as green manufacturing; to push forward merger and reorganization and promote the development of small- and medium-sized enterprises in the industry; to build national platforms for the research and development in generic technology of the cement industry; and to speed up the high-tech transformation to upgrade traditional equipment manufacturing industry. The average annual growth of gross industrial output value, industrial added value, and prime operating revenue average annual growth remains above 15%. By 2014, the gross industrial output value of cement industry had broken the one trillion Yuan mark.
This paper selects the average growth rate of recent five years from 2010 to 2014 as the scenario, namely assuming that each variable grows at this average growth rate from 2011 to 2030, to forecast China’s energy consumption in the cement industry in this historical scenario. In the historical scenario, the average annual growth rates of gross industrial output value in the cement industry (TVP), labor productivity (LP), fuel retail price index (P), industry concentration (IS), and energy efficiency (EE) are 14.84%, 22.97%, 1.19%, 25.36% and 12.06%, respectively. Accordingly, with reference to the “13th Five-Year” nonmetal manufacturing industry overall development planning, namely the improvement of market economy, the corresponding values of each variable are selected as the planning scenario. In the scenario of high energy saving, the assumption that the growth of industry concentration (IS) accelerates are made; the country gradually promote the market reforms of energy prices; and the fuel retail price index (P) is higher than that in the historical scenario. The average growth rate of these two scenarios is taken as the value in the scenario of medium energy-saving.
Scenario analysis method are adopted to forecast China’s energy consumption and energy saving potential of cement in these three scenarios.
The growth rate settings of all variables in Table 8 have fully taken practical conditions of China and economic theories into consideration, and the growth rates of all variables in the scenarios are reasonable.
According to the above cointegration equation and different scenarios on the growth rate of each variable of energy consumption in China’s cement industry, the energy consumption in different scenarios of China’s cement industry in the future is obtained, as shown in Table 9.
It can be seen in Table 9, in medium energy-saving scenario, China’s energy demand in the cement industry in 2020 and 2030 is 285.65 and 275.49 million tons of standard coal. respectively, which is 23.57 and 64.86 million tons of standard coal lower than that in the historical scenario, and the reduced the energy consumption reaches 7.62% and 19.06% of the energy needs in the corresponding historical scenario. In high energy-saving scenario, China’s energy demand in the cement industry in 2020 and 2030 is 265.07 and 225.69 million tons of standard coal, respectively. These two figures are 44.15 and 114.66 million tons of standard coal lower than that in the historical scenario, respectively, which reduce the energy needs by 14.28% and 33.69% compared to the historical scenario. Thus, it can be seen that China’s cement industry has a considerable potential for energy saving under positive energy-saving policies.
8. Conclusions and Recommendations
This paper has studied the long-term equilibrium relationship between energy demand in China’s cement industry and a group of variables, namely gross industrial output value of cement industry, labor productivity, fuel prices, industry concentration and energy efficiency from 1980 to 2014, and estimated the coefficients of the influencing factors. Based on the results obtained, this paper has forecasted and analyzed the future energy demand and energy saving potential in the industry by scenario analysis. The promotion of different energy saving policies could release energy saving potential in the industry.
It can be seen from the established long-term equilibrium equation that industrial output value of cement has a significant positive correlation with energy demand in this industry. The increase of energy prices and industry concentration could improve energy efficiency and reduce energy demand. In addition, the improvement of labor productivity cannot directly lead to a decline of energy consumption.
Among all the factors, the elasticity coefficient of industrial output value of cement on manufacturing is the largest. The features of present economic stage determine that the energy demand is rigid, i.e., energy demand would rapidly rise with the rapid economic development.
The cement industry is the basic and direct consumers in the construction industry, and China’s rapid economic growth over the last 30 years is the leading factor that drives the rapid growth of energy demand in the cement industry. The elasticity coefficient of industry concentration is also larger than those of other factors, which reflects the characteristics of cement production. The elasticity coefficient of energy prices on energy demand in manufacturing is small, which indicates that the controls on energy prices by the Chinese government and the policy of low energy prices limit the adverse effect of energy prices on energy demand. In addition, the positive impact of labor productivity on energy consumption indicates that the goal of energy saving cannot be realized by the improvement of industry technology alone, and that both energy efficiency in the industry and the amount of energy should be taken into consideration.
Through the final scenario analysis, the results show that energy demand in the cement industry in 2020 and 2030 would reach 309.22 and 340.35 million tons of standard coal, respectively, if the industry develops under the previous development speed and development model. However, if the government changes the development mode and incorporates energy saving and emissions reduction into the economic planning, energy consumption of the industry would sharply decline. In the two energy-saving scenarios in this paper, by 2030, the energy consumption of the cement industry would decreased by 19.06% in the medium energy-saving scenario on the basis of the standard scenario during the same period; and a decreased by 33.69% in the high energy-saving scenario on the basis of the standard scenario during the same period. This indicates that there is much room for energy saving in China’s cement industry.
According to the above model analysis, regarding the way to achieve energy-saving in the industry, to reduce energy consumption at the expense of the speed of economic growth is very effective and immediate, while the cost is inevitably large, and is also not feasible in practice. The empirical results of this paper provide certain help for alleviating the contradictions between economic growth and reducing energy consumption. Compared with reducing economic growth, to achieve energy saving and emissions reduction in the cement industry from the perspective of energy prices as well as the upgrading of industrial structure and energy efficiency is obviously more practical. Therefore, this paper proposes the following policy recommendations.
First, deepen the reform of energy price mechanism. Establish and improve the pricing mechanism for energy, which could flexibly reflect the relation between market supply and demand, resource scarcity and environmental costs, and thus promote energy saving and emissions reduction, structure adjustment and environmental protection. Raise resource tax appropriately, perfect the way taxes are calculated and the way they are collected, and change gradually the method of levying from specific duty to ad valorem duty, in order to promote the reasonable development and utilization of resources. Push forward actively the reform of electricity price, perfect pricing mechanism for transmission and distribution price, reform the classification structure for sales price, and push forward actively tiered pricing for residential users and commercial users. Improve the pricing mechanism for oil further, shorten price adjustment period and improve control procedure, and further market reforms. Continue to push forward the implementation of the reform of natural gas price and pilot work, clarify the price relation between natural gas and alternative energy, and lead the rational allocation of natural gas resources.
Second, upgrade the industry structure of the cement industry, and improve industry concentration by integration and transformation.
The government needs to introduce measures and coordinate with the implementation of national major strategies and key construction projects to improve core competitiveness of the cement industry; with merger and reorganization (see Lin and Wesseh) [33], resource integration as the main line, build several large enterprise groups; speed up the construction of industrial clusters through industrial division and cooperation and specialization production. Upgrade product structure toward high-end products, and transform industrial technology toward deep technology integration of new technologies such as information technology and so on. Transform business models from selling products to selling service. Transform the drive pattern from investment-driven to connotation-driven; and shift the growth point from traditional industries to emerging industries.
In addition, insist on the concept of combining technology and development, and take technology support, service, leading the industry development as the focus of the work of the industry association. In accordance with the obligation orientation of the association, strengthen the organization and coordination of major scientific and technical projects on common issues of the industry, promote the development and application of new techniques as well as new technologies, carry out technology consultant service, promote the exchange and cooperation on science and technology, and publish regular Annual Reports on the Development of Science and Technology in China’s Cement Industry. Further cooperate with China Building Materials Federation on the filter of new technologies of energy saving and emission reduction and their application in the industry. Revise the Catalogue of Key Energy Saving and Emissions Reduction Technologies for Promotion by China Cement Association, recommend more practical technologies and equipment to more cement enterprises, and transform these scientific and technological achievements into productive forces. Energy conservation and environmental protection as well as green transformation are the only way for the cement industry. The cement industry has to do their best to accomplish environment cost internalization, transparency on the indexes of emission reduction targets and the implementation of environmental protection concept as soon as possible. Practice social responsibilities of cement enterprises actively, and pay high attention to key parts such as coal-saving, electricity-saving, water-saving, cleaner production, pollution reduction, etc. Participate actively in the “second generation” technology research and development as well as the setting of different standards and policies, and achieve the target of preeminent above rivals and lead in the industry at an early date.
To sum up, the government should introduce appropriate policies, encourage and lead enterprises to actively develop energy conservation technologies and alternative energy technologies, and minimize energy consumption. Set incentive fiscal, finance, and price polices to promote the development of green economy and low carbon economy, and give appropriate subsidies to enterprise adopting energy-saving measures. Build an energy-saving market environment, where backward equipment is eliminated while advanced equipment is promoted. Increase input in the research and development as well as industrialization of technologies and equipment related to energy-saving, clean energy, carbon capture, utilization and storage, etc., in order to reduce energy consumption effectively.
Acknowledgments
The paper is supported by the Grant for Collaborative Innovation Center for Energy Economics and Energy Policy (No: 1260-Z0210011), Xiamen University Flourish Plan Special Funding (No:1260-Y07200) and China National Social Science Fund (No. 15ZD058)"
Author Contributions
Boqiang Lin, Zihan Zhang and Fei Ge conceived, designed, prepared and revised this paper together. All authors read and approved the final manuscript.
Conflicts of Interest
The authors declare no conflict of interest.
References
- Lin, B.; Zhang, Z. Carbon emissions in China’s cement industry: A sector and policy analysis. Renew. Sustain. Energy Rev. 2016, 58, 1387–1394. [Google Scholar] [CrossRef]
- Engle, R.F.; Granger, C.W.J. Cointegration and error correction: Representation, estimation and testing. Econometrica 1987, 55, 251–276. [Google Scholar] [CrossRef]
- Galindo, L.M. Short- and long-run demand for energy in mexico: A cointegration approach. Energy Policy 2005, 33, 1179–1185. [Google Scholar] [CrossRef]
- Türkekul, B.; Unakıtan, G. A co-integration analysis of the price and income elasticities of energy demand in turkish agriculture. Energy Policy 2011, 39, 2416–2423. [Google Scholar] [CrossRef]
- Kulshreshtha, M.; Parikh, J.K. Modeling demand for coal in India: Vector autoregressive models with cointegrated variables. Energy 2000, 25, 149–168. [Google Scholar] [CrossRef]
- Park, S.Y.; Zhao, G. An estimation of u.S. Gasoline demand: A smooth time-varying cointegration approach. Energy Econ. 2010, 32, 110–120. [Google Scholar] [CrossRef]
- Bhaskara Rao, B.; Rao, G. Cointegration and the demand for gasoline. Energy Policy 2009, 37, 3978–3983. [Google Scholar] [CrossRef]
- Ramanathan, R. Short-and long-run elasticities of gasoline demand in India: An empirical analysis using cointegration techniques. Energy Econ. 1999, 21, 321–330. [Google Scholar] [CrossRef]
- Alves, D.C.O.; de Losso da Silveira Bueno, R. Short-run, long-run and cross elasticities of gasoline demand in brazil. Energy Econ. 2003, 25, 191–199. [Google Scholar] [CrossRef]
- Akinboade, O.A.; Ziramba, E.; Kumo, W.L. The demand for gasoline in south africa: An empirical analysis using co-integration techniques. Energy Econ. 2008, 30, 3222–3229. [Google Scholar] [CrossRef]
- Amarawickrama, H.A.; Hunt, L.C. Electricity demand for sri lanka: A time series analysis. Energy 2008, 33, 724–739. [Google Scholar] [CrossRef]
- Lin, B. Structural changes, efficiency improvement and electricity demand forecasting. Econ. Res. J. 2003, 5, 57–65. [Google Scholar]
- He, X.P.; Liu, X.Y.; Lin, Y.P. China’s electricity demand forecast under urbanization process. Econ. Res. J. 2009, 2009, 118–130. [Google Scholar]
- Lin, B.; Xie, C. Estimation on oil demand and oil saving potential of china’s road transport sector. Energy Policy 2013, 61, 472–482. [Google Scholar] [CrossRef]
- Lin, B.; Xu, L. Energy conservation of electrolytic aluminum industry in china. Renew. Sustain. Energy Rev. 2015, 43, 676–686. [Google Scholar] [CrossRef]
- Lin, B.; Xie, X. Energy conservation potential in china’s petroleum refining industry: Evidence and policy implications. Energy Convers. Manag. 2015, 377–386. [Google Scholar] [CrossRef]
- Lin, B.; Yang, L. The potential estimation and factor analysis of China’s energy conservation on thermal power industry. Energy Policy 2013, 62, 354–362. [Google Scholar] [CrossRef]
- Wen, Z.; Meng, F.; Chen, M. Estimates of the potential for energy conservation and CO2 emissions mitigation based on asian-pacific integrated model (aim): The case of the iron and steel industry in china. J. Clean. Prod. 2014, 65, 120–130. [Google Scholar] [CrossRef]
- Dickey, D.A.; Fuller, W.A. Distribution of the estimators for autoregressive time series with a unit root. J. Am. Stat. Assoc. 1979, 74, 427–431. [Google Scholar] [CrossRef]
- Phillips, P.; Perron, P. Testing for a unit root in time series regression. Biometrika 1988, 75, 335–346. [Google Scholar] [CrossRef]
- Kwiatkowski, D.; Phillips, P.C.B.; Schmidt, P.; Shin, Y. Testing the null hypothesis of stationarity against the alternative of a unit root: How sure are we that economic time series have a unit root? J. Econom. 1992, 54, 159–178. [Google Scholar] [CrossRef]
- Elliot, G.; Rothenberg, T.; Stock, J. Efficient tests for an autoregressive unit root. Econometrica 1996, 64, 813–836. [Google Scholar] [CrossRef]
- Ng, S.; Perron, P. Lag length selection and the construction of unit root tests with good size and power. Econometrica 2001, 69, 1519–1554. [Google Scholar] [CrossRef]
- Granger, C.W.J. Investigating causal relations by econometric models and cross-spectral methods. Econometrica 1969, 37, 424–438. [Google Scholar] [CrossRef]
- Diebold, F.X. Elements of Forecasting; Cincinnati: South-Western, OH, USA, 2001. [Google Scholar]
- Norman, G. Economies of scale in the cement industry. J. Ind. Econ. 1979, 10, 317–337. [Google Scholar] [CrossRef]
- Enrico Cagno, A.T. Exploring drivers for energy efficiency within small- and medium-sized enterprises: First evidences from italian manufacturing enterprises. Appl. Energy 2013, 104, 276–285. [Google Scholar] [CrossRef]
- Lin, B.; Wu, Y.; Zhang, L. Estimates of the potential for energy conservation in the chinese steel industry. Energy Policy 2011, 39, 3680–3689. [Google Scholar] [CrossRef]
- Hondroyiannis, G. Estimating residential demand for electricity in greece. Energy Econ. 2004, 26, 319–334. [Google Scholar] [CrossRef]
- Peri, M.; Baldi, L. Vegetable oil market and biofuel policy: An asymmetric cointegration approach. Energy Econ. 2010, 32, 687–693. [Google Scholar] [CrossRef]
- Belloumi, M. Energy consumption and gdp in tunisia: Cointegration and causality analysis. Energy Policy 2009, 37, 2745–2753. [Google Scholar] [CrossRef]
- MacKinnon, J.G.; Haug, A.A.; Michelis, L. Numerical distribution functions of likelihood ratio tests for cointegration. J. Appl. Econom. 1999, 14, 563–577. [Google Scholar] [CrossRef]
- Lin, B.Q.; Wesseh, P.K., Jr. Estimates of inter-fuel substitution possibilities in chinese chemical industry. Energy Econ. 2013, 40, 560–568. [Google Scholar] [CrossRef]
Figure 1.
The Cost Structures of Cement Production.
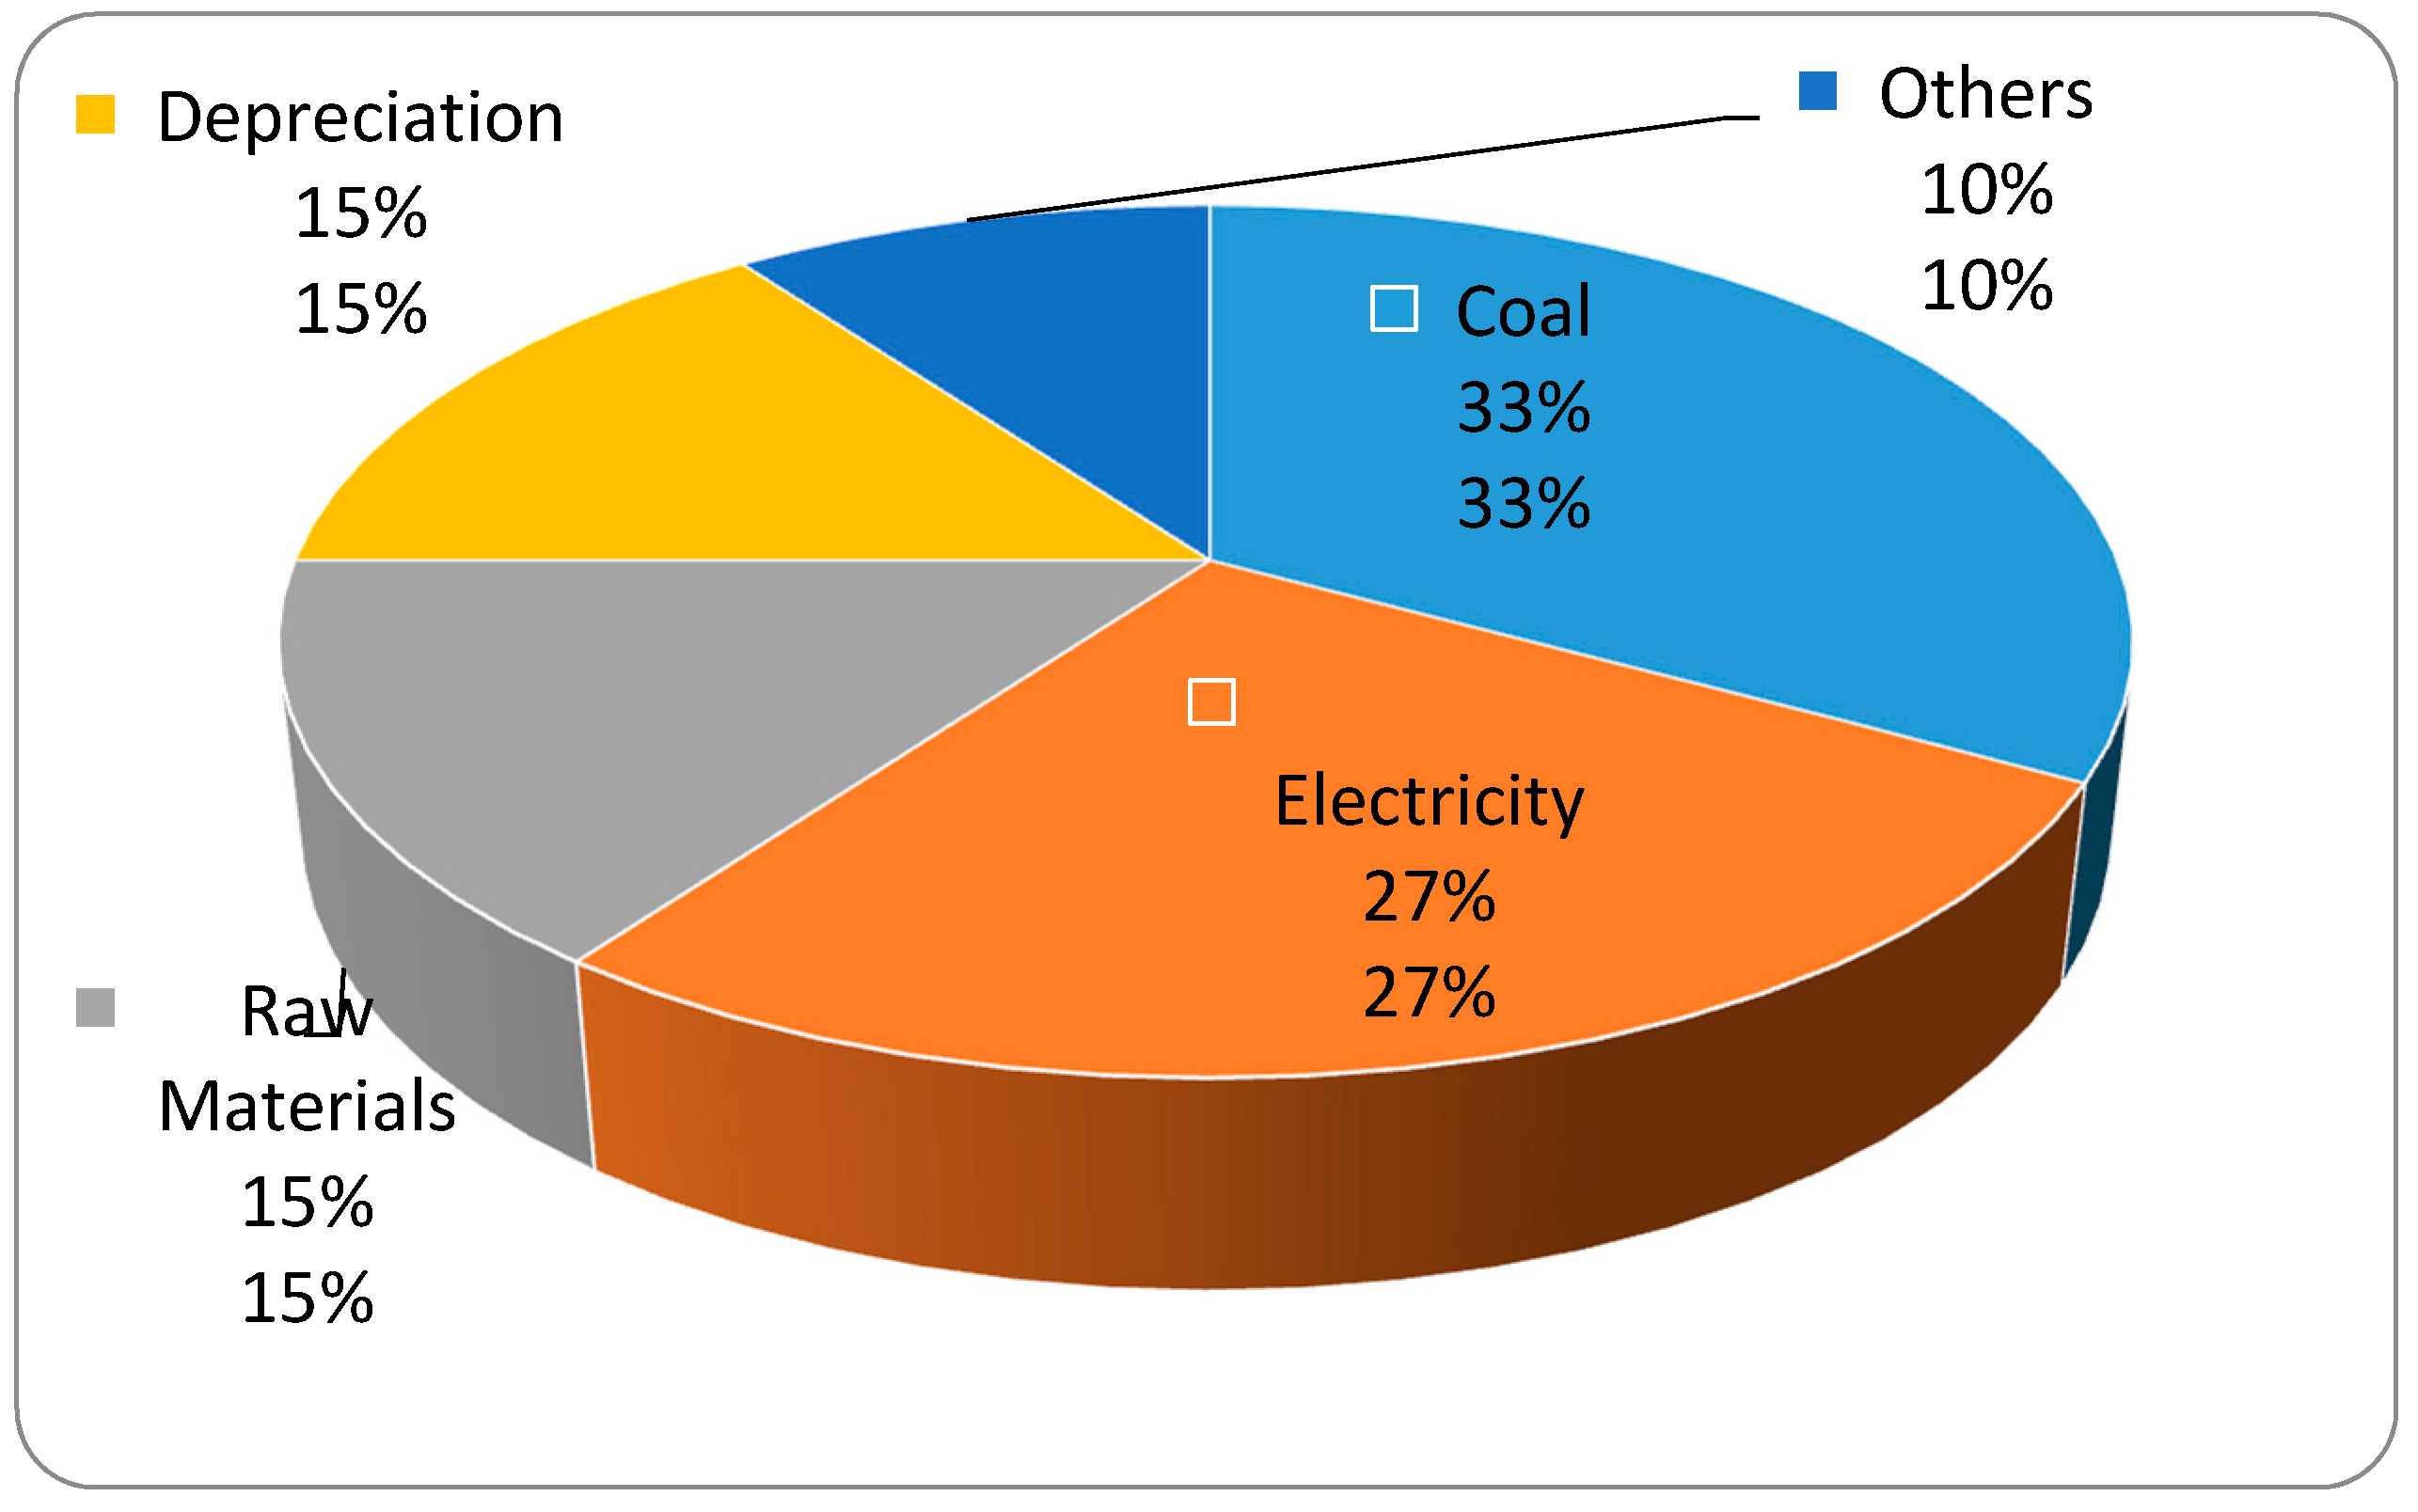
Figure 2.
The Actual Value and Fitting Value of Energy Consumption in China’s Cement Industry.

Figure 3.
The Discrimination Diagram of VECM (Vector Error Correction Model) System Stability.


Table 1.
Data and Variables.
| Variable | Obs | Mean | Std.Dev. | Min | Max |
|---|---|---|---|---|---|
| EC | 35 | 120.91 | 94.90 | 16.49 | 296.96 |
| TVP | 35 | 549.95 | 576.13 | 48.90 | 2217.33 |
| P | 35 | 5.76 | 4.34 | 1.00 | 13.82 |
| EE | 35 | 1.29 | 0.37 | 0.90 | 2.39 |
| LP | 35 | 1.56 | 2.13 | 0.15 | 8.63 |
| IS | 35 | 1.38 | 1.47 | 0.27 | 6.27 |
Table 2.
Granger Test.
| Equation | Excluded | Chi2 | Prob. |
|---|---|---|---|
| lnEC | lnIS | 4.7501 | 0.093 |
| lnEC | lnP | 10.266 | 0.006 |
| lnEC | lnEE | 4.6299 | 0.099 |
| lnEC | lnLP | 4.1125 | 0.043 |
| lnEC | lnTVP | 4.875 | 0.087 |
Table 3.
Unit Root Test.
| Series | ADF | PP | KPSS | |||
|---|---|---|---|---|---|---|
| Without Trend | With Trend | Without Trend | With Trend | Without Trend | With Trend | |
| LnEC | −1.884 | −1.252 | −1.293 | −2.064 | 0.260 | 0.131 * |
| LnIS | −3.034 * | −2.821 | −3.021* | −2.798 | 0.153 | 0.082 |
| LnP | −0.711 | −3.344 * | −0.690 | −2.472 | 0.613 ** | 0.082 |
| LnEE | −1.472 | −1.034 | −1.472 | −1.034 | 0.540 ** | 0.155 ** |
| LnLP | −2.441 | −2.144 | −2.461 | −2.119 | 0.601 ** | 0.130 * |
| LnTVP | 0.128 | −0.863 | −0.025 | −1.086 | 0.347 | 0.119 |
| ΔLnEC | −1.074 *** | −8.233 *** | −5.264 *** | −5.479 *** | −5.264 ** | −5.479 *** |
| ΔLnIS | −4.732 *** | −4.653 *** | −5.102 *** | −4.856 *** | 0.172 * | 0.121 * |
| ΔLnP | −3.505 ** | −3.329 * | −3.615 ** | −3.301 * | 0.126 * | 0.115 * |
| ΔLnEE | −3.815 *** | −4.009 ** | −3.815 ** | −4.009 ** | 0.226 ** | 0.084 ** |
| ΔLnLP | −2.889 * | −3.374 * | −2.889 * | −3.374 * | 0.339 * | 0.107 * |
| ΔLnTVP | −4.782 *** | −4.823 *** | −4.754 *** | −4.778 *** | 0.297 * | 0.134 * |
Note: ***, ** and * denote significant levels at 1%, 5% and 10% respectively.
Table 4.
Various Criteria for Choosing VAR lag Length.
| Lag Length | LogL | LR | FPE | AIC | SC | HQ |
|---|---|---|---|---|---|---|
| 0 | 20.65995 | NA | 1.21 × 10⁻⁷ | −1.739994 | −1.492668 | −1.705891 |
| 1 | 104.5343 | 111.8324 * | 1.99 × 10⁻¹⁰ | −8.281586 | −6.797633 | −8.076969 |
| 2 | 147.2186 | 33.19890 | 6.61 × 10⁻¹¹ * | −10.24651 * | −7.525928 * | −9.871377 * |
Note: * denotes the selected lag length according to the criterion. LR: continuous correction LR test statistics (significant at 5% level); FPE: final prediction error; AIC (Akaike): information criterion; SC (Schwarz): information criterion; HQ (Hannan–Quinn): information criterion.
Table 5.
The Result of the Cointegration Test.
| LnEC | LnIS | LnP | LnEE | LnLP | LnTVP |
|---|---|---|---|---|---|
| 1.000000 | 0.0080926 ** | 0.0115978 ** | 1.025734 *** | −0.0166976 *** | −1.001809 *** |
| (2.19) | (2.34) | (162.97) | (4.89) | (174.48) |
Note: ** and *** indicates the significance at the 5% and 1% level respectively.
Table 6.
Johansen and Juselius Cointegration Test.
| Hypothesized No. of CE(S) | Eigenvalue | Trace Statistic | 0.05 Critical Value | Prob. |
|---|---|---|---|---|
| None * | 0.981628 | 166.3749 | 88.80380 | 0.0000 |
| At most 1 * | 0.898864 | 94.42994 | 63.87610 | 0.0000 |
| At most 2 * | 0.783404 | 53.18679 | 42.91525 | 0.0035 |
| At most 3 | 0.660175 | 25.65178 | 25.87211 | 0.0532 |
| At most 4 | 0.292329 | 6.223959 | 12.51798 | 0.4324 |
Trace test indicates 1 cointegrating equation at the 0.05 level; * denotes rejection of the hypothesis at the 0.05 level [32].
Table 7.
Maximum Eigenvalue Test.
| Hypothesized No. of CE(S) | Eigenvalue | Max-Eigen Statistic | 0.05 Critical Value | Prob. |
|---|---|---|---|---|
| None * | 0.981628 | 71.94501 | 38.33101 | 0.0000 |
| At most 1 * | 0.898864 | 41.24315 | 32.11832 | 0.0029 |
| At most 2 * | 0.783404 | 27.53502 | 25.82321 | 0.0295 |
| At most 3 * | 0.660175 | 19.42782 | 19.38704 | 0.0493 |
| At most 4 | 0.292329 | 6.223959 | 12.51798 | 0.4324 |
Trace test indicates 1 cointegrating equation at the 0.05 level; * denotes rejection of the hypothesis at the 0.05 level [32].
Table 8.
The Scenarios on Energy Consumption of China’s Cement Industry.
| Variables | Historical Scenario | Medium Energy-Saving Scenario | High Energy-Saving Scenario |
|---|---|---|---|
| TVP | 14.84% | 13.42% | 12% |
| P | 1.19% | 1.60% | 2% |
| EE | 12.06% | 13.03% | 14% |
| LP | 22.97% | 23.99% | 25% |
| IS | 25.36% | 26.68% | 28% |
Table 9.
The Forecast on Energy Consumption in China’s Cement Industry (unit: ten thousand tons of standard coal).
Table 9.
The Forecast on Energy Consumption in China’s Cement Industry (unit: ten thousand tons of standard coal).
| Year | Historical Scenario | Medium Energy-Saving Scenario | High Energy-Saving Scenario |
|---|---|---|---|
| 2020 | 30,922 | 28,565 | 26,507 |
| 2030 | 34,035 | 27,549 | 22,569 |
© 2017 by the authors. Licensee MDPI, Basel, Switzerland. This article is an open access article distributed under the terms and conditions of the Creative Commons Attribution (CC BY) license (http://creativecommons.org/licenses/by/4.0/).
Share and Cite
MDPI and ACS Style
Lin, B.; Zhang, Z.; Ge, F. Energy Conservation in China’s Cement Industry. Sustainability 2017, 9, 668. https://doi.org/10.3390/su9040668
AMA Style
Lin B, Zhang Z, Ge F. Energy Conservation in China’s Cement Industry. Sustainability. 2017; 9(4):668. https://doi.org/10.3390/su9040668
Chicago/Turabian StyleLin, Boqiang, Zihan Zhang, and Fei Ge. 2017. "Energy Conservation in China’s Cement Industry" Sustainability 9, no. 4: 668. https://doi.org/10.3390/su9040668
Note that from the first issue of 2016, this journal uses article numbers instead of page numbers. See further details here.