Article

Household Livelihood Strategies and Implication for Poverty Reduction in Rural Areas of Central Nepal

1
Institute of Mountain Hazard and Environment, Chinese Academy of Sciences, Chengdu 610041, China
2
University of Chinese Academy of Sciences, Beijing 100049, China
3
Local Initiatives for Biodiversity, Research and Development (LI-BIRD), Gairapatan-4, Pokhara Post Box No. 324, Nepal
4
Chengdu Institute of Biology, Chinese Academy of Sciences, Chengdu 610041, China
*
Author to whom correspondence should be addressed.
Sustainability 2017, 9(4), 612; https://doi.org/10.3390/su9040612
Submission received: 1 March 2017 / Revised: 11 April 2017 / Accepted: 13 April 2017 / Published: 14 April 2017

Abstract

:
Understanding household livelihood strategies is pivotal to minimize rural poverty in the least developed countries like Nepal. This study is an attempt to assess livelihood strategies pursued by rural households, investigate the most remunerative strategy, and identify the factors that influence a household’s choice of better strategies in rural Nepal. Primary data collected in 453 households from three villages of central Nepal are analyzed quantitatively within a sustainable livelihood framework. This study categorized households into five main livelihood strategy groups. The results showed that the majority (61%) of the households diversified their income to non-farm sources. Livelihood diversification to business/enterprise strategies adopted by 16% of the households is the most remunerative strategy followed by commercial farming that includes 13% of the sample and are more relevant to poverty reduction. Land holding, education, agriculture and skill training, access to credit, and proximity to the road and market center are the major influencing factors on the adoption of higher returning livelihood strategies. Stimulating poor households to follow market-oriented farm and non-farm activities by improving access to education, vocational training, rural credit, and rural infrastructures is momentous for reducing poverty in the rural areas of central Nepal.

1. Introduction

Rural households combine a diverse set of income generating and social activities and construct a portfolio of livelihood activities to meet and, if possible, to enhance better livelihood outcomes [1]. Almost two-thirds of the world’s poor people reside in the rural areas of low-income countries, mainly depending on subsistence farming and other natural resources for their livelihood [2]. However, low productivity in farming and limited accessibility to non-farm income sources have been increasing vulnerability of these people who are often poor and deprived with a minimum standard of life [3,4]. Although poverty is a multi-dimensional issue, it is directly associated with a household’s income, asset holding, and other economic activities that mutually generate a household’s livelihood strategy and outcomes [5]. Hence, it is important to underpin the underlying mechanism related to rural poor’s livelihood strategies in order to achieve the international goal of poverty reduction [3].
To understand the poverty-livelihood nexus in rural areas of developing countries, several scholars have studied household livelihood strategies through different approaches, given different terminologies, and assessed their relevance to poverty reduction [6,7,8,9,10,11,12,13]. They have classified household livelihood strategies based either on income quartiles [14], households’ asset ownership [15,16], major livelihood activities [17], or on income composition [7,18,19]. Studies centered on the welfare outcome of a household’s livelihood strategies have consistently found a positive relationship between livelihood diversification to the non-farm sector and poverty reduction [11,14,16,20,21]. There is also increasing evidence of the contribution of business or rural enterprises and commercial farming for minimizing rural poverty [7,10,12]. A number of authors have explored the influencing factors on the choice of a household’s livelihood strategies [8,18,22,23]. The overall conclusion is that households’ livelihood strategy choices mainly depend on differential access to and control over five type of livelihood capital/assets. In addition, a significant influence of the location factor including geographical location and distance to key facilities (such as road, market) in the choice of livelihood strategy has been further emphasized in some studies [7,12,24].
Nepal is a mountainous country, where approximately 77% of its area is covered by mountains and hills making it difficult to construct infrastructure and basic facilities [25]. This has caused about 80% of the total population to be concentrated in rural areas where the majority of them depend on subsistence farming for their livelihood [26]. However, fairly small parcels of per capita arable land holding (average of 0.9 ha in 2010 as per World Bank 2016), high dependence on agriculture, declining farm productivity, and limited access to non-farm income have triggered severe poverty in the rural areas of mountains and hills in Nepal [25]. As in other developing countries, rural areas in Nepal are also undergoing rapid socio-economic and environmental transitions in recent years which has brought newer opportunities and challenges for rural livelihoods [27,28]. Resultantly, rural households are trying to broaden their household economy either to survive or to generate additional income to secure livelihood [29,30]. This change, however, has resulted in commendable progress in reducing overall poverty from 42% in 2004 to 25% in 2011, but with very low progress in the rural areas of hills and mountains in Nepal [26]. Recent empirical studies also have indicated that the livelihood security of smallholder farmers in Nepal is in a vulnerable condition [29,31,32]. Therefore, the goal of reducing poverty and improving a household’s livelihood in rural Nepal has remained a challenging task. A clear understanding of livelihood strategy, outcome, and their impact factors is indispensable to unraveling the bottleneck of poverty and to formulate an effective anti-poverty program in Nepal. However, the status of household livelihood strategies, their underlying determinants, and welfare outcomes have been seldom studied in Nepal. Therefore, using data from a detailed household survey from three Village Development Committee (VDC) located along an elevation gradient of central Nepal, this paper aims to: (1) assess livelihood strategies adopted by rural households, (2) identify higher returning livelihood strategies and their relevance to poverty reduction and (3) explore the determinants of households’ choice of better livelihood strategies. Identification of distinct groups of households with similar livelihood strategies, their relevance to poverty reduction, and the underlying factors influencing the choice of the most lucrative livelihood strategy may have greater policy implications in formulating and implementing more effective actions targeted at alleviating poverty and improving rural livelihood.

2. Methods

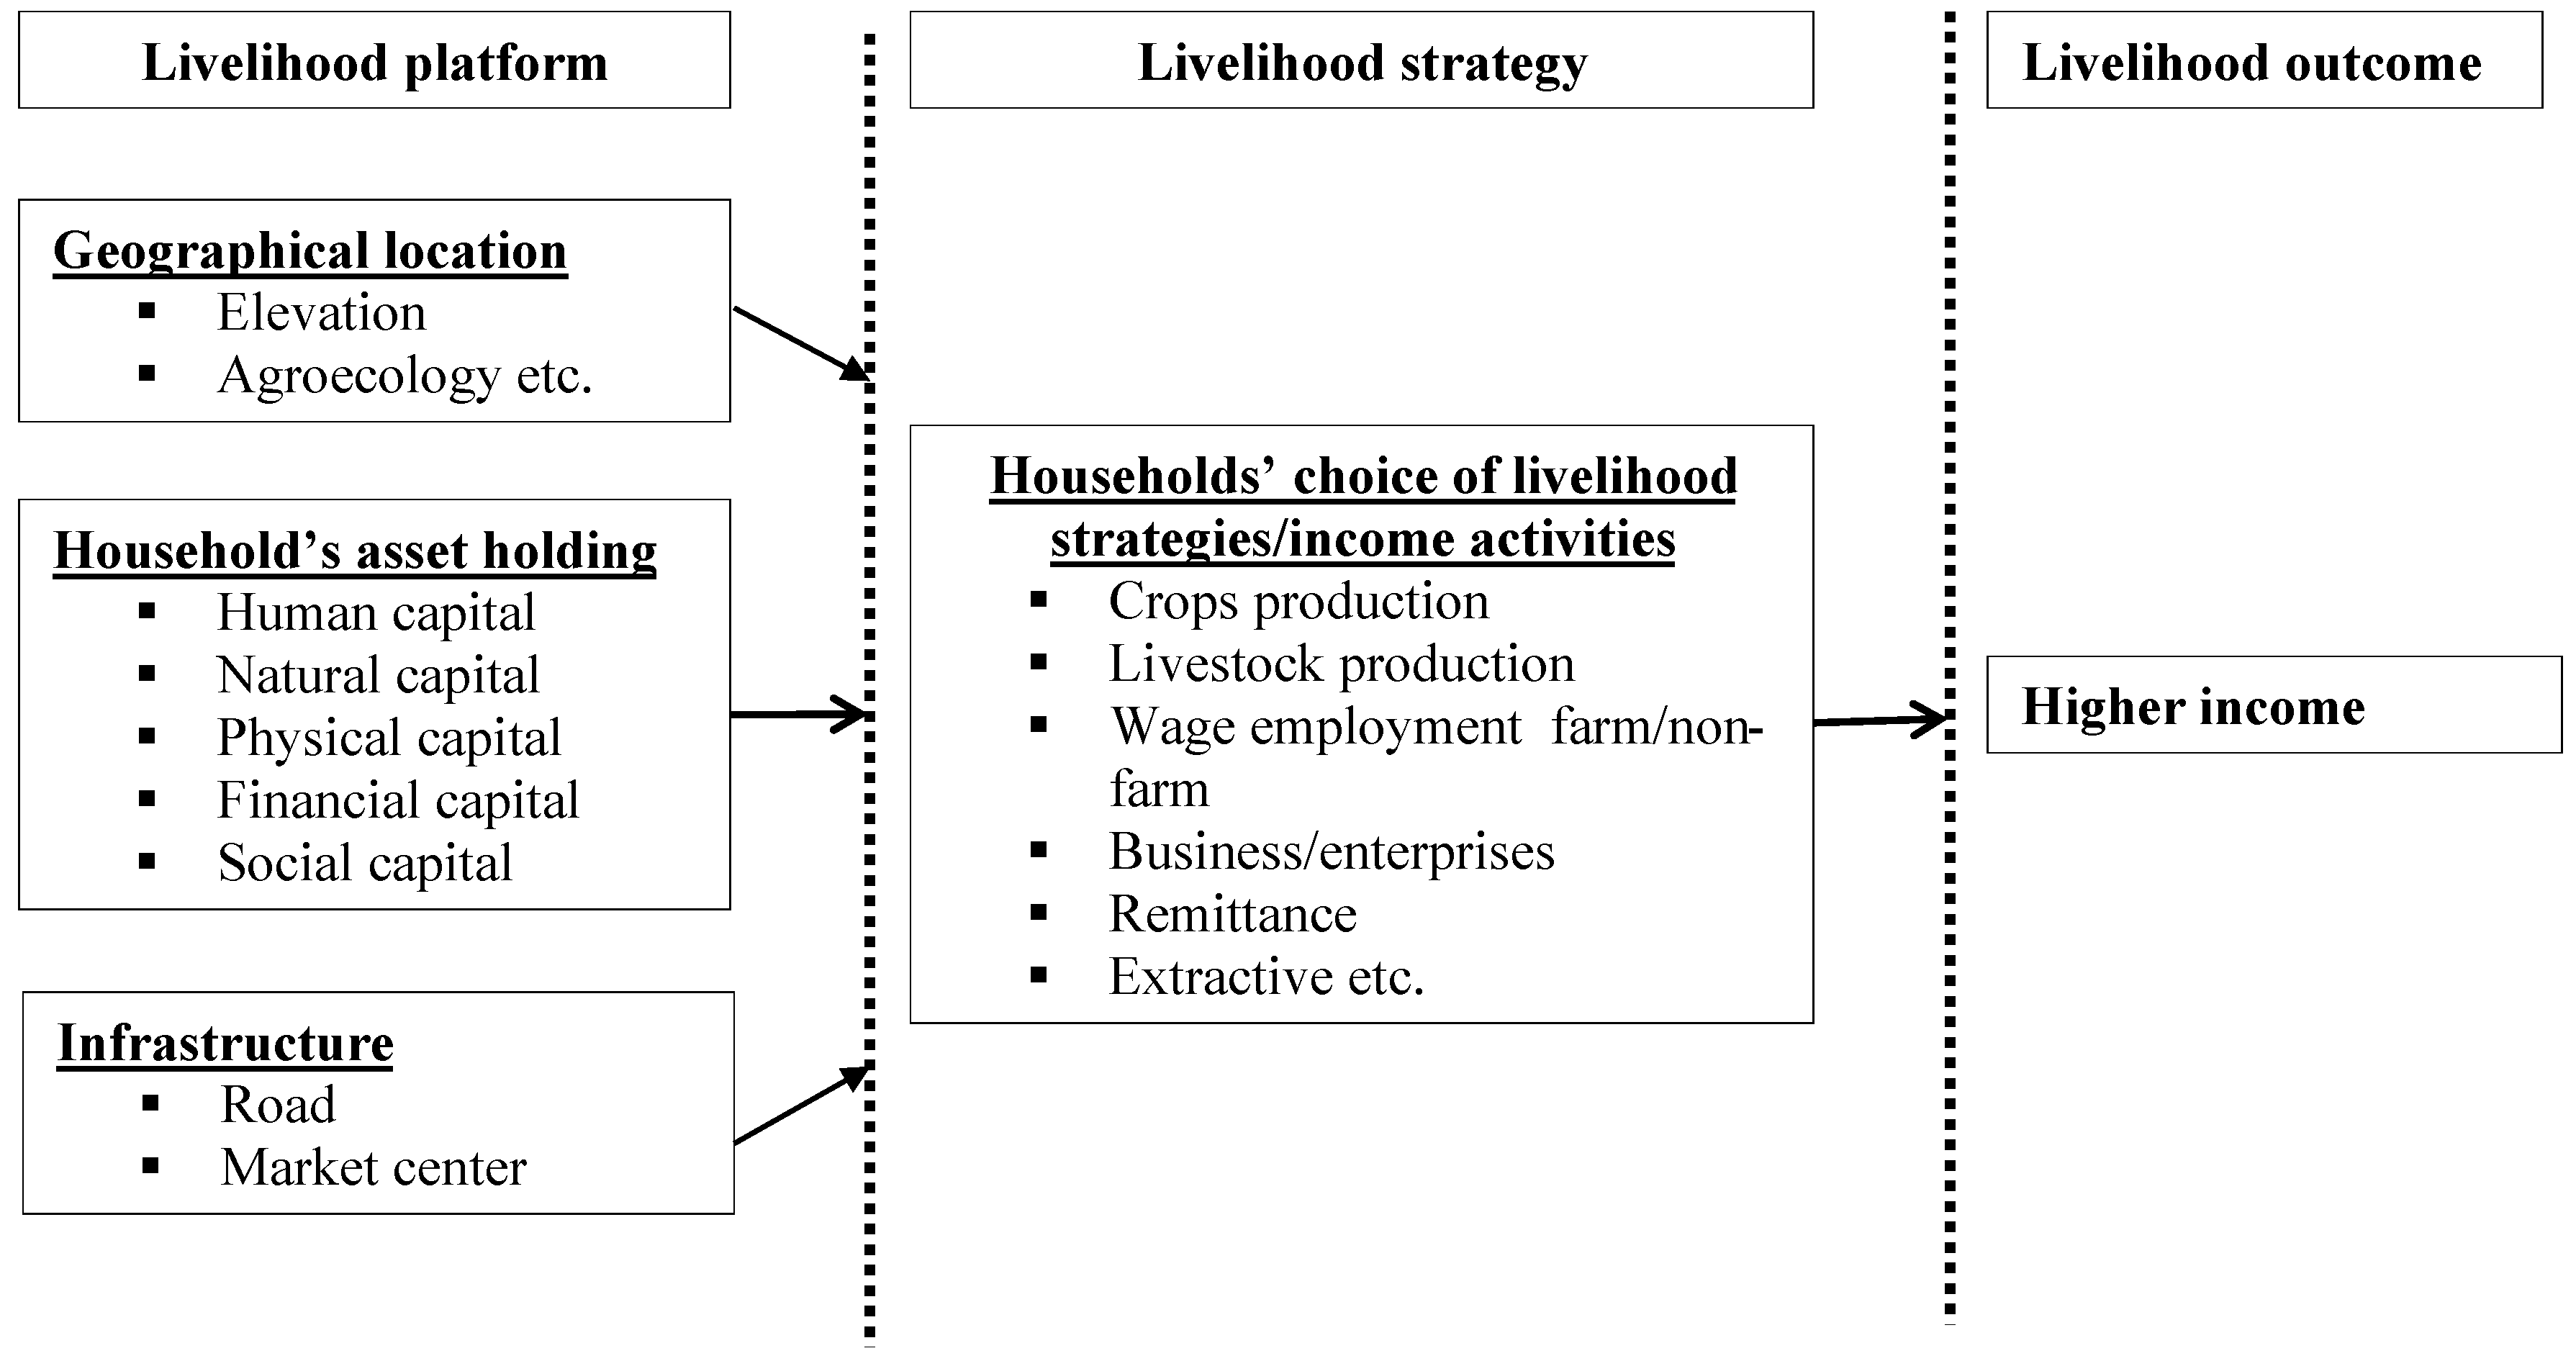
2.1. Livelihood Concept and Analysis Framework
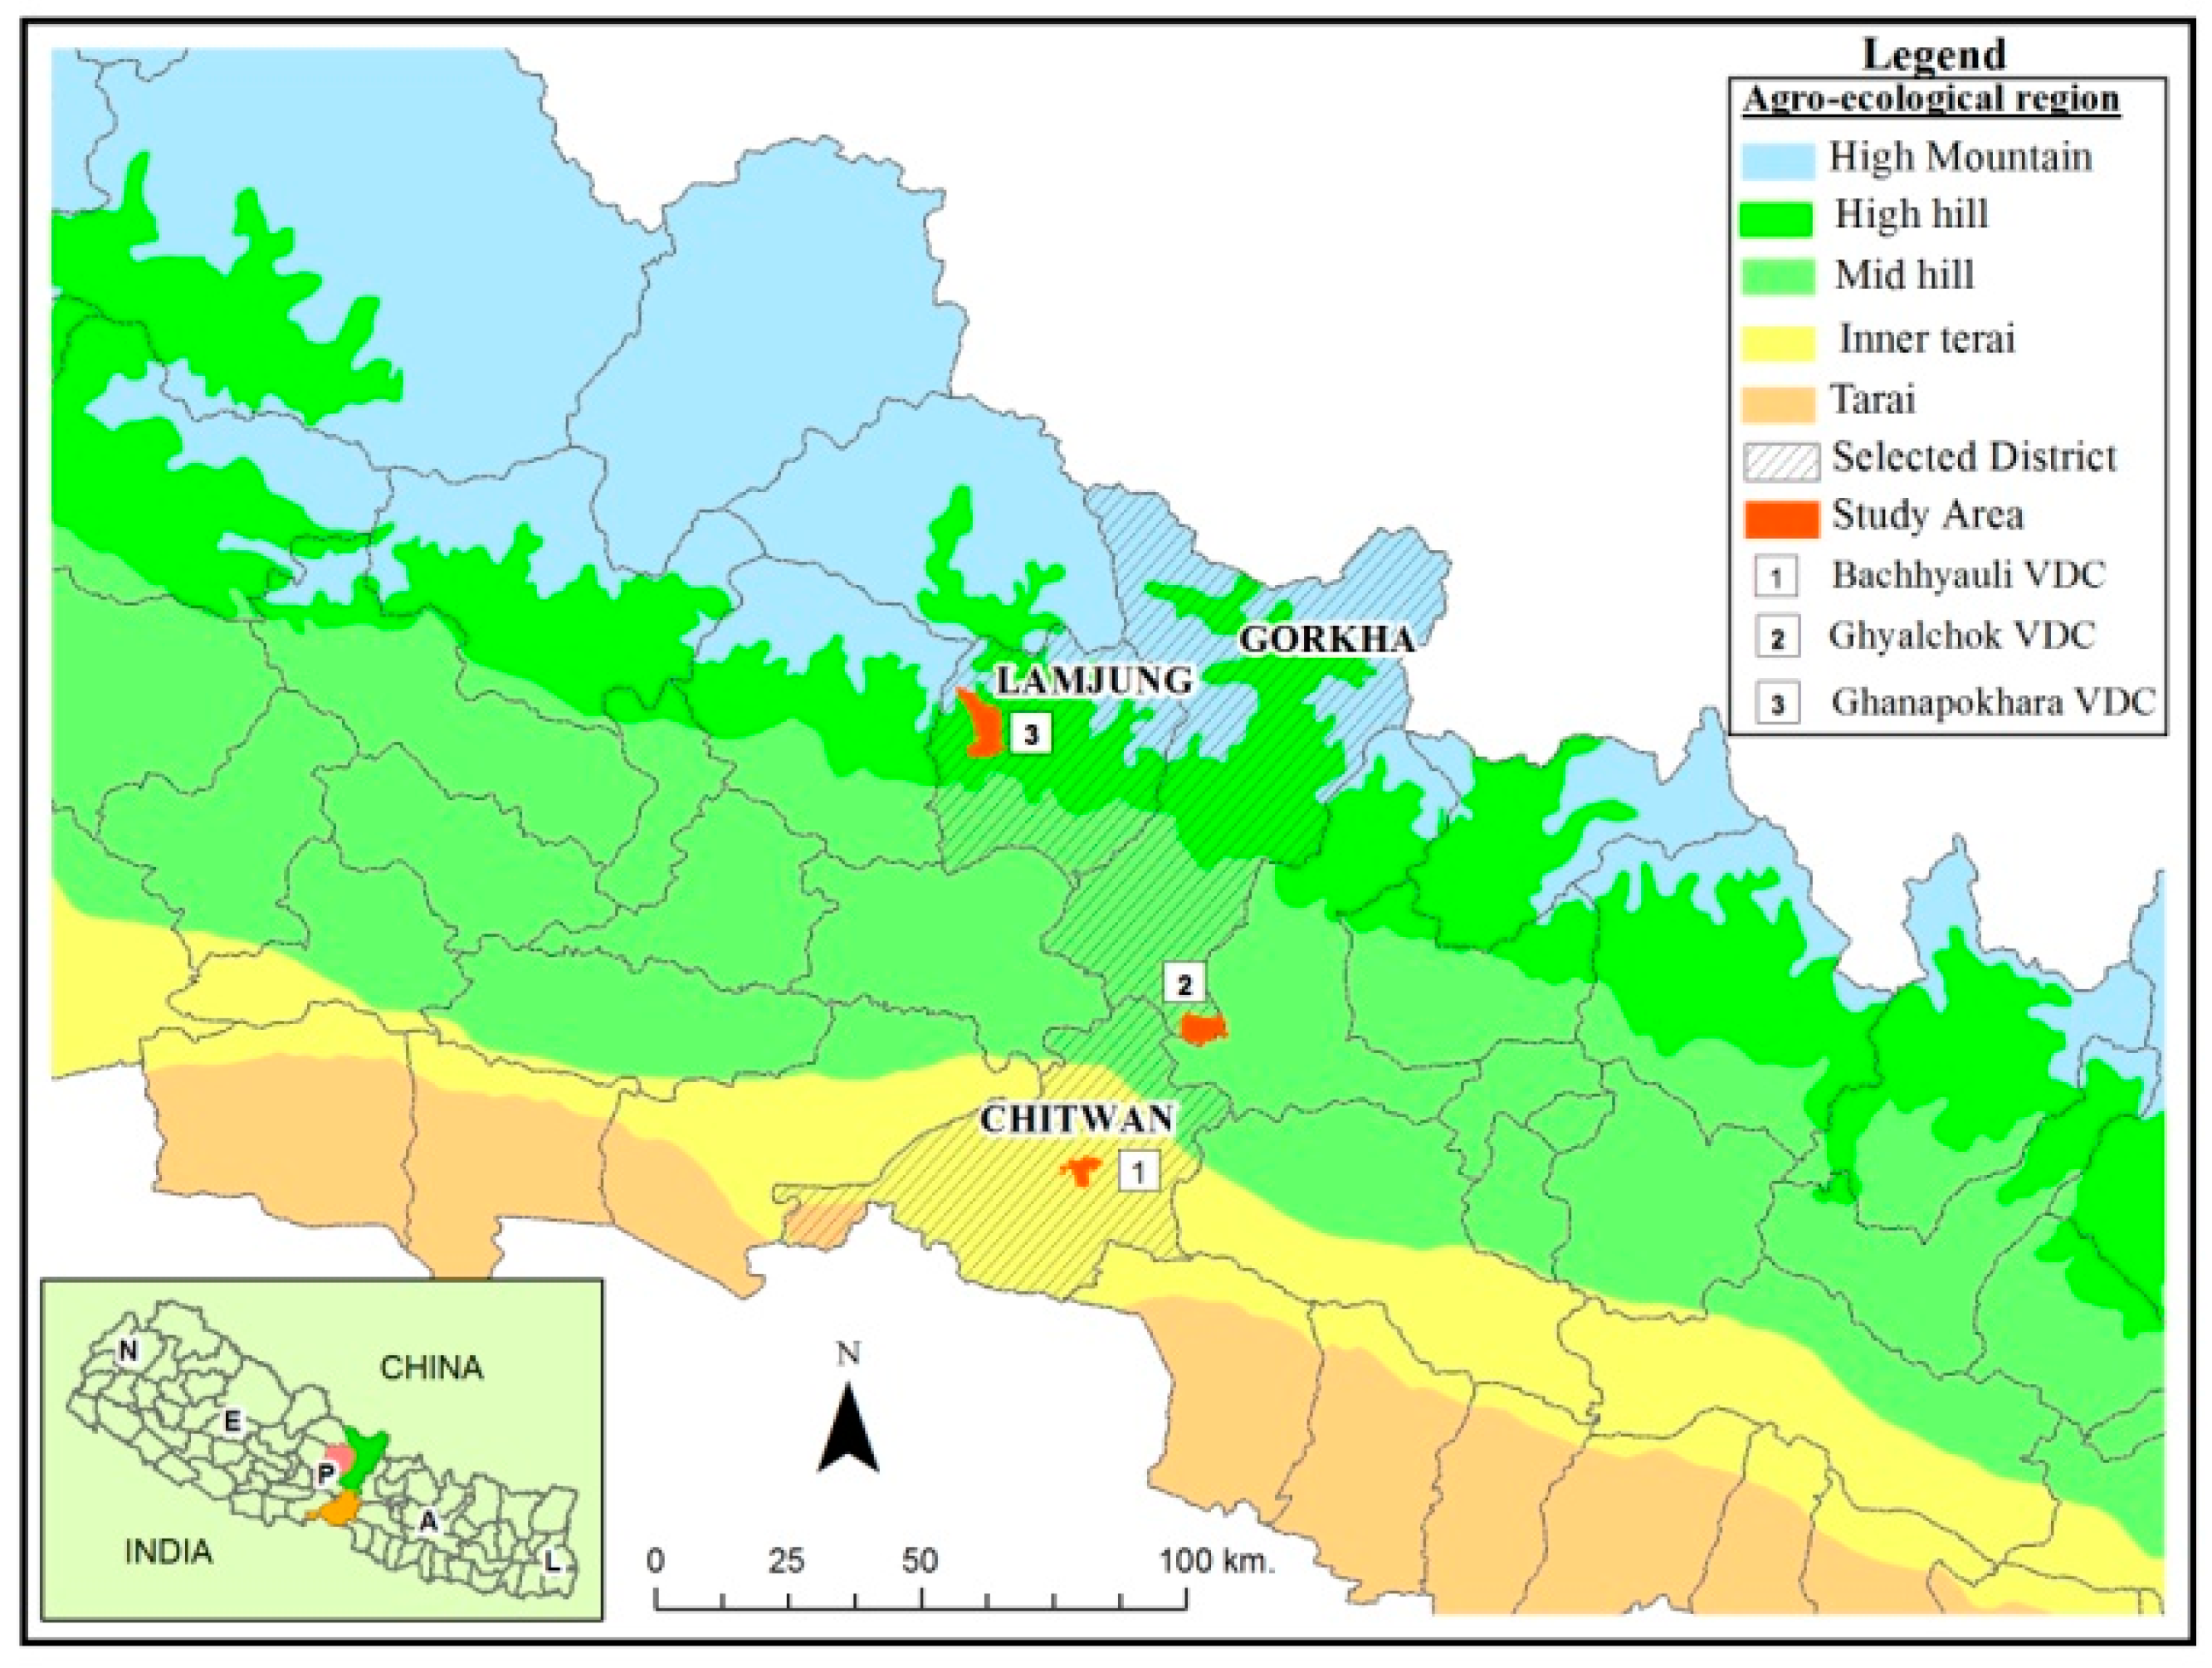
Livelihood can be defined as the capabilities, assets (tangible and intangible), and activities required in order to make a living [33]. It will be sustainable and resilient when it can cope with and recover from shocks and stress, and maintain or enhance its capabilities and assets, including the natural resource base both currently and in the future [33,34]. To comprehend whether poor people’s livelihood is sustainable or not, the Sustainable Livelihood Analysis Frameworks (SLF) have been proposed [34,35,36]. Several studies related to rural livelihood have used SLF [14,16,17,19,23,29]. SLF encompasses five interacting elements namely; vulnerability context, asset pentagon, mediating factors, livelihood strategy, and outcomes that jointly create the livelihood of poor people [34]. However, this study used SLF with a particular focus on three aspects of the framework: livelihood asset, livelihood strategy, and outcome (Figure 1).
SLF highlights five types of livelihood assets namely human, physical, financial, natural, and social capital [22,34,38]. Households combine these assets together with activities and choices and construct a portfolio of activities (such as agriculture, migration, livelihood diversification, etc.) to achieve their livelihood goals which can be defined as livelihood strategies [34,35]. As in Tesfaye’s [24] and Soltani’s [7] studies, we defined household livelihood strategy as a combination of income activities. Since a household’s choice of a particular livelihood strategy is conditioned by its asset holding and external factors such as location [12,36,37], we also used a household’s asset holding, geographical location (such as elevation and agroecology), and infrastructure (proximity to road and market center) as conditioning factors. Livelihood outcomes are the gains from livelihood strategies (such as income, food security, and environmental sustainability) pursued and vary across strategies and households [6,35]. We considered higher income as an indicator of welfare outcome for this study.

2.2. Study Area

This study was carried out in three districts of Chitwan-Annapurna Landscape (CHAL) in central Nepal. Village Development Committees (VDCs) and Municipalities are the lowest administrative unit in Nepal. Three (VDCs) namely Bachhauli, Ghyalchok, and Ghanapokhra from the Chitwan, Gorkha, and Lamjung districts, respectively, were selected for the case study (Figure 2). The study areas stretch from 190 to 2700 m above sea level (hereafter m) and from the sub-tropical to cool temperate climatic zone representing three different agroecological regions (inner terai, mid hill, and high hill) of Nepal [39,40]. Smallholder subsistence farming with a mixed crop-livestock production system is a common source of livelihood, but the level of agricultural dependency and its importance to overall household income varies across the area. Besides agriculture, salaried jobs, tourism related business, outmigration for non-farm jobs, and wage labour are the major sources of household income within the area [40,41]. However, distinct bio-physical, socio-economic, and infrastructure situations along an elevation gradient create varying levels of opportunities and constraints for different livelihood activities. Three VDCs with distinct geographic, physiographic, and socio-economic characteristics were selected to capture as much livelihood heterogeneity as possible that prevails in the rural areas of central Nepal.

2.3. Data and Sampling

Data for this study was obtained through a household survey conducted from November to December 2015. The questionnaire survey was followed by a series of informal interviews and formal preliminary group discussions. Firstly, we carried out several informal key informant interviews with the local farmers in each VDC. Secondly, we organized three focus group discussions (FGDs) (one in each VDC) with 15–20 participants in each group and 12 key informant surveys (four in each VDC) to get village level information on the diverse aspects of livelihood such as context, livelihood opportunity constraints, and infrastructure development. The representatives for FGDs included old farmers, local leaders, VDC officers, and Non-governmental Organization (NGO) workers. Similarly, old farmers, local shopkeepers, local teachers, and VDC officers were selected as key informants for the interview. The main purpose of the discussions was to better understand the livelihood context and to obtain supplementary information. Then, a total of 15 questionnaires (five in each VDC) were pre-tested in order to examine the appropriateness of a predesigned set of questionnaires in the selected VDCs. Finally, the household survey was directed following multi-stage random sampling. Four out of the nine wards in Bachhauli and Ghanapokhara and five out of the nine wards in Ghyalchok were purposively selected for the study based on elevation, ethnic composition, and the socio-economic and infrastructure situation. The sample households were then randomly selected by a computer generated random number. Altogether 453 households were surveyed, which consists of 217 from Bachhauli, 133 from Ghyalchok, and 103 from Ghanapokhra. These numbers account for about 10% of the households in each sampled village. The household survey collected detailed information on a household’s geographical location with key socio-economic elements such as household demographic characteristics, education, asset holdings, occupations, income and expenditure, production and sale of crop and livestock products, and membership in formal or informal organizations and participation in agricultural and other income generating training.

2.4. Data Analysis

2.4.1. Income Source and Income Accounting

This study categorized more than 25 sub-categories of income sources into eight major categories i.e., food crop income, cash crop income, livestock income, non-farm salary/wage income, farm wage income, remittance income, business/enterprise income, and other income. All the income used in this study was net income estimated by subtracting the gross value of all purchased inputs for each activity from the gross income. Similar to Babulo’s [18] study, this study used a household’s self-reported values of market prices for estimating income and production expenditure. We excluded the amount of household consumption income and the cost of family labour in calculating the production cost as in previous studies [17,24,42]. Despite home consumption contributing to a large proportion of the total household’s income [43], we aimed to identify livelihood strategies capable of reducing absolute poverty, where cash earning or nominal income is considered as the suitable proxy [44]. Besides, calculating actual labour time and costs for family farm labour (shadow wage) involves several inaccuracies including the hours of family members who work partially in the farm (e.g., elderly people, school going children) which constitutes a large portion of the family labor [45,46]. In addition, the opportunity cost of this labor is very low due to the lack of alternative employment opportunities. If we use the market wage rate for calculation, the family labour cost would constitute a large proportion of the total cost. Inclusion of consumption income without the family labour cost would result in high error in the net income calculation. Therefore, we excluded the value of home consumption as in earlier studies [17,42]. Following the aggregation of the total annual household income, daily per capita income was calculated by dividing the sum of the nominal household income by the household size and was converted to a daily measure by diving by 365. Later the per capita income was converted to US dollar (106.8 NRP = 1 US$, exchange rate as per the Nepal Rastra Bank on 29 September 2016).

2.4.2. Determining Livelihood Strategy Cluster

Clustering households into distinct livelihood strategy groups employing sectoral income share through cluster analysis has become the dominant approach in livelihood studies [7,17,24]. Categorizing households with similar income earning characteristics into a mutually exclusive group enables policy makers to design and implement more effective programmes for the targeted group [7,17]. Therefore, this study used Principle Component Analysis (PCA) followed by cluster analysis to categorize households into distinct livelihood strategy groups based on the percentage contribution of individual income to the total household income.
Similar to the previous studies by Tesfaye [24] and Soltani [7], PCA was applied using eight major income sources as input variables. Then, the first principal components factors loaded from Varimax rotation (with Eigen values greater than 1) were used as inputs into the hierarchical cluster analysis followed by K-means cluster analysis. Hierarchical cluster analysis followed by the Ward method classified a total of 453 observations into five clusters. As suggested by Hair [47], k-means cluster analysis was applied in order to correct the possible misclassification of observations at the boundaries between the clusters which regrouped our sampled households into five clearly defined clusters. Finally, the cluster membership of each household obtained from the k-means cluster analysis was used as household livelihood strategies. The clusters were named based on the average share of income from each source. One Way Analysis of Variance (ANOVA) followed by post-hoc Tukey’s test was used to test the differences in sectoral income share among strategy groups.
We also calculated and compared the level of income diversification among five livelihood strategy clusters using Simpson’s index [48]. Following the assumption of Ellis [49], three main categories of incomes were considered to determine diversification—on-farm, off-farm, and non-farm income. The household income diversification index was calculated by using the following equation as done by Chilongo [50]:
Diversity   index   =   1 i   =   1 n ( S i ) 2
where Si indicates the share (percentage) of income source i to the total household income and n is the number of households. The index ranges from 0 to 1 where 0 refers to no diversification and 1 refers to highest diversification.

2.4.3. Identifying a Higher Returning Livelihood Strategy

To evaluate the most remunerative livelihood strategy, the welfare outcome was chosen. Several previous studies have used either per capita income [10], household consumption expenditure [21], or mean total income [9] as a proxy to evaluate welfare. This study has compared the mean per capita income as an indicator of the welfare outcome considering that mean per capita daily income mirrors the expected outcome of a chosen strategy [9,10]. One way ANOVA and pairwise comparisons were used to test the apparent differences the in per capita income outcome of five livelihood strategies identified from the cluster analysis. The per capita daily income of five strategies was further tested through first order stochastic dominance analysis assuming that first order stochastically dominant strategies have lower cumulative density for every possible income level than the other and reflect greater likelihoods of ensuring higher income [10,51].

2.4.4. Determining Livelihood Strategy Determinants

Multinomial logistic (MNL) regression was used to identify the determinants of household livelihood choices. Five clusters of livelihood strategies identified from the k-means cluster analysis were used as the dependent variables. It was assumed that the livelihood strategy choice is a function of several livelihood platform variables including a household’s demographic characteristics, human capital, natural capital, physical capital, financial capital, social capital, and location and geographical factors. Therefore, understanding the rural background of Nepal and reviewing the relevant literature, a total of 19 asset-based explanatory variables were selected for this study. The selected variables, their definitions, and expected relationships to livelihood strategy choices are summarized in Table 1. Among them, elevation and agroecology were highly correlated (r = 0.97, p < 0.001). To avoid multicollinearity issues, agroecology was excluded in the multivariate regression. All analyses were carried out using SPSS version 21 and Minitab version 17.

3. Results

3.1. Description of Livelihood Strategies (LSs)

This study identified a limited set of livelihood strategies (LSs) through factor and cluster analysis. The results are presented in Table 2 and Table 3. The PCA extracted four principle component factors with eigenvalues greater than 1, explaining 66.25% of the varience (Table 2). The first factor has high positive loading on non-farm salary/wage income and high negative loading on remittance signifying non-farm salary/wage vs. remittance income. The second factor has high positive loadings on commercial crop and livestock income while negative loadings on non-farm wage, remittance, and business/enterprise income which suggests that the households involved in commercially oriented cash crop and livestock production are less likely to be involve in other non-farm income activities. Similarly, there is a high positive loading of self-employed business/enterprise income and a negative loading on remittance and non-farm wages. This signifies that households that earn from self-employed business/enterprise activities are less dependent on remittance income. Finally, the fourth factor has high positive loadings on food crop and livestock income share while high negative loadings on commercial crop, farm and non-farm wage, and remittance income. This further suggests that households that are oriented to cereal crop/livestock production are less likely to depend on other non-farm oriented income.
The five clearly distinct clusters were identified from the K means cluster analysis. The clusters were named based on income distribution characteristics. The mean and standard deviations for the sectoral income shares and pairwise comparison for each income share between every combination of clusters are summarized in Table 3. The results from one-way ANOVA show significant differences in the income shares among clusters with p < 0.001 except for the case of other income with p < 0.01 (Table 3). Furthermore, the result of the pairwise comparisons for each sectoral income share among the five clusters indicates significant differences between at least one pair of clusters. Similarly, the household income diversity index in Table 3 shows a significant difference in the income diversification among clusters with p < 0.001. In addition, the result from the pairwise comparisons shows non-significant difference in income diversification between cluster 5 and cluster 3 which both are primarily associated with farm related strategies.
The first cluster was named as the non-farm wage strategy since 75.2% of the share of the total income was covered by non-farm wage income alone. This cluster represents about one fourth of the total sample and appeared as the second largest cluster. This strategy was commonly adopted to all three case study sites but a relatively higher percentage (32.7) of households in low-land terai sites (Bachhauli VDC) followed this in comparison to mid hill (21.8%) and high hill (14.8%) (Table 4).
Cluster two consists of the households that earned most of their income from self-employed rural enterprise and small business, and on average 63.8% of the total income share in this cluster was accounted for by business/enterprise income. Hence this was termed as the business/enterprise strategy. 15.2% of the sampled households were involved in this cluster. The percentage of households following this strategy is almost equal for all three sites based on the total sample of each site (Table 4).
The third cluster has 68.6% of its income share from market-oriented high-value cash crop and livestock sales (43.8% and 24.8% from cash crop and livestock, respectively) in overall income and thus was named as the commercial farming strategy. Here, commercial farming refers to the diversification of subsistence farming to the production of high-value commodities such as vegetables, fruits, and livestock for commercial purpose rather than producing a single commercial crop. In addition, the household income diversity index in Table 3 showed that this strategy has the second highest (0.31) mean income diversification. This cluster represents 13.2% of the total sample (Table 3). This strategy is dominant in the mid hill study area (Ghyalchok VDC) (Table 4).
Remittance income alone contributes 77.3% of the household’s total income in cluster four. Therefore, it was named as the remittance-oriented strategy. This strategy includes households with relatively high remittance income and with the lowest diversity index (0.16) (Table 3). This is the largest among the five clusters, representing 35.8% of the total sample. This is the most dominant strategy in the high hill site (Ghanapokhara VDC) since 60.2% of the total sample from this site has adopted remittance based activities as their main source of income (Table 4).
Finally, the fifth cluster was named as the diversified subsistence strategy since households in this cluster earned income from more diversified sources than the other four clusters. The major share of total household income in this cluster was covered by food crop income (33.3%), livestock income (34.1%), and non-farm wage income (17.2%) (Table 3). This cluster is the smallest among the five clusters identified for this study, representing only 9.7% of the total sample. The majority of the households in this cluster are located in the low-terai study site and are involved in cereal crops and livestock production (Table 4).

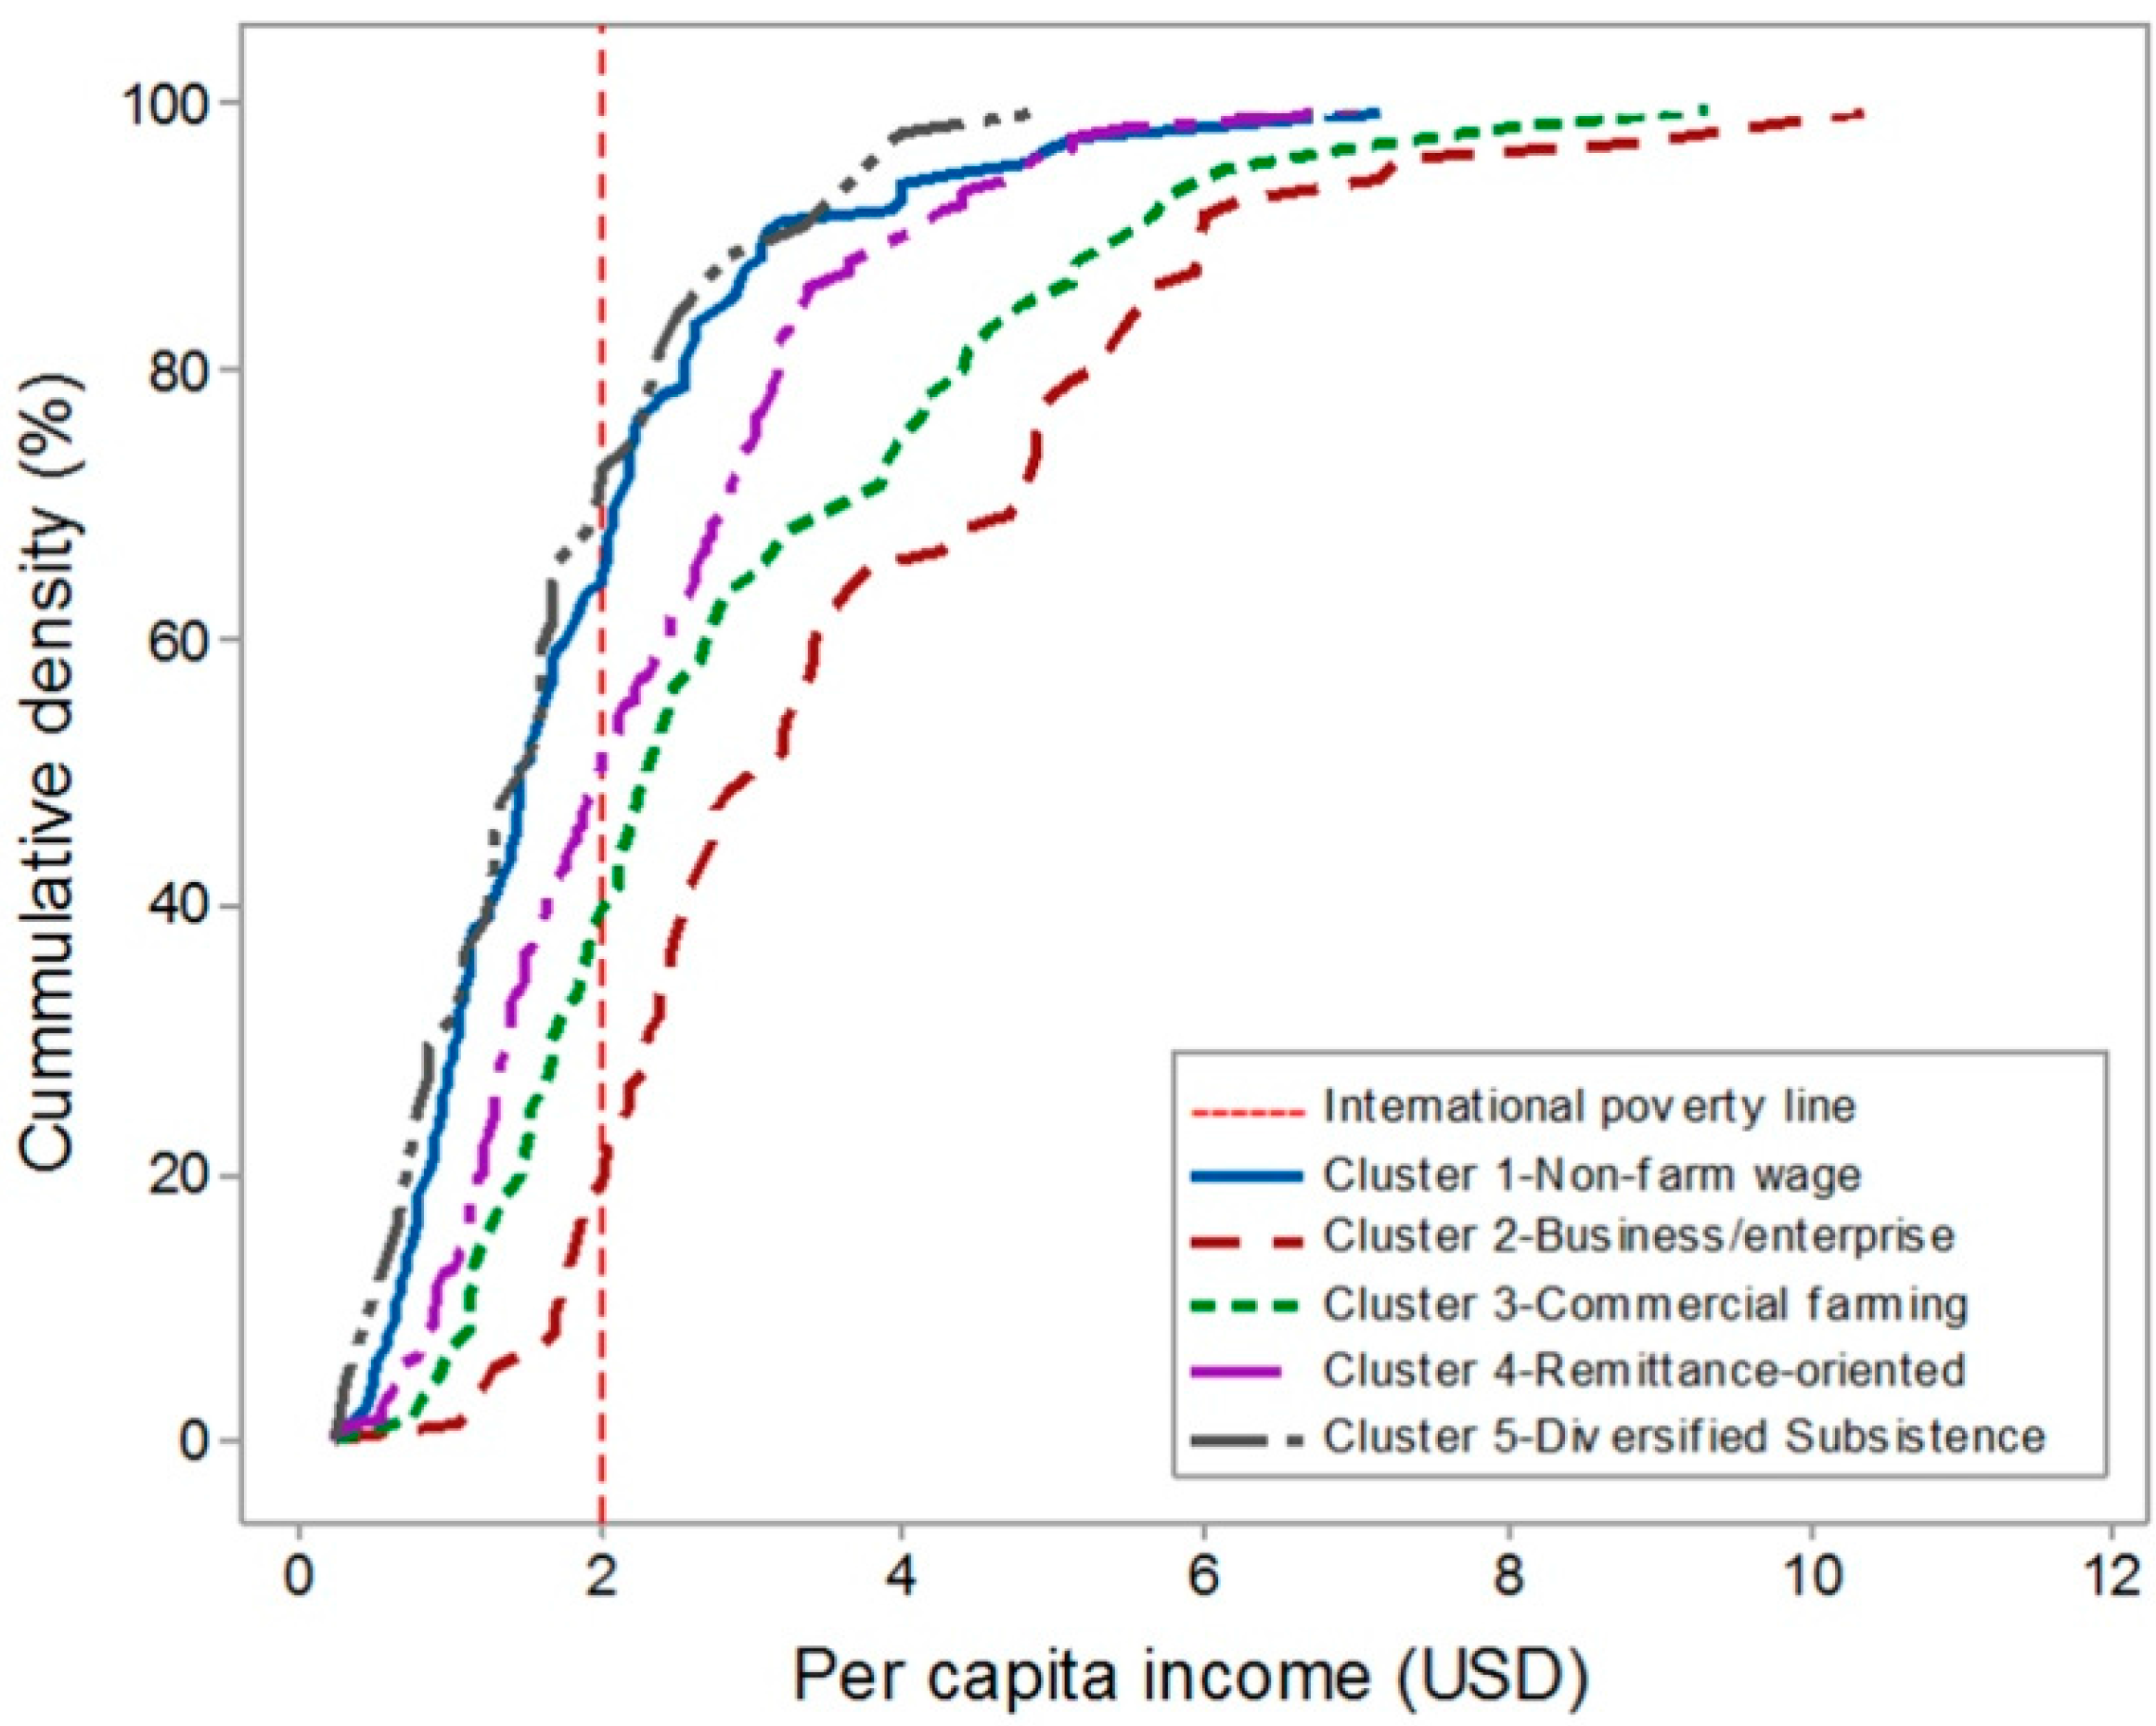
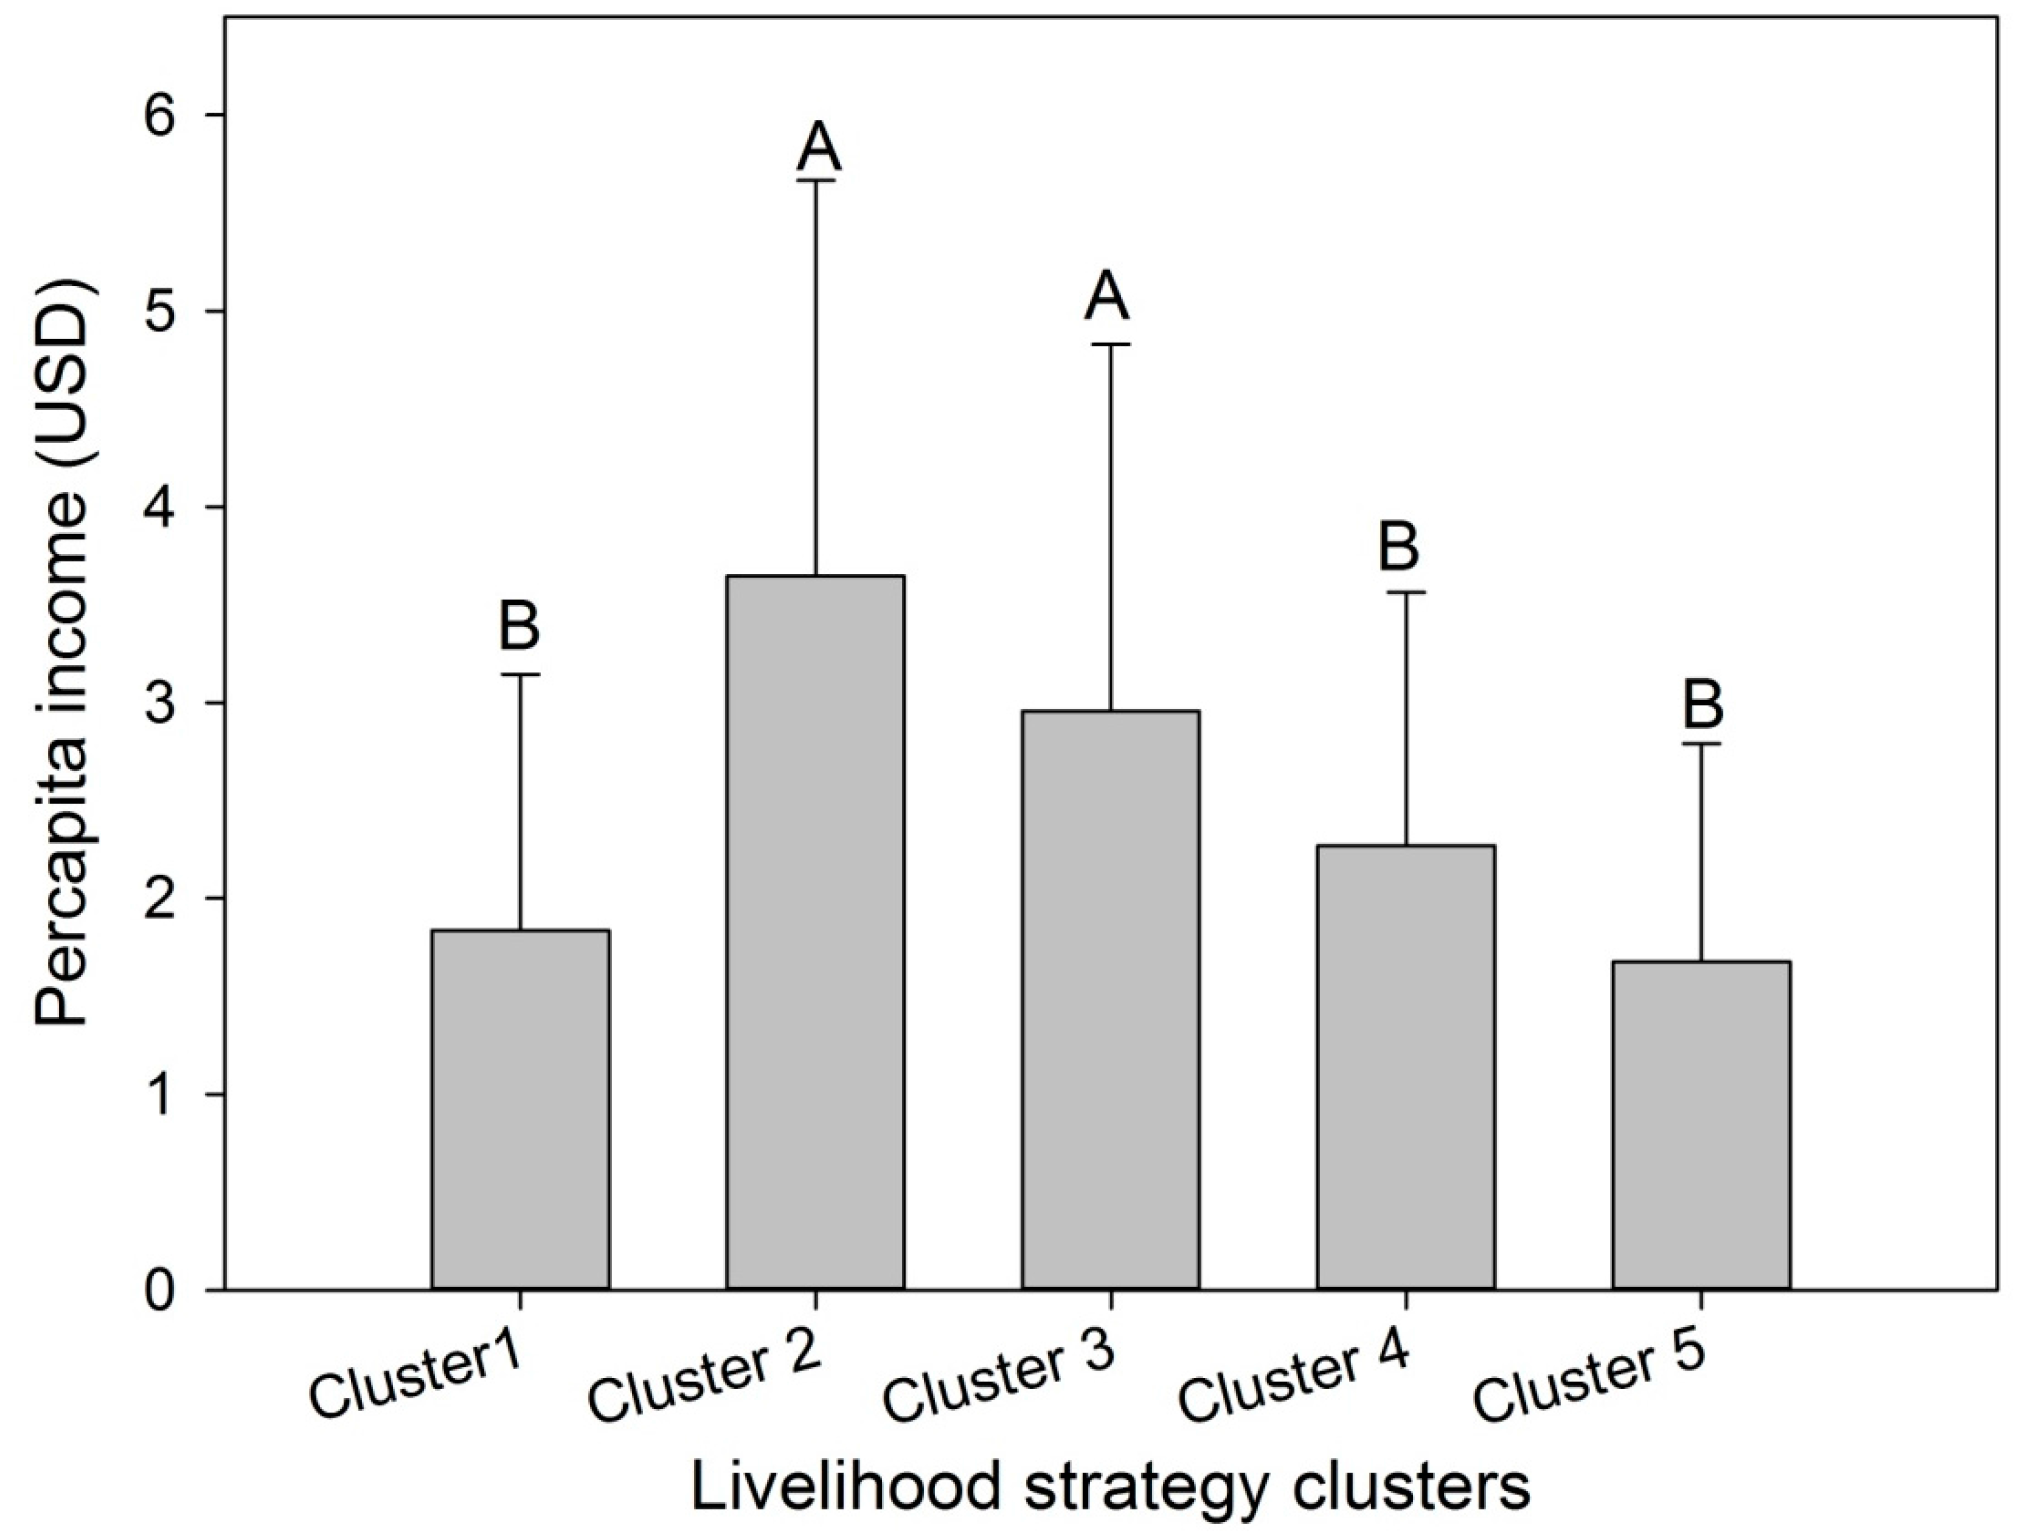
3.2. Which Livelihood Strategy Is Superior?

Daily mean per capita income (DPCI) among the five LS groups ranged greatly from $1.68 for diversified subsistence to $3.65 for business/enterprise LS. The business/enterprise strategy was found to be the most remunerative strategy in terms of the highest ($3.65) mean DPCI outcome followed by commercial farming ($2.96). The result from one-way ANOVA showed significant differences (p = 0.001) in DPCI among the five LS clusters. Furthermore, the result of the pairwise comparison of DPCI among the clusters showed no significant difference between business/enterprise LS and commercial farming LS. However, DPCI of these two LSs differed significantly with the other three clusters (Cluster 1, Cluster 2, and Cluster 5) (Figure 3).
The cumulative density curves (Figure 4) further indicated that the business/enterprise strategy is the most lucrative since it first-order stochastically dominates the other four strategies. Similarly, the commercial farming strategy stochastically dominates the other three strategies and appeared as the second most remunerative strategy. The result has further confirmed that the diversified subsistence LS is the most inferior among the five strategies since it is dominated by the other four strategies with higher DPCI. In addition, less than 18% and 38% of households adopting business/enterprise and commercial farming LS, respectively, were found under the international poverty line (at $2 per day) which was over 71% for the households following the diversified subsistence LS.

3.3. Socio-Economic Characteristics of Households by the Five Livelihood Strategy (LS) Clusters

The summary statistics of the nominal explanatory variables according to the five LSs clusters showed that ethnicity, agricultural skill-development training, and access to credit are significantly different among the households in the four LSs group with p < 0.001, except for membership in organization with p < 0.01. However, there are no significant differences in the sex of the household head across the five strategies (Supplementary Table S1). Similarly, the summary statistic results of the continuous explanatory variables showed significant differences in the education years of the household head, total land holding, and distance from the home to the nearest market center at p < 0.001, whereas it showed the age of the household head, average age of family members, a household’s fixed assets value, average distance from home to the nearest road, and elevation at p < 0.01. However, there are no significant differences in the average number of a household’s working age members and households’ expenditure per year among the five livelihood strategy clusters (Supplementary Table S2).

3.4. Determinants of Livelihood Strategy

Multinomial logistic regression (MNL) was applied with a diversified subsistence strategy as a reference category in order to assess the effects of each predictor variables on the likelihood of a specific livelihood strategy choice relative to diversified subsistence. The results of the MNL regression are presented in Table 5. The results showed a positive and significant impact of male headed households (β = 0.923, p = 0.01), average education (β = 0.20, p = 0.01), working age family members (β = 0.088, p = 0.01) and elevation (β = 0.0.005, p = 0.001) in choosing a non-farm wage strategy against diversified subsistence. On the contrary, there were significant negative influences of the size of land holding (β = −1.963, p = 0.001), value of livestock assets (β = −0.013, p = 0.001), distance from home to road (β = −1.714, p = 0.001), and distance from home to market center (β = −0.069, p = 0.05). However, no significant influence of age and education of the HH head, skill-development training, membership in organizations, and ethnicity on the choice of non-farm wage LS were found.
Similarly, households headed by more educated head (β = 0.214, p = 0.001), having member with skilled development training (β = 1.68, p = 0.001), having more access to credit (β = 1.321, p = 0.001), no member with agricultural training (−1.216, p = 0.05), smaller size of land holding (β = −1.473, p = 0.001), located closer to the road (β = −3.147, p = 0.01), located closer to the market center (β = −0.159, p = 0.01), and at higher elevation (β = 0.007, p = 0.01) were more likely to adopt the business/enterprise strategy than food-grain production. Similarly, there were negative but significant influences of the Brahmin and Tharu ethnic group in the choice of the business/enterprise strategy, suggesting a lower likelihood of following the business/enterprise LS by them in comparison to Janajati while Chhetri had a significant positive association. However, gender and age of household head, family size and working age members, a household’s assets value, expenditure, and membership in organizations showed positive associations but not a significant influence on the adoption of the business/enterprise LS.
While comparing the commercial farming LS with diversified subsistence, households headed by more educated heads (β = 0.242, p = 0.01), with a bigger family size (β = 0.413, p = 0.01), members having agricultural training (β = 2.083, p = 0.001), membership in organizations (β = 1.039, p = 0.05), having more access to credit (β = 0.71, p = 0.05), owned relatively small size of land (β = −1.053, p = 0.01), located closer to road (β = −1.943, p = 0.001) and market center (β = −0.715, p = 0.001), and at higher elevation (β = 0.051, p = 0.001) preferred to choose a commercial farming strategy. Similarly, there were negative and significant associations of the Brahmin and Tharu ethnic groups on the adoption of commercial farming LS signifying the lower involvement of these ethnic groups in commercial farming as compared to Janajati. Finally, households headed by lower educated (β = −0.017, p = 0.05), male (β = 1.196, p = 0.01), having higher expenditure (β = 0.024, p = 0.01) but lower average education (β = −0.217, p = 0.01), owned smaller farm size (β = −2.026, p = 0.001) and livestock with lower value (β = 0.008, p = 0.01), located closer to a vehicle passable road (β = −1.932, p = 0.001) and at higher altitude (β = 0.005, p = 0.001) were more likely to choose the remittance oriented LS (Table 5).

4. Discussion

4.1. Household Livelihood Strategy in Rural Nepal

This study has identified five distinct clusters of livelihood strategies, namely the non-farm wage, the business/enterprise, the commercial farming, the remittance oriented, and the diversified subsistence strategies followed by rural households in central Nepal. The results show that income diversification to non-farm activities has become the dominant livelihood strategy since the majority (about 61%) of households have diversified their livelihood to non-farm related strategies (includes remittance and non-farm wages). This result seems reasonable because growing outmigration to cities and abroad prompted by limited employment opportunities and low profit from subsistence farming in the rural areas has been increasing the households receiving non-farm income including remittance and non-farm wages. The increasing role of remittance and non-farm income in households and the national economy in Nepal is widely discussed in the empirical literature and national reports [30,57,58]. As indicated by the results, very few (only about 10%) households are found in the diversified subsistence group which is represented by households that generated higher income from cereal and livestock sales. This can be because a) increasing remittance and non-farm income have decreased the contribution of agricultural income in the overall household income and b) this study categorized households based on the share of cash earning while the majority of the farming households in Nepal produce food grain for subsistence purposes. This study also revealed that nearly one-third (about 29%) of the sampled households have market based LS (business/enterprise and commercial farming). Among them, households in low-land terai and high-hill VDCs are taking advantage of tourism related business since they are located near the renowned tourist centers in Nepal. While in mid-hill VDC, the majority of households have diversified subsistence farming to vegetable production for commercial purposes due to unfolding market opportunities fueled by increasing urbanization. In addition, livestock based enterprises along with non-farm micro-enterprises were found to be commonly practiced in the sample villages. Although slowly increasing newer livelihood opportunities fueled by increasing connectivity and infrastructure development in the rural areas may have attracted smallholder farmers to adopt market-oriented farm and non-farm activities.
This study has suggested that income diversification is the major characteristic in the study villages, which is aligned with the existing findings on rural livelihood diversification [12,14,22,59]. However, to assess the reasons for diversification is beyond the scope of this study—livelihood security could be the motive of diversification. The results showed that two farm based strategies (i.e., diversified subsistence and commercial farming) are highly diversified strategies. Since agriculture-based rural livelihood in Nepal is highly vulnerable due to the high production cost but low productivity from agriculture, which has been accelerated by the adverse effect of global climate change [32], smallholder farmers may have diversified their income to enhance their livelihood security and resilience power. More importantly, this study has indicated an increasing domination of non-farm sector income over farm income in rural households. The results showed that only about 23% of sampled households adopted the farm-based strategy (including both subsistence and commercial farming) as major income activities. Moreover, other empirical studies also revealed that subsistence farming in Nepal has been shifting to the hands of less capable women and elderly people and increasing fallow land due to the shortage of labour caused by outmigration [60,61]. Thus, these results have indicated a serious threat to future food security and agricultural development for an agrarian country like Nepal.

4.2. Livelihood Strategy, Income, and Implication for Poverty Reduction

Among the five clusters of LSs, business/enterprise based LS has been found to be the most remunerative in terms of the highest DPCI followed by commercial farming, while diversified subsistence LS was the least. Furthermore, the dominance of DPCI of these two strategies over the others indicates that market-oriented strategies either based on farm or non-farm strategies have greater likelihood of earning higher income and have the potential to alleviate poverty in our study areas. Since the significantly lower percentage of households belonging to these strategies lie under the international poverty line, it additionally reflects the effectiveness of business/enterprise and commercial farming strategies to overcome rural poverty. Respondents in our FGDs also reported that the diversification of livelihood activity to market oriented business/enterprises and commercial farming has increase villagers’ income earning and has improved their purchasing power which is crucial for alleviating absolute poverty. The effectiveness of market-oriented livelihood strategies such as business and self-employed rural enterprises to stabilize rural households’ income and food security in developing countries has been also highlighted by several previous studies [7,10,18].
Despite evidence of a positive relation between household welfare and livelihood diversification to non-farm strategies [14,22], this study indicates that pure non-farm based strategies returns good income but are not as effective as self-employed business/enterprise and market-oriented farming. It could be because of the unmanaged and low paid labour market in non-farm sector in Nepal. Similarly, out-migrants who have migrated for unskilled foreign jobs and seasonal migrants are uneducated and involved in low paid jobs. The ineffectiveness of remittance to reduce poverty in the long run in Nepal is due to its adverse socio-economic and environmental impacts, which have been discussed in studies related to outmigration [57,60,62]. Diversified subsistence LSs as shown by the results to be less profitable strategies in terms of income earning, although it reflects better subsistence capacity which also is the most important aspect of poverty reduction in developing countries [43]. However, generating higher income is perhaps the most effective solution for reducing poverty and increasing a poor household’s resilience capacity [63]. As indicated by the result, higher income can be generated via connecting poor people to the higher income market through promotion of high value agriculture and non-farm activities for commercial purposes. Though, both of these options may not be long term solutions for rural poverty in Nepal unless essential measures are taken. As a mountainous country, the agricultural sector in Nepal is highly vulnerable to the direct impacts of global climate change where commercial farming may be catastrophic for poor farmers in the long run, until climate change adaptation technologies are adopted in farming systems as suggested by Castells-Quintana’s studies [64,65]. Moreover, due to a poor infrastructure and fragile socio-economic and political environment, promoting sustainable business and micro-enterprises among rural poor in Nepal also entails a great challenge if the situation is not improved.

4.3. Determinants of Livelihood Strategy

This study revealed how distinct factors ranging from the household head’s characteristics to the households’ characteristics, households’ access to livelihood capitals (human, natural, financial, physical and social), infrastructure situation, and location factors influenced a household’s choice of various livelihood strategies. Since the purpose of the study is to explore the factors that contribute to adopting better LS, the discussion will hinge on the factors influencing adoption of the two most lucrative LSs identified above, i.e., business/enterprise and commercial farming LSs. Education of the household head, and agricultural and skill-development training were found to be the most influencing human capitals in choosing business/enterprise and commercial farming strategies (hereafter higher returning LSs). Greater influences of human capital including education and trainings on the adoption of higher returning LSs are widely discussed in the existing literature [7,9,54]. It could be due to higher education and skill development trainings that are likely to develop more skilled and capable entrepreneurs [66], while agricultural trainings are likely to motivate farmers to diversify subsistence oriented traditional farming to commercial-oriented high-value commodities [67]. Confirming the results from Eneyew [68] and Reardon [56], this study also established a strong relation between family size and the numbers of working-age family members with the LSs choice. Households with a larger family size have higher chances of adopting commercial farming LS, possibly because agricultural activities in Nepal are labor-intensive. Hence the availability of family labor is very important for intensive market-oriented farming. However, opposite our expectation, the adoption of higher returning LSs was not affected by the gender of the household head, possibly due to decreasing gender differences in the access to productive resources.
The results indicated a negative and significant relationship of total land holding on the choice of higher returning LSs which is justifiable because low profit from subsistence farming alone cannot sustain the livelihood of rural households who owned smaller sizes of land which compels them to generate higher income from the limited land through commercially-oriented farm and non-farm activities. However, the result contradicts the findings of Nepal and Thapa [69] who reported that households with larger land holding are likely to adopt commercial farming in Nepal. It could be due to their study site being closer to the market center than ours since proximity to the market and road enables farmers to sell products with a greater farm gate price [69,70]. Aligned with the previous findings [6,71,72], our results also indicate a greater probability of adopting market-oriented higher returning LSs by the households that are located closer to the road and market. Financial capital is pivotal for the rural poor to start up any commercially-oriented business/enterprises [10]. Our analysis also showed that access to credit positively and significantly influences the adoption of commercially-oriented higher returning LSs. In our FGDs, participants also explained that increasing involvement in social and financial organization and access to credit from women groups, micro-finance, and banks have attributed starting small enterprises such as grocery stores, restaurants, goat-keeping, poultry farming, and other income-generating activities such as tailoring. Caste and ethnic affiliation traditionally used to play a strong role in economic status and LS choice in Nepal [73]. The results showed that households in the Brahmin and Tharu communities are less likely to adopt lucrative LS than those in the Janajati, Chhetri, and Dalit communities. Traditionally, the privileged ethnic groups like the Brahmin and Chhetri used to often be involved in higher returning LSs [74] but the contradictory finding in this study indicates a rapidly changing social fabric where the most unprivileged and asset poor ethnic groups such as Dalits are stepping out from so-called occupational restrictions.
Geographical locations such as agroecology and elevation significantly impact factors on the choice of certain types of livelihood activities [8,10,12,50]. This study also revealed that farming households in lower altitudes are more likely to adopt the diversified subsistence strategy while farmers in higher altitudes are likely to choose alternative strategies. A similar pattern was reported in Ethiopia by Tesfaye [24]. The crop production potential in plain areas (terai) is very good compared to the high and mid-hill areas in Nepal [75], hence it makes sense that households in terai continue food grain production based LS. Low productivity from rain-fed agriculture at higher altitude is hardly enough to meet the needs of food for home consumption; hence farmers in the potential areas in mid and high hill are compelled to diversify income activities to commercially oriented farm and non-farm sectors. This could also be the reason for the higher likelihood of adopting remittance oriented LS with the increase in elevation, particularly in the high hill case study VDC.
Our analysis shows empirical evidence about the relationship among variables contributing to the adoption of certain livelihood strategies by rural people, which should not be confused as direct causal links between these variables. Adoption of one or another livelihood strategy is affected by various social, economic, policy, cultural, and religious factors which make it very difficult to establish direct causal links of determinants of the livelihood strategies. Despite this, the analysis reveals strong associations of a few determinants to the adoption of better livelihood strategies, which gives insights to policy makers on what types of activities could help in reducing poverty in rural areas.

5. Conclusions and Recommendation

This study assessed the dominant livelihood strategies adopted by rural households, their relevance to poverty reduction based on income returning aspects, and the factors that influence the adoption of higher returning livelihood strategies in the central landscape of Nepal. The findings suggested that livelihood diversification to non-farm activities is common among the majority of rural households. Only a few households have adopted livelihood diversification to business/enterprise and commercial farming which are more lucrative strategies and are more relevant for poverty reduction in our study site and in other areas with similar contexts. The result further suggested that education, training, land holding, access to credit, proximity to the road and market, and agroecological location are the major influencing factors in the adoption of higher returning strategies. Therefore, targeted programmes to support poor households should emphasize building human capital through education, agriculture, and skill-based training along with strengthening financial capital by increasing access to credit. Development projects should come up with rural credit policies targeted to poor households that can motivate the diversification of traditional livelihood activities to more profitable business-oriented strategies. These efforts, however, should go together with investment in rural infrastructure, particularly agricultural roads and market centers in order to increase the connectivity of the rural poor to the global market.
As suggested by the result, smallholder farmers in Nepal are being diverted from subsistence farming to non-farm activities like remittance and wage labor. Although increasing domination of the non-farm sector in rural livelihood minimizes agriculture dependencies, it can be a better solution to the increasing environmental problems caused by overpressure on land resources. Nonetheless, increasing the distraction from agriculture may create a challenge for food self-sufficiency of the country which already has a large population under malnutrition and food insecurity. Increasing the attraction of poor people to off-farm strategies, on one hand, may hinder the productivity of the agriculture sector while on the other can increase the rate of unemployment. It is less likely to have a transformation of the economic structuring of Nepal in the foreseeable future due to slow growth of the other manufacturing sectors. Therefore, commercialization of the agricultural sector will remain a top strategy for poverty reduction at least for a few more decades. Although higher priority to non-farm and manufacturing sectors is anticipated in the long-term, commercialization of the agricultural sector is indispensable in the short-term. Therefore, greater investment and support for the agriculture sector is important to attract the young generation to adopt commercial agriculture which is crucial for alleviating rural poverty and food insecurity.
Promotion of commercial agriculture can also have detrimental impacts on the environment. The input-intensive, mono-cropping based model of commercial agriculture, as promoted under the green-revolution model, can deteriorate the health of soil, water, humans, and the ecosystem. However, Nepal has neither the strong competitive advantage nor suitable ecological and social condition for the high-input intensive commercialization. Therefore, it is important to increase investment in research and development of the ecologically sound low-external-input based methods for commercialization (e.g., organic farming). In addition, agriculture in the rural areas has also been affected by few new challenges, along with several traditional ones. Increased weather variations due to global climate change have aggravated many constraints of subsistence agriculture such as greater water stresses for crops and animals, infestation of new diseases and pests, increased frequencies of the weather-induced risk and hazards, and high soil erosion, among many others. Addressing these changes is also crucial for the sustainable reduction of poverty in the rural areas of Nepal. Therefore, the diversification of income sources of poor people through commercial farming by promoting appropriate climate-smart agricultural practices would be a win-win situation to enhance ecologically and economically sound livelihood strategies. Concurrently, by identifying areas of specific economic potential, the government should invest in them in order to stimulate the local poor to be involved in self-employed business/enterprise activities in order to reduce poverty in the long run in Nepal.

Supplementary Materials

The following are available online at www.mdpi.com/2071-1050/9/4/612/s1, Table S1: Summary statistics of nominal explanatory variables according to the five LSs clusters (the numbers are percentages and the results are derived from the Chi-square test), Table S2: Summary statistics of continuous explanatory variables according to the five LSs clusters (results are derived from one-way ANOVA).

Acknowledgments

We would like to acknowledge the support from NSFC-ICIMOD Cooperation Project (NO. 41661144038—02), Aid project on Ministry of Science and technology of the PRC in 2013, The World Academy of Sciences (TWAS) and CAS-TWAS President Fellowship Program. We are greatly thankful to the anonymous reviewers for their valuable comments. In addition, farmers and local assistants in Bachhauli, Ghyalchok, and Ghanpokhara VDCs are thanked for their hospitality and support for completing the survey. Similarly, we thank the students of the Institute of Agriculture, Tribhuvan University, Rampur, Nepal who were involved in household questionnaire survey.

Author Contributions

S.P.K. and W.D. conceived the idea; S.P.K., B.P., J.R.K., J.Z., and Y.S. performed the field work; S.P.K., B.P., and J.R.K. analyzed the data; S.P.K., B.P., and J.R.K. wrote the paper.

Conflicts of Interest

The authors declare no conflict of interest.

References

  1. Davis, B.; Winters, P.; Carletto, G.; Covarrubias, K.; Quiñones, E.J.; Zezza, A.; Stamoulis, K.; Azzarri, C.; DiGiuseppe, S. A cross-country comparison of rural income generating activities. World Dev. 2010, 38, 48–63. [Google Scholar] [CrossRef]
  2. World Bank Group. Global Monitoring Report 2014/2015: Ending Poverty and Sharing Prosperity; World Bank Group: Washington, DC, USA, 2015. [Google Scholar]
  3. Rigg, J. Land, farming, livelihoods, and poverty: Rethinking the links in the rural south. World Dev. 2006, 34, 180–202. [Google Scholar] [CrossRef]
  4. Dixon, J.A.; Gibbon, D.P.; Gulliver, A. Farming Systems and Poverty: Improving Farmers’ Livelihoods in a Changing World; Food & Agriculture Organization: Rome, Italy, 2001. [Google Scholar]
  5. Thorbecke, E. Multidimensional poverty: Conceptual and measurement issues. In The Many Dimensions of Poverty; Springer: New York, NY, USA, 2007; pp. 3–19. [Google Scholar]
  6. Ellis, F. Household strategies and rural livelihood diversification. J. Dev. Stud. 1998, 35, 1–38. [Google Scholar] [CrossRef]
  7. Soltani, A.; Angelsen, A.; Eid, T.; Naieni, M.S.N.; Shamekhi, T. Poverty, sustainability, and household livelihood strategies in Zagros, Iran. Ecol. Econ. 2012, 79, 60–70. [Google Scholar] [CrossRef]
  8. Fang, Y.-P.; Fan, J.; Shen, M.-Y.; Song, M.-Q. Sensitivity of livelihood strategy to livelihood capital in mountain areas: Empirical analysis based on different settlements in the upper reaches of the Minjiang River, China. Ecol. Indic. 2014, 38, 225–235. [Google Scholar] [CrossRef]
  9. Nielsen, Ø.J.; Rayamajhi, S.; Uberhuaga, P.; Meilby, H. Smiththvelihood strategy to livelihood capital in mountain areas: Empirical analysng an activity choice approach. Agric. Econ. 2013, 44, 57–71. [Google Scholar] [CrossRef]
  10. Brown, D.R.; Stephens, E.C.; Ouma, J.O.; Murithi, F.M.; Barrett, C.B. Livelihood Strategies in the Rural Kenyan Highlands; Cornell University: Ithaca, NY, USA, 2006. [Google Scholar]
  11. Oumer, A.M.; de Neergaard, A. Understanding livelihood strategy-poverty links: Empirical evidence from central highlands of Ethiopia. Environ. Dev. Sustain. 2011, 13, 547–564. [Google Scholar] [CrossRef]
  12. Jansen, H.G.; Pender, J.; Damon, A.; Wielemaker, W.; Schipper, R. Policies for sustainable development in the hillside areas of Honduras: A quantitative livelihoods approach. Agric. Econ. 2006, 34, 141–153. [Google Scholar] [CrossRef]
  13. Barrett, C.B.; Clark, M.B.; Clay, D.C.; Reardon, T. Heterogeneous constraints, incentives and income diversification strategies in rural Africa. Q. J. Int. Agric. 2005, 44, 37–60. [Google Scholar] [CrossRef]
  14. Barrett, C.B.; Reardon, T.; Webb, P. Nonfarm income diversification and household livelihood strategies in rural Africa: Concepts, dynamics, and policy implications. Food Policy 2001, 26, 315–331. [Google Scholar] [CrossRef]
  15. Van den Berg, M. Household income strategies and natural disasters: Dynamic livelihoods in rural Nicaragua. Ecol. Econ. 2010, 69, 592–602. [Google Scholar] [CrossRef]
  16. Ansoms, A.; McKay, A. A quantitative analysis of poverty and livelihood profiles: The case of rural Rwanda. Food Policy 2010, 35, 584–598. [Google Scholar] [CrossRef]
  17. Iiyama, M.; Kariuki, P.; Kristjanson, P.; Kaitibie, S.; Maitima, J. Livelihood diversification strategies, incomes and soil management strategies: A case study from Kerio Valley, Kenya. J. Int. Dev. 2008, 20, 380–397. [Google Scholar] [CrossRef]
  18. Babulo, B.; Muys, B.; Nega, F.; Tollens, E.; Nyssen, J.; Deckers, J.; Mathijs, E. Household livelihood strategies and forest dependence in the highlands of Tigray, Northern Ethiopia. Agric. Syst. 2008, 98, 147–155. [Google Scholar] [CrossRef]
  19. Xu, D.; Zhang, J.; Rasul, G.; Liu, S.; Xie, F.; Cao, M.; Liu, E. Household livelihood strategies and dependence on agriculture in the mountainous settlements in the Three Gorges Reservoir Area, China. Sustainability 2015, 7, 4850–4869. [Google Scholar] [CrossRef]
  20. Stifel, D.C. The rural non-farm economy, livelihood strategies and household welfare. Afr. J. Agric. Resour. Econ. 2010, 4, 82–109. [Google Scholar]
  21. Alemu, Z.G. Livelihood strategies in rural South Africa: Implications for poverty reduction. In Proceedings of the 2012 International Association of Agricultural Economists (IAAE) Triennial Conference, Foz do Iguacu, Brazil, 18–24 August 2012; pp. 1–24. [Google Scholar]
  22. Ellis, F. The determinants of rural livelihood diversification in developing countries. J. Agric. Econ. 2000, 51, 289–302. [Google Scholar] [CrossRef]
  23. Smith, D.R.; Gordon, A.; Meadows, K.; Zwick, K. Livelihood diversification in Uganda: Patterns and determinants of change across two rural districts. Food Policy 2001, 26, 421–435. [Google Scholar] [CrossRef]
  24. Tesfaye, Y.; Roos, A.; Campbell, B.M.; Bohlin, F. Livelihood strategies and the role of forest income in participatory-managed forests of Dodola area in the bale highlands, southern Ethiopia. For. Policy Econ. 2011, 13, 258–265. [Google Scholar] [CrossRef]
  25. National Planning Commission. Nepal status paper—United Nations conference on sustainable development 2012 (Rio+20) synopsis. In United Nations Conference on Sustainable Development 2012 (Rio+20); National Planning Commission: Kathmandu, Nepal, 2011. [Google Scholar]
  26. Central Bureau of Statistics. Agriculture Census, 2013; Central Bureau of Statistics: Kathmandu, Nepal, 2013.
  27. Blaikie, P.; Cameron, J.; Seddon, D. Understanding 20 years of change in west-central Nepal: Continuity and change in lives and ideas. World Dev. 2002, 30, 1255–1270. [Google Scholar] [CrossRef]
  28. Byg, A.; Herslund, L. Socio-economic changes, social capital and implications for climate change in a changing rural Nepal. GeoJournal 2016, 81, 169–184. [Google Scholar] [CrossRef]
  29. Bhandari, B.; Grant, M. Analysis of livelihood security: A case study in the Kali-Khola watershed of Nepal. J. Environ. Manag. 2007, 85, 17–26. [Google Scholar] [CrossRef] [PubMed]
  30. Rahut, D.B.; Ali, A.; Kassie, M.; Marenya, P.P.; Basnet, C. Rural livelihood diversification strategies in Nepal. Poverty Public Policy 2014, 6, 259–281. [Google Scholar] [CrossRef]
  31. Bhattarai, B.; Beilin, R.; Ford, R. Gender, agrobiodiversity, and climate change: A study of adaptation practices in the Nepal Himalayas. World Dev. 2015, 70, 122–132. [Google Scholar] [CrossRef]
  32. Maraseni, T.N. Climate change, poverty and livelihoods: Adaptation practices by rural mountain communities in nepal. Environ. Sci. Policy 2012, 21, 24–34. [Google Scholar]
  33. Chambers, R.; Conway, G. Sustainable Rural Livelihoods: Practical Concepts for the 21 st Century; Institute of Development Studies: Brighton, UK, 1992. [Google Scholar]
  34. Department for International Development. Sustainable Rural Livelihoods Guidance Sheets; Department for International Development: London, UK, 1999.
  35. Carney, D. Approaches to Sustainable Livelihoods for the Rural Poor; ODI Poverty Briefing; Overseas Development Institute: Brighton, UK, 1999. [Google Scholar]
  36. Scoones, I. Sustainable Rural Livelihoods: A framework for Analysis; IDS Working Paper 72; Institute of Development Studies: Brighton, UK, 1998. [Google Scholar]
  37. Carney, D. Sustainable rural livelihoods: What contribution can we make? In Proceedings of the Department for International Development’s Natural Resources Advisers’ Conference, London, UK, 10–14 July 1998; Department for International Development (DFID): London, UK, 1998. [Google Scholar]
  38. Rakodi, C. A capital assets framework for analysing household livelihood strategies: Implications for policy. Dev. Policy Rev. 1999, 17, 315–342. [Google Scholar] [CrossRef]
  39. Khatiwada, J.R.; Ghimire, S.; Khatiwada, S.P.; Paudel, B.; Bischof, R.; Jiang, J.; Haugaasen, T. Frogs as potential biological control agents in the rice fields of chitwan, nepal. Agric. Ecosyst. Environ. 2016, 230, 307–314. [Google Scholar] [CrossRef]
  40. World Wildlife Fund Nepal. Chitwan Annapurna Landscape (CHAL): A Rapid Assessment; World Wildlife Fund Nepal: Kathmandu, Nepal, 2013. [Google Scholar]
  41. Paudel Khatiwada, S.; Zhang, J.; Yi, S.; Paudel, B.; Deng, W. Agricultural land use intensity and determinants in different agro-ecological regions of central Nepal. In Land Cover Change and Its Eco-Environmental Responses in Nepal; Li, A., Wei, D., Wei, Z., Eds.; Springer: Chengdu, China, 2017; in press. [Google Scholar]
  42. Evans, H.E.; Ngau, P. Rural-urban relations, household income diversification and agricultural productivity. Dev. Chang. 1991, 22, 519–545. [Google Scholar] [CrossRef]
  43. Huber, F.K.; Yang, Y.; Weckerle, C.S.; Seeland, K. Diversification of livelihoods in a society in transition: A case study of Tibetan communities in southwest China. Soc. Nat. Resour. 2014, 27, 706–723. [Google Scholar] [CrossRef]
  44. Annabi, N.; Cockburn, J.; Decaluwe, B.; Khondker, B.; Raihan, S. Implications of WTO Agreements and Unilateral Trade Policy Reforms for Poverty in Bangladesh: Short versus Long-Run Impacts; The World Bank: Washington, DC, USA, 2006. [Google Scholar]
  45. Menon, M.; Perali, F.; Rosati, F. The Shadow Wage of Child Labour: An Application to Nepal; Faculty of Economics, University of Rome: Rome, Italy, 2005. [Google Scholar]
  46. Takane, T. Labor use in smallholder agriculture in malawi: Six village case studies. Afr. Stud. Monogr. 2008, 29, 183–200. [Google Scholar]
  47. Hair, J.F. Multivariate Data Analysis: A Global Perspective; Prentice Hall: Upper Saddle River, NJ, USA, 2009. [Google Scholar]
  48. Simpson, E.H. Measurement of diversity. Nature 1949, 163, 688. [Google Scholar] [CrossRef]
  49. Ellis, F. Rural Livelihoods and Diversity in Developing Countries; Oxford University Press: Oxford, UK, 2000. [Google Scholar]
  50. Chilongo, T. Livelihood strategies and forest reliance in malawi. For. Trees Livelihoods 2014, 23, 188–210. [Google Scholar] [CrossRef]
  51. Whitmore, G.A.; Findlay, M.C. Stochastic Dominance: An Approach to Decision-Making under Risk; Lexington Books: Lanham, MD, USA, 1978. [Google Scholar]
  52. Valdivia, C.; Gilles, J. Gender and resource management: Households and groups, strategies and transitions. Agric. Hum. Values 2001, 18, 5–9. [Google Scholar] [CrossRef]
  53. Zakaria, H.; Abujaja, A.M.; Adam, H.; Salifu, W.Y. Does gender makes any difference in livelihoods diversification? Evidence from Northern Ghana. Int. J. Agric. Ext. Rural Dev. Stud. 2015, 1, 36–51. [Google Scholar]
  54. Gautam, Y.; Andersen, P. Rural livelihood diversification and household well-being: Insights from Humla, Nepal. J. Rural Stud. 2016, 44, 239–249. [Google Scholar] [CrossRef]
  55. Khatun, D.; Roy, B. Rural livelihood diversification in West Bengal: Determinants and constraints. Agric. Econ. Res. Rev. 2012, 25, 115–124. [Google Scholar]
  56. Reardon, T. Using evidence of household income diversification to inform study of the rural nonfarm labor market in Africa. World Dev. 1997, 25, 735–747. [Google Scholar] [CrossRef]
  57. Maharjan, A.; Bauer, S.; Knerr, B. International migration, remittances and subsistence farming: Evidence from Nepal. Int. Migr. 2013, 51, 249–263. [Google Scholar] [CrossRef]
  58. Ministry of Finance. Nepal Economic Survey Report 2012–13; Ministry of Finance: Kathmandu, Nepal, 2013.
  59. Freeman, A.; Ellis, F. Implications of livelihood strategies for agricultural research: A Kenya case study. In Rural Livelihoods and Poverty Reduction Policies; Routledge: London, UK; New York, NY, USA, 2005; pp. 198–212. [Google Scholar]
  60. Gartaula, H.; Niehof, A.; Visser, L. Shifting perceptions of food security and land in the context of labour out-migration in rural Nepal. Food Secur. 2012, 4, 181–194. [Google Scholar] [CrossRef]
  61. Paudel, K.P.; Tamang, S.; Shrestha, K.K. Transforming land and livelihood: Analysis of agricultural land abandonment in the Mid Hills of Nepal. J. For. Livelihood 2014, 12, 11–18. [Google Scholar]
  62. Massey, D.S.; Axinn, W.G.; Ghimire, D.J. Environmental change and out-migration: Evidence from Nepal. Popul. Environ. 2010, 32, 109–136. [Google Scholar] [CrossRef] [PubMed]
  63. Daw, T.; Brown, K.; Rosendo, S.; Pomeroy, R. Applying the ecosystem services concept to poverty alleviation: The need to disaggregate human well-being. Environ. Conserv. 2011, 38, 370–379. [Google Scholar] [CrossRef]
  64. Castells-Quintana, D.; Lopez-Uribe, M.D.P.; McDermott, T. Coping with Climate Risk: The Role of Institutions, Governance and Finance in Private Adaptation Decisions of the Poor; Working paper No. 200; Centre for Climate Change Economics and Grantham Research Institute on Climate Change and the Environment, University of Leeds and the London School of Economics and Political Science: London, UK, 2015; p. 54. [Google Scholar]
  65. Castells-Quintana, D.; Lopez-Uribe, M.d.P.; McDermott, T.K. Geography, institutions and development: A review of the long-run impacts of climate change. Clim. Dev. 2016. [Google Scholar] [CrossRef]
  66. Wallenborn, M. Skills development for poverty reduction (SDPR): The case of Tajikistan. Int. J. Educ. Dev. 2009, 29, 550–557. [Google Scholar] [CrossRef]
  67. Alam, G.M.; Hoque, K.E.; Khalifa, M.T.B.; Siraj, S.B.; Ghani, M.F.B.A. The role of agriculture education and training on agriculture economics and national development of Bangladesh. Afr. J. Agric. Res. 2009, 4, 1334–1350. [Google Scholar]
  68. Eneyew, A.; Bekele, W. Determinants of livelihood strategies in Wolaita, Southern Ethiopia. Agric. Res. Rev. 2012, 1, 153–161. [Google Scholar]
  69. Nepal, R.; Thapa, G.B. Determinants of agricultural commercialization and mechanization in the hinterland of a city in Nepal. Appl. Geogr. 2009, 29, 377–389. [Google Scholar] [CrossRef]
  70. Fafchamps, M.; Shilpi, F. The spatial division of labour in Nepal. J. Dev. Stud. 2003, 39, 23–66. [Google Scholar] [CrossRef]
  71. Pender, J.; Nkonya, E.; Jagger, P.; Sserunkuuma, D.; Ssali, H. Strategies to increase agricultural productivity and reduce land degradation: Evidence from uganda. Agric. Econ. 2004, 31, 181–195. [Google Scholar] [CrossRef]
  72. Reardon, T.; Stamoulis, K.; Balisacan, A.; Cruz, M.; Berdegué, J.; Banks, B. Rural non-farm income in developing countries. State Food Agric. 1998, 1998, 283–356. [Google Scholar]
  73. Levine, N.E. Caste, state, and ethnic boundaries in Nepal. J. Asian Stud. 1987, 46, 71–88. [Google Scholar] [CrossRef]
  74. Aryal, J.P.; Holden, S.T. Caste, investment and intensity of production. In Proceedings of the 18th Annual Conference of the European Association of Environmental and Resource Economists (EAERE), Rome, Italy, 29 June–2 July 2011. [Google Scholar]
  75. Poudel, S.; Kotani, K. Climatic impacts on crop yield and its variability in nepal: Do they vary across seasons and altitudes? Clim. Chang. 2013, 116, 327–355. [Google Scholar] [CrossRef]
Figure 1. Conceptual framework of the study adopted from [7,18,34,37].
Sustainability 09 00612 g001
Figure 2. Map of Nepal indicating the study districts with the selected sampling Village Development Committee (VDC).
Sustainability 09 00612 g002
Figure 3. Mean Daily per capita income by different LSs clusters. The bar represents the mean and the error bar represents the SD. The letters are derived from the Post hoc Tukey’s test. Different letters indicate significant difference at the 5% level.
Sustainability 09 00612 g003
Figure 4. Cumulative density distributions for each livelihood strategy (LS).
Sustainability 09 00612 g004
Table 1. Livelihood platform variables used, their definition, and expected relation with livelihood strategies.
Explanatory VariablesDefinitionLiterature ReviewExpected Relationships with Livelihood Strategies (LSs)
Human capital
Gender of household (HH) headThe gender of main decision maker of a HH (Dummy; if sex of HH head is female 1, otherwise 0)[52,53]HHs headed by males are more likely to be involved in higher returning LSs both in the farm and non-farm sector
Age of HH headAge of HH head (years)[12,18]HHs with a younger head are expected to adopt more profitable LSs
Education of HH headSchooling Years of HH head[7,54]HHs with a higher educated head are more likely to be involved in higher returning non-farm LSs
Average educationAverage education of total family members (years)[23,55]HHs having higher average education are supposed to be involved in non-farm based LSs
Working age membersNumbers of HH members aged between 15 and 64 years[20,55]HHs having a higher number of working age members are more likely to engage in more diversified LSs
Family sizeTotal HH members[19,56]HHs with a bigger family size are expected to adopt farm-based LSs
Agricultural trainingIf HH head or other member have training related to agriculture (Dummy; if yes = 1, No = 0)[12,22]HHs having member/s with agricultural training are expected to be involved in commercial farm based LSs
Skill-development trainingIf household head or any member have income generating training (Dummy; if Yes = 1, No = 0)[55]HHs having member/s with skill-development training are more likely to be involved in self-employed rural enterprise
Natural Capital
Total land holdingsSize of HH’s own land for agriculture (ha)[19,22]HHs with smaller size of agricultural land holdings are more likely to engaged in non-farm based LSs
Physical capital
Livestock valueEstimated value of total livestock owned by household in Nepalese Rupees (NPR)[12,13]HHs owning livestock with higher value are supposed to follow commercially oriented on-farm LSs
Household Asset valueEstimated value of building, agricultural, and non-agricultural assets owned by HH (NPR)[12,55]HHs owning fixed assets with higher value are expected to follow commercially oriented LSs
Financial capital
Access to creditIf the household has a loan during the last 2 years (Dummy; Yes = 1, No = 0)[10,22,37]HHs having access to credit are more likely to start up rural enterprise
ExpenditureHH’s total annual expenditure (except crop and livestock production expenditure) (NPR)[9,21]HHs having higher expenditure are more likely to engage in non-farm LSs
Social capital
EthnicityHousehold’s Ethnic affiliation (Dummy; 1 = Brahmin, 2 = Chhetri, 3 = Dalit, 4 = Tharu, 5 = Janajati)[9,30]HHs that belong to Brahmin and Chhetri are supposed to be involved in more remunerative non-farm LSs
Membership in organizationWhether HH head or any member have been members of formal/informal groups/organizations (Dummy: yes = 1, No = 0)[7,19,24]HHs having member/s with membership in organization are expected to be involved in more profitable farm and non-farm LSs
Infrastructures
Home-road DistanceDistance to nearest vehicle passable road (KM)[7,12,18]HHs located closer to roads are more likely to follow commercial oriented farm and non-farm LSs
Home-market DistanceDistance to nearest Market center the HH usually use (KM)[7,18,24]HHs located closer to market centers are expected to adopt market oriented farm and non-farm LSs
Geographical factors
ElevationElevation of each HH recorded by GPS (M)[7,12]HHs located at lower elevation are more likely to be involved in higher returning farm/non-farm LSs
AgroecologyDummy 1 = low-land terai, 2 = mid-hill, and 3 = high hill[10,50,55]HHs in low-land terrain are expected to be involved in higher returning farm and non-farm based LSs
Table 2. Extracted principle component factors from Principle Component Analysis (PCA) with varimax rotation with Eigenvalues greater than 1.
Income VariablesFactor 1Factor 2Factor 3Factor 4
Food crop0.1570.084−0.0460.813
Commercial crop−0.0580.8060.06−0.255
Livestock0.0350.652−0.0170.422
Non-farm salary/wages0.889−0.261−0.238−0.147
Wage Labour Agriculture0.2140.1120.024−0.487
Remittance−0.805−0.341−0.447−0.144
Business/enterprise−0.082−0.2090.950.044
Other0.0360.1330.286−0.07
Table 3. Income distribution, level of diversity, and intensity of poverty among livelihood strategy clusters.
Income SourceTotalCluster 1Cluster 2Cluster 3Cluster 4Cluster 5F Statistic
Cluster NameNon-Farm WageBusiness/EnterpriseCommercial FarmingRemittance-OrientedDiversified Subsistence
MeanSDMeanSDMeanSDMeanSDMeanSDMeanSD
Food crop 6.412.84.2 b6.53.9 b6.84.7 b6.22.34.1333 a24.5102.902 ***
Commercial Crop7.917.32.5 b6.24.1 b8.543.8 a23.31.7 b4.71.7 b4.2218.421 ***
Livestock12.215.97.6 c8.18.5 c10.124.8 b19.06.4 c8.734.1 a25.058.568 ***
Wage Non-farm 26.632.675.2 a16.312.2 b,c18.711.1 b,c16.26.9 c11.617.2 b22.2363.49 ***
Wage-Agriculture1.77.22.8 a,b8.41.4 a,b4.94.2 a14.30.7 b2.40.0 b0.04.004 ***
Remittance30.937.53.5 b9.35.1 b12.07.2 b15.277.3 a17.35.9 b13.2684.849 ***
Business/enterprise14.024.94.1 b9.363.9 a203.7 b9.24.5 b9.17.8 b15.0360.899 ***
Others0.32.00.2 a,b1.00.9 a3.40.6 a,b3.10.1 b0.80.0 a,b0.03.127 **
Simpson Diversity Index 0.22 c,d0.160.25 b,c0.170.31 a,b0.190.16 d0.150.34 a0.2015.19 ***
Number of HH453115726016244
Percentage of HH 25.415.913.235.89.7
Percentage of extremely poor HH 1 38.32.8013.322.238.6
Percentage of poor HH 2 25.215.325.027.231.8
Bold numerals refer to the higher share of individual income; a,b,c,d common superscripted letter imply that the mean income difference is not significant; 1 Percentage of households with less than US$1.25/capita/day; 2 Percentage of households with less than US$2/capita/day; Significant at *** 99%, ** 95%.
Table 4. Distribution of sampled households in three study areas by livelihood strategy clusters. Numbers in parentheses are percentages.
Survey AreasNon-Farm WageBusiness/EnterpriseCommercial FarmingRemittance-OrientedDiversified SubsistenceTotal
Low-terai71(32.7)34 (15.7)3(1.4)73(33.6)36(16.6)217
Mid-hill29(21.8)21(15.8)51 (38.3)27 (20.3)5(3.8)133
High-hill15(14.8)17(16.5)6(5.8)62(60.2)3(2.9)103
Pearson Chi-Square = 147.335; p < 0.001.
Table 5. Determinants of livelihood strategy choice (multinomial logistic regression, diversified subsistence production as reference category).
Explanatory VariablesNon-Farm WageBusiness/EnterpriseCommercial FarmingRemittance-Oriented
B (Std. Error)B (Std. Error)B (Std. Error)B (Std. Error)
Male headed household0.923 ** (0.46)0.045 (0.516)0.422 (0.612)1.196 ** (0.461)
HH head’s age−0.013 * (0.019)0.03 (0.023)0.039 (0.025)0.003 (0.019)
HH head’s education years−0.006 (0.065)0.214 *** (0.072)0.242 ** (0.086)−0.017 * (0.065)
HH’s average education years0.207 ** (0.123)0.057 (0.14)−0.032 (0.15)−0.217 ** (0.122)
Family size0.136 (0.175)0.071 (0.2)0.413 ** (0.231)0.122 (0.173)
Working age family members0.088 ** (0.244)0.199 (0.277)0.136 (0.306)0.11 (0.242)
Agricultural training a,c−0.672 (0.537)−1.216 * (0.652)2.083 *** (0.669)−0.786 * (0.548)
Skill-training a,d0.698 (0.463)1.68 *** (0.578)−0.841 (0.593)0.649 (0.461)
Total landholding−1.963 *** (0.483)−1.473 *** (0.453)−1.053 ** (0.565)−2.026 *** (0.441)
HH’s access to credit a,e0.022 (0.45)1.321 *** (0.564)0.711 * (0.634)−0.511 (0.446)
HH’s expenditure0.04 (0.008)0.011 (0.006)0.01 (0.009)0.004 ** (0.008)
Livestock value−0.013 *** (0.005)0.021 (0.002)0.019 (0.003)−0.008 ** (0.003)
HH’s fixed asset value−0.006 (0.011)0.021 (0.004)0.007 (0.005)−0.006 (0.004)
Membership in organization a,f0.572 (0.644)0.694 (0.74)1.039 * (0.803)0.308 (0.625)
Ethnicity
Brahmin ethnic group a,g0.453 (0.714)−1.71 ** (0.787)−2.152 ** (0.878)−1.68 ** (0.717)
Chhetri ethnic group a,g2.247 (1.59)2.786 * (1.644)2.411 (1.566)2.052 (1.553)
Dalit ethnic group a,g1.279 (1.051)1.05 (1.136)1.211 (1.147)1.018 (1.043)
Tharu ethnic group a,g−0.502 (0.762)−1.624 ** (0.831)−3.749 ** (1.77)−0.431 (0.744)
Home to road distance Km−1.714 *** (0.422)−3.147 ** (0.55)−1.943 *** (0.473)−1.932 *** (0.421)
Home to market distance Km−0.069 * (0.053)−0.159 ** (0.086)−0.715 *** (0.125)−0.078 (0.055)
Elevation (m)0.005 *** (0.001)0.007 ** (0.001)0.01 *** (0.002)0.005 *** (0.001)
Log Likelihood = −461.502; LR Chi square = 438.10; Probability > chi2 = 0.000; Goodness of fit: Pearson Chi square = 1470.95; p-value = 0.952; Deviance chi-square = 923.00; p-value = 0.998; Pseudo R-square: Cox and Snell = 0.620; Nagelkerke = 0.652, McFadden = 0.322; Significant at *** 99%, ** 95%, and * 90%; a Dummy variables; b excluded category: female-headed household; c excluded category: not having agricultural training; d excluded category: not having skill-development training, e excluded category: not having access to credit, f excluded category: not having membership of organization, g excluded category: Janajati ethnic group.

