
Spatial and Temporal Variations in the Ecological Footprints in Northwest China from 2005 to 2014

1
Institute of Geographic Sciences and Natural Resources Research, Key Laboratory of Land Surface Pattern and Simulation, Chinese Academy of Sciences, Beijing 100101, China
2
University of Chinese Academy of Sciences, Beijing 100049, China
*
Author to whom correspondence should be addressed.
Sustainability 2017, 9(4), 597; https://doi.org/10.3390/su9040597
Submission received: 26 January 2017
/
Revised: 4 April 2017
/
Accepted: 10 April 2017
/
Published: 13 April 2017
(This article belongs to the Section Environmental Sustainability and Applications)
Abstract
:Global change is becoming increasingly evident, and human activities are also causing severe damage to natural resources and the environment. Therefore, it is increasingly important to study regional sustainability in order to guide human decisions and actions. The ecological footprint is a useful indicator with which to quantify the pressures imposed by humans on natural resources and regional capacities for sustainable development. This paper analyzed the variations in the ecological footprints and capacity for regional development of five provinces in Northwest China in 2005–2014, based on the Wackernagel ecological footprint method, using the standard measurement of the national hectare. The ecological footprints of the five provinces were quite different, mainly because of the differences in arable land and fossil energy resources. The average ecological footprint in Shanxi was relatively high over the study period, at 22,549.86 thousand NHA, which had the greatest demand for natural resources, whereas that of Qinghai was relatively low, at 4163.20 thousand NHA. The ecological footprint in Northwest China increased from 57,770.19 thousand NHA in 2005 to 96,501.66 thousand NHA in 2014, predominantly attributed to the growth of the fossil energy ecological footprint (coal accounted for 72.88%, crude oil accounted for 14.97%, and coke accounted for 6.67%). The changes in the ecological footprint per 10,000 CNY gross domestic product, the ecological footprint diversity index, and the development capacity index in the study period revealed an increase in the comprehensive development capacity in this region, which should improve the regional capacity for sustainable development, but the stability of the eco-economic systems in Shanxi, Ningxia, and Xinjiang require improvement. This analysis provides the reference information for the construction of an ecologically viable civilization in Northwest China and the scientific foundation for the implementation of the Belt and Road Initiative.

1. Introduction
Accelerating global change has become a hotspot and increasingly important for assessing sustainability in recent decades [1,2]. Sustainable development is an important way to achieve harmony between humans and nature, by instituting resource saving to realize the coordinated growth of populations, economies, and environmental resources [3,4]. A regional sustainable ecological status has important practical significance for the ecological stability of the environment and the improvement of man-land relationships [5,6]. It is particularly important that the relationships between humans and natural and economic resources are adjusted in a rational manner.
Ecological footprints are the areas of biological production necessary for regions or individuals to maintain their resource consumption and to absorb their waste [7]. The ecological footprint reflects the human impact on the environment and allows the balance between the supply of and demand for economic resources to be evaluated and the level of sustainable development to be quantified [7,8]. It reflects the human influence on the environment, including the mechanisms of sustainability [9]. Therefore, the study of a regional ecological footprint is an important foundation for sustainable development and the promotion of an ecologically viable civilization [10,11].
The concept of the ecological footprint was proposed in the 1990s by Rees, who used this vivid metaphor to describe the impact humans have on the Earth [12]. Wackernagel then defined the concept from a different perspective and modified it [7,13]. Other studies have predominantly used the concept to assess the sustainable development status of regions or countries [11,14]. The concept of the ecological footprint was introduced into China at the end of the 20th century and quickly became a research hotspot for assessing national, provincial, and municipal standards of land use, climate change, resource utilization, and so on [15,16,17]. The ecological footprint model is closely linked to spatial criteria. Global hectares (GHA) are used for international analyses and comparisons but may not accurately reflect the actual situation when defining regional characteristics. It may cause large errors in regional comparison, entailing problems in data acquisition and standardization on national, provincial, and municipal spatial scales [18,19]. To more sensitively reflect the status of ecological footprints in different provinces and cities in the same country, the concept of “national hectares” (NHA) has been proposed, based on the concept of global hectares, and has great utility in smaller-scale studies [19,20]. The dynamic analysis of ecological footprints has attracted increasing attention in recent years since economic and social systems are constantly changing. The changes in ecological footprints were analyzed in a time series to examine the evolution of regional sustainable development [21] and to predict future developments [22]. A dynamic analysis of ecological footprints is very useful in determining the responses of the ecological environment to social and economic changes and can provide targeted recommendations on how to extend the regional capacity for sustainable development.
The Chinese government has instituted the Silk Road Economic Belt to promote international connectivity and to build a new geographic economic pattern [23,24]. Five provinces in Northwest China are the main areas involved in this belt. However, their geographic location and natural environment mean that there are serious ecological and environmental problems. Research into the ecological footprint of the Silk Road Economic Belt in Northwest China is an important way to measure the sustainable development status of the region, and is also an important approach for implementing the national strategy.
Therefore, this paper calculates the ecological footprints of five provinces in Northwest China in 2005–2014, with a model of ecological footprint based on NHA, and analyze the spatial and temporal variations in these ecological footprints and the regional capacity for comprehensive development. It is extremely important to provide a scientific basis for sustainable development strategies that can be employed in construction of the Silk Road Economic Belt in this area.
2. Data and Methods
2.1. Study Area
The study areas examined in this paper are five provinces in Northwest China that account for 32.2% of the total land area of China: Shanxi Province (Shanxi), Gansu Province (Gansu), Qinghai Province (Qinghai), Ningxia Hui Autonomous Region (Ningxia), and Xinjiang Uygur Autonomous Region (Xinjiang) (Figure 1). These areas have an arid or semi-arid temperate continental climate, varied morphology, and are rich in natural resources. However, the ecosystem and natural environment are fragile, and some current situations are seriously detrimental, such as the sandy desertification caused by wind erosion, and the degradation of range lands by excessive cultivation and overgrazing [25,26].
The study area is part of the Silk Road Economic Belt and is highly significant in the coordinated development of the regional economy. However, compared with East China, this region has a much lower level of economic development, and its lower per capita gross domestic product (GDP) has resulted in a gradual disparity in industrial structure relative to that of East China [23]. Since the implementation of western development strategies, industrial output has played an expanding role in the economic structures of the five provinces, and the development of tertiary industries has gradually expanded. The economic levels of Shanxi and Xinjiang are increasingly superior to those of Qinghai, Gansu, and Ningxia [27].
2.2. Methods
2.2.1. Ecological Footprint Model Based on NHA
When the ecological footprint was calculated, the consumption of all types of materials and energy was converted into corresponding areas of biologically productive land. These areas were classified into the following six main categories: arable land, forest, pasture, fishing grounds, built-up areas, and fossil energy land. The average biological productivity was multiplied by an equivalence factor to convert each into a standardized area of biological production. This allowed their direct comparison and the identification of any differences in ecological productivity
where k is the type of biologically productive land; rk is the equivalence factor of the k-th type of land; dk is the average productivity of the k-th type of land (kg·ha−1), and D is the average productivity of the total national land (kg·ha−1). The equivalence factors for the various biologically productive lands in this paper are based on data from Gu et al. [28]: the equivalence factor for arable land is 5.25, for forest is 0.21, for pasture is 0.09, for fishing grounds is 0.14, for built-up areas is 5.25, and for fossil energy land is 0.21. This standardization allowed us to compare the results for different provinces and years.
The ecological footprint was calculated as follows:
where EF is the final ecological footprint (NHA); N is the total population; ef is the per capita ecological footprint (NHA per capita); i is the type of resource that people consume; efi is the per capita ecological footprint of the i-th type of consumption (NHA per capita); Pi is the annual per capita consumption of the i-th consumed item (kg per capita); Yi is the national annual average productivity of the i-th consumed item (kg·ha−1)
where Mi is the national annual average yield on ecologically productive land of the i-th consumed item (kg); Qi is the national biologically productive area of the i-th consumed item (ha). The national annual average productivity of the main items of biological resource consumption in 2005–2014 was calculated (Table 1), and although quite a few data were missing. The corresponding data were calculated by the China Statistical Yearbook, taken from Dai et al. [29], or interpolated with the moving average method. The average calorific value of world’s production of fossil fuel was used to calculate energy consumption.
2.2.2. Comprehensive Regional Development Capacity
The comprehensive regional development capacity is influenced by natural factors, social factors, economic factors, and so on. The regional comprehensive development status can be evaluated with the ecological footprint per 10,000 CNY GDP, the ecological footprint diversity index, and the development capacity index. With the development of science and technology, the influence of human factors on the utilization of regional natural resources is increasing. To quantify the efficiency of natural resource utilization, the ecological footprint per 10,000 CNY GDP has been introduced [30] as
where T is the ecological footprint per 10,000 CNY GDP (NHA /10,000 CNY), EF is the ecological footprint (NHA), and GDP is gross domestic product per year (10,000 CNY). The higher the ecological footprint per 10,000 CNY GDP, the lower will be the resource utilization efficiency.
The ecological footprint diversity index indicates the number of different types of land used and the distribution of the ecological footprint, and reflects the degree of balance and fairness in the eco-economic system [30]. The Shannon-Weaver formula was used to calculate the ecological footprint diversity index [31].
where H is the ecological footprint diversity index and Mk is the proportion of the k-th land type in the total ecological footprint. The higher the H, the higher the ecological footprint diversity. The more balanced the distribution of the ecological footprint, the better will be the stability of the eco-economic system.
The development capacity index, which reflects the developmental status of the ecological economic system, was calculated as follows with the Ulanowicz method [32]:
where C is the development capacity index (NHA), and ef is the per capita ecological footprint (NHA per capita). The higher the C, the higher the development capacity. Improving the ecological footprint diversity is an efficient way to increase the development capacity.
This paper used the ecological footprint per 10,000 CNY GDP, ecological footprint diversity index and development capacity index to evaluate the sustainability more comprehensively and strictly, since the regional development is complex.
2.3. Data Sources
In this study, the data on the main items of consumption and productive areas in 2005–2014 were taken from the China Statistical Yearbook [33]. The data on the consumption of biological resources (grain, oil, eggs, fruit, sugar, pork, beef, timber, and so on) were taken from the statistical yearbooks for each area [34,35,36,37,38], and individual missing data were interpolated with the moving average method. Data on the consumption of energy (coal, coke, crude oil, gasoline, kerosene, diesel, fuel oil, natural gas, and electricity) were taken from the China Energy Statistical Yearbook (2006–2014) [39] and the statistical yearbooks for each area in 2015 [34,35,36,37,38].
3. Results
3.1. Spatial and Temporal Variations in the Ecological Footprints in Northwest China
3.1.1. Spatial Variations in the Ecological Footprints in Northwest China
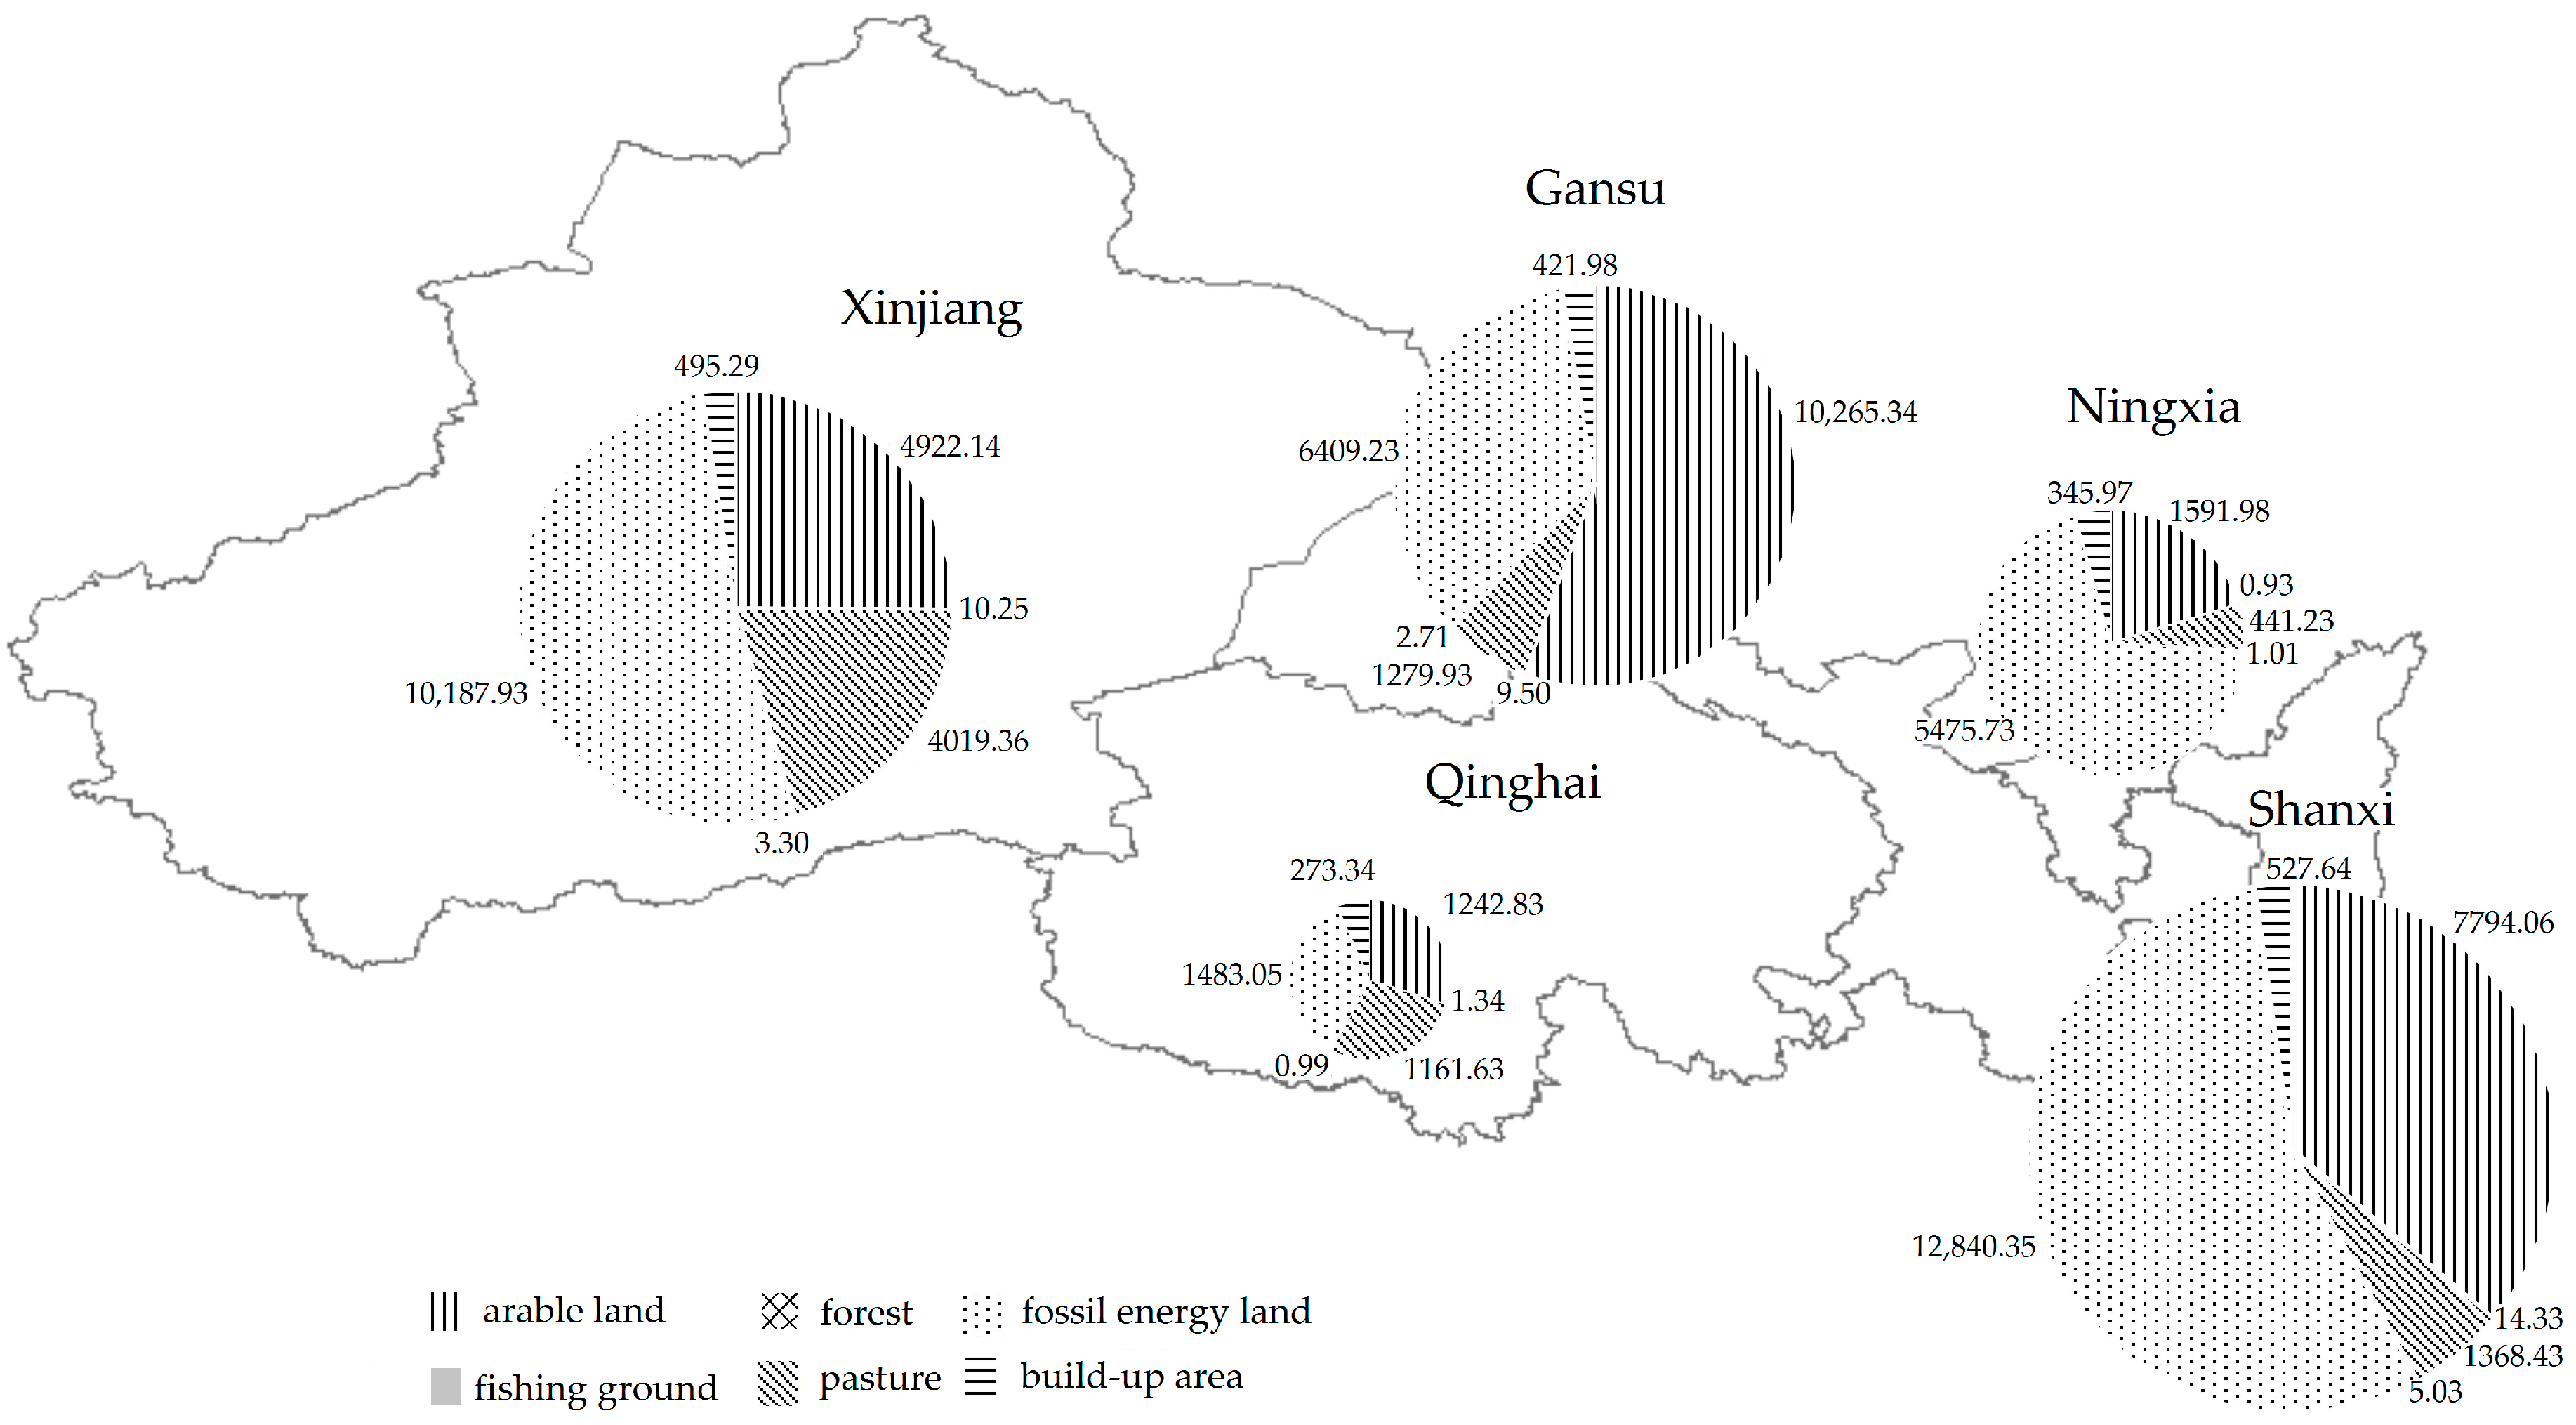
From 2005 to 2014, the total ecological footprints of Northwest China were 72,666.92 thousand NHA per year: for the arable land ecological footprint was 25,816.36 thousand NHA, for the forest footprint was 36.37 thousand NHA, for the pasture footprint was 8270.60 thousand NHA, for the fossil energy ecological footprint was 36,396.30 thousand NHA, for the ecological footprint of build-up area was 2134.24 thousand NHA (Figure 2). The average ecological footprint in Northwest China in 2005–2014 was 14,533.38 thousand NHA, and there were obvious disparities between the provinces. The average ecological footprint in this 10 years was highest in Shanxi, at 22,549.86 thousand NHA, whereas that of Qinghai was lowest, at only 4163.20 thousand NHA. This discrepancy may be related to the low level of economic development in Qinghai. In terms of the ecological footprint for biological resources, those of Gansu and Shanxi were highest, whereas those of Qinghai and Ningxia were relatively low, and that of Gansu (9150.70 thousand NHA) was 2.8 times greater than that of Qinghai. Arable land accounted for a large proportion of the ecological footprints for the biological resources in each province. This proportion was 55.61% in Gansu, whose arable land footprint was the highest in Northwest China. The pasture footprint of Xinjiang was 4019.36 thousand NHA, much higher than those of the other provinces, and this difference may be related to the heavy consumption of cattle and sheep by local people. The energy ecological footprints of Shanxi (which is the highest, at 12,840.35 thousand NHA) and Qinghai (the lowest, at 1483.05 thousand NHA) differed greatly. Ningxia accounted for the largest proportion at 69.69% of fossil energy land. The proportions of forest, fishing grounds, and built-up areas in each province were very small, and there was little difference in these proportions among the five provinces. Arable land and fossil energy land, followed by pasture, were the main sources of the differences in the ecological footprints of the five provinces.
The ecological footprint in Northwest China in 2005–2014 is shown in Figure 3. Over the study period, the ecological footprint of Shanxi was relatively high with a maximum value of 31,006.38 thousand NHA. However, Qinghai was relatively low with a minimum value of 3689.89 thousand NHA. There was a maximum difference between the maximum and minimum values in Shanxi, at 13,330.73 thousand NHA, while it was only 1245.53 NHA in Qinghai.
3.1.2. Temporal Variations in the Ecological Footprints in Northwest China
The changes in the ecological footprint in Northwest China (Figure 4) showed that there was an obvious increasing trend over the study period. It increased from 57,770.19 thousand NHA in 2005 to 96,501.66 thousand NHA in 2014, at a rate of 3873.15 thousand NHA per year. The fossil energy ecological footprint increased 34,896.14 thousand NHA during the studied period, which accounted most for the growth of total ecological footprint. The arable land ecological footprint and the pasture footprint also had large proportions, but showed no obvious increase.
Dynamic Changes in the Arable Land Ecological Footprints in Northwest China
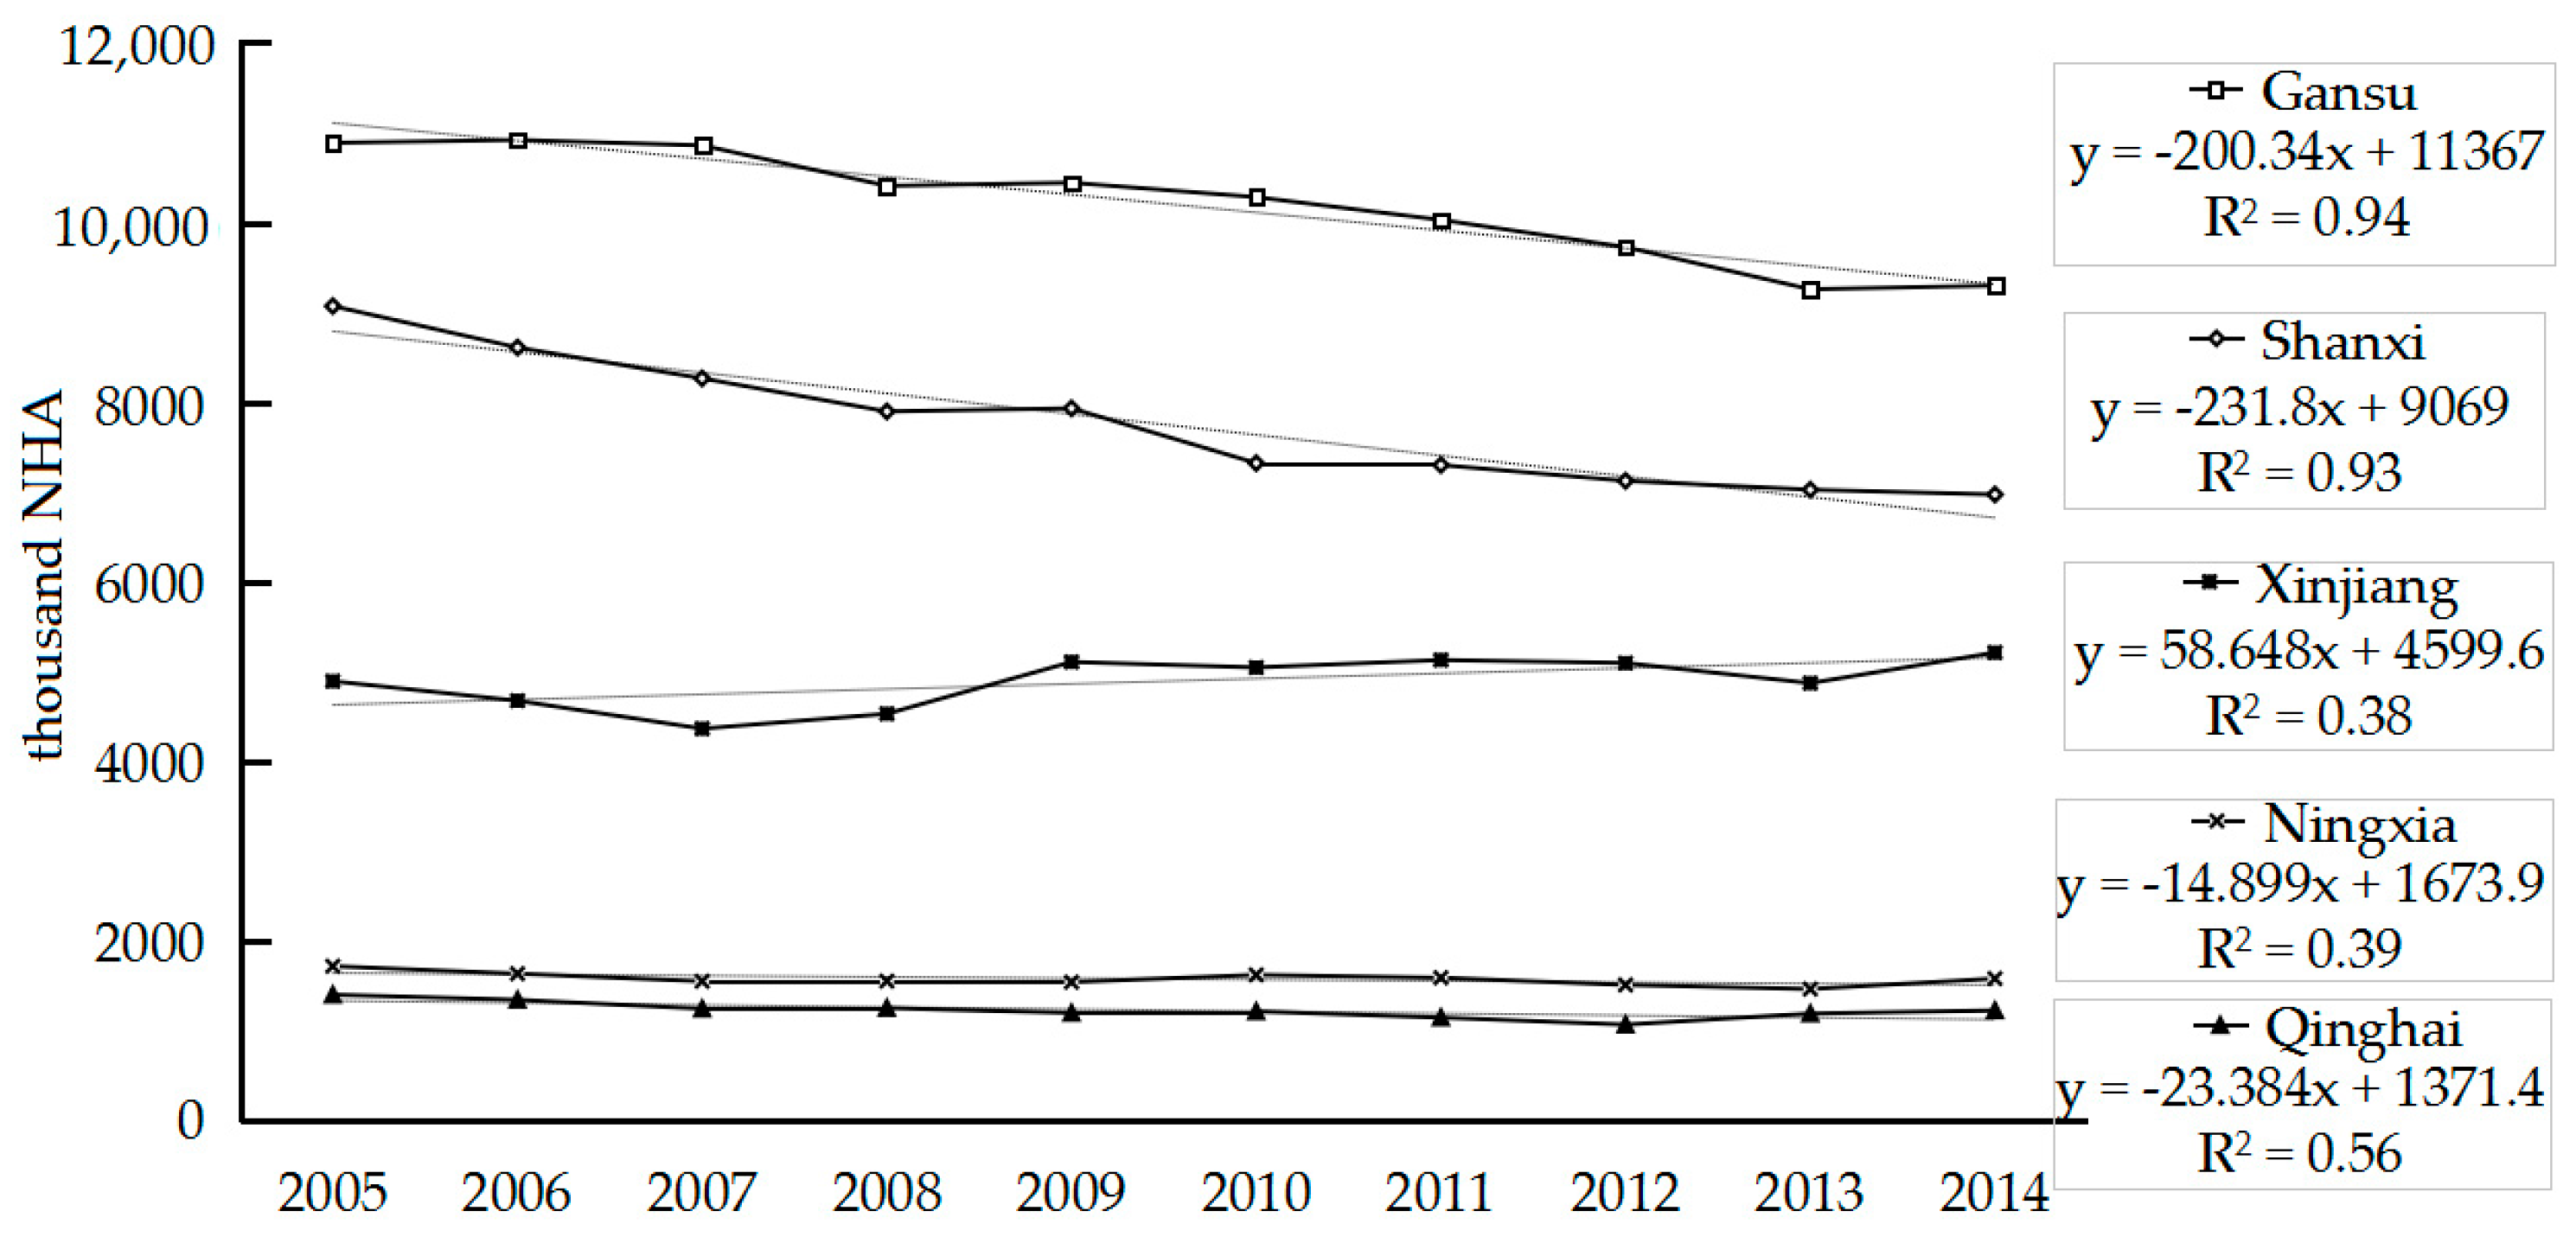
The total arable land ecological footprint in Northwest China showed a deceasing trend overall. It dropped from 28,137.33 thousand NHA in 2005 to 24,438.33 thousand NHA in 2014 (Figure 5). The changes in the arable land ecological footprints in the five northwest provinces showed that the average arable ecological footprint in Gansu was highest in this area over the study period, with an overall decreasing trend at a rate of 200.03 thousand NHA per year, decreasing by 1596.61 thousand NHA between 2005 and 2014. This reduction might be related to the decline in farmland area under the Grain for Green Policy. The arable ecological footprint of Shanxi showed a relatively clear declining trend over the study period, at a rate of 231.80 thousand NHA per year. It dropped from 9118.81 thousand NHA to 7011.01 thousand NHA, whereas the population increased and the economic level improved, indicating that the efficiency of arable land utilization in Shanxi was increasing. The ecological footprint for arable land in Xinjiang showed a fluctuating trend, with no obvious increase, and a rate of 58.65 thousand NHA per year. The arable ecological footprints in Qinghai and Ningxia were still relatively low, which might be associated with the sizes of their populations. These two provinces showed fluctuating trends and slight declines, with rates of 14.90 thousand NHA per year in Ningxia and 23.38 thousand NHA per year in Qinghai.
Dynamic Changes in the Fossil Energy Ecological Footprints in Northwest China
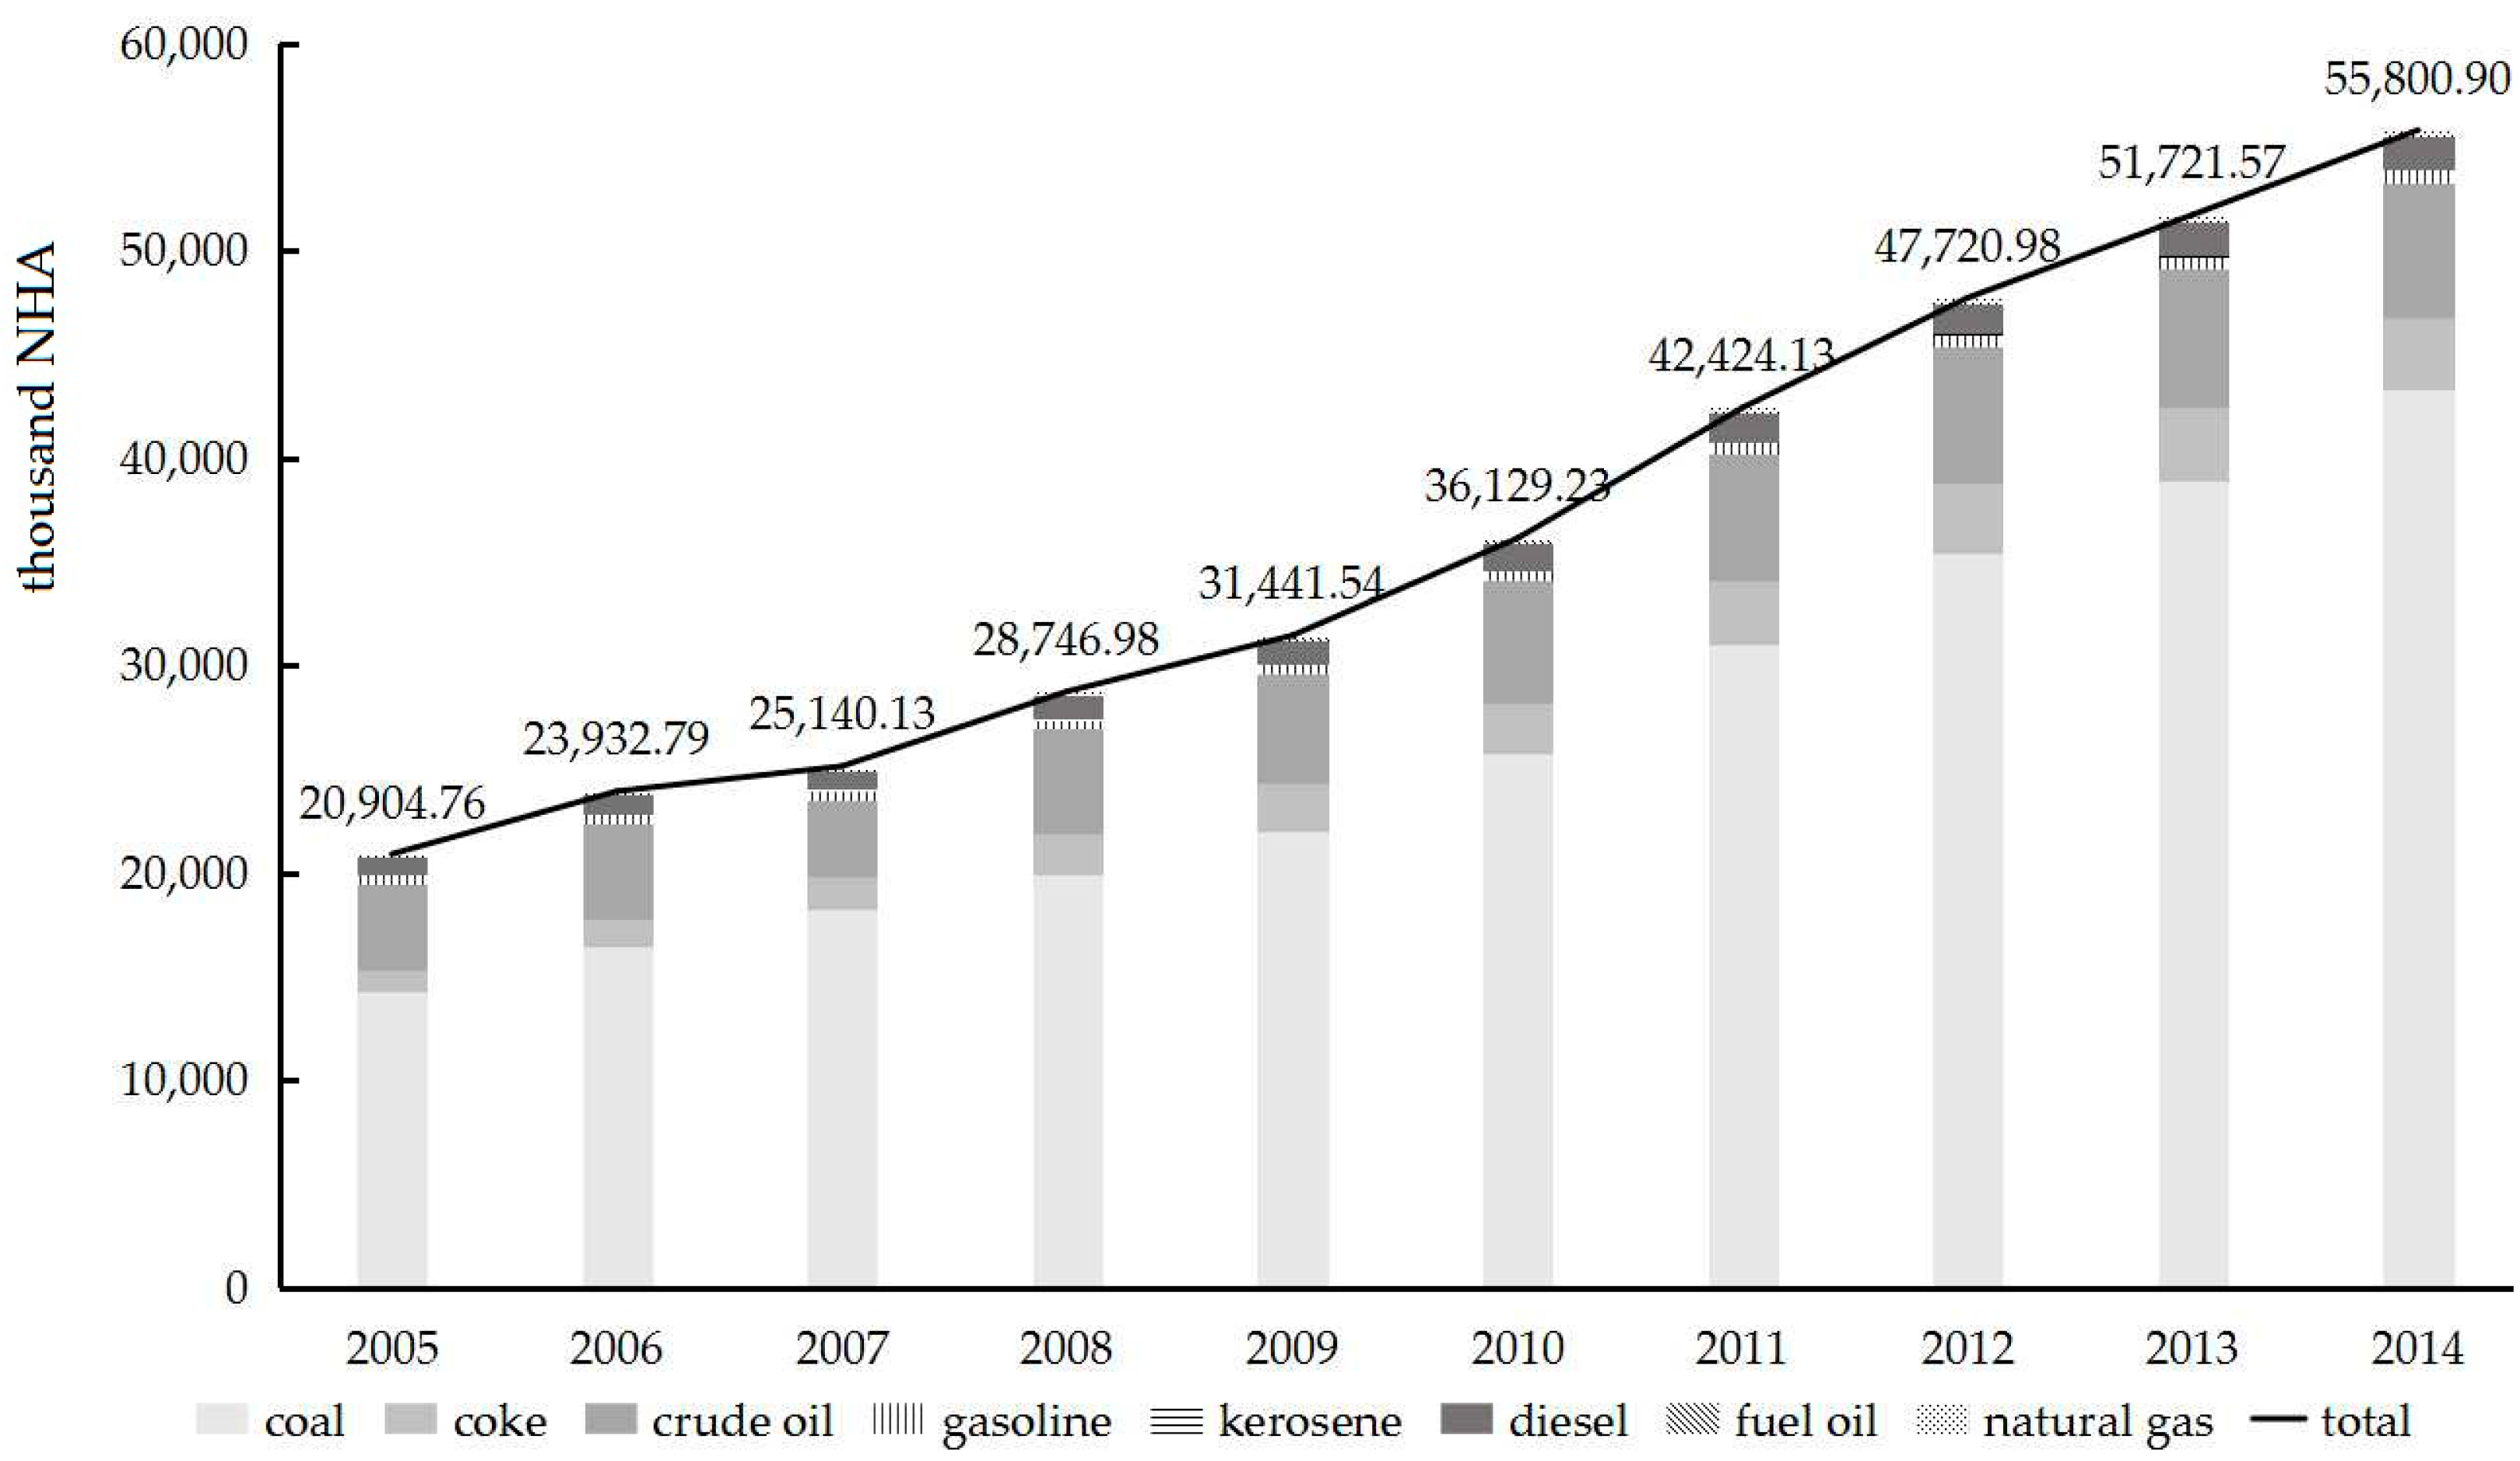
The changes in the fossil energy ecological footprints in Northwest China (Figure 6) showed increasing trends in 2005–2014, which might be related to improvements in regional economic development, with more energy consequently consumed. The total fossil energy ecological footprint increased from 20,904.76 thousand NHA in 2005 to 55,800.90 thousand NHA in 2014, at a rate of 3489.6 thousand NHA per year. Each item of fossil energy ecological footprint showed an increasing trend over the study period. The coal accounted for the largest proportion at 72.88%, followed by the crude oil at 14.97%, and the coke at 6.67%.
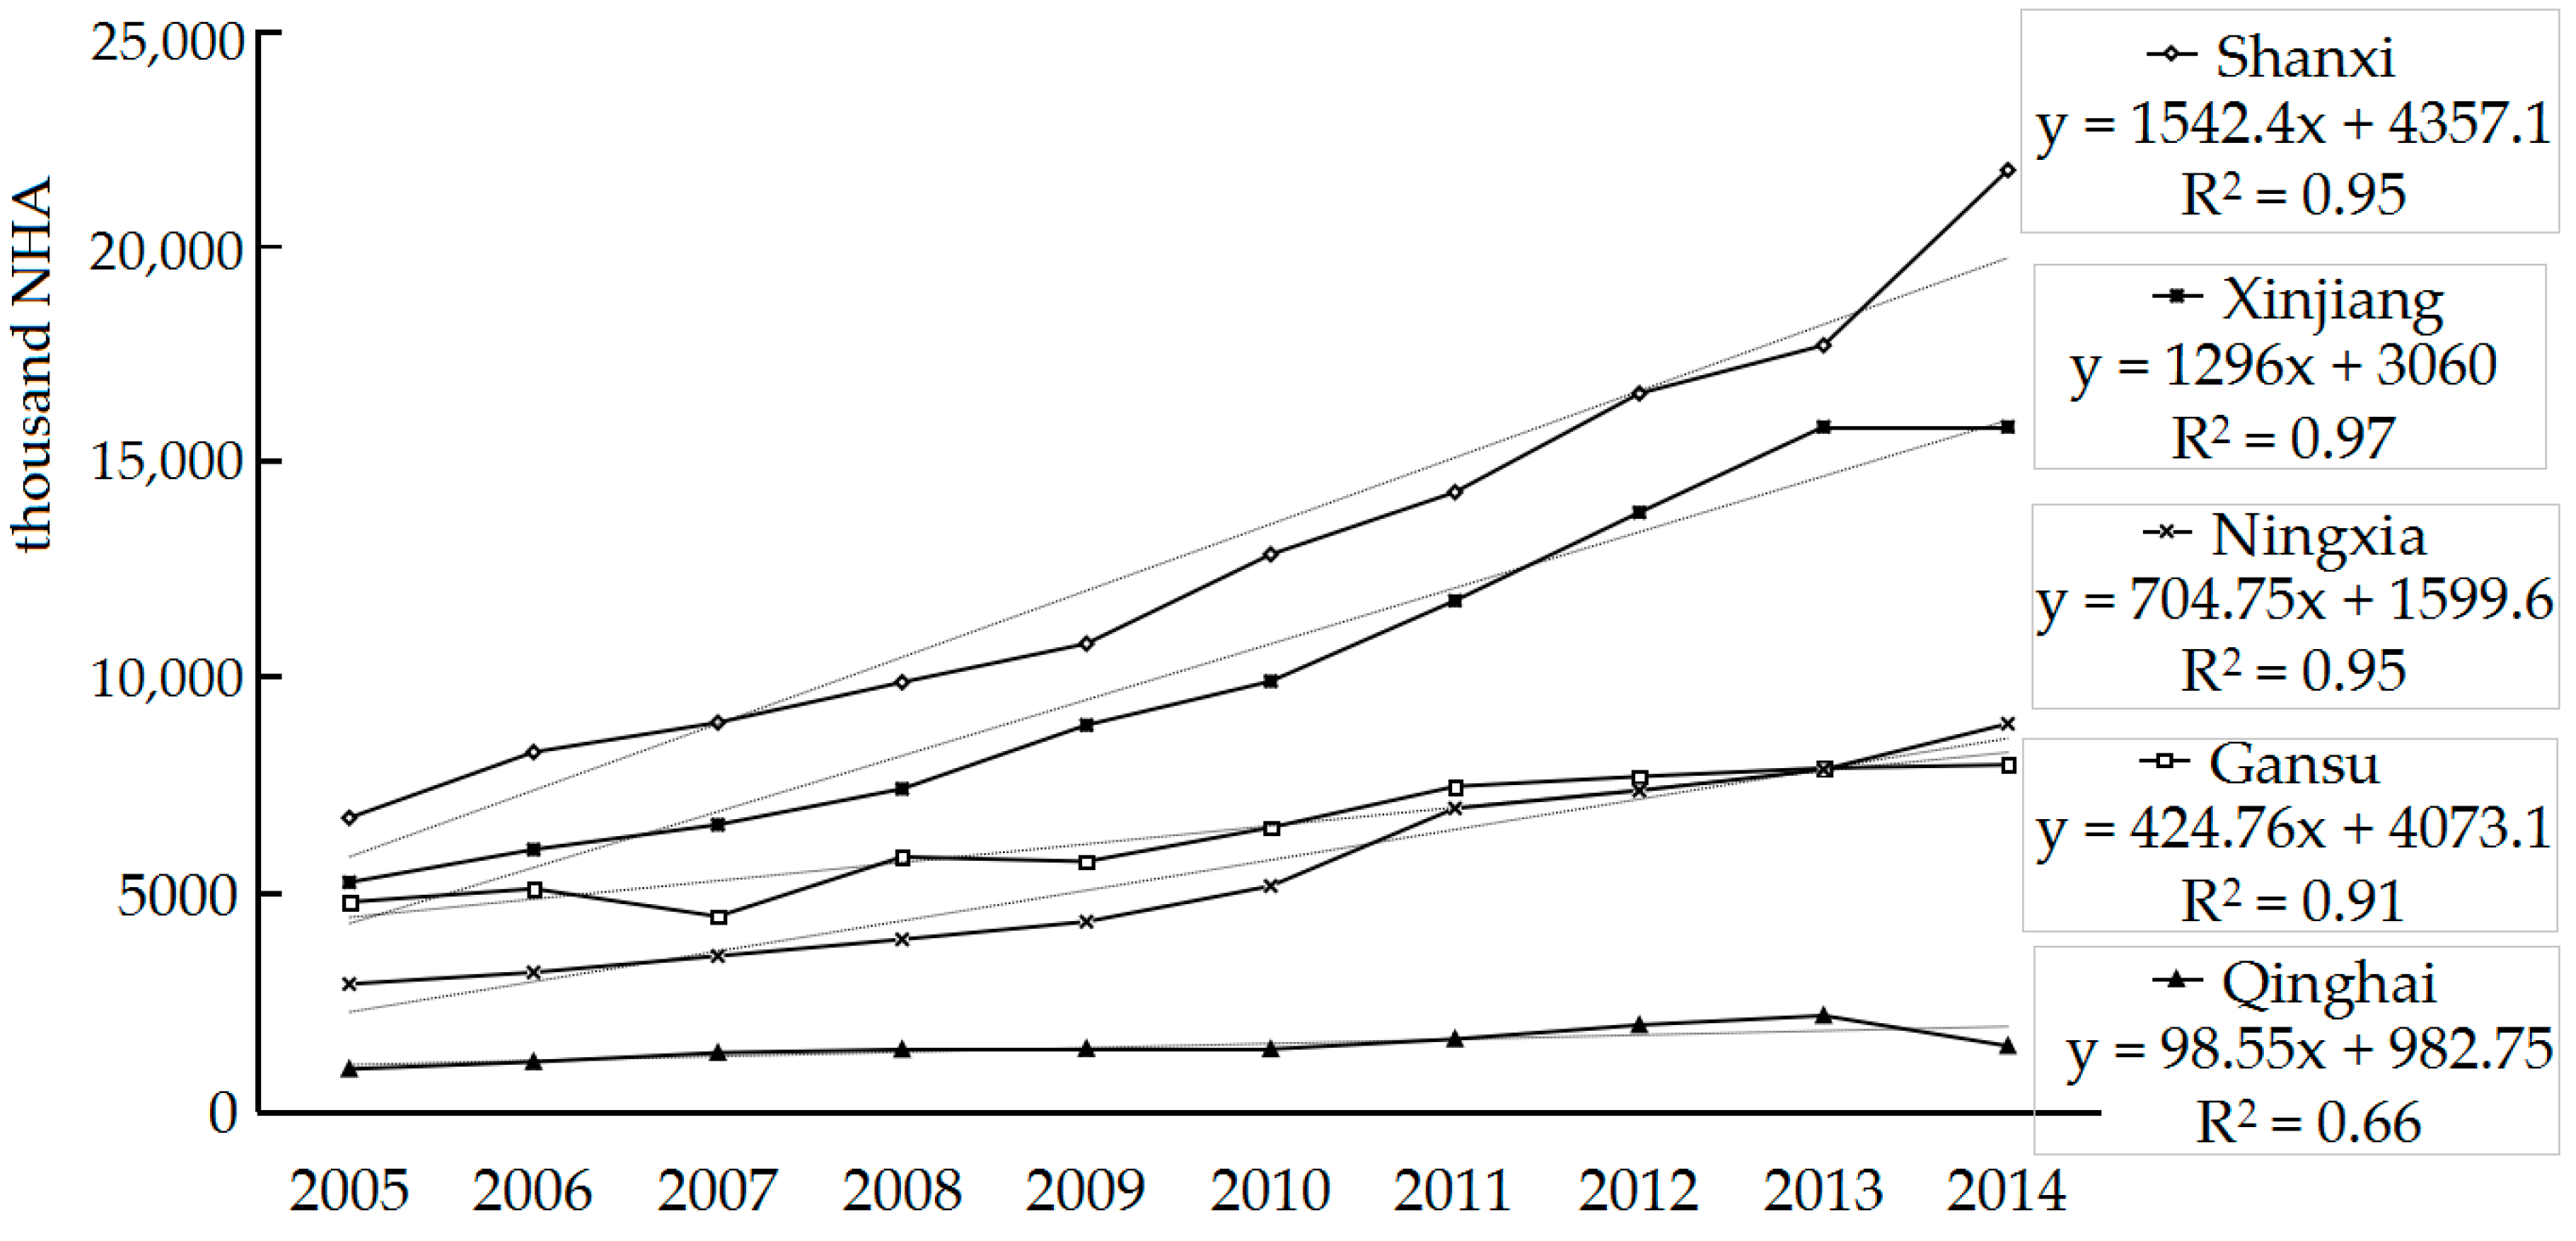
The changes of fossil energy ecological footprints of each province (Figure 7) showed that the fossil energy ecological footprint in Shanxi was highest in the region from 2005 to 2014. It increased from 6804.52 thousand NHA to 21,815.10 thousand NHA, at a rate of 1542.4 thousand NHA per year. Qinghai had the lowest fossil energy ecological footprint, with a low growth rate of only 98.55 thousand NHA per year, which may be associated with its level of economic development, was relatively low for Northwest China. The fossil energy ecological footprints in Xinjiang, Gansu, and Qinghai increased steadily to 2013, but then decreased significantly in 2014. That may be attributable to the regional policy adjustment that reduced energy consumption. The fossil energy ecological footprints in Shanxi and Ningxia increased greatly in 2014, and Shanxi had the highest growth of 4059.43 thousand NHA per year. Therefore, in the last two years, some measures must have been taken to improve its efficiency of energy utilization while developing its economy.
During 2005–2014, the energy ecological footprints accounted for a large proportion of the total ecological footprints in Northwest China, and increased greatly. It was concluded that the main cause of the increase in the regional ecological footprint was the increase in the fossil energy ecological footprint. Reducing energy consumption, especially the coal, may be critical in reducing the regional ecological footprint and the overall regional ecological footprint.
3.2. Analysis of the Overall Regional Development
To evaluate the comprehensive regional development capacity of Northwest China, the ecological footprint per 10,000 CNY GDP, the ecological footprint diversity index, and the development capacity index were calculated (Table 2).
The ecological footprints per 10,000 CNY GDP reflect the differences in the efficiency of resource consumption in the five provinces. The ecological footprints per 10,000 CNY GDP for the provinces showed a downward trend, indicating that the efficiency of the provinces’ resource utilization has improved. The average was lowest for Shanxi, indicating that Shanxi had a high demand for natural capital, but its resource utilization efficiency was the highest at this time. Resource utilization efficiency was lowest in Ningxia, with a high ecological footprint per 10,000 CNY GDP of 0.54 NHA. The ecological footprint per 10,000 CNY GDP for Gansu clearly decreased, from 0.90 NHA in 2005 to 0.29 NHA in 2014, equivalent to a reduction of 0.61 NHA per 10,000 CNY in total. Ningxia, which had a relatively high ecological footprint per 10,000 CNY GDP of 0.42 NHA in 2014, must improve the efficiency of its resource utilization.
It can be seen from the ecological footprint diversity index that the index was highest in Qinghai, with a range of 1.21–1.30 since 2005, which indicates that the allocation of the ecological footprint in Qinghai was spread more equally among different types of biologically productive land than in the other provinces, and that the stability of the eco-economic system was also greatest. Xinjiang was not far behind, with an average index of 1.11. The ecological footprint diversity indices of Shanxi, Gansu, and Ningxia were not markedly different, indicating that the proportions of the ecological footprints contributed by each biologically productive land type were similar in these three provinces. From 2005 to 2014, the ecological footprint diversity indices of Qinghai and Gansu increased slightly, indicating that the coordination between economic development and the ecological environment gradually improved. The ecological diversity in Shanxi, Ningxia, and Xinjiang declined over the past 10 years, which indicates that economic development is causing some destruction of the ecological environment, and it will be necessary to improve the mode of economic development to protect the ecological environment.
Based on the development capacity index, Ningxia had the best development capacity in Northwest China, with a high average development capacity index of 1.07 NHA. Shanxi had the lowest development capacity index of 0.58 NHA, which might be associated with the large size of the regional population. From 2005 to 2014, the development capacity indices of these five provinces have shown a steadily increasing trend, indicating that regional economic development is improving with the correct guidance of the Belt and Road Initiative.
When the ecological footprint per 10,000 CNY GDP, the ecological footprint diversity index, and the development capacity index for Northwest China 2005–2014 were comprehensively analyzed, Shanxi’s demand for natural capital increased, and at the same time, its resource utilization efficiency grew, whereas the stability of its eco-economic system decreased, reflecting increasing conflict between the ecological environment and social and economic development. The resource utilization efficiency of Gansu clearly increased, and its ecological footprint diversity index and development capacity index also increased, indicating an increase in the coordination of economic development and the ecological environment, improving the capacity of this province for sustainable development. The resource utilization efficiency of Ningxia was relatively low, whereas its development capacity index was the highest in this area. The resource utilization efficiency and development capacity index of Qinghai continued to increase, and its ecological footprint diversity was also relatively high. This showed that the coordination between economic development and the ecological environment in Qinghai was the best of the five provinces examined, and clearly promotes the sustainable development of this region. From 2005 to 2014, the resource utilization efficiency and regional development capacity of Xinjiang steadily improved and its eco-economic stability was relatively superior, which is conducive to the improvement of its capacity for regional sustainable development.
4. Conclusions and Discussion
4.1. Conclusions
This paper estimated the national average production of the major items of biological resource consumption, and analyzed the temporal and spatial variations in the ecological footprints and the overall regional development capacity of Northwest China from 2005 to 2014 using the theory and methods of ecological footprint analysis based on the NHA. The main conclusions drawn are:
- The ecological footprint in Northwest China was 72,666.92 thousand NHA per year. The average ecological footprints of the provinces in Northwest China range from high to low in the order: Shanxi (22,549.86 thousand NHA) > Xinjiang (19,638.27 thousand NHA) > Gansu (18,548.71 thousand NHA) > Ningxia (7856.87 thousand NHA) > Qinghai (4163.20 thousand NHA). Arable land and fossil energy land account for a large proportion of the total ecological footprint, and are the principal factors contributing to the disparities among the provinces. The ecological footprint for arable land was highest in Gansu and lowest in Qinghai. The ecological footprint for pasture in Xinjiang was significantly higher than that in the other provinces, at 4019.36 thousand NHA. The ecological footprint for fossil energy land was highest in Shanxi, at 12,840.35 thousand NHA, and Ningxia contained the largest proportion of fossil energy land of any province.
- From 2005 to 2014, the dynamic changes in the ecological footprint in Northwest China increased from 57,770.19 thousand NHA in 2005 to 96,501.66 thousand NHA in 2014. The fossil energy ecological footprint increased 34,896.14 thousand NHA which accounted a large proportion for the increase of total ecological footprint. The arable ecological footprint of Gansu decreased each year, decreasing by 1596.61 thousand NHA between 2005 and 2014. That of Shanxi also decreased, at a rate of 231.80 thousand NHA per year. Those of Xinjiang, Ningxia, and Qinghai changed little. However, the fossil energy ecological footprint, which is the major determinant of the ecological footprint, increased from 20,904.76 thousand NHA in 2005 to 55,800.90 thousand NHA in 2014. Each province tended to increase, especially in Shanxi. This indicates that regional economic growth is based on the mass consumption of energy.
- The ecological footprints per 10,000 CNY GDP in Northwest China showed decreasing trends from 2005 to 2014. The ecological footprint diversity indexes were highest in Qinghai, with a range of 1.21–1.30. The development capacity indexes showed that Ningxia had a high value of 1.07 NHA, while Shanxi had the lowest value of 0.58 NHA. In Gansu and Qinghai, resource utilization efficiency, eco-economic system stability, and developmental capacity all increased, indicating that the degree of harmony between the economy and the environment is increasing, which is conducive to sustainable development. In Shanxi, Ningxia, and Xinjiang, resource utilization efficiency and developmental capacity increased, but the stability of the eco-economic system requires further improvement.
4.2. Discussion
In this paper, using the modified ecological footprint method, it was found that arable land and fossil energy land account for a large proportion of the total ecological footprint, and are the main factors responsible for the differences among the provinces. The ecological footprints of the five provinces tended to increase in the period examined, which was mainly attributed to the increase in energy consumption. Therefore, this paper suggests that improving the efficiency of energy consumption and the energy structure would be effective ways to promote regional sustainable development. As the population increases and the economy develops, it is necessary to consider the energy consumption in Northwest China and make the best use of this energy. The region is rich in energy reserves, but it is a relatively fragile ecological environment. The consumption of large amounts of energy and the excessive emission of waste may accelerate the deterioration of the regional ecological environment. More attention must be paid to energy consumption and its efficient utilization, by the reasonable use of regional resources and by implementing resource cooperation and development between regions. As shown in this paper, coal and crude oil accounted for a large proportion of fossil energy ecological footprint. It is therefore important to improve the energy structure in Northwest China. Developing new energy (e.g., solar energy and wind energy) can reduce the dependency on fossil energy and can be helpful to the regional sustainable development.
The results in this paper show that there were spatial disparities of ecological footprint in Northwest China that Shanxi was the highest and Qinghai was the lowest, and that there were increasing trends in five provinces from 2005 to 2015. On spatial distribution, it is consistent with the results of Wu et al. [40]. On temporal variation, it is also in line with the results of Li et al. [21] who founded an increasing trend from 1990 to 2010 in Shanxi, Gansu, Ningxia and Xinjiang, and of Yue et al. [41] who showed a steadily growth in Gansu from 1995 to 2003. In this paper, we used the equivalence factors on national scale based on Equation (1) from Gu et al. [28]. This method mainly focuses on representing actual human consumption [9,20,42]. Recently, the equivalence factors based on net primary productivity (EQF-NPP) was proposed, which emphasized the productivity provided by various land types [43]. However, total NPP measurements have been criticized for reflecting relative levels of total production rather than those useful for human [20]. And the NPP estimation accuracy still needs to be further improved [44,45,46].
Although the results of the improved ecological footprint method, using NHA as the unit of measure, better reflect regional differences, the method still has some limitations, including the failure to include water resources [15], which may lead to uncertainties in the results. Therefore, in future studies, it will be important to further improve the ecological footprint model to achieve a more comprehensive assessment of different regions. This will allow for the discussion of the driving mechanisms in depth and therefore provide more effective ways to improve the harmony between regional ecologies and economies and the capacity for sustainable development. In other words, such studies may identify new ways to achieve regional sustainable development, by taking full advantages of the history and geography of the Silk Road Economic Belt against the background of the Belt and Road Initiative.
Acknowledgments
This work was supported by the Key Program of the National Natural Science Foundation of China (41530749) and the Cultivate Project of the Institute of Geographic Sciences and Natural Resources Research, CAS (TSYJS03).
Author Contributions
Yunhe Yin designed the research; Xiang Han performed the analysis; Yunhe Yin, Xiang Han, and Shaohong Wu drafted the paper.
Conflicts of Interest
The authors declare no conflict of interest.
References
- Grimm, N.B.; Faeth, S.H.; Golubiewski, N.E.; Redman, C.L.; Wu, J.; Bai, X.; Briggs, J.M. Global Change and the Ecology of Cities. Science 2008, 319, 756–760. [Google Scholar] [CrossRef] [PubMed]
- Castree, N. Geography and the new social contract for global change research. Trans. Inst. Br. Geogr. 2016, 41, 328–347. [Google Scholar] [CrossRef]
- Reyer, C.; Bachinger, J.; Bloch, R.; Hattermann, F.F.; Ibisch, P.L.; Kreft, S.; Lasch, P.; Lucht, W.; Nowicki, C.; Spathelf, P.; et al. Climate change adaptation and sustainable regional development: A case study for the federal state of Brandenburg, Germany. Reg. Environ. Chang. 2012, 12, 523–542. [Google Scholar] [CrossRef]
- Griggs, D.; Stafford-Smith, M.; Gaffney, O.; Rockstrom, J.; Ohman, M.C.; Shyamsundar, P.; Steffen, W.; Glaser, G.; Kanie, N.; Noble, I. Policy: Sustainable development goals for people and planet. Nature 2013, 495, 305–307. [Google Scholar] [CrossRef] [PubMed]
- Ostrom, E. A general framework for analyzing sustainability of social-ecological systems. Science 2009, 325, 419–422. [Google Scholar] [CrossRef] [PubMed]
- Zhang, Q.; Zhang, L.; Li, Y. Exploring the path of regional eco-compensation under the coordination of man-land relationship perspective. Disaster Adv. 2012, 5, 31–36. [Google Scholar]
- Wackernagel, M.; Onisto, L.; Bello, P.; Linares, A.C.; Falfán, I.S.L.; García, J.M.; Guerrero, A.I.S.; Ma, G.S.G. National natural capital accounting with the ecological footprint concept. Ecol. Econ. 1999, 29, 375–390. [Google Scholar] [CrossRef]
- Costanza, R. The dynamics of the ecological footprint concept. Ecol. Econ. 2000, 32, 341–345. [Google Scholar]
- Wackernagel, M.; Silverstein, J. Big things first: Focusing on the scale imperative with the ecological footprint. Ecol. Econ. 2000, 32, 391–394. [Google Scholar]
- Holden, E. Ecological footprints and sustainable urban form. J. Hous. Built Environ. 2004, 19, 91–109. [Google Scholar] [CrossRef]
- Dakhia, K.; Berezowskaazzag, E. Urban institutional and ecological footprint: A new urban metabolism assessment tool for planning sustainable urban ecosystems. Manag. Environ. Qual. Int. J. 2010, 21, 78–89. [Google Scholar] [CrossRef]
- Rees, W.E. Ecological footprints and appropriated carrying capacity: What urban economics leaves out. Environ. Urban. 1992, 4, 121–130. [Google Scholar] [CrossRef]
- Wackernagel, M.; Rees, W. Our Ecological Footprint: Reducing Human Impact on the Earth; New Society Publishers: Victoria, BC, Canada, 1996; pp. 61–83. [Google Scholar]
- Toth, G.; Szigeti, C. The historical ecological footprint: From over-population to over-consumption. Ecol. Indic. 2016, 60, 283–291. [Google Scholar] [CrossRef]
- Zeng, Z.; Liu, J.; Koeneman, P.H.; Zarate, E.; Hoekstra, A.Y. Assessing water footprint at river basin level: A case study for the Heihe River Basin in Northwest China. Hydrol. Earth Syst. Sci. 2012, 16, 2771–2781. [Google Scholar] [CrossRef]
- Cesaretti, G.P.; Harris, K.T.; Khalil, M.T.; Misso, R.; Osborne-Lee, I.W.; Shakir, H.S.H. Global ecological footprint, climate change impacts and assessment. Rivista Di Studi Sulla Sostenibilita 2013. [Google Scholar] [CrossRef]
- Miao, C.L.; Sun, L.Y.; Yang, L. The studies of ecological environmental quality assessment in Anhui Province based on ecological footprint. Ecol. Indic. 2016, 60, 879–883. [Google Scholar] [CrossRef]
- Wiedmann, T.; Lenzen, M. On the conversion between local and global hectares in ecological footprint analysis. Ecol. Econ. 2007, 60, 673–677. [Google Scholar] [CrossRef]
- Bagliani, M.; Galli, A.; Niccolucci, V.; Marchettini, N. Ecological footprint analysis applied to a sub-national area: The case of the Province of Siena (Italy). J. Env. Manag. 2008, 86, 354–364. [Google Scholar] [CrossRef] [PubMed]
- Kitzes, J.; Galli, A.; Bagliani, M.; Barrett, J.; Dige, G.; Ede, S.; Erb, K.; Giljum, S.; Haberl, H.; Hails, C.; et al. A research agenda for improving national Ecological Footprint accounts. Ecol. Econ. 2009, 68, 1991–2007. [Google Scholar] [CrossRef]
- Li, J.; Liu, Z.; He, C.; Wei, T.; Sun, Z. Are the drylands in Northern China sustainable? A perspective from ecological footprint dynamics from 1990 to 2010. Sci. Total Environ. 2016, 553, 223–231. [Google Scholar] [CrossRef] [PubMed]
- Gao, B.; Xu, Q.T. Dynamic analysis and prediction of ecological footprint in Jilin province of China based on grey prediction model. Mech. Sci. Eng. IV 2014, 472, 899–903. [Google Scholar] [CrossRef]
- Dong, S.; Li, Z.; Li, Y.; Shi, G.; Yu, H.; Wang, J.; Li, J.; Mao, Q.; Huang, Y. Resources, environment and economic patterns and sustainable development modes of the Silk Road Economic Belt. J. Resour. Ecol. 2015, 6, 65–72. (In Chinese) [Google Scholar]
- Fasslabend, W. The Silk Road: A political marketing concept for world dominance. Eur. View 2015, 14, 293–302. [Google Scholar] [CrossRef]
- Zheng, D.; Yin, Y. Eco-reconstruction in Northwest China. In Water and Sustainability in Arid Regions; Springer: Berlin, Germany, 2010; pp. 3–14. [Google Scholar]
- Zhao, H.Y.; Guo, J.Q.; Zhang, C.J.; Sun, L.D.; Zhang, X.D.; Lin, J.J.; Wang, Y.H.; Fang, F.; Peng-Li, M.A.; Liu, C.H. Climate change impacts and adaptation strategies in Northwest China. Adv. Clim. Chang. Res. 2014, 5, 7–16. [Google Scholar] [CrossRef]
- Wan, L.; Xia, J.; Hong, S.; Bu, H.; Ning, L.; Chen, J. Decadal climate variability and vulnerability of water resources in arid regions of Northwest China. Environ. Earth Sci. 2015, 73, 6539–6552. [Google Scholar] [CrossRef]
- Gu, X.W.; Wang, Q.; Liu, J.X.; Li, G.J. New method of urban ecological footprint calculation based on national hectare. J. Northeast. Univ. 2005, 26, 397–400. (In Chinese) [Google Scholar]
- Dai, J.; Wu, Y.; Ouyang, Y. Calculations of the national average yield, equivalence factor and yield factor in ten years based on national hectares’ ecological footprint model—A case study of Xiamen City. In Proceedings of the Geo-Informatics in Resource Management and Sustainable Ecosystem, Wuhan, China, 8–10 November 2013; Bian, F., Xie, Y., Eds.; Springer: Berlin, Germany, 2015; Volume 482, pp. 338–349. [Google Scholar]
- Xu, Z.; Zhang, Z.; Cheng, G.; Chen, D. Ecological footprint calculation and development capacity analysis of China in 1999. Chin. J. App. Ecol. 2003, 14, 280. [Google Scholar] [CrossRef]
- Shannon, C.E.; Weaver, W. The mathematical theory of communication. Q. Rev. Biol. 1951, 5, 3–55. [Google Scholar]
- Ulanowicz, R.E. Growth and Development: Ecosystems Phenomenology; Springer: New York, NY, USA, 1986; p. 203. [Google Scholar]
- National Bureau of Statistics, People’s Republic of China. China Statistical Yearbook (2006–2015); Chinese Statistical Press: Beijing, China. (In Chinese)
- Statistical Bureau of Uygur Autonomous Region of Xinjiang. Statistical Yearbook of Xinjiang (2006–2015); Chinese Statistical Press: Beijing, China. (In Chinese)
- Statistical Bureau of Shaanxi Province. Statistical Yearbook of Shaanxi (2006–2015); Chinese Statistical Press: Beijing, China. (In Chinese)
- Editorial Board of Gansu Yearbook. Gansu Yearbook (2006–2015); Chinese Statistical Press: Beijing, China. (In Chinese)
- Statistical Bureau of Hui Autonomous Region of Ningxia. Statistical Yearbook of Ningxia (2006–2015); Chinese Statistical Press: Beijing, China. (In Chinese)
- Statistical Bureau of Qinghai Province. Statistical Yearbook of Qinghai (2006-2015); Chinese Statistical Press: Beijing, China. (In Chinese)
- National Bureau of Statistics, People’s Republic of China. China Energy Statistical Yearbook (2006–2014); China Statistics Press: Beijing, China. (In Chinese)
- Wu, D.; Liu, J. Multi-regional input-output (MRIO) study of the provincial ecological footprints and domestic embodied footprints traded among China’s 30 provinces. Sust. Use Envir. Resour. 2016, 8, 1345. [Google Scholar] [CrossRef]
- Yue, D.; Xu, X.; Li, Z.; Hui, C.; Li, W.; Yang, H.; Ge, J. Spatiotemporal analysis of ecological footprint and biological capacity of Gansu, China 1991–2015. Ecol. Econ. 2006, 58, 393–406. [Google Scholar] [CrossRef]
- Monfreda, C.; Wackernagel, M.; Deumling, D. Establishing national natural capital accounts based on detailed ecological footprint and biological capacity assessments. Land Use Policy 2004, 21, 231–246. [Google Scholar] [CrossRef]
- Liu, M.C.; Li, W.H.; Zahng, D.; Su, N. The calculation of equivalence factor for ecological footprints in China: A methodological note. Front. Environ. Sci. Eng. 2015, 9, 1015–1024. [Google Scholar] [CrossRef]
- Venetoulis, J.; Talberth, J. Refining the ecological footprint. Environ. Dev. Sustain. 2008, 10, 441–469. [Google Scholar] [CrossRef]
- Siche, R.; Agostinho, F.; Ortega, E. Emergy net primary production (ENPP) as basis for calculation of ecological footprint. Ecol. Indic. 2010, 10, 475–483. [Google Scholar] [CrossRef]
- Gu, Q.; Wang, H.; Zheng, Y.; Zhu, J.; Li, X. Ecological footprint analysis for urban agglomeration sustainability in the middle stream of the Yangtze River. Ecol. Model. 2015, 318, 86–99. [Google Scholar] [CrossRef]
Figure 1.
Altitude and location of the five studied provinces in Northwest China.
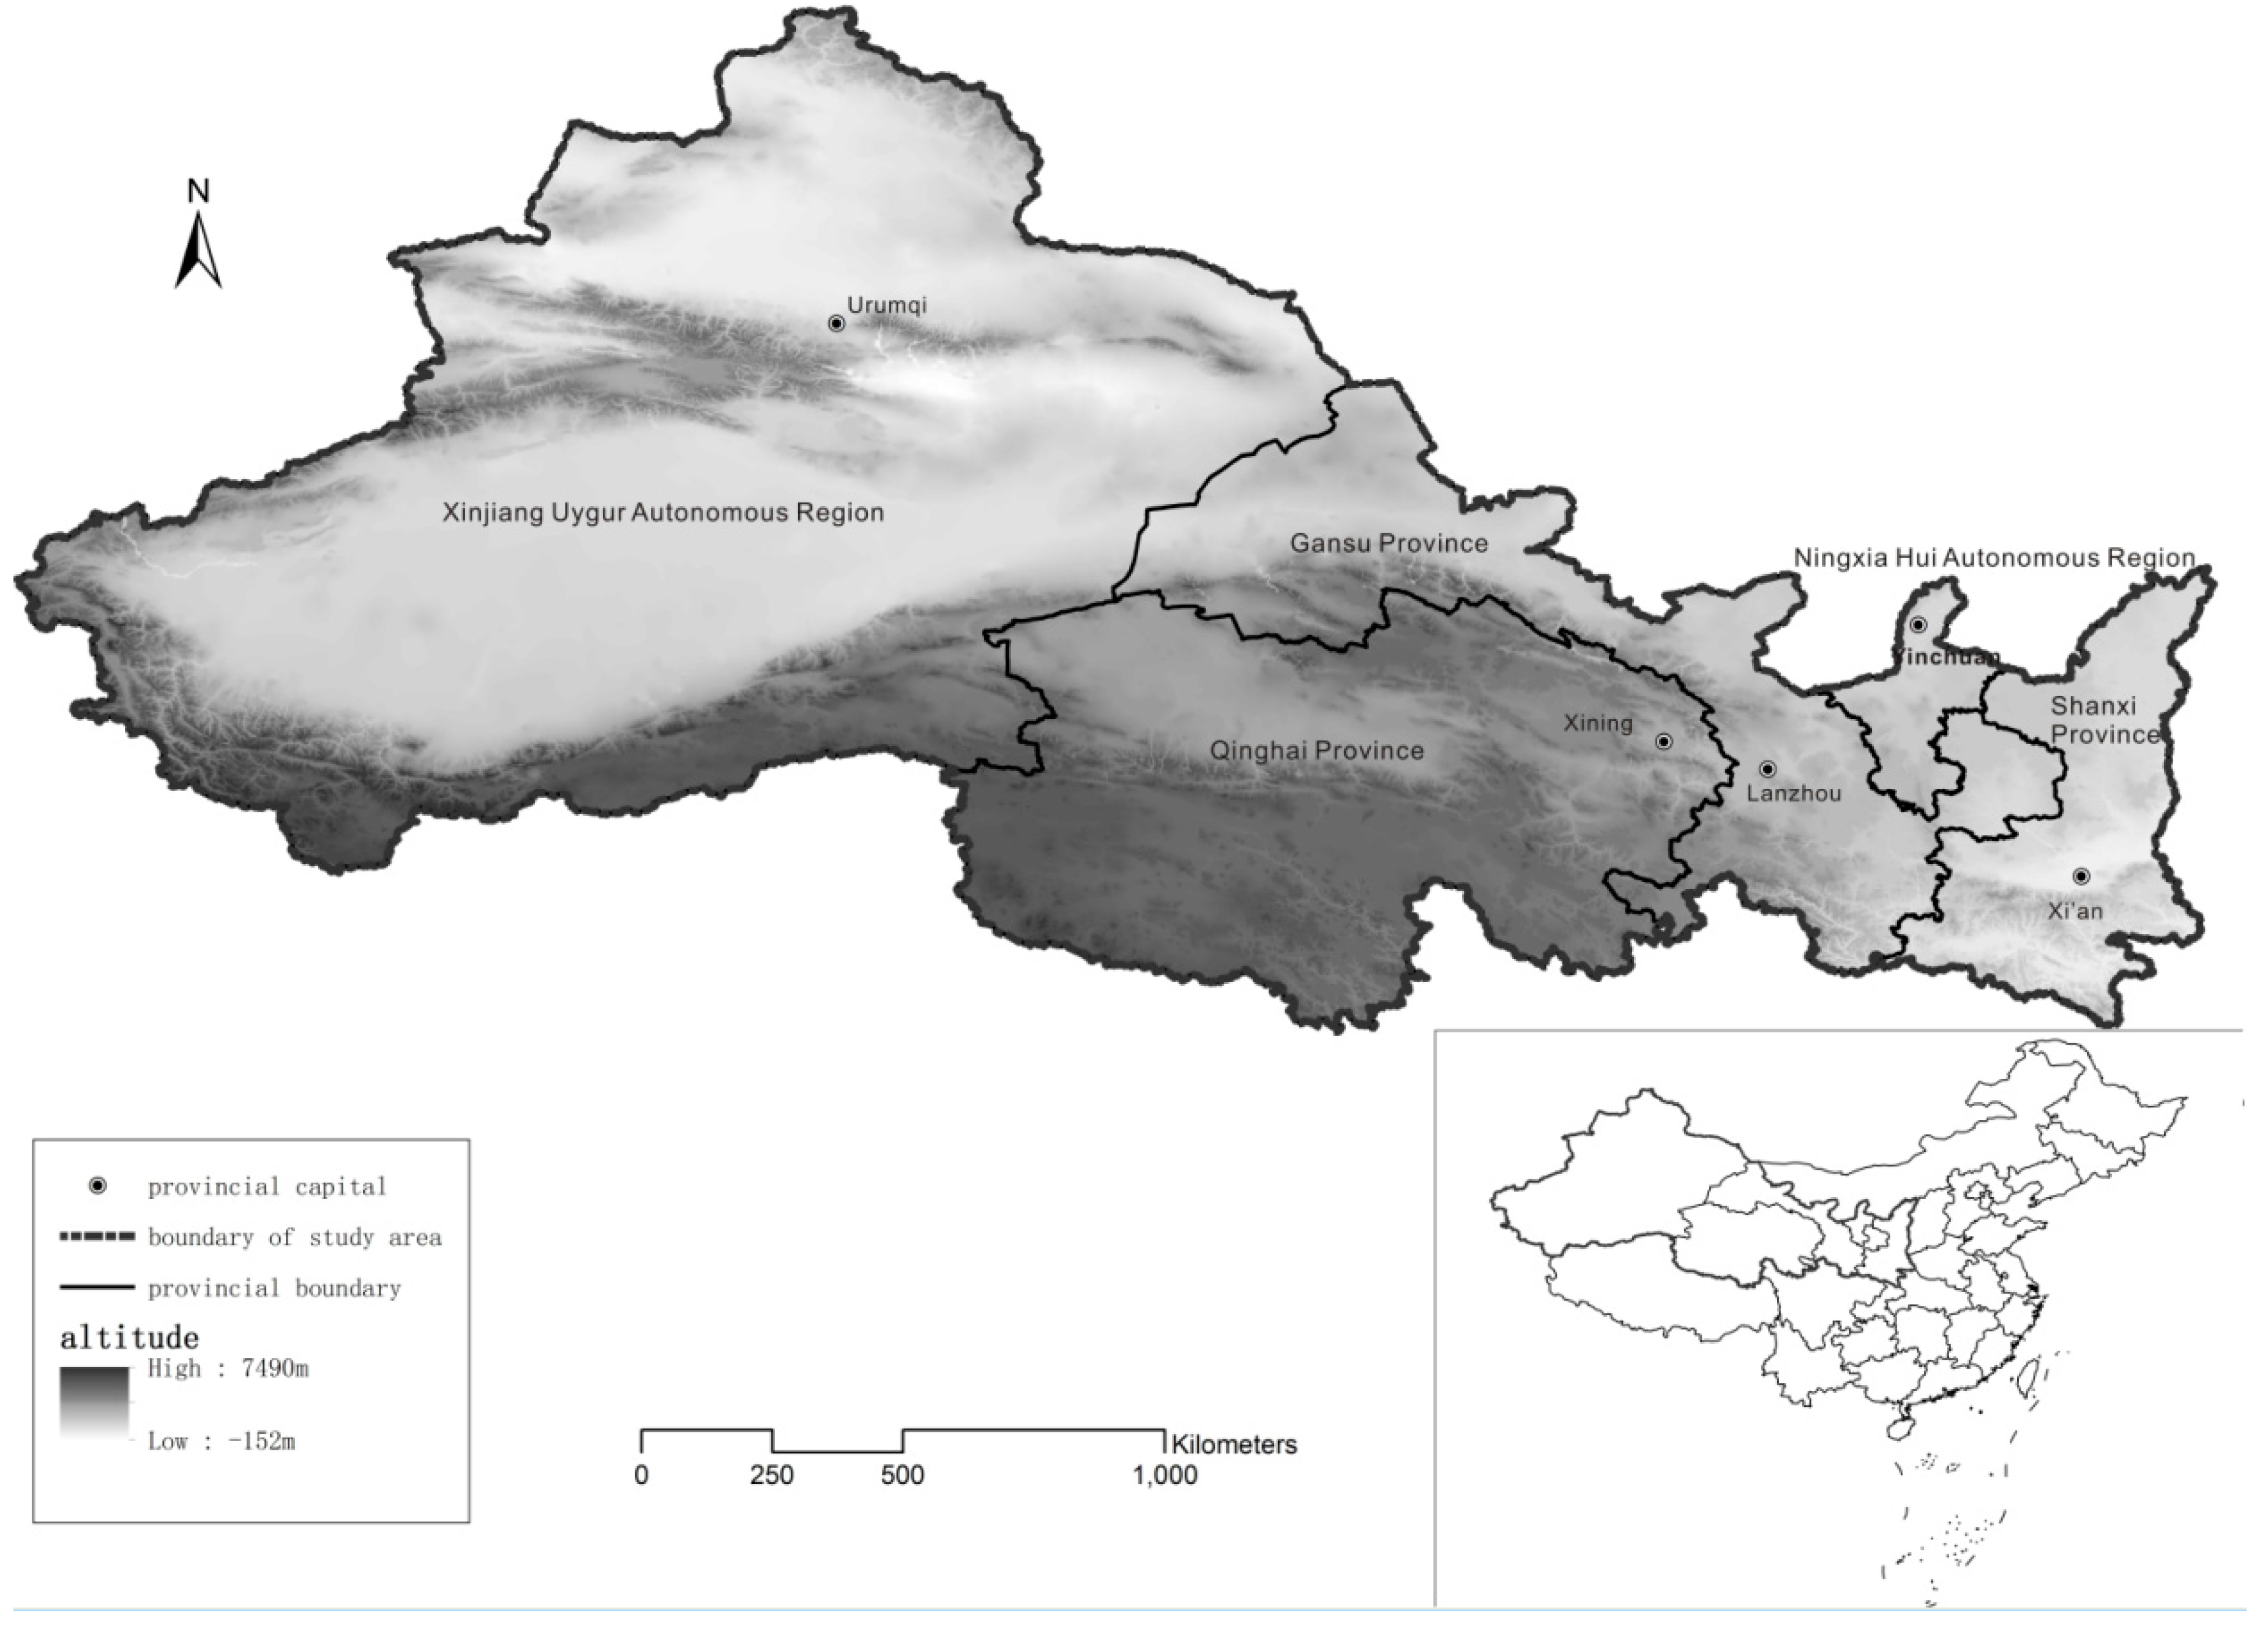
Figure 2.
Comparison of the ecological footprints in Northwest China for various biologically productive land types (thousand national hectares (NHA)).
Figure 2.
Comparison of the ecological footprints in Northwest China for various biologically productive land types (thousand national hectares (NHA)).

Figure 3.
Boxplots of ecological footprint in Northwest China in 2005–2014 (thousand NHA).
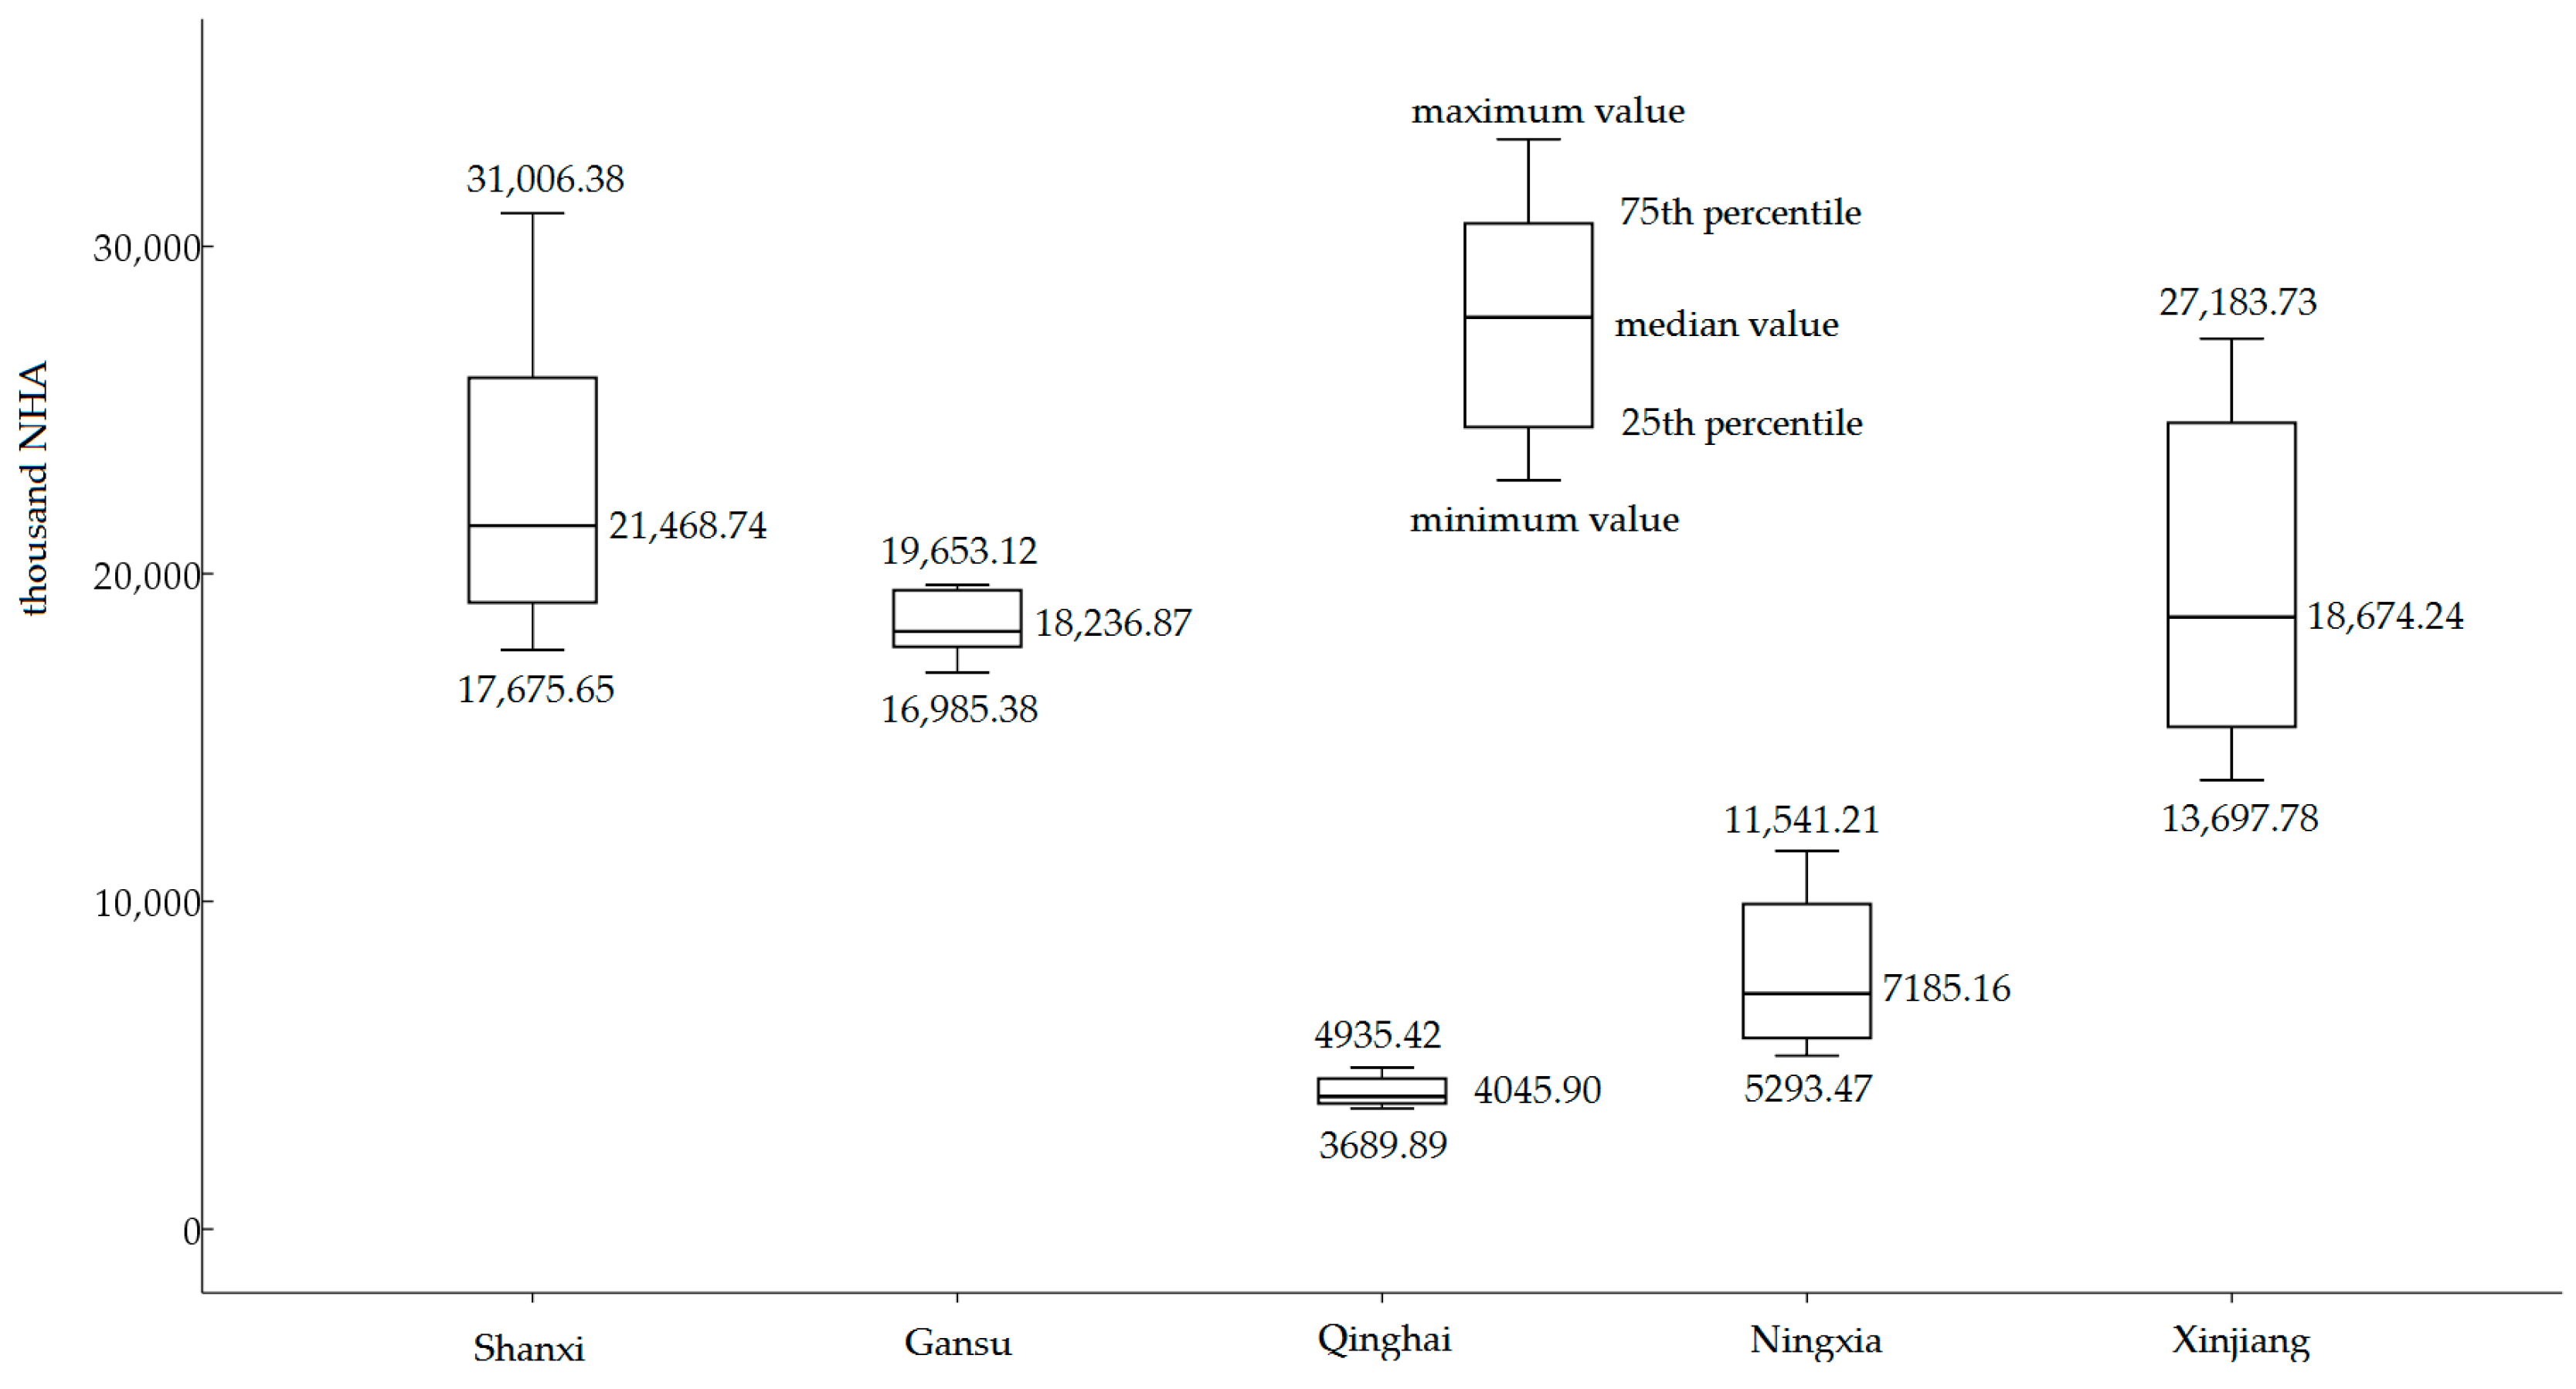
Figure 4.
Dynamic changes and comparison of the ecological footprints in Northwest China (thousand NHA).
Figure 4.
Dynamic changes and comparison of the ecological footprints in Northwest China (thousand NHA).
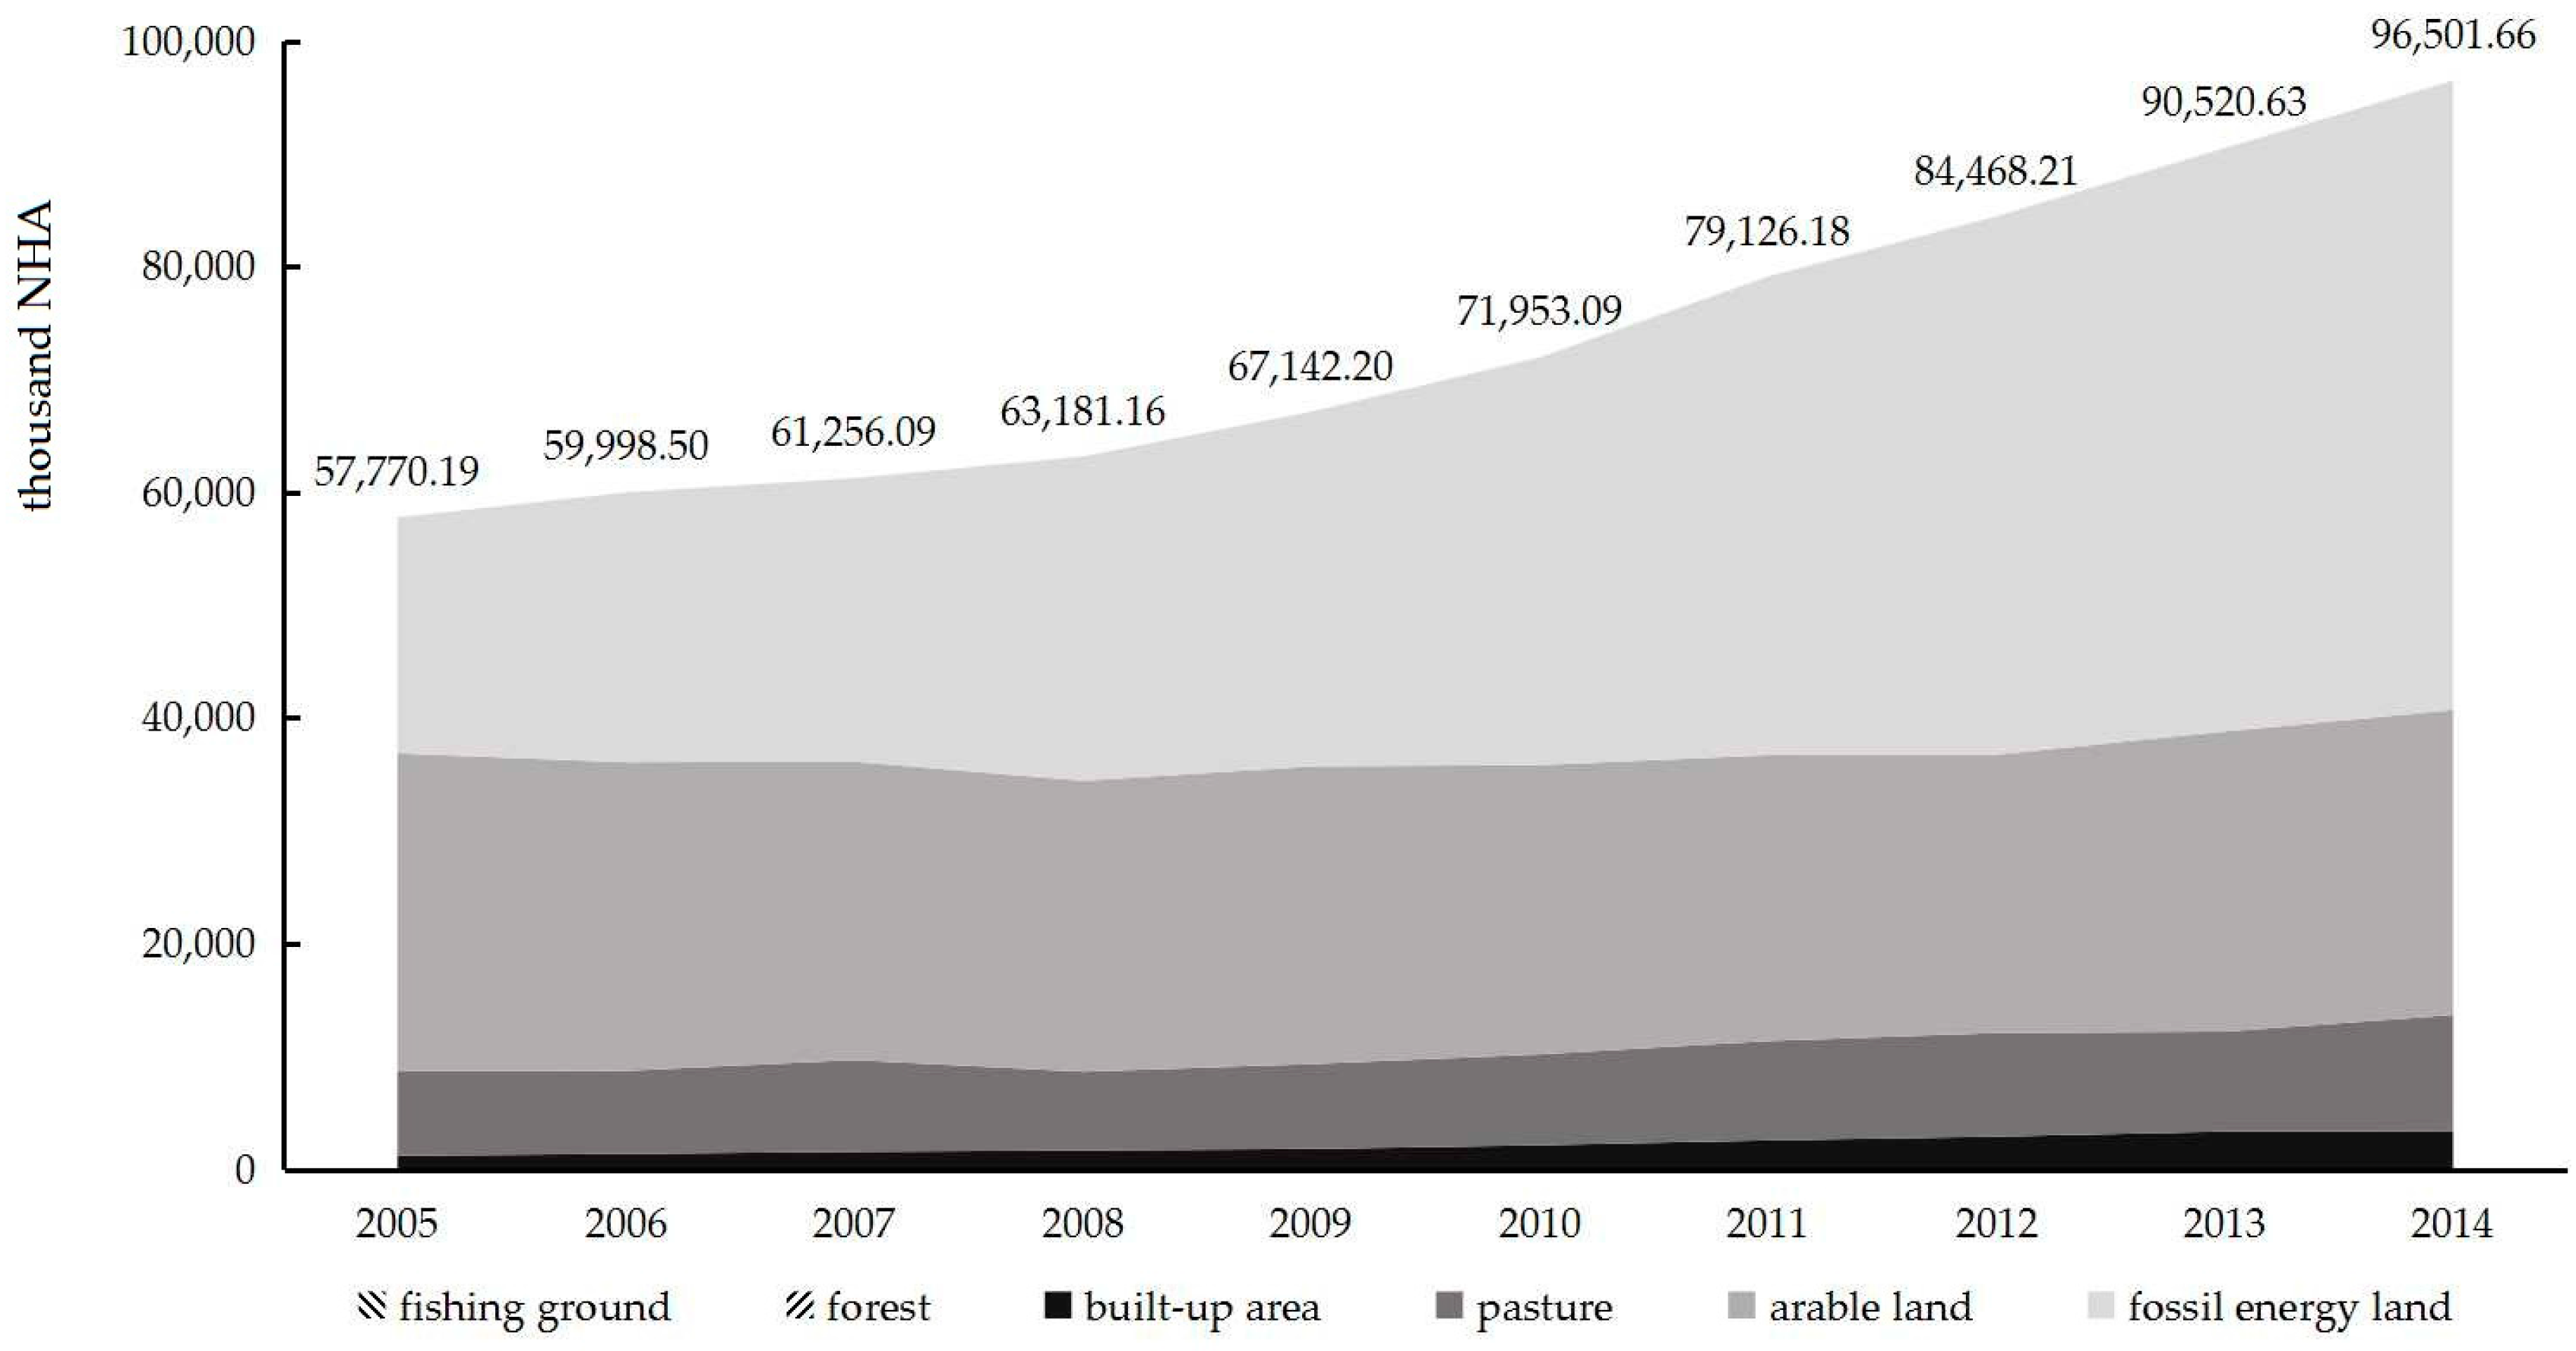
Figure 5.
Dynamic changes in the arable ecological footprints in Northwest China (thousand NHA).

Figure 6.
Fossil energy ecological footprint in Northwest China in 2005–2014 (thousand NHA).

Figure 7.
Dynamic changes in the fossil energy ecological footprints in Northwest China (thousand NHA).
Figure 7.
Dynamic changes in the fossil energy ecological footprints in Northwest China (thousand NHA).

Table 1.
National annual average productivity of the main items of biological resources consumed in 2005–2014 (kg·ha−1).
Table 1.
National annual average productivity of the main items of biological resources consumed in 2005–2014 (kg·ha−1).
| Land Type | Consumption Item | 2005 | 2006 | 2007 | 2008 | 2009 | 2010 | 2011 | 2012 | 2013 | 2014 |
|---|---|---|---|---|---|---|---|---|---|---|---|
| arable land | grain | 5225 | 5310 | 5320 | 5548 | 5447 | 5524 | 5707 | 5824 | 5894 | 5892 |
| arable land | oil | 2150 | 2250 | 2270 | 2300 | 2310 | 2282 | 2291 | 2296 | 2295 | 2291 |
| arable land | pork | 2915 | 2928 | 2762 | 2896 | 2723 | 2840 | 2844 | 2832 | 2816 | 2825 |
| pasture | beef * | 5.30 | 5.60 | 4.60 | 4.60 | 4.70 | 4.70 | 4.77 | 4.84 | 4.88 | 4.90 |
| pasture | mutton * | 10.00 | 10.80 | 8.80 | 8.70 | 8.90 | 8.47 | 8.69 | 8.89 | 9.05 | 9.14 |
| pasture | poultry | 3387 | 3433 | 3340 | 3578 | 3402 | 3261 | 3292 | 3320 | 3338 | 3364 |
| arable land | eggs | 3137 | 3160 | 3065 | 3296 | 3120 | 3011 | 3039 | 3064 | 3079 | 3101 |
| pasture | milk | 41.00 | 47.60 | 52.60 | 53.00 | 52.50 | 52.70 | 52.73 | 52.64 | 52.69 | 52.69 |
| arable land | beans | 1670 | 1650 | 1460 | 1690 | 1620 | 1638 | 1621 | 1613 | 1607 | 1632 |
| fishing ground | aquatic products | 1481 | 1510 | 1538 | 1495 | 1621 | 1692 | 1760 | 1838 | 1904 | 1998 |
| arable land | vegetables | 31,860 | 35,050 | 35,051 | 35,052 | 35,053 | 35,052 | 35,052 | 35,052 | 35,052 | 35,052 |
| forest | fruits | 16,060 | 16,890 | 17,320 | 17,910 | 18,310 | 18,540 | 19,250 | 19,820 | 20,280 | 19,910 |
| arable land | sugar | 60,420 | 66,750 | 67,650 | 67,440 | 65,170 | 66,753 | 66,753 | 66,529 | 66,301 | 66,584 |
| forest | timber † | 0.32 | 0.38 | 0.40 | 0.46 | 0.40 | 0.46 | 0.47 | 0.47 | 0.48 | 0.47 |
| arable land | peanuts | 3076 | 3254 | 3302 | 3365 | 3361 | 3455 | 3502 | 3598 | 3663 | 3580 |
| arable land | tea | 690 | 720 | 720 | 730 | 730 | 725 | 726 | 728 | 727 | 726 |
Note: * the productive sources of beef and mutton are considered to pasture only; † the unit of the national average timber production is m3 ha–1. Data sources: China Statistical Yearbook in 2005–2014 and Dai et al. [29].
Table 2.
Ecological footprint per 10,000 CNY GDP, the ecological footprint diversity index, and the development capacity index of Northwest China in 2005–2014.
Table 2.
Ecological footprint per 10,000 CNY GDP, the ecological footprint diversity index, and the development capacity index of Northwest China in 2005–2014.
| Year | Ecological Footprint Per 10,000 CNY GDP (NHA /10,000 CNY) | Ecological Footprint Diversity Index | Development Capacity Index (NHA) | ||||||||||||
|---|---|---|---|---|---|---|---|---|---|---|---|---|---|---|---|
| Shanxi | Gansu | Qinghai | Ningxia | Xinjiang | Shanxi | Gansu | Qinghai | Ningxia | Xinjiang | Shanxi | Gansu | Qinghai | Ningxia | Xinjiang | |
| 2005 | 0.45 | 0.90 | 0.79 | 0.86 | 0.53 | 0.99 | 0.92 | 1.21 | 1.01 | 1.15 | 0.48 | 0.63 | 0.82 | 0.90 | 0.78 |
| 2006 | 0.39 | 0.78 | 0.69 | 0.74 | 0.47 | 0.98 | 0.93 | 1.23 | 0.96 | 1.14 | 0.49 | 0.65 | 0.84 | 0.86 | 0.80 |
| 2007 | 0.33 | 0.63 | 0.62 | 0.63 | 0.43 | 1.00 | 0.91 | 1.23 | 0.98 | 1.15 | 0.51 | 0.61 | 0.90 | 0.93 | 0.84 |
| 2008 | 0.27 | 0.56 | 0.48 | 0.52 | 0.38 | 0.97 | 0.93 | 1.23 | 0.95 | 1.13 | 0.51 | 0.65 | 0.85 | 0.96 | 0.84 |
| 2009 | 0.25 | 0.51 | 0.38 | 0.49 | 0.42 | 0.98 | 0.95 | 1.24 | 0.94 | 1.11 | 0.54 | 0.66 | 0.86 | 1.00 | 0.93 |
| 2010 | 0.22 | 0.45 | 0.38 | 0.45 | 0.35 | 0.96 | 0.97 | 1.28 | 0.90 | 1.10 | 0.57 | 0.71 | 0.93 | 1.09 | 0.97 |
| 2011 | 0.19 | 0.39 | 0.33 | 0.46 | 0.33 | 0.94 | 1.00 | 1.28 | 0.83 | 1.09 | 0.60 | 0.76 | 0.99 | 1.24 | 1.08 |
| 2012 | 0.18 | 0.34 | 0.28 | 0.42 | 0.33 | 0.91 | 1.00 | 1.26 | 0.80 | 1.08 | 0.63 | 0.75 | 1.01 | 1.22 | 1.19 |
| 2013 | 0.18 | 0.31 | 0.26 | 0.40 | 0.31 | 0.90 | 1.05 | 1.25 | 0.78 | 1.04 | 0.71 | 0.80 | 1.05 | 1.24 | 1.21 |
| 2014 | 0.19 | 0.29 | 0.21 | 0.42 | 0.29 | 0.86 | 1.04 | 1.30 | 0.73 | 1.07 | 0.77 | 0.79 | 1.00 | 1.28 | 1.27 |
| mean | 0.27 | 0.39 | 0.44 | 0.54 | 0.39 | 0.95 | 0.98 | 1.27 | 0.88 | 1.11 | 0.58 | 0.70 | 0.93 | 1.07 | 0.99 |
© 2017 by the authors. Licensee MDPI, Basel, Switzerland. This article is an open access article distributed under the terms and conditions of the Creative Commons Attribution (CC BY) license (http://creativecommons.org/licenses/by/4.0/).
Share and Cite
MDPI and ACS Style
Yin, Y.; Han, X.; Wu, S. Spatial and Temporal Variations in the Ecological Footprints in Northwest China from 2005 to 2014. Sustainability 2017, 9, 597. https://doi.org/10.3390/su9040597
AMA Style
Yin Y, Han X, Wu S. Spatial and Temporal Variations in the Ecological Footprints in Northwest China from 2005 to 2014. Sustainability. 2017; 9(4):597. https://doi.org/10.3390/su9040597
Chicago/Turabian StyleYin, Yunhe, Xiang Han, and Shaohong Wu. 2017. "Spatial and Temporal Variations in the Ecological Footprints in Northwest China from 2005 to 2014" Sustainability 9, no. 4: 597. https://doi.org/10.3390/su9040597
Note that from the first issue of 2016, this journal uses article numbers instead of page numbers. See further details here.