Article

Evaluation of a Semi-Intensive Aquaponics System, with and without Bacterial Biofilter in a Tropical Location

by
Laura Silva
1,
Edgardo Escalante
2,
David Valdés-Lozano
1,
Martha Hernández
1 and
Eucario Gasca-Leyva
1,*
1
Centro de Investigación y de Estudios Avanzados del IPN-CINVESTAV, Km 6 Antigua Carretera a Progreso, C.P. 97310 Mérida, Mexico
2
Centro Regional Universitario de la Península de Yucatán, Universidad Autónoma Chapingo, Ex Hacienda Temozón Norte, C.P. 97310 Mérida, Mexico
*
Author to whom correspondence should be addressed.
Sustainability 2017, 9(4), 592; https://doi.org/10.3390/su9040592
Submission received: 25 November 2016 / Revised: 30 March 2017 / Accepted: 7 April 2017 / Published: 12 April 2017
(This article belongs to the Section Sustainable Agriculture)

Abstract

:
This study compares the aquaponics Nile tilapia (Oreochromis niloticus)—pak choi (Brassica chinensis) system with and without a bacterial biofilter (BF and NBF) in a tropical location. The aim was to determine whether a semi-intensive aquaponics system NBF could offer a production alternative for small-scale farmers in this region, both technically and biologically. The Tilapia aquaponics culture was continuously recirculated and water was added (influent) and removed (effluent) from the plant aquaponics culture every 24 h. Total ammonia nitrogen (TAN) and nitrite nitrogen (NO2-N) were analysed in the plant aquaponics culture influent and effluent. At the end of the experiment the individual fresh total weight, dry total weight, edible weight, height and diameter of the pak choi plants were measured. None of the pak choi variables showed significant differences between treatments. TAN and NO2-N were higher in the NBF influent than in the BF influent. TAN and NO2-N in the effluent of both treatments were similar and lower than in the influent. The plant aquaponics culture therefore works as a biofilter and the NBF aquaponics system could be used for small-scale farmers in the tropics, with easier management and less costs than a BF aquaponics system.

1. Introduction

The rural population is highest in countries in intertropical regions [1], and most of them are in the categories of developing economies and least developed countries [2]. For these populations, agriculture is the main source of income and employment. In order to improve their diet these populations need to change from a subsistence diet to one with good nutritional value [3].
Eco-efficiency in the simplest of terms is about achieving more with less [4], by using the available resources more efficiently in order to improve sustainable productivity and increase the food available [5]. Eco-efficiency can be increased either by altering the management of an individual crop and livestock enterprise or by altering the land-use system [6], for example, diversifying farm production. According to Tscharntke et al. [7] the agriculture practiced under smallholder farmer-dominated landscapes, rather than large-scale farming, is the backbone of global food security in the developing world.
One way to introduce farm diversification is through aquaponics, which is the combined culture of fish and plants in the same system. The nutrients for the plants come from compounds excreted by the fish as a product of their metabolism and from the bacterial decomposition of organic waste (faeces and uneaten feed). This, together with the reuse of water, makes aquaponics systems an eco-efficient alternative. In aquaponics systems a bacterial biofilter is usually included [8,9,10,11,12,13], however several experiments have been carried out without a microbial biofilter [14,15]. To our knowledge, no work has been carried out to compare an aquaponics system with and without a bacterial biofilter.
Bacterial biofilters are important components in Recirculating Aquaculture Systems (RAS). As a final product of protein catabolism, fish excrete toxic ammonia through their gills. In water, ammonia nitrogen exists in two forms, ionised ammonia nitrogen (NH4+-N) and unionized ammonia nitrogen (NH3-N), which together are known as total ammonia nitrogen (TAN); the proportion of these depends on salinity, temperature and pH [16]. Through the process of nitrification, carried out by bacteria of the genus Nitrosobacter and Nitrosomas, TAN is converted first to nitrite (NO2), which is toxic to fish, and then to nitrates (NO3), which are relatively harmless to fish. In the culture tanks nitrification takes place spontaneously but slowly. For this reason, in intensive RAS, a biofilter with bacteria that increase the nitrification potential is required [9,17].
In hydroponic culture the compound most commonly used as a source of nitrogen is NO3 [18]. However, plants can assimilate NH4+-N under high radiation and therefore high photosynthesis [19]. In intertropical areas, the direct assimilation of NH4+-N by plants is possible due to the high solar radiation (daily average of 400 langleys).
As an example, Yucatan, Mexico is located in the tropics and semi-intensive tilapia (Oreochromis spp.) culture systems have been installed in rural areas as a complementary activity for small-scale rural farmers who receive governmental support. One of the obstacles for the economic success of the farms has been the inadequate transfer of technology [20] and the low price of tilapia. In contrast, pak choi (Brassica chinensis) is an oriental vegetable that grows well in tropical regions and its local market price is higher (approximately 3.5 dollars/kg) than lettuce (0.5–1.5 dollars/piece) which has a similar harvest time of 30 days. Since the aquaponics system is a source of vegetables and fish, it could provide a more varied diet for the farmers and encourage farm diversification, which is recommended for development [21,22]. The implementation of simple aquaponics systems could help provide rural communities with food security and might work as a first step towards the sustainable intensification of aquaponics systems in the region. In this area, the development of simple aquaponics systems without a biofilter might be a better option than a system with a biofilter, since the level of technical knowledge required to manage these systems is lower than that required for systems with biofilters. Therefore, the aim of this study was to investigate whether a semi-intensive NBF aquaponics system could offer a production alternative for small-scale farmers in this region.

2. Materials and Methods

The experiment was carried out at the Aquaculture Research Station CINVESTAV-Merida, in Yucatan, Mexico and lasted 28 days. Two aquaponics installations were used to test two treatments; one with a trickling biofilter (BF) and the other without a bacterial biofilter (NBF).

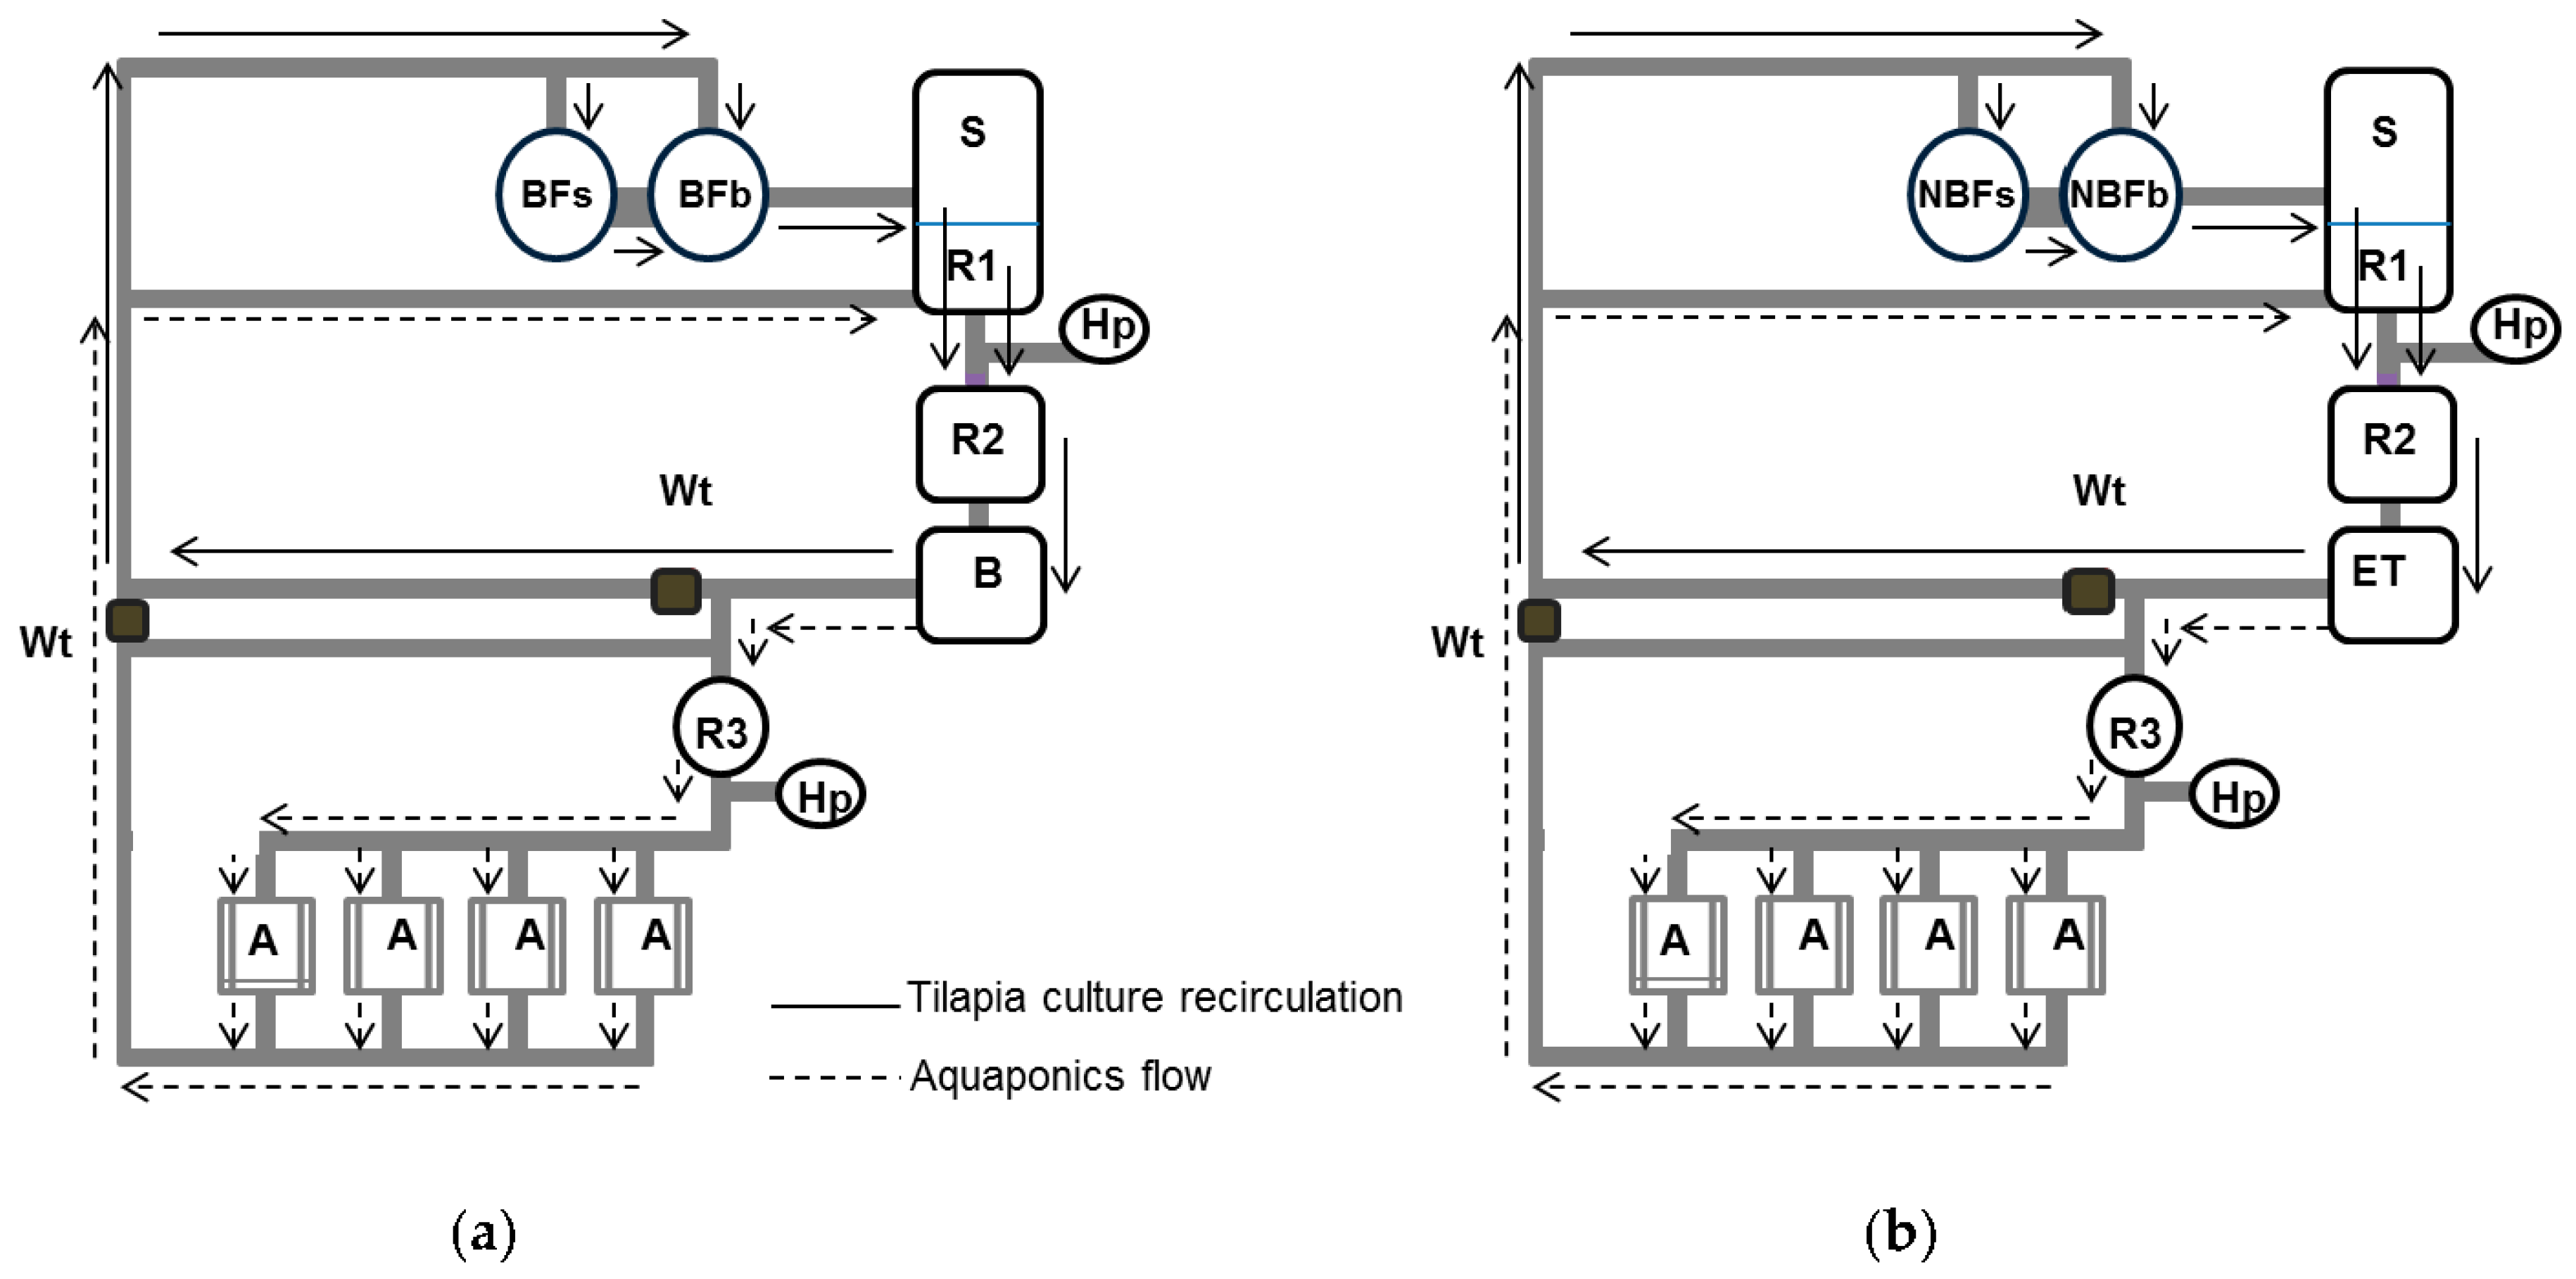
2.1. Experimental System

In each treatment, the tilapia aquaponics culture component (Figure 1) included two circular fiberglass tanks for fish culture with a volume capacity of 1 m3. Each treatment had two fish weight groups one smaller (BFs and NBFs) than the other (BFb, NBFb). The system also includes a sedimentation tank (S), a reserve tank that fed the water pump (R2) and an elevated tank (ET), which in the case of the BF treatment worked as a biofilter (B). Each fiberglass tank was filled with 0.75 m3 of water and both tanks were connected. Water from these aquaculture tanks flowed through a 75 mm diameter tube to the rectangular 1 × 1.6 × 1 m sedimentation tank. Water from the sedimentation tank passed to a 1 × 1 × 1 m reserve tank (R2) and was then sent to the 1 × 1 × 1 m elevated tank, which in the case of the BF treatment works as a biofilter, using a 1/2 hp water pump. Water from the elevated tank or biofilter (depending on the treatment) then flowed through 38 mm diameter tubes to the culture tanks. When necessary, water from the elevated tank or biofilter was sent to the reserve tank R3 and then to the plant aquaponics culture. The biofilter used in the BF treatment was a trickling biofilter and was built with polyethylene corrugated tube and tarred nylon fishing net; these materials were chosen since they are accessible to local farmers. The medium for bacteria fixation was 12.7 mm diameter high density polyethylene corrugated tube that has a calculated specific surface area of 680 m2/m3. The polyethylene corrugated tube was cut into pieces of 25.4 mm in length and these were suspended over the water column in tank B, for the BF treatment, using the tarred nylon fishing net. A total of 200 linear metres of this tube was used, which represents a total volume of 0.063 m3 and a total surface area of 42.73 m2. In the biofilter, taking into count the walls, the surface area available for bacteria fixation was 43.73 m2 and in the treatment without the biofilter it was only 1.6 m2.
The floating bed technique was used in the plant aquaponics culture component (Figure 1), which included two reserve tanks (R1 and R3), a 1/2 hp water pump and four trapezoidal fiberglass plant aquaponics culture tanks (A). Each tank was 0.90 × 0.90 m at the bottom and 1 × 1 m at the top, with a depth of 0.40 m which provided for a volume of 336 L and a surface area of 3.32 m2 when filled to a depth of 0.375 m. A sheet of expanded polystyrene (1 m2 surface area, 25 mm thick), with perforations of 25 mm diameter (spaced 0.20 m × 0.25 m apart), floated on the surface of the water of each plant aquaponics culture tank. The plants were placed in these perforations with a sponge around the stalk to provide support. The water from the plant aquaponics culture tanks was passed through 50 mm tubes to the reserve tank (R1).
The plant aquaponics culture tanks were placed in a shade net house, 5 × 12 m with a height of 3.5 m. The lateral walls were protected with an anti-aphid net and the roof was made of shade net with 30% sunlight reduction, a UV light stabiliser and antioxidants to provide a UV photoprotection system.

2.2. System Operation

The water flux through the fish culture was continuous while in the plant aquaponics culture it was intermittent (Figure 1). As the plant aquaponics culture tank´s size was small, the influent and effluent of these would show no measurable difference between them if the flux was continuous. In order to be able to observe differences, every 24 h [23] water in the plant aquaponics culture tanks was exchanged as follows: for each treatment the effluent from the plant aquaponics culture tanks (A) was flushed by gravity to the reserve tank (R1). This was done to prevent the water that had been in the plant aquaponics culture component for 24 h from mixing with the water that had been in the recirculation of the fish culture system for 24 h, because the fish culture water would be introduced as influent in the plant aquaponics culture. Once the plant aquaponics culture tanks were empty, water was distributed from the elevated tank (B) by gravity to R3 (which was empty) and sent to the plant aquaponics culture tanks (A), where it remained with no recirculation for 24 h. Finally, water from R1 was mixed again with the fish culture water. This process lasted approximately half an hour, but the roots remained without water for less than 5 min.

2.3. Experimental Conditions

The experimental integrated systems were operated with fish in them for 4 months prior to the initiation of the trial when the systems were flushed and fresh water was added, thus theoretically the bacterial population was established. The plants used were pak choi, which were kindly provided by “Centro Regional Universitario de la Península de Yucatán de la Universidad Autónoma Chapingo (CRUPY)”, and these were transplanted to the aquaponics system 21 days after being sown. Eight plant aquaponics culture tanks, with a density of 20 plants/m2, were used in the experiment, four tanks in each treatment to provide replicates.
At the beginning of the plant culture and in both treatments (BF and NBF), 1 mL of micronutrient stock solution of [24], kindly provided by CRUPY, was added to each 10 L of water. The same amount was used when the system was refilled or when a micronutrient deficiency was visually detected [19]. At the end of the culture cycle the individual total fresh weight, total dry weight, edible weight (leaf and stalks), leaf height and stem basal diameter of five plants in each plant aquaponics culture tank were measured. Plants were dried in an oven at 68 °C for 76 h to obtain total dry weight and dry leaf and stalk weight. Yield (weight/m2) was calculated using the average obtained per replicate.
Fish were produced at the Aquaculture Research Station, CINVESTAV-Mérida. Since monosex culture using males is common practice in tilapia farms (because the female growth is less), 46 male tilapia were introduced in each treatment two weeks before plants were transplanted into the system. The initial biomass in each treatment was established considering the daily fish food consumption in an attempt to obtain an initial daily feed input of 224 g. This daily food input is based on the optimum fish food/plant growing area ratio of 56 g/m2 obtained by Al-Hafedh [14], taking into account that we had four square meters of plant growing area. In each treatment, the initial biomass (BF and NBF) was 7.69 kg. Given the availability of fish, and based on weight, the fish were distributed between two tanks in each treatment (Figure 1): one with 22 fish with an average weight of 122 g (BFs and NBFs for the BF and NBF treatment respectively), and another with 24 fish with an average weight of 208 g (BFs and NBFs for the BF and NBF treatment respectively). Fish were fed three times daily with commercial formulated feed (32% crude protein). The daily feeding rate was restricted to a percentage of the biomass in each tank, decreasing with tilapia growth (from 3.2% to 2.3%) based on the feed provider’s recommendation. Every two weeks all the fish were weighed individually and the amount of feed was adjusted to their biomass. The average weight of the fish in each tank was calculated and this, together with the number of fish and the provider’s feeding tables, were used to calculate the amount of daily food for each tank.

2.4. Water Quality and Toxic Nitrogen Compounds

Temperature, dissolved oxygen (DO), pH and conductivity were measured daily in the plant aquaponics culture tanks between 9:00 and 10:00 h, after water was exchanged. Temperature, DO and conductivity were measured with a YSI model 85 digital meter and pH with a multiparameter 35 Series Oakton Eutech instrument. The same parameters were measured in the aquatic tanks twice a week (Monday and Thursday) between 8:30 and 9:30 h.
To analyse TAN and NO3-N concentrations, commencing at the end of the first week, water samples were collected weekly between 9:00 and 10:00 h from the plant aquaponics culture tanks after the water had been exchanged (influent) and 24 h later before water was removed (effluent). TAN was analysed in the Marine Chemistry Laboratory at CINVESTAV using the phenol method, and NO3-N was analysed in the Aquaculture Laboratory at CINVESTAV by colourimetry (APHA, 1992) with a Technitron autoanalyzer II and processed using the New Analyser Program (NAP) software. Average concentrations of NH3-N from the plant aquaponics culture tanks’ influent and effluent were calculated using the equations (Equations (1) and (2)) proposed by Emerson et al. [16].
p K a =   0.0901821 + 2729.92 T
where,
  • T = Temperature in K
    f = 1 10 ( p K a p H ) + 1
where,
  • f = fraction of total ammonia that is un-ionized
  • pKa = dissociation constant from Equation (1)

2.5. Statistical Analyses

On one side of the greenhouse there were two tree trunks that provided some shade in the afternoon, hence a randomized complete block design with four blocks (B1, B2, B3 and B4) was applied. In this experimental design, the aim was to identify whether there is any difference among the effects of the different treatments, not whether there is any difference due to the blocks or the interaction between treatments and blocks. Due to the experimental design, differences in-plant growth variables and water quality parameters, between treatments, were analysed with a two-way ANOVA providing a significance level of at least 0.05. For dry weight and humidity, the Friedman test, with a significance level of at least 0.05, was used due to the lack of data normality. Since for all variables and parameters the block effect was not significant, it was neglected. A one-way ANOVA, with a significance level of at least 0.05, was therefore used to test only the treatment effect for plant growth variables and water quality, and a Kruskal-Wallis test, a significance level of at least 0.05, for dry weight and moisture.
To compare between the treatments with and without a biofilter, fish weight, TAN and NO2-N were analysed using the Two-Sample t-test for independent samples, with a significance level of at least 0.05. The exception was the weight group b final fish weight, where the Mann-Whitney test for independent samples, with at least 0.05 significance level, was used due to lack of normality. NH3-N was also analysed with the Mann-Whitney test for independent samples, a significance level of at least 0.05, due to the lack of data normality. To compare TAN and NO2-N in the plant aquaponics culture between influent and effluent, a Paired sample t-test was applied. The Wilcoxon Signed-Rank test was used to compare NH3-N between the influent and the effluent, with a significance level of at least 0.1 due to sample size. A Paired samples t-test, with at least 0.05 significance level, was applied to normally distributed data to compare the TAN and NO2-N concentration between the influent and the effluent and between consecutive weeks, and a Wilcoxon Signed-Rank test was applied with a significance level of 0.1, due to sample size, for data that lacked with normality.

3. Results

3.1. Pak choi and tilapia Production in Aquaponics Systems

Plant survival was 100% in both treatments. Pak choi plants attained commercial size in both treatments (average height greater than 30 cm) and all growth parameters showed no significant difference between treatments, F1,6 = 1.08 × 10⁻³, p = 0.97 for final fresh weight; H4,4 = 0.08, p = 0.89 for final dry weight; H4,4 = 1.33, p = 0.34 for moisture; F1,6 = 0.03, p = 0.87 for fresh weight edible portion; F1,6 = 0.49, p = 0.51 for average leaf height and F1,6 = 0.04, p = 0.84 for average stem basal diameter (Table 1). Pak choi yield was 5.10 kg/m2 in NBF and 4.98 kg/m2 in BF.
Fish survival was 100% in both treatments. Final weight was significantly different (t0.05(2),42 = 2.59, p = 0.0065) for the small fish (s) but not for the large fish (b) (t0.05(2),46 = 1.6, p = 0.2152) (Table 2). For both, small (s) and large (b) fish, a higher value of specific growth rate (SGR) and lower feed conversion ratio (FCR) value were obtained in the BF treatment compared to NBF (Table 2). Tilapia final density was 11.28 kg/m3 in the system with the biofilter and 10.44 kg/m3 in the system without the biofilter and tilapia yield was 6.16 kg/m3 in the system with the biofilter and 5.32 kg/m3 in the system without the biofilter.

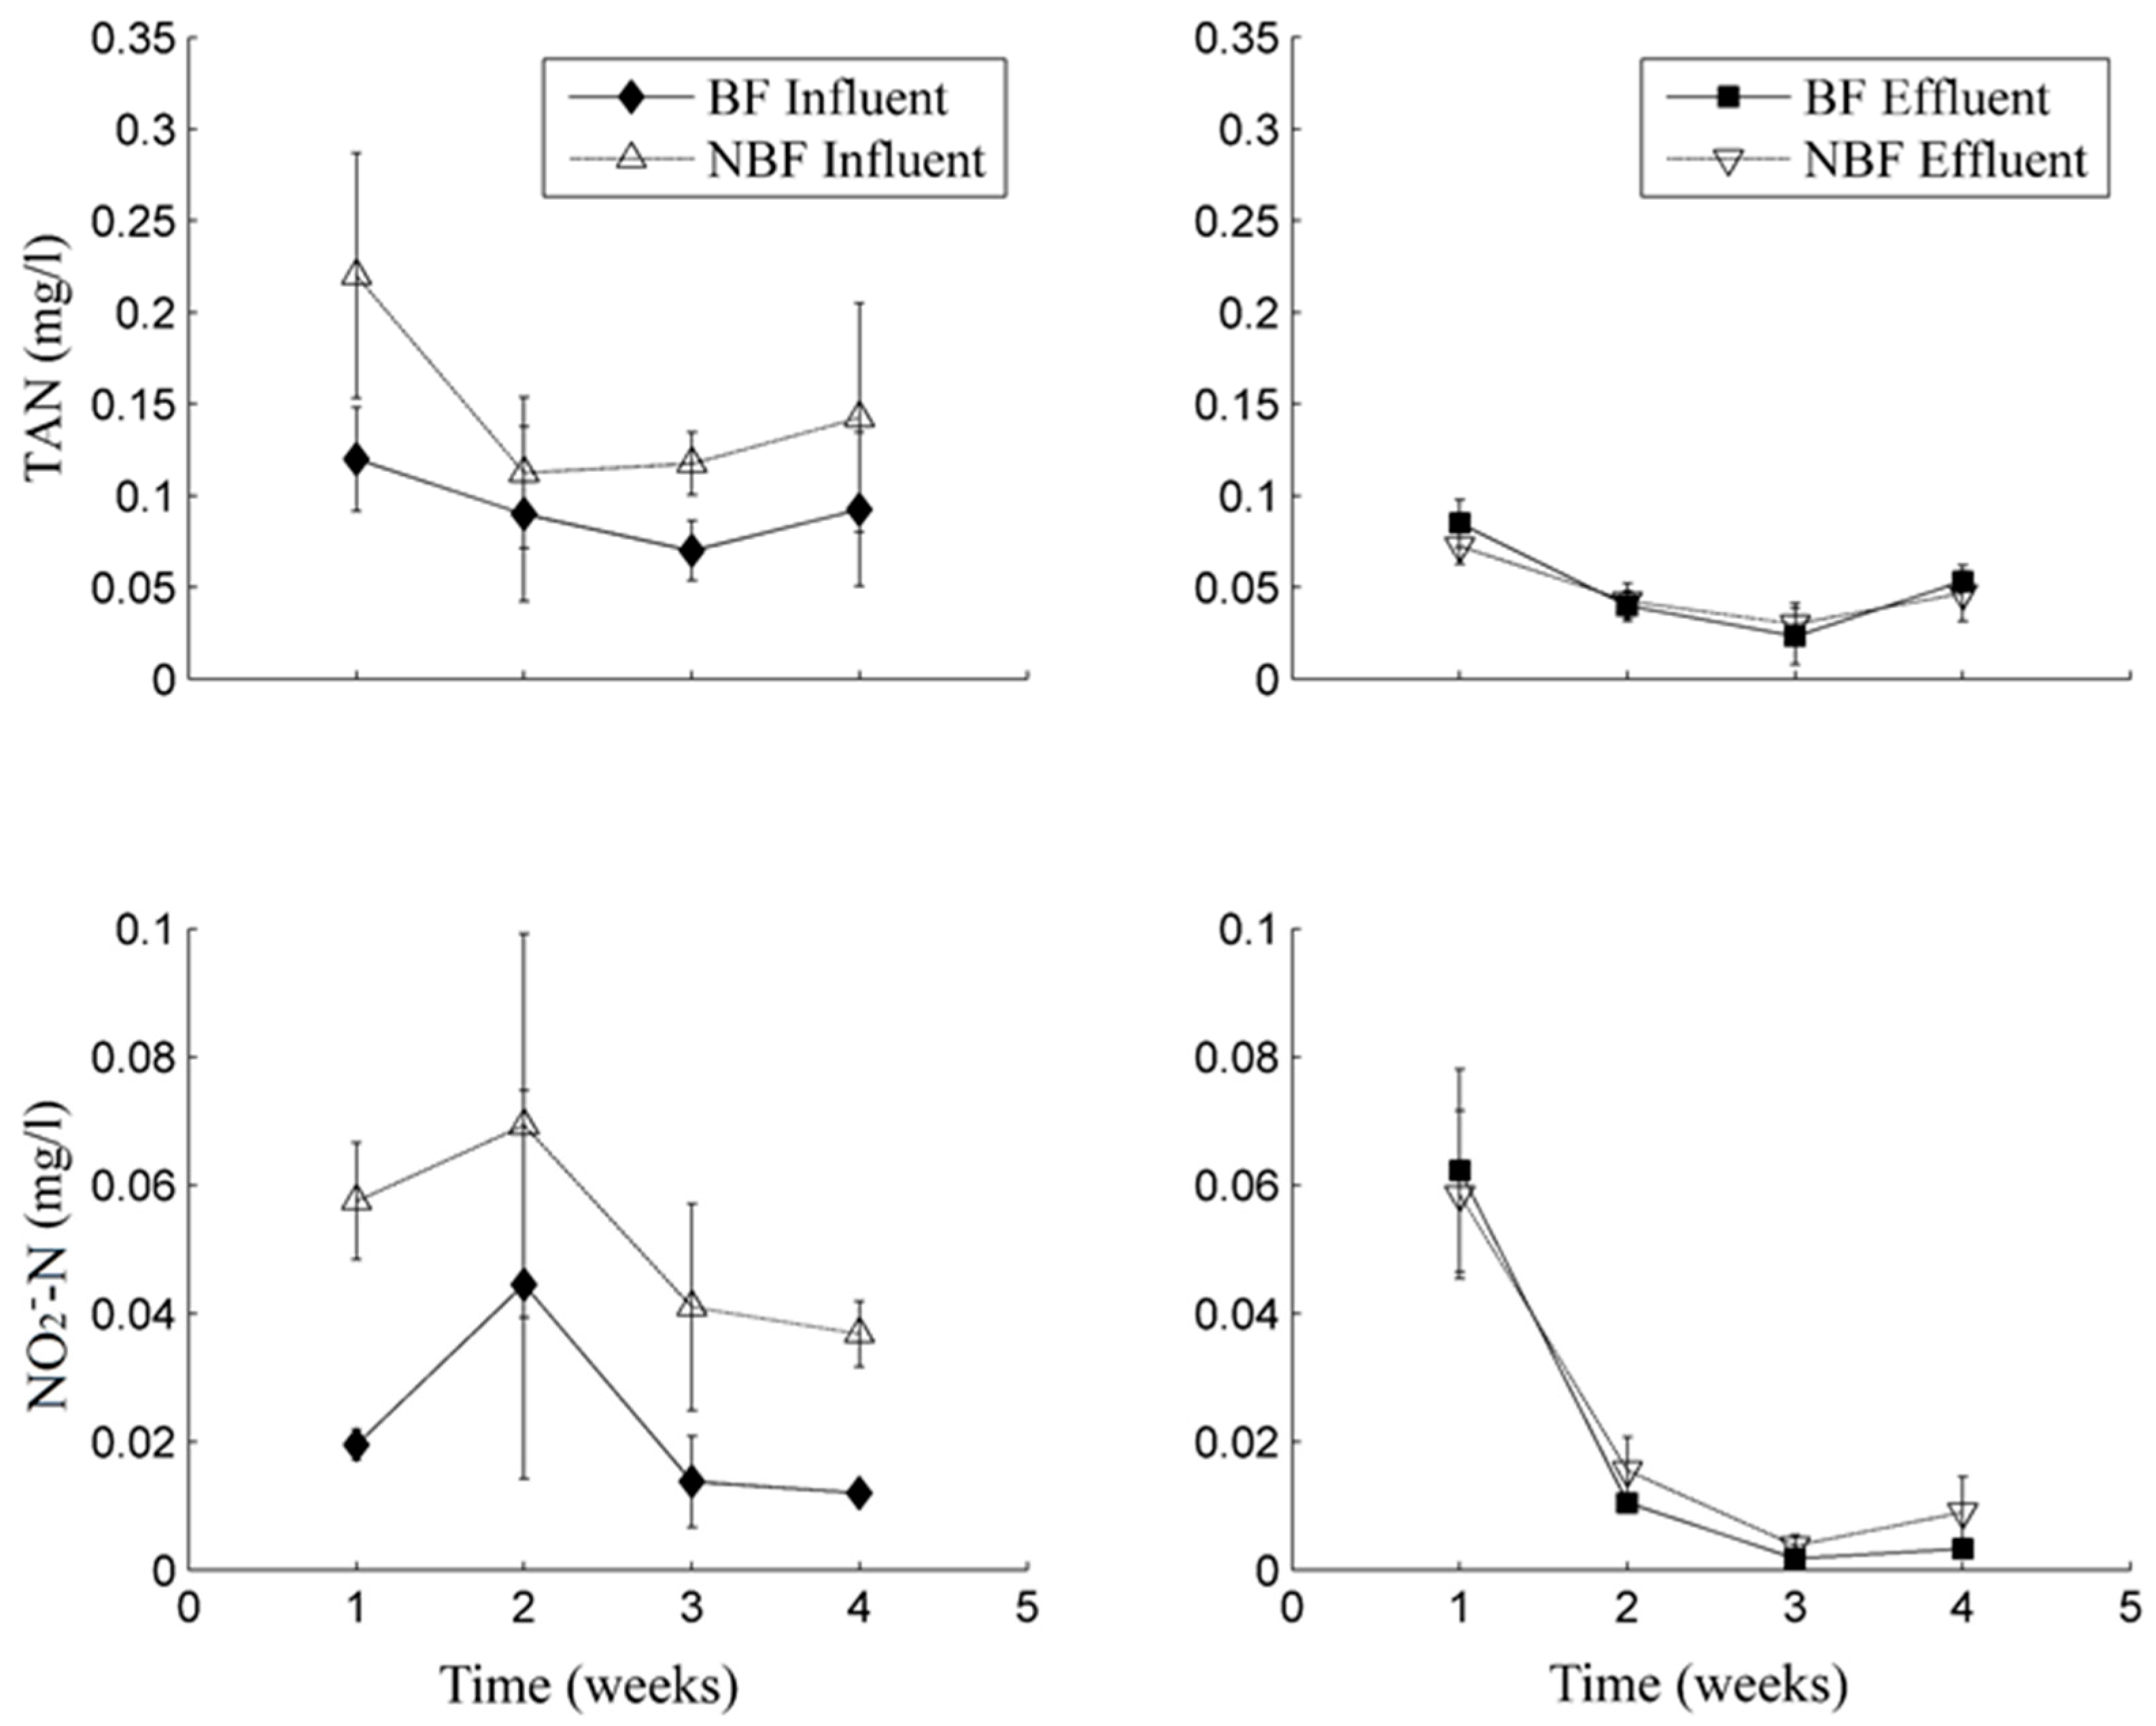
3.2. Water Quality in Plant Aquaponics Culture and Tilapia Aquaponics Culture Components

In the plant aquaponics culture, the influent aquaponics water quality was significantly different between the treatments with (BF) and without (NBF) a biofilter (Table 3). Differences were extremely significant for water temperature (F1,6 = 83.86, p = 0.0001), highly significant for D.O. (F1,6 = 62.54, p = 0.0002) and conductivity (F1,6 = 29.59, p = 0.0016), and significant for pH (F1,6 = 7.21, p = 0.0363) between the treatments.
In the BF treatment, influent pH and D.O. were higher and conductivity and temperature were lower than in the NBF treatment. In contrast, there was only a very highly significant difference in the effluent water between systems for conductivity (F1,6 = 222.94, p < 0.0001), with lower values for BF.
In the tilapia aquaponics culture, only the average values of water quality parameters of each treatment are presented in Table 4. Values in the table are the average during the experiment obtained from mean values from both tanks (small fish and large fish tanks) from each treatment (Figure 1).
The analyses of toxic nitrogen compounds, in the influent and effluent of plant aquaponics culture, revealed that average NO2-N and TAN concentrations in the influent were significantly lower (−t0.05(1),6 = −6.08, p = 0.0005 and −t0.05(1),6 = −3.68, p = 0.0051 respectively) in the BF treatment than in the NBF treatment, while in the effluent the concentration was not significantly different for NO2-N (t0.05(2),6 = −6.08, p = 0.4535) or for TAN (t0.05(2),6 = 1.40, p = 0.2102) (Table 5).
Average NH3-N concentrations calculated for the influent were lower (U0.05(1),4,4 = 10, p = 0.0286) in the system with biofilter compared to the system without biofilter. In the effluent, there were no significant differences between treatments (U0.05(1),4,4 = 22, p = 0.3429).
TAN and NO2-N in the plant aquaponics culture tanks differed throughout the study (Figure 2). For the BF treatment TAN concentration was higher in the influent than in the effluent on the second (T0.1(1),4 = 10, p = 0.0625) and third week (t0.05(1),2 = 4.21, p = 0.0260); in NBF it was higher in the influent than in the effluent on the first (T0.1(1),4 = 10, p = 0.0625), second (t0.05(1),3 = 3.33, p = 0.0223) and third week (t0.05(1),3 = 8.43, p = 0.0017). In the treatment with the biofilter, NO2-N concentration was significantly higher in the influent than in the effluent in the second (T0.1(1),4 = 10, p = 0.0625), third (t0.05(1),3 = 3.0, p = 0.0100) and fourth (t0.05(1),2 = 8.15, p = 0.0019) week. There were also significant differences in the same weeks (2nd week—t0.05(1),3 = 4.09, p = 0.0132; 3rd—t0.05(1),2 = 4.55, p = 0.0100; 4th—t0.05(1),2 = 6.63, p = 0.0035) in the treatment without the biofilter.

4. Discussion

4.1. Pak choi and tilapia Production in Aquaponics Systems

Despite the fact that the mean environmental temperature during the experiment (28.03 °C, obtained from the CINVESTAV meteorological station) exceeded the range proposed by Stephens [25] for pak choi culture of 15–21 °C, the pak choi plants in both treatments (with and without a biofilter) reached commercial size in 30 days, which is a shorter culture time than the 40–84 days previously reported [26,27,28,29]. Heights were within the range of 20–50 cm [30,31] and individual weights within the range of 225–260 g [31]. The pak choi humidity was also similar to the value reported by the US Department of Agriculture [32] (95.32%). Pak choi productivity in both treatments was higher than that reported in other aquaponics studies [33,34,35] and was within the range of 0.5 to 7 kg/m2 for soil culture [28]. This may be because the response of different plant varieties to environmental temperature can vary [25]. There are also reports of pak choi grown successfully in aquaponics systems between 21.6 and 30.4 °C [33], and in hydroponic systems under greenhouse conditions between 34 and 45 °C [36,37] of environmental temperature. This suggests that the environmental temperature during the experiment was appropriate for pak choi development. Thus, the study demonstrates that pak choi aquaponics culture in a tropical location is viable.
In tilapia aquaponics culture, the feeding conversion rate obtained in both treatments (see Table 2) was within the 1.4–1.8 range reported in previous aquaponics studies for fish with similar initial weights to those of the current study [8,14,17]. Furthermore, a higher specific growth rate was obtained than that reported for fish with an initial similar weight to those of the current study (0.7%) [14], therefore, tilapia aquaponics culture may be considered successful in both treatments.

4.2. Water Quality in Plant Aquaponics Culture and Tilapia Aquaponics Culture Components

In the influent, differences between water parameters for the treatments with and without a biofilter (see Table 3) were probably a consequence of the system’s orientation or the trickling biofilter. Temperature and D.O. may have been affected by the system’s orientation since the fish tanks in the treatment without a biofilter had a concrete wall next to them, which acted as a barrier against cooling during the night. In contrast, the fish tanks in the treatment with a biofilter did not have such a barrier, resulting in lower temperatures and higher oxygen concentrations. Another possible reason for this is the way the water falls over the bacteria fixing medium in trickling biofilters, which puts the water in contact with air, leading to oxygenation of the water, the release of CO2 and cooling. Furthermore oxygen is inversely related to temperature, thus it is logical that if the water temperature was lower in the treatment with a biofilter than in the treatment without one, the D.O. was higher in the former than the latter. Lower levels of conductivity and higher pH values in the treatment with a biofilter than in the treatment without a biofilter, may be due to the biofilter. The trickling biofilter allows more CO2 to be eliminated than in the elevated tank from the treatment without a biofilter [38]. This raises the pH level and increases the CO3 concentration, which leads to CaCO3 precipitation and reduces the ion quantity in the solution and therefore the conductivity [39].
In the effluent, there was no significant difference for almost all the water parameters, with the exception of conductivity, which was higher in the treatment without a biofilter than in the treatment with a biofilter, which was also the case in the influent. These similarities prove that the plant aquaponics culture component in a system without a biofilter is able to achieve the same water quality as a system with a biofilter, the exception being conductivity.
To our knowledge there are no specific reports on optimum dissolved oxygen levels and hydroponic solution temperature for pak choi. However, Remy et al. [36] reported a hydroponic solution temperature of 27 °C for pak choi culture using a RAFT system, which is similar to the water temperature in the current study (see Table 3). In this study (see Table 3) pH and conductivity were outside of the recommended range for pak choi culture [18,19,40]. In both treatments, in the plant aquaponics culture the aquaponics solution pH was higher than that previously reported of 5.5–6.5 for pak choi in hydroponic systems [8]. A pH value of 8.5 can limit nutrient availability (N, Bo, Fe, Mn, Cu and Zn) but does not inhibit growth [9]. When visible Fe deficiencies appeared, the micronutrient was added and this enabled the pak choi to grow with no signs of any other deficiencies and without having to decrease the solution pH. Recommended conductivity for hydroponic cultivation is within the 1500–4000 μS/cm range [9,40], however the levels observed in the current study were lower than this. In both treatments, even with a lower conductivity and higher pH than recommended, pak choi growth was successful. In aquaponics systems, it is common for conductivity to be lower and pH values to be higher than those recommended for hydroponics [41,42,43,44].
In the tilapia aquaponics culture tanks, the water quality parameters (pH, DO and temperature, see Table 4) were within the recommended range for the healthy growth of tilapia [45]. As we previously stated, culture performance was within the reported ranges for the feeding conversion rate and specific growth rate [8,14,17].
Water quality is a major economic and environmental issue in developing countries [46]; aquaculture may harm the environment by releasing organic effluents or disease treatment chemicals into the standing waters. Efforts to reduce these impacts and improve resource use efficiency have been driven by the potential increase in sustainability that could come from using waste from the land as a source of food and nutrients [47], as is the case in aquaponics.
In the current experiment, the lower levels of TAN and NO2-N in the presence of a biofilter, compared to when one was absent (see Table 5), prove that the biofilter has a nitrifying action. In the treatment without a biofilter, the higher average concentrations for TAN and NO2-N in the influent, and lower concentrations in the effluent, indicate that the system’s plant aquaponics culture was effective in regulating both toxic compounds over the four weeks of the study. This study also demonstrated the capacity of the plant aquaponics culture to assimilate these toxic nitrogen compounds, proved by the lower concentrations in the effluent than in the influent. This may have occurred because pak choi is able to assimilate ammonia NH4+-N as a source of nitrogen [18] and might even prefer it over nitrate NO3 [36].
Through the trial, TAN removal or transformation (due to nitrification) was more evident in the treatment without a biofilter than in the treatment with a biofilter (see Table 5 and Figure 2). This was because the TAN concentration in the treatment with a biofilter was lower since the biofilter transforms it first to NO2-N and then to NO3-N. Meanwhile, NO2-N removal through the research was similar in both treatments, with higher concentrations in the influent than in the effluent during the last three weeks. In the first week, the concentration was probably higher in the influent than in the effluent due to the fact that the the bacterial population was not yet established in the plant aquaponics culture tanks.
Ammonia is one of the most critical water quality parameters in intensive tilapia culture [48]. A concentration of 2 mg/L of TAN has been reported as toxic [49], with negative effects on tilapia growth due to chronic exposure reported above 0.1 mg/L of NH3-N [50,51]. In the case of NO2-N, Atwood et al. [52] found that for tilapia the LC50 was 8 mg/L NO2-N after 96 h and, according to Yildiz et al. [53], the concentration of NO2-N which causes methaemoglobin to increase in tilapia is within the range of 0.50–1.38 mg/L. Such levels were not reached in the current study, which could be due to the biofilter and system surface area (which works as a bacteria fixing medium) in the treatment with a biofilter, and to the system surface area and the plant aquaponics culture component in the treatment without a biofilter. In both treatments, another factor that contributed to the prevention of toxic levels of nitrogen compounds being reached was the semi-intensive tilapia stocking density. Since the quantity of NH3-N and NO2-N released by the fish was relatively low, the accumulation rate was also low. Small fish (s) in the treatment without a biofilter were more sensitive to higher concentrations of ammonia and nitrites than the large ones (b) (see Table 2), thus the results suggest that this kind of system would be more appropriate for fish in the final culture stage.
In an aquaponic system without a biofilter, in tropical areas and under semi-intensive fish culture conditions, the plant aquaponics culture reduced ammonia and nitrite concentrations to the same level as the concentrations of an aquaponic system with a trickling biofilter. For semi-intensive production systems, hydroponic tanks were able to retain and transform toxic nitrogen compounds and function as a biofilter. In the treatment without a biofilter the plant aquaponics culture and surface area was also sufficient for maintaining ammonia and nitrite below toxic levels for fish over a 4-week growth period without the need of a biofilter. This larger area for bacteria fixation in the BF treatment was the reason behind the lower levels of toxic nitrogen compounds recorded in this treatment.
Considering the high removal of TAN and nitrites by the plant aquaponics culture in the NBF treatment, the aquaponics system should be tested with a permanent flow through the plant aquaponics culture. In such systems TAN and NO2-N levels might be lower, because the constant flow will prevent them from accumulating, and tilapia growth may be similar with or without a biofilter, however trials are needed to prove this.

5. Conclusions

The production of commercial-sized plants four weeks after their introduction to a semi-intensive aquaponics fish culture, demonstrates an efficient use of wastewater from fish culture. The quantity of food produced was similar to that reported for pak choi and tilapia cultures grown separately. These outcomes suggest that a semi-intensive aquaponics system without a biofilter is an ecologically sustainable way to produce food. Results also demonstrated that it is possible to establish an eco-efficient tilapia-pak choi aquaponics system without a bacterial biofilter as a food production alternative for the small-scale rural farmers of Yucatan or other tropical locations.

Acknowledgments

The experimental work performed in this study was funded by “Departamento de Recursos del Mar”, CINVESTAV, Merida, Yucatan, Mexico. Experimental setup, data collection and analyses were made possible thanks to a student grant received by Laura Silva from the Mexican “Consejo Nacional de Ciencia y Tecnología” (CONACYT) to carry out doctoral studies at CINVESTAV. The authors thank Elizabeth Real de León for her assistance with water analyses and Tiburcio Castro Suaste for his support during all the stages of the experiment.

Author Contributions

Laura Silva and Edgardo Escalante contributed to the research design. Laura Silva coordinates, carried out the experiment and analyzed the literature. Edgardo Escalante carried out a detailed review. David Valdes Lozano carried out the TAN water analysis. Martha Hernández contributed to write the body of the paper and carried out a detailed review. Eucario Gasca-Leyva supervised the research project and carried out a detailed review. All the authors read and approved the final manuscript.

Conflicts of Interest

The authors declare no conflict of interest.

References

  1. World Bank. Rural Population (% of Total Population). Available online: http://data.worldbank.org/indicator/SP.RUR.TOTL.ZS?view=map (accessed on 15 November 2016).
  2. United Nations. World Economic Situation and Prospects; United Nations: New York, NY, USA, 2016; p. 47. [Google Scholar]
  3. Paliwal, R.L.; Granados, G.; Lafitte, H.R.; Violic, A.D.; Marathée, J.-P. El Maíz En Los Trópicos: Mejoramiento y Producción; United Nations Food and Agriculture Organization: Roma, Italy, 2001. [Google Scholar]
  4. Keating, B.A.; Carberry, P.S.; Bindraban, P.S.; Asseng, S.; Meinke, H.; Dixon, J. Eco-efficient agriculture: Concepts, challenges, and opportunities. Crop Sci. 2010, 50. [Google Scholar] [CrossRef]
  5. CIAT. Direcciones Estratégicas: Agricultura Eco-Eficiente Para Reducir La Pobreza; Centro Internacional de Agricultura Tropical: Cali, Colombia, 2009. [Google Scholar]
  6. Wilkins, R. Eco-efficient approaches to land management: A case for increased integration of crop and animal production systems. Philos. Trans. R. Soc. B Biol. Sci. 2008, 363, 517–525. [Google Scholar] [CrossRef] [PubMed]
  7. Tscharntke, T.; Clough, Y.; Wanger, T.C.; Jackson, L.; Motzke, I.; Perfecto, I.; Vandermeer, J.; Whitbread, A. Global food security, biodiversity conservation and the future of agricultural intensification. Biol. Conserv. 2012, 151, 53–59. [Google Scholar] [CrossRef]
  8. Watten, B.J.; Busch, R.L. Tropical production of tilapia (Sarotherodon aurea) and tomatoes (Lycopersicon esculentum) in a small-scale recirculating water system. Aquaculture 1984, 41, 271–283. [Google Scholar] [CrossRef]
  9. Quilleré, I.; Marie, D.; Roux, D.; Gosse, F.; Morot-Gaudry, J.F. An artificial productive ecosystem based on a fish/bacteria/plant association. 1. Design and management. Agric. Ecosyst. Environ. 1993, 47, 13–30. [Google Scholar] [CrossRef]
  10. Lennard, W.; Leonard, B. A comparison of three different hydroponic sub-systems (gravel bed, floating and nutrient film technique) in an aquaponic test system. Aquac. Int. 2006, 14, 539–550. [Google Scholar] [CrossRef]
  11. Sikawa, D.C.; Yakupitiyage, A. The hydroponic production of lettuce (Lactuca sativa) by using hybrid catfish (Clarias macrocephalus × C. Gariepinus) pond water: Potentials and constraints. Agric. Water Manag. 2010, 97, 1317–1325. [Google Scholar] [CrossRef]
  12. Yen, H.Y.; Chou, J.H. Water purification by oyster shell bio-medium in a recirculating aquaponic system. Ecol. Eng. 2016, 95, 229–236. [Google Scholar] [CrossRef]
  13. Cerozi, B.D.S.; Fitzsimmons, K. Use of Bacillus spp. to enhance phosphorus availability and serve as a plant growth promoter in aquaponics systems. Sci. Hortic. 2016, 211, 277–282. [Google Scholar] [CrossRef]
  14. Al-Hafedh, Y.S.; Alam, A.; Beltagi, M.S. Food production and water conservation in a recirculating aquaponic system in saudi arabia at different ratios of fish feed to plants. J. World Aquac. Soc. 2008, 39, 510–520. [Google Scholar] [CrossRef]
  15. Endut, A.; Jusoh, A.; Ali, N.; Wan Nik, W.B.; Hassan, A. A study on the optimal hydraulic loading rate and plant ratios in recirculation aquaponic system. Bioresour. Technol. 2010, 101, 1511–1517. [Google Scholar] [CrossRef] [PubMed]
  16. Emerson, K.; Russo, R.C.; Lund, R.E.; Thurston, R.V. Aqueous Ammonia Equilibrium Calculations: Effect of pH and Temperature. J. Fish. Res. Board Can. 1975, 32, 2379–2383. [Google Scholar] [CrossRef]
  17. Rakocy, J.E.; Bailey, D.S.; Shultz, R.C.; Thoman, E.S. Update on Tilapia and Vegetable Production in the Uvi Aquaponic System, New Dimensions on Farmed Tilapia. In Proceedings of the Sixth International Symposium on Tilapia in Aquaculture, Manila, Philippines, 12–16 September 2004; Bolivar, R., Mair, G., Fitzsimmons, K., Eds.; Bureau of Fisheries & Aquatic Resources: Manila, Philippines, 2004. [Google Scholar]
  18. Aminuddin, H.; Khalip, R.; Norayah, K.; Alias, H. Urea as the nitrogen source in nft hydroponic system. Pertan. J. Trop. Agric. Sci. 1993, 16, 87–94. [Google Scholar]
  19. Resh, H.M. Hydroponic Food Production: A Definitive Guidebook for the Advanced Home Gardener and the Commercial Hydroponic Grower; CRC Press: Boca Raton, FL, USA, 2012. [Google Scholar]
  20. Isla-Esquivel, M.L.; Jimenez, A.C.; Yam, L.A.R. Factores sociales que afectan el cultivo de tilapia en la península de yucatán. Ambient. Desarro. 2011, 15, 113–135. [Google Scholar]
  21. FAO. Anti-Hunger Programme, a Twin-Track Approach to Hunger Reduction: Priorities for National and International Action; United Nations Food and Agriculture Organization: Roma, Italy, 2003. [Google Scholar]
  22. Nichols, M.; Savidov, N. Aquaponics: Protein and vegetables for developing countries. In Proceedings of the I International Symposium on Sustainable Vegetable Production in Southeast Asia, Salatiga, Indonesia, 14–17 March 2011; Everaarts, A., Neeteson, J., De Neve, S., Boehme, M., Eds.; International Society for Horticultural Science: Leuven, Belgium, 2012; pp. 189–193. [Google Scholar]
  23. Pan, J.; Sun, H.; Nduwimana, A.; Wang, Y.; Zhou, G.; Ying, Y.; Zhang, R. Hydroponic plate/fabric/grass system for treatment of aquacultural wastewater. Aquac. Eng. 2007, 37, 266–273. [Google Scholar] [CrossRef]
  24. Del Sánchez Castillo, F.; Escalante Rebolledo, E.R. Hidroponia. Un Sistema de Producción de Plantas; Principios y Métodos de Cultivo, 3rd ed.; Universidad Autónoma Chapingo: Texcoco, Mexico, 1988. [Google Scholar]
  25. Stephens, J.M. Cabbage, Chinese--Brassica Campestris L.(Pekinensis Group), Brassica Campestris L. (Chinensis Group); University of Florida Cooperative Extension Service, EDIS: Gainesville, FL, USA, 2012. [Google Scholar]
  26. Kulavit, W.; Catherine, A.H.; Stuart, T.N. Won Bok & Pak Choi; Department of Agricultural and Resource Economics, C.O., University of Hawaii: Honolulu, HI, USA, 1992. [Google Scholar]
  27. Wong, J.W.C.; Li, G.X.; Wong, M.H. The growth of brassica chinensis in heavy-metal-contaminated sewage sludge compost from hong kong. Bioresour. Technol. 1996, 58, 309–313. [Google Scholar] [CrossRef]
  28. FAO. Ecocrop Database. Available online: http://ecocrop.fao.org/ecocrop/srv/en/cropView?id=547 (accessed on 17 July 2015).
  29. Zutić, I.; Borošić, J.; Toth, N.; Novak, B.; Dobričević, N. Agronomic and Dietary Value of Pak Choy (Brassica rapa ssp. Chinensis) in Different Growing Periods. In Proceedings of the III Balkan Symposium on Vegetables and Potatoes, Bursa, Turkey, 6–10 September 2004; International Society for Horticultural Science: Leuven, Belgium, 2007; pp. 239–243. [Google Scholar]
  30. Ronzio, R.A. The Encyclopedia of Nutrition and Good Health; Facts On File, Inc.: New York, NY, USA, 2003; p. 726. [Google Scholar]
  31. Hu, S.-Y. Food Plants of China; Chinese University Press: Hong Kong, China, 2005. [Google Scholar]
  32. US Department of Agriculture; A.R.S.; Nutrient Data Laboratory. National Nutrient Database for Standard Reference Release 28, Basic Report: 11116, Cabbage, Chinese (Pak-Choi), Raw. Available online: http://ndb.nal.usda.gov/ndb/foods/show/2894?manu=&fgcd= (accessed on 7 December 2015).
  33. Zou, Y.; Hu, Z.; Zhang, J.; Guimbaud, C.; Wang, Q.; Fang, Y. Effect of seasonal variation on nitrogen transformations in aquaponics of northern china. Ecol. Eng. 2016, 94, 30–36. [Google Scholar] [CrossRef]
  34. Zou, Y.; Hu, Z.; Zhang, J.; Xie, H.; Guimbaud, C.; Fang, Y. Effects of ph on nitrogen transformations in media-based aquaponics. Bioresour. Technol. 2016, 210, 81–87. [Google Scholar] [CrossRef] [PubMed]
  35. Zou, Y.; Hu, Z.; Zhang, J.; Xie, H.; Liang, S.; Wang, J.; Yan, R. Attempts to improve nitrogen utilization efficiency of aquaponics through nitrifies addition and filler gradation. Environ. Sci. Pollut. Res. 2016, 23, 6671–6679. [Google Scholar] [CrossRef] [PubMed]
  36. Remy, M.; Singh, B.K.; Taylor, R. Evaluación de dos técnicas hidropónicas adaptadas para las condiciones del trópico húmedo. Tierra Trop. 2006, 2, 29–35. [Google Scholar]
  37. Cho, Y.Y.; Son, J.E. Effects of electrical conductivity on growth and yield of hydroponically-grown pak-choi (Brassica campestris ssp. Chinensis). Hortic. Environ. Biotechnol. 2007, 48, 97–101. [Google Scholar]
  38. Timmons, M.B.; Ebeling, J.M.; Wheaton, F.W.; Summerfelt, S.T.; Vinci, B.J. Recirculating Aquaculture Systems, 2nd ed.; Northeast Regional Aquaculture Center: Ithaca, NY, USA, 2002; pp. 205–258. [Google Scholar]
  39. Stumm, W.; Morgan, J.J. Aquatic Chemistry: Chemical Equilibria and Rates in Natural Waters, 3rd ed.; John Wiley & Sons, Inc.: New York, NY, USA, 1995; p. 1022. [Google Scholar]
  40. Trejo-Téllez, L.I.; Gómez-Merino, F.C. Nutrient solutions for hydroponic systems. In Hydroponics—A Standard Methodology for Plant Biological Researches; Asao, T., Ed.; InTech: Rijeka, Croatia, 2012; p. 244. [Google Scholar]
  41. Liang, J.-Y.; Chien, Y.-H. Effects of feeding frequency and photoperiod on water quality and crop production in a tilapia–water spinach raft aquaponics system. Int. Biodeterior. Biodegrad. 2013, 85, 693–700. [Google Scholar] [CrossRef]
  42. Medina, M.; Jayachandran, K.; Bhat, M.G.; Deoraj, A. Assessing plant growth, water quality and economic effects from application of a plant-based aquafeed in a recirculating aquaponic system. Aquac. Int. 2016, 25, 415–427. [Google Scholar] [CrossRef]
  43. Roosta, H.R.; Hamidpour, M. Effects of foliar application of some macro- and micro-nutrients on tomato plants in aquaponic and hydroponic systems. Sci. Hortic. 2011, 129, 396–402. [Google Scholar] [CrossRef]
  44. Wortman, S.E. Crop physiological response to nutrient solution electrical conductivity and pH in an ebb-and-flow hydroponic system. Sci. Hortic. 2015, 194, 34–42. [Google Scholar] [CrossRef]
  45. El-Sayed, A.-F.M. Tilapia Culture; CABI Publishing: Oxfordshire, UK, 2006; p. 277. [Google Scholar]
  46. Markandya, A. Water quality issues in developing countries. In Economic Development and Environmental Sustainability: New Policy Options; López, R., Toman, M.A., Eds.; Oxford University Press: New York, NY, USA, 2006; pp. 307–344. [Google Scholar]
  47. Godfray, H.C.J.; Beddington, J.R.; Crute, I.R.; Haddad, L.; Lawrence, D.; Muir, J.F.; Toulmin, C. Food security: the challenge of feeding 9 billion people. Science 2010, 327, 812. [Google Scholar] [CrossRef] [PubMed]
  48. Liakonis, K.M.; Waagbø, R.; Foss, A.; Breck, O.; Imsland, A.K. Effects of chronic and periodic exposures to ammonia on the eye health in juvenile atlantic halibut (Hippoglossus hippoglossus). Fish Physiol. Biochem. 2012, 38, 421–430. [Google Scholar] [CrossRef] [PubMed]
  49. Benli, A.Ç.K.; Köksa, G.; Özkul, A. Sublethal ammonia exposure of Nile tilapia (Oreochromis niloticus L.): Effects on gill, liver and kidney histology. Chemosphere 2008, 72, 1355–1358. [Google Scholar] [CrossRef] [PubMed]
  50. El-Shafai, S.A.; El-Gohary, F.A.; Nasr, F.A.; van der Steen, N.P.; Gijzen, H.J. Chronic ammonia toxicity to duckweed-fed tilapia (Oreochromis niloticus). Aquaculture 2004, 232, 117–127. [Google Scholar] [CrossRef]
  51. El-Sherif, M.; El-Feky, A.M. Effect of ammonia on Nile tilapia (O. niloticus) performance and some hematological and histological measures. In Proceedings of the 8th International Symposium on Tilapia in Aquaculture, Cairo, Egypt, 12–14 October 2008; pp. 513–530. [Google Scholar]
  52. Atwood, H.L.; Fontenot, Q.C.; Tomasso, J.R.; Isely, J.J. Toxicity of nitrite to Nile tilapia: Effect of fish size and environmental chloride. N. Am. J. Aquac. 2001, 63, 49–51. [Google Scholar] [CrossRef]
  53. Yildiz, H.Y.; Köksal, G.; Borazan, G.; Benli, Ç.K. Nitrite-induced methemoglobinemia in Nile tilapia, Oreochromis niloticus. J. Appl. Ichthyol. 2006, 22, 426–427. [Google Scholar] [CrossRef]
Figure 1. Aquaponics systems (a) biofilter (BF) treatment system; (b) without biofilter (NBF) treatment system. BFs (small), BFb (larger), NBFs (small), NBFb (larger): Fish tanks, S: Sedimentation tank, Hp: Hydraulic pump, B: Biofilter, ET: Elevated tank, R1, R2 and R3: Reservoirs, A: Plant aquaponics culture tanks, Wt: Water taps.
Sustainability 09 00592 g001
Figure 2. Concentrations of TAN and nitrites in the influent and effluent of the plant aquaponics culture through time. BF, treatment with biofilter and NBF, treatment without biofilter. Points in the graph represent mean values and whiskers represent the standard error.
Sustainability 09 00592 g002
Table 1. Pak choi average growth (mean ± standard deviation) over a four-week period in tilapia/pak choi aquaponics culture with (BF) and without (NBF) a biofilter.
VariableUnitsBFNBF
Final fresh weight (g/plant)284.6 ± 73.11 286.3 ± 36.97
Final dry weight (g/plant)11.8 ± 2.74 11.5 ± 1.68
Moisture%95.83 ± 0.222 95.99 ± 0.117
Fresh weight edible portion (g/plant)248.8 ± 65.33 255.0 ± 35.64
Leaf heightcm35.0 ± 2.67 36.1 ± 1.65
Stem basal diametermm10.16 ± 1.067 10.29 ± 0.700
Table 2. Growth (mean ± standard deviation) of large (b) and small (s) tilapia over four weeks in aquaponics systems with (BF) and without (NBF) a biofilter.
ParametersBFsBFbNBFsNBFb
Fish number22242224
Initial weight (g)122.3 ± 8.94 a208.3 ± 20.61 a122.5 ± 9.75 a208.4 ± 21.47 a
Final weight (g)303.2 ± 45.87 a427.5 ± 45.87 a272.6 ± 31.24 b403.0 ± 53.73 a
Specific growth rate (%)1.891.501.671.37
Feeding conversion rate1.381.501.621.68
Final density per treatment (kg/m3)11.2810.44
Yield per treatment (kg produced/m3)6.165.32
Different superscript letters denote statistically significant differences between treatments for each weight group (p < 0.01).
Table 3. Average values (mean ± standard deviation) of the water quality parameters temperature, pH, dissolved oxygen (D.O.), and conductivity of the influent and effluent over a four-week period in plant aquaponics culture with (BF) and without (NBF) a biofilter.
Influent/EffluentTreatmentWater Temperature (°C)D.O. (mg/L)pHConductivity (µS/cm)
InfluentBF29.4 ± 0.05 a6.94 ± 0.033 a8.44 ± 0.044 a1188 ± 17 a
NBF29.73 ± 0.06 b6.80 ± 0.011 b8.35 ± 0.052 b1240 ± 16 b
EffluentBF28.2 ± 0.12 a7.10 ± 0.057 a8.81 ± 0.055 a1125 ± 5 a
NBF28.4 ± 0.12 a7.02 ± 0.040 a8.76 ± 0.089 a1173 ± 4 b
Different superscript letters denote statistically significant differences between treatments (p < 0.05).
Table 4. Average values (mean ± standard deviation) of the water quality parameters temperature, pH, dissolved oxygen (D.O.), and conductivity of the over a four-week period in tilapia aquaponics culture tanks with (BF) and without (NBF) a biofilter.
TreatmentWater Temperature (°C)D.O. (mg/L)pHConductivity (µS/cm)
BF29.116.298.501152
NBF29.266.248.371199
No statistical tests were o carried out due to lack of replicates.
Table 5. Average values (mean ± standard deviation) and percentage removal of toxic nitrogen compounds over four weeks in the influent and effluent of a plant aquaponics culture.
Influent/EffluentTreatmentNO2-N (mg/L)TAN (mg/L)NH3-N(mg/L)
InfluentBF0.022 ± 0.0063 a,10.094 ± 0.0125 a,10.015 ± 0.0031 a,1
NBF0.051 ± 0.0071 b,10.148 ± 0.0266 b,10.021 ± 0.0028 b,1
EffluentBF0.019 ± 0.0045 a,10.053 ± 0.0083 a,20.017 ± 0.0029 a,1
NBF0.022 ± 0.0032 a,20.046 ± 0.0054 a,20.015 ± 0.0007 a,2
Percentage removal BF13.642.2−13.3
NBF58.864.328.6
BF, treatment with biofilter and NBF, treatment without biofilter. The table presents the mean value from replicates ± standard deviation. Different superscript letters denote statistically significant differences between treatments and different superscript numbers between Influent and Effluent from the same treatment (p < 0.05).

