
Evolution Characteristics of Landscape Ecological Risk Patterns in Coastal Zones in Zhejiang Province, China


1
Department of Geography & Spatial Information Techniques, Ningbo University, Ningbo 315211, China
2
Research Center for Marine Culture and Economy, Ningbo 315211, China
3
University of South Florida, School of Geosciences, Tampa, FL 33620-5200, USA
4
School of Law, Ningbo University, Ningbo 315211, China
*
Authors to whom correspondence should be addressed.
Sustainability 2017, 9(4), 584; https://doi.org/10.3390/su9040584
Submission received: 16 February 2017
/
Revised: 5 April 2017
/
Accepted: 7 April 2017
/
Published: 11 April 2017
Abstract
:Analyzing evolution characteristics of landscape ecological risk patterns would help establish ecological risk early warning mechanism, reduce the ecological risk probability and promote coastal landscape pattern optimization. In this study, landscape pattern indices were first calculated by using multitemporal Landsat TM images acquired in years 1990, 2000 and 2010, then landscape ecological risk pattern evolution models and the spatiotemporal evolutions of ecological risk patterns of coastal zones in Zhejiang province, China were constructed and analyzed. The results demonstrate that (1) greater changes have taken place in landscape structures during the two decades, and (2) the areas of cropland, sea, woodland and water surface have decreased significantly, while the areas of built-up land, unused land and aquaculture land have increased. In 1990, coastal landscapes were mainly occupied by extremely low and low ecological risk areas. However, by 2010, the low ecological risk area apparently decreased compared to that in 1990, while extremely high and high ecological risk areas increased significantly, occupying spatial regions where originally the extremely low and low ecological risk zones located. Transition rates of ecological risk grades in the second ten years (2000–2010) were significantly lower than in the first ten years (1990–2000). The result suggests that people who originally urged to accelerate coastal landscape exploitation and development have started to concern the ecological environment protection and to pursue a mode that economic development and ecological protection are synchronously conducted.
1. Introduction
Risk refers to a possibility or probability that causes some negative effects under certain circumstances that expose some specific environmental pressures [1,2]. The risk pattern evolution is a complicated system process and is affected by various factors, such as nature, society and economy. Different impact factors make different effects on the risk evolution process from their functions, impact ranges and extents. These factors can interact at different spatial scales, which can result in a complexity and unpredictability of an ecological risk revolution. A scientific ecological risk assessment and risk pattern evolution analysis may provide an important reference for establishing an ecological risk early warning mechanism, reducing an ecological risk probability and promoting a coastal landscape pattern optimization [3]. As an object of human activities and resources and environment exploitations, the landscape is a concern of ecological researchers. Per the landscape ecological risk pattern evolution analysis at a regional scale, the possibility and impact magnitude caused by human activities, natural disasters and environmental pollution on ecosystem structure and function can be measured and evaluated [4]. Consequently, various potential ecological environment impact factors, processes and their cumulative consequences can be comprehensively evaluated through the landscape ecological risk pattern evolution analysis.
Existing studies on ecological risk assessment boomed in 1970s. Of them, the United States was one of the first countries that were interested in studying the ecological risk [5,6]. Initially, research was only conducted on a toxicological study on effects of a single chemical pollutant on the environment and human health. By the end of 1980s, scholars had gradually changed from studies of toxicological risk to ecological risk assessment at different scales. The ecological risk assessment based on a regional scale had become a research topic in the field of ecology and geography. In 1998, the US Environmental Protection Agency (EPA) officially promulgated an “Ecological Risk Assessment Guide” [7], which symbolizes that the ecological risk assessment has reached a mature stage. After that, a series of studies were conducted by many researchers on impacts of the ecological risk assessment framework and chemical toxic on the ecological risk [8,9]. Many scholars were focusing on in-depth studies of regional ecological risk at different spatial scales, such as lakes [10], river delta [11,12], and watershed basin [9,13,14] and different land use/cover types [15,16,17,18]. Major risk assessment models consist of the Relative Risk assessment Model (RRM) [19], the Hierarchical Patch Dynamics Paradigm (HPDP) [20] and the Procedure for Ecological Tiered Assessment of Risk (PETAR) [21].
Along with the development of ecological risk assessment, an ecological risk assessment focusing on landscape ecological process and spatial pattern in an interrelated perspective became an important branch of regional ecological risk assessment in 1990s [22]. The concept of landscape was first proposed by German geographer Carl Troll [23] in the interpretation of remote sensing images in East Africa. As a complex of the natural surface, the landscape is of a spatial heterogeneity of a regional ecosystem collection. It consists of various heterogeneous elements. Due to the nature of high heterogeneity of the landscape change, the change of its whole structure and dynamic process is relatively slow, but spatial components of the landscape can be changed in different speeds and intensities when disturbed. Thus, an ecological risk assessment method can be used to evaluate the key factors of ecological risk assessment, the risk receptor range and the damage status, etc. by quantifying such a slowly changing amount of the landscape [24]. The landscape itself is a resource of human economic activities and an object of human exploitation. The economic activities of human beings are mainly carried out at a landscape level. The landscape has become an appropriate scale to study the impact of human activities on the environment. Compared with the regional ecological risk assessment that focuses on a comprehensive assessment of multiple risks and on an overall risk quantitative assessment of ecological environment, the landscape ecological risk assessment lays more emphasis on the effect of landscape pattern on ecological processes or functions. To a certain extent, an evaluation method based on a landscape pattern can get rid of the inherent mode of the traditional ecosystem evaluation; it evaluates the landscape ecological risk directly from the spatial pattern at a regional scale. With the evaluation method, a risk receptor is no longer a single element in a regional ecosystem, but rather ecosystem itself that makes up heterogeneous landscapes. Risk sources are also no longer environmental pollutants, natural disasters or human interference, but ecological risk effects to evaluate the degree of deviation from an optimal pattern of a landscape mosaic.
A landscape index is frequently used to measure the landscape pattern at a region scale, and thus in a study of landscape ecological risk assessment, it is involved in the landscape ecological risk assessment framework. A landscape ecological risk index is often constructed by using data of regional land use and landscape structure derived from remote sensing images. It is an integrated ecological risk index that is spatially variable, assessed by using a systematically sampling method, and finally, a semivariogram analysis tool of the ecological risk index can be carried out. This method was adopted in this study.
Compared with the ecological risk assessment of some regions where human activity is intense, a study area selected in natural areas such as forest, grassland and other natural areas is relatively rare. This is consistent with a development trend of macro ecology in recent years, which emphasizes the impact of human activities on an ecosystem, and focuses on the study of ecological environment-social economic complex [25]. Meanwhile, a landscape ecological risk assessment conducted in natural areas that are ecologically fragile and have a strong response to global change still needs to be further studied. Such natural areas include the coastal zone [13], the wetland [26], the loess hilly region, the agro-pastoral ecotone and the desert oasis. The overall landscape pattern in these areas is relatively fragmented and has a poor stability and resilience, and the pattern’s changes is rapid and obvious under pressures of both human activities and natural disturbance. Therefore, these areas will be a focus of future research on landscape ecological risk assessment.
As major interfaces of mainland, atmosphere and ocean systems, a coastal zone is one of the most frequent and concentrated regions for material, energy and information exchange. Due to rich resources, superior natural conditions, excellent geographical location and unique characteristics of land and sea, the coastal zone is one of the most active and concentrated regions [27,28]. Meanwhile, a conflict between resources and environment leads to primary problems caused by increasing human activities, and the coastal zones have transformed to sensitive regions where various hazards and risks occur frequently [28,29,30]. Since the International Council for Science (ICSU), the International Geosphere-Biosphere Programme (IGBP) and the International Human Dimensions Programme (IHDP) on Global Environmental Change programs identified the Land Ocean Interactions in the Coastal Zone (LOICZ) as one of their core programs in 1986, many researchers have conducted various studies on analyses of coastal zones from the landscape pattern [31,32], the ecological risk [33,34] and the land-use and land-cover change [35]. However, few studies have actually addressed issues on the dynamics of spatial and temporal risk pattern evolution, and studies that focus on assessing coastal ecological risk pattern evolution are even scarcer. The coastal zone ecological risk pattern is a dynamic process that is characterized by continuous updates and changes. Further, the risk factor, environment and tolerance can significantly affect the ecological risk pattern in the coastal zone [36].
Along with the economic development in the world, especially developing countries per China as a representative, the speedy urbanization, the problems of population density, traffic congestion, shortage of resources, environmental pollution and ecological deterioration and so on have become foci of attention of the whole human society in the process of urbanization in the coastal zone [37]. The impact of human activities on the change of the Earth system is beyond the natural force and cannot be ignored. Rapid urbanization leads to a large reduction in arable land, destruction of habitat, extinction of species, and reduction of net primary productivity. Due to the speedy urbanization, the impact of human activities on the environment will directly change the original land use pattern and cause the change of land use/cover, thus profoundly affecting the Earth’s ecosystem [38]. As a macroscopic representation of land surface, the change of structure and pattern of the land affects the characteristics of landscape pattern, which results in the fragmentation of landscape patches and the ecological degradation. Human activities leading to the change of landscape pattern include urbanization, excessive deforestation, cultivation and unreasonable afforestation measures, etc. Among them, there are two main factors that cause the change of landscape pattern: urbanization and farming.
Coastal zones in Zhejiang province, China have been disturbed seriously by a long history of various exploitations and frequent anthropogenic activities. In recent years, the development and utilization of the coastal zones in Zhejiang Province have become a hotspot of economic development there. The hotspot of economic development mainly includes river dam construction, reclamation, coastal tourism, marine aquaculture, coastal mining, and pollutant emissions. Along with the rapid economic development in Zhejiang coastal zones, the coastal population pressure also increases. Human excessively plunders biological resources, and the exploitation and utilization activities of open land resources also intensified. The shortage of resources and deterioration of ecological environment are becoming more and more serious, which mainly reflect in the excessive reclamation of tidal flat and wetland, the decrease of cultivated land caused by urbanization and the decrease of natural vegetation coverage. As the change of landscape pattern, landscape types, such as cultivated land, sea area, forestland, water surface and so on, are replaced by construction land and farmland, and the scale of salt and sea aquaculture continues to expand, which leads to an increase in ecological risk sensitivity and vulnerability in coastal areas. Moreover, the degree of ecological risk increases, and coastal areas are exposing to a variety of hazards, such as sea level rise, seawater intrusion, coastal flooding and waterlogging, etc. caused by climate change. Thus, it is urgent to study and understand environmental changes in Zhejiang coastal zone [39]. Therefore, the primary goal of this study is to investigate the evolution characteristics of coastal ecological risk in Zhejiang province, China. The specific research objectives include (a) constructing landscape ecological risk indexes by using Landsat TM image data acquired in years 1990, 2000 and 2010 and landscape ecological metrics; (b) developing evolution models of landscape ecological risk pattern; and (c) analyzing spatiotemporal variation of the landscape ecological risk patterns in the coastal zones during the period of 1990–2010 in the study area.
2. Data and Methods
2.1. Study Area
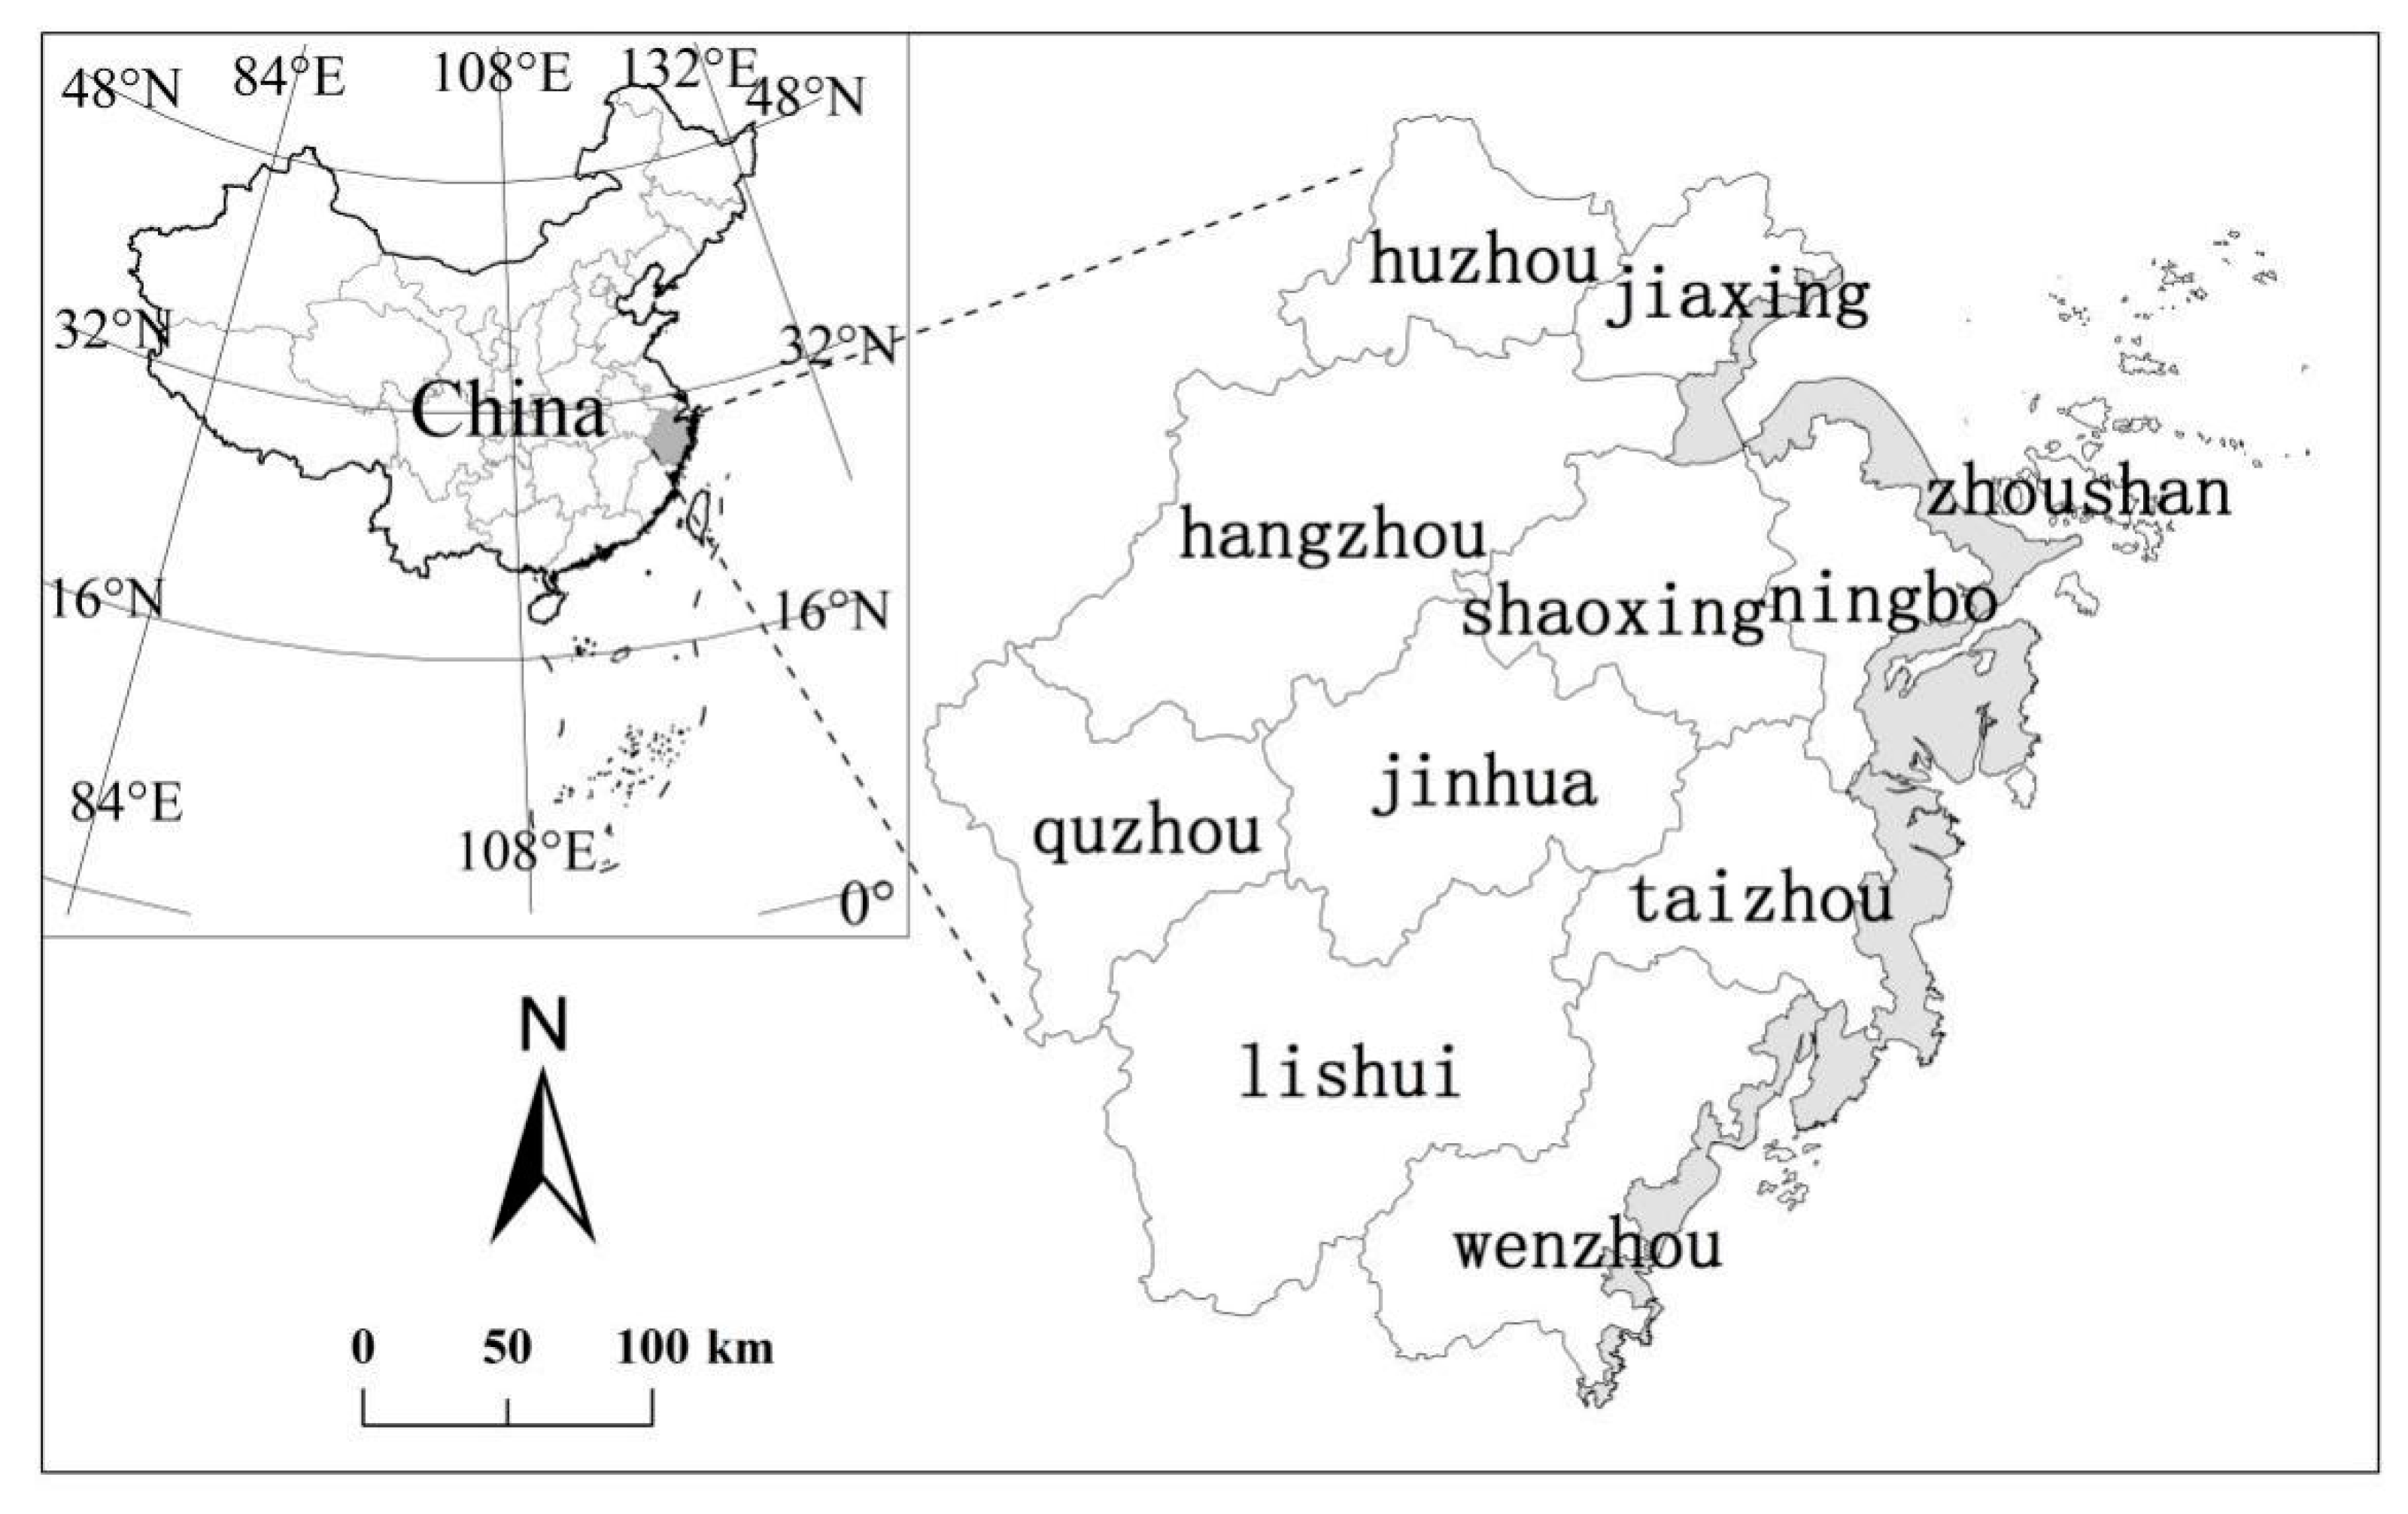
The study area is located in the coastal zones of Zhejiang Province, China (27°12′–31°31′N, 118°00′–123°00′E) (Figure 1) and is controlled by the tropical ocean air mass and polar continental air mass alternately. The coastal zones are located in the transition zone of tropical and subtropical climates. The terrestrial area of the province encompasses 101,800 km2 that is one of the smallest provinces in China (only 1.06% of total area in China). However, the province possesses an extensive sea area and includes seven coastal cities (including Jiaxing, Hangzhou, Shaoxing, Ningbo, Taizhou, Wenzhou and Zhoushan, Figure 1). More than 3061 islands (each with a land area of ≥500 m2) are distributed in this coastal area. The study area has a coastline of 2253.7 km while the total coastline in the Zhejiang province has 6500 km (including all offshore islands) and is approximately 20.3% of total coastline in China.
By considering the integrity of administrative divisions, the study area could be defined by relevant coastal villages, towns and streets (27°12′–30°44′N, 120°23′–122°08′E) (Figure 1, filled in grey), which cover approximately 10,000 km2. The study area has an average elevation of 5.67 m, and ranges from 4 to 6 m. This region has a sub-tropical monsoon climate, with a clear division of four seasons and abundant sunshine. Average annual temperature is 15–18 °C with a January mean of 3–8 °C and a July mean of 25–29 °C, and annual mean precipitation varies from 980 to 2000 mm. The coastal zones are important economically-developed regions in Zhejiang province and located on the southern wing of Yangtze River Delta, China. Their northeast is adjacent to international metropolis The City of Shanghai, China. The study area faces the Pacific Ocean and enjoys the advantages of the ocean, which is of great benefit to conduct regional technology and resources cooperation and exchanges at home and abroad.
2.2. Data Sets and Processing
In this study, Landsat TM images acquired in the years 1990, 2000 and 2010 were used as primary data resources (acquired between June and October covering a vegetation-growing season). Other data sources mainly include: (a) The administrative map of Zhejiang province; (b) land use map and land use history data that were collected from Land and Resources Department of Zhejiang Province; (c) the topographic map of Zhejiang province (1:250,000); and (d) GPS field survey data collected for this project. Remote sensing TM image processing was done using ERDAS software [40], including image geometric correction, image mosaicking, and masking out the study area. By referring to the national land resources classification system [41,42] and existing land use condition in different study periods, the landscape in the study area was determined into eight types (incl. woodland, cropland, built-up land, water surface, aquaculture land, tidal flat, unused land, and sea area). Then, these landscape types were modified and verified by using eCognition Developer 8.7 (Trimble, Sunnyvale, CA, USA) and ArcGIS 10.0 software (ESRI, Redlands, CA, USA) [43], and the landscape-type maps of years 1990, 2000, and 2010 (in vector format) were created. In this study, the eight landscape types in different periods were treated as the coastal zone ecological risk receptors and the ecological risk indexes were constructed for them as well. The coastal ecological risk spatial distribution maps were compiled by using Geostatistical Analyst Tools in ArcGIS [42]. Finally, with these available spatial data sets and spatial analysis tools and techniques, characteristics of landscape ecological risk pattern evolution of the coastal zones in Zhejiang province were investigated.
2.3. Dividing Ecological Risk Subarea
By referring to the method by Zeng et al. [44,45] and considering the spatial heterogeneity of the study area and patch size for spatializing the ecological risk index, the coastal zones were divided into subareas at an 11.35 km × 11.35 km cell size by using equidistance sampling method. As a result, there were about 155 grid cells (risk subareas) included in the study area (Figure 2). On the basis of these subareas, integrated ecological risk indexes for each grid were first constructed, then these risk indexes were identified as the centroid value of each specific ecological risk subarea grid.
2.4. Constructing Ecological Risk Indexes
Accounting to previous studies associated with basin, landscape and wetland ecological risk assessments [46,47], it is suggested that the analysis of coastal landscape risk pattern evolution caused by human activities would be functional expressions of coastal landscape ecological vulnerability and the degree of risk receptor responding to a risk source (such as anthropogenic impacts on landscape exploitation). By referring to previous studies [42,45] and considering characteristics of the study area and impacts of human activities on coastal landscapes, a landscape disturbance index, a fragility index, and a loss degree index were selected in order to finally build an integrated index that may be used for assessing coastal landscape ecological risk pattern evolution (Table 1). In Table 1, definitions and expressions of landscape ecological risk assessment indices were summarized.
2.5. Spatial Analysis Method
The ecological risk index, as a spatial variable, has characteristics of structure and heterogeneity in spatial change. Geostatistics Analyst Tools can be used to test, simulate and assess the spatial correlation and distribution patterns of various spatial variables. Thus, in practice, the semi-variance analysis method is frequently adopted to investigate regional ecological risk. In this study, different models of semi-variance function were used to optimally fit the sampling point data, and spatial analysis of the regional ecological risk was conducted by using Kriging interpolation. The semi-variance formula is given as:
where, Y(h) is the semi-variance function; h is the step length (i.e., interval distance); N(h) is the number of samples within the interval distance h; Z(xi) and Z(xi + h) are the observed value of ecological risk index at the spatial location of xi and xi + h, respectively [51]. In this study, the semi-variogram was first created, then it was fitted with an optimal model, and finally a spatial distribution map of ecological risk index was created by summating, sampling and ordinary Kriging interpolating, etc. using functions of spatial analysis and Geostatistics Analyst Tools of ArcGIS 10.0 [42].
3. Results and Analyses
3.1. Evolution Characteristics of Landscape Types
The numbers of patches and areas of all landscape types in years 1990, 2000 and 2010 were calculated by using ArcGIS10.0 and Fragstats3.4 software [42]. Referring to the formulas in Table 1, landscape pattern indexes of all landscape types in the study area for the three years were calculated and summarized in Table 2.
The results in Figure 3 show that the landscape structure and proportion of areas in coastal zones in Zhejiang province changed significantly during the period of 1990–2010. The landscape types of cropland, sea area, woodland, and water area decreased constantly, while the areas of built-up land, unused land and aquaculture land showed increasing trends in the study periods. During the 20 years, the first area (type) decreasing is the sea area (by 767.61 km2) compared to all other landscape types. This is because more and more sea area would be accelerated to transfer into various artificial landscapes. The next landscape type decreasing is the cropland (by 632.39 km2). The cropland annually reduced by 31.62 km2 in 1990–2010, and the area reduction rate in 2000–2010 was six times of the rate in 1990–2000, which appeared an accelerating reduction trend. The increase of built-up land area was the greatest among all landscape types, which annually increased by 58.80 km2. In addition, from 1990 to 2010, the aquaculture land area also increased by 5.2% (annually increased by 4.24 km2), and the area increasing rate in 2000–2010 was nearly 2.5 times of that in previous decade.
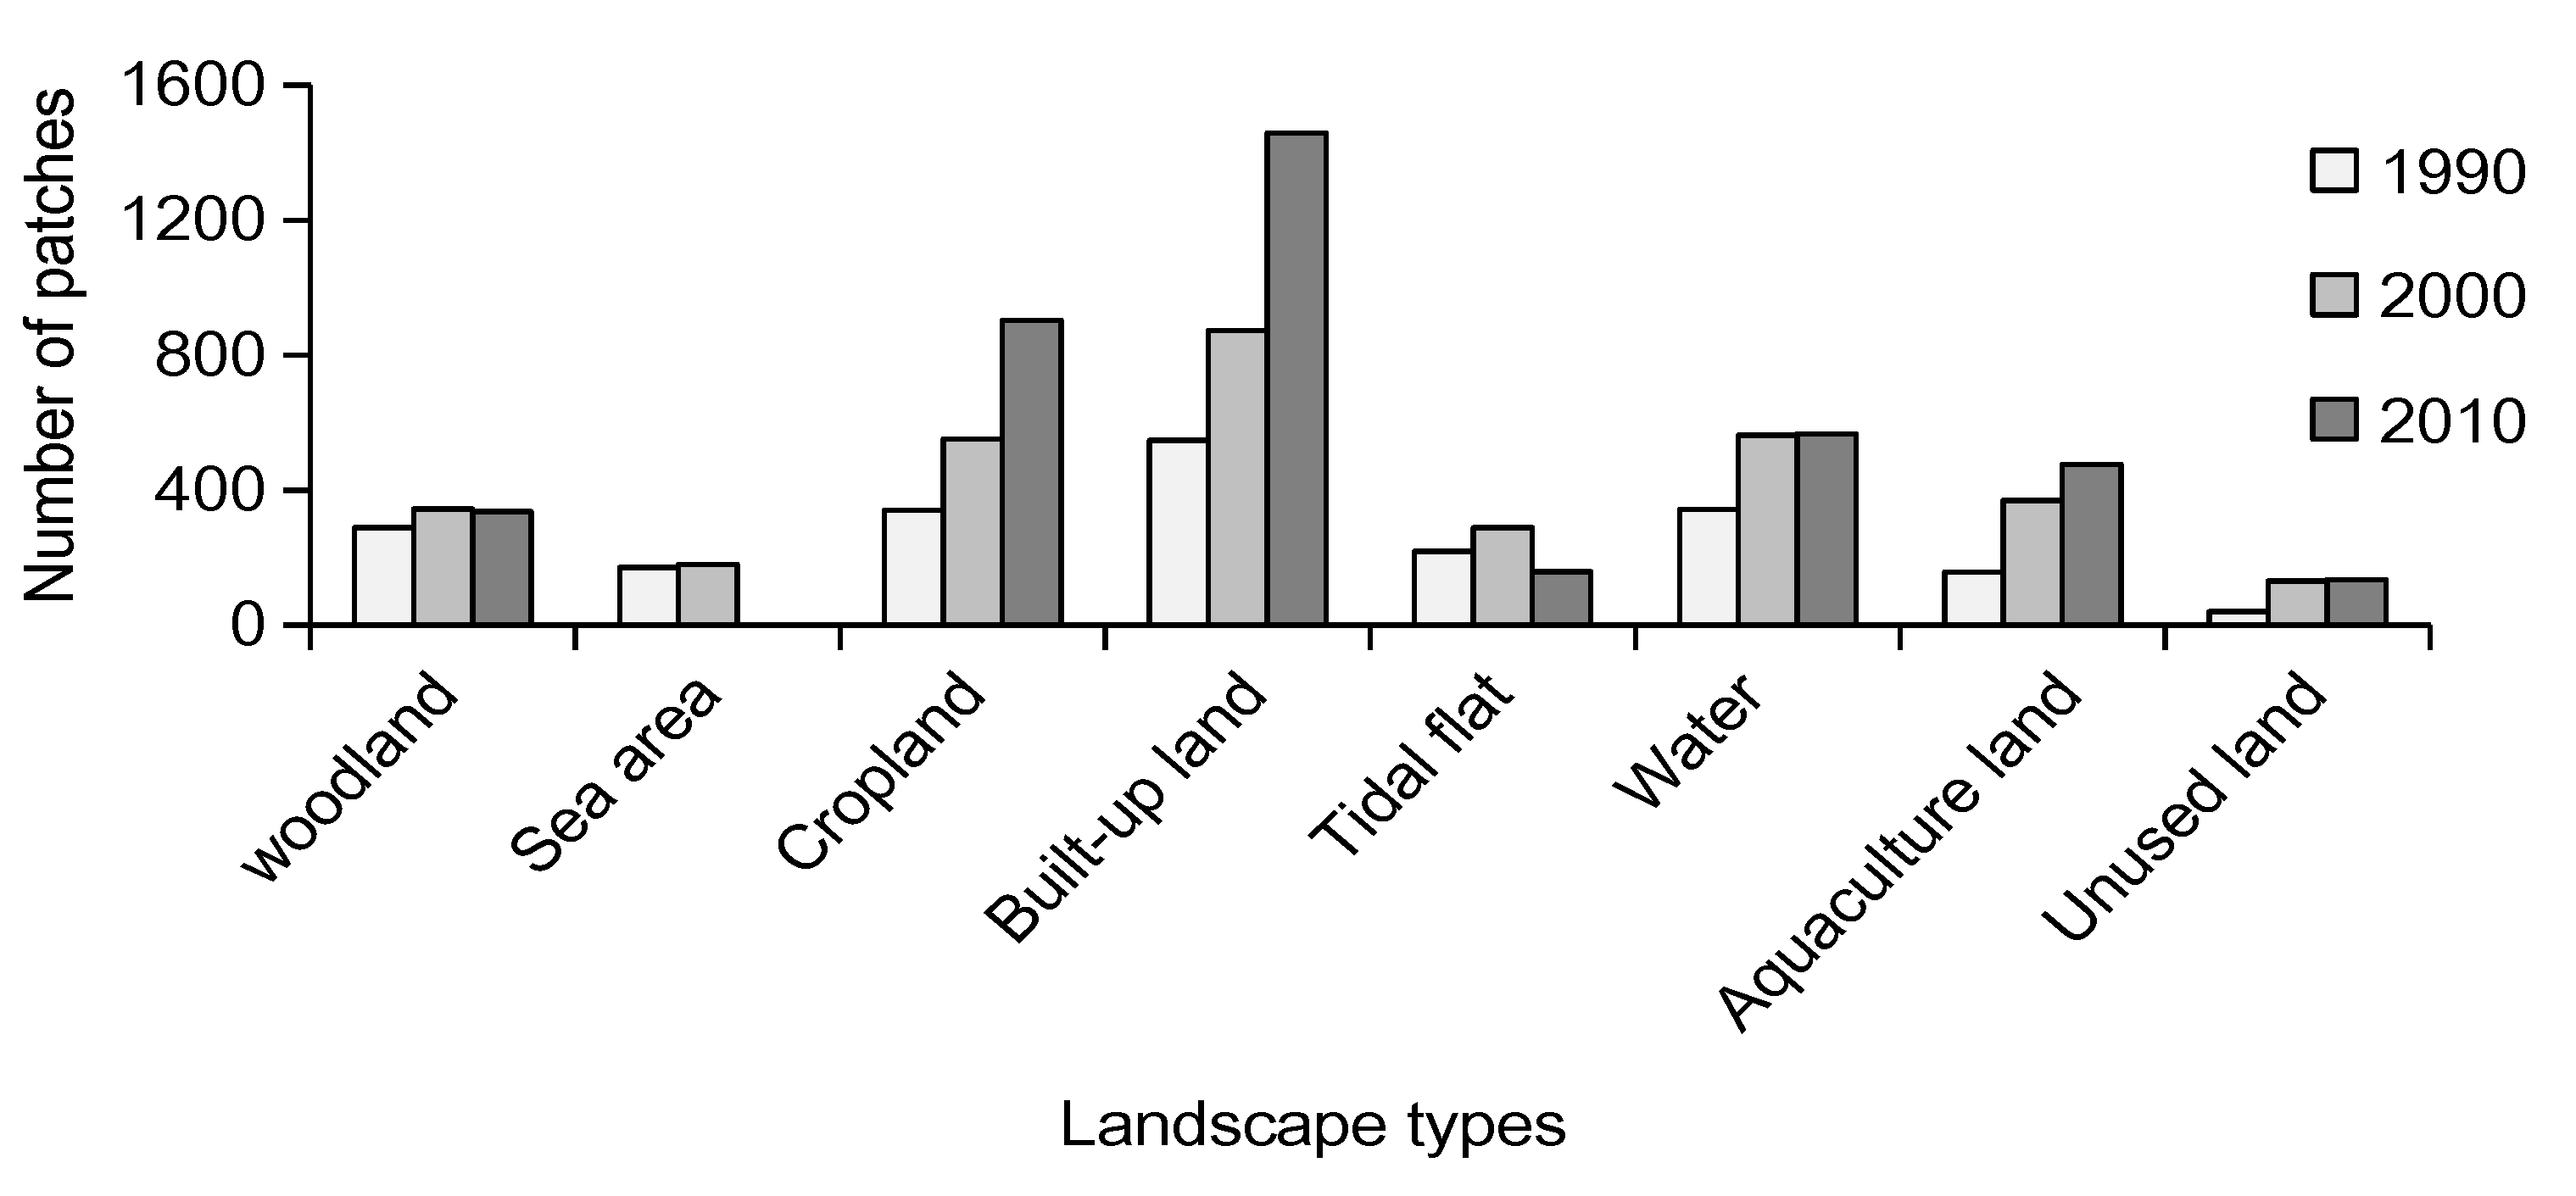
The numbers of patches of all landscape types increased significantly during the period of 1990–2010 (Figure 4). There were about 2108 patches in 1990. However, the number increased to 4035 patches in 2010 (increased by approximately 91% compared to that in 1990). The number of patches of built-up land significantly increased (548 patches in 1990 and 1459 patches in 2010, increased by 1.6 times). Meanwhile, the landscape indexes of various landscape types were also significantly altered during the observed 20 years (Table 2). The landscape fragmentation index and the isolation index of woodland, sea area, crop land and water area increased significantly. These results indicate: (1) The geographical distribution of the four landscape types tended to be scattered; (2) the random decentralization continued to be intensified; and (3) the landscape dominance gradually weakened. Thus, their landscape dominant index constantly decreased. With a rapid pace of industrialization and urbanization, the area of built-up land continued to increase, and thus the landscape isolation index decreased, but its landscape dominant index increased. The landscape of built-up land tended to concentrate on a certain geographical distribution. In general, the coastal ecological risk probability showed an increasing trend in the study area, which could be because the area of natural landscape decreased, while the area of artificial landscapes continuously increased.
3.2. Spatiotemporal Differences of Landscape Ecological Risk Patterns
The ecological risk index for the 155 landscape risk subareas (grids) in the years 1990, 2000, and 2010 in the study area was calculated based on the landscape indexes in Table 2 and using the formulas of ecological risk index (ERIi). By optimally fitting the theoretical models of semi-variance analysis, the results show that the spherical model was better for years 1990 and 2010 while the Gaussian model was better for the year 2000. On the basis of these models, the Kriging interpolation method was then used to interpolate the ecological risk index (ERIi) for the years 1990, 2000, and 2010 using Geostatistical Analyst Tools in ArcGIS 10.0 software [42]. To conveniently analyze evaluation characteristics of coastal ecological risk index during the two different periods in the study area, the ecological risk index values of subareas were divided into five grades by using natural break point and a relative index method (at an interval of 0.016). If ERIi < 0.031, then the ecological risk grade is extremely low. If 0.031 ≤ ERIi < 0.047, then the ecological risk grade is low. If 0.047 ≤ ERIi < 0.063, then the ecological risk grade is medium. If 0.063 ≤ ERIi < 0.079, then the ecological risk grade is high. If ERIi ≥ 0.079, then the ecological risk grade is extremely high. Base on the detailed risk grade division standard, the coastal ecological risk grade maps covering the study area were generated (Figure 5), then a statistical analysis for different graded areas for the 155 ecological risk subareas in the study area was conducted (Figure 6).
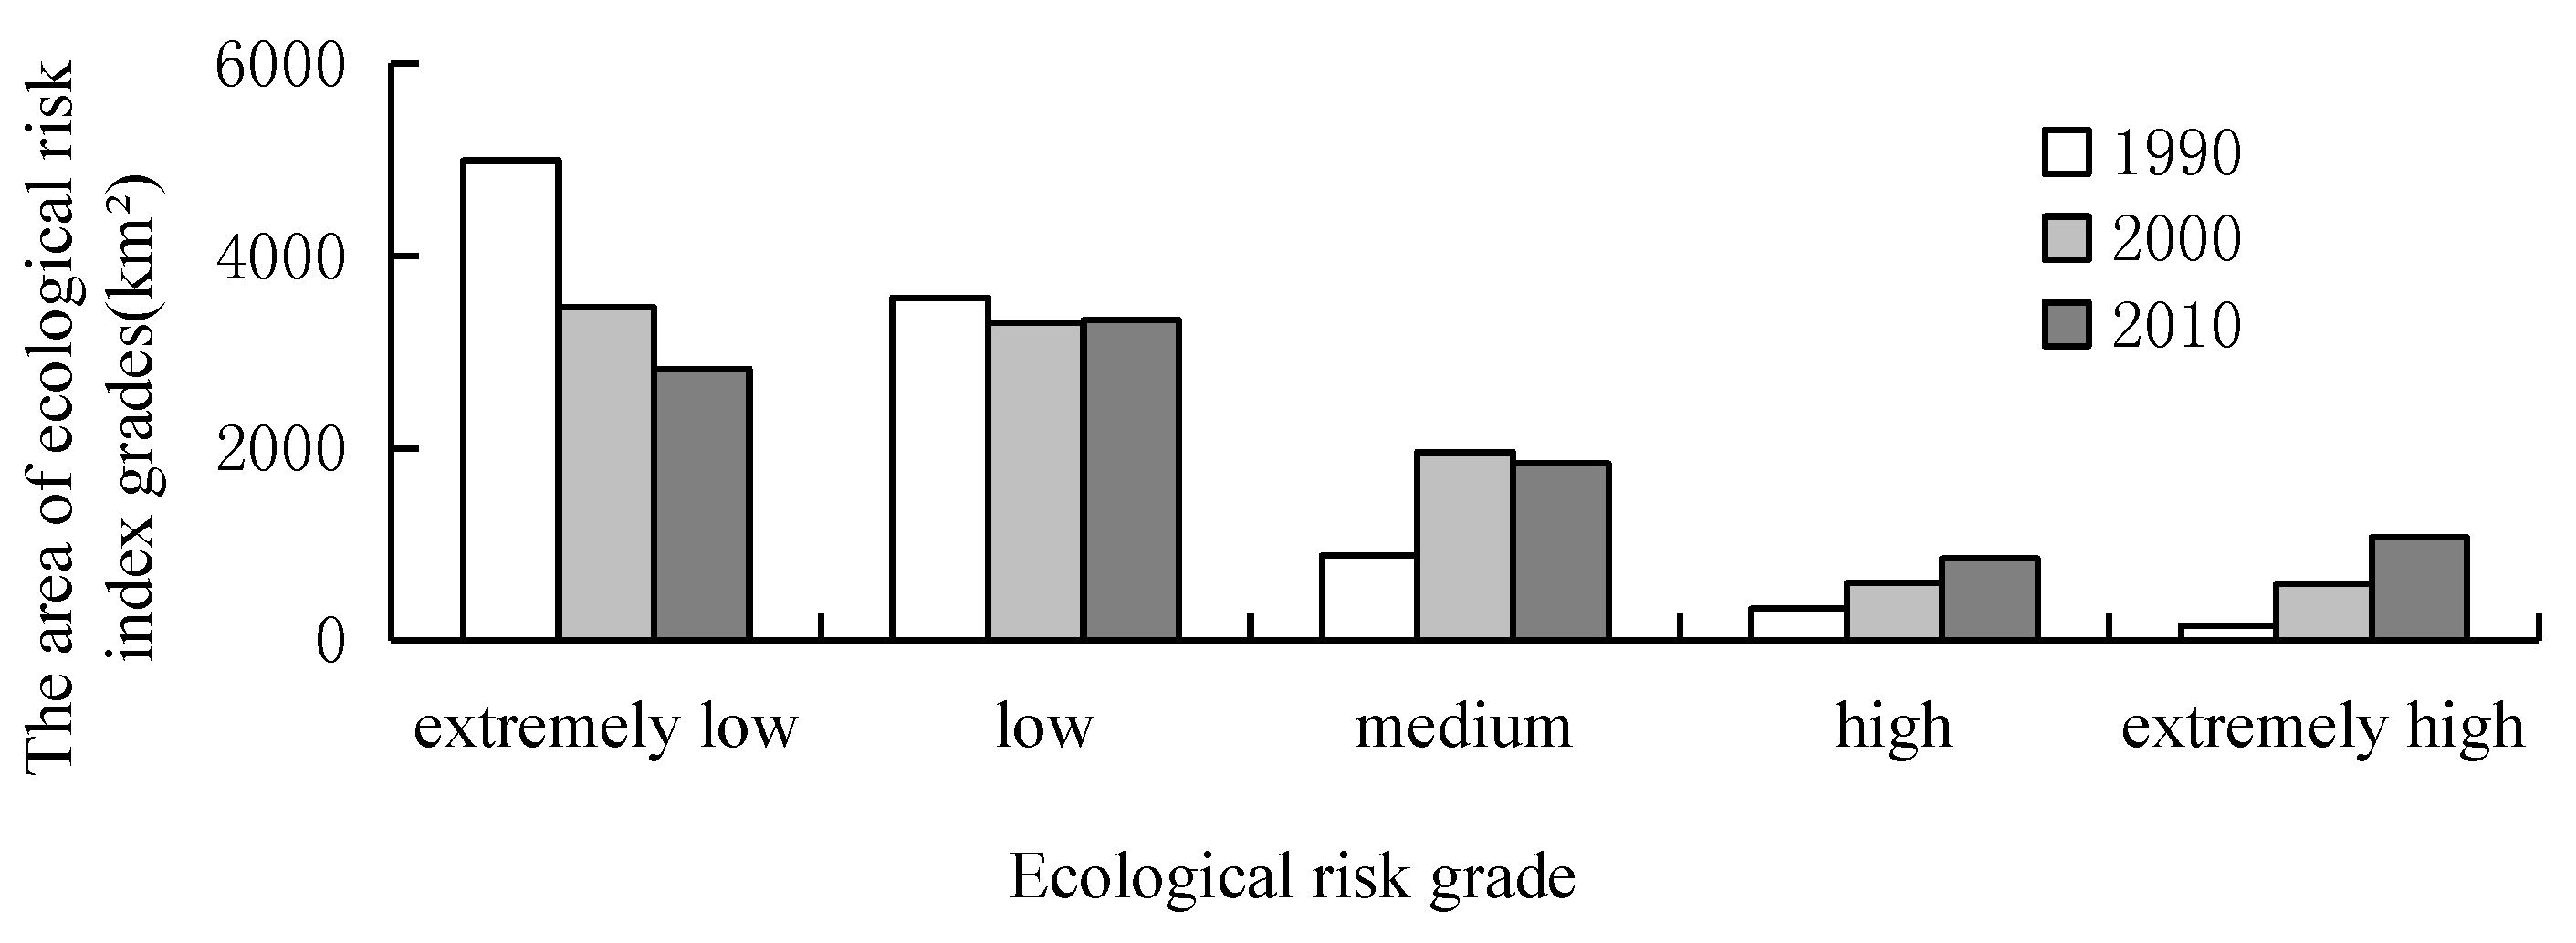
The results indicate that the distribution areas of extremely low and low ecological risk grades were 4991.08 km2 (50.30% of the study area) and 3565.92 km2 (35.94% of the study area) in 1990, respectively (Figure 5 and Figure 6). The extremely low ecological risk grade area mainly distributed in the midwest and southern study region, which include the Xiangshan county and Ninghai county of Ningbo city. The low ecological risk grade area mostly located in the eastern and northern coastal zone in Jiaxing city. Woodland and cropland were the dominant landscape types in year 1990, and the ecological risk level was relative low in these landscape regions. The medium ecological risk grade areas mainly distributed in the southern Hangzhou Bay and the Oujiang estuary coastal zones, which occupied 882.65 km2 (accounting for 8.90% of the total study area) in1990. The relevant landscape types were obviously characterized by plain terrains, well-developed society and economics, and high population densities. Urban, industrial and mining lands widely distributed in these regions, which showed a greater degree of patch isolation and fragmentation. The areas covered with high and extremely high ecological risk grades were relatively small and occupied 329.00 km2 (3.32% of total study area) and 153.77 km2 (1.55% of total study area), respectively. The ecological region mostly distributed in the estuary of Qiantang River with a large mass of reed wetlands and tidal flats with a higher landscape sensitivity and vulnerability distributing there and thus the region showed a relatively higher ecological risk grade.
Compared to 1990, the spatial distributions of ecological risk grades changed significantly in 2000. The extremely low ecological risk grade area decreased by 1522.72 km2. Meanwhile, the low ecological risk area decreased slightly from 35.94% to 33.33% of the total study area. With time going, in general, the low ecological risk areas shrank to landward and were occupied by the previous relatively lower ecological risk regions. These spatial distribution changes were obvious in the central coastal zone. As the development of urbanization and industrialization, human activities mainly focused on reclamations of mountains with gentle slope, woodlands in the piedmont region, and grasslands, and the previous woodland landscape was replaced by the cropland and built-up land which usually have had a higher ecological vulnerability index. The medium ecological risk area obviously increased from 882.65 km2 in 1990 to 1961.52 km2 in 2000, with a proportion increased by 11%. The spatial distribution of the medium ecological risk area has expanded to the southern Hangzhou Bay. The large amount of the medium ecological risk areas in 2000 occupied the previous relatively lower ecological risk areas in 1990, mostly close to the Linhai City and Yuhuan County. In addition, from 1990 to 2000, the extremely high and high ecological risk grade areas increased slightly from 3.32% to 5.99% and 1.55% to 5.95%, respectively, mostly occurring in the estuary of Qiantang River and Wenzhou city regions. In the southern bank of the Hangzhou Bay, the tidal flat landscape constantly silted, and large sea areas were occupied by tidal flat and aquaculture landscapes. Consequently, the fragmentation index increased while the dominance index decreased, and thus the corresponding ecological risk index increased. In the Oujiang estuary and Fieyun estuary coastal zones of Wenzhou city, the cropland reclaimed in plain terrain, and the area of built-up land continuously increased. Thus, in this region, the landscape was becoming more fragmented and isolated, which led to the ecological risk index increasing.
Compared to 2000, the extremely low ecological risk grade areas in 2010 in the study area decreased significantly from 34.95% to 28.47%, and the low ecological risk areas increased slightly (only 0.8% of total study area). The extremely high and high ecological risk area proportions continuously expanded from 5.99% in 2000 to 8.60% in 2010 and 5.95% in 2000 to 10.79% in 2010, and the areas increased by 258.93 km2 and 480.02 km2, respectively. The spatial distributions of ecological risk areas significantly changed in the southern Hangzhou Bay, the Sanmen Bay, and the eastern coastal plain terrain regions from Linhai to Wenling City. All the three coastal zones were characterized by intertidal mudflat, vast sea area and marine fishery resources. With the continuous development of the society and marine economy, more and more muddy coasts and croplands were converted into ponds, which were used for aquaculture industry. To 2011, the mariculture area in Zhejiang province has already reached to 908.39 km2. In addition, the medium ecological risk grade area in 2010 reduced slightly compared to 2000.
3.3. The Ecological Risk Grade Shifting Analysis
In the study periods, the areas of various landscape ecological risk grades frequently changed. If using traditional area statistics, shifting areas of different ecological risks were not efficiently identified. Thus, an ecological risk transfer matrix was employed to analyze changes of different ecological risk areas. With a spatial overlay analysis method, the spatial distribution maps of ecological risk grade for years 1991, 2000, and 2010 were first overlaid, and then the direction and area changes of the ecological risk grade shifting were quantitatively analyzed for the three time periods (1990–2000, 2000–2010, and 1990–2010) (Table 3, Table 4 and Table 5).
The results in Table 5 show that the total area transferred from low to high ecological risk level was 5176.41 km2 (summing all numbers in upper triangular elements in Table 5; it was 52.17% of the study area) during the period of 1990–2010 in the study area, but the total area transferred from high to low ecological risk level was only 2.50% in area (summation of all numbers in lower triangular elements in Table 5). The shifting area from extremely low to low ecological risk level was 1855.91 km2 and held the biggest change in the transfer matrix (Table 5). These conversions mostly occurred in the interlaced zones of piedmont regions and coastal plains. The woodlands of higher ecological risk were shifted into croplands and built-up lands continuously in pace with the exploitation of gentle slope area. In addition, the total area transferred from low to medium ecological risk grade was 1255.42 km2, and these conversions mainly concentrated on the plain and offshore areas in the study area. Along with the development of urbanization and industrialization, human activities and unreasonable exploitation and utilization of land resources obviously influenced the nature during the past 20 years in the coastal zones in Zhejiang province. Consequently, the coastal ecological risk levels showed a rising trend generally, even though it declined in some areas.
The results in Table 3 suggest that a total of 4263.18 km2 (43% of the study area) of lands was converted into higher ecological risk levels during the period of 1990–2000, while the shifted areas changed to 3184.91 km2 (32.1% of the study area, Table 4) during the second ten years. Such a lower rate of conversion during the period 2000–2010 compared to the previous ten years might be because people began to pay attention to the ecological environment protection while exploiting the coastal zones. The degraded areas of ecological risk levels were 48.02 km2 during the 1990–2000, whereas 1518.82 km2 during the period of 2000–2010, respectively. In the previous ten years, the major shifted areas from low to medium ecological risk and extremely low to low ecological risk were 1660.91 km2 and 1564.95 km2, respectively (Table 3). These conversions mostly located in the piedmont regions and coastal plains. However, in the second ten years (Table 4), most of the extremely low ecological risk area shifted into low ecological risk area (1163.85 km2), and the transfer greatly occurred in Xiangshan Bay and the piedmont plains from Ningbo to Taizhou city.
The results in Table 6 present that annual transition rates of different ecological risk grades were different between the first ten-year period and the second ten-year period. The transition types (directions) with ecological risk grades transferred from high or higher to low or lower included low to extremely low ecological risk grade, medium to extremely low and low ecological risk grades, high to extremely low and low and medium ecological risk grades, extremely high to medium and high ecological risk grades, etc. Moreover, such transitions had an accelerated trend for the second ten years compared to the first ten years although both periods all showed an increasing trend. Meanwhile, the transition types with greater annual transition rates of ecological risk grades transferred from low or lower to high or higher were associated with extremely low to low, medium and high ecological risk grades, low to medium and high and extremely high grades, medium to high and extremely high grades, and high to extremely high ecological risk grade, etc.
4. Discussion
During the period of 1990–2010, landscape ecological risk grades generally increased. Because of a lack of suitable overall development planning and coordinated arrangements, many aquaculture ponds were scattered in cropland and sea landscapes. These small-scale ponds occupied many areas of the landscapes with poorer economic efficiency, which also led to increasing ecological vulnerability, fragmentation and isolation in this region. Thus, under the process of urbanization, the interests of both ecosystem and economic development should be comprehensively considered, efficiently conducting industrial and agricultural productions with organized, planned and suitable guidelines, and finally realizing the coordinated development of economic growth and ecological environment protection.
The significant ecological risk grade shifting occurred among the different risk grades during the two study periods. This could be due to the accelerated socio-economic development, industrial structure adjustment, and transition of various landscape types in the region where the ecological risk areas significantly changed during the study periods. With the rapid development of economy in Zhejiang province, urban build-up lands continuously expanded and apparently occupied the large amount of woodlands and croplands. Moreover, the port terminal, highway and high-speed railway infrastructure construction have also occupied more lands. The rapid urbanization has promoted the processes of built-up land expansion into croplands, and more and more farming workers migrated into cities, which resulted in serious housing problems. Meanwhile, people conducted the land reclamation at an expense of deforestation in the piedmont regions far away from coastlines, planted crops and fruit trees to ease the conflict between the rapid cropland reduction and population increment. Consequently, the ecological risk grades of different landscapes significantly changed during the 20 years.
Although such transition rates of ecological risk grades transferred from low to high for the two ten-year periods show increasing trends, compared to the first ten years for some important transition types, the coastal ecological risk situation during the second ten years was apparently improved (Table 6). This might be because local governments had started to consider ecological environment protection and taken some efficient policy to make the paces of deterioration slowed down during the second ten years. Therefore, this suggests that while people originally were urgent to accelerate coastal landscape exploitation and development, they currently began to concern the ecological environment protection, and to pursue a mode that economic exploitation and ecological protection may be harmoniously conducted.
Overall, human activities have significantly impacted the landscape structure during the period of 1990–2010. The transfers of landscape types and boundaries between them became more and more complicated, and the conversions of ecological risk grades became more frequent than before. This conclusion is generally consistent with the evolution characteristics of landscape structure and risk patterns caused by the change of a large amount of land use and land cover under the speedy urbanization and city expansion in other many developing countries [52].However, given the double characteristic of land and ocean possessed by the coastal zones in Zhejiang province, compared to an inner land region, the influence factors driving the evolution of landscape patterns are more diverse, and the evolution mechanism is more complicated.
A coastal zone as a transitional zone between land and ocean is always considered an area that has a greater protective function than that of production [53]. Thus, in the process of Zhejiang coastal zone exploitation the governments should gradually increase the productive function of coastal areas, pay attention to the effects of the port industry, city construction, agricultural exploitation and the development and consolidation of land reserve resources on coastal ecological environment, and strengthen coastal land use planning. The governments should also evaluate coupling relationships between natural resources and ecological environment and socioeconomic development issues, formulate appropriate planning for regional development, optimize the industrial structure, and introduce high-tech industries to adjust the current ecological economic development mode that over-relied on natural resources. The coastal zone is an important natural protection zone and wetland ecological concentration area. Thus, the governments should strictly control the scale of construction land, such as ports. The buffer zone must retain in a certain range to protect the ecological environment [54,55] and to implement the ecological compensation system effectively. As for the situation of small forestland scale in the study area, the governments should strengthen the construction of coastal ecological forest. Coastal (beach) resources should be rationally exploited by controlling their own breeding pollution, improving the water quality of aquaculture area, strengthening the monitoring of the marine environment quality of key aquaculture areas and strictly controlling the destruction of coastal shelterbelt behavior that is for the development of aquaculture. Through these measures above, we can ensure the ecological construction and economic development together in the study area to finally achieve a sustainable development of the ecological fragile areas.
The methods, developed in this study, used for assessing landscape ecological risk may be applied to other coastal zones after considering several issues discussed as follows. First of all, landscape ecological risk assessment based on spatial pattern is more concerned with the influence of the number, function and combination of landscape elements on ecological risk. It brings the landscape ecology into a study as the core of evaluation rather than an auxiliary, so that it is suitable for all types of risk integrative assessment, but not for those that emphasize a specific process. The source-sink landscape model that seeks a quantitative expression of the coupling of landscape pattern and ecological process is an integrated way to integrate patterns and process. According to the specific risk of stress and the role of the object, clearing source-sink landscape types and risk process can effectively avoid drawbacks of the landscape ecological risk assessment method that only relies on landscape pattern index. Therefore, the risk assessment based on the source-sink landscape model is an important trend of landscape ecological risk assessment model in the future.
As for the evaluation unit, the risk cell (grid) is used as the evaluation unit, and the results are interpolated as the continuous risk spatial distribution value in a study area. However, using the risk cell as the evaluation unit is not fully considered as the spatial heterogeneity. To some extent, it separates the original surface physical geography links, which may interfere with the overall grasp of a landscape pattern and comprehensive analysis. Therefore, a study of landscape risk assessment should begin to pay more attention to expression of the geographical significance of the evaluation unit, which needs further study.
As for the method of weight assignment, the method does not have a universality of the pros and cons itself, just needs to determine an appropriate weighting method based on substantial risk assessment objectives. The weight determination in this study was mostly based on the expert experience and judgment. Although this evaluation method is not objective enough, but generally it can basically work and reflect the difference of importance between different evaluation indices, and its applicability and practicality are stronger compared to the objective weighting method. However, the weight assignment process is still a difficult point in the landscape ecological risk assessment. This is because using an inappropriate method may directly affect the distribution characteristics of the evaluation results and significantly increase the uncertainty of the evaluation results.
Finally, a landscape ecological risk assessment is a process of judgment based on experience, in which there are inevitably incomplete data or random interfences and other uncertainties. Because this study was not able to establish a direct relationship between the landscape structure and the type of ecological problems in specific areas, the ecological risk index constructed in this study was just considered as a comprehensive probability measure of the possibility of ecological problems occurring without considering other factors, such as the social, economic and ecological environment. Thus, the results have a certain degree of uncertainty. A landscape ecological risk assessment at this stage seldom brings uncertainty evaluation into risk assessment, which makes the reliability of assessment results more difficult to grasp. Therefore, in the future study of landscape ecological risk assessment, an analyst must pay more attention to the evaluation of the uncertainty of the assessment results in order to ensure the validity and reliability of the landscape ecological risk assessment results.
5. Conclusions
In this study, with the multitemporal Landsat TM data acquired in the years 1990, 2000 and 2010, the evolution characteristics of landscape ecological risk patterns of the coastal zones in Zhejiang province, China were mapped and analyzed. The main conclusions were derived from this study as follows:
During the study periods, the landscape structures were significantly altered. The landscape areas of cropland, sea area, woodland and water surface decreased, while the areas of built-up land, unused land and aquaculture land constantly increased. The landscape fragmentation index and the isolation index of woodland, sea area, cropland and water significantly increased. The ecological dominant index decreased and the landscape dominance gradually weakened.
During the past 20 years, temporal evolutions of ecological risk grades occurred significantly. The spatial distributions of extremely low and low ecological risk grades occupied majority of the coastal zones in Zhejiang province, and they were 50.30% and 35.94% of the study area in 1990, respectively. By 2000, the extremely low and low ecological risk areas decreased differentially, while the medium ecological risk area significantly increased. Until 2010, the extremely low ecological risk area further reduced, while the extremely high and high ecological risk areas increased apparently.
Moreover, the spatial distributions of ecological risk patterns also changed significantly during the period of 1990–2010. The extremely low and low ecological risk grade areas showed distinctly decreasing and landward shifting trends in the period. The extremely high and high ecological risk areas expanded in the coastal region continuously, occupied areas where relatively lower ecological risk grades originally located. By 2010, the extremely high and high ecological risk areas were concentrated in the muddy coasts, and during the 20 years, their areas increased by 524.75 km2 and 916.72 km2, respectively. Therefore, all those demonstrate that people had been intensifying their impacts on coastal resources, especially coastline resources.
There were only about 12 coastal zone ecological risk conversions occurring from 1990 to 2000, but 22 conversions occurred from 2000 to 2010. During the past 20 years, the total area transferred from a relatively lower ecological risk grade to a relatively high grade was 5176.41 km2 (52.17% of the study area), but the transferred from a relatively higher to low level was only247.75 km2 (only 2.50% of the study area). Such unequal transfers among different ecological risk grades were the major cause that produced substantial inner changes in ecological risk structural characteristics.
The rate of ecological risk rising during the second ten years was apparently lower than the first ten years. This indicates that people who originally hoped accelerate coastal landscape exploitation and development currently began to concern ecological environment protection and to pursue a mode that economic exploitation and ecological protection may be harmoniously conducted.
Acknowledgments
This research project was funded by Chinese National Science Foundation (No. U1609203, 41471004) and the K.C. Wong Magna Fund of Ningbo University.
Author Contributions
Jialin Li, Ruiliang Pu and Hongbo Gong designed the research and wrote the paper. Xu Luo, Mengyao Ye and Baixiang Feng analyzed the data.
Conflicts of Interest
The authors declare no conflict of interest.
References
- IOMC (Inter-Organizaition Programme for the Sound Management for Chemicals). IPCS Risk Assessment Terminology; World Health Organization (WHO): Geneva, Switzerland, 2004. [Google Scholar]
- Pollino, C.; Thomas, C.; Hart, B. Introduction to models and risk assessment. Hum. Ecol. Risk Assess. 2012, 18, 13–15. [Google Scholar] [CrossRef]
- Liu, X.; Su, W.; Wang, Z.; Huang, Y.; Deng, J. Regional ecological risk assessment of land use in the flooding zone of the three gorges reservoir area based on relative risk model. Acta Sci. Circumst. 2012, 32, 248–256. [Google Scholar]
- Xu, X.; Lin, H.; Fu, Z. Regional ecological risk assessment of wetland in the Huanghe River delta. Acta Sci. Nat. Univ. Pekin. 2001, 37, 111–120. [Google Scholar]
- Markus, J.; Mc Bratney, A.B. A review of the contamination of soil with lead II, Spatial distribution and risk assessment of soil lead. Environ. Int. 2001, 27, 399–411. [Google Scholar] [CrossRef]
- Riviere, J.L. Ecological Risk Evaluation of Polluted Soils; The Chemical Rubber Company Press: Boca Raton, FL, USA, 2006. [Google Scholar]
- Environmental Protection Agency (EPA). Guidelines for Ecological Risk Assessment; Office of Water: Washington, DC, USA, 1998.
- Cook, R.B.; Suter, G.W.; Sain, E.R. Ecological risk assessment in a large river reservoir: 1. Introduction and background. Environ. Toxicol. Chem. 1999, 18, 581–588. [Google Scholar]
- Cormier, S.M.; Smith, M.; Norton, S.; Neiheisel, T. Assessing ecological risk in watersheds: A case study of problem formulation in the Big Darby Creek watershed, Ohio, USA. Environ. Toxicol. Chem. 2000, 19, 1082–1096. [Google Scholar] [CrossRef]
- Salihoglu, G.; Karaer, F. Ecological risk assessment and problem formulation for Lake Uluabat, a Ramsar state in Turkey. Environ. Manag. 2004, 33, 899–910. [Google Scholar] [CrossRef]
- Jiang, Q.; Deng, X.; Zhan, J.; Yan, H. Impacts of economic development on ecosystem risk in the Yellow River Delta. Procedia Environ. Sci. 2011, 5, 208–218. [Google Scholar] [CrossRef]
- Xu, X.G.; Lin, H.P.; Fu, Z.Y. Probe into the method of regional ecological risk assessment—A casestudy of wetland in the Yellow River Delta in China. J. Environ. Manag. 2004, 70, 253–262. [Google Scholar] [CrossRef] [PubMed]
- Hayes, E.H.; Landis, W.G. Regional ecological risk assessment of a near shore marine environment: Cherry Point, WA. Hum. Ecol. Risk Assess. 2004, 10, 299–325. [Google Scholar] [CrossRef]
- Obery, A.M.; Landis, W.G. A regional multiple stressor risk assessment of the Codorus Creek watershed applying the relative risk model. Hum. Ecol. Risk Assess. 2002, 8, 405–428. [Google Scholar] [CrossRef]
- Bhagyanagar, R.; Kawal, B.M.; Dwarakish, G.S.; Surathkal, S. Land use/land cover change and urban expansion during 1983–2008 in the coastal area of Dakshina Kannada district, South India. J. Appl. Remote Sens. 2012, 6, 1–17. [Google Scholar] [CrossRef]
- Li, D.Q.; Zhang, C.; Pizzol, L.; Critto, A.; Zhang, H.B.; Lv, S.H.; Marcomini, A. Regional risk assessment approaches to land planning for industrial polluted areas in China: The Hulunbeier region case study. Environ. Int. 2014, 65, 16–32. [Google Scholar] [CrossRef] [PubMed]
- Merlotto, A.; Piccolo, M.C.; Bertola, G.R. Urban growth and land use/cover change at Necochea and Quequen cities, Buenos Aires province, Argentina. Revista de Geografia Norte Grande 2012, 53, 159–176. [Google Scholar] [CrossRef]
- Walker, R.; Landis, W.; Brown, P. Developing a regional ecological risk assessment: A case study of a tasmanian agricultural catchment. Hum. Ecol. Risk Assess. 2001, 7, 412–439. [Google Scholar] [CrossRef]
- Bartolo, R.E.; van Dam, R.A.; Bayliss, P. Regional ecological risk assessment for Australia’s Tropical rivers: Application of the relative risk model. Hum. Ecol. Risk Assess. 2012, 18, 16–46. [Google Scholar] [CrossRef]
- Colnar, A.M.; Landis, W.G. Conceptual model development for invasive species and a regional risk assessment case study: The European green crab, Carcinus maenas, at cherry point, Washington, USA. Hum. Ecol. Risk Assess. 2007, 13, 120–155. [Google Scholar] [CrossRef]
- Zhang, S.; Zhang, L.; Zhang, Y. Ecological risk assessment of the Yulin coal mining area based on the petarmethod. Resour. Sci. 2011, 33, 1914–1923. [Google Scholar]
- Suter, G.W. Endpoints for regional ecological risk assessments. Environ. Manag. 1990, 14, 9–23. [Google Scholar] [CrossRef]
- Turner, M.G. Landscape Ecology in Theory and Practice: Pattern and Process; Springer: Berlin, Germany, 2001. [Google Scholar]
- Wu, L.Y. The Study of Regional Landscape Ecological Risk Assessment and the Environmental Risk Management Countermeasure: Take Dongshan Island for Example; Fujian Normal University: Fuzhou, China, 2004. [Google Scholar]
- Peng, J.; Wang, Y.L.; Wu, J.S.; Zhang, Y.S. Evaluation for regional ecosystem health: Methodology and research progress. Acta Ecol. Sin. 2007, 27, 4877–4885. [Google Scholar] [CrossRef]
- Liu, D.D.; Qu, R.J.; Zhao, C.H. Landscape ecological risk assessment in Yellow River Delta. J. Food Agric. Environ. 2012, 10, 970–972. [Google Scholar]
- Sachs, J.D.; Mellinger, A.D.; Gallup, J.L. The geography of poverty and wealth. Sci. Am. 2001, 284, 70–75. [Google Scholar] [CrossRef] [PubMed]
- Adger, W.N.; Hughes, T.P.; Folke, C.; Carpenter, S.R.; Rockstrom, J. Social-ecological resilience to coastal disasters. Science 2005, 309, 1036–1039. [Google Scholar] [CrossRef] [PubMed]
- Paula, D.P.; Dias, J.M.A.; Ferreira, O.; Morais, J.O. High-rise development of the sea-front at Fortaleza (Brazil): Perspectiveson its valuation and consequences. Ocean Coast. Manag. 2013, 77, 14–23. [Google Scholar] [CrossRef]
- Small, C.; Nicholls, R.J. A global analysis of human settlement in coastal zones. J. Coast. Res. 2003, 19, 584–599. [Google Scholar]
- Deng, J.S.; Wang, K.; Hong, Y.; Qi, J.G. Spatio-temporal dynamics and evolution of land use change and landscape pattern in response to rapid urbanization. Landsc. Urban Plan. 2009, 92, 187–198. [Google Scholar] [CrossRef]
- Wan, J.; Li, Z.; Lei, K. Dynamic analysis of the landscape spatial pattern in the coastal zone of the Bohai bay, 1954–2000. Res. Environ. Sci. 2009, 22, 77–82. [Google Scholar]
- Chen, Q.; Liu, J.; Ho, K.C. Development of a relative risk model for evaluating ecological risk of water environment in the Haihe River Basin estuary area. Sci. Total Environ. 2012, 420, 79–89. [Google Scholar] [CrossRef] [PubMed]
- Yu, W.W.; Zhang, L.P.; Ricci, P.F.; Chen, B.; Huang, H. Coastal ecological risk assessment in regional scale: Application of the relative risk model to Xiamen Bay China. Ocean Coast. Manag. 2015, 108, 131–139. [Google Scholar] [CrossRef]
- Zuo, L.; Xu, J.; Zhang, Z.; Wen, Q.; Liu, B.; Zhao, X.; Yi, L. Spatial-temporal land use change and landscape response in Bohai. J. Remote Sens. 2011, 15, 604–620. [Google Scholar]
- Jiang, W.; Sheng, S.; Zhu, X.; Zuo, W. Change and spatial pattern of flood disaster risk. Geogr. Res. 2008, 27, 502–508. [Google Scholar]
- Ramachandra, T.V.; Aithal, B.H.; Sanna, D.D. Insights to urban dynamics through landscape spatial pattern analysis. Int. J. Appl. Earth Obs. Geoinf. 2012, 18, 329–343. [Google Scholar]
- Dewan, A.M.; Yamaguchi, Y. Land use and land cover change in Greater Dhaka, Bangladesh: Using remote sensing to promote sustainable urbanization. Appl. Geogr. 2009, 29, 390–401. [Google Scholar] [CrossRef]
- Islam, M.A.; Mitra, D.; Dewan, A.; Akhter, S.H. Coastal multi-hazard vulnerability assessment along the Ganges deltaic coast of Bangladesh—A geospatial approach. Ocean Coast. Manag. 2016, 127, 1–15. [Google Scholar] [CrossRef]
- Xu, L.; Li, J.; Yang, L.; Yuan, Q.; Wang, M.; Chen, P. Integrated suitability evaluation on mainland coastline resources in Zhejiang Province. Chin. Land Sci. 2015, 29, 49–56. [Google Scholar]
- Li, X.; Li, J. Analysis on regional landscape ecological risk based on GIS—A case study along the lower reaches of the Weihe River. Arid Zone Res. 2008, 25, 899–903. [Google Scholar]
- Zhang, X.; Shi, P.; Luo, J.; Liu, H.; Wei, W. The ecological risk assessment of arid inland river basin at the landscape scale: A case study on Shiyang river basin. J. Nat. Resour. 2014, 29, 410–419. [Google Scholar]
- Liu, H.; Zhu, Q. Studies of methodologies and their development on land use/cover change detection by using high spatial resolution remote sensing data. Resour. Sci. 1999, 21, 23–27. [Google Scholar]
- Zeng, H.; Liu, G. Analysis of regional ecological risk based on landscape structure. Chin. Environ. Sci. 1999, 19, 454–457. [Google Scholar]
- Gao, B.; Li, X.; Li, Z.; Chen, W.; He, X.; Qi, S. Assessment of ecological risk of coastal economic developing zone in Jinzhou Bay based on landscape pattern. Acta Ecol. Sin. 2011, 31, 3441–3450. [Google Scholar]
- Fu, Z.; Xu, X.; Lin, H.; Wang, X. Regional ecological risk assessment of in the Liaohe river delta wetlands. Acta Ecol. Sin. 2001, 21, 365–373. [Google Scholar]
- Liu, S.; Yang, Z.; Cui, B.; Gan, S. Effects of road on landscape and its ecological risk assessment: A case study of Lancangjiang River valley. Chin. J. Ecol. 2005, 24, 897–901. [Google Scholar]
- Wang, J.; Zhao, G.; Du, C. Analysis on the regional ecological environment vulnerability based on the information of spatial structure of landscapes—A case study in Kenli country located in the Yellow River delta. Arid Zone Res. 2005, 22, 317–321. [Google Scholar]
- Xie, H. Regional eco-risk analysis of based on landscape structure and spatial statistics. Acta Ecol. Sin. 2008, 28, 5020–5026. [Google Scholar]
- Zhang, Y.; Lei, G.; Lin, J.; Zhang, H. Spatiotemporal change and its ecological risk of landscape pattern in different spatial scales in Zhalong Nature Reserve. Chin. J. Ecol. 2012, 31, 1250–1256. [Google Scholar]
- Wu, J.H. Landscape Ecology-Pattern, Process, Scale and Grade, 2nd ed.; Higher Education Press: Beijing, China, 2007. [Google Scholar]
- Dewan, A.M.; Yamaguchi, Y.; Rahman, M.Z. Dynamics of land use/cover changes and the analysis of landscape fragmentation in Dhaka Metropolitan, Bangladesh. GeoJournal 2012, 77, 315–330. [Google Scholar] [CrossRef]
- He, C.H.; Zhou, R.J. Spatial-temporal variation of land use based on landscape patterns in the coastal zone of Yancheng, Jiansu. Resour. Environ. Yangtze Basin 2016, 25, 1191–1199. [Google Scholar]
- Bateman, I.J.; Harwood, A.R.; Mace, G.M.; Watson, R.T.; Abson, D.J.; Andrews, B.; Binner, A.; Crowe, A.; Day, B.H.; Dugdale, S.; et al. Bringing ecosystem services into economic decision-making: Land use in the United Kingdom. Science 2013, 341, 45–51. [Google Scholar] [CrossRef] [PubMed]
- Fürst, C.; Helming, K.; Lorz, C.; Müller, F.; Verburg, P.H. Integrated land use and regional resource management: A cross disciplinary dialogue on future perspectives for a sustainable development of regional resources. J. Environ. Manag. 2013, 127, S1–S5. [Google Scholar] [CrossRef] [PubMed]
Figure 1.
The geographical location of the study area. The study area is shaded in gray in the right zoom-in map.
Figure 1.
The geographical location of the study area. The study area is shaded in gray in the right zoom-in map.

Figure 2.
A map of ecological risk subarea grids.
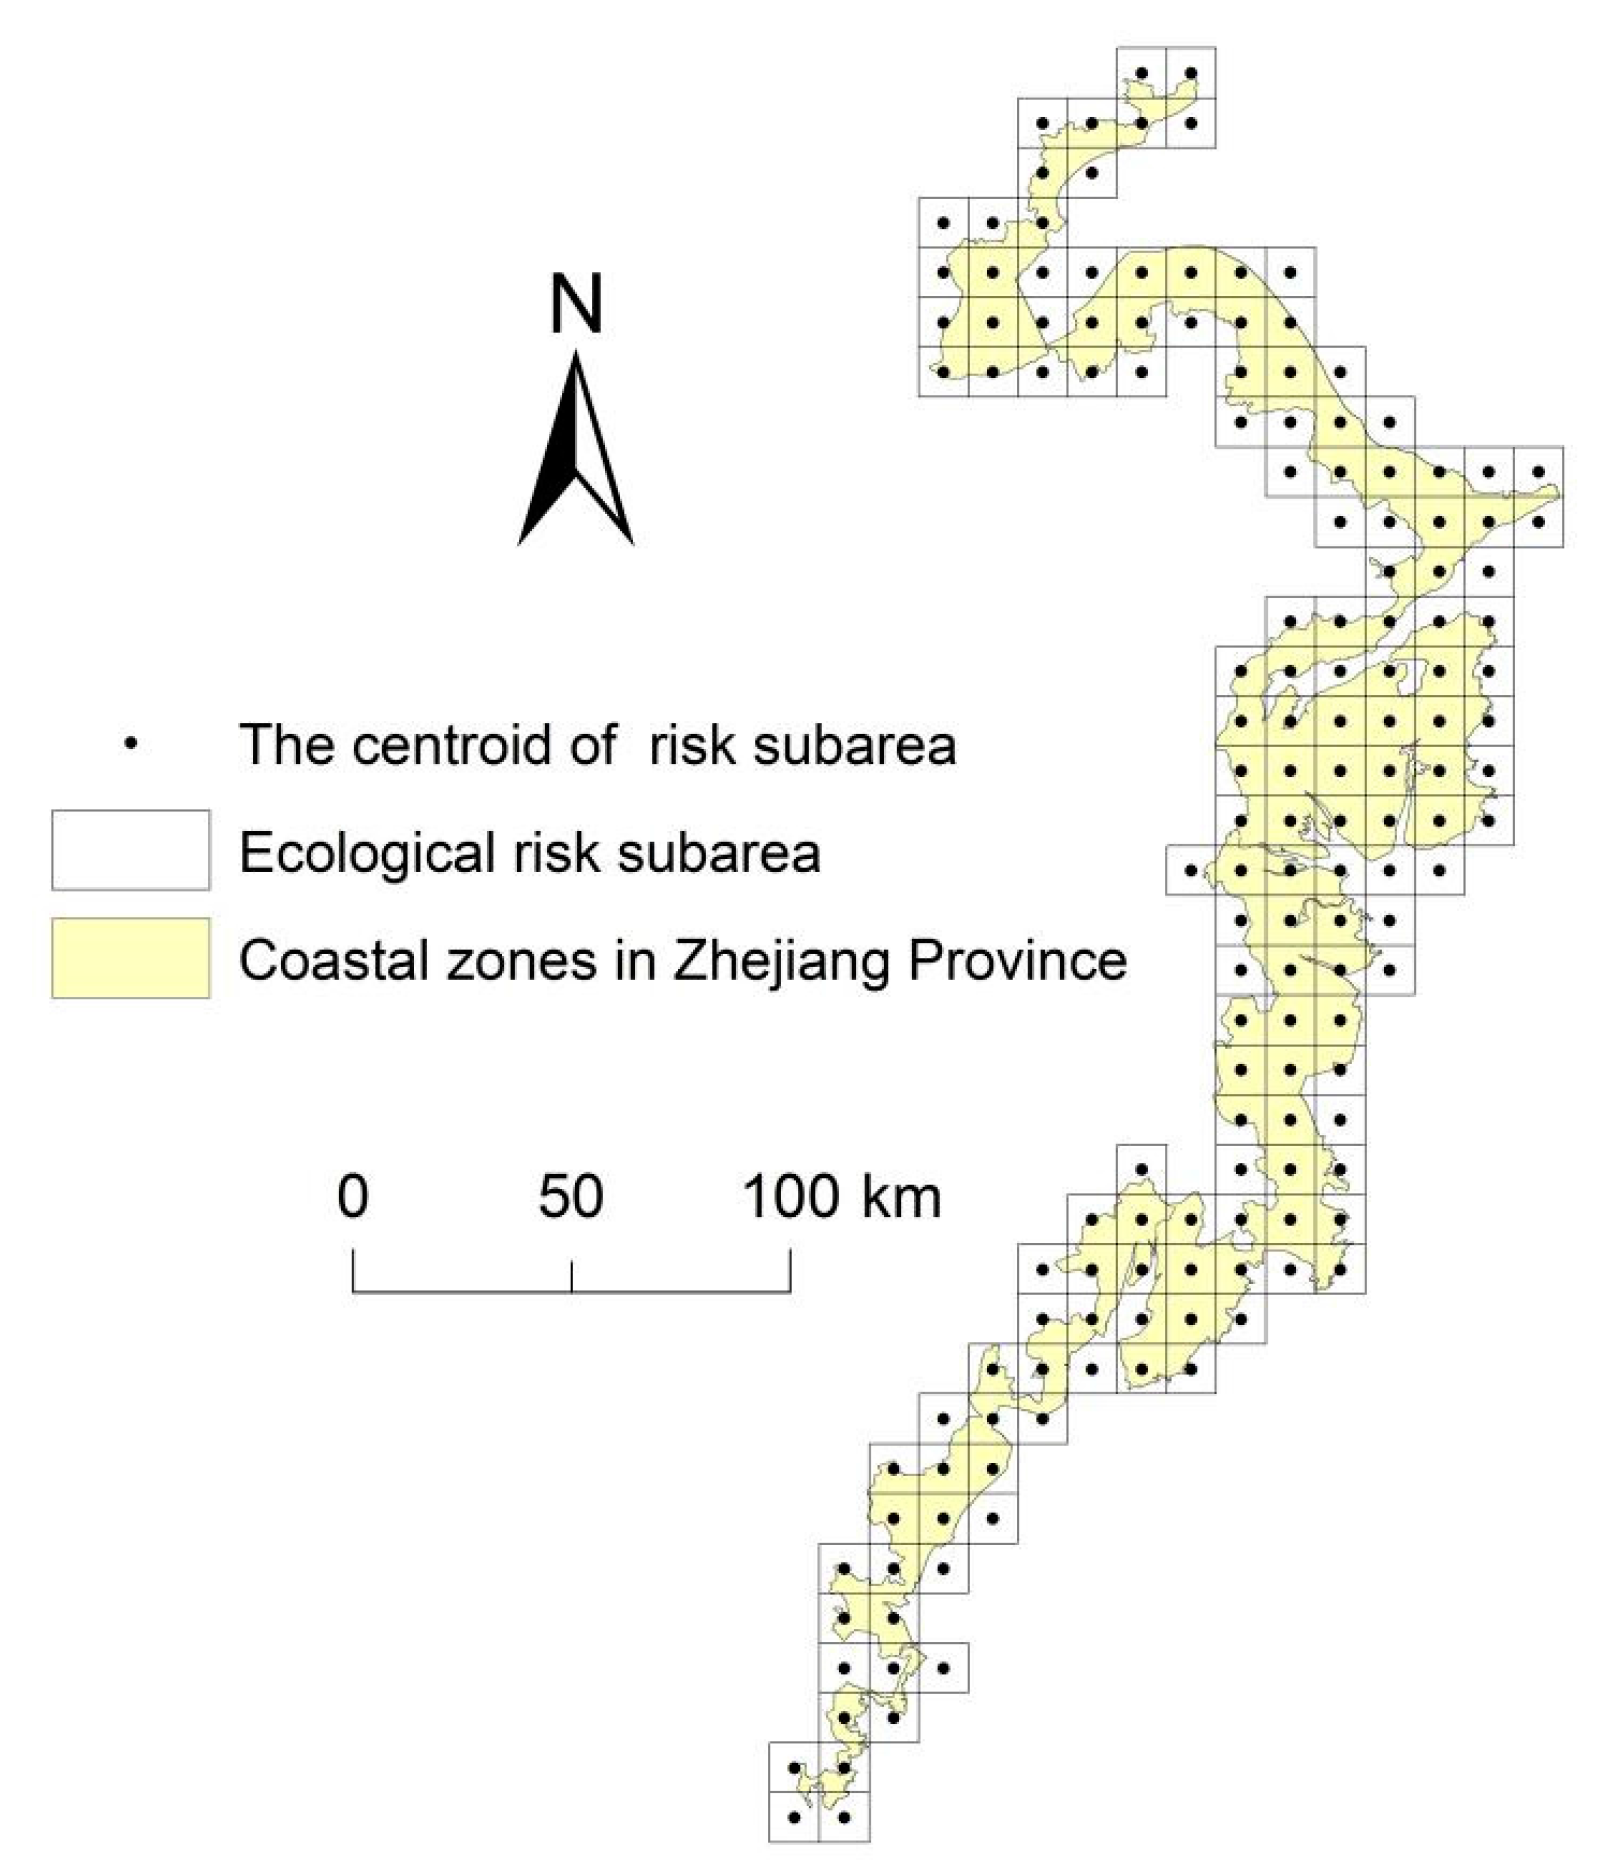
Figure 3.
Changes in landscape structure and proportion of areas in coastal zones in Zhejiang province from 1990 to 2010.
Figure 3.
Changes in landscape structure and proportion of areas in coastal zones in Zhejiang province from 1990 to 2010.
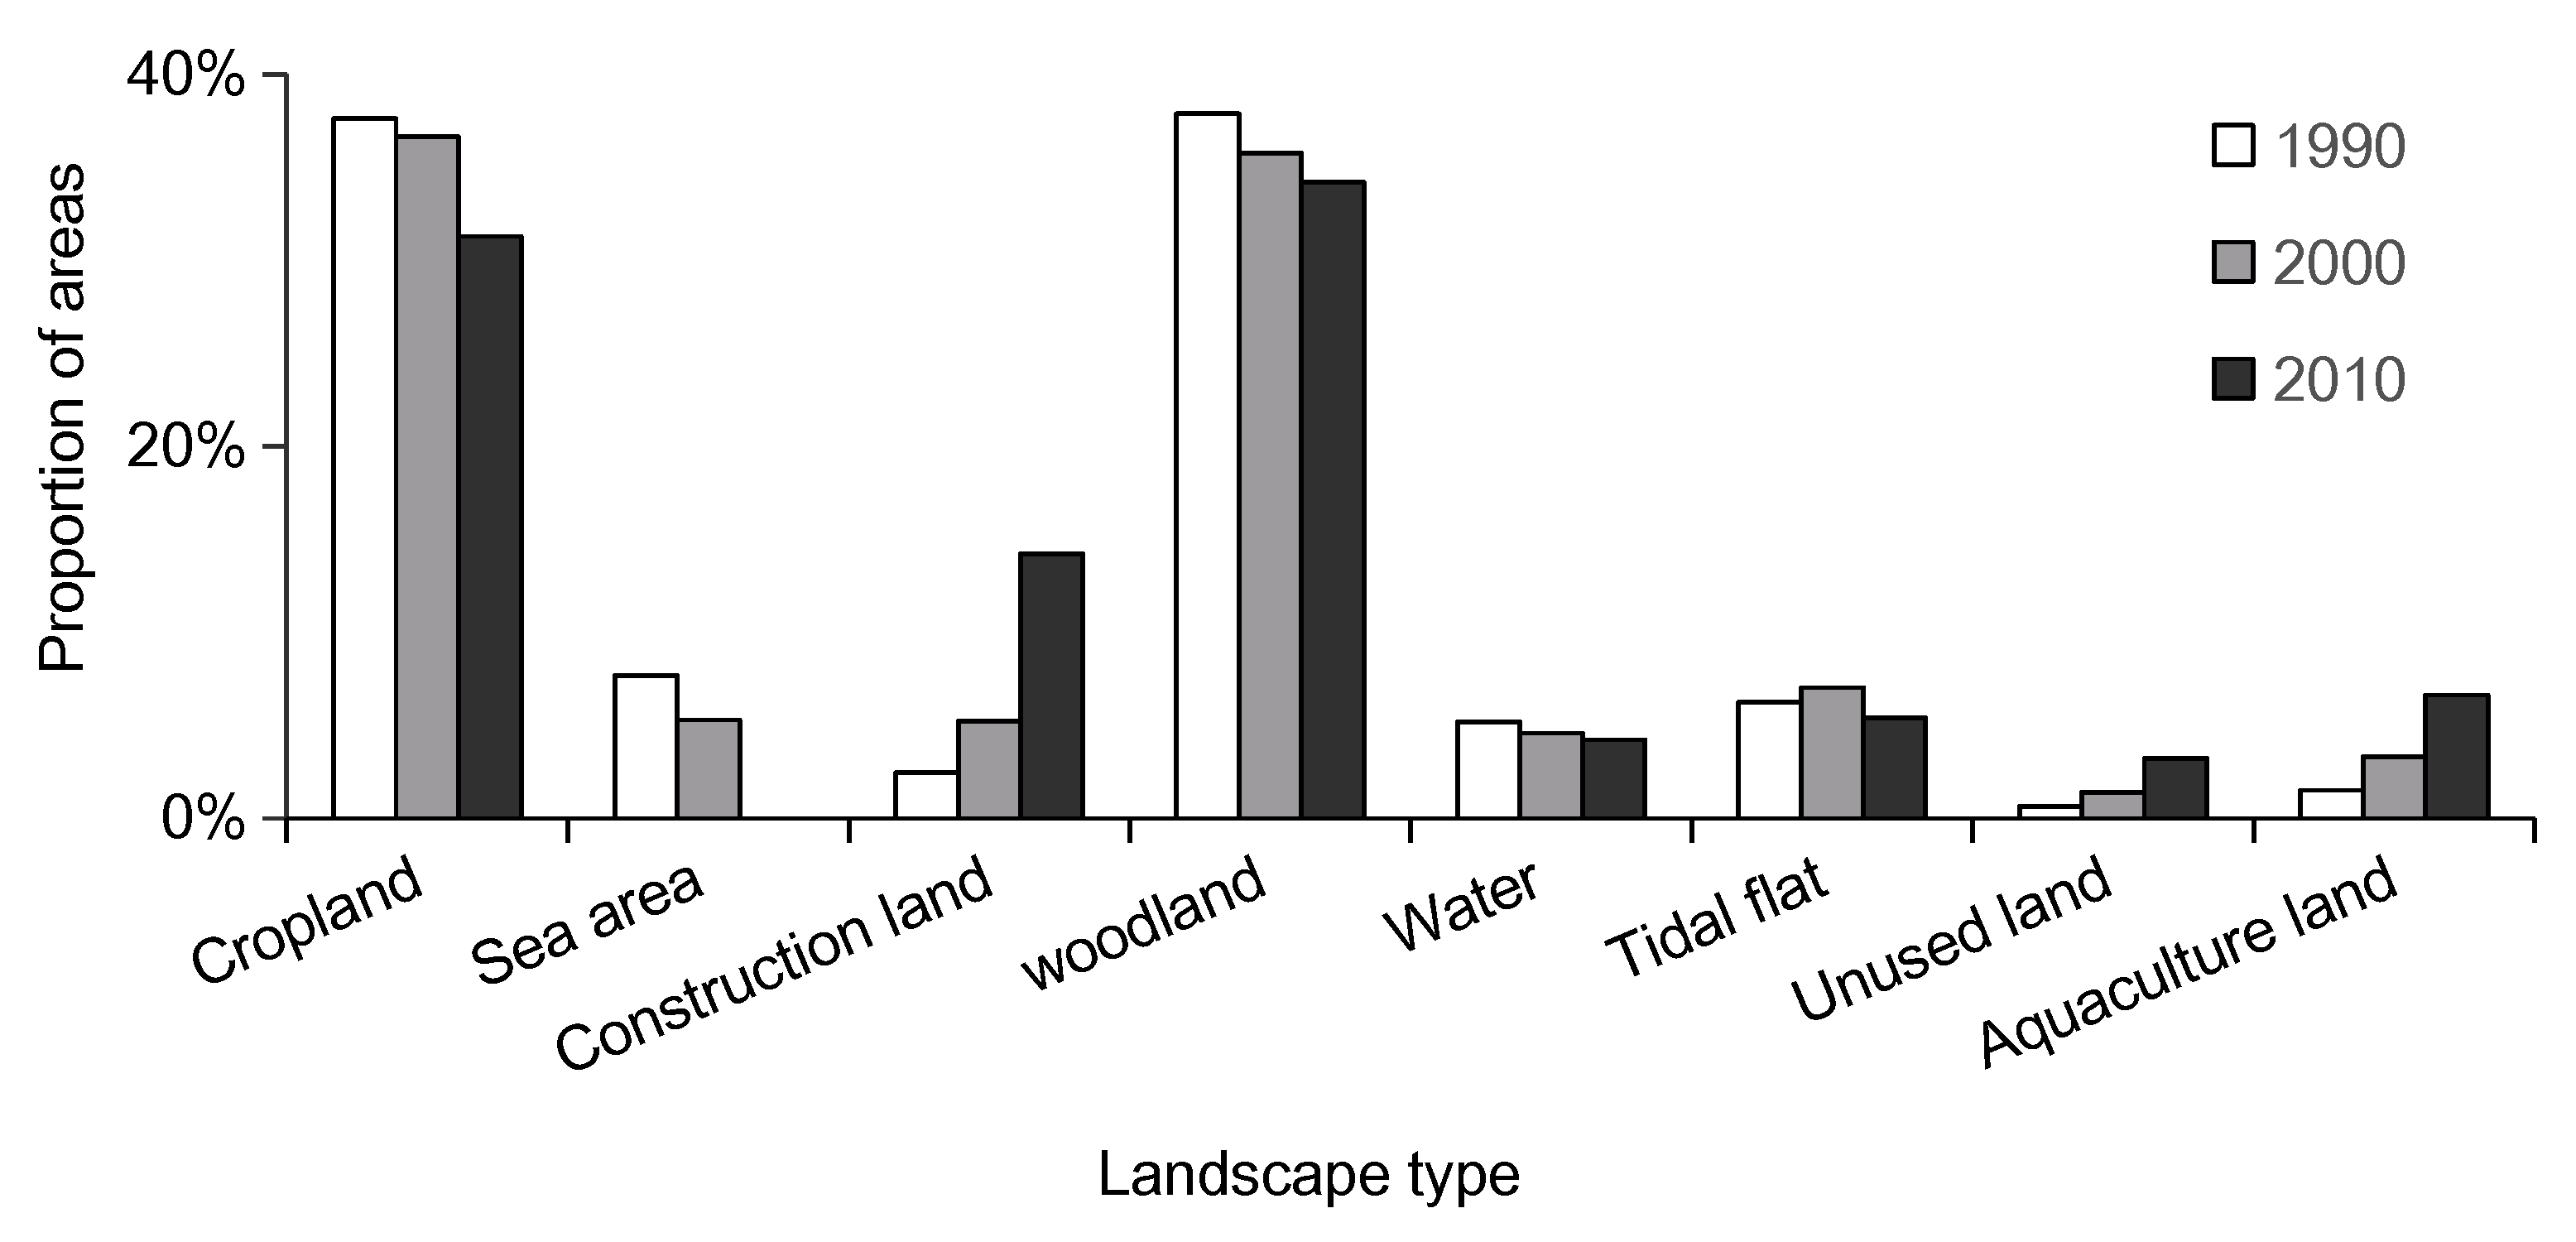
Figure 4.
Changes in numbers of patches of landscape types in coastal zones in Zhejiang province from 1990 to 2010.
Figure 4.
Changes in numbers of patches of landscape types in coastal zones in Zhejiang province from 1990 to 2010.

Figure 5.
Spatial distribution evolution of ecological risk index grades of coastal zones in Zhejiang province from1990 to 2010.
Figure 5.
Spatial distribution evolution of ecological risk index grades of coastal zones in Zhejiang province from1990 to 2010.
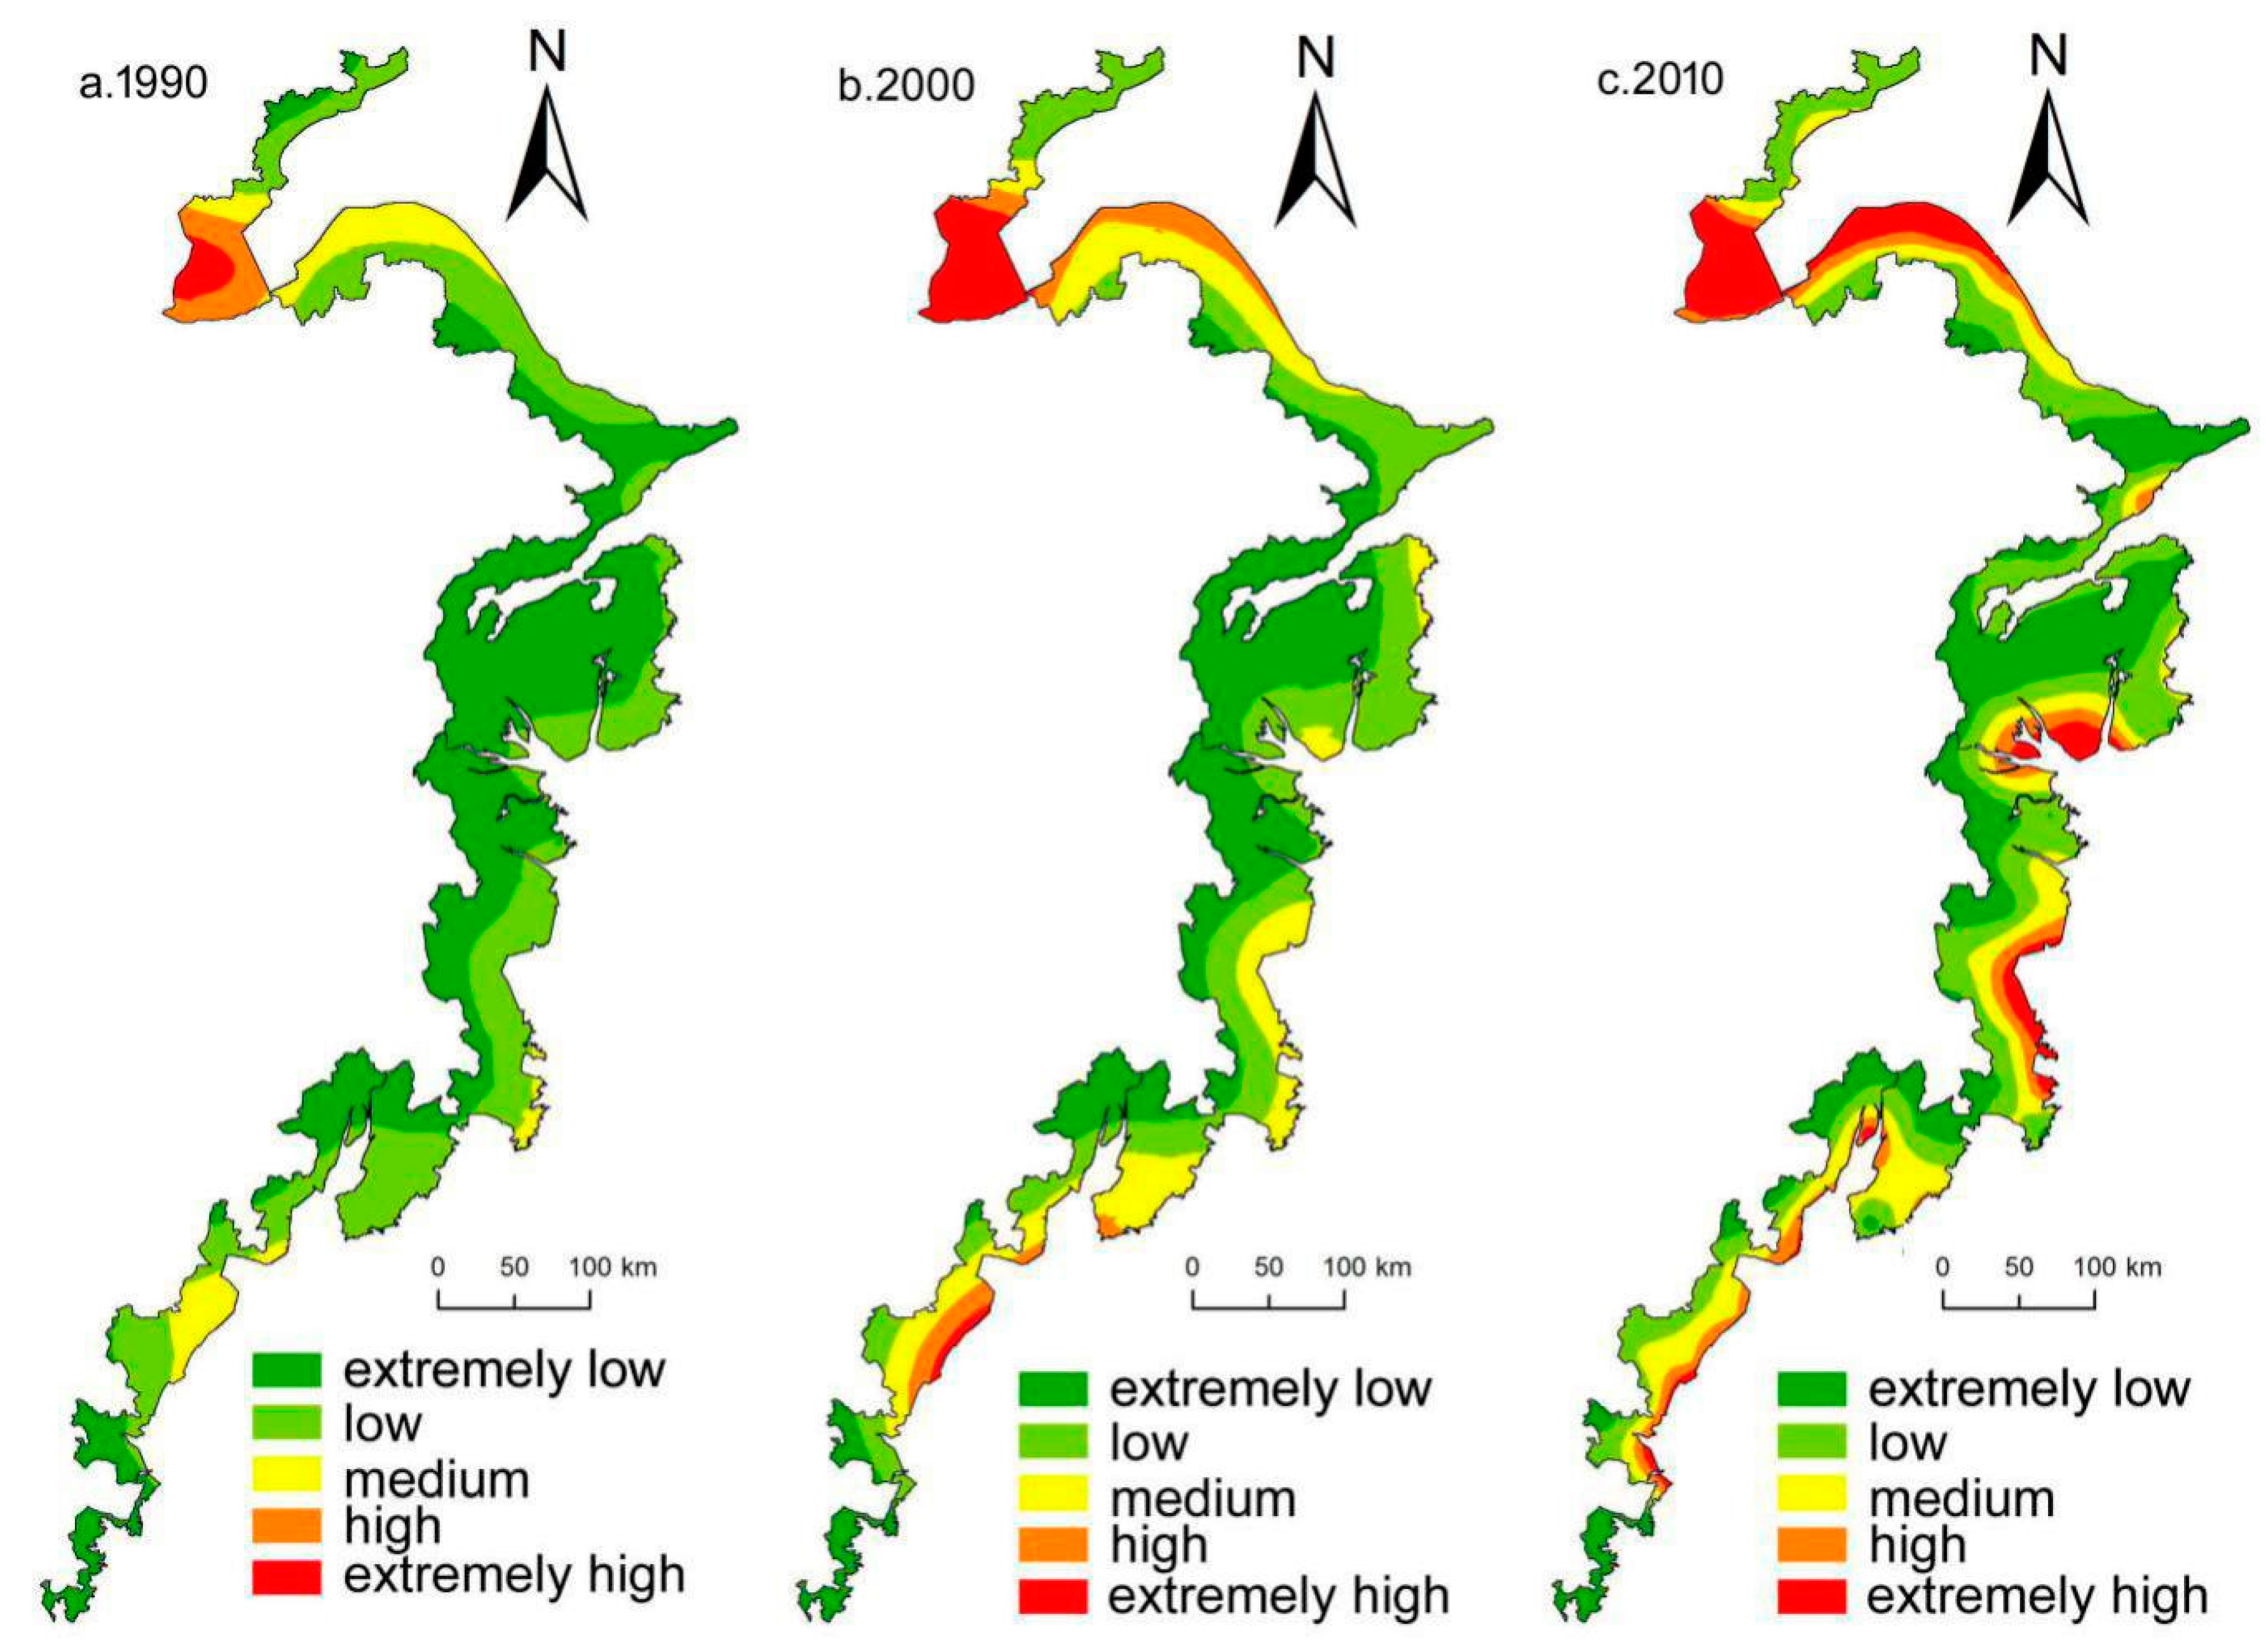
Figure 6.
Changes in the areas of different ecological risk grades from1990 to 2010.

Table 1.
Indices of landscape ecological risk assessment.
| Index | Definition | Expression |
|---|---|---|
| Landscape disturbance index (Ei) | It represents the degree of an ecosystem disturbed by external factors, is constructed by weighting three landscape ecological indices, including the landscape fragmentation index (Ci), the landscape isolation index (Ni) and the landscape dominant index (Di) to characterize the ecosystem affected by external disturbance. | where, a, b and c are the weighted coefficients (a + b + c = 1). Based on previous studies [40] and the experts’ suggestions, coefficients with 0.5, 0.3, and 0.2 were respectively set for a, b, and c. In addition, for unused land, a = 0.2, b = 0.3, and c = 0.5 were specially set because of their possessing regional and specific landscape features [42]. |
| Landscape fragmentation index (Ci) | It is defined as the degree of fragmentation of the entire landscape or one certain type of landscape at a specific time and in a specific nature. The greater the Ci is, the poorer the stability within a landscape [48]. | where, ni is the number for ith land (land use and land cover) type, and Ai is the total area of the ith land type. |
| Landscape isolation index (Ni) | It refers to the degree of dispersion of different patches in a type of landscape. The greater dispersion degree means more separate from different patches in the landscape and thus more complicated of the landscape distribution [41]. | where, A is the landscape total area; Ai is the area of ith land type; and ni is the number of patches of ith land type. |
| Landscape dominant index (Di) | It represents the importance of certain patches in the entire landscape, directly reflecting effects of patches on landscape pattern formation and change. | where, Pi is the patch density (Pi = the number of patches of ith landscape type/total number of patches); fi is the patch frequency (fi = the number of samples of ith landscape type/total number of samples); and Li is the patch ratio (Li = the area of samples of ith landscape type/total area of samples) |
| Landscape fragility index (Fi) | It mainly refers to the vulnerability of ecosystem structure within different landscape types, reflecting the resistance ability of different landscape receptors to the disturbance of the external risk resources. The weaker the resistance ability of a landscape risk receptor to the external risk resources, the greater the fragility, and thus the greater the ecological risk. | In this study, based on the characteristics of the study area and previous studies [49,50], the vulnerability of different landscape types was first divided into eight levels from low to high, i.e., built-up land, woodland, cropland, water, sea area, aquaculture land, tidal flat, and unused land. The landscape fragility index of various landscape types was then normalized to obtain final Fi values of different landscape types. |
| Landscape loss degree index (Ri) | It represents the loss severity of ecosystem’s natural properties of different landscape types when suffering disturbances from the external risk sources (including natural and anthropogenic factors). It is derived by the superposition of the landscape disturbance index (Ei) and the landscape fragility index (Fi). | where, Ri is the ith landscape loss degree index; Ei is the ith landscape disturbance index; Fi is the ith landscape fragility index |
| Landscape ecological risk index (ERIi) | It represents the relative degree of comprehensive ecological losses in a sample plot so that the landscape spatial pattern is transformed to a spatialized ecological risk variable using sampling method. In the process, a concept of area proportion of different landscape components is introduced. | where, ERIi is the ith subarea’s ecological risk index; Rj is the jth landscape loss degree index; Akj is the jth landscape’s area in the kth region; and Ak is an area of kth region. |
Table 2.
Landscape risk pattern indices summarized from the study area.
| Year | Type | Ci | Ni | Di | Ei | Fi | Ri |
|---|---|---|---|---|---|---|---|
| 1990 | woodland | 0.08 | 0.22 | 0.42 | 0.19 | 0.06 | 0.01 |
| Sea area | 0.22 | 0.85 | 0.20 | 0.41 | 0.14 | 0.06 | |
| Cropland | 0.09 | 0.24 | 0.46 | 0.21 | 0.08 | 0.02 | |
| Construction land | 2.23 | 4.74 | 0.26 | 2.59 | 0.03 | 0.07 | |
| Tidal flat | 0.35 | 1.18 | 0.23 | 0.57 | 0.20 | 0.11 | |
| Water | 0.66 | 1.78 | 0.23 | 0.91 | 0.11 | 0.10 | |
| Aquaculture land | 1.05 | 4.16 | 0.14 | 1.80 | 0.17 | 0.30 | |
| Unused land | 0.64 | 5.01 | 0.06 | 1.66 | 0.22 | 0.37 | |
| 2000 | woodland | 0.10 | 0.26 | 0.41 | 0.21 | 0.06 | 0.01 |
| Sea area | 0.34 | 1.26 | 0.17 | 0.58 | 0.14 | 0.08 | |
| Cropland | 0.15 | 0.32 | 0.46 | 0.26 | 0.08 | 0.02 | |
| Construction land | 1.67 | 2.82 | 0.30 | 1.74 | 0.03 | 0.05 | |
| Tidal flat | 0.41 | 1.20 | 0.23 | 0.61 | 0.19 | 0.12 | |
| Water | 1.23 | 2.58 | 0.25 | 1.44 | 0.11 | 0.16 | |
| Aquaculture land | 1.12 | 2.90 | 0.21 | 1.47 | 0.17 | 0.25 | |
| Unused land | 0.94 | 4.1 | 0.11 | 1.48 | 0.22 | 0.33 | |
| 2010 | woodland | 0.10 | 0.27 | 0.39 | 0.21 | 0.06 | 0.01 |
| Cropland | 0.29 | 0.48 | 0.45 | 0.38 | 0.08 | 0.03 | |
| Construction land | 1.03 | 1.34 | 0.39 | 0.10 | 0.03 | 0.03 | |
| Tidal flat | 0.30 | 1.16 | 0.17 | 0.53 | 0.19 | 0.10 | |
| Water | 1.34 | 2.81 | 0.25 | 1.56 | 0.11 | 0.17 | |
| Aquaculture land | 0.72 | 1.64 | 0.23 | 0.90 | 0.17 | 0.15 | |
| Unused land | 0.42 | 1.79 | 0.14 | 0.69 | 0.22 | 0.15 |
Note: Ci is the landscape fragmentation index; Ni is the landscape isolation index; Di is the landscape dominant index; Ei is the landscape disturbance index; Fi is the landscape fragility index; and Ri is the landscape loss degree index.
Table 3.
Transition of ecological risk in the coastal zones in Zhejiang province from 1990 to 2000 (km2).
Table 3.
Transition of ecological risk in the coastal zones in Zhejiang province from 1990 to 2000 (km2).
| Year 2000 | Extremely Low | Low | Medium | High | Extremely High | Total | |
|---|---|---|---|---|---|---|---|
| Year 1999 | |||||||
| Extremely low | 3420.34 | 1564.95 | 5.80 | 0 | 0 | 4991.08 | |
| Low | 48.02 | 1742.30 | 1660.91 | 114.69 | 0 | 3565.92 | |
| Medium | 0 | 0 | 294.81 | 480.14 | 107.70 | 882.65 | |
| High | 0 | 0 | 0 | 0 | 329.00 | 329.00 | |
| Extremely high | 0 | 0 | 0 | 0 | 153.77 | 153.77 | |
| Total | 3468.36 | 3307.25 | 1961.52 | 594.82 | 590.47 | 9922.42 | |
Table 4.
Transition of ecological risk in the coastal zones in Zhejiang province from 2000 to 2010 (km2).
Table 4.
Transition of ecological risk in the coastal zones in Zhejiang province from 2000 to 2010 (km2).
| Year 2010 | Extremely Low | Low | Medium | High | Extremely High | Total | |
|---|---|---|---|---|---|---|---|
| Year 2000 | |||||||
| Extremely low | 2145.25 | 1163.85 | 142.57 | 16.69 | 0 | 3468.36 | |
| Low | 631.35 | 1677.18 | 659.36 | 249.82 | 89.54 | 3307.25 | |
| Medium | 41.44 | 501.34 | 802.33 | 346.80 | 269.61 | 1961.52 | |
| High | 6.67 | 43.85 | 168.37 | 129.26 | 246.67 | 594.82 | |
| Extremely high | 0 | 0 | 14.61 | 111.18 | 464.67 | 590.47 | |
| Total | 2824.71 | 3386.22 | 1787.25 | 853.75 | 1070.49 | 9922.42 | |
Table 5.
Transition of ecological risk in the coastal zones in Zhejiang province from 1990 to 2010 (km2).
Table 5.
Transition of ecological risk in the coastal zones in Zhejiang province from 1990 to 2010 (km2).
| Year 2010 | Extremely Low | Low | Medium | High | Extremely High | Total | |
|---|---|---|---|---|---|---|---|
| Year 1990 | |||||||
| Extremely low | 2677.13 | 1855.91 | 333.72 | 114.44 | 9.88 | 4991.08 | |
| Low | 141.18 | 1430.13 | 1255.42 | 472.98 | 266.21 | 3565.92 | |
| Medium | 6.39 | 100.17 | 198.11 | 227.22 | 350.75 | 882.65 | |
| High | 0 | 0 | 0 | 39.12 | 289.88 | 329.00 | |
| Extremely high | 0 | 0 | 0 | 0 | 153.77 | 153.77 | |
| Total | 2824.71 | 3386.22 | 1787.25 | 853.75 | 1070.49 | 9922.42 | |
Table 6.
Annual transition rates of different ecological risk grades from1990 to 2000 and from 2000 to 2010 (km2/year).
Table 6.
Annual transition rates of different ecological risk grades from1990 to 2000 and from 2000 to 2010 (km2/year).
| Transfer Direction | 1990–2000 | 2000–2010 | Transfer Direction | 1990–2000 | 2000–2010 |
|---|---|---|---|---|---|
| From extremely low to low | 156.49 | 116.24 | From medium to high | 48.01 | 34.68 |
| From extremely low to medium | 0.58 | 14.26 | From medium to extremely high | 10.77 | 26.96 |
| From extremely low to high | 0 | 1.67 | From high to extremely low | 0 | 0.67 |
| From low to extremely low | 4.80 | 63.13 | From high to low | 0 | 4.38 |
| From low to medium | 166.09 | 65.94 | From high to medium | 0 | 16.84 |
| From low to extremely high | 11.47 | 24.98 | From high to extremely high | 32.90 | 24.67 |
| From low to extremely high | 0 | 8.95 | From extremely high to medium | 0 | 1.46 |
| From medium to extremely low | 0 | 4.14 | From extremely high to high | 0 | 11.12 |
| From medium to low | 0 | 50.13 |
© 2017 by the authors. Licensee MDPI, Basel, Switzerland. This article is an open access article distributed under the terms and conditions of the Creative Commons Attribution (CC BY) license (http://creativecommons.org/licenses/by/4.0/).
Share and Cite
MDPI and ACS Style
Li, J.; Pu, R.; Gong, H.; Luo, X.; Ye, M.; Feng, B. Evolution Characteristics of Landscape Ecological Risk Patterns in Coastal Zones in Zhejiang Province, China. Sustainability 2017, 9, 584. https://doi.org/10.3390/su9040584
AMA Style
Li J, Pu R, Gong H, Luo X, Ye M, Feng B. Evolution Characteristics of Landscape Ecological Risk Patterns in Coastal Zones in Zhejiang Province, China. Sustainability. 2017; 9(4):584. https://doi.org/10.3390/su9040584
Chicago/Turabian StyleLi, Jialin, Ruiliang Pu, Hongbo Gong, Xu Luo, Mengyao Ye, and Baixiang Feng. 2017. "Evolution Characteristics of Landscape Ecological Risk Patterns in Coastal Zones in Zhejiang Province, China" Sustainability 9, no. 4: 584. https://doi.org/10.3390/su9040584
Note that from the first issue of 2016, this journal uses article numbers instead of page numbers. See further details here.