
Regional-Level Carbon Allocation in China Based on Sectoral Emission Patterns under the Peak Commitment


1
School of Business Administration, China University of Petroleum at Beijing, Beijing 102249, China
2
Center for Applied GIScience, Department of Geography and Earth Sciences, University of North Carolina, Charlotte, NC 28223, USA
*
Author to whom correspondence should be addressed.
Sustainability 2017, 9(4), 552; https://doi.org/10.3390/su9040552
Submission received: 3 January 2017
/
Revised: 20 March 2017
/
Accepted: 20 March 2017
/
Published: 5 April 2017
(This article belongs to the Section Environmental Sustainability and Applications)
Abstract
:The Chinese government has committed to reaching its carbon emissions peak by 2030, which is a major undertaking. However, traditional carbon allocation processes may face a suite of difficulties, including the dynamics of the allocation principle, the independence of the allocation entities and data availability. Considering these difficulties, in this study, we developed a multi-level carbon allocation model that integrates five sectors and 30 provinces in China. Based on the clustering of the sectoral carbon emission of major countries (or regions), the model simulates and analyzes carbon allocation at the provincial level in China under the peak commitment. The results of this study are as follows: First, in contrast to allocating national carbon allocations (NCAs) to provinces, the grandfather principle is the only option for allocating NCAs to sectors. In the future, China’s carbon emissions pattern will be dominated by the contribution from electricity and heat production sectors. This carbon emission pattern can be further divided into three categories: Pattern M, where the manufacturing and construction sectors significantly contribute to total emissions; Pattern R, where the residential buildings and commercial and public services sectors have a significant contribution to total emissions; and Pattern T, where the contribution of the transport sector to total emissions is substantial; Second, emission patterns affect the allocation of sectoral carbon allocations at the national level (SCANs). Although the preferences vary from sector to sector, they are consistent between the national and provincial levels; Third, compared with sectoral preferences, provincial preferences are more complex. Sixteen provinces, including Hebei, Shanxi and Inner Mongolia, prefer Pattern T. There are nine provinces, for example, Guangdong, Shandong and Jiangsu, whose preferred pattern is M; and five provinces, represented by Beijing, Shanghai and Tianjin, have a preference for Pattern R; Last, but not least, to achieve China’s peak commitment, different provinces face alternative peak pressures. It is worth mentioning that, in patterns R and T, provinces with a high proportion of manufacturing and construction sector emissions, such as Guangdong, Shandong, Jiangsu and Zhejiang, may have to increase the share of carbon emissions from the transport sector or from residential buildings and commercial and public services sectors to postpone their peak year.
1. Introduction
On 30 November 2015, at the 21st session of the UNFCCC (See Appendix A for abbreviations in the paper), China promised to reach its carbon emission peak by 2030 [1], marking the beginning of China’s cap control of carbon emissions. Achieving this commitment has become one of the major challenges facing the Chinese government as part of its response to global climate or environmental change. Curbing the carbon emissions requires the implementation of regional carbon reductions in China. However, a prerequisite for the implementation of carbon reductions is to determine future total carbon allocations and their interregional allocations in China. This represents a scientific problem that needs in-depth study.
Before the Kyoto Protocol [2] was developed in 2007, most studies on carbon allocations focused on the allocation principles and used Article 3.1 of UNFCCC [3] as evaluation criteria. These studies concentrated on the selection of an appropriate principle [4,5,6]. Rose et al. [7] proposed three categories of controversial equity principles. The first category is based on distribution equity, represented by the principle of sovereignty, equality and the ability to pay. The second category is associated with output equity, for example the principle of horizontal and vertical compensation. The third one relies on process equity, exemplified by the principle of maximum minimization, consistency and the market. In general, as Steenberghe [8] stressed, the latter two categories are less frequently applied than the first category, although these two categories are superior in terms of dynamics and flexibility. The main reason is that these categories account for many uncertainties, such as economic growth, technology and emission reduction costs. It should be noted that given the dynamic evolution of regional carbon emissions, new challenges will arise regardless of the adopted allocation principle [9]. Currently, more studies are carried out using various models from a cost-effective point of view [10,11]. For example, Lin and Ning [12] assessed the EU’s carbon allocations based on the ZSG-DEA model. Park et al. [13] investigated the use of the Boltzmann distribution to allocate carbon for eight countries (Canada, China, Germany, Italy, Japan, Russia, the U.K. and the U.S.). Zhang et al. [14] combined the Shapley value with an entropy approach to allocate regional carbon allocations in China. These models provided important reference for further study. However, some studies of modeling carbon allocation appear to be subjective, and the indicators used in these studies tend to be one-sided and isolated [15] because the models are based on too many strict assumptions, some of which are only made at the theoretical level.
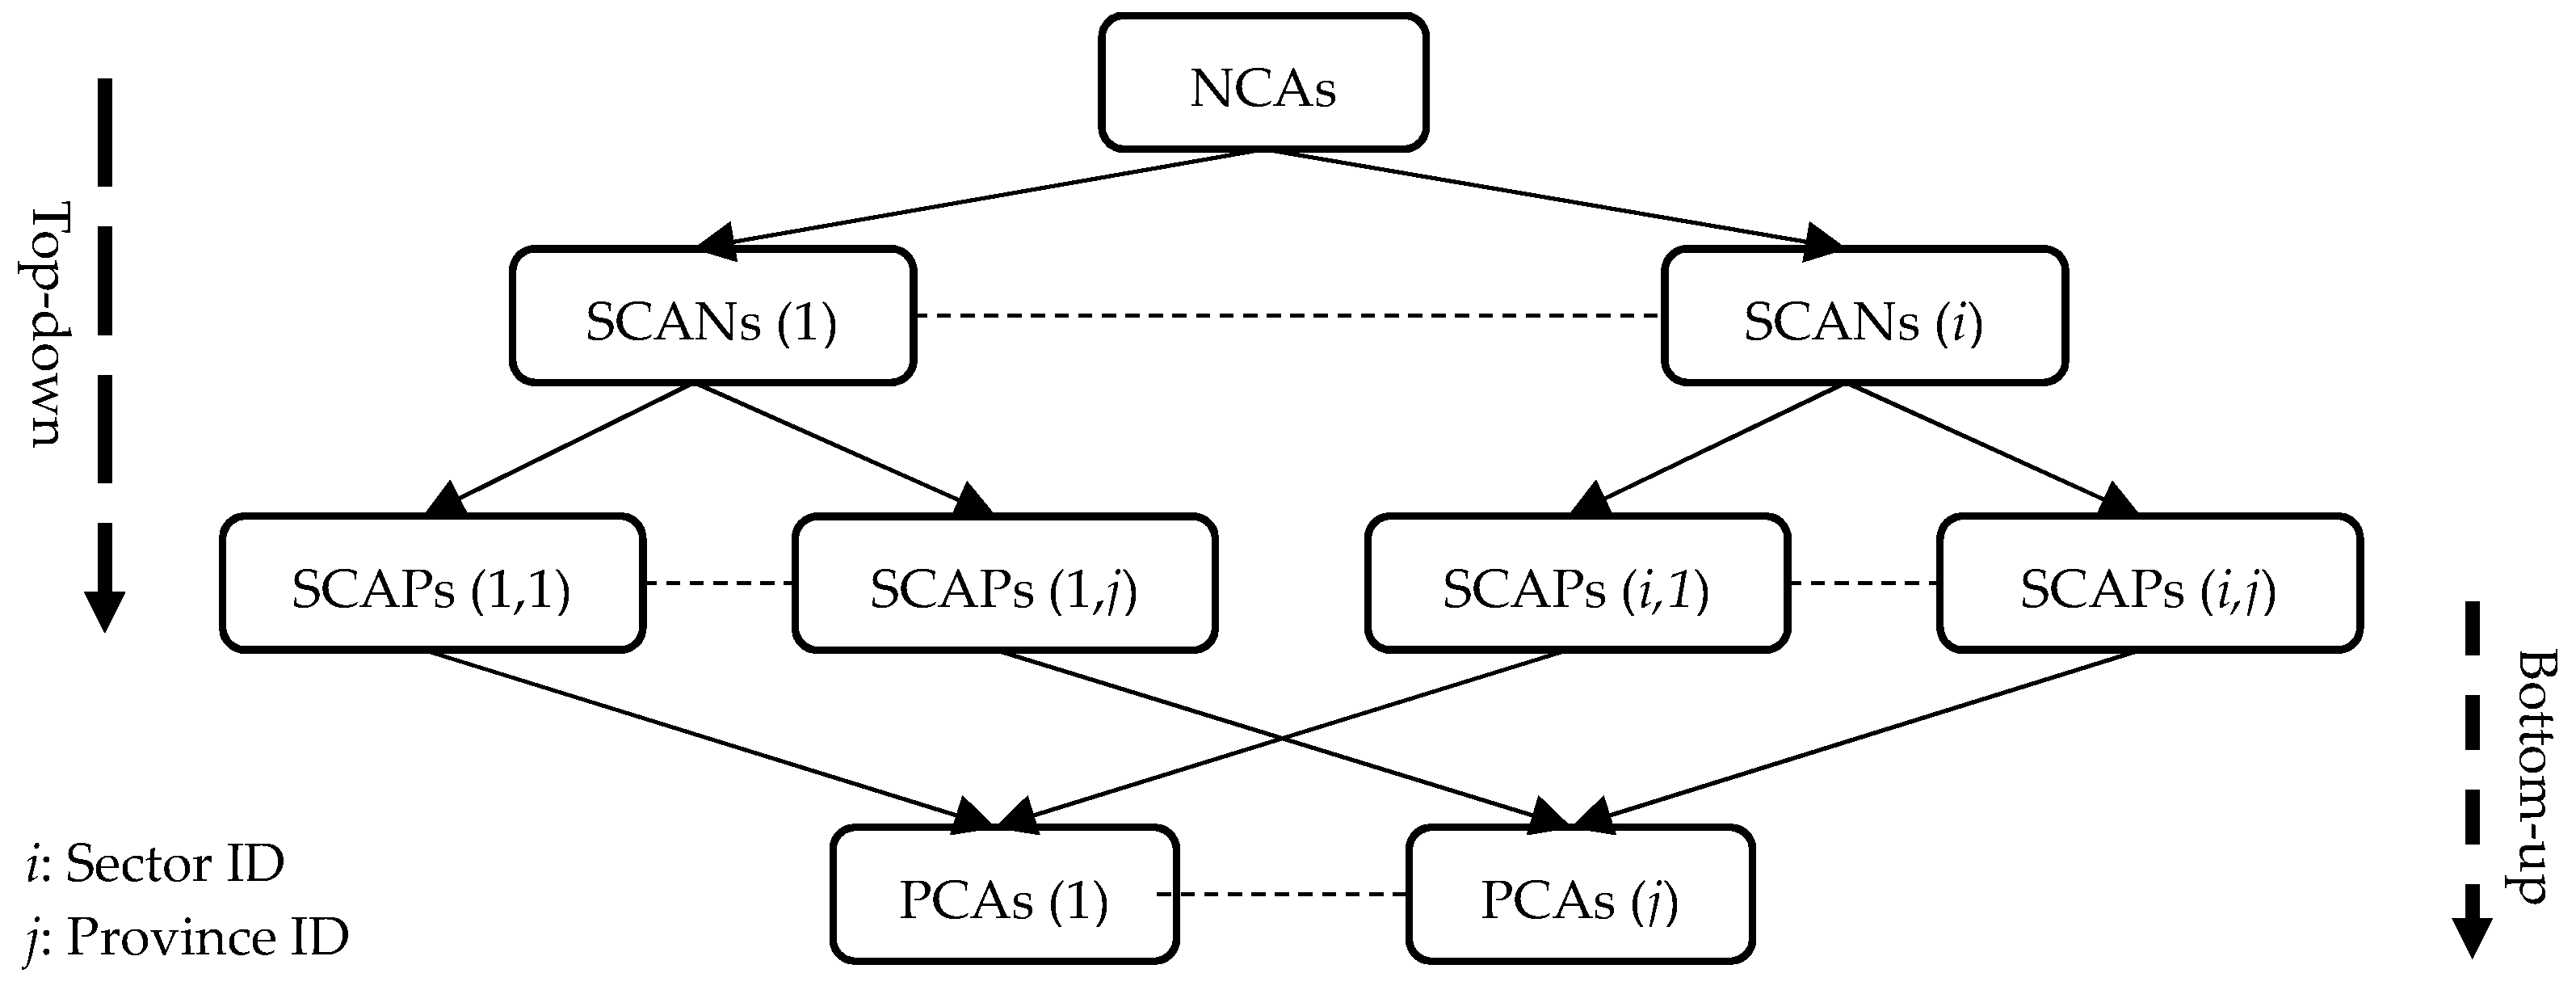
With respect to the allocation process, there are mainly two approaches [16]. One is a top-down process: that is, first the allocations of the upper-level entity are calculated, and then, these allocations are assigned to subordinate entities, for example computing global carbon allocations among countries (or regions) [17,18,19,20], national carbon allocation among provinces [21,22] or among sectors [23,24]. The other approach for carbon allocation is a bottom-up process. This bottom-up approach first sets the emission reduction targets to calculate the allocations for the lower-level entity, and then, these allocations are aggregated to the superior entity, represented by estimating global allocations by regional voluntary emission reductions under UNFCCC [25,26]. In fact, both the top-down and bottom-up approaches require independence, which means that there should be no bargaining or conditional binding among lower-level entities. Otherwise, it is easy to form inequity in the allocation process, which would make it difficult to implement. For example, when assigning a country’s allocations to its provinces through the top-down process, each province tends to use its political or economic power to influence government decisions on the choice of principles when the results of provincial carbon allocations (PCAs) differ from one principle to another. Therefore, provinces with less power to negotiate can only make a compromise on the allocation principle, thereby losing the quotas that should be allocated to them under the principles that they prefer. Another example is the use of the bottom-up process to allocate global quotas. With respect to NCAs, more than 20 global schemes have been proposed. However, none of them have been unanimously accepted because it is hard to reach agreements on critical points (e.g., some countries’ emission reduction targets are based on others’) [27,28,29].
The research on carbon allocation has matured, which provides a reference for the study of intra-regional allocation. However, carbon allocation at the regional level, for example examining regional allocations in China under the peak commitment, faces a series of challenging questions. First, how do we combine the dynamic evolution of regional carbon emissions with a specific principle? Second, how do we eliminate the interdependence among provinces in the allocation process? In addition, lack of data in some provinces further increase the difficulty.
To address these challenging questions, we developed a carbon allocation model that integrates three levels, including national, provincial and sectoral, with different sectoral emission patterns. Here, sectoral emission patterns refer to the proportion of carbon emitted by different sectors within a region. To address the first question above, the sectoral emission patterns of representative countries are studied as the target model. Then, trend extrapolation and scenario simulation of the target model are applied to reflect the alternative future evolution of China’s carbon emission structure. To answer the second question, instead of the traditional methods where NCAs are allocated to provinces first and then to the different sectors within the province, an improved method is used where NCAs are allocated to sectors first and then to the corresponding sectors in each province. The advantage of the improved method is that the negotiation space will be greatly restricted due to large differences in production methods and the product mix among sectors. Thus, this method should effectively avoid the interdependence among the provinces in the traditional method. In addition, it is difficult to assign allocations to sectors within the province based on the traditional method because the proportion of carbon emitted by different sectors at the provincial level in China is often not available. Thus, the improved method calculates sectoral carbon allocations by taking the ratio of sectors’ output at the provincial level to those at the national level instead of the ratio of sectoral carbon allocations at the provincial level (SCAPs) to SCANs because these two proportions are usually consistent, and the former is easy to obtain from the input-output table at the provincial level.
2. Model and Data
2.1. Data
2.1.1. Classification of Sectors
The current classification standards of sectoral division can be based on five sector-, 17 sector- and 42 sector-based categories. To ensure the consistency of data at the national and provincial levels and to account for the availability of data, the study classifies all sectors into five categories according to the World Bank criteria: (1) residential buildings and commercial and public services, (2) manufacturing and construction, (3) transport, (4) electricity and heat production and (5) “other” sectors (“Other” sectors represent all sectors, except the four sectors mentioned above per the World Bank database.).
2.1.2. Data Sources and Processing
The study mainly involves two types of data: (1) the proportion of sectoral carbon emissions in major countries (or regions) and (2) the ratio of sectors’ output at the provincial level to that at the national level. The former comes from the World Bank, where the proportion of sectoral CO2 emissions were gathered from 1971 to 2013 and extrapolated to 2030 using a condition in which the summation of the proportion of all sectors is 100%. The latter comes from the input-output table on the 42 sectors of 30 provinces in China in 2007 (National Bureau of Statistics. China’s Regional Input-Output Table 2007. China Statistics Press. In general, the ratio of sectors’ output at the provincial level to that at the national level remains relatively stable). See Appendix B for the consolidation of sectoral data from different data sources. The extrapolations in this study are based on the least squares principle, where the best curves are fitted by minimizing the sum of squared deviations of historical and trend values, including quadratic, logarithmic and exponential functions. In addition, mean squared error (MSE) is used to validate the fitted curves. In the process of validation, 43 historical carbon emission data (1971–2013) are divided into two groups, where the former 30 data are taken as the curve fitting data group for training and the latter 13 data as the data group for validation.
The study sets 2015 as the base year, 2030 as the final year and 2016–2030 as the allocation period. China’s carbon emissions in 2015 are extrapolated through polynomial fitting and trend extrapolation from the World Bank’s historical data. An average value of 2.85 GtC/year (The unit GtC represents the gigatons of carbon) was obtained, and values vary between 2.74 GtC/year and 2.97 GtC/year. China’s carbon emissions in 2030 were projected as 3.19 GtC/year using the projections for the current policy scenario of the World Energy Outlook [30].
2.2. Model
In this study, we proposed a method to improve carbon allocation in China (see Figure 1). Using this method, our model first allocates NCAs to sectors and then allocates them to the corresponding sectors in each province based on a top-down process. Finally, the PCAs will be aggregated based on a bottom-up process.
2.2.1. National Carbon Allocations
In general, NCAs are the maximum amount of carbon emissions allowed for a country. Therefore, the total NCAs from 2016 to 2030 can be expressed as follows:
where t is a single year during the allocation period.
2.2.2. Sectoral Carbon Allocations at the National Level
SCANs can be obtained from NCAs. A relatively straightforward method of calculating SCAPs is to set representative indicators by selecting a specific principle and then allocate NCAs to sectors based on the value of representative indicators, as in Equation (2)
where α is the value of representative indicators and i is the sector ID.
To combine the dynamic evolution of regional carbon emissions with the selected principle, this study introduces the allocation approach for SCANs based on sectoral emissions patterns. The steps are as follows:
- (1)
- Conduct cluster analysis of the sectoral carbon emission structure of major countries (or regions), and extract typical target models.
- (2)
- Select a representative country in each target model.
- (3)
- Set the ratio of sectoral carbon emissions to national carbon emissions as the representative indicator. Assuming the representative indicator changes at a constant rate, the value of the representative indicator during the allocation period can be expressed using the following formula.
- (4)
- Allocate NCAs to all sectors using Equation (2).
2.2.3. Provincial Carbon Allocations
In contrast to the traditional method, the improved method first obtains SCAPs and then estimates PCAs, where SCAPs are calculated by multiplying SCANs by the ratio of sector output at the provincial level to sector output at the national level, as in Equation (4)
where j is the province ID, β is the ratio of sector output at the provincial level to sector output at the national level and γ is the deviation from sectoral policies at the provincial level to the sectoral policies at the national level. Here, we assume γ = 1, which means that the evolution process of sectoral policies at the provincial level follows the evolution process of sectoral policies at the national level.
Finally, PCAs are calculated by summing up all SCAPs in the same province, as in Equation (5).
3. Simulation and Discussion
3.1. China's National Carbon Allocations during the Peak Commitment Period
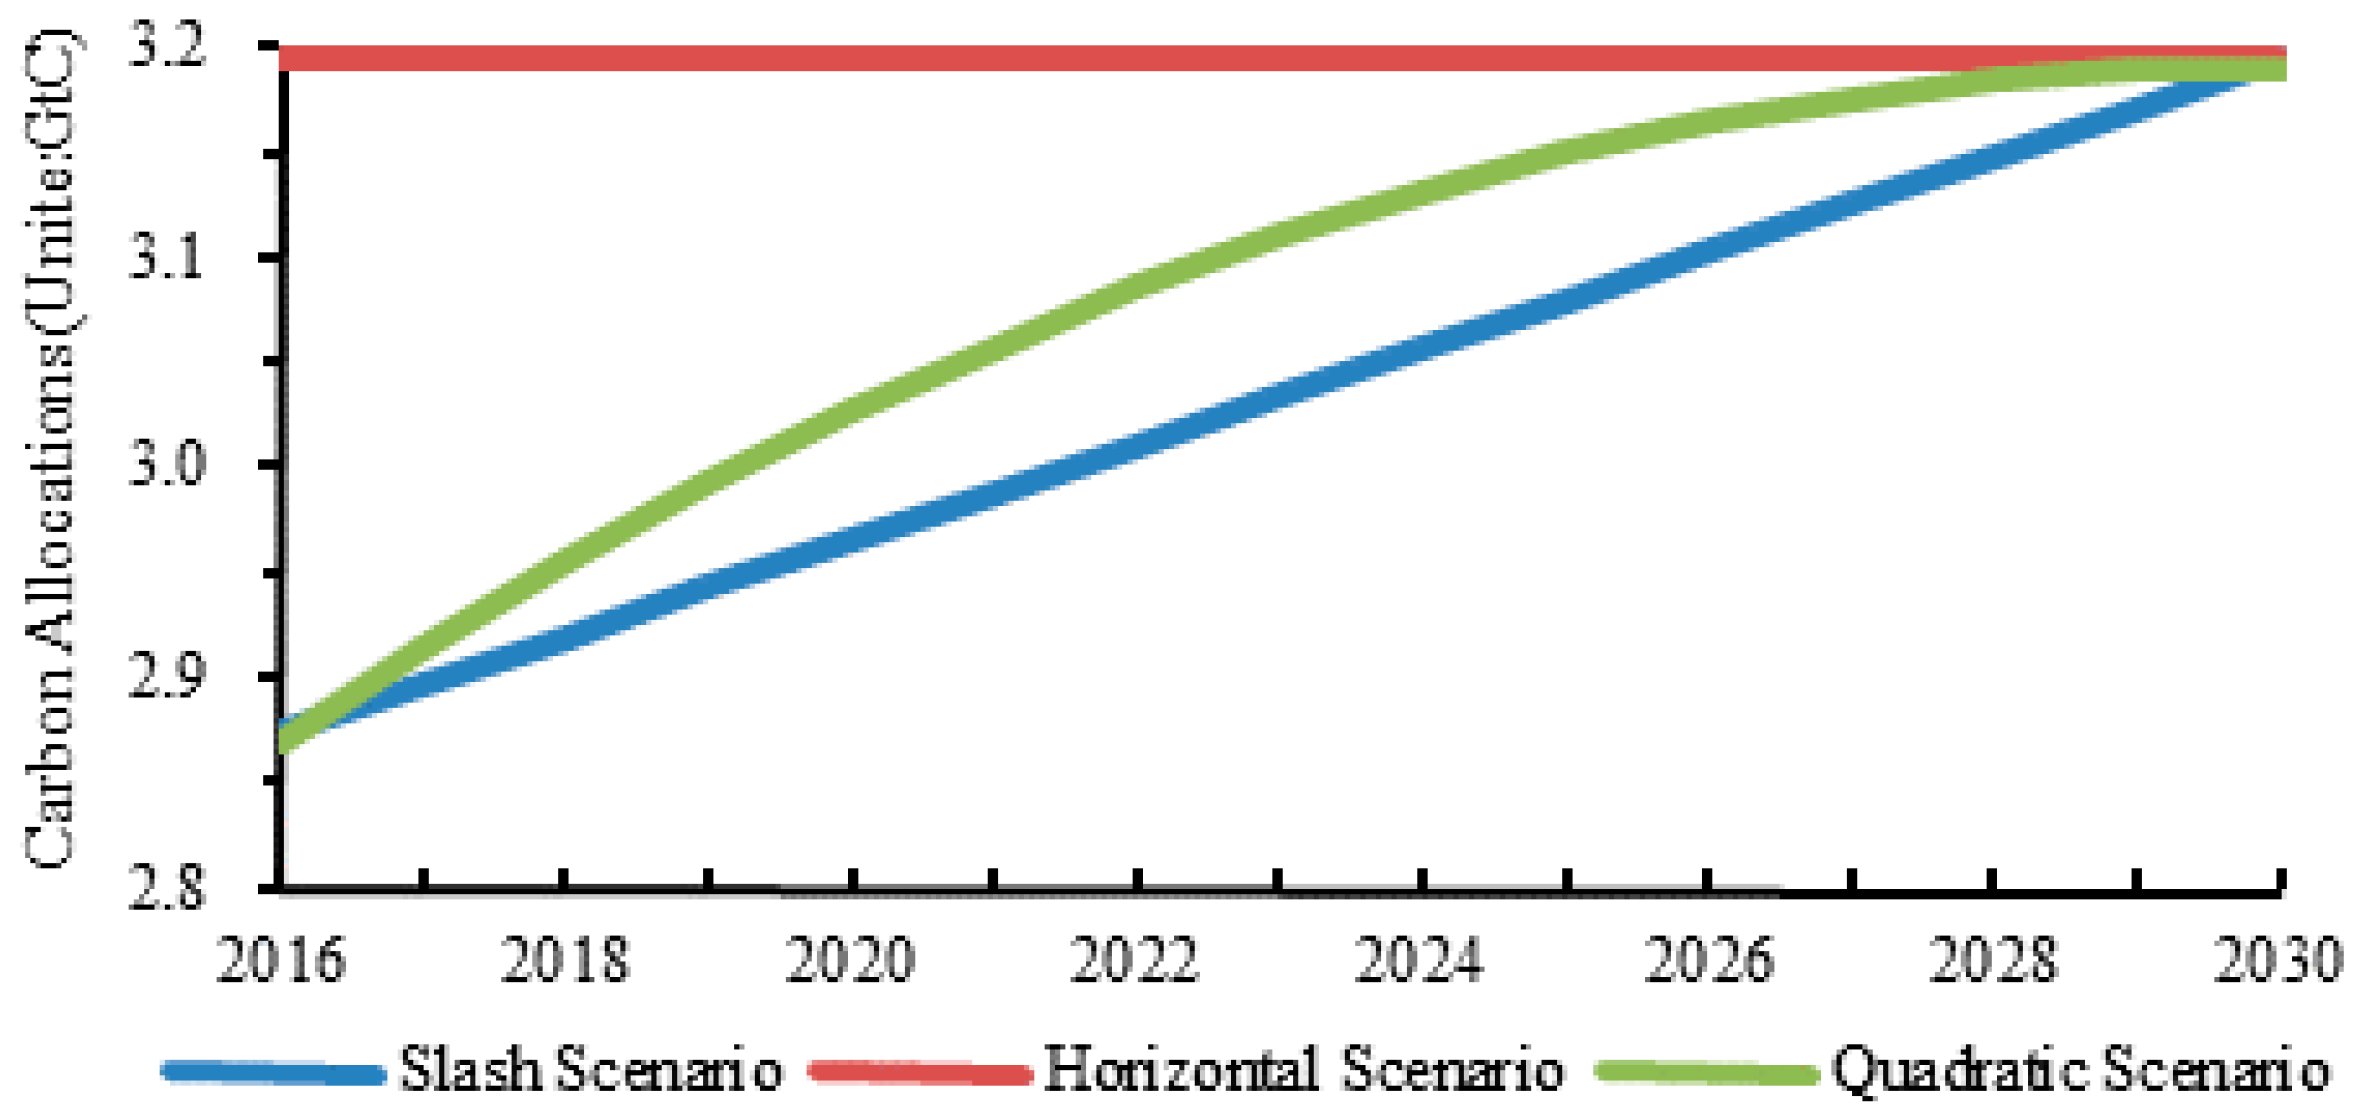
The peak commitment means that the NCAs will rise until 2030. In general, the rising trend can be divided into three types according to the slope of the NCAs: constant, decreasing and increasing. The peak commitment also means that 2030 will be a turning point in the rise of NCAs, when the slope of NCAs changes from positive to negative. Therefore, it is not realistic for the slope of China’s NCAs to show an increasing trend under the peak commitment.
Using Equation (1), we can estimate China’s NCAs from 2016 to 2030. Figure 2 shows that values range from 45.51 GtC to 47.91 GtC. The horizontal (NCAs peak in 2016 and remaining constant until 2030) and slash scenario (NCAs increase with a constant slope from 2016 to 2030) represent the maximum and minimum, while the quadratic scenario (NCAs increase quadratically) lies in between (with an NCA of 46.19 GtC).
The peaking scenario determines the relative size of China’s NCAs during the allocation period. Obviously, China’s NCAs before the peak will not behave like either the slash or horizontal scenario, but will be most like the quadratic scenario (with different degrees of curvature). Given the same conditions, the greater the curvature in the scenario, the higher the value of China’s NCAs is. We focus on the quadratic scenario in the following simulation and analysis.
3.2. China's SCANs during the Peak Commitment Period
3.2.1. Selection of Principles for SCAN allocation
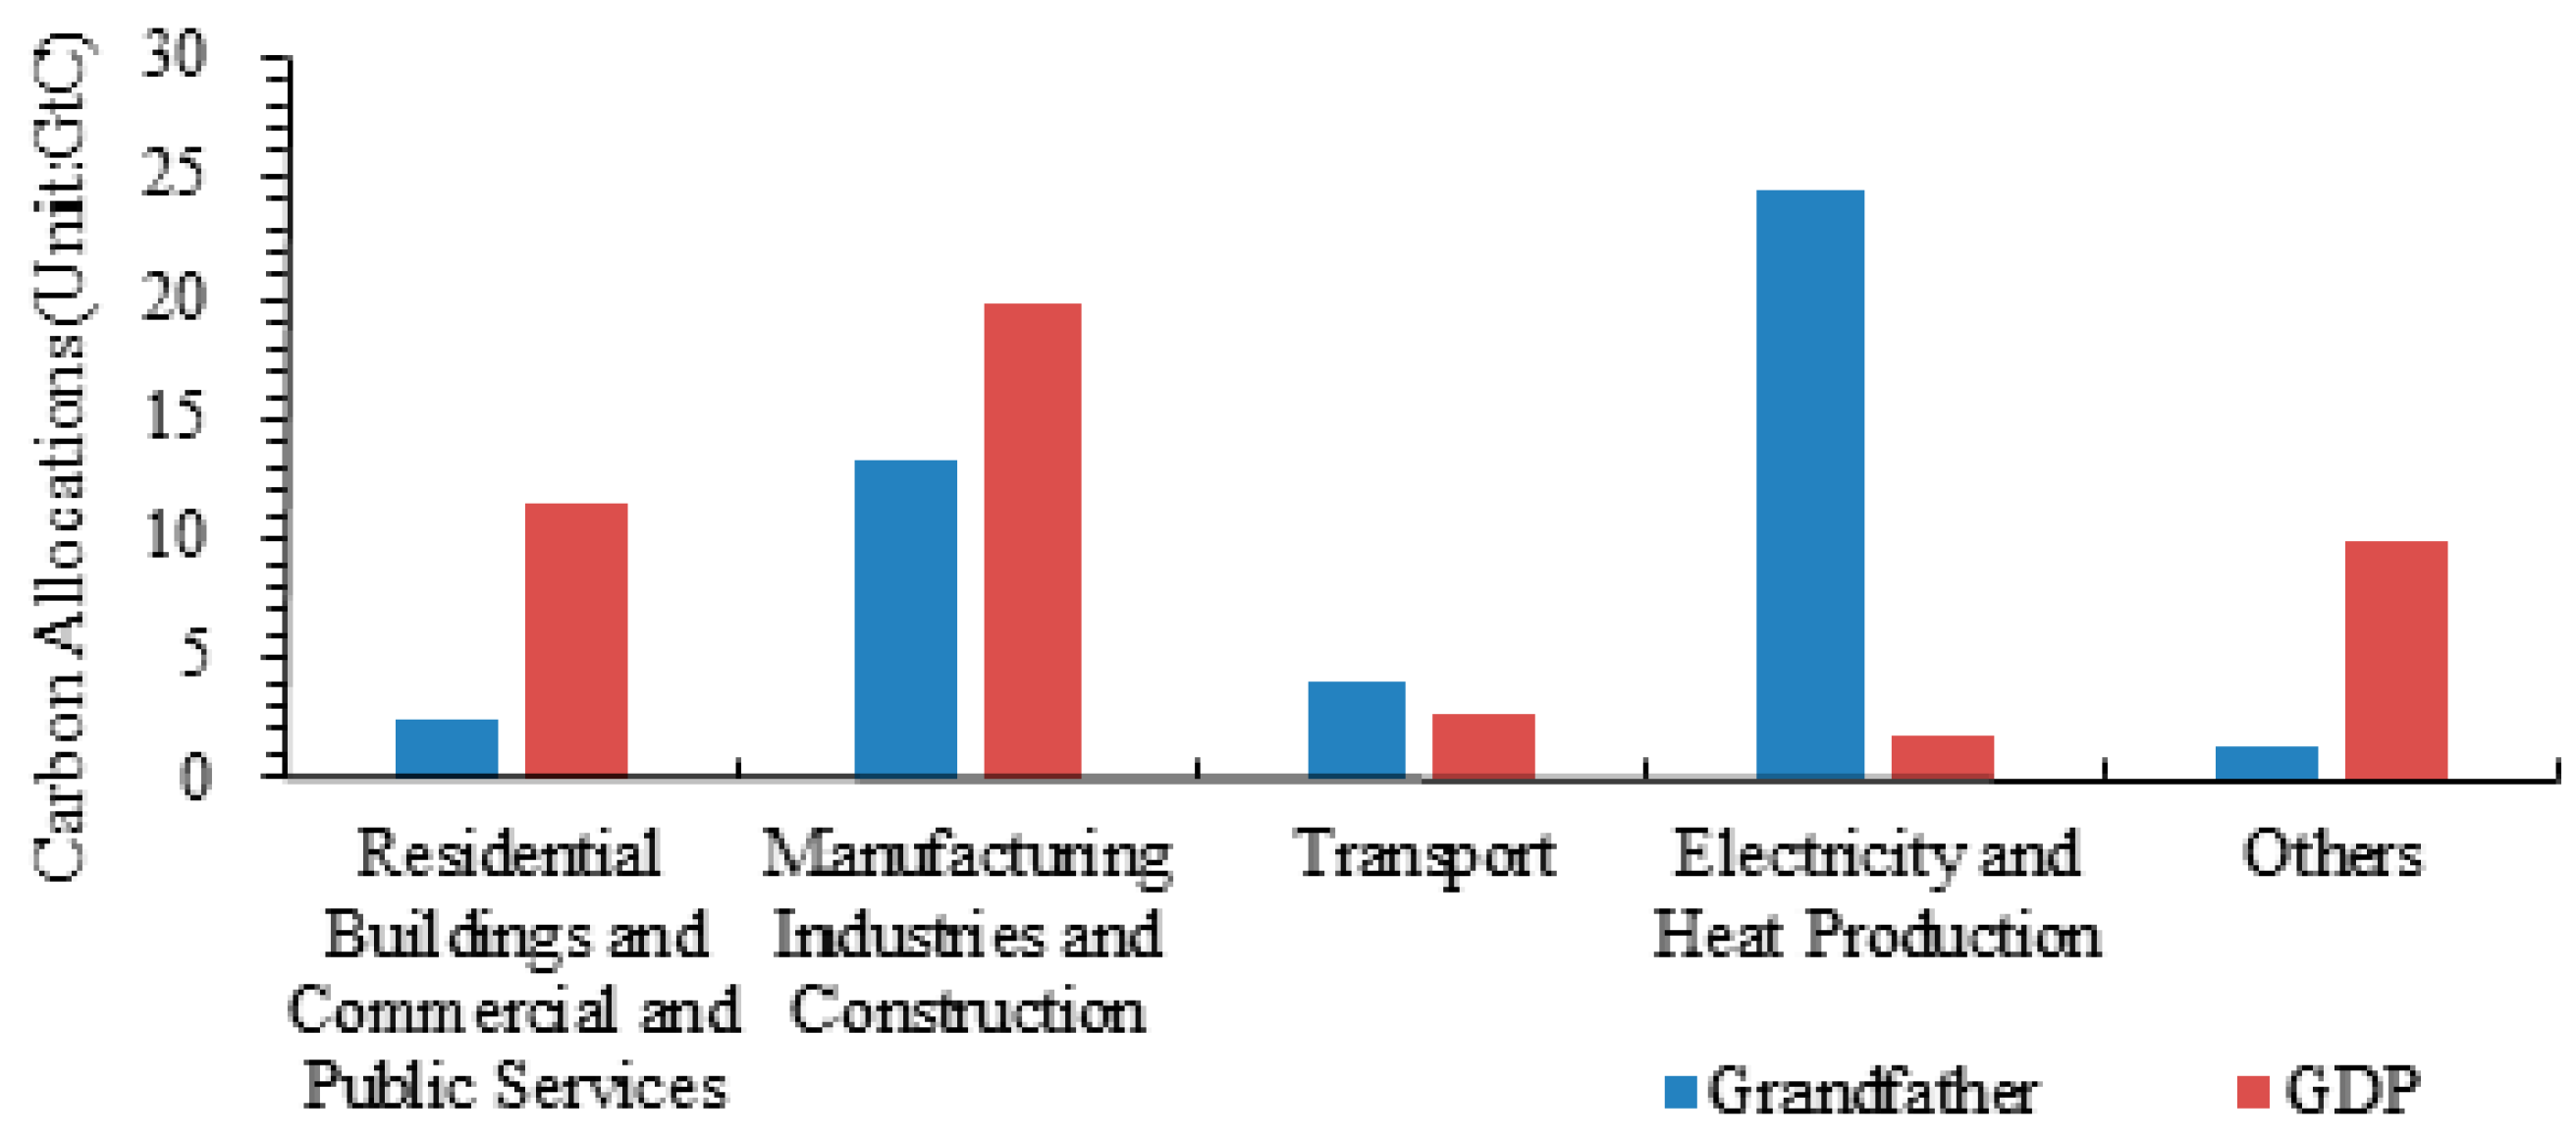
Using Equation (2), we can now allocate NCAs across sectors. Taking the grandfather and output principles as examples (For the definition of the grandfather and output principles, see [7]), carbon emissions and the sector added value are set as the representative indicators for these two principles. Figure 3 shows the SCANs from 2016 to 2030. The results of SCANs under the grandfather and GDP principles show significant differences. Under the grandfather principle, electricity and heat production sectors account for the largest share of the SCANs, and “other” sectors account for the smallest portion. Under the GDP principle, the share of manufacturing and construction sectors becomes the largest, while the share of electricity and heat production sectors shifts from the largest, under the grandfather principle, to the smallest.
In contrast to the quota allocations among provinces in which interdependence exists, it is much easier to determine the allocation principle among sectors. Because of the difference in production methods and product mix among sectors, the adoption of any principles other than the grandfather principle would have a significant impact on most sectors, which is highly impractical. This makes the grandfather principle the only option for inter-sectoral quota allocation.
3.2.2. Sectoral Emission Patterns in Major Countries or Regions
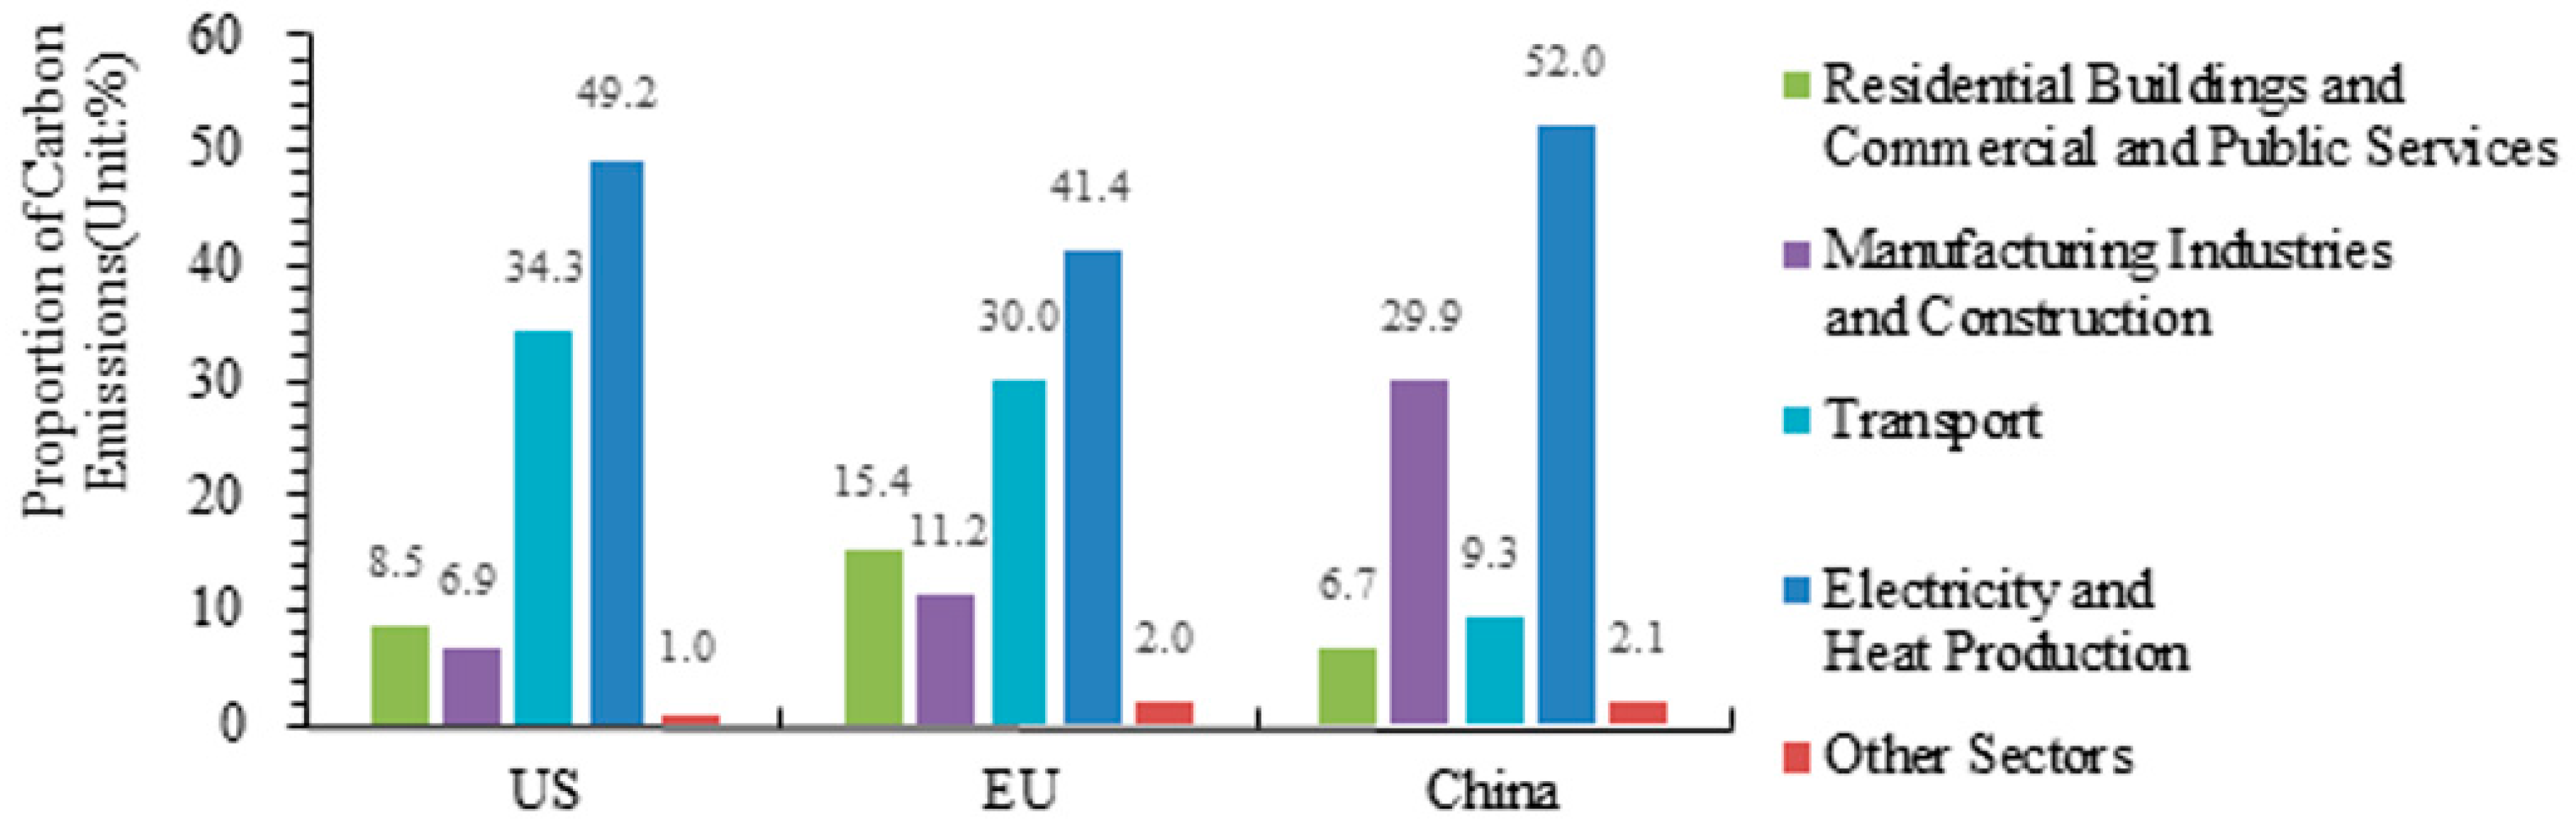
Based on the grandfather principle, China’s NCAs can be allocated among sectors at the national level. However, an important prerequisite for the allocation is to get the future trend of the sectoral carbon emissions structure. Although sectoral carbon emissions vary from country to country, some common features or patterns may be identified that could be of help for inferring this future trend. Therefore, we conducted clustering analysis on the proportion of sectoral carbon emission (To avoid multicollinearity, the clustering process discards the data of the proportion of CO2 emissions from “other sectors” to total emissions.) in major countries (or regions) using the hierarchical clustering method [31] and used the clustering results as China’s alternative sector carbon emission patterns during the peak commitment period. The clustering result (see Table 1) shows that there are two categories of countries (or regions) that are significantly different from China as in Category 3 (where emissions from electricity and heat production sectors contribute most to total emissions), Category 1 (where emissions from the transport sector contribute most to total emissions) and Category 2 (where emissions from the manufacturing and construction sectors contribute most to total emissions). Further analysis finds that the countries (or regions) that fall within Categories 1 and 2 are either economically underdeveloped or less populated. Accounting for the current conditions and future trends of China’s economy and population, our study indicates that China will not shift to either Category 1 or 2 in the future and will more likely remain in Category 3. For this reason, these two categories (1 and 2) were dropped. We then conducted hierarchical clustering analysis on the remaining data (i.e., we focus on emissions from electricity and heat production sectors, contributing most to total emissions). The second clustering results (see Table 1) show that the USA and Canada belong to Category 3-1; the EU and Turkey fall within Category 3-2; and China and India belong to Category 3-3. These categories are referred to as Pattern T, Pattern R and Pattern M, respectively, where all three patterns are dominated by the contribution from electricity and heat production sectors. In Pattern M, the manufacturing and construction sectors significantly contribute to total emissions. In Pattern R, the residential buildings and commercial and public services sectors have a significant contribution to total emissions. In Pattern T, the contribution of the transport sector to total emissions is the second highest (after the dominating contribution from electricity and heat production sectors).
Suppose that China’s sectoral carbon emission structure will not fundamentally change before the peak, meaning that carbon emissions from the electricity and heat production sectors will continue to be the biggest contributors to national carbon emissions. Based on the above clustering results, Patterns M, R and T will be the three alternative target patterns for the future evolution of China’s sectoral carbon emission structure. Since China has become the world’s largest developing country, its policy decision on the future evolution of the sectoral carbon emission structure could be either continual to maintain the current pattern or converge with representative developed countries. According to the clustering results, China, the U.S. and the EU are selected as the representative countries for Patterns M, T and R, respectively, and their sectoral carbon emission trends are extrapolated (Refer to Section 2.1.2 for the process of extrapolation and validation). Figure 4 shows the proportion of the representative countries’ sectoral carbon emissions in 2030.
3.2.3. Comparison of SCANs under Different Target Patterns
According to the trend extrapolation results of the target model, we use Formula (3) to derive the annual value of the representative indicators of five sectors for China from 2016 to 2030. By substituting them into Equation (2), we can allocate the NCAs to sectors based on Patterns M, R and T. The allocation results are shown in Figure 5.
Figure 5 shows that the target patterns change the relative share of the SCANs. In Pattern T, the SCANs for the transport sector and for the residential buildings and commercial and public services sectors increase from 0.28 GtC and 0.14 GtC in 2016 to 1.09 GtC and 0.27 GtC in 2030. The SCANs for the manufacturing and construction sectors decline from 0.81 GtC down to 0.22 GtC during the same period. The remaining two sectors experienced only small changes. In Pattern R, the SCANs for the transport sector and for the residential buildings and commercial and public services sectors increase from 0.27 GtC and 0.15 GtC in 2016 to 0.96 GtC and 0.49 GtC in 2030. The SCANs for the manufacturing and construction sectors and for the electricity and heat production sectors decline from 0.82 GtC and 1.56 GtC to 0.36 GtC and 1.32 GtC, respectively, during the same period. The “other” sectors experienced only small changes. In Pattern M, the SCANs for all sectors increase steadily from 2016 to 2030. Apparently, SCANs show a great difference under alternative target patterns. It is worth mentioning that changes in the SCANs in Pattern R and Pattern T are similar, except for the electricity and heat production sectors where SCANs experienced little change in Pattern T and declined in Pattern R.
The differences in the distribution of SCANs will inevitably lead to diverse preferences for target patterns. Table 2 shows the allocation results of SCANs for all five sectors under the three target patterns from 2016 to 2030. The preference here means that a sector gets more quotas.
It can be seen from Table 2 that the key factor in changing sectoral preferences is the relative size of SCANs across sectors under different target patterns. For example, for given NCAs, a sector always prefers the target pattern that allocates most SCANs to its own. The more SCANs a sector gets under a target pattern compared to those under others, the higher its preference for this target pattern is. In general, the relative size of the SCANs determines the sectoral preference for the target pattern.
3.3. China’s SCAPs and PCAs during the Peak Commitment Period
3.3.1. Provincial Preferences for Carbon Emission Patterns
SCANs can be used to calculate SCAPs using Equation (4). Figure 6 shows the total SCAPs for 30 provinces in China from 2016 to 2030.
Like SCANs, the target pattern is also an important influential factor of SCAPs. However, the preference of the provincial sector for the target pattern is fully consistent with that of the national sector (see Table 2). This is mainly because the target pattern can only change the relative share of the SCANs, and the more the SCANs, the higher the corresponding SCAPs are according to Equation (4).
In addition to the target pattern, SCAPs are also affected by the share of emissions from the provincial sector in the national sector. For example, compared with other provinces, the residential buildings and commercial and public services sectors, the transport sector and the electricity and heat production sectors in Guangdong province account for the largest share of carbon emissions in the corresponding sectors in China. Therefore, carbon allocations for these three sectors in Guangdong are larger than in other provinces. Similarly, the carbon allocations for the manufacturing and construction sectors and “other” sectors in Jiangsu and Shandong provinces will receive the most allocations. In the case that other conditions remain unchanged, the larger the share of emissions from the provincial sector in the national sector, the greater the SCAPs are.
Using SCAPs, PCAs can be aggregated according to Equation (5). Table 3 lists PCAs for 30 provinces in China from 2016 to 2030.
The provincial preference for the target pattern is complex. It depends on the weighted result of all sectoral preferences for the target pattern. The weight here is the share of the sectoral carbon emissions in the province. Therefore, the higher the share, the greater the preference the province would have for the target model that the sector prefers. As Table 3 shows, the number of provinces with a preference for Pattern T is the largest (up to 16), including Hebei, Shanxi and Inner Mongolia. Their sectoral emission structure is mainly characterized by a relatively high proportion of emissions from the transport sector, compared to Patterns M and R. The number of provinces that prefer pattern M is nine, including Liaoning, Shandong and Jiangsu. Their sectoral emissions structure is mainly characterized by a relatively high proportion of emissions from the manufacturing and construction sectors. The number of provinces with a preference for Pattern R is the lowest (only five), including Beijing, Shanghai and Tianjin. Their sectoral emission structure is characterized by a relatively high proportion of emission from the residential buildings and commercial and public services sectors and a relatively low proportion from the manufacturing and construction sectors.
3.3.2. Peaking Pressure at the Provincial Level
Through the allocation of quotas, the peak pressure will be decomposed from the national level to the provincial level by advancing the provincial peak year. Figure 7 shows the peak year of PCAs under the different target patterns.
The NCAs experience a nonlinear change, making the peak PCAs year complex (PCAs are the sum of all SCAPs, which are computed by Equations (2) and (4); where α is linear, β is constant and γ = 1.). In Pattern M, except for Shanxi, Inner Mongolia, Guangxi and Gansu provinces where the peak year advanced to 2029 and Guizhou, Qinghai and Ningxia provinces where the peak years advanced to 2028, the peak years occur in 2030, the same as China’s commitment to its peak year (see Figure 7). This indicates that the current sectoral carbon emission structure of the seven provinces above is quite different from Pattern M, meaning they need to make more adjustments to their sectoral structure than other provinces during the peak commitment. In Patterns R and T, most of the provinces with the peak year advanced are characterized by a relatively high share of carbon emissions from the manufacturing and construction sectors, while the SCAPs for these sectors are significantly reduced. This is mainly because the preference of the provincial sector for the target pattern is consistent with that of the national sector, and the manufacturing and construction sectors prefer Pattern M rather than Patterns T or R (see Table 2). Figure 7 shows that there are eight provinces that advanced their peak year in both Patterns R and T. Among the top four provinces with the largest carbon emissions from manufacturing and construction sectors (i.e., Guangdong, Shandong, Jiangsu and Zhejiang), the total SCAPs for these sectors account for 43% of SCANs, and their average peak year is much earlier than in Pattern M. These two patterns will bring significant challenges to manufacturing and construction sectors in China, especially to the four provinces mentioned above. In other words, these four provinces have to increase the share of carbon emissions from the transport sector or residential buildings and commercial and public services sectors in order to postpone the peak year. In contrast to Pattern T, Shanxi, Hubei, Guangxi and Guizhou provinces also advanced their peak years because of their significant differences in carbon emissions from residential buildings and commercial and public services in Pattern R.
3.4. Sensitivity Analysis
Variation in parameter values may lead to changes in simulation results. It is thus necessary to perform sensitivity analysis on the parameters of our model. In the process of allocating PCAs, the parameter γij is introduced in Equation (4) to illustrate potential changes in the ratio of sectors’ output at the provincial level to sector output at the national level. However, γij is usually uncertain, thus leading to uncertainty in the SCAPs calculated from γij As a result, this uncertainty may lead to a change in the simulation results for target pattern preferences and provincial peak years. Therefore, we designed an experiment to conduct sensitivity analysis on γij to examine whether, and to what degree, the simulation results may change when γij is perturbed. Since the production behavior of provincial sectors is usually path dependent and tends to follow sectoral policies at the national level, we set γij to follow a normal distribution with mean μ = 1 and standard deviation σ (perturbation rate; typically small values). The average annual change in the ratios of sectors output at the provincial level to sector output at the national level in China’s sectors is between ±0.05 (According to the database of China’s National Bureau of Statistics from 2008 to 2015.). Considering that target patterns have largely reflected the average annual change trend of γij, the perturbation rate σ (the standard deviation of γij) should be kept less than 0.05. Thus, in this sensitivity analysis experiment, we design three treatments by setting σ to 0.01, 0.02 and 0.05, respectively. For each treatment, we perform 100 Monte Carlo runs.
The sensitivity analysis results (see Table A3, Table A4 and Table A5 in Appendix C) show that, compared with Table 3, the absolute value of PCAs from 2016 to 2030 may vary with the increase in the perturbation rate σ. However, the preference of more than half of the provinces (16) for the target patterns remains unchanged, such as Beijing, Hebei and Liaoning. On the other hand, 14 provinces, such as Zhejiang, Anhui and Chongqing, tend to adjust their preference for target patterns. The main feature of these provinces that maintain their preference for a target pattern is that the contribution of some sector (or sectors) to the total emissions is significantly higher than that of others and consistent with the target pattern. For example, Beijing with dominant residential buildings and commercial and public services sectors always prefers pattern R. A high proportion of manufacturing and construction sectors in Liaoning province makes it always prefer Pattern M. The transport sector dominating in Hebei province leads to a stable, preferred Pattern T in response to perturbation. In other words, the more significant the sectoral carbon emission structure in provinces, the more stable the provincial preference for target patterns would be in the face of uncertainty, for example changes in the ratio of sector output at the provincial level to sector output at the national level here.
The mean and standard deviation of provincial peak years for the three treatments of the sensitivity analysis experiment are reported in Table A6, Table A7 and Table A8 in Appendix D. Further analysis revealed that the reason for advancing the provincial peak year was due to the inconsistency between the sectoral carbon emissions structure and the target patterns. The larger the gap between them, the more the provincial peak year will be advanced. Small perturbation (treatment 1; σ = 0.01) leads to marginal change in provincial peak year. For example, the means of provincial peak years in Table A6 remain almost the same as the peak year of PCAs in Figure 7. With the increase of σ, the provincial peak years are advanced to some extent. It is mainly because larger σ increases the possibility of the difference between the sectoral carbon emissions structure and the target patterns. Therefore, the larger the perturbation, the more the provincial peak years (with higher variation) would be advanced. Thus, to accurately estimate the peak years in advance, it is necessary to combine the planning of the future sectoral carbon emissions structure so as to reduce the uncertainty of change in the provincial sectoral carbon emissions structure.
4. Conclusions
In this study, we presented a model that combines top-down and bottom-up carbon allocation processes to overcome difficulties that traditional methods may face, including the dynamics of the distribution principle, the independence of allocations entities and data availability. By using clustering analysis and scenario simulation, we have the following five conclusions:
First, China’s NCAs range from 45.51 GtC to 47.91 GtC during the peak commitment period. In contrast to allocating NCAs to provinces, it is much easier to determine the allocation principle among sectors. The grandfather principle is the best and only option. In the future, China’s carbon emissions pattern will be dominated by the contribution from electricity and heat production sectors. This emission pattern can be further distinguished into three categories (Patterns M, R and T), in which other types of sectors (manufacturing and construction, residential buildings and commercial and public services and transport) have significant contributions to total emission while electricity and heat production sectors dominate the emission.
Second, peak scenarios and emission patterns are two factors that can affect SCANs. The former sets the absolute size of the quotas for each sector, while the latter adjusts the relative share of quotas among the sectors. In terms of sectoral preferences, manufacturing and construction sectors, electricity and heat production sectors and “other” sectors prefer Pattern M; residential buildings and commercial and public services sectors prefer Pattern R; and the transport sector prefers Pattern T. Although the preferences vary from sector to sector, they are consistent at the national and provincial level.
Third, compared with sectoral preferences, provincial preferences are more complex. There are 16 provinces with a significant amount of transport sectoral carbon emissions (i.e., the preferred pattern is T), consisting of Hebei, Shanxi and Inner Mongolia. Nine provinces that have a high proportion of manufacturing and construction sector emissions (i.e., Pattern M is preferred) are represented by Guangdong, Shandong and Jiangsu. There exist five provinces with heavy residential construction and commercial and public service sector emissions that have a preference for Pattern R, including Beijing, Shanghai and Tianjin.
Fourth, to achieve peak commitment for China, different provinces are facing alternative peak pressures. In the case of the quadratic scenario, Pattern R affected the largest number of provinces (up to 12), followed by Patterns T and M (eight and seven provinces). In the future, if China adopts either Pattern R or T, the manufacturing- and construction-oriented provinces will face higher pressure, especially Jiangsu, Zhejiang, Shandong and Guangxi provinces. In order to postpone the peak year, they may have to increase the share of carbon emissions from the transport sector or residential buildings and commercial and public services sectors.
Last, sensitivity analysis show that the more significant the sectoral carbon emission structure in provinces, the more stable the provincial preference for target patterns would be in face of uncertainty. In addition, the larger the perturbation (standard deviation σ of γ), the more the provincial peak years (with higher variation) would be advanced.
In summary, our model that combines both bottom-up and top-down processes provides support for decision-making related to carbon allocation in China. This combined modeling approach may provide insight into understanding the complexity of carbon allocation in other countries. We will focus on the following directions for future work. First, to make the carbon allocation results more robust, an analysis using IPCC [26] sectoral projections will be carried out once relevant data for the IPCC sectoral projections are available. Second, spatial analysis (e.g., spatial autocorrelation) will be conducted to reveal the spatially-explicit characteristics (e.g., hotspots) of carbon allocation at the province level in terms of sectoral preference and peak years. Third, an agent-based simulation modeling approach will be used to better represent the potential interactions among alternative sectors of different provinces in terms of carbon allocation.
Acknowledgments
The authors would like to thank the School of Business Administration, China University of Petroleum in Beijing and the Center for Applied Geographic Information Science, the University of North Carolina at Charlotte. This work is supported by the National Science Foundation for Young Scholar of China (41501127), the National Basic Research Program of China (973 Program No. 2012CB955800) and the National Social Science Foundation for Young Scholar of China (14CGJ025).
Author Contributions
Qianting Zhu performed the modeling, collected the data and wrote most of the manuscript. Wenwu Tang analyzed the methodology and helped to write and revise the manuscript.
Conflicts of Interest
The authors declare no conflicts of interest. The funding sponsors had no role in the design of the study, the collection, analyses or interpretation of data, the writing of the manuscript, nor in the decision to publish the results.
Appendix A

Table A1.
Abbreviations for the paper.
| Definition | Abbreviation |
|---|---|
| United Nations Framework Convention on Climate Change | UNFCCC |
| National carbon allocations | NCAs |
| Provincial carbon allocations | PCAs |
| Sectoral carbon allocations at the national level | SCANs |
| Sectoral carbon allocations at the provincial level | SCAPs |
Appendix B
Table A2.
Sectoral reunification.
| 17 Sectors |  | 5 Sectors |  | 42 Sectors |
|---|---|---|---|---|
| Commercial catering Public utilities and residential services Finance and insurance Other services | Residential buildings and commercial and public services | Information transmission, computer services and software Wholesale and retail trade Accommodation and catering Financial industry Real estate industry Leasing and business services Research and experimental development Integrated technical service industry Water conservancy, environment and public facilities management Resident services and other services Education Health, social security and social welfare Culture, sports and entertainment Public administration and social organization | ||
| Food industry Textile, sewing and leather products manufacturing Other manufacturing industries Coking, gas and petroleum processing industries Chemical industry Building materials and other non-metallic mineral products industry Metal product manufacturing Machinery and equipment manufacturing Construction industry | Manufacturing and construction | Food manufacturing and tobacco processing Textile industry Textile, clothing, footwear, leather, down and related products Wood processing and furniture manufacturing Paper and printing and cultural, educational and sporting goods manufacturing industry Petroleum processing, coking and nuclear fuel processing Chemical industry Non-metallic mineral products industry Metal smelting and rolling processing industry Metal products industry General, special equipment manufacturing industry Transportation equipment manufacturing Electrical machinery and equipment Communications equipment, computers and other electronic equipment manufacturing Instruments, cultural and office machinery manufacturing Handicrafts and other manufacturing industries Waste materials Construction industry | ||
| Transportation, post and telecommunications services | Transport | Transportation and Warehousing Postal service | ||
| Electricity and steam, hot water production and supply | Electricity and heat production | Electricity, heat production and supply Gas production and supply Water production and supply | ||
| Agriculture | “other” | Agriculture, forestry, animal husbandry and fishery | ||
| Mining industry | Coal mining and washing industry Petroleum and natural gas industries Mining and dressing of metals Non-metallic mineral and other mining industry | |||
Appendix C. Provincial Preference for Target Patterns for Different Perturbations on γ
Table A3.
Provincial preference for target patterns (perturbation rate: standard deviation σ = 0.01).
Table A3.
Provincial preference for target patterns (perturbation rate: standard deviation σ = 0.01).
| Region | Pattern T | Pattern R | Pattern M | Region | Pattern T | Pattern R | Pattern M | ||||||
|---|---|---|---|---|---|---|---|---|---|---|---|---|---|
| Mean | SD | Mean | SD | Mean | SD | Mean | SD | Mean | SD | Mean | SD | ||
| Beijing # | 1.45 | 0.01 | 1.48 * | 0.01 | 1.29 | 0.02 | Henan | 2.41 | 0.05 | 2.41 | 0.04 | 2.42 * | 0.05 |
| Tianjin # | 0.75 | 0.02 | 0.76 * | 0.02 | 0.75 | 0.02 | Hubei # | 1.851 * | 0.07 | 1.83 | 0.06 | 1.848 | 0.07 |
| Hebei # | 2.59 * | 0.04 | 2.54 | 0.04 | 2.43 | 0.05 | Hunan | 1.64 * | 0.05 | 1.63 | 0.04 | 1.62 | 0.05 |
| Shanxi # | 1.31 * | 0.05 | 1.27 | 0.05 | 1.29 | 0.04 | Guangdong | 5.34 | 0.06 | 5.36 | 0.06 | 5.52 * | 0.08 |
| Inner Mongolia # | 1.75 * | 0.05 | 1.67 | 0.05 | 1.64 | 0.05 | Guangxi | 1.10 * | 0.02 | 1.08 | 0.02 | 1.08 | 0.02 |
| Liaoning # | 1.82 | 0.03 | 1.826 | 0.03 | 1.832 * | 0.02 | Hainan # | 0.210 * | 0.00 | 0.206 | 0.00 | 0.19 | 0.00 |
| Jilin # | 0.64 | 0.01 | 0.66 * | 0.01 | 0.64 | 0.01 | Chongqing | 0.81 * | 0.03 | 0.80 | 0.03 | 0.80 | 0.04 |
| Heilongjiang | 1.055 * | 0.01 | 1.050 | 0.01 | 1.01 | 0.01 | Sichuan | 1.775 * | 0.03 | 1.76 | 0.03 | 1.767 | 0.03 |
| Shanghai # | 1.91 | 0.03 | 1.94 * | 0.03 | 1.90 | 0.05 | Guizhou # | 0.84 * | 0.02 | 0.80 | 0.02 | 0.82 | 0.02 |
| Jiangsu # | 3.61 | 0.11 | 3.70 | 0.10 | 3.93 * | 0.11 | Yunnan # | 0.815 | 0.02 | 0.81 | 0.02 | 0.819 * | 0.02 |
| Zhejiang | 2.68 | 0.22 | 2.76 | 0.20 | 2.77 * | 0.22 | Shaanxi # | 0.98 * | 0.02 | 0.96 | 0.02 | 0.95 | 0.02 |
| Anhui | 1.217 | 0.02 | 1.219 * | 0.02 | 1.19 | 0.02 | Gansu # | 0.57 * | 0.02 | 0.56 | 0.01 | 0.55 | 0.02 |
| Fujian | 1.69 * | 0.02 | 1.67 | 0.02 | 1.63 | 0.03 | Qinghai | 0.2322 * | 0.01 | 0.22 | 0.01 | 0.2320 | 0.01 |
| Jiangxi | 0.88 | 0.02 | 0.88 | 0.01 | 0.89 * | 0.02 | Ningxia | 0.294 * | 0.01 | 0.28 | 0.01 | 0.289 | 0.01 |
| Shandong # | 3.52 | 0.07 | 3.57 | 0.07 | 3.66 * | 0.06 | Xinjiang | 0.475 | 0.01 | 0.477 * | 0.01 | 0.44 | 0.01 |
Table A4.
Provincial preference for target patterns (perturbation rate: standard deviation σ = 0.02).
Table A4.
Provincial preference for target patterns (perturbation rate: standard deviation σ = 0.02).
| Region | Pattern T | Pattern R | Pattern M | Region | Pattern T | Pattern R | Pattern M | ||||||
|---|---|---|---|---|---|---|---|---|---|---|---|---|---|
| Mean | SD | Mean | SD | Mean | SD | Mean | SD | Mean | SD | Mean | SD | ||
| Beijing # | 1.41 | 0.03 | 1.45 * | 0.03 | 1.31 | 0.04 | Henan | 2.301 | 0.09 | 2.302 * | 0.09 | 2.22 | 0.13 |
| Tianjin # | 0.745 | 0.06 | 0.752 * | 0.05 | 0.71 | 0.06 | Hubei # | 1.714 * | 0.06 | 1.69 | 0.06 | 1.707 | 0.05 |
| Hebei # | 2.41 * | 0.05 | 2.38 | 0.04 | 2.33 | 0.04 | Hunan | 1.70 * | 0.05 | 1.68 | 0.05 | 1.68 | 0.05 |
| Shanxi # | 1.26 * | 0.11 | 1.23 | 0.10 | 1.21 | 0.10 | Guangdong | 6.16 * | 0.29 | 6.08 | 0.27 | 6.14 | 0.26 |
| Inner Mongolia # | 1.59 * | 0.08 | 1.53 | 0.08 | 1.48 | 0.10 | Guangxi | 1.050 * | 0.03 | 1.045 | 0.03 | 1.045 | 0.03 |
| Liaoning # | 1.78 | 0.05 | 1.78 | 0.05 | 1.83 * | 0.05 | Hainan # | 0.23 * | 0.02 | 0.22 | 0.02 | 0.21 | 0.01 |
| Jilin # | 0.62 | 0.02 | 0.63 * | 0.03 | 0.60 | 0.03 | Chongqing | 0.76 * | 0.02 | 0.75 | 0.02 | 0.75 | 0.02 |
| Heilongjiang | 1.07 * | 0.05 | 1.06 | 0.05 | 1.04 | 0.05 | Sichuan | 1.74 | 0.10 | 1.76 | 0.11 | 1.77 * | 0.12 |
| Shanghai # | 1.80 | 0.06 | 1.83 * | 0.06 | 1.78 | 0.05 | Guizhou # | 0.87 * | 0.03 | 0.83 | 0.03 | 0.86 | 0.04 |
| Jiangsu # | 3.36 | 0.13 | 3.46 | 0.12 | 3.58 * | 0.14 | Yunnan # | 0.76 | 0.02 | 0.76 | 0.02 | 0.77 * | 0.02 |
| Zhejiang | 3.11 | 0.55 | 3.16 | 0.52 | 3.40 * | 0.60 | Shaanxi # | 0.98 * | 0.02 | 0.97 | 0.02 | 0.95 | 0.02 |
| Anhui | 1.14 | 0.03 | 1.15 * | 0.02 | 1.11 | 0.03 | Gansu # | 0.55 * | 0.02 | 0.54 | 0.02 | 0.53 | 0.02 |
| Fujian | 1.64 * | 0.04 | 1.62 | 0.04 | 1.57 | 0.04 | Qinghai | 0.20 | 0.02 | 0.20 | 0.01 | 0.21 * | 0.01 |
| Jiangxi | 0.898 * | 0.03 | 0.895 | 0.03 | 0.88 | 0.03 | Ningxia | 0.26 * | 0.01 | 0.25 | 0.01 | 0.25 | 0.01 |
| Shandong # | 3.62 | 0.10 | 3.70 | 0.10 | 3.79 * | 0.14 | Xinjiang | 0.50 * | 0.02 | 0.49 | 0.02 | 0.46 | 0.01 |
Table A5.
Provincial preference for target patterns (perturbation rate: standard deviation σ = 0.05).
Table A5.
Provincial preference for target patterns (perturbation rate: standard deviation σ = 0.05).
| Region | Pattern T | Pattern R | Pattern M | Region | Pattern T | Pattern R | Pattern M | ||||||
|---|---|---|---|---|---|---|---|---|---|---|---|---|---|
| Mean | SD | Mean | SD | Mean | SD | Mean | SD | Mean | SD | Mean | SD | ||
| Beijing # | 1.68 | 0.16 | 1.69 * | 0.15 | 1.55 | 0.17 | Henan | 2.44 | 0.28 | 2.49 * | 0.29 | 2.39 | 0.30 |
| Tianjin # | 0.68 | 0.07 | 0.70 * | 0.07 | 0.69 | 0.07 | Hubei # | 2.32 * | 0.29 | 2.26 | 0.27 | 2.21 | 0.25 |
| Hebei # | 2.06 * | 0.26 | 2.04 | 0.25 | 1.96 | 0.29 | Hunan | 2.03 | 0.30 | 1.97 | 0.28 | 2.04 * | 0.34 |
| Shanxi # | 1.03 * | 0.12 | 1.00 | 0.12 | 0.97 | 0.14 | Guangdong | 4.32 | 0.60 | 4.50 | 0.54 | 4.65 * | 0.54 |
| Inner Mongolia # | 1.11 * | 0.26 | 1.07 | 0.24 | 1.04 | 0.21 | Guangxi | 1.10 | 0.10 | 1.10 | 0.09 | 1.16 * | 0.09 |
| Liaoning # | 2.03 | 0.15 | 2.05 | 0.16 | 2.14 * | 0.23 | Hainan # | 0.244 * | 0.02 | 0.239 | 0.02 | 0.23 | 0.02 |
| Jilin # | 0.60 | 0.03 | 0.61 * | 0.03 | 0.58 | 0.03 | Chongqing | 0.84 | 0.09 | 0.85 | 0.09 | 0.96 * | 0.15 |
| Heilongjiang | 0.93 | 0.13 | 0.96 | 0.12 | 0.98 * | 0.10 | Sichuan | 1.75 * | 0.13 | 1.73 | 0.12 | 1.62 | 0.12 |
| Shanghai # | 1.63 | 0.12 | 1.66 * | 0.12 | 1.63 | 0.12 | Guizhou # | 0.69 * | 0.15 | 0.65 | 0.14 | 0.65 | 0.16 |
| Jiangsu # | 3.98 | 0.79 | 3.91 | 0.73 | 4.02 * | 0.86 | Yunnan # | 0.62 | 0.14 | 0.64 | 0.13 | 0.65 * | 0.14 |
| Zhejiang | 5.53 * | 1.34 | 5.50 | 1.25 | 5.29 | 1.22 | Shaanxi # | 0.733 * | 0.08 | 0.731 | 0.08 | 0.71 | 0.08 |
| Anhui | 1.29 * | 0.10 | 1.28 | 0.09 | 1.22 | 0.11 | Gansu # | 0.61 * | 0.05 | 0.60 | 0.04 | 0.60 | 0.05 |
| Fujian | 1.77 | 0.20 | 1.78 | 0.20 | 1.89 * | 0.21 | Qinghai | 0.22 | 0.02 | 0.21 | 0.02 | 0.23 * | 0.02 |
| Jiangxi | 0.70 | 0.07 | 0.72 | 0.06 | 0.73 * | 0.07 | Ningxia | 0.26 | 0.04 | 0.25 | 0.04 | 0.27 * | 0.05 |
| Shandong # | 2.50 | 0.53 | 2.54 | 0.51 | 2.68 * | 0.47 | Xinjiang | 0.465 | 0.04 | 0.469 * | 0.03 | 0.44 | 0.03 |
SD: standard deviation; * the most preferred target pattern for each province; # provincial preference remains unchanged for the same target pattern under all 3 treatments of sensitivity analysis.
Appendix D. Provincial Peaking Years for Different Perturbations on γ
Table A6.
Provincial peaking years for perturbation rate (standard deviation) σ = 0.01.
| Region | Pattern T | Pattern R | Pattern M | Region | Pattern T | Pattern R | Pattern M | ||||||
|---|---|---|---|---|---|---|---|---|---|---|---|---|---|
| Mean | SD | Mean | SD | Mean | SD | Mean | SD | Mean | SD | Mean | SD | ||
| Beijing | 2030 | 0.00 | 2030 | 0.00 | 2030 | 0.00 | Henan | 2030 | 0.59 | 2030 | 0.00 | 2030 | 0.00 |
| Tianjin | 2030 | 0.10 | 2030 | 0.00 | 2030 | 0.00 | Hubei | 2030 | 0.46 | 2029 | 0.44 | 2030 | 0.45 |
| Hebei | 2030 | 0.00 | 2030 | 0.00 | 2030 | 0.00 | Hunan | 2030 | 0.00 | 2030 | 0.38 | 2030 | 0.00 |
| Shanxi | 2030 | 0.00 | 2029 | 1.14 | 2029 | 0.34 | Guangdong | 2025 | 0.62 | 2025 | 0.81 | 2030 | 0.49 |
| Inner Mongolia | 2030 | 0.00 | 2030 | 0.17 | 2029 | 0.00 | Guangxi | 2030 | 0.34 | 2029 | 0.92 | 2029 | 0.17 |
| Liaoning | 2030 | 0.24 | 2030 | 0.17 | 2030 | 0.00 | Hainan | 2030 | 0.00 | 2030 | 0.00 | 2030 | 0.00 |
| Jilin | 2030 | 0.00 | 2030 | 0.00 | 2030 | 0.00 | Chongqing | 2030 | 0.00 | 2030 | 0.00 | 2030 | 0.00 |
| Heilongjiang | 2030 | 0.00 | 2030 | 0.00 | 2030 | 0.00 | Sichuan | 2029 | 0.61 | 2029 | 0.85 | 2030 | 0.38 |
| Shanghai | 2030 | 0.00 | 2030 | 0.00 | 2030 | 0.00 | Guizhou | 2030 | 0.41 | 2025 | 0.58 | 2028 | 0.00 |
| Jiangsu | 2021 | 0.77 | 2024 | 1.24 | 2030 | 0.00 | Yunnan | 2027 | 0.50 | 2027 | 0.28 | 2030 | 0.44 |
| Zhejiang | 2024 | 0.93 | 2025 | 1.39 | 2030 | 0.00 | Shaanxi | 2030 | 0.14 | 2030 | 0.59 | 2030 | 0.50 |
| Anhui | 2030 | 0.00 | 2030 | 0.00 | 2030 | 0.00 | Gansu | 2030 | 0.00 | 2030 | 0.32 | 2030 | 0.00 |
| Fujian | 2030 | 0.00 | 2030 | 0.00 | 2030 | 0.00 | Qinghai | 2027 | 0.73 | 2023 | 0.62 | 2028 | 0.00 |
| Jiangxi | 2030 | 0.00 | 2030 | 0.00 | 2030 | 0.00 | Ningxia | 2029 | 0.58 | 2024 | 0.66 | 2028 | 0.00 |
| Shandong | 2026 | 0.99 | 2028 | 0.74 | 2030 | 0.00 | Xinjiang | 2030 | 0.00 | 2030 | 0.00 | 2030 | 0.00 |
Table A7.
Provincial peaking years when perturbation rate (standard deviation) σ = 0.02.
| Region | Pattern T | Pattern R | Pattern M | Region | Pattern T | Pattern R | Pattern M | ||||||
|---|---|---|---|---|---|---|---|---|---|---|---|---|---|
| Mean | SD | Mean | SD | Mean | SD | Mean | SD | Mean | SD | Mean | SD | ||
| Beijing | 2030 | 0.00 | 2030 | 0.00 | 2030 | 0.00 | Henan | 2029 | 1.06 | 2029 | 0.82 | 2030 | 0.00 |
| Tianjin | 2030 | 0.54 | 2029 | 1.51 | 2030 | 0.76 | Hubei | 2029 | 0.98 | 2028 | 1.02 | 2027 | 1.31 |
| Hebei | 2030 | 0.44 | 2029 | 0.97 | 2029 | 0.43 | Hunan | 2030 | 0.27 | 2030 | 0.38 | 2030 | 0.29 |
| Shanxi | 2029 | 0.94 | 2028 | 1.17 | 2029 | 0.51 | Guangdong | 2025 | 1.62 | 2025 | 1.93 | 2030 | 0.64 |
| Inner Mongolia | 2030 | 0.00 | 2030 | 0.47 | 2029 | 0.84 | Guangxi | 2030 | 0.44 | 2028 | 1.47 | 2029 | 0.36 |
| Liaoning | 2030 | 0.27 | 2029 | 0.82 | 2029 | 0.91 | Hainan | 2030 | 0.00 | 2030 | 0.00 | 2030 | 0.00 |
| Jilin | 2030 | 0.86 | 2030 | 1.05 | 2030 | 0.00 | Chongqing | 2030 | 0.10 | 2030 | 0.30 | 2030 | 0.00 |
| Heilongjiang | 2030 | 0.00 | 2030 | 0.00 | 2030 | 0.00 | Sichuan | 2028 | 0.82 | 2027 | 1.79 | 2027 | 1.94 |
| Shanghai | 2030 | 0.00 | 2030 | 0.00 | 2030 | 0.00 | Guizhou | 2030 | 0.81 | 2025 | 0.61 | 2028 | 1.14 |
| Jiangsu | 2020 | 1.61 | 2022 | 2.19 | 2028 | 1.14 | Yunnan | 2027 | 1.35 | 2027 | 0.55 | 2030 | 0.50 |
| Zhejiang | 2024 | 1.84 | 2025 | 1.91 | 2030 | 0.00 | Shaanxi | 2029 | 0.96 | 2028 | 1.14 | 2029 | 0.57 |
| Anhui | 2030 | 0.00 | 2030 | 0.00 | 2030 | 0.00 | Gansu | 2030 | 0.47 | 2029 | 0.47 | 2030 | 0.38 |
| Fujian | 2030 | 0.00 | 2030 | 0.00 | 2030 | 0.00 | Qinghai | 2027 | 1.07 | 2023 | 0.98 | 2028 | 0.52 |
| Jiangxi | 2030 | 0.00 | 2030 | 0.00 | 2030 | 0.00 | Ningxia | 2028 | 1.18 | 2024 | 1.39 | 2028 | 1.26 |
| Shandong | 2025 | 1.29 | 2028 | 1.35 | 2029 | 1.25 | Xinjiang | 2030 | 0.00 | 2030 | 0.00 | 2030 | 0.00 |
Table A8.
Provincial peaking years when perturbation rate (standard deviation) σ = 0.05.
| Region | Pattern T | Pattern R | Pattern M | Region | Pattern T | Pattern R | Pattern M | ||||||
|---|---|---|---|---|---|---|---|---|---|---|---|---|---|
| Mean | SD | Mean | SD | Mean | SD | Mean | SD | Mean | SD | Mean | SD | ||
| Beijing | 2030 | 0.00 | 2030 | 0.00 | 2030 | 0.22 | Henan | 2027 | 1.47 | 2028 | 1.36 | 2030 | 0.00 |
| Tianjin | 2030 | 1.00 | 2029 | 2.65 | 2029 | 0.80 | Hubei | 2029 | 1.57 | 2028 | 1.24 | 2027 | 2.14 |
| Hebei | 2030 | 0.82 | 2028 | 2.53 | 2029 | 0.80 | Hunan | 2027 | 2.12 | 2026 | 2.60 | 2029 | 0.44 |
| Shanxi | 2029 | 0.60 | 2026 | 2.53 | 2028 | 0.67 | Guangdong | 2023 | 2.94 | 2021 | 3.58 | 2030 | 0.70 |
| Inner Mongolia | 2030 | 0.00 | 2030 | 0.50 | 2029 | 0.95 | Guangxi | 2027 | 2.30 | 2025 | 1.70 | 2028 | 0.49 |
| Liaoning | 2028 | 1.27 | 2027 | 2.80 | 2029 | 1.80 | Hainan | 2030 | 0.00 | 2030 | 0.00 | 2030 | 0.00 |
| Jilin | 2030 | 1.14 | 2030 | 1.20 | 2030 | 0.00 | Chongqing | 2027 | 1.68 | 2027 | 2.09 | 2029 | 0.52 |
| Heilongjiang | 2027 | 2.17 | 2027 | 2.56 | 2029 | 0.59 | Sichuan | 2027 | 1.36 | 2026 | 2.32 | 2026 | 2.43 |
| Shanghai | 2030 | 0.20 | 2030 | 0.00 | 2030 | 0.00 | Guizhou | 2030 | 0.40 | 2024 | 2.13 | 2028 | 1.49 |
| Jiangsu | 2020 | 2.05 | 2022 | 3.30 | 2026 | 3.14 | Yunnan | 2026 | 2.98 | 2027 | 2.11 | 2030 | 0.80 |
| Zhejiang | 2024 | 2.25 | 2025 | 2.26 | 2027 | 1.19 | Shaanxi | 2029 | 1.00 | 2028 | 1.13 | 2028 | 0.71 |
| Anhui | 2027 | 2.22 | 2027 | 2.47 | 2030 | 0.00 | Gansu | 2027 | 3.38 | 2026 | 2.60 | 2028 | 0.46 |
| Fujian | 2027 | 2.52 | 2027 | 2.17 | 2030 | 0.49 | Qinghai | 2026 | 1.41 | 2023 | 2.28 | 2028 | 1.65 |
| Jiangxi | 2030 | 0.10 | 2030 | 0.10 | 2030 | 0.31 | Ningxia | 2028 | 2.34 | 2024 | 1.70 | 2027 | 2.31 |
| Shandong | 2023 | 3.45 | 2024 | 2.40 | 2029 | 1.41 | Xinjiang | 2026 | 2.83 | 2025 | 4.11 | 2029 | 0.86 |
SD: standard deviation.
References
- UNFCCC. Report of the Conference of the Parties on Its Twenty-First Session. Available online: http://unfccc.int/resource/docs/2015/cop21/eng/10.pdf (accessed on 1 December 2016).
- UNFCCC. Kyoto Protocol. Available online: http://unfccc.int/resource/docs/convkp/kpeng.pdf (accessed on 1 December 2016).
- Sands, P. The United Nations framework convention on climate change. Rev. Eur. Commun. Int. Environ. Law 1992, 1, 270–277. [Google Scholar] [CrossRef]
- Böhringer, C.; Lange, A. On the design of optimal grandfathering schemes for emission allowances. Eur. Econ. Rev. 2005, 49, 2041–2055. [Google Scholar] [CrossRef]
- Stern, N.H. The Economics of Climate Change: the Stern Review; Cambridge University press: Cambridge, UK, 2007. [Google Scholar]
- Den Elzen, M.G.J.; Berk, M.; Lucas, P.; Criqui, P.; Kitous, A. Multi-Stage: A rule-based evolution of future commitments under the Climate Change Convention. Int. Environ. Agreem. Politics Law Econ. 2006, 6, 1–28. [Google Scholar] [CrossRef]
- Rose, A.; Stevens, B.; Edmonds, J. International equity and differentiation in global warming policy. Environ. Resour. Econ. 1998, 12, 25–51. [Google Scholar] [CrossRef]
- Van Steenberghe, V. Core-Stable and Equitable Allocations of Greenhouse Gas Emission Permits. Available online: https://papers.ssrn.com/soL3/papers.cfm?abstract_id=683162 (accessed on 2 April 2017).
- Cazorla, M.; Toman, M. International equity and climate change policy. Integr. Assess. 2001, 1, 111–126. [Google Scholar]
- An, Q.; Wen, Y.; Xiong, B.; Yang, M.; Chen, X. Allocation of carbon dioxide emission permits with the minimum cost for Chinese provinces in big data environment. J. Clean. Prod. 2016, 142, 886–893. [Google Scholar] [CrossRef]
- Zhang, Y.J.; Hao, J.F. Carbon emission quota allocation among China’s industrial sectors based on the equity and efficiency principles. Ann. Oper. Res. 2016. [Google Scholar] [CrossRef]
- Lin, T.; Ning, J. The research on the carbon emission permit allocative efficiency in EU countries based on zero and DEA model. J. Quant. Tech. Econ. 2011, 3, 36–50. [Google Scholar]
- Park, J.W.; Kim, C.U.; Isard, W. Permit allocation in emissions trading using the Boltzmann distribution. Phys. A Stat. Mech. Appl. 2012, 391, 4883–4890. [Google Scholar] [CrossRef]
- Zhang, Y.J.; Wang, A.D.; Da, Y.B. Regional allocation of carbon emission quotas in China: Evidence from the Shapley value method. Energy Policy 2014, 74, 454–464. [Google Scholar] [CrossRef]
- Yi, W.J.; Zou, L.L.; Guo, J.; Wang, K.; Wei, K.M. How can China reach its CO2 intensity reduction targets by 2020? A regional allocation based on equity and development. Energy Policy 2011, 39, 2407–2415. [Google Scholar] [CrossRef]
- Zhu, Q.; Duan, K.; Wu, J.; Wang, Z. Agent-Based Modeling of Global Carbon Trading and Its Policy Implications for China in the Post-Kyoto Era. Emerg. Mark. Financ. Trade 2016, 52, 1348–1360. [Google Scholar] [CrossRef]
- Lozano, S.; Villa, G.; Brännlund, R. Centralised reallocation of emission permits using DEA. Eur. J. Oper. Res. 2009, 193, 752–760. [Google Scholar] [CrossRef]
- Ding, Z.-L.; Duan, X.-N.; GE, Q.-S.; Zhang, Z.-Q. Control of Atmospheric CO2 Concentration in 2050: Calculation of Emission Rights in Different Countries. Sci. China Ser. D 2009, 39, 1009–1027. [Google Scholar] [CrossRef]
- Li, T.; Chen, L.-J.; Fan, Y. Study on Carbon Emission Reduction Quota of Provinces in China Based on Nonlinear Programming. Manag. Rev. 2010, 22, 54–60. [Google Scholar]
- Wang, K.; Li, M. Modeling and application of carbon emission quota by DEA. J. Beijing Inst. Technol. Soc. Sci. Ed. 2013, 15, 7–13. [Google Scholar]
- Benestad, O. Energy needs and CO2 emissions constructing a formula for just distributions. Energy Policy 1994, 22, 725–734. [Google Scholar] [CrossRef]
- Kvrndokk, S. Tradeable CO2 Emission Permits: Initial Distribution as a Justice Problem. Environ. Values 1995, 4, 129–148. [Google Scholar] [CrossRef]
- Den Elzen, M.; Höhne, N.; Moltmann, S. The Triptych approach revisited: A staged sectoral approach for climate mitigation. Energy Policy 2008, 36, 1107–1124. [Google Scholar] [CrossRef]
- Cong, R.; Wei, Y. Potential impact of (CET) carbon emissions trading on China’s power sector: A perspective from different allowance allocation options. Energy 2010, 35, 3921–3931. [Google Scholar] [CrossRef]
- Wu, J.; Wang, S. Wang, Z. Study on Evolution of Climate Negotiation Standpoint and Future Emission Reduction Targets in Major Countries. Prog. Clim. Chang. Res. 2016, 12, 202–216. [Google Scholar]
- IPCC. IPCC Guidelines for National Greenhouse Gas Inventories. Available online: http://www.ipcc-nggip.iges.or.jp/public/2006gl/vol2.html (accessed on 2 April 2017).
- Wei, Y.; Wang, L.; Liao, H.; Wang, K.; Murty, T.; Yan, J. Responsibility accounting in carbon allocation: A global perspective. Appl. Energy 2014, 130, 122–133. [Google Scholar] [CrossRef]
- Ringius, L.; Torvanger, A.; Underdal, A. Burden sharing and fairness principles in international climate policy. Int. Environ. Agreem. 2002, 2, 1–22. [Google Scholar] [CrossRef]
- Klinsky, S.; Dowlatabadi, H. Conceptualizations of justice in climate policy. Clim. Policy 2009, 9, 88–108. [Google Scholar] [CrossRef]
- WEO. World Energy Outlook 2010 Edition. Available online: http://www.worldenergyoutlook.org/weo2010/ (accessed on 2 April 2017).
- Johnson, S.C. Hierarchical clustering schemes. Psychometrika 1967, 32, 241–254. [Google Scholar] [CrossRef] [PubMed]
Figure 1.
Improved method for carbon allocation in China (NCAs: national carbon allocations; SCANs: sectoral carbon allocations at the national level; SCAPs: sectoral carbon allocations at the provincial level; PCAs: provincial carbon allocations).
Figure 1.
Improved method for carbon allocation in China (NCAs: national carbon allocations; SCANs: sectoral carbon allocations at the national level; SCAPs: sectoral carbon allocations at the provincial level; PCAs: provincial carbon allocations).

Figure 2.
NCAs in China from 2016 to 2030 (NCAs: national carbon allocations).

Figure 3.
SCANs under the grandfather and GDP principle from 2016 to 2030 (SCANs: sectoral carbon allocations at the national level).
Figure 3.
SCANs under the grandfather and GDP principle from 2016 to 2030 (SCANs: sectoral carbon allocations at the national level).

Figure 4.
Sectoral carbon emissions structure of representative countries in 2030.

Figure 5.
SCANs from 2016 to 2030 (SCANs: sectoral carbon allocations at the national level).
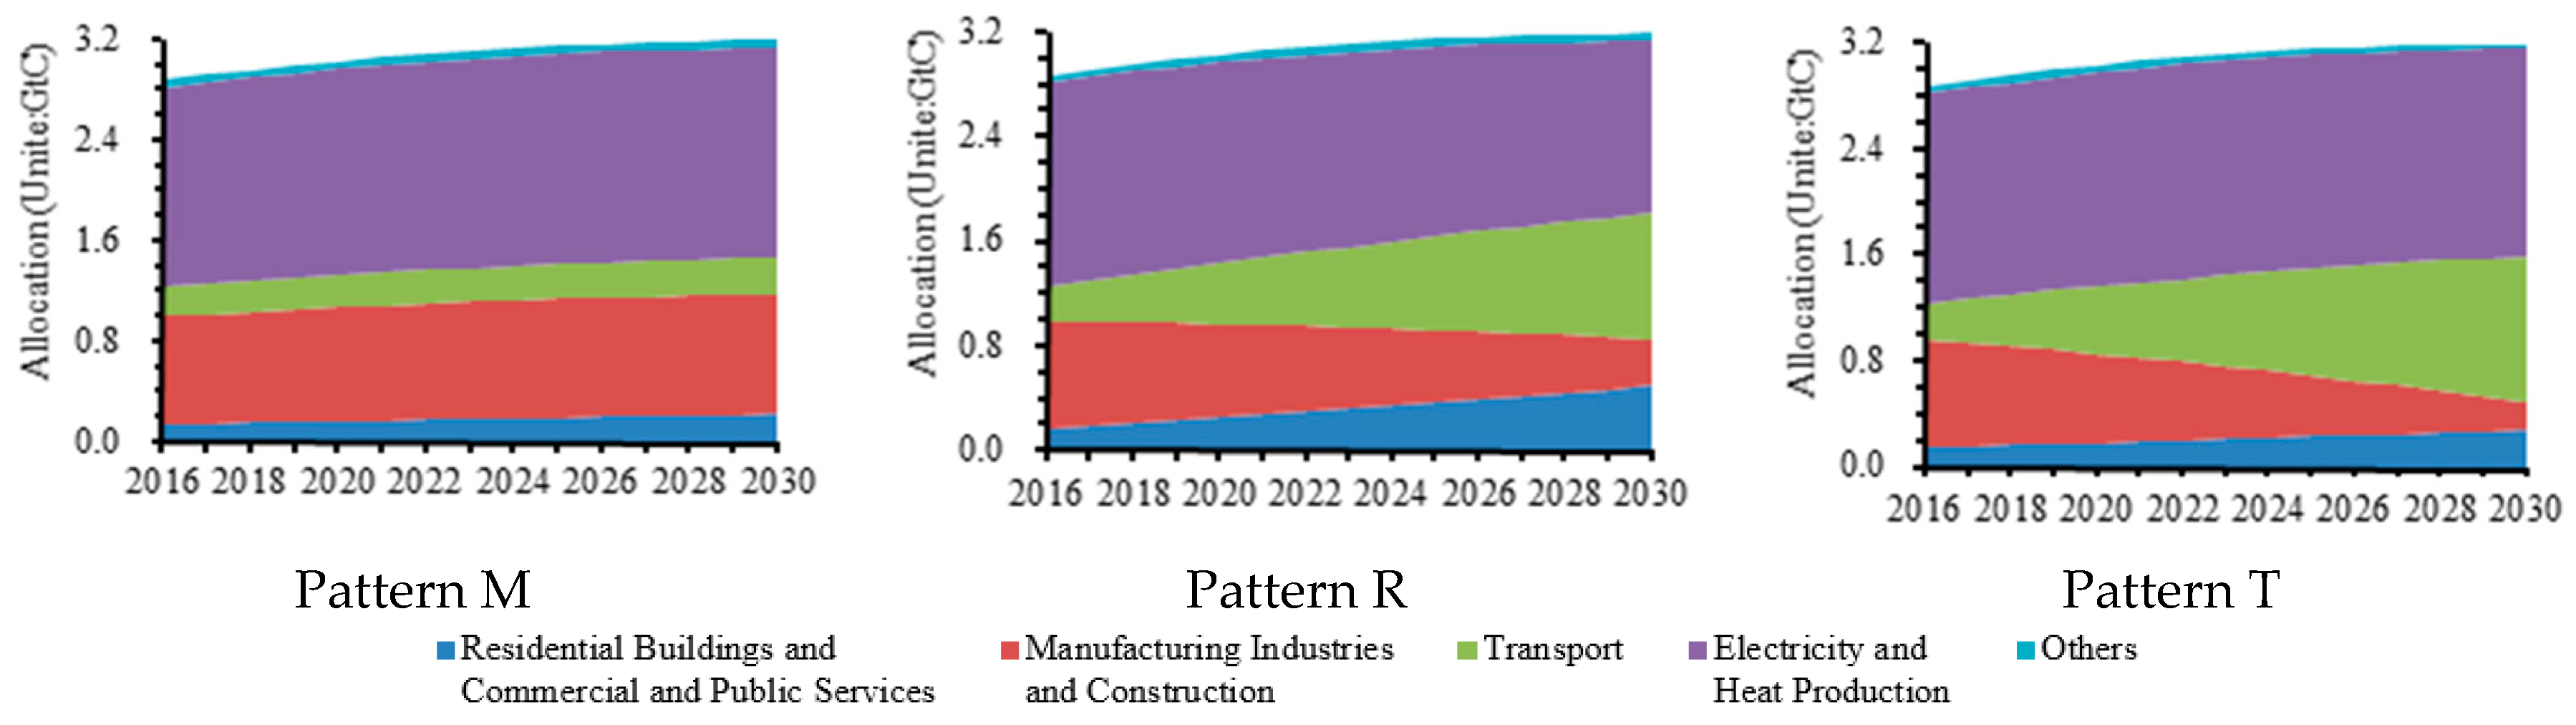
Figure 6.
SCAPs for 30 provinces in China from 2016 to 2030 (SCAPs: sectoral carbon allocations at the provincial level).
Figure 6.
SCAPs for 30 provinces in China from 2016 to 2030 (SCAPs: sectoral carbon allocations at the provincial level).
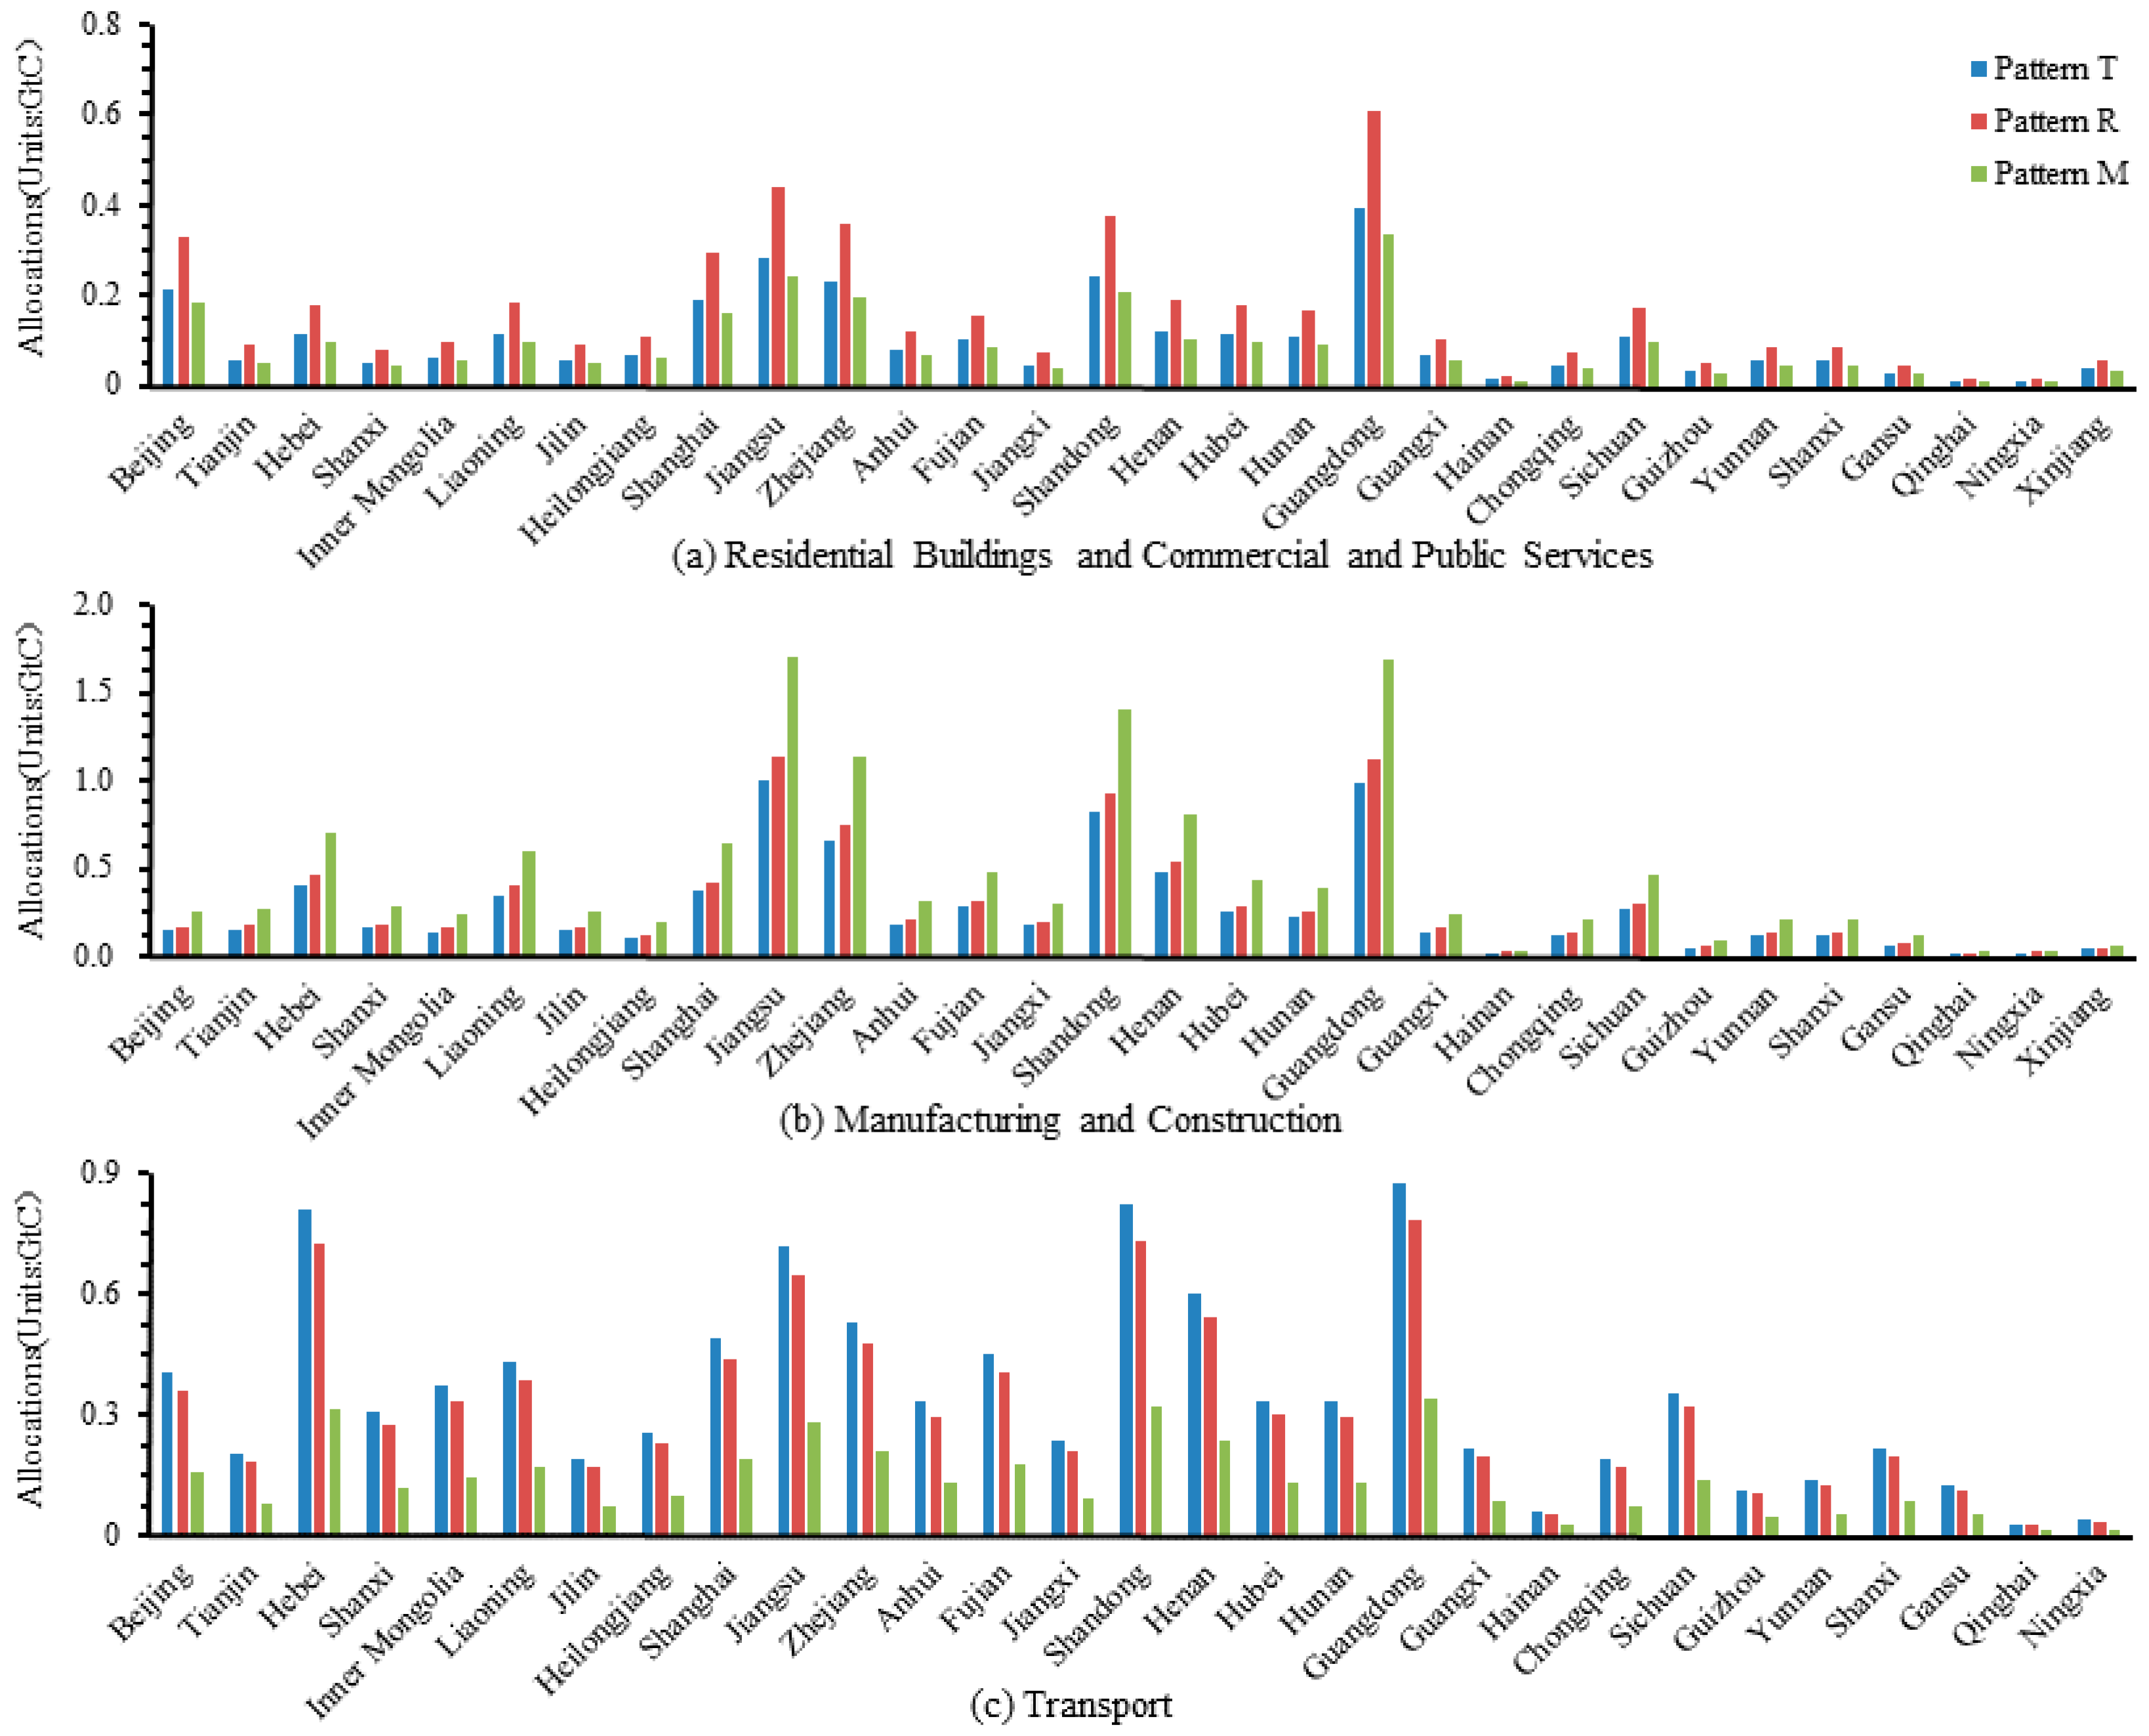
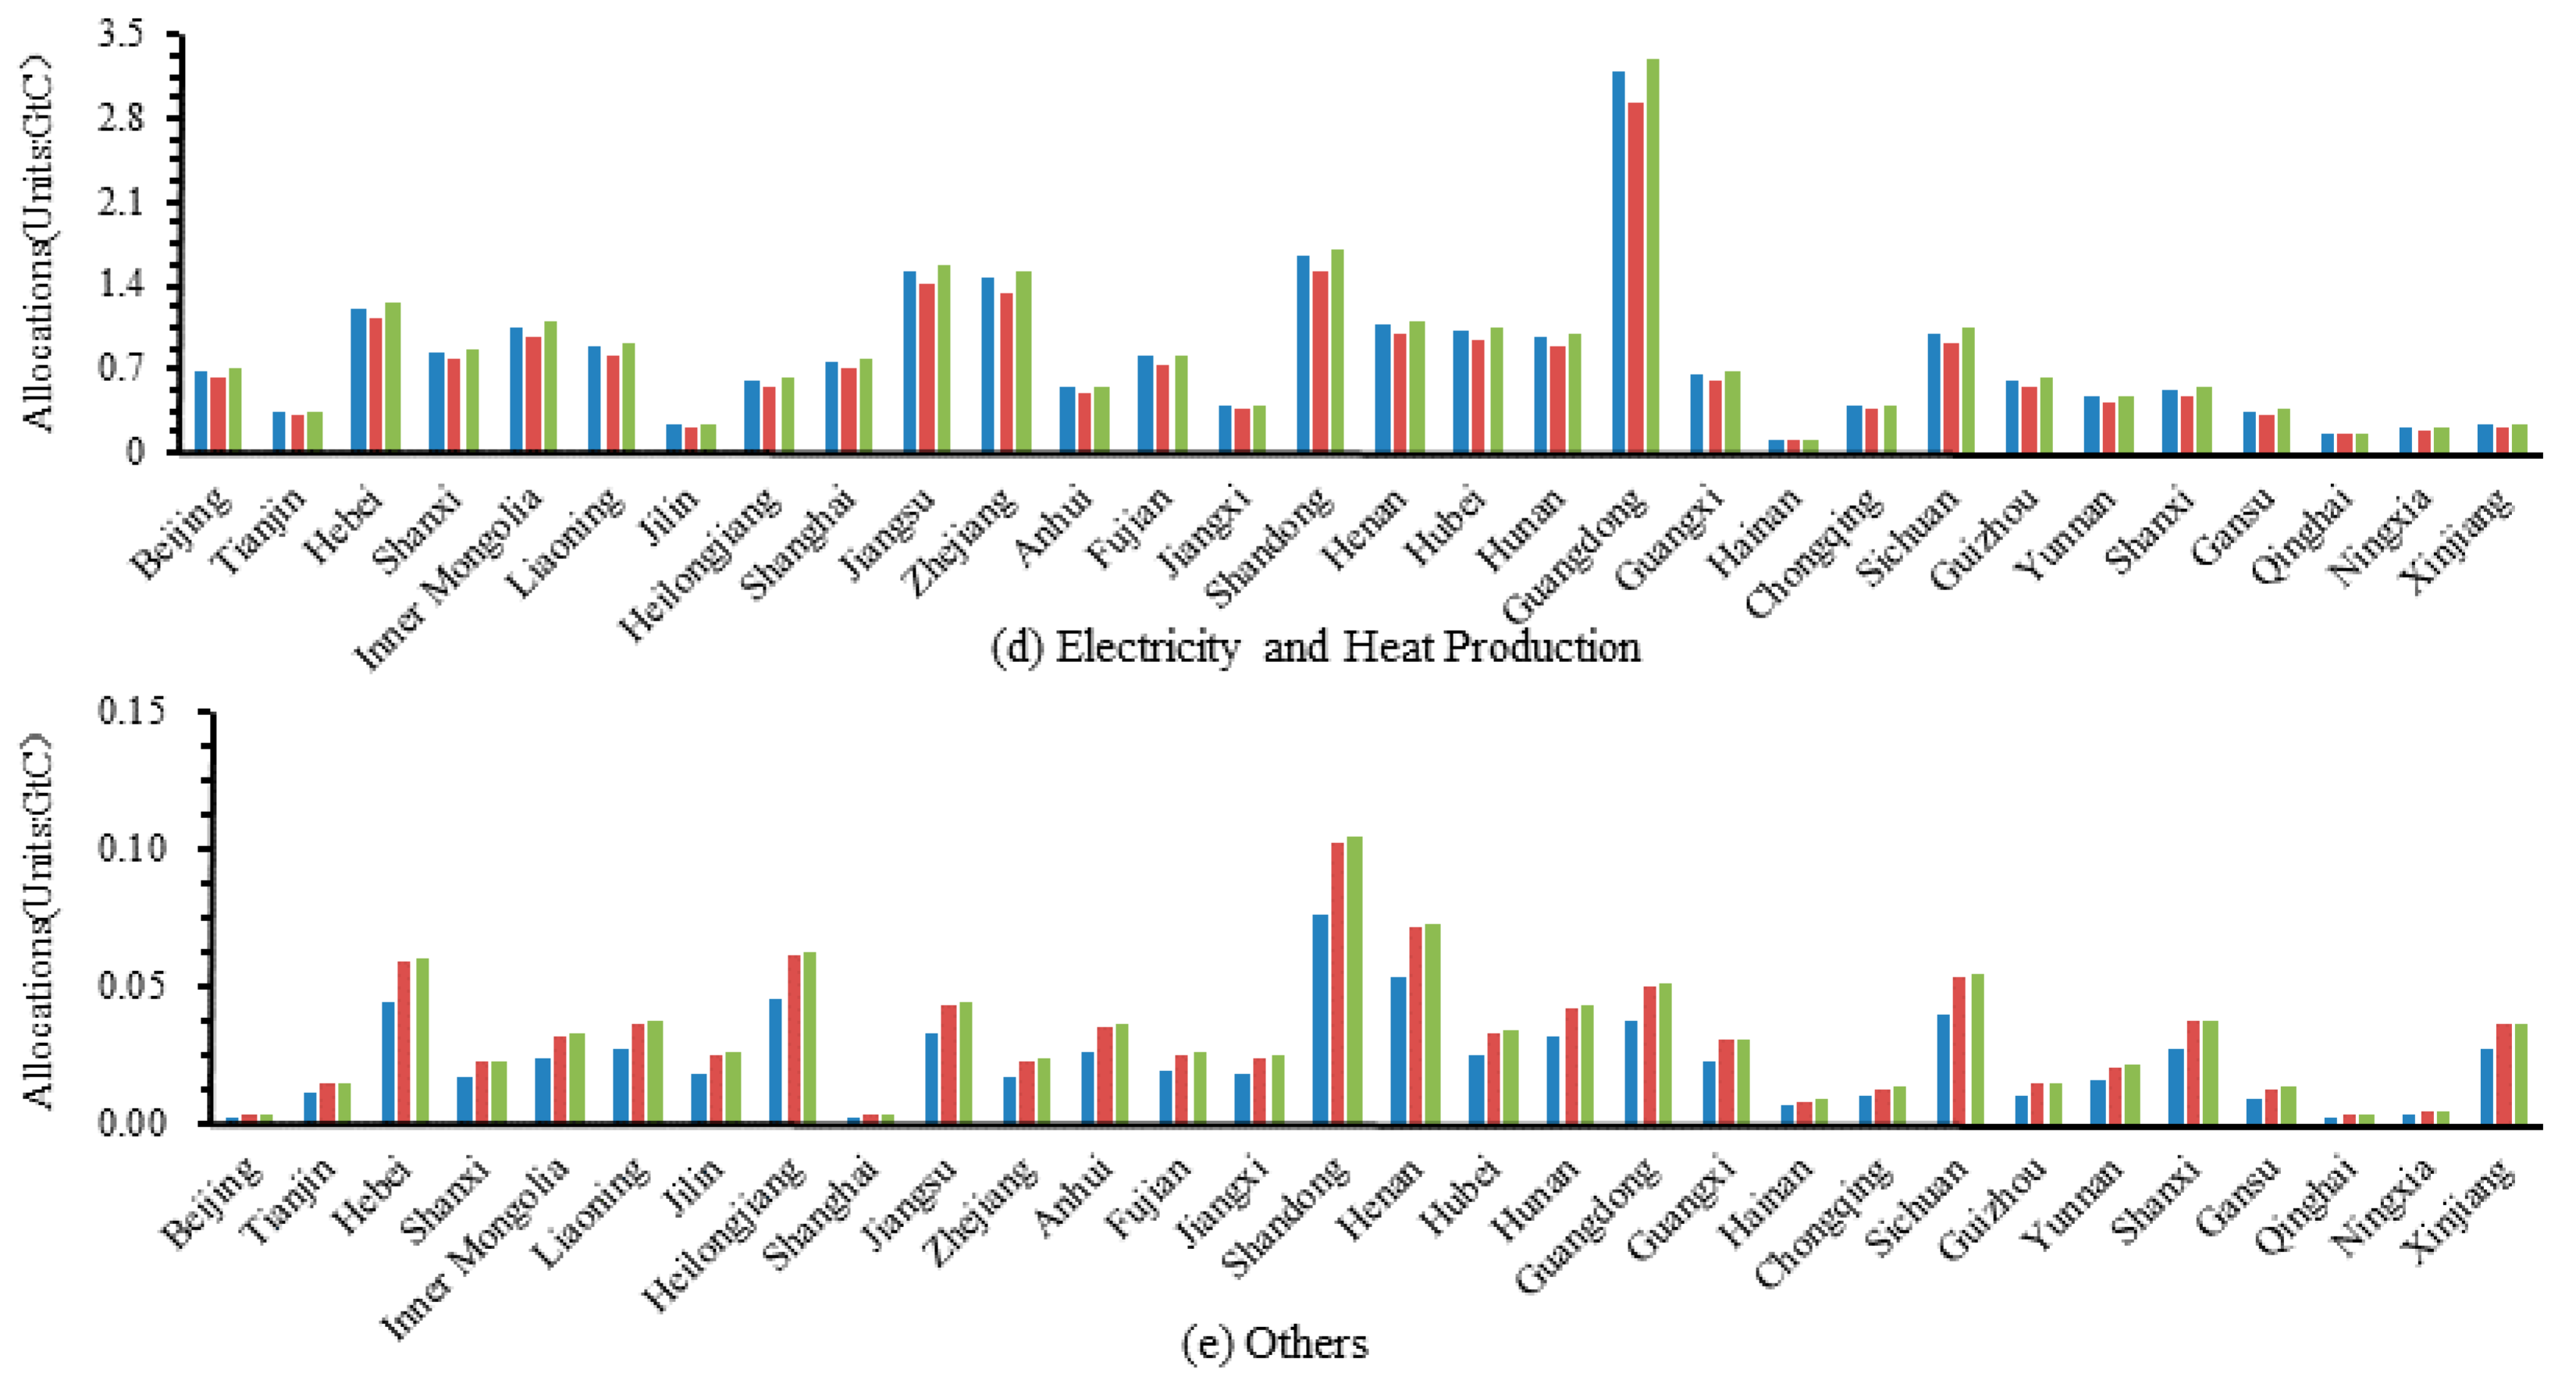
Figure 7.
The peak year of PCAs (PCAs: provincial carbon allocations).
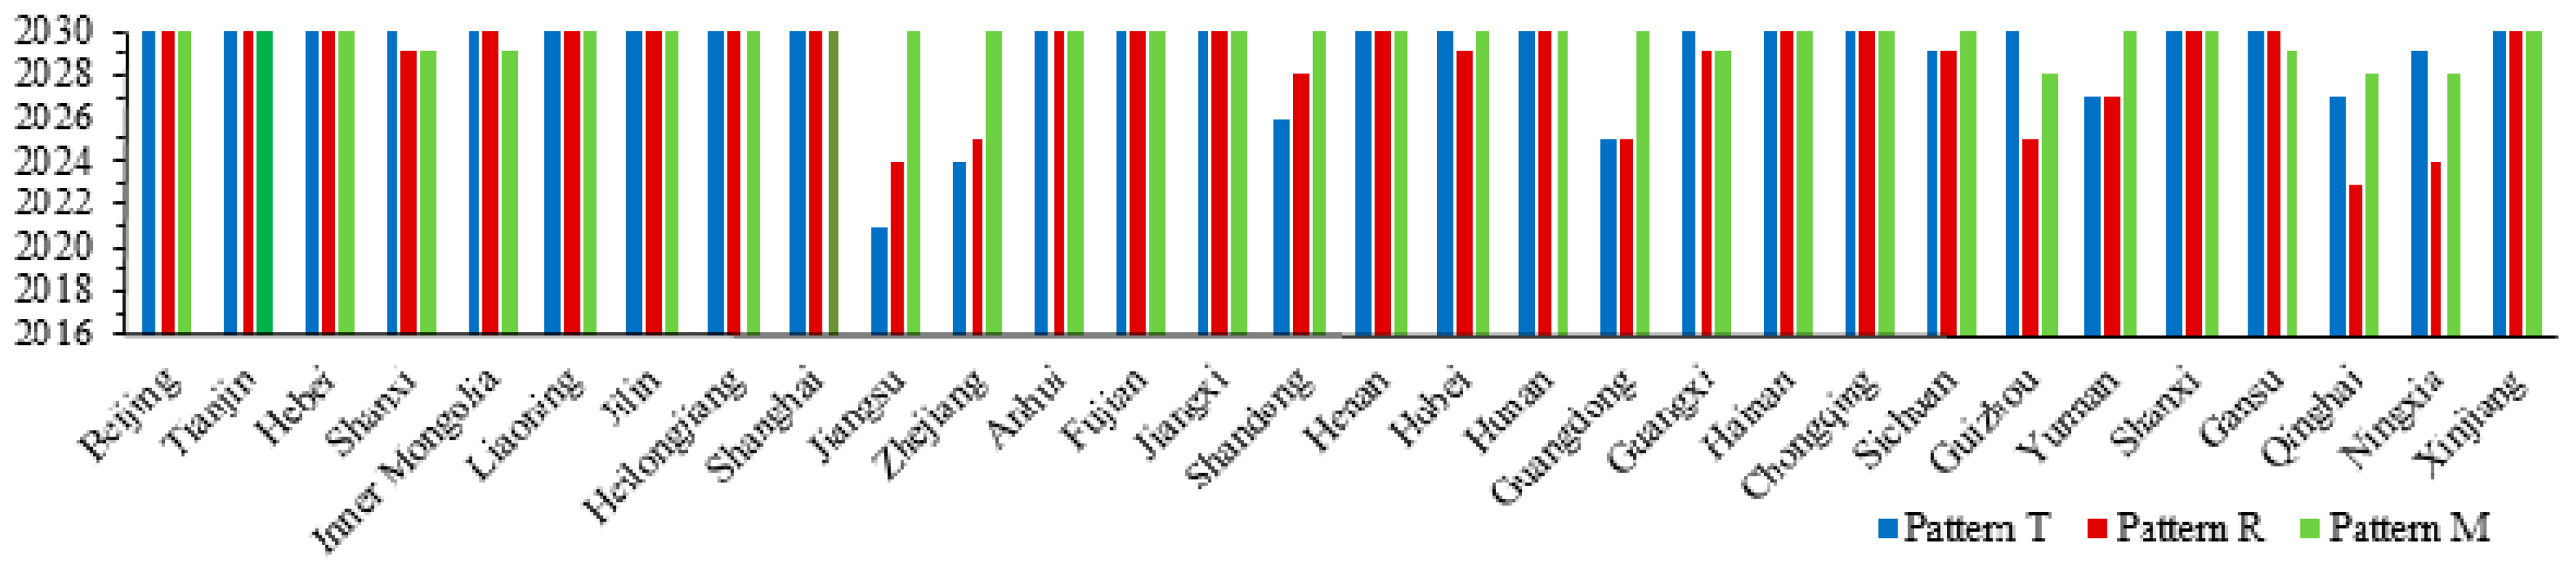
Table 1.
Sectoral emission patterns in major countries (or regions).
| Categories | Countries (or Regions) | Characteristics | |
|---|---|---|---|
| 1st Clustering | 2nd Clustering: | ||
| Category 1 | / | Cameroon, Ghana, Cambodia, Tanzania, Ethiopia, Nepal, Benin, Congo, Angola, Albania, Costa Rica, Sudan, Kenya, El Salvador, Kyrgyzstan, Guatemala, Georgia, Brazil, Switzerland, Colombia, Ecuador, Botswana, Mozambique, Namibia, Togo, the Democratic Republic of the Congo | Emissions from the transport sector contribute most to total emissions |
| Category 2 | / | the United Arab Emirates, Oman, Trinidad and Tobago, Zambia, the Democratic People’s Republic of Korea | Emissions from the manufacturing and construction sectors contribute most to total emissions |
| Category 3 | Category 3-1 (Pattern T) | U.S., Canada, Argentina, Bolivia, Chile, Côte d’Ivoire, the Dominican Republic, Algeria, the Arab Republic of Egypt, Eritrea, Gabon, Honduras, Croatia, Haiti, Indonesia, Iraq, Jamaica, Jordan, Lebanon, Libya, Sri Lanka, Morocco, Mexico, Nigeria, Nicaragua, Pakistan, Panama, Peru, Philippines, Saudi Arabia, Senegal, Syrian Arab Republic, Thailand, Tunisia, Uruguay, Bolivarian Republic of Venezuela, Viet Nam, Republic of Yemen | Emissions from electricity and heat production sectors contribute most to total emissions and emissions from the transport sector significantly contribute to total emissions compared with Category 3-2 and Category 3-3 |
| Category 3 | Category 3-2 (Pattern R) | EU, Turkey, Armenia, Azerbaijan, Iran (Islamic Republic of), Moldova, Turkmenistan, Uzbekistan, Zimbabwe | Emissions from electricity and heat production sectors contribute most to total emissions and emissions from residential buildings and commercial and public services significantly contribute to total emissions compared with Category 3-1 and Category 3-3 |
| Category 3 | Category 3-3 (Pattern M) | China, India, Russian Federation, South Africa, Australia, Bangladesh, Bahrain, Bosnia and Herzegovina, Belarus, Brunei Darussalam, Cuba, Israel, Japan, Kazakhstan, Republic of Korea, Kosovo, Kuwait, Macedonia, Montenegro, Mongolia, Mauritius, Malaysia, Qatar, Singapore, Serbia, Ukraine | Emissions from electricity and heat production sectors contribute most to total emissions and emissions from the manufacturing and construction significantly contribute to total emissions compared with Category 3-1 and Category 3-2 |
Table 2.
SCANs under the 3 target patterns from 2016 to 2030 (unit: GtC; SCANs: sectoral carbon allocations at the national level).
Table 2.
SCANs under the 3 target patterns from 2016 to 2030 (unit: GtC; SCANs: sectoral carbon allocations at the national level).
| Sector | Target Pattern | ||
|---|---|---|---|
| Pattern T | Pattern R | Pattern M | |
| Residential Buildings and Commercial and Public Services | 3.11 | 4.83 * | 2.65 |
| Manufacturing and Construction | 8.03 | 9.13 | 13.80 * |
| Transport | 10.30 * | 9.21 | 4.03 |
| Electricity and Heat Production | 24.05 | 22.09 | 24.75 * |
| Other | 0.70 | 0.94 | 0.96 * |
* The most preferred target pattern for each sector.
Table 3.
PCAs from 2016 to 2030 (unit: GtC; PCAs: provincial carbon allocations).
| Region | Pattern T | Pattern R | Pattern M | Region | Pattern T | Pattern R | Pattern M |
|---|---|---|---|---|---|---|---|
| Beijing | 1.45 | 1.49 * | 1.30 | Henan | 2.330 | 2.328 | 2.335 * |
| Tianjin | 0.77 | 0.78 * | 0.76 | Hubei | 1.738 * | 1.725 | 1.737 |
| Hebei | 2.59 * | 2.55 | 2.43 | Hunan | 1.66 * | 1.65 | 1.65 |
| Shanxi | 1.38 * | 1.34 | 1.34 | Guangdong | 5.48 | 5.49 | 5.71 * |
| Inner Mongolia | 1.66 * | 1.59 | 1.56 | Guangxi | 1.10 * | 1.09 | 1.09 |
| Liaoning | 1.82 | 1.82 | 1.83 * | Hainan | 0.214 * | 0.211 | 0.20 |
| Jilin | 0.65 | 0.67 * | 0.65 | Chongqing | 0.76 * | 0.75 | 0.74 |
| Heilongjiang | 1.10 * | 1.09 | 1.04 | Sichuan | 1.781 | 1.77 | 1.783 * |
| Shanghai | 1.82 | 1.86 * | 1.79 | Guizhou | 0.82 * | 0.79 | 0.81 |
| Jiangsu | 3.56 | 3.66 | 3.85 * | Yunnan | 0.80 | 0.80 | 0.81 * |
| Zhejiang | 2.90 | 2.95 | 3.06 * | Shanxi | 0.95 * | 0.94 | 0.92 |
| Anhui | 1.170 * | 1.168 | 1.11 | Gansu | 0.58 * | 0.57 | 0.56 |
| Fujian | 1.66 * | 1.64 | 1.60 | Qinghai | 0.221 | 0.21 | 0.223 * |
| Jiangxi | 0.863 * | 0.862 | 0.85 | Ningxia | 0.280 * | 0.27 | 0.277 |
| Shandong | 3.60 | 3.65 | 3.73 * | Xinjiang | 0.470 | 0.472 * | 0.43 |
* The most preferred target pattern for each province.
© 2017 by the authors. Licensee MDPI, Basel, Switzerland. This article is an open access article distributed under the terms and conditions of the Creative Commons Attribution (CC BY) license (http://creativecommons.org/licenses/by/4.0/).
Share and Cite
MDPI and ACS Style
Zhu, Q.; Tang, W. Regional-Level Carbon Allocation in China Based on Sectoral Emission Patterns under the Peak Commitment. Sustainability 2017, 9, 552. https://doi.org/10.3390/su9040552
AMA Style
Zhu Q, Tang W. Regional-Level Carbon Allocation in China Based on Sectoral Emission Patterns under the Peak Commitment. Sustainability. 2017; 9(4):552. https://doi.org/10.3390/su9040552
Chicago/Turabian StyleZhu, Qianting, and Wenwu Tang. 2017. "Regional-Level Carbon Allocation in China Based on Sectoral Emission Patterns under the Peak Commitment" Sustainability 9, no. 4: 552. https://doi.org/10.3390/su9040552
Note that from the first issue of 2016, this journal uses article numbers instead of page numbers. See further details here.