Analysis of Driving Factors for Extended Producer Responsibility by Using Interpretative Structure Modelling (ISM) and Analytic Network Process (ANP)

Abstract
:1. Introduction
2. Literature Review
2.1. Theory and Practice Research of Extended Producer Responsibility
2.2. Driving Factor Analysis of Extended Producer Responsibility
3. Methodology
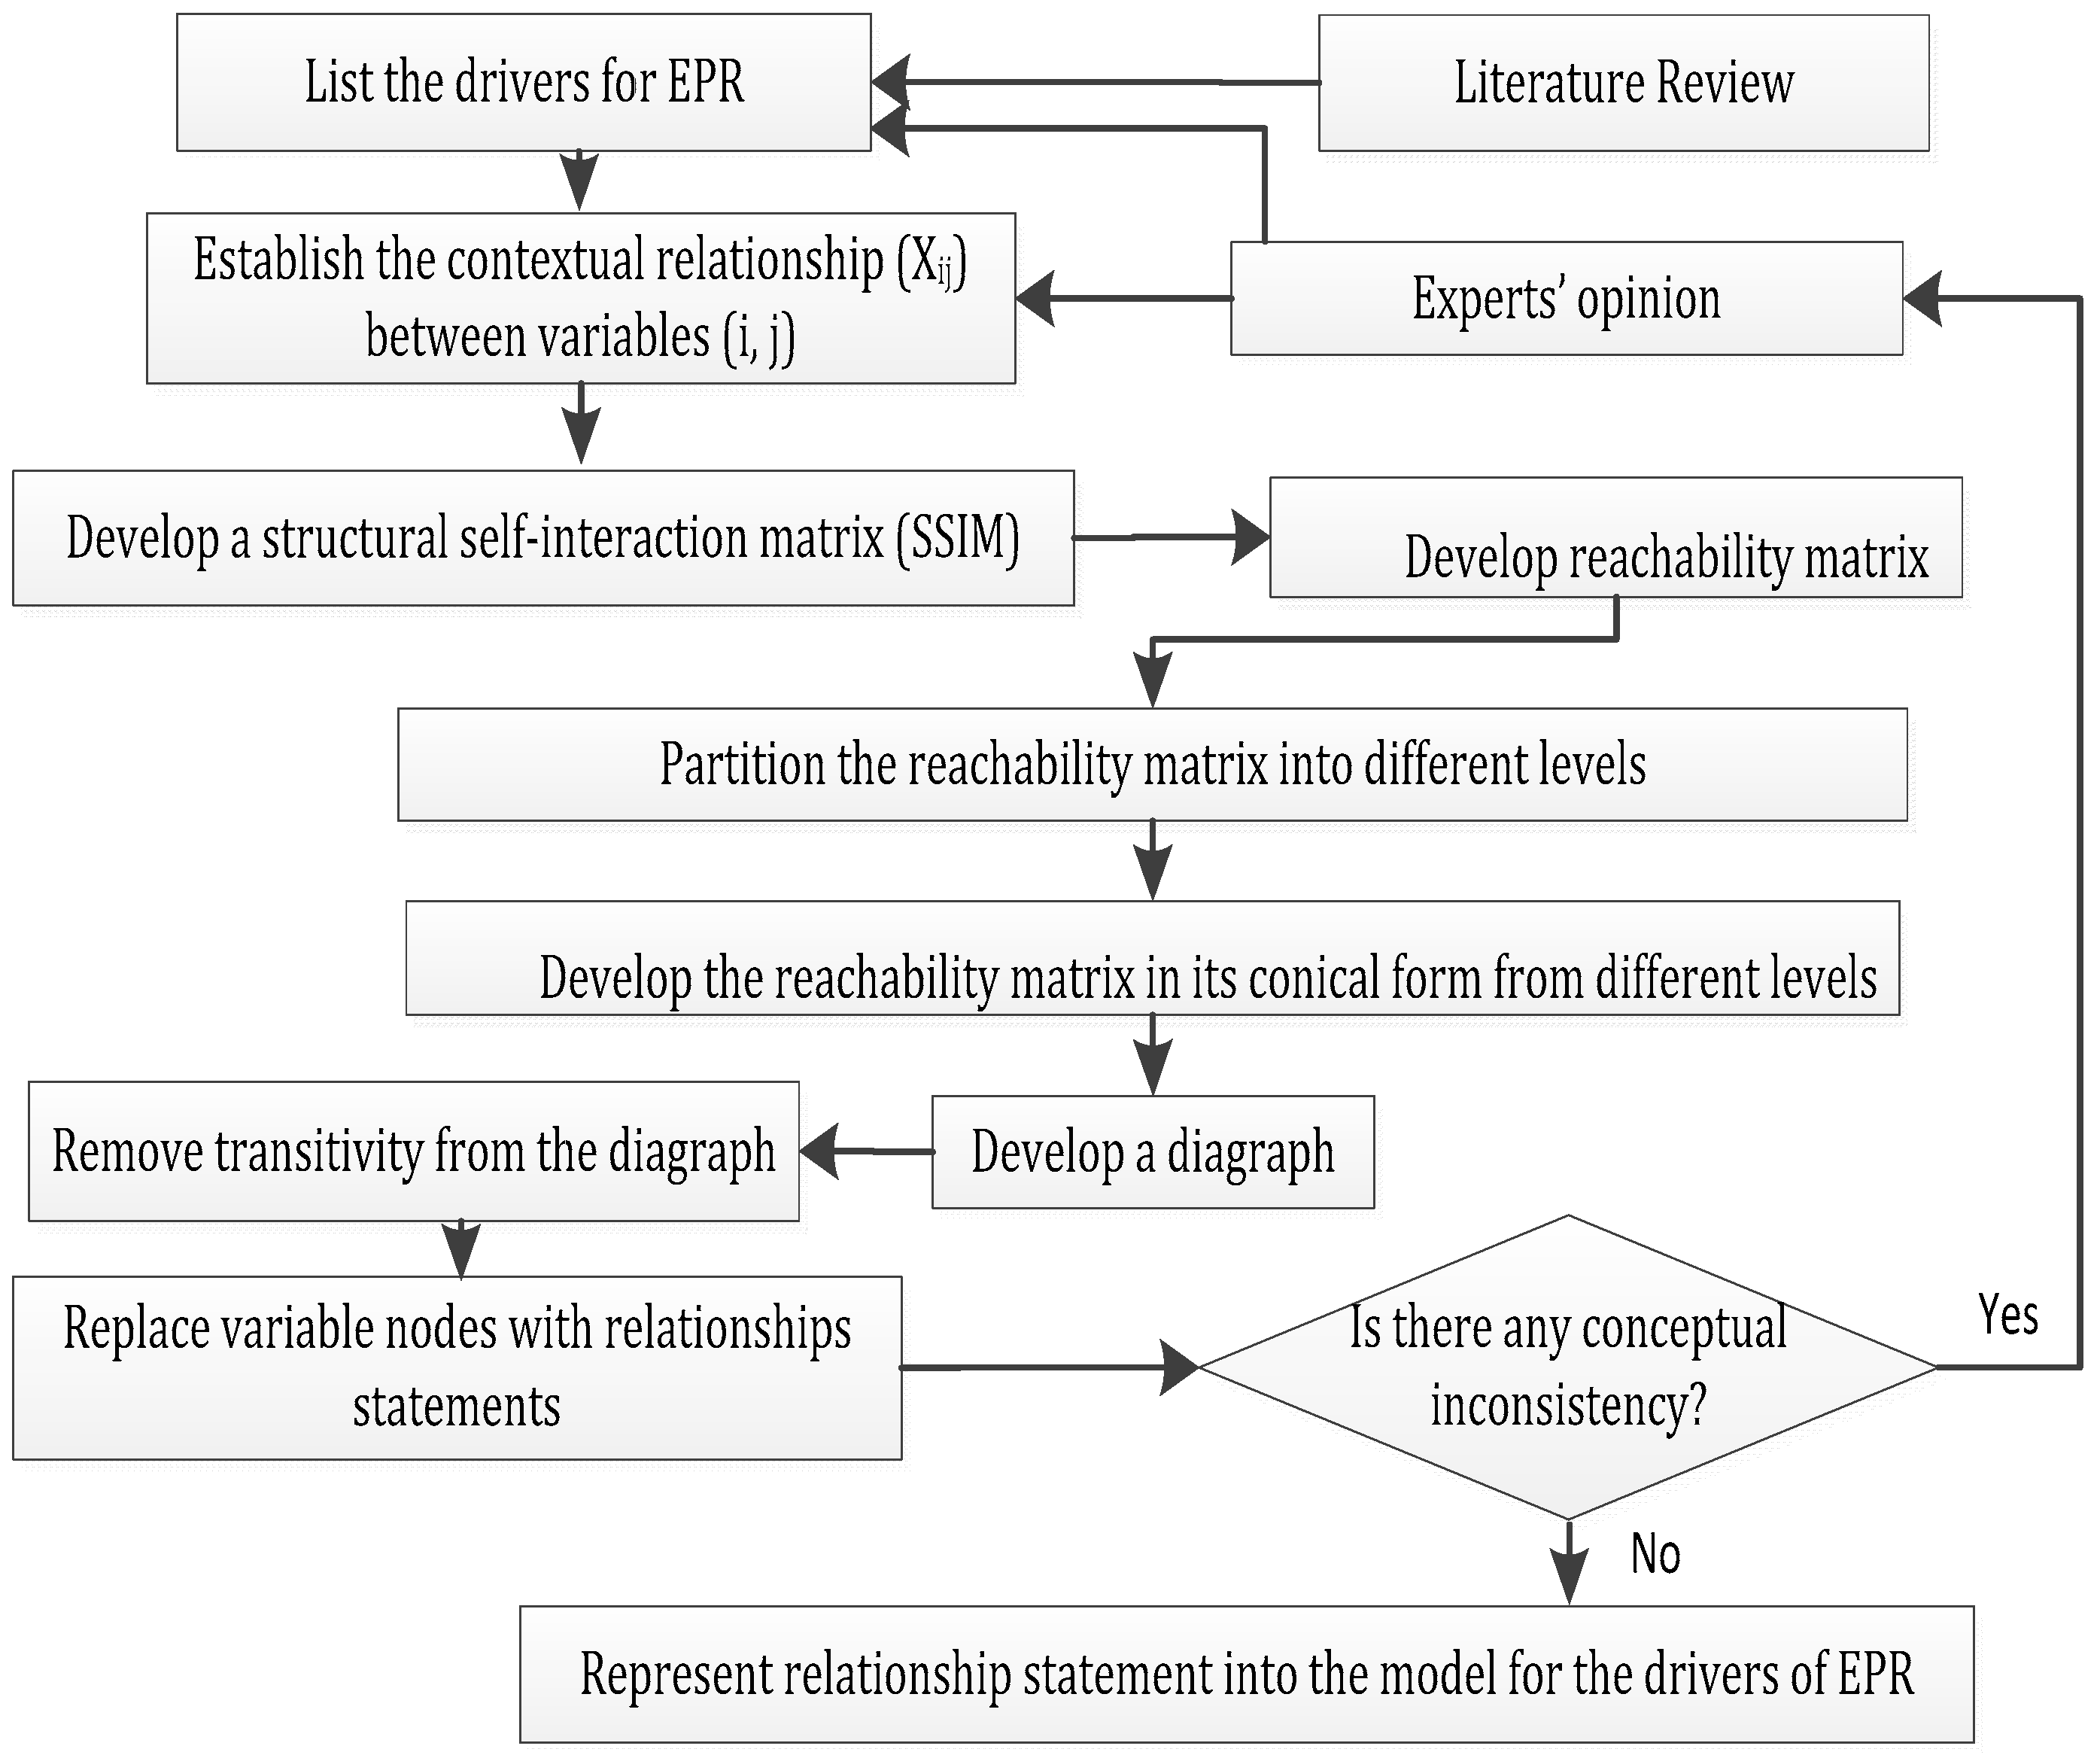
3.1. ISM
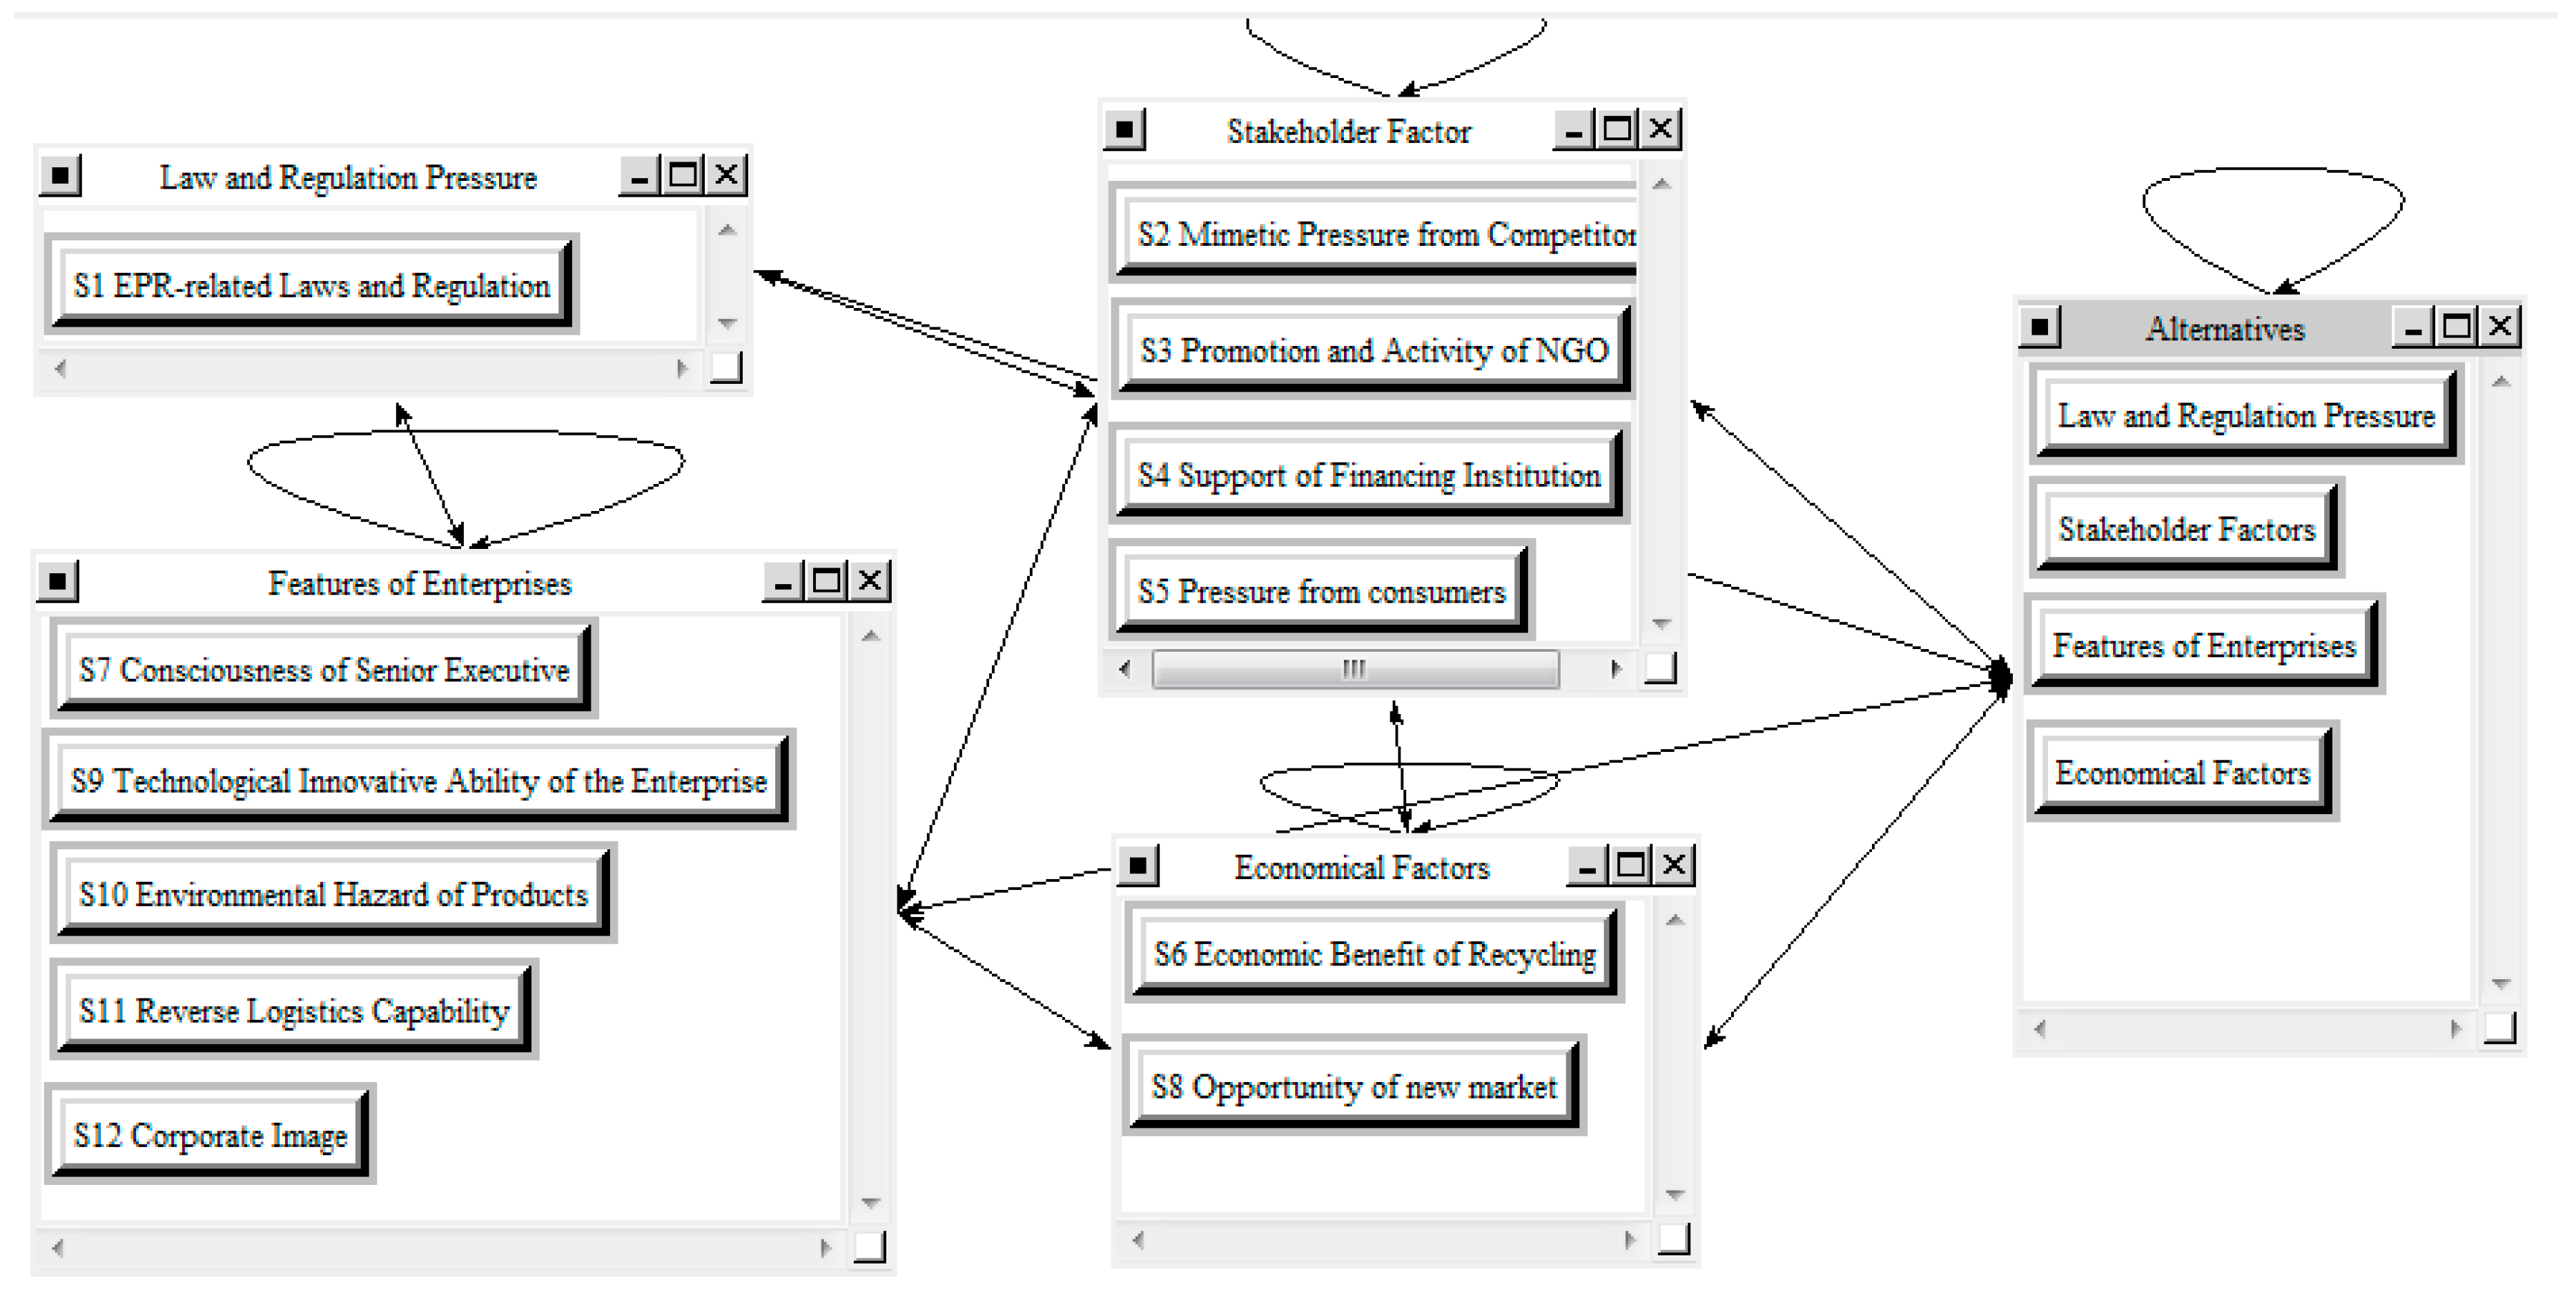
3.2. ANP
4. Problem Description and Data Collection
4.1. Factor Recognition
4.2. Data Collection
5. Partition Analysis of Driving Factors by Using ISM
5.1. SSIM
5.2. Initial Reachability Matrix
5.3. Level Partitions
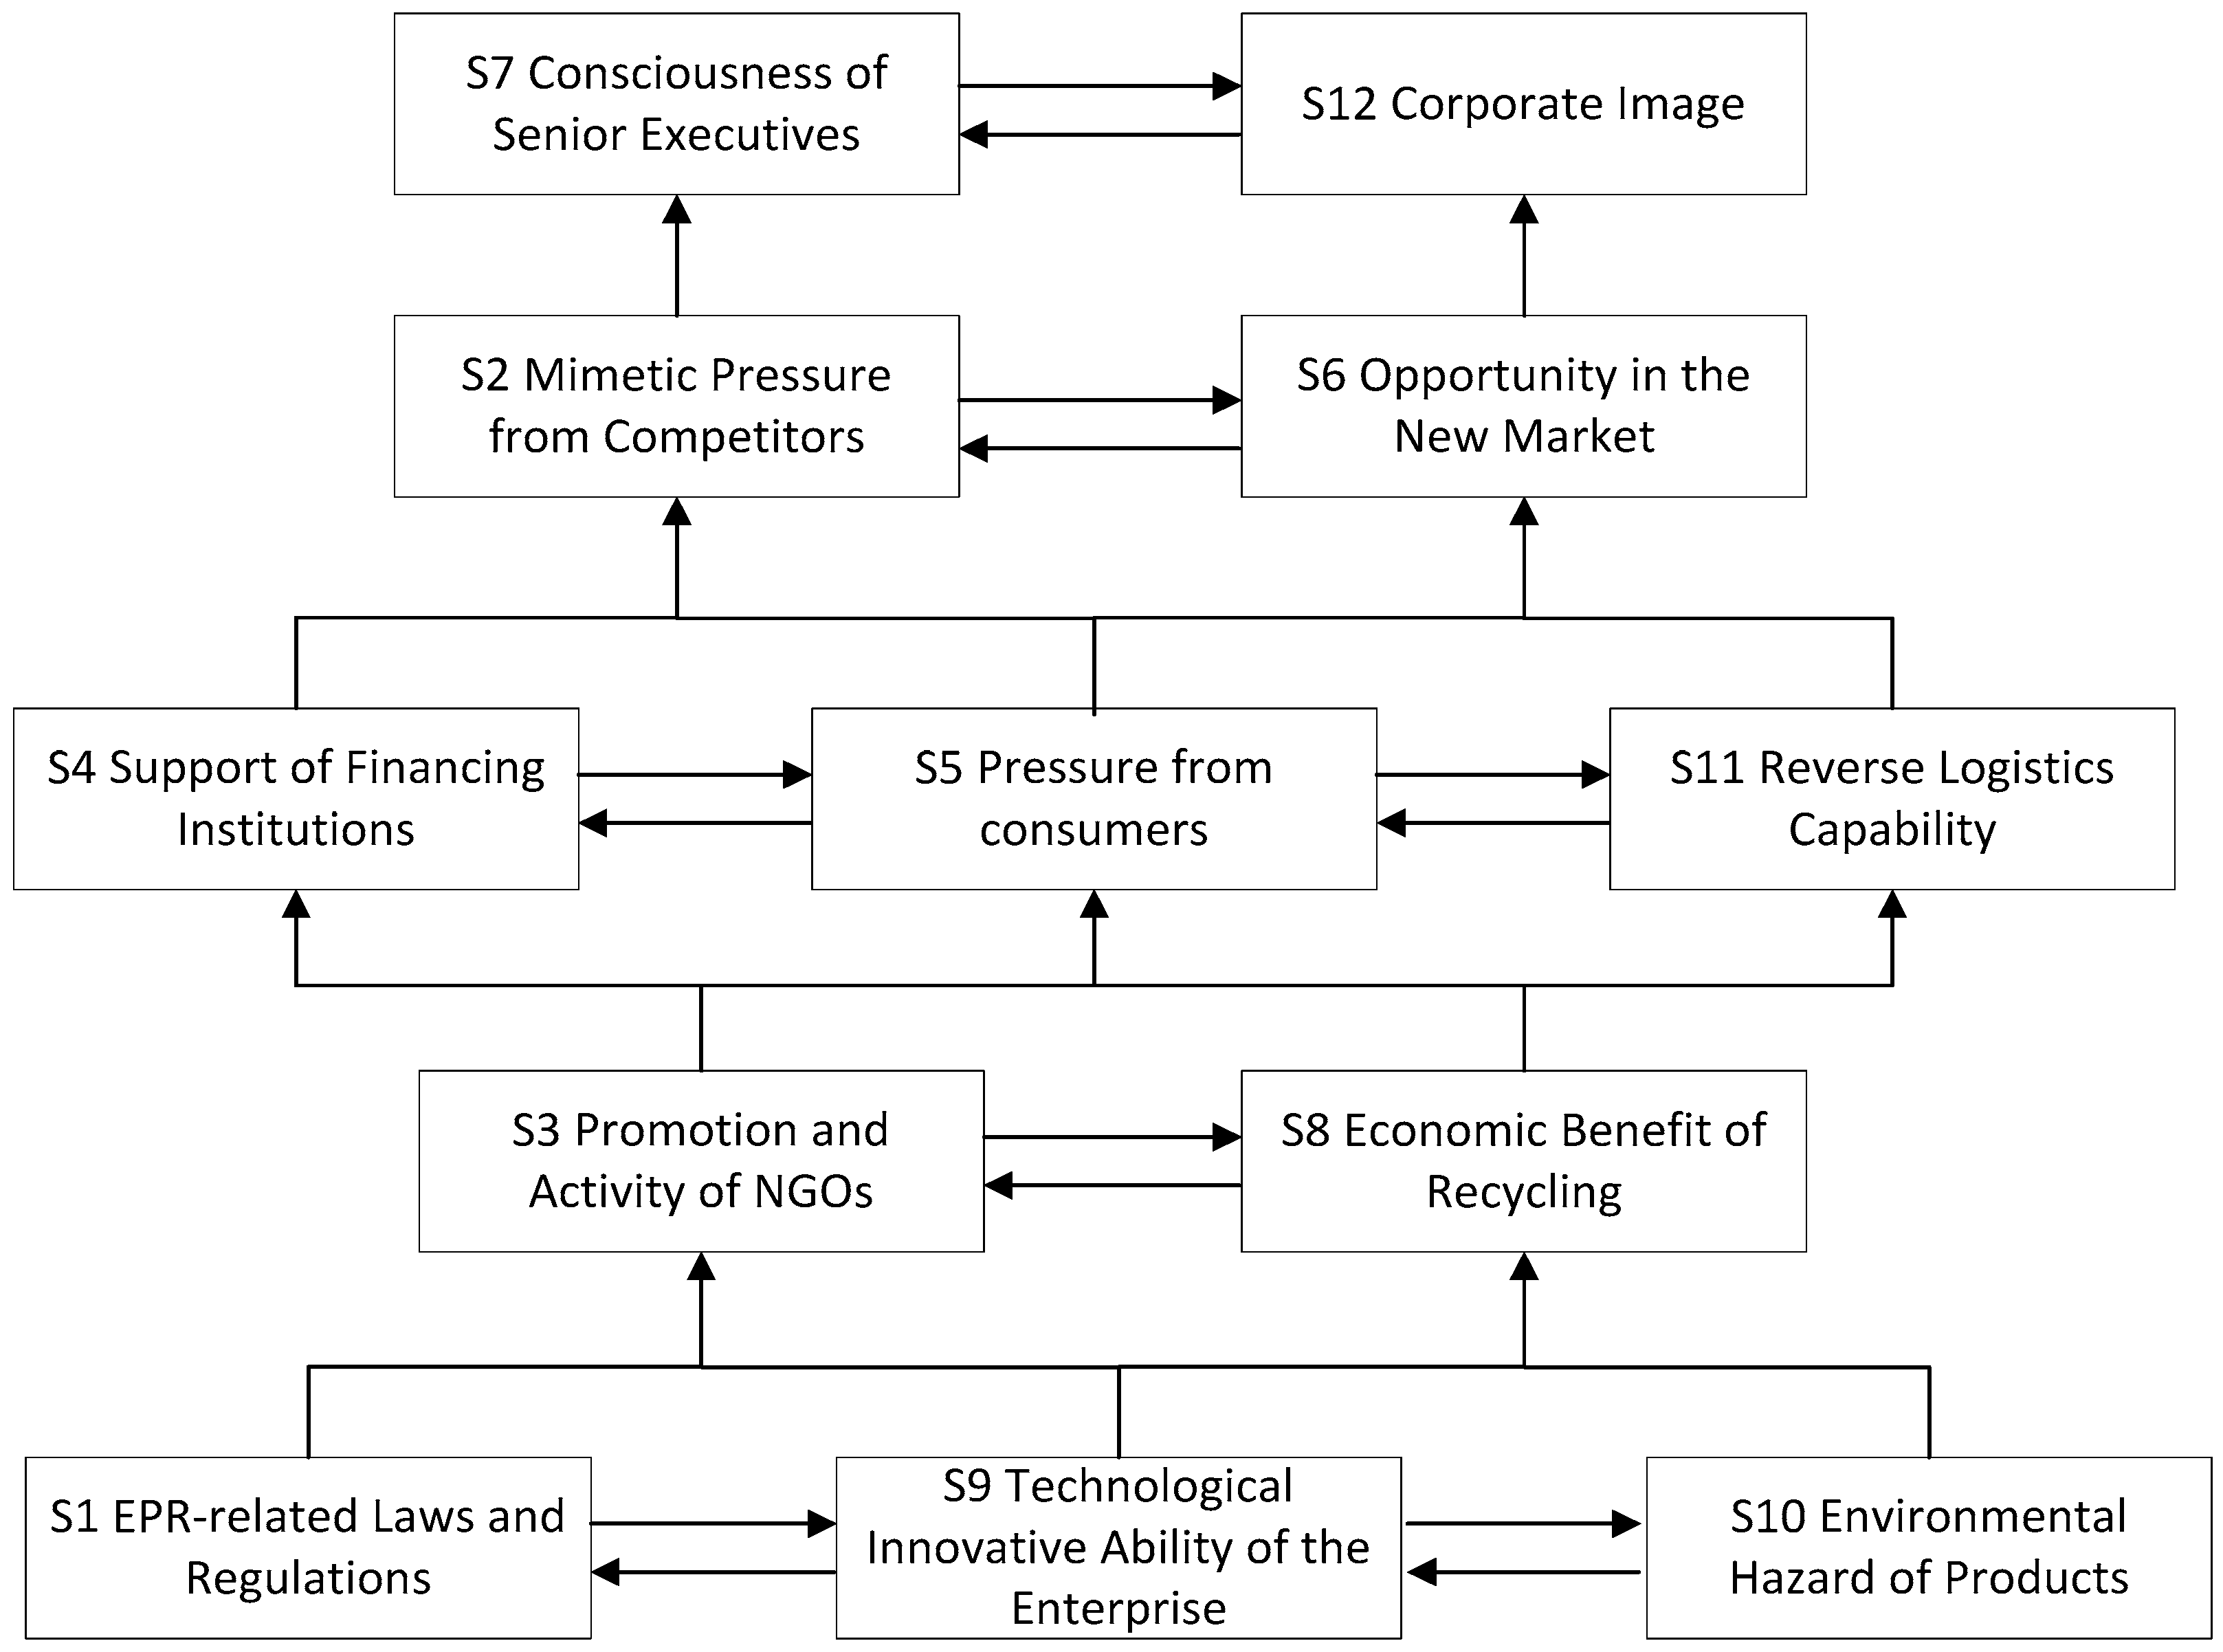
5.4. Formation of the ISM-Based Model
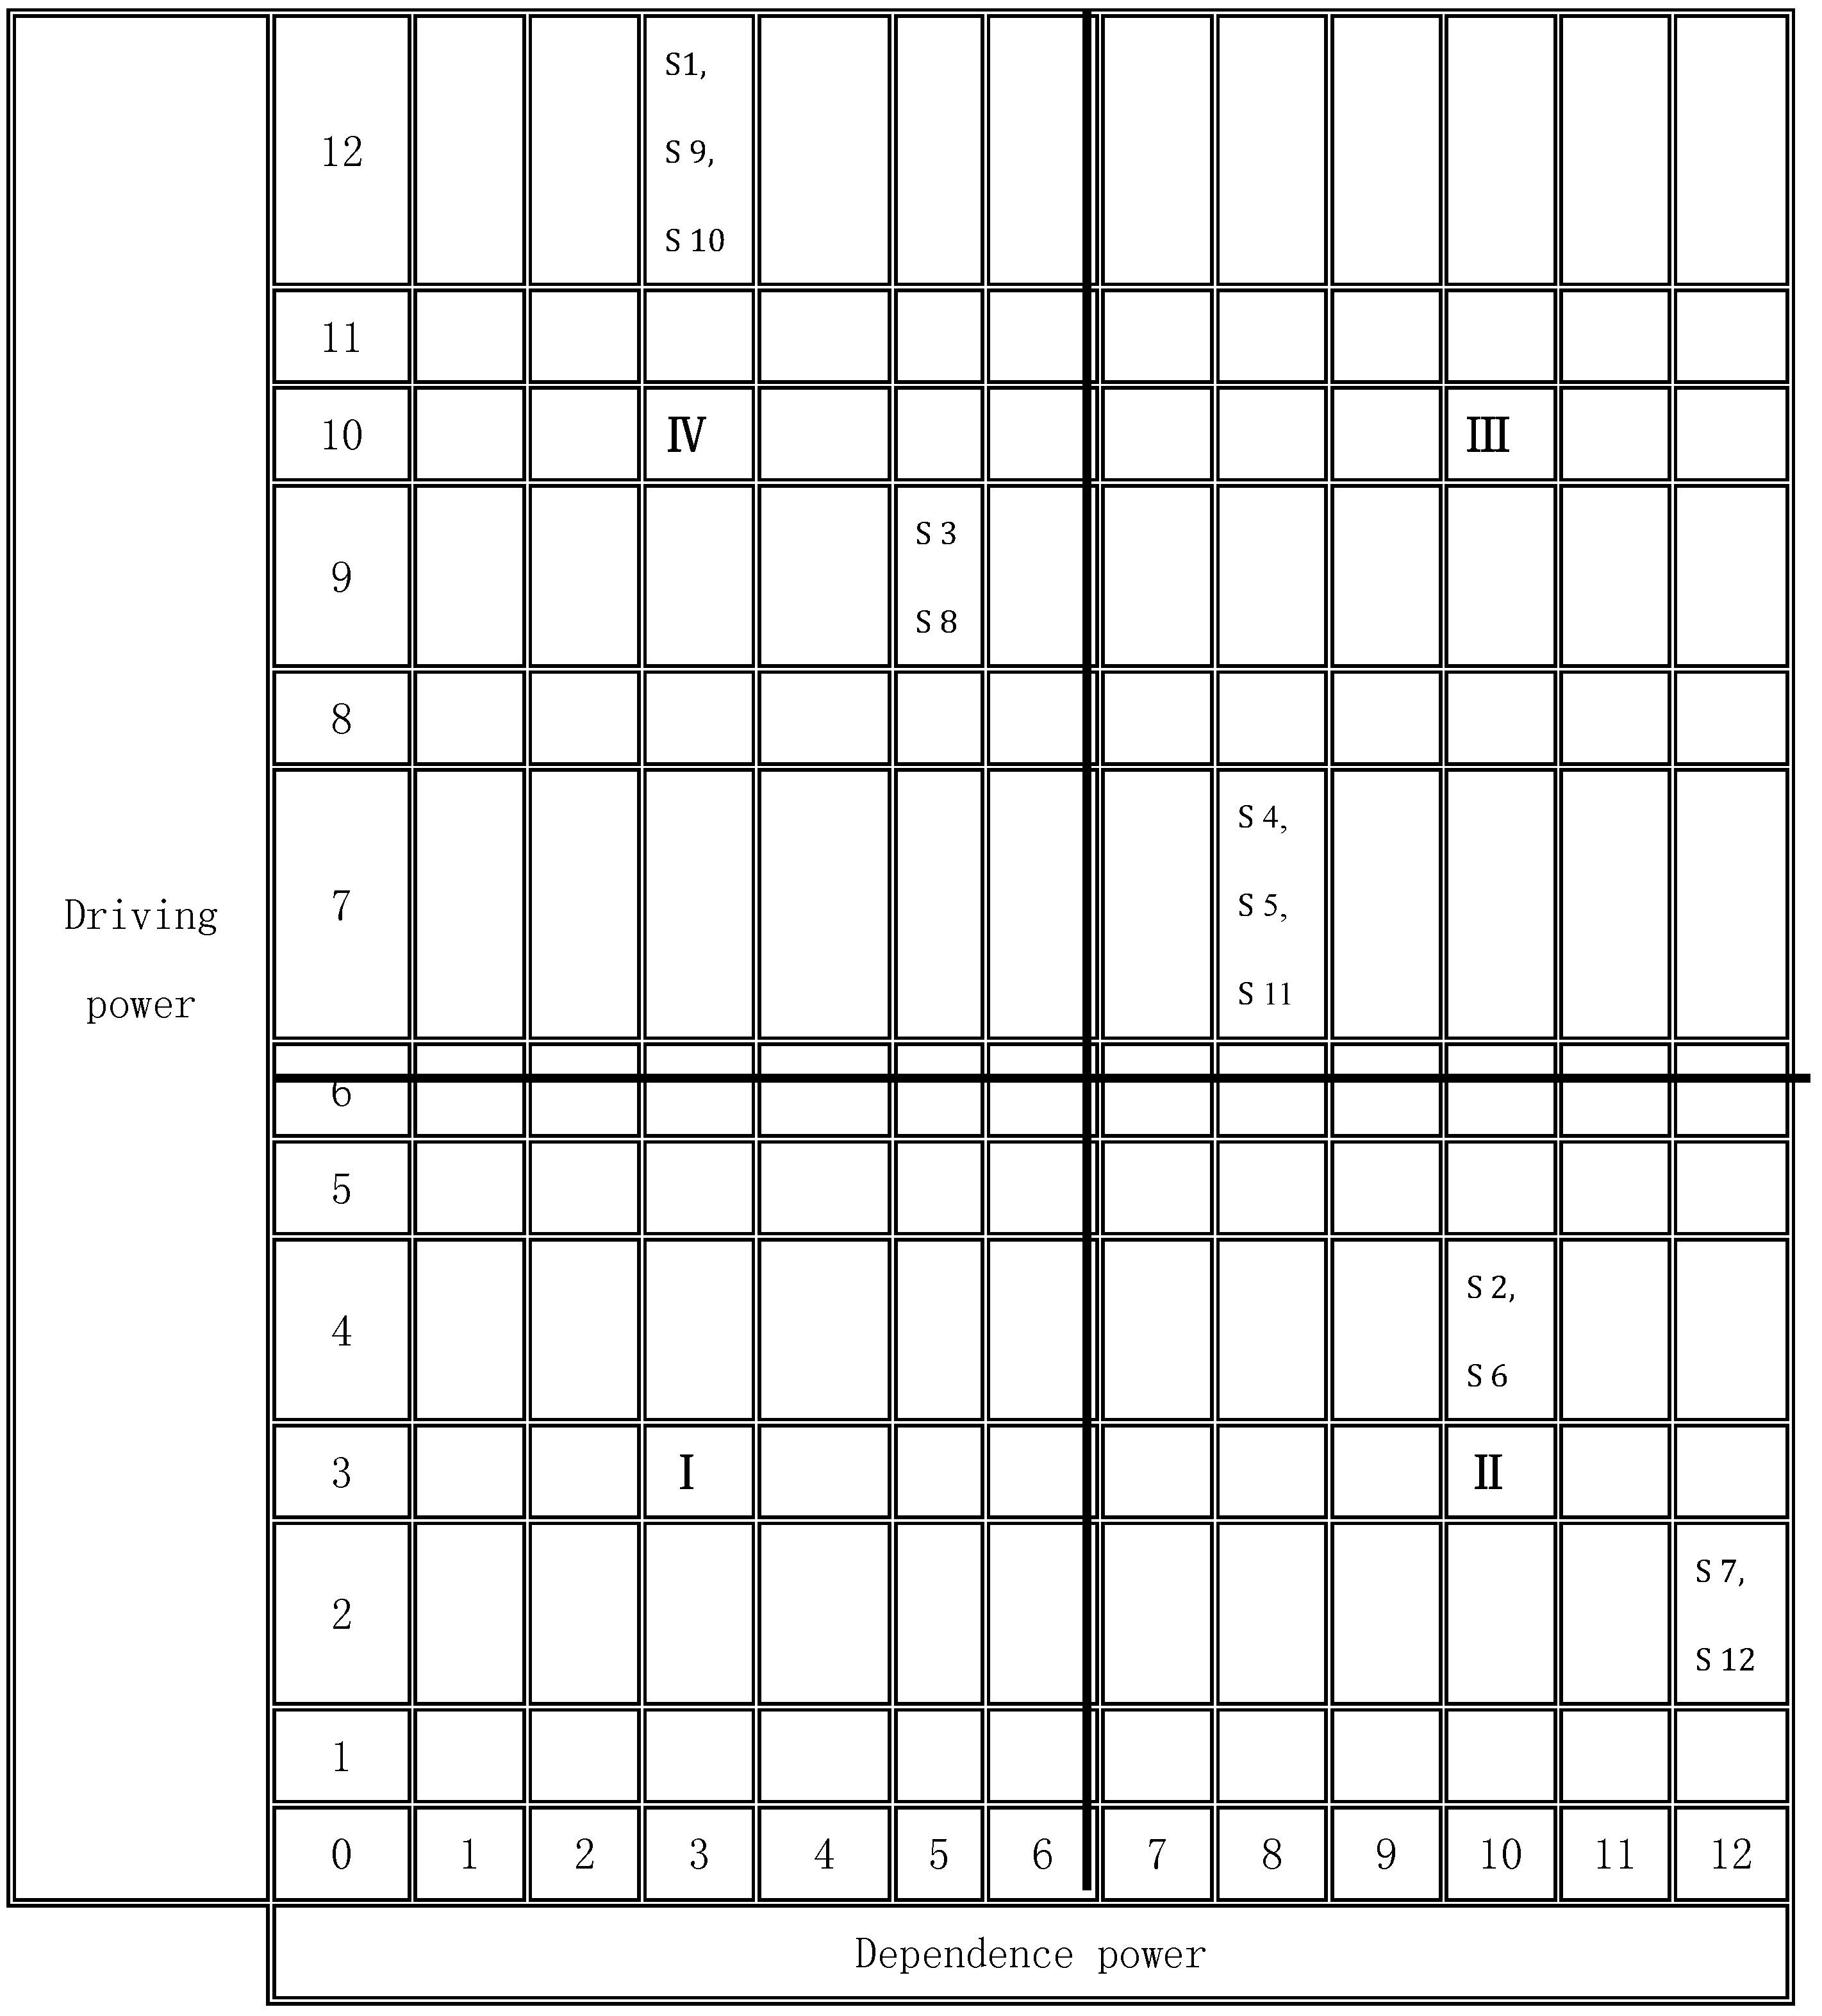
5.5. Matrix Cross-Reference Multiplication Applied to a Classification (MICMAC) Analysis
6. Factor Ranking through ANP
7. Conclusions
Author Contributions
Conflicts of Interest
References
- OECD Publishing. Extended Producer Responsibility: A Guidance Manual for Governments; Organisation for Economic Co-Operation and Development: Paris, France, 2001. [Google Scholar]
- Manomaivibool, P. Extended producer responsibility in a non-OECD context: The management of waste electrical and electronic equipment in India. Resour. Conserv. Recycl. 2009, 53, 136–144. [Google Scholar] [CrossRef]
- Lindhqvist, T. Extended Producer Responsibility in Cleaner Production: Policy Principle to Promote Environmental Improvements of Product Systems. Ph.D. Thesis, Lund University, Lund, Sweden, 1 January 2000. [Google Scholar]
- Kibert, N.C. Extended producer responsibility: A tool for achieving sustainable development. J. Land Use Environ. Law 2004, 19, 503–523. [Google Scholar]
- Lifset, R.; Atasu, A.; Tojo, N. Extended producer responsibility. J. Ind. Ecol. 2013, 17, 162–166. [Google Scholar] [CrossRef]
- Kiddee, P.; Naidu, R.; Wong, M.H. Electronic waste management approaches: An overview. Waste Manag. 2013, 33, 1237–1250. [Google Scholar] [CrossRef] [PubMed]
- OECD Publishing. Extended Producer Responsibility: Updated Guidance for Efficient Waste Management; OECD Publishing: Paris, France, 2016. [Google Scholar]
- Nash, J.; Bosso, C. Extended producer responsibility in the United States. J. Ind. Ecol. 2013, 17, 175–185. [Google Scholar] [CrossRef]
- Kunz, N.; Atasu, A.; Mayers, K.; Wassenhove, L.V. Extended Producer Responsibility: Stakeholder Concerns and Future Developments; White Paper; INSEAD Social Innovation Centre: Fontainebleau, France, 2014. [Google Scholar]
- Gui, L.; Atasu, A.; Ergun, Ö.; Toktay, L.B. Implementing extended producer responsibility legislation. J. Ind. Ecol. 2013, 17, 262–276. [Google Scholar] [CrossRef]
- Wang, J.; Chen, M. Management status of end-of-life vehicles and development strategies of used automotive electronic control components recycling industry in China. Waste Manag. Res. J. Int. Solid Wastes Public Clean. Assoc. Iswa 2012, 30, 1198. [Google Scholar] [CrossRef] [PubMed]
- Toffel, M.W. End-of-life product recovery: Drivers, prior research, and future directions. In Proceedings of the Conference on European Electronics Take-Back Legislation: Impacts on Business Strategy and Global Trade, Paris, France, 17–18 October 2002. [Google Scholar]
- Zhao, Y.; Zhu, Q.; Wu, C. Empirical Study on the Effect of Implementing Extended Producer Responsibility (EPR) in China’s Automobile Industry. Manag. Rev. 2008, 1, 006. [Google Scholar]
- Gupt, Y.; Sahay, S. Review of extended producer responsibility: A case study approach. Waste Manag. Res. 2015, 33, 595–611. [Google Scholar] [CrossRef] [PubMed]
- Wang, J.; Chen, M. Implementing extended producer responsibility: Vehicle remanufacturing in China. J. Clean. Prod. 2011, 19, 680–686. [Google Scholar]
- Tong, X.; Lifset, R.; Lindhqvist, T. Extended Producer Responsibility in China. J. Ind. Ecol. 2005, 8, 6–9. [Google Scholar] [CrossRef]
- Zhu, Q.; Sarkis, J. An inter-sectoral comparison of green supply chain management in China: Drivers and practices. J. Clean. Prod. 2006, 14, 472–486. [Google Scholar] [CrossRef]
- AlKhidir, T.; Zailani, S. Going green in supply chain towards environmental sustainability. Glob. J. Environ. Res. 2009, 3, 246–251. [Google Scholar]
- Wu, G.C.; Ding, J.H.; Chen, P.S. The effects of GSCM drivers and institutional pressures on GSCM practices in Taiwan’s textile and apparel industry. Int. J. Prod. Econ. 2012, 135, 618–636. [Google Scholar] [CrossRef]
- Diabat, A.; Govindan, K. An analysis of the drivers affecting the implementation of green supply chain management. Resour. Conserv. Recycl. 2011, 55, 659–667. [Google Scholar] [CrossRef]
- Luo, J.; Chong, A.Y.L.; Ngai, E.W.T.; Liu, M.J. Green Supply Chain Collaboration implementation in China: The mediating role of guanxi. Trans. Res. Part E Logist. Trans. Rev. 2014, 71, 98–110. [Google Scholar] [CrossRef]
- Lilly, M. Sustainable Manufacturing: Manufacturing for Sustainability; Manufacturing Skills Australia (MSA): North Sydney, Australia, 2008. [Google Scholar]
- Gutowski, T.; Murphy, C.; Allen, D.; Bauer, D.; Bras, B.; Piwonka, T.; Sheng, P.; Sutherland, J.; Thurston, D.; Wolff, E. Environmentally benign manufacturing: Observations from Japan, Europe and the United States. J. Clean. Prod. 2005, 13, 1–17. [Google Scholar] [CrossRef]
- Zhu, Q.; Sarkis, J.; Geng, Y. Green supply chain management in China: Pressures, practices and performance. Int. J. Oper. Prod. Manag. 2005, 25, 449–468. [Google Scholar] [CrossRef]
- Rehman, M.A.A.; Shrivastava, R.L. An innovative approach to evaluate green supply chain management (GSCM) drivers by using interpretive structural modeling (ISM). Int. J. Innov. Technol. Manag. 2011, 8, 315–336. [Google Scholar] [CrossRef]
- Soo Wee, Y.; Quazi, H.A. Development and validation of critical factors of environmental management. Ind. Manag. Data Syst. 2005, 105, 96–114. [Google Scholar] [CrossRef]
- Sarkis, J. How Green Is the Supply Chain? Practice and Research; Graduate School of Management, Clark University: Worchester, UK, 1999; pp. 1–40. [Google Scholar]
- Berry, M.A.; Rondinelli, D.A. Proactive corporate environmental management: A new industrial revolution. Acad. Manag. Exec. 1998, 12, 38–50. [Google Scholar] [CrossRef]
- Chien, M.K.; Shih, L.H. An empirical study of the implementation of green supply chain management practices in the electrical and electronic industry and their relation to organizational performances. Int. J. Environ. Sci. Technol. (IJEST) 2007, 4, 383. [Google Scholar]
- Kilbourne, W.E.; Beckmann, S.C. Review and Critical Assessment of Research on Marketing and the Environment. J. Mark. Manag. 1998, 14, 513–532. [Google Scholar] [CrossRef]
- Singh, M.D.; Kant, R. Knowledge management barriers: An interpretive structural modeling approach. Int. J. Manag. Sci. Eng. Manag. 2008, 3, 141–150. [Google Scholar]
- Zhu, Q.; Sarkis, J. The moderating effects of institutional pressures on emergent green supply chain practices and performance. Int. J. Prod. Res. 2007, 45, 4333–4355. [Google Scholar] [CrossRef]
- Allen, D.; Bauer, D.; Bras, B.; Gutowski, T.; Murphy, C.; Piwonka, T.; Sheng, P.; Sutherland, J.; Thurston, D.; Wolff, E. Environmentally Benign Manufacturing: Trends in Europe, Japan, and the USA. J. Manuf. Sci. Eng. 2002, 124, 908–920. [Google Scholar]
- Stevels, A. Green Supply chain management, much more than questionnaires and ISO 14.001. In Proceedings of the IEEE International Symposium on Electronics and the Environment, San Francisco, CA, USA, 6–9 May 2002. [Google Scholar]
- Zhu, Q.; Sarkis, J. Relationships between operational practices and performance among early adopters of green supply chain management practices in Chinese manufacturing enterprises. J. Oper. Manag. 2004, 22, 265–289. [Google Scholar] [CrossRef]
- Rao, P.; Holt, D. Do green supply chains lead to competitiveness and economic performance? Int. J. Oper. Prod. Manag. 2005, 25, 898–916. [Google Scholar] [CrossRef]
- Rao, P. Greening the supply chain: a new initiative in South East Asia. Int. J. Op. Prod. Manag. 2002, 22, 632–655. [Google Scholar] [CrossRef]
- Green, K.; Morton, B.; New, S. Greening Organizations Purchasing, Consumption, and Innovation. Organ. Environ. 2000, 13, 206–225. [Google Scholar] [CrossRef]
- Shang, K.C.; Lu, C.S.; Li, S. A taxonomy of green supply chain management capability among electronics-related manufacturing firms in Taiwan. J. Environ. Manag. 2010, 91, 1218–1226. [Google Scholar] [CrossRef] [PubMed]
- Gutowski, T.G. Environmentally benign manufacturing and ecomaterials; Product induced material flows. Mater. Trans. 2002, 43, 359–363. [Google Scholar] [CrossRef]
- Routroy, S. Antecedents and drivers for green supply chain management implementation in manufacturing environment. ICFAI J. Supply Chain Manag. 2009, 6, 20–35. [Google Scholar]
- Hu, A.H.; Hsu, C.W. Empirical study in the critical factors of green supply chain management (GSCM) practice in the Taiwanese electrical and electronics industries. In Proceedings of the 2006 IEEE International Conference on Management of Innovation and Technology, Singapore, 21–23 June 2006. [Google Scholar]
- Chen, Y.S. The Driver of Green Innovation and Green Image: Green Core Competence. J. Bus. Ethics 2008, 81, 531–543. [Google Scholar] [CrossRef]
- Warfield, J.N. Developing subsystem matrices in structural modelling. IEEE Trans. Syst. Man Cybern. 1974, 1, 74–80. [Google Scholar] [CrossRef]
- Sage, A.P. Systems Engineering: Methodology & Applications; IEEE Computer Society Press: Washington, DC, USA, 1977. [Google Scholar]
- Mandal, A.; Deshmukh, S.G. Vendor selection using interpretive structural modelling (ISM). Int. J. Oper. Prod. Manag. 1994, 14, 52–59. [Google Scholar] [CrossRef]
- Jharkharia, S.; Shankar, R. Selection of logistics service provider: An analytic network process (ANP) approach. Omega 2007, 35, 274–289. [Google Scholar] [CrossRef]
- Kannan, G.; Pokharel, S.; Kumar, P.S. A hybrid approach using ISM and fuzzy TOPSIS for the selection of reverse logistics provider. Resour. Conserv. Recycl. 2009, 54, 28–36. [Google Scholar] [CrossRef]
- Saaty, T.L. The Analytic Network Process; RWS Publications: Pittsburgh, PA, USA, 1996. [Google Scholar]
- Saaty, T.L. Fundamentals of the Analytic Hierarchy Process. Available online: http://link.springer.com/chapter/10.1007%2F978-94-015-9799-9_2#page-1 (accessed on 28 March 2017).
- Meade, L.M.; Sarkis, J. Analyzing organizational project alternatives for agile manufacturing processes: An analytical network approach. Int. J. Prod. Res. 1999, 37, 241–261. [Google Scholar] [CrossRef]
- Klausner, M.; Hendrickson, C.T. Reverse-logistics strategy for product take-back. Interfaces 2000, 30, 156–165. [Google Scholar] [CrossRef]
- Webster, S.; Mitra, S. Competitive strategy in remanufacturing and the impact of take-back laws. J. Oper. Manag. 2007, 25, 1123–1140. [Google Scholar] [CrossRef]
- Atasu, A.; Wassenhove, L.N. An Operations Perspective on Product Take-Back Legislation for E-Waste: Theory, Practice, and Research Needs. Prod. Oper. Manag. 2012, 21, 407–422. [Google Scholar] [CrossRef]
- Esenduran, G.; Kemahlıoğlu-Ziya, E.; Swaminathan, J.M. Take-Back Legislation: Consequences for Remanufacturing and Environment. Decis. Sci. 2016, 47, 219–256. [Google Scholar] [CrossRef]
- Esenduran, G.; Kemahlıoğlu-Ziya, E.; Swaminathan, J.M. Impact of Take-Back Regulation on the Remanufacturing Industry. Prod. Oper. Manag. 2017. [Google Scholar] [CrossRef]
- Oraiopoulos, N.; Ferguson, M.E.; Toktay, L.B. Relicensing as a secondary market strategy. Manag. Sci. 2012, 58, 1022–1037. [Google Scholar] [CrossRef]
- Atasu, A.; Toktay, L.B.; Van Wassenhove, L.N. How collection cost structure drives a manufacturer’s reverse channel choice. Prod. Oper. Manag. 2013, 22, 1089–1102. [Google Scholar] [CrossRef]
- Chuang, C.H.; Wang, C.X.; Zhao, Y. Closed-loop supply chain models for a high-tech product under alternative reverse channel and collection cost structures. Int. J. Prod. Econ. 2014, 156, 108–123. [Google Scholar] [CrossRef]
- Zhu, W.; He, Y. Green product design in supply chains under competition. Eur. J. Oper. Res. 2017, 258, 165–180. [Google Scholar] [CrossRef]


| Serial Number | Driving Factors | Explanations | Sources |
|---|---|---|---|
| 1 | EPR-related Laws and Regulations | Laws and regulations are the instruments necessary for governance of business enterprises. EPR-related laws and regulations play an important role in EPR implementation of companies. | Zhu & Sarkis [17]; Alkhidir & Zailani [18]; Wu et al. [19]; Diabat & Govindan [20] |
| 2 | Mimetic Pressure from Competitors | Enterprises whose competitors implement EPR widely need to keep themselves ahead of others. | Luo et al. [21]; Lilly [22]; Gutowasky et al. [23]; |
| 3 | Promotion and Activity of Nongovernmental Organisations | Some promotion activities of e-NGOs promote the implementation of EPR. | Zhu & Sarkis [17]; Zhu et al. [24] |
| 4 | Support of Financing Institutions | Green finance provided by financing institutions to green enterprises encourages enterprises to implement EPR. | Our contributed barrier |
| 5 | Pressure from Consumers | The concern of customers for environment is one of influencing factors of EPR. | Rehman & Shrivastava [25], Soo and Quazi [26]; Sarkis [27]; Berry and Rondinelli [28] |
| 6 | Opportunity in the New Market | EPR implementation creates significant market increase in customer demand for products | Chieh-Yu Lin [29]; Kilbourne and Beckmann [30] |
| 7 | Consciousness of Senior Executives | The consciousness of senior executives to undertake EPR in the enterprise. | Singh and Kant [31]; Zhu and Sarkis [32]; Allen et al. [33]. |
| 8 | Economic Benefit of Recycling | The economic benefit of end-of-life (EOL) products obtained by recyclers. | Stevels [34]; Zhu and Sarkis [35]; and Holt [36]; Rao [37]; Green et al. [38] |
| 9 | Technological Innovative Ability of the Enterprise | The capability of the enterprise to achieve eco design and green manufacturing. | Our contributed barrier |
| 10 | Environmental Hazard of Products | Negative influence on environment, such as soil fertility, poisonous gases, caused by EOL products. | Shang et al. [39]; Gutowski [40] |
| 11 | Reverse Logistics Capability | Reverse logistics is the one of the tools to achieve EPR. | Diabat & Govindan [20], Routroy [41], Rao & Holt [26], Zhu et al. [24], Hu & Hsu [42] |
| 12 | Corporate Image | Being more responsible to the social and environmental impact helps to enhance the enterprise’s image. | Chen [43]; Zhu et al. [32] |
| 12 | 11 | 10 | 9 | 8 | 7 | 6 | 5 | 4 | 3 | 2 | |
|---|---|---|---|---|---|---|---|---|---|---|---|
| 1 | O | V | O | X | O | V | O | V | V | V | V |
| 2 | O | O | O | O | A | V | X | A | O | O | |
| 3 | O | O | A | O | X | V | O | V | V | ||
| 4 | O | O | O | O | O | V | O | X | |||
| 5 | V | X | A | O | A | V | V | ||||
| 6 | O | A | O | A | A | V | |||||
| 7 | X | A | O | A | A | ||||||
| 8 | O | V | A | O | |||||||
| 9 | V | O | X | ||||||||
| 10 | V | O | |||||||||
| 11 | V |
| 1 | 2 | 3 | 4 | 5 | 6 | 7 | 8 | 9 | 10 | 11 | 12 | |
|---|---|---|---|---|---|---|---|---|---|---|---|---|
| 1 | 1 | 1 | 1 | 1 | 1 | 0 | 1 | 0 | 1 | 0 | 1 | 0 |
| 2 | 0 | 1 | 0 | 0 | 0 | 1 | 1 | 0 | 0 | 0 | 0 | 0 |
| 3 | 0 | 0 | 1 | 1 | 0 | 0 | 1 | 1 | 0 | 0 | 0 | 0 |
| 4 | 0 | 0 | 0 | 1 | 1 | 0 | 1 | 0 | 0 | 0 | 0 | 0 |
| 5 | 0 | 1 | 0 | 1 | 1 | 1 | 1 | 0 | 0 | 0 | 1 | 1 |
| 6 | 0 | 1 | 0 | 0 | 0 | 1 | 1 | 0 | 0 | 0 | 0 | 0 |
| 7 | 0 | 0 | 0 | 0 | 0 | 0 | 1 | 0 | 0 | 0 | 0 | 1 |
| 8 | 0 | 1 | 1 | 0 | 1 | 1 | 1 | 0 | 0 | 0 | 1 | 0 |
| 9 | 1 | 0 | 0 | 0 | 0 | 1 | 1 | 1 | 1 | 1 | 0 | 0 |
| 10 | 0 | 0 | 1 | 0 | 1 | 0 | 0 | 1 | 1 | 1 | 0 | 1 |
| 11 | 0 | 0 | 0 | 0 | 1 | 1 | 1 | 0 | 0 | 0 | 1 | 1 |
| 12 | 0 | 0 | 0 | 0 | 0 | 0 | 1 | 0 | 0 | 0 | 0 | 1 |
| 1 | 2 | 3 | 4 | 5 | 6 | 7 | 8 | 9 | 10 | 11 | 12 | DriverPower | |
|---|---|---|---|---|---|---|---|---|---|---|---|---|---|
| 1 | 1 | 1 | 1 | 1 | 1 | 1 | 1 | 1 | 1 | 1 | 1 | 1 | 12 |
| 2 | 0 | 1 | 0 | 0 | 0 | 1 | 1 | 0 | 0 | 0 | 0 | 1 | 4 |
| 3 | 0 | 1 | 1 | 1 | 1 | 1 | 1 | 1 | 0 | 0 | 1 | 1 | 9 |
| 4 | 0 | 1 | 0 | 1 | 1 | 1 | 1 | 0 | 0 | 0 | 1 | 1 | 7 |
| 5 | 0 | 1 | 0 | 1 | 1 | 1 | 1 | 0 | 0 | 0 | 1 | 1 | 7 |
| 6 | 0 | 1 | 0 | 0 | 0 | 1 | 1 | 0 | 0 | 0 | 0 | 1 | 4 |
| 7 | 0 | 0 | 0 | 0 | 0 | 0 | 1 | 0 | 0 | 0 | 0 | 1 | 2 |
| 8 | 0 | 1 | 1 | 1 | 1 | 1 | 1 | 1 | 0 | 0 | 1 | 1 | 9 |
| 9 | 1 | 1 | 1 | 1 | 1 | 1 | 1 | 1 | 1 | 1 | 1 | 1 | 12 |
| 10 | 1 | 1 | 1 | 1 | 1 | 1 | 1 | 1 | 1 | 1 | 1 | 1 | 12 |
| 11 | 0 | 1 | 0 | 1 | 1 | 1 | 1 | 0 | 0 | 0 | 1 | 1 | 7 |
| 12 | 0 | 0 | 0 | 0 | 0 | 0 | 1 | 0 | 0 | 0 | 0 | 1 | 2 |
| Dependence Power | 3 | 10 | 5 | 8 | 8 | 10 | 12 | 5 | 3 | 3 | 8 | 12 |
| Criteria | Reachability Set R (Si) | Antecedent Set A (Si) | Intersection Set R (Si) ∩ A (Si) | Level |
|---|---|---|---|---|
| S7 | S7, S12 | S1, S2, S3, S4, S5, S6, S7, S8, S9, S10, S11, S12 | S7, S12 | I |
| S12 | S7, S12 | S1, S2, S3, S4, S5, S6, S7, S8, S9, S10, S11, S12 | S7, S12 | I |
| S2 | S2, S6 | S1, S2, S3, S4, S5, S6, S8, S9, S10, S11 | S2, S6 | II |
| S6 | S2, S6 | S1, S2, S3, S4, S5, S6, S8, S9, S10, S11 | S2, S6 | II |
| S4 | S4, S5, S11 | S1, S3, S4, S5, S8, S9, S10, S11 | S4, S5, S11 | III |
| S5 | S4, S5, S11 | S1, S3, S4, S5, S8, S9, S10, S11 | S4, S5, S11 | III |
| S11 | S4, S5, S11 | S1, S3, S4, S5, S8, S9, S10, S11 | S4, S5, S11 | III |
| S3 | S3, S8 | S1, S3, S8, S9, S10 | S3, S8 | IV |
| S8 | S3, S8 | S1, S3, S8, S9, S10 | S3, S8 | IV |
| S1 | S1, S9, S10 | S1, S9, S10 | S1, S9, S10 | V |
| S9 | S1, S9, S10 | S1, S9, S10 | S1, S9, S10 | V |
| S10 | S1, S9, S10 | S1, S9, S10 | S1, S9, S10 | V |
| Goal | D1 | D2 | D3 | D4 | S1 | S2 | S3 | S4 | S5 | S6 | S7 | S8 | S9 | S10 | S11 | S12 | |
|---|---|---|---|---|---|---|---|---|---|---|---|---|---|---|---|---|---|
| Goal | |||||||||||||||||
| D1 | 0.534 | 0.307 | 0.357 | 0.322 | |||||||||||||
| D2 | 0.088 | 0.066 | 0.071 | 0.043 | |||||||||||||
| D3 | 0.288 | 0.330 | 0.134 | 0.135 | |||||||||||||
| D4 | 0.090 | 0.104 | 0.059 | 0.071 | |||||||||||||
| S1 | 0.500 | 0.712 | 0.688 | ||||||||||||||
| S2 | 0.192 | 0.043 | 0.038 | 0.277 | 0.010 | ||||||||||||
| S3 | 0.044 | 0.016 | 0.008 | 0.004 | |||||||||||||
| S4 | 0.071 | 0.030 | 0.057 | 0.019 | |||||||||||||
| S5 | 0.192 | 0.155 | 0.225 | 0.050 | 0.029 | 0.108 | |||||||||||
| S6 | 0.250 | 0.790 | 0.745 | 0.758 | 0.113 | 0.702 | |||||||||||
| S7 | 0.152 | 0.486 | 0.210 | 0.198 | 0.775 | 0.071 | 0.723 | 0.146 | 0.051 | 0.095 | |||||||
| S8 | 0.250 | 0.745 | 0.113 | 0.219 | |||||||||||||
| S9 | 0.033 | 0.049 | 0.007 | ||||||||||||||
| S10 | 0.179 | 0.111 | 1.000 | 0.052 | 0.095 | ||||||||||||
| S11 | 0.090 | 0.073 | 0.015 | 0.029 | |||||||||||||
| S12 | 0.179 | 0.111 | 1.000 | 0.052 | 0.095 |
| Name | Priorities |
|---|---|
| S1 EPR-related Laws and Regulations | 0.534 |
| S2 Mimetic Pressure from Competitors | 0.04676 |
| S3 Promotion and Activity of NGOs | 0.00516 |
| S4 Support of Financing Institution | 0.00684 |
| S5 Pressure from Consumers | 0.02925 |
| S6 Opportunity of New Market | 0.07556 |
| S7 Consciousness of Senior Executives | 0.14448 |
| S8 Economic Benefit of Recycling | 0.01444 |
| S9 Technological Innovative Ability of the Enterprise | 0.00014 |
| S10 Environmental Hazard of Products | 0.00028 |
| S11 Reverse Logistics Capability | 0.00028 |
| S12 Corporate Image | 0.14282 |
© 2017 by the authors. Licensee MDPI, Basel, Switzerland. This article is an open access article distributed under the terms and conditions of the Creative Commons Attribution (CC BY) license (http://creativecommons.org/licenses/by/4.0/).
Share and Cite
Zheng, X.; Xu, F.; Feng, L. Analysis of Driving Factors for Extended Producer Responsibility by Using Interpretative Structure Modelling (ISM) and Analytic Network Process (ANP). Sustainability 2017, 9, 540. https://doi.org/10.3390/su9040540
Zheng X, Xu F, Feng L. Analysis of Driving Factors for Extended Producer Responsibility by Using Interpretative Structure Modelling (ISM) and Analytic Network Process (ANP). Sustainability. 2017; 9(4):540. https://doi.org/10.3390/su9040540
Chicago/Turabian StyleZheng, Xiong, Fangchao Xu, and Lipan Feng. 2017. "Analysis of Driving Factors for Extended Producer Responsibility by Using Interpretative Structure Modelling (ISM) and Analytic Network Process (ANP)" Sustainability 9, no. 4: 540. https://doi.org/10.3390/su9040540