
Analysis of the Barriers to Widespread Adoption of Electric Vehicles in Shenzhen China

1
Research Center for Modern Logistics, Graduate School at Shenzhen, Tsinghua University, Tsinghua Campus, The University Town, Shenzhen 518055, China
2
Research Center for Intelligent Logistics and Transportation, Tsinghua-Berkeley Shenzhen Institute, The University Town, Shenzhen 518055, China
*
Author to whom correspondence should be addressed.
Sustainability 2017, 9(4), 522; https://doi.org/10.3390/su9040522
Submission received: 3 December 2016
/
Revised: 18 March 2017
/
Accepted: 24 March 2017
/
Published: 30 March 2017
(This article belongs to the Section Energy Sustainability)
Abstract
:China promoted the large-scale adoption of Electric Vehicles (EVs) in its 13th five-year plan; however, this target faces many obstacles. This paper analyzes the main barriers to widespread adoption of EVs through a survey in Shenzhen, which has the biggest EVs market share out of China’s major cities. Based on previous research, this paper conducted a new study using 406 approved questionnaires among 500 participants. Our study proposed five hypotheses to examine the main barriers to widespread adoption of EVs. The analysis was conducted using statistical method that included two-way frequency tables, chi-square test, and factor analysis. The results indicated that perception of advantages of EVs and access to recharging EVs remained the main barriers in large-scale penetration. Furthermore, our study revealed that a drop in financial incentives would not cause a significant decline in the future adoption of EVs. The study provides suggestions to car manufacturers and government policy advisors based on our analysis and discussion.
1. Introduction
Electric vehicles (EVs) are classified based on their fuel technologies, of which there are four types: plug-in hybrid electric vehicles (PHEVs), extended-range battery electric vehicles (E-REVs), battery electric vehicles (BEVs), and hybrid electric vehicles (HEVs) [1]. It has been proposed that EVs are a good solution for the problem of GHGs (greenhouse gases) caused by transportation and air pollutant emissions [2]. Most developed countries are carrying out a variety public policies and financial incentives for the large-scale adoption of EVs. In the existing literature, much research focused on the topics of consumer choice, recharging station placement, and the economic analysis of EV promotion [3,4,5,6,7,8,9,10]
Despite a broad consensus on the large-scale adoption of EVs in the world, its benefits and realization ultimately falls on the willingness of consumers to accept new technology. According to a survey conducted in 2008, 69% of US consumers have little or no familiarity with the technology of PHEVs [3]. A later research also showed that people could not accept premiums for the adoption of EVs [4]. To fully understand the behavior behind a consumer’s choice, another survey was conducted in major US cities to examine the consumer’s willingness and attitude towards plug-in electric cars. The results revealed that the overall ratio of the desire to buy or lease electric vehicles is small. However, interest in the PHEVs technology is greater than that of the EVs [5]. Furthermore, when considering range anxiety, a barrier to EVs adoption, several studies have inferred that people are not willing to choose EVs due to range anxiety and inconvenient recharging access [6].
Much of the previous literature in this area analyzed the consumer’s opinion, desire and attitude toward EVs, and also examines other societal or psychological influences on the adoption of EVs [7]. The findings showed that attitudes, knowledge and perception related to EVs differ across gender, age, and education groups [7,8]. Furthermore, the previous study also suggested that the adoption of EVs were influenced by public policies, financial incentives, and energy price [9]. Additionally, many previous studies aimed at investigating pro-environmental lifestyle, technology oriented lifestyle and openness of to change. Another survey was conducted to explore the environment awareness of consumers, technology views, experiences and interest in EVs. The results indicated that sustainability and environmental benefits of EVs have a major influence on EVs adoption, and a major potential barriers to widespread EVs adoption is the uncertainty associated with the EVs battery technology and sustainability of fuel source. As we know, China is the second biggest market for car manufacturers in the world; however, there have been few studies on the penetration behavior and patterns of Chinese consumers with regard to electric cars. This study extends previous research by conducting a new survey in Shenzhen, China.
Since 2009, China has become the largest car producer and the second largest market consumer of passenger vehicles in the world. The demographic data published by the government shows that the market share of EVs in China has surpassed that of the US in terms of production and sales data issued online on 13 August 2015 [10]. Furthermore, it is well-known that Shenzhen is one of the most innovative cities and is an EVs demonstration town in China, which has played a significant contribution in their innovation and the openness of the global market. These factors make Shenzhen an excellent case study for studying the status of EV adoption and the buying behavior of consumers. Previous research also shows that there are significant differences that exist in the values and decision-making process between Western and Chinese people [11,12]. Other results have indicated that in The Netherlands, consumers pay high attention to value and safety. The French favor design, style, and fashion in car advertisements [13], while German and Italian consumers share similar characteristics with the French in preferring fast, advanced technology, and smart, multifunctional vehicles. In contrast, Americans consider cars as a symbol of status and seek big, powerful vehicles [13]. Moreover, a new interview study was conducted in US, which examined the consumer purchasing behavior, acceptance and barriers toward PHEVs [14,15]. However, the evidence was still unclear as to how Chinese consumers felt regarding EVs.
This study conducted a survey among the residents of Shenzhen residents. Participants had to have at least 3–10 years of driving experience and were acutely aware of cars and urban transportation conditions. Furthermore, at least one-third of respondents had to have experience driving EVs. The survey focused on the participant’s preference for EVs, as well as their willingness and attitudes towards these vehicles.
2. Material and Methods
This paper examined the consumer consumption behavior of Chinese people towards EVs through a questionnaire undertaken in the city of Shenzhen. Based on the literature reviewed in the introduction, previous research revealed barriers to widespread adoption of EVs. Furthermore, earlier findings showed that cross-cultural differences influenced the purchasing intent of consumers towards vehicles. Another Chinese research also revealed that product branding significantly affected the buying intent of consumers for vehicles other than company brands [16]. Hence, this paper proposed five hypotheses and tried to confirm it by analysis.
- hypotheses# 1:
- The participants showed more preference for EVs with a local brand and elegant style;
- hypotheses# 2:
- The participants’ attitude toward EVs depends on the perception of the advantages of EV technology compared with in combustion engine vehicles (ICEVs);
- hypotheses# 3:
- The buying willingness of participants depends on the access to recharging EVs;
- hypotheses# 4:
- The high price of EVs is a critical barrier in purchasing willingness; and
- hypotheses# 5:
- Consumer purchasing willingness will decrease if financial subsidies drop significantly.
To examine these hypotheses, a survey conducted among the residents of Shenzhen will assist in developing new energy products such as EVs, PHEVs, and solar powered products. BYD (brand name of one China EVs manufacturer)—a well-known EV producer in China—has a diverse range of EVs selling across the global market. BYD’s EV products cover electric passenger cars, electric buses and electrical engineering vehicles such as the BYD K9, electronic van T5, and electric truck T7. Furthermore, the total miles of EVs running in Shenzhen has already achieved 150 million kilometers, with at least 1000 electric taxis, and 3000 electric buses operating in Shenzhen over the past three years [17]. Hence, Shenzhen residents have a shorter distance to close EVs. Although Shenzhen has a population of 1,178,900, the registered population was 3,549,900 from the Shenzhen government’s published data. Most of the other residents came from different provinces of China. Thus, this study chose to target only Shenzhen residents , which was considered to be representative of the normal status, instead of a particular case.
The study collected survey data among Shenzhen residents including drivers experienced with EVs, EV consumers, or residents familiar with EVs. This research recruited participants and expressed the value of the study and their contribution by website. Each participant received RMB100 as a bonus, with a total of 500 questionnaires distributed. In total, there were 406 usable cases with a response rate of 81.2%.
The study used statistical methods including: two-way frequency tables, chi-square, the Fisher’s test, and factor analysis to examine the differences between the causes and consumer willingness. In the chi-square and Fisher’s test, the study used a standard 5% or 0.05 cut-off for defining the significant difference. An associated p-value less than 0.05 showed significant differences. Furthermore, the study also conducted a factor analysis to explore the relationship between the causes and dependent variables using IBM SPSS software. The following sections present the survey and statistical result based on these methods.
3. Data and Control
Some questionnaires were discarded if participants did not respond in the survey. Furthermore, a preliminary test showed that the questionnaire needed at least 10 min to complete. The mean value of the time spent on completing the questionnaire was 17 min, and four questionnaires were removed due to a time of less than 3 min being spent on answering the questions. There were 52 questions in the survey which set up with multiple choice answers (e.g., not at all, a little, somewhat, a lot). Additionally, for statistical analysis answer choices were scored depending on the degree (“not at all” = 1, “a little” = 2, “somewhat” = 3, “a lot” = 4).
The survey was categorized into four sections: (1) basic information such as age, gender, income, education, occupation, driving experiences, home ownership and travel pattern; (2) preference for EVs, and the EV characteristics pursued by consumers; (3) purchasing willingness and attitude toward EVs such as the present consumer’s real willingness and attitude toward EVs; and (4) public policy and financial incentives which represent the main public policy and financial incentives currently established in China.
4. Results
4.1. Sample Description and Basic Information
The research aim was to examine the willingness of consumers to buy EVs and their attitudes towards them to reveal the main barriers to their widespread adoption in China. Furthermore, these results could be used as a basis for public policy development in other cities in China.
The study collected 406 usable questionnaires, of which males respondents accounted for 76.4% of the whole population (n = 310), and 23.6% were females (n = 96). The age of the respondents was mainly concentrated between 22 and 35 years old bracket and accounted for 53.4% of the whole population. Age group over 35 years old accounted for 45.5% and ranked second , and only 5 participants were less than 22 years old.
With regard to the occupation of the respondents, most of them were office workers (40.4%) of the total participants, with private firms owners ranked second, and senior management group third. A further 9.4% were research and design engineers, and the rest were university students. The overall sample population represents potential consumers of EVs and the demographic distribution is showed in Table 1.
The survey also summarized the respondents’ driving experiences, income level, home ownership and trip patterns. Most respondents owned private cars and apartments. According to annual income, more than 50% of respondents were of the middle or even the middle high classes in China. Furthermore, one-third of survey respondents had previous driving experiences with EVs or PHEVs.
4.2. The Preference for EVs
Based on statistical analysis (Figure 1), 59.3% (n = 242) of respondents favored Chinese EV brands, 17.9% (n = 73) preferred Germany brands, 15.9% (n = 65) of respondents aspired to American brands, and the last 6.9% (n = 28) preferred Japanese brands. Furthermore, the Fisher’s test results (p-value = 0.007) revealed significant differences between gender and consumers’ preference for EV brands in Table 2. Males expressed greater interest in Chinese EV brands, while females preferred Germany brands. A subsequent Fisher’s test (p-value = 0.004) revealed that 68.3% of office workers and 65.8% of Research and Design (R&D) engineers also preferred Chinese brands. Similarly, private firm owner and senior management preferred Chinese brands and accounted for 57.6% and 47.6% respectively. When asked about car style, males showed a higher preference for sport utility vehicle (SUV) PHEVs than females, and females showed more interest in hatchback cars than men.
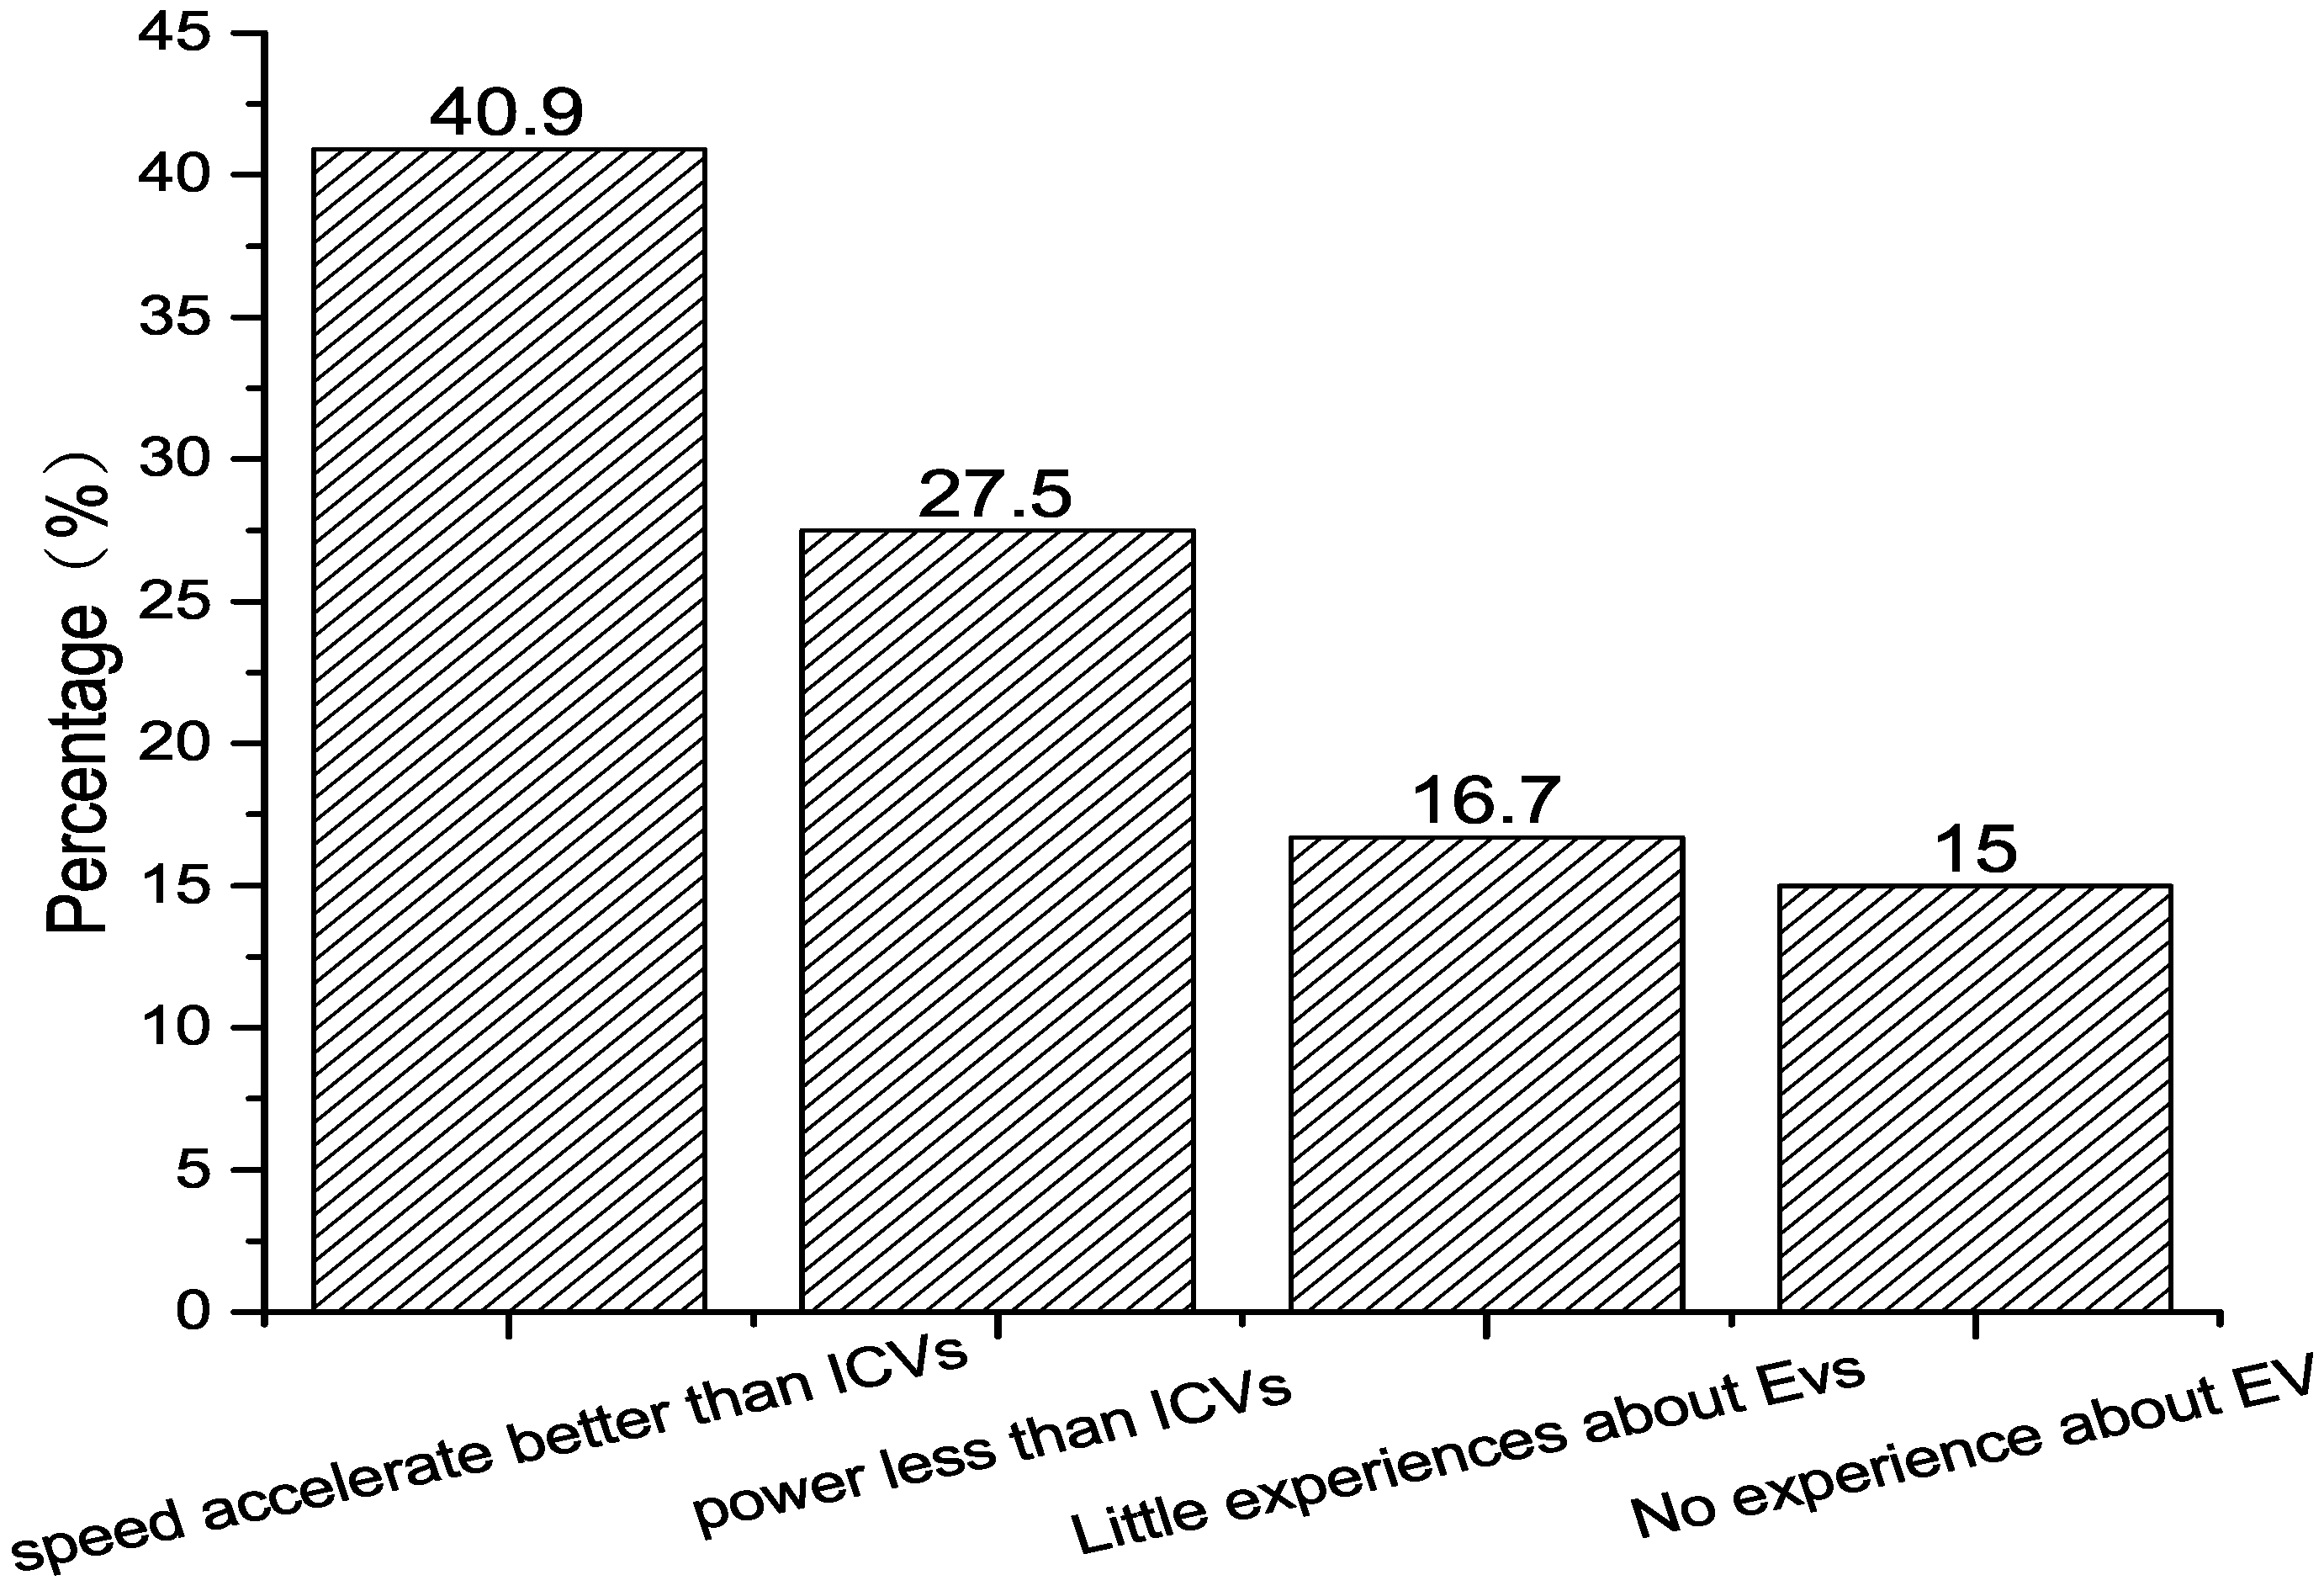
As seen in Figure 2, 55.7% of participants had private cars, and 68.4% (n = 279) had driving experiences with EVs. The Fisher tests (p-value = 0.029) showed little differences between gender and EVs experience in Table 3; however, males showed more experiences than females. There were no other significant differences between driving experience and factors such as age (p-value = 0.654), income level (p-value = 0.318), occupation (p-value = 0.135), home ownership (p-value = 0.214) and region (p-value = 0.463). However, there were significant differences between driving experience and perception of EVs (p-value = 0.006).
The study also analyzed the primary factors by SPSS, and the results are shown in Table 4, Table 5 and Table 6 and Figure 3. The research inferred the common items presented in Table 6 and offered common factors with an absolute value greater than sorted below:
- Environment awareness and energy security: Respondents have high awareness of environment protection.
- Private car demand: Consumers desire to buy car for transportation need
- EVs Operation cost: Consumers monthly travel cost.
- EVs Characteristics: Low operation cost, zero exhaust emissions, status symbol, etc.
- Daily travel mileage: Consumers daily travel mileage.
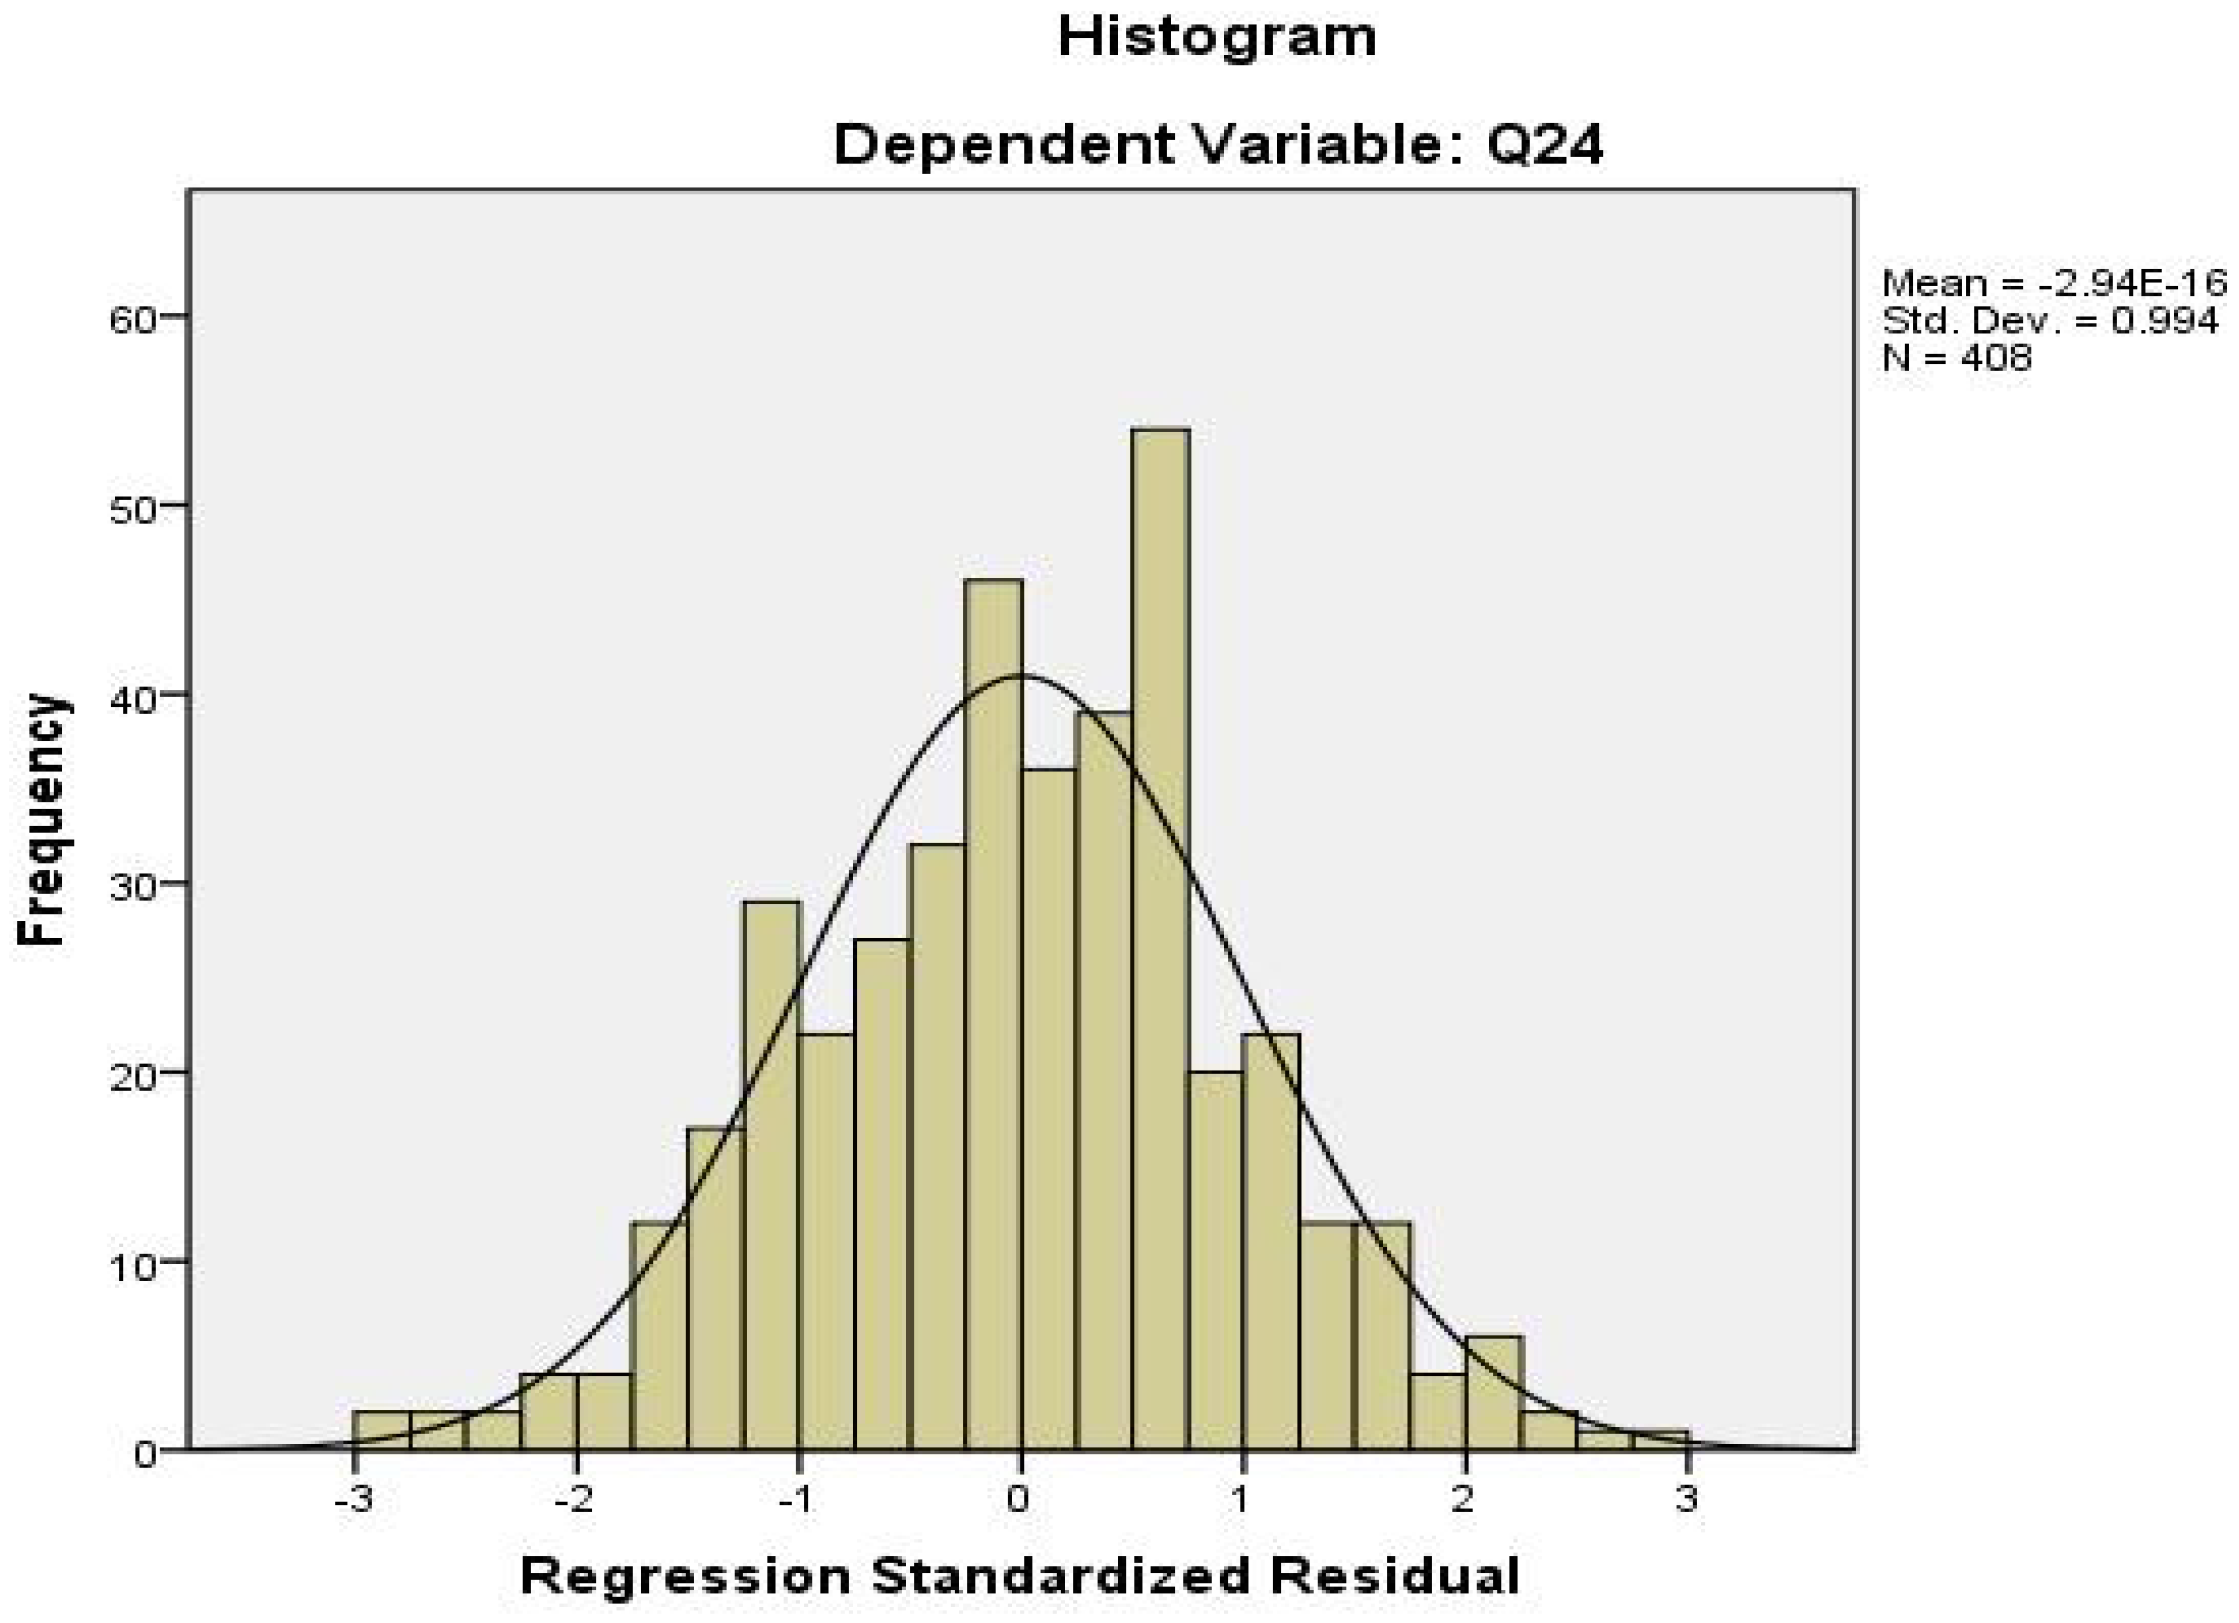
To further examine the associations between consumer preference and the specific factors, the study conducted a regression by SPSS (Statistical Products and Service Solutions). The regression residual distribution test (Figure 3) showed the regression equation was valid.
Table 6 shows the results of regression performed by SPSS and is explained by the equation as below:
4.3. Consumers Purchasing Willingness and Attitude
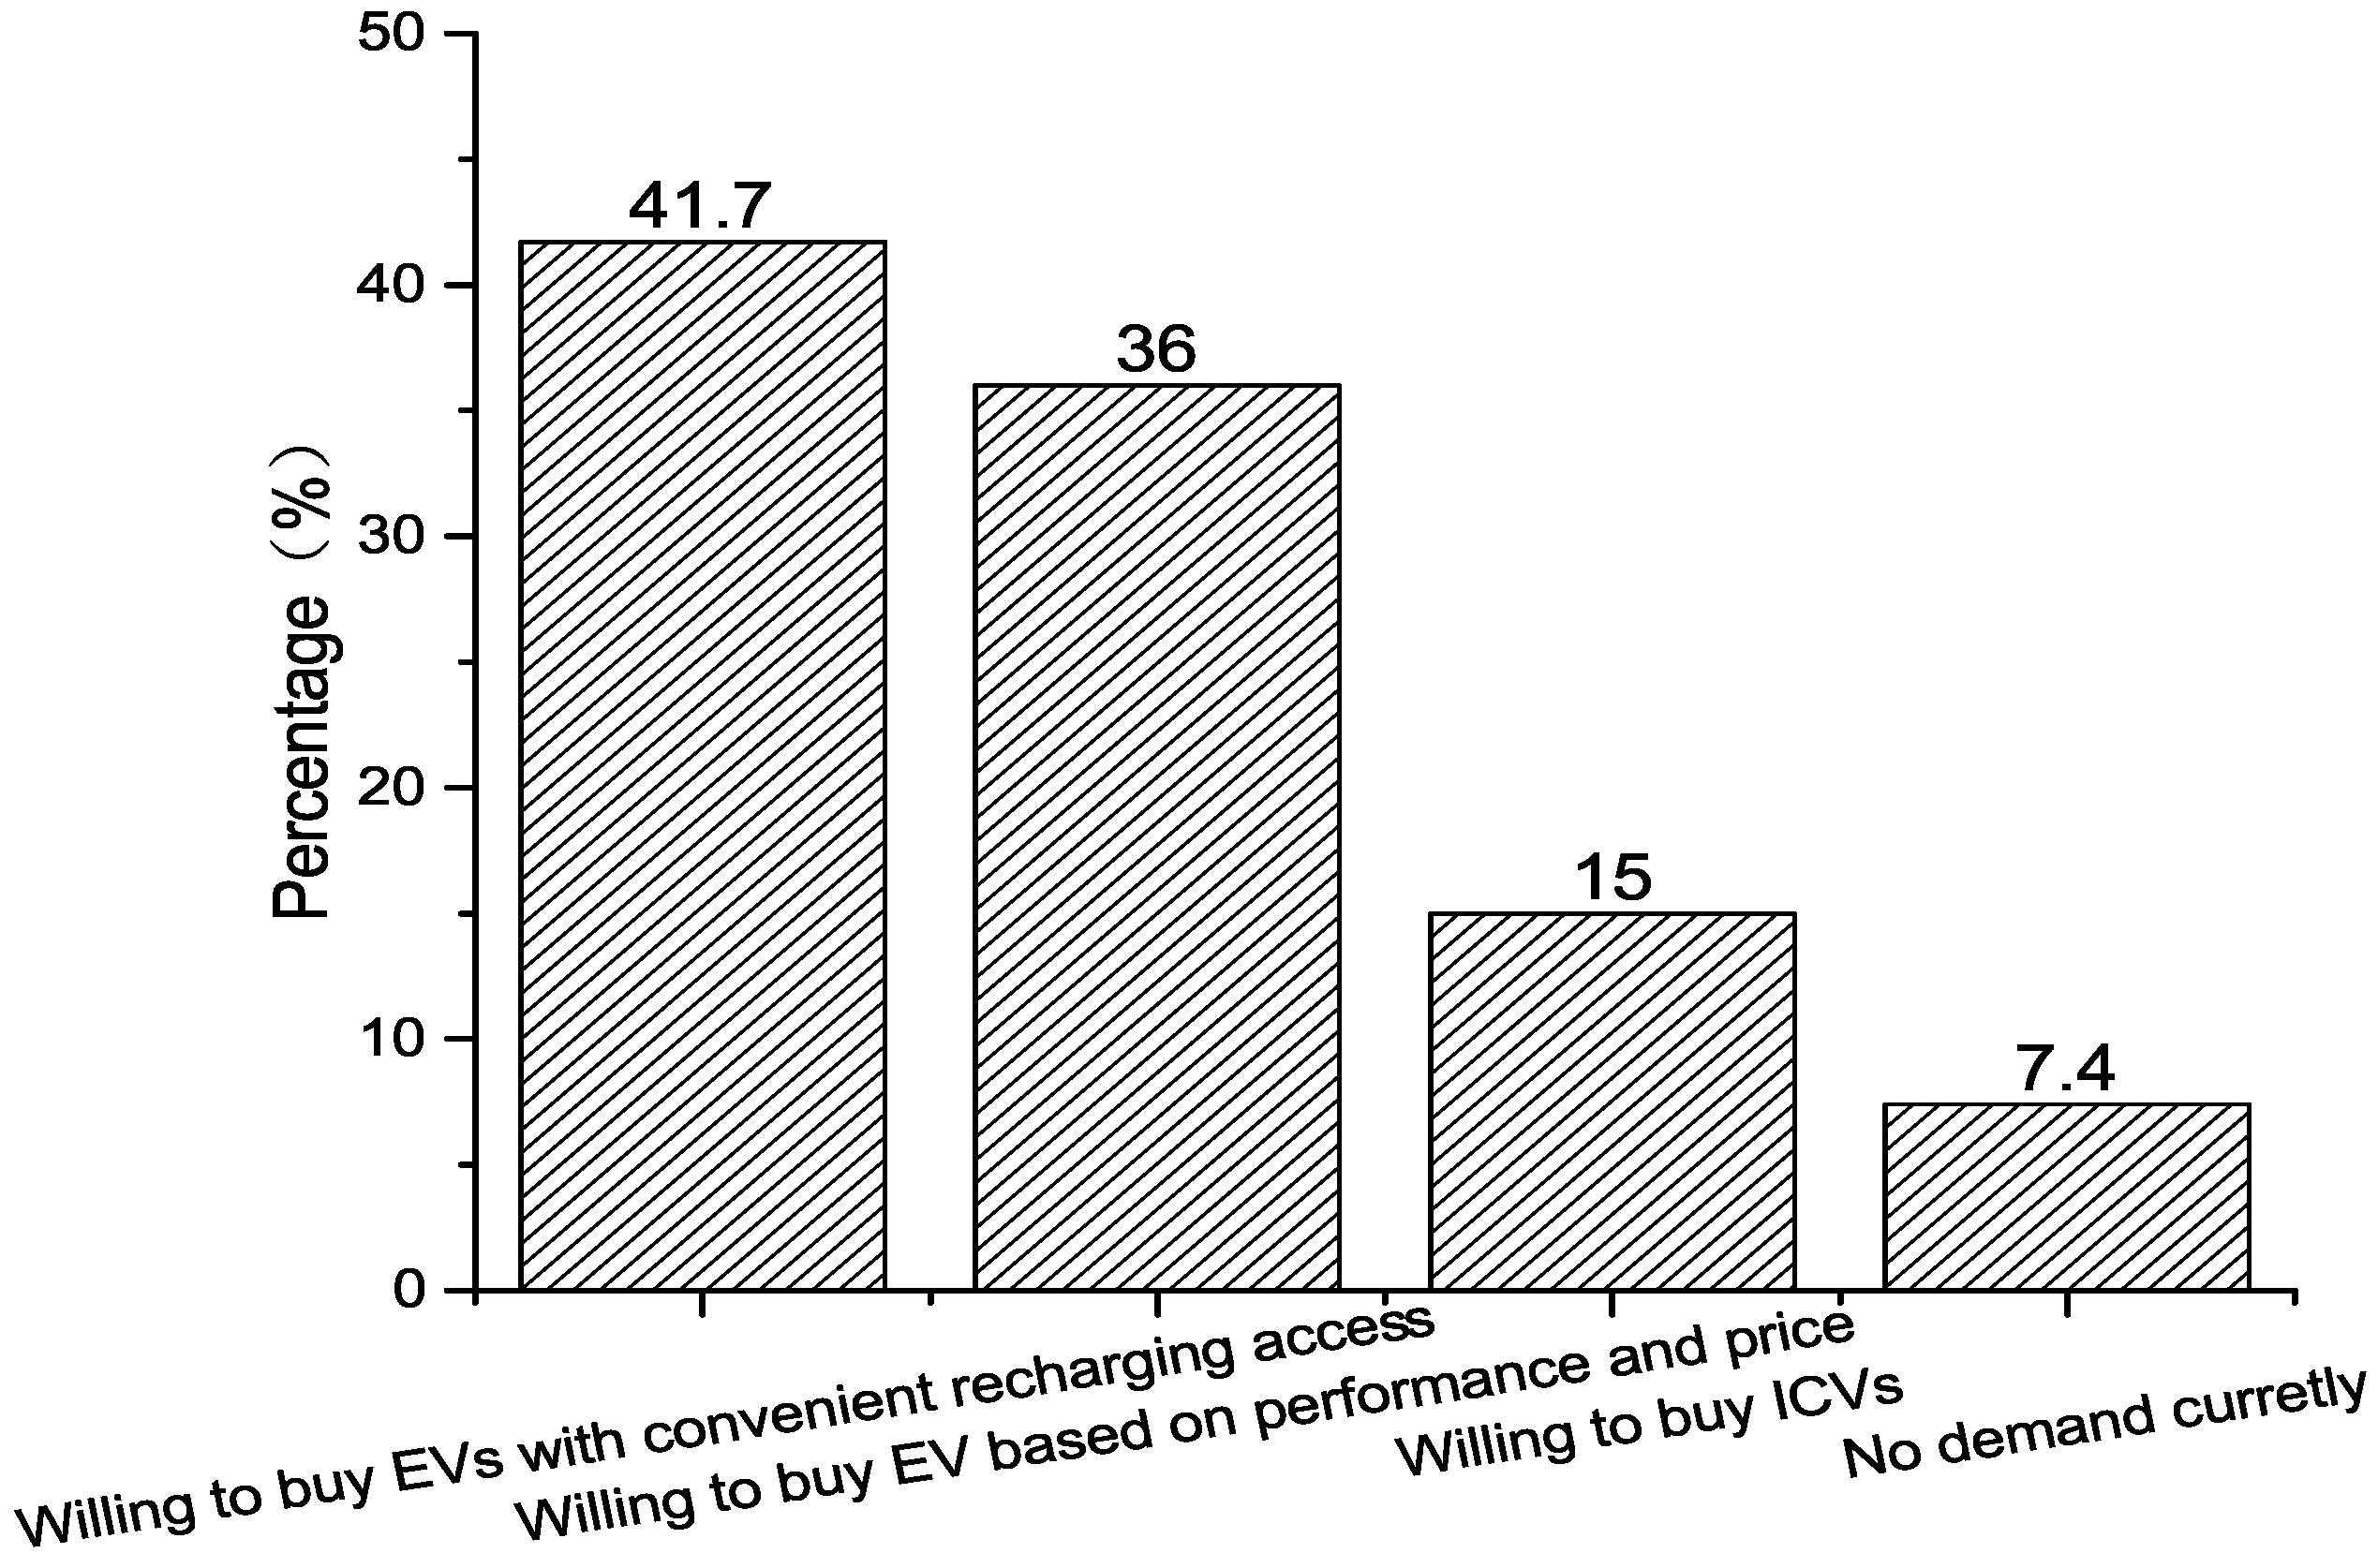
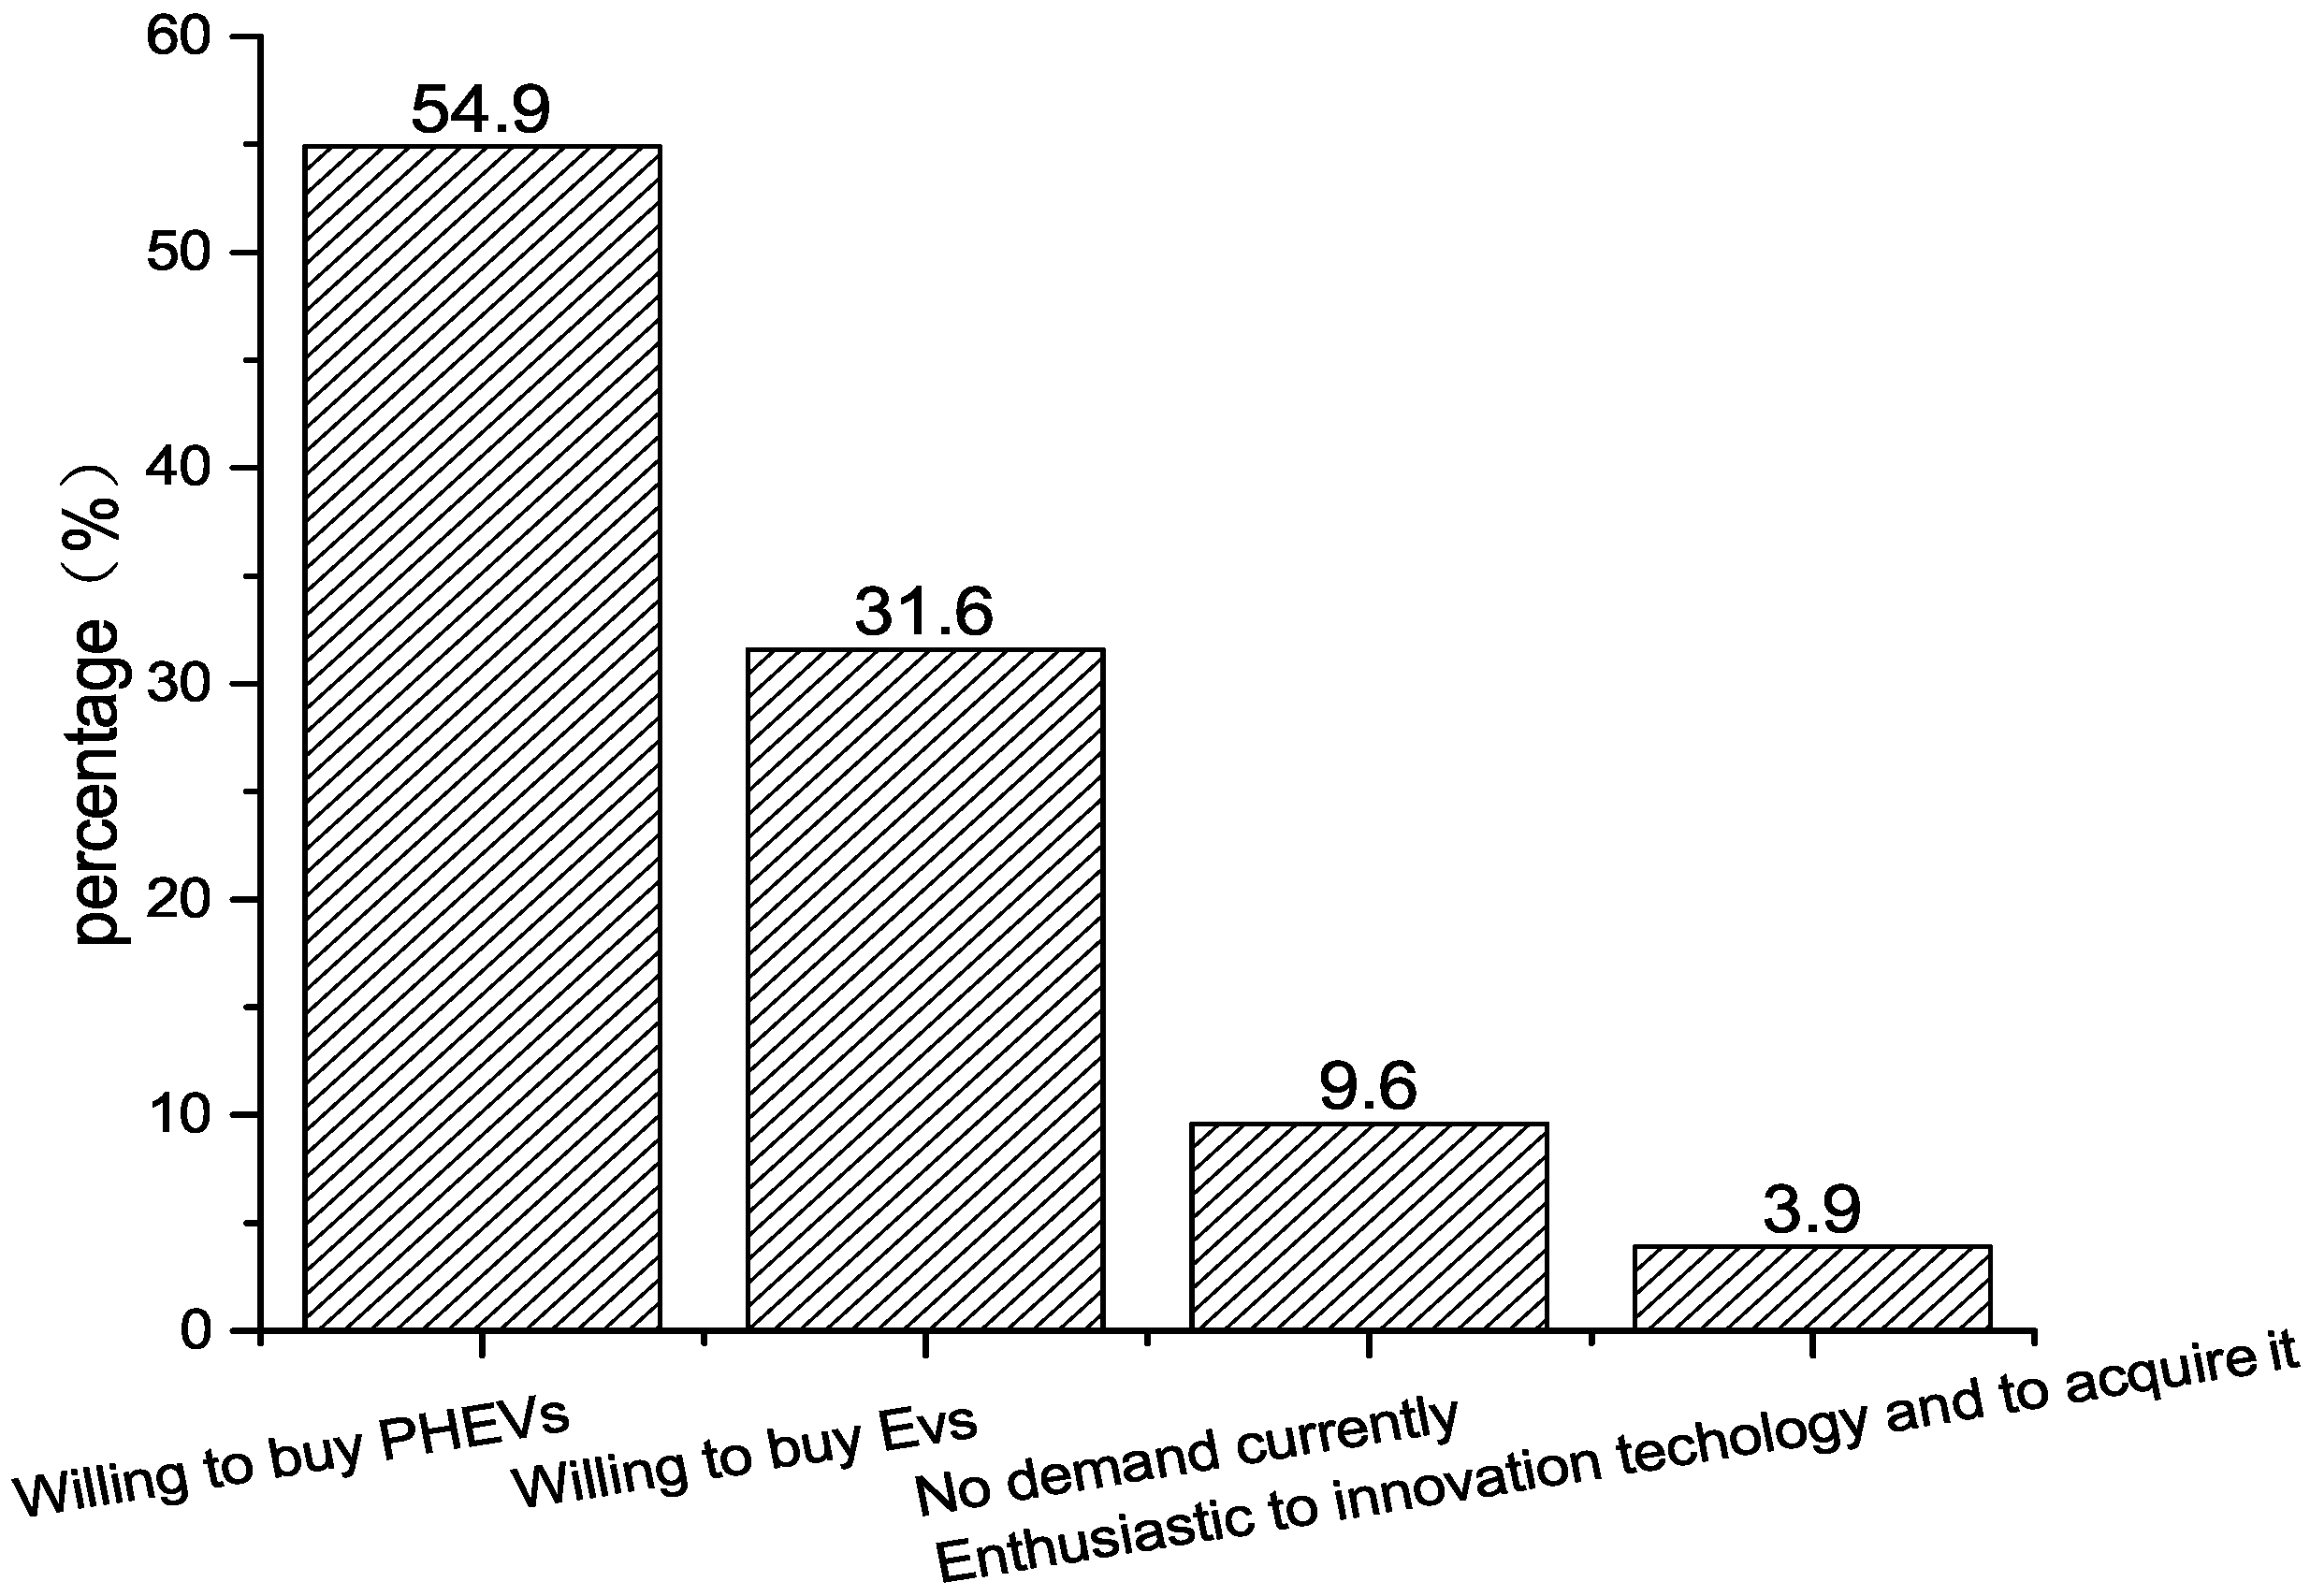
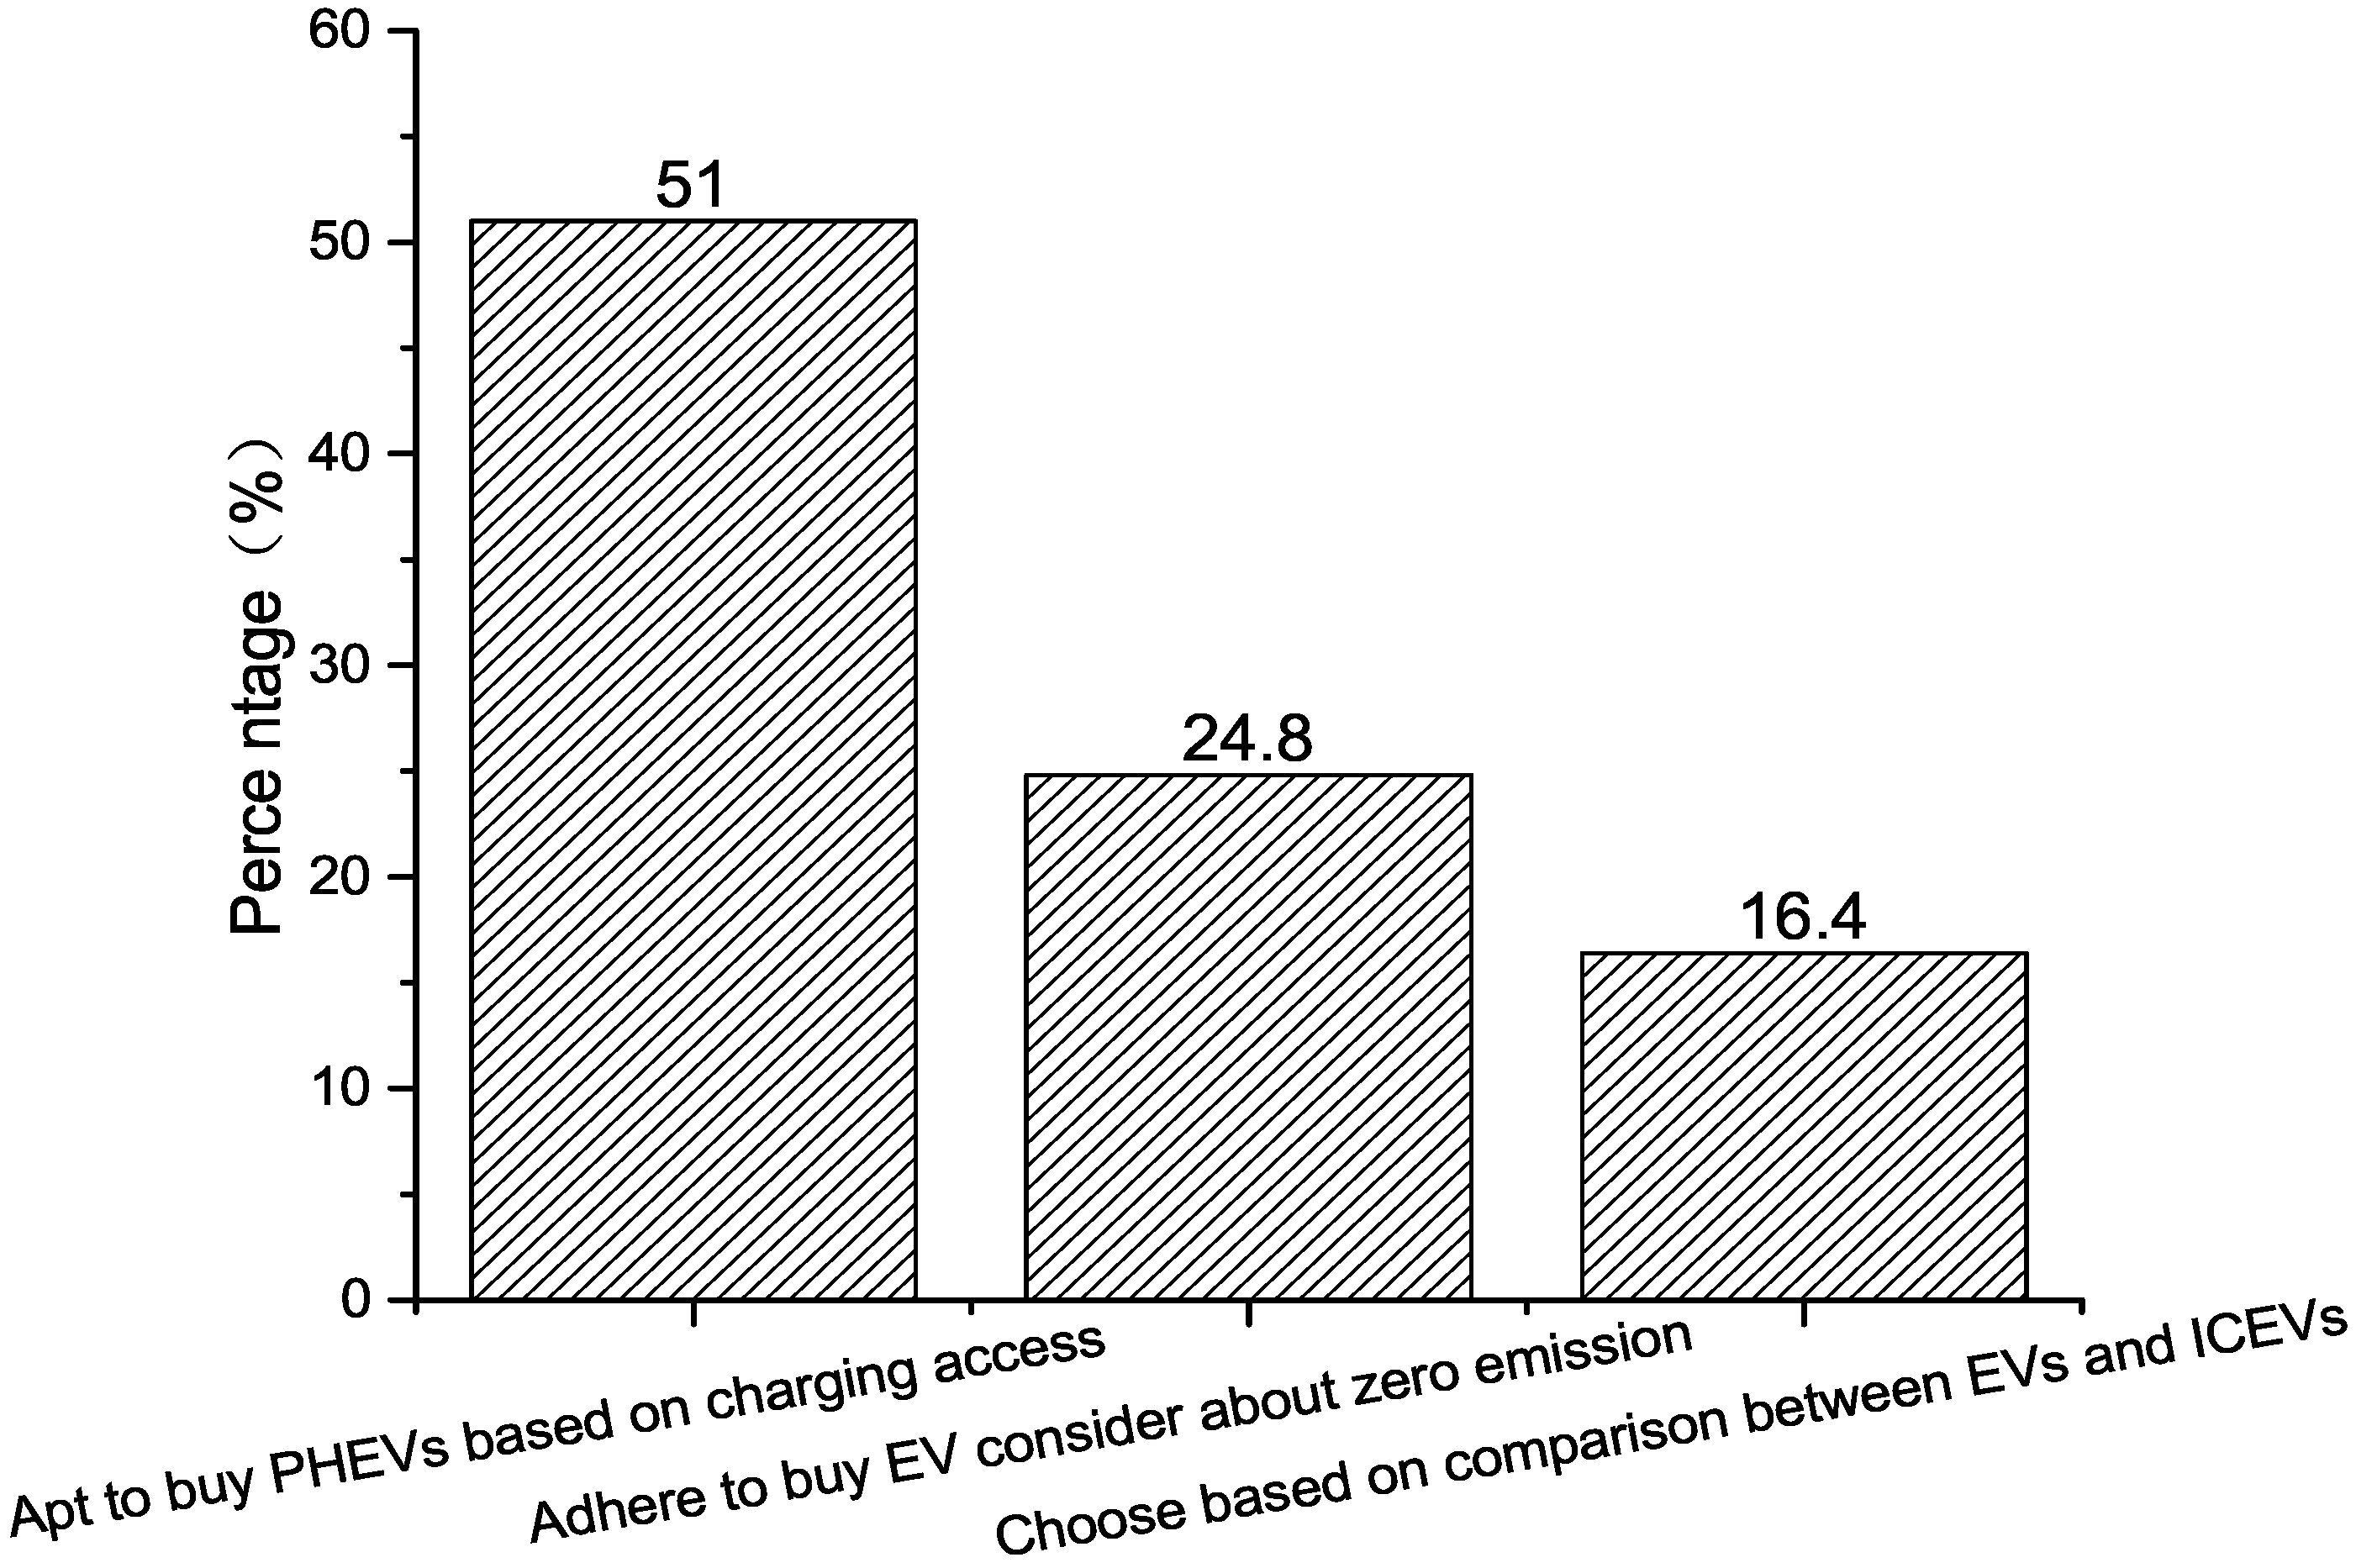
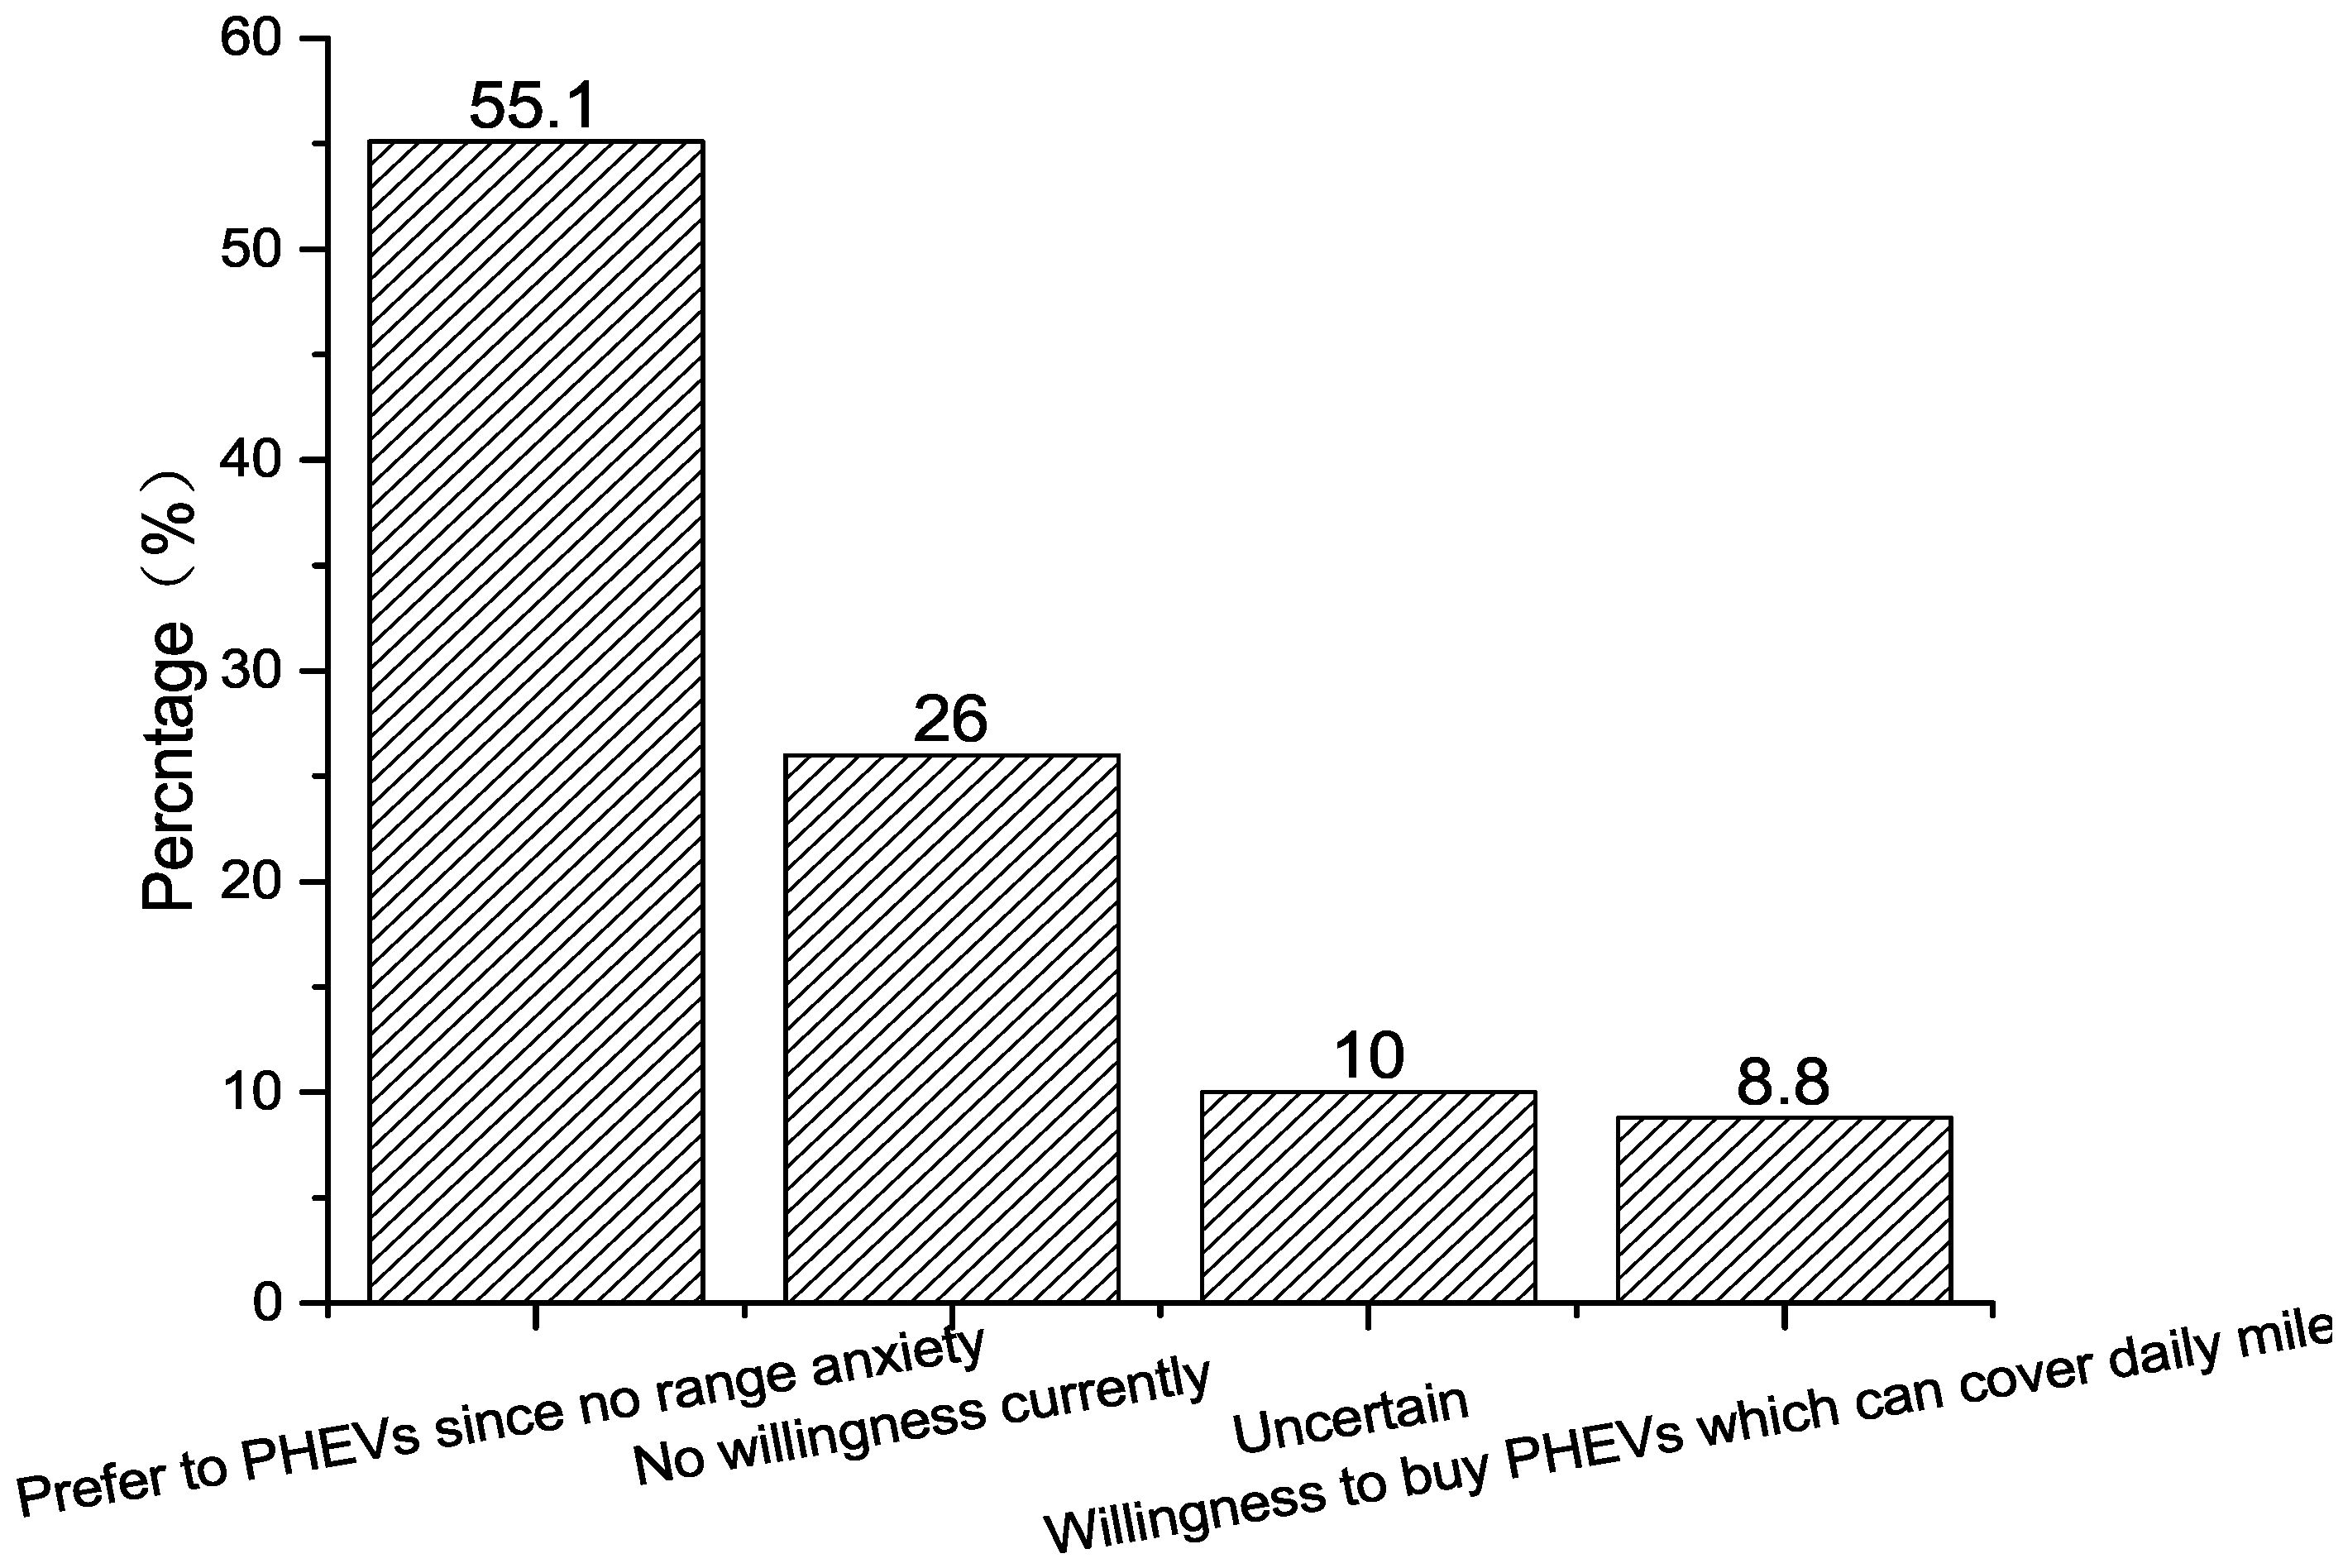
With regard to purchasing willingness for EVs, the study also examined the response of first-time car buyers. Figure 4 showed that 41.7% (n = 170) of respondents who wished to buy EVs considered the convenient recharging stations, 36% (n = 147) expressed strong interests in EVs due to their advantages. Furthermore, it examined the willingness of buyers for EVs as the second car, which revealed that 54.9% (n = 224) (Figure 5) had more willingness than before, and 31.6% (n = 129) had the desire to buy EVs as the second car. Thus, there was an 8.8% (n = 129) increase in the willingness of participants compared to the first-time. However, further analysis showed significant differences between occupation (p-value = 0.025), income level (p-value = 0.021) and buying desire. It revealed that office workers had more desire to buy EVs than others as did middle-income level respondents. Additionally, the survey showed that if the respondent had a private car and driving experiences, he or she was more likely to buy EVs than others.
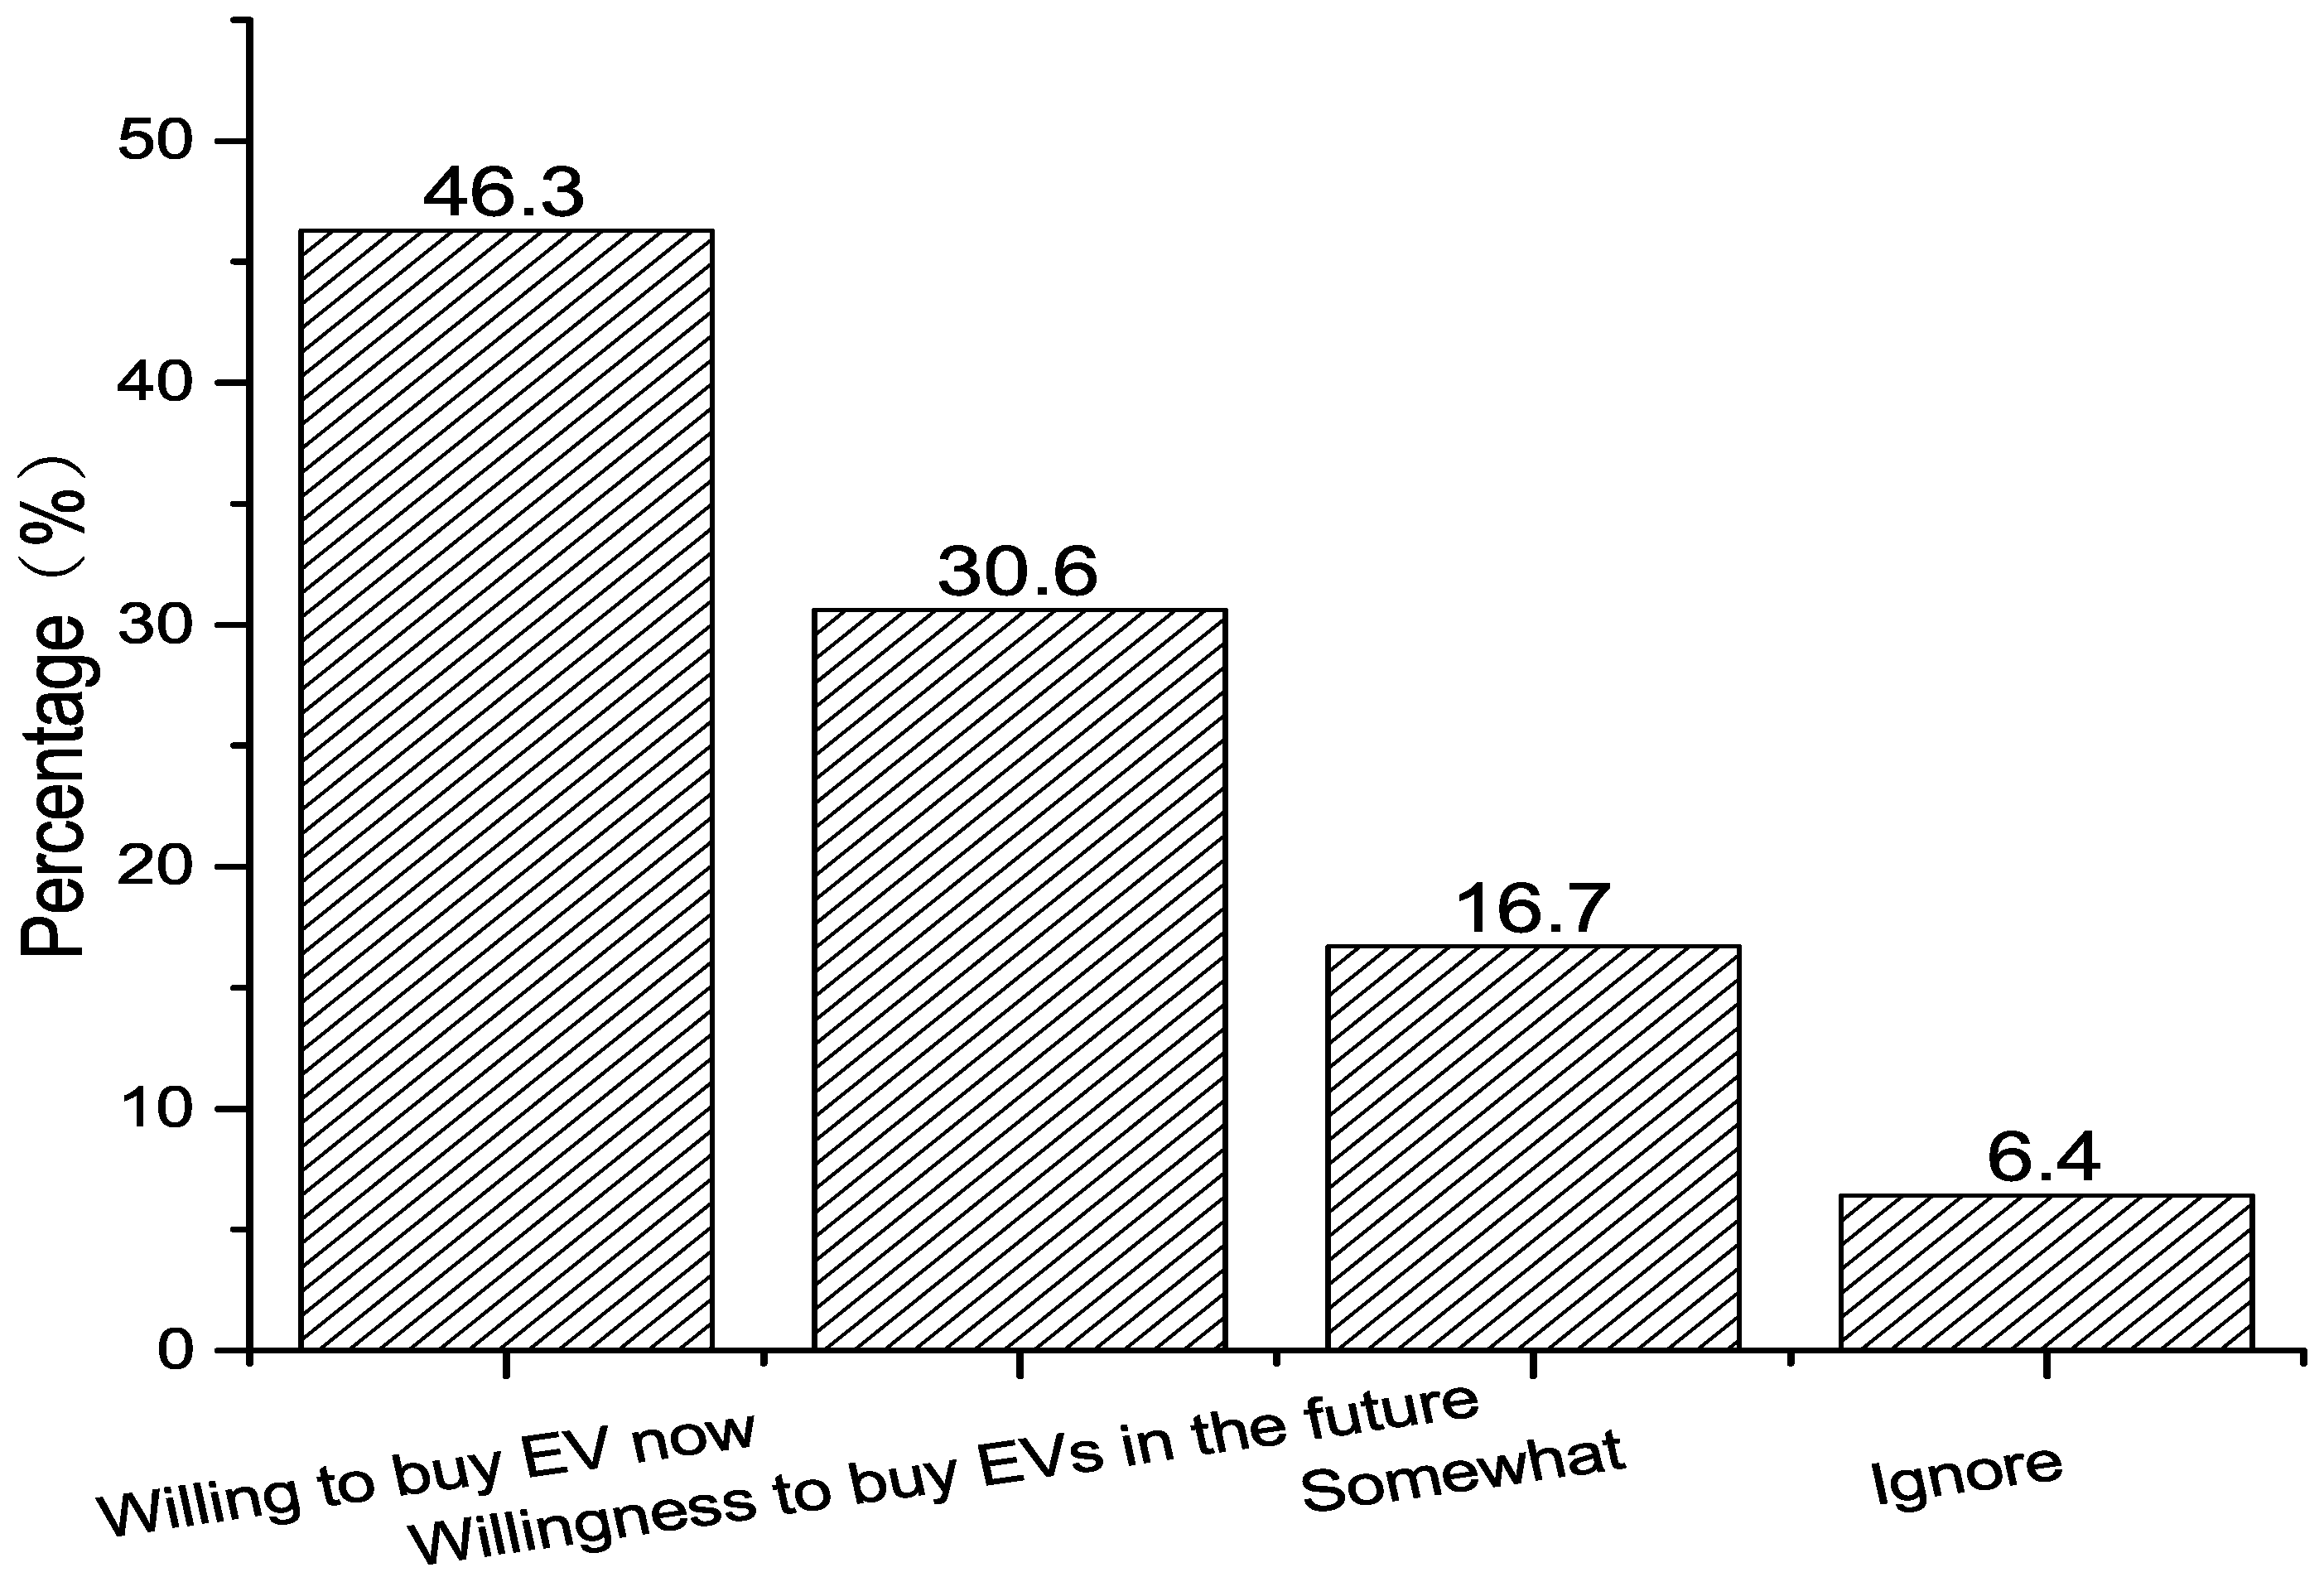
Furthermore, our research inferred that social circle, public policy, and energy security concern influenced the consumer willingness, which is shown in Figure 6 and Table 7. The analysis revealed that 29.9% (n = 122) of consumers were willing to change their minds based on a friend’s opinion, and 27.9% were willing to change their minds based on a family member’s opinion. When considering energy security concern, 46.3% (n = 189) expressed a strong desire to buy EVs now, 30.6% (n = 125) had the desire to buy EVs in the future, and 16.7% (n = 68) members expressed somewhat of a desire to buy EVs. Overall, the total percentage of consumers’ willingness increased to 93.6% (n = 382).
Regardless of the growth in fuel saving technology, or a significant drop in the future cost of fossil fuels, the respondents still demonstrated a strong desire to buy EVs, with percentages of 75.8% and 80.7%, respectively (Figure 7). With rising fuel prices, the intent to buy EVs will significantly increase.
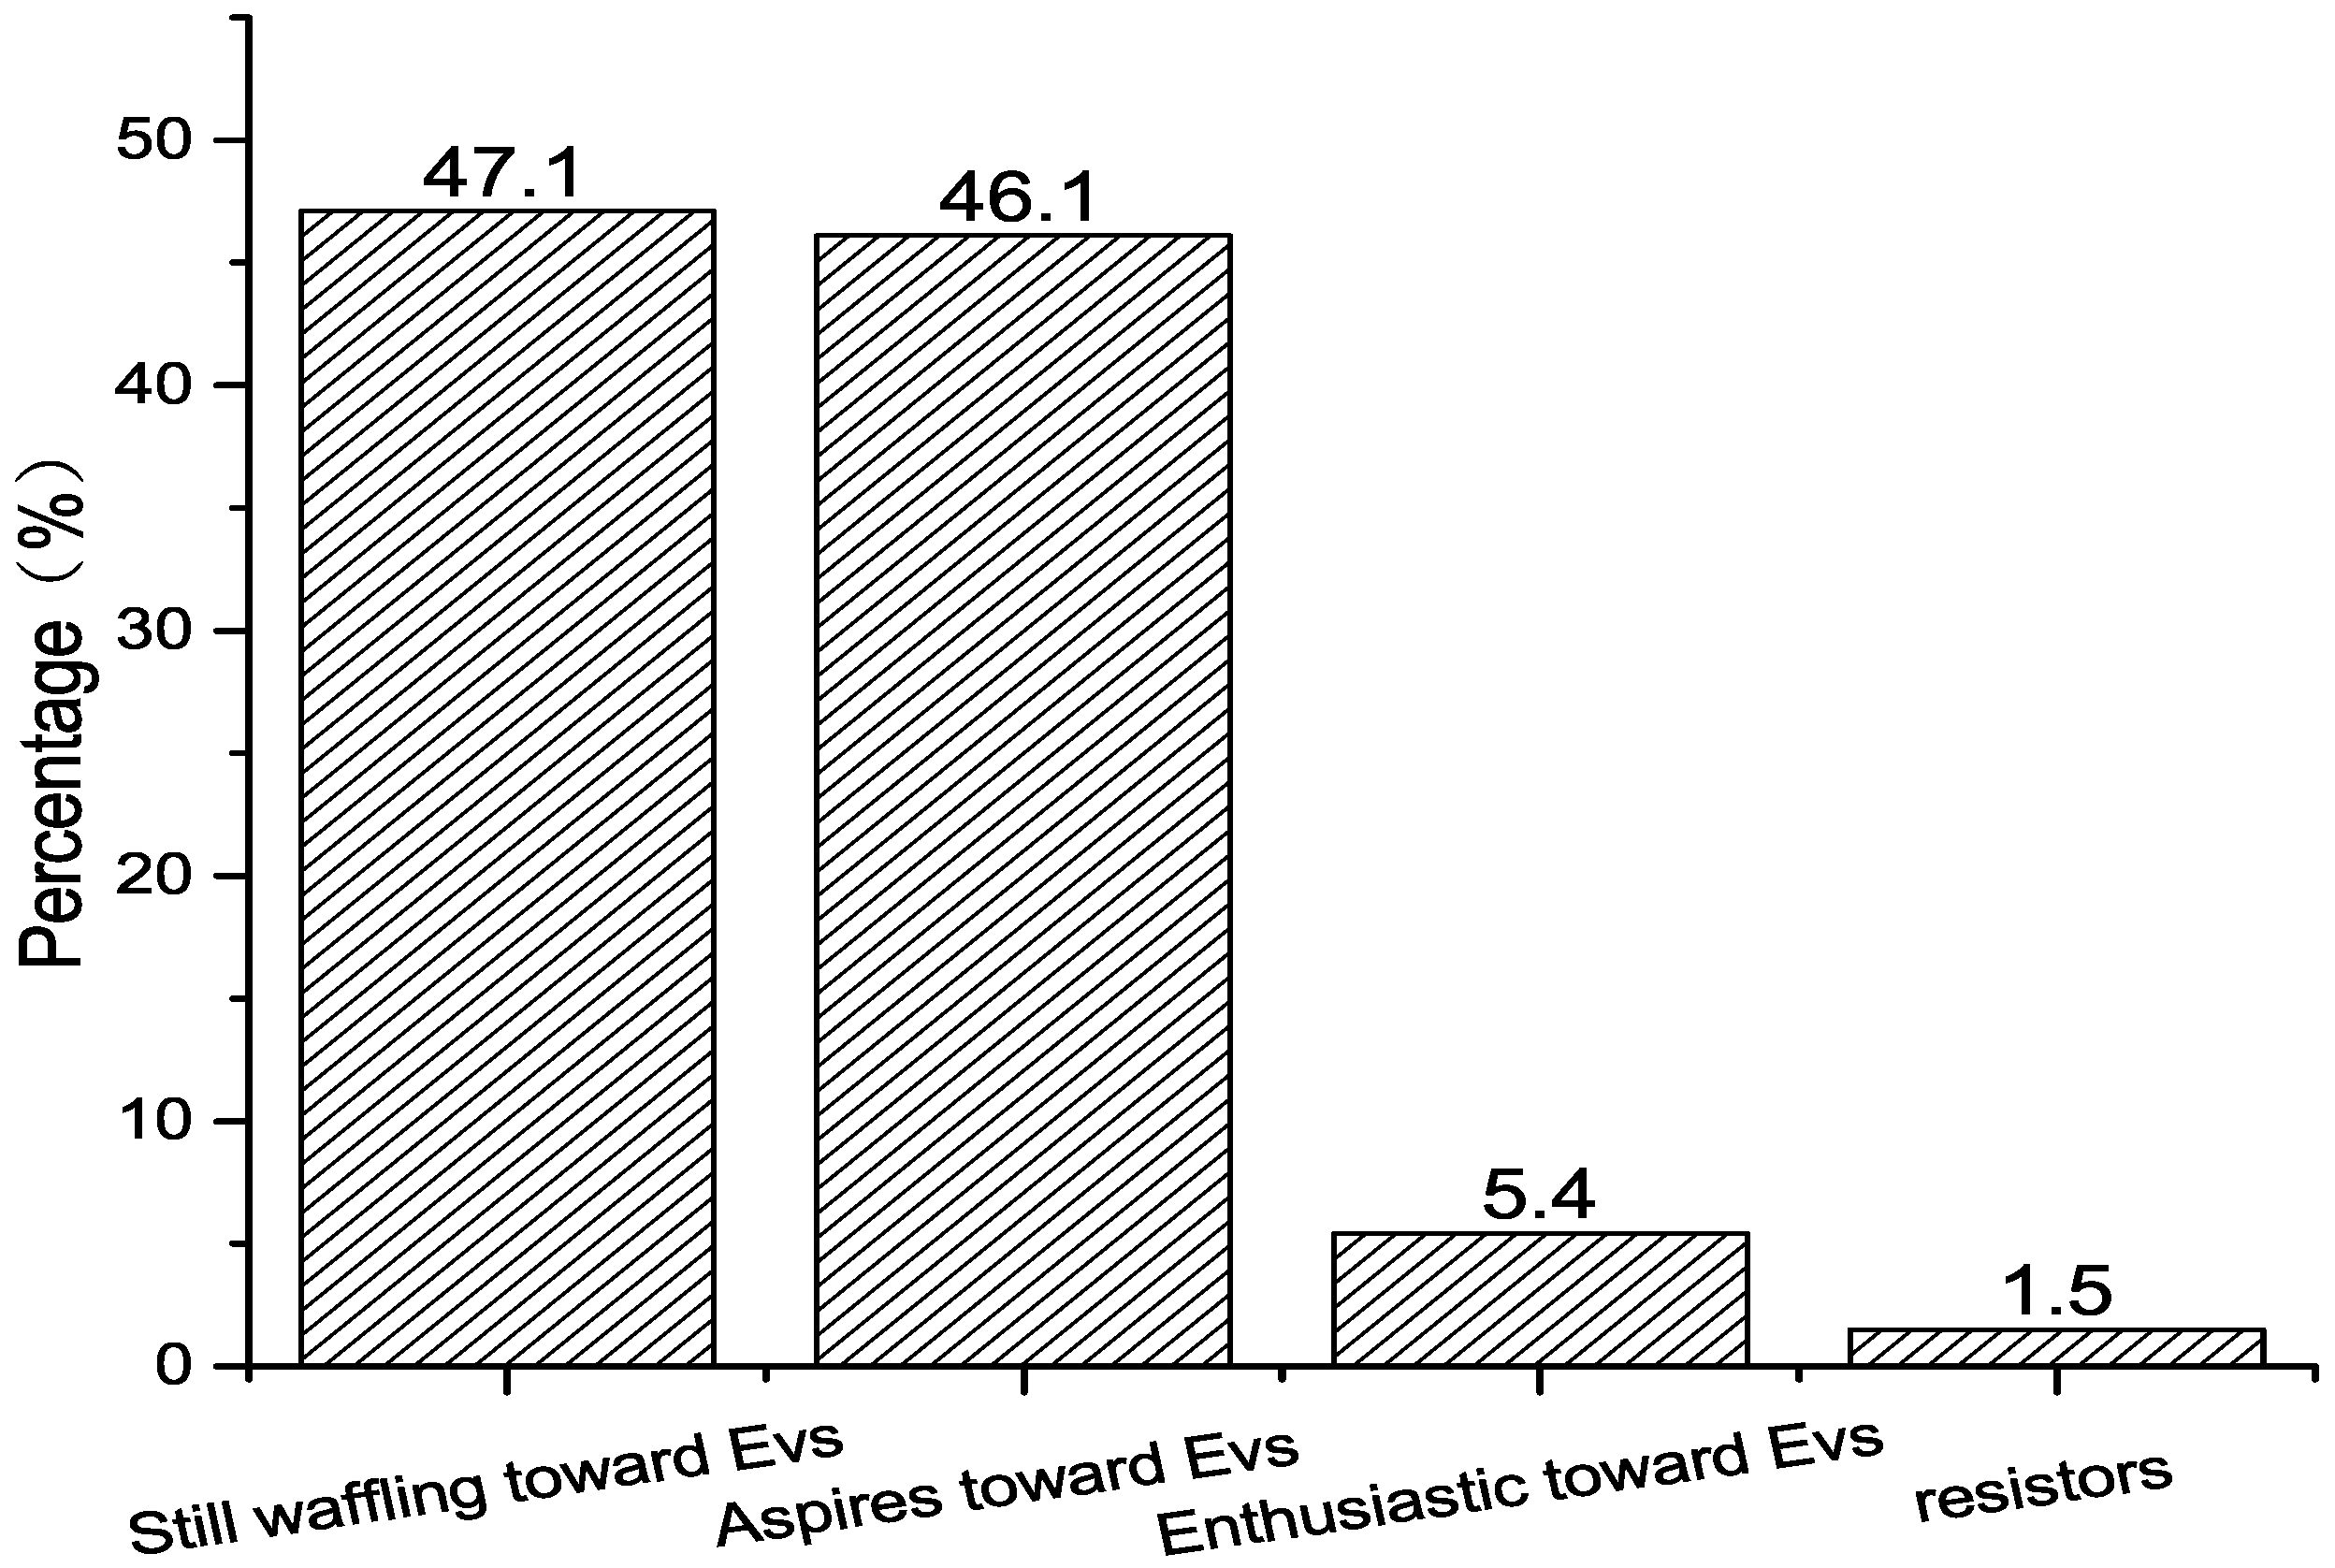
Many experts have suggested that EVs are a good choice for environmental conservation and energy security; however, consumer attitudes were critical of large-scale penetration of EVs. The study showed that 47.1% (n = 192) members were undecided toward EVs, and 46.1% (n = 188) aspired to own an EV (Figure 8). Furthermore, 5.4% (n = 22) members were enthusiastic about EVs, and only 1.5% were against EVs. The Fisher’s tests showed significant differences between participant attitudes and willingness as shown in Table 7 (p-value = 0.001), which means that a greater positive attitude toward EVs, leads to a stronger desire to buy these types of vehicles.
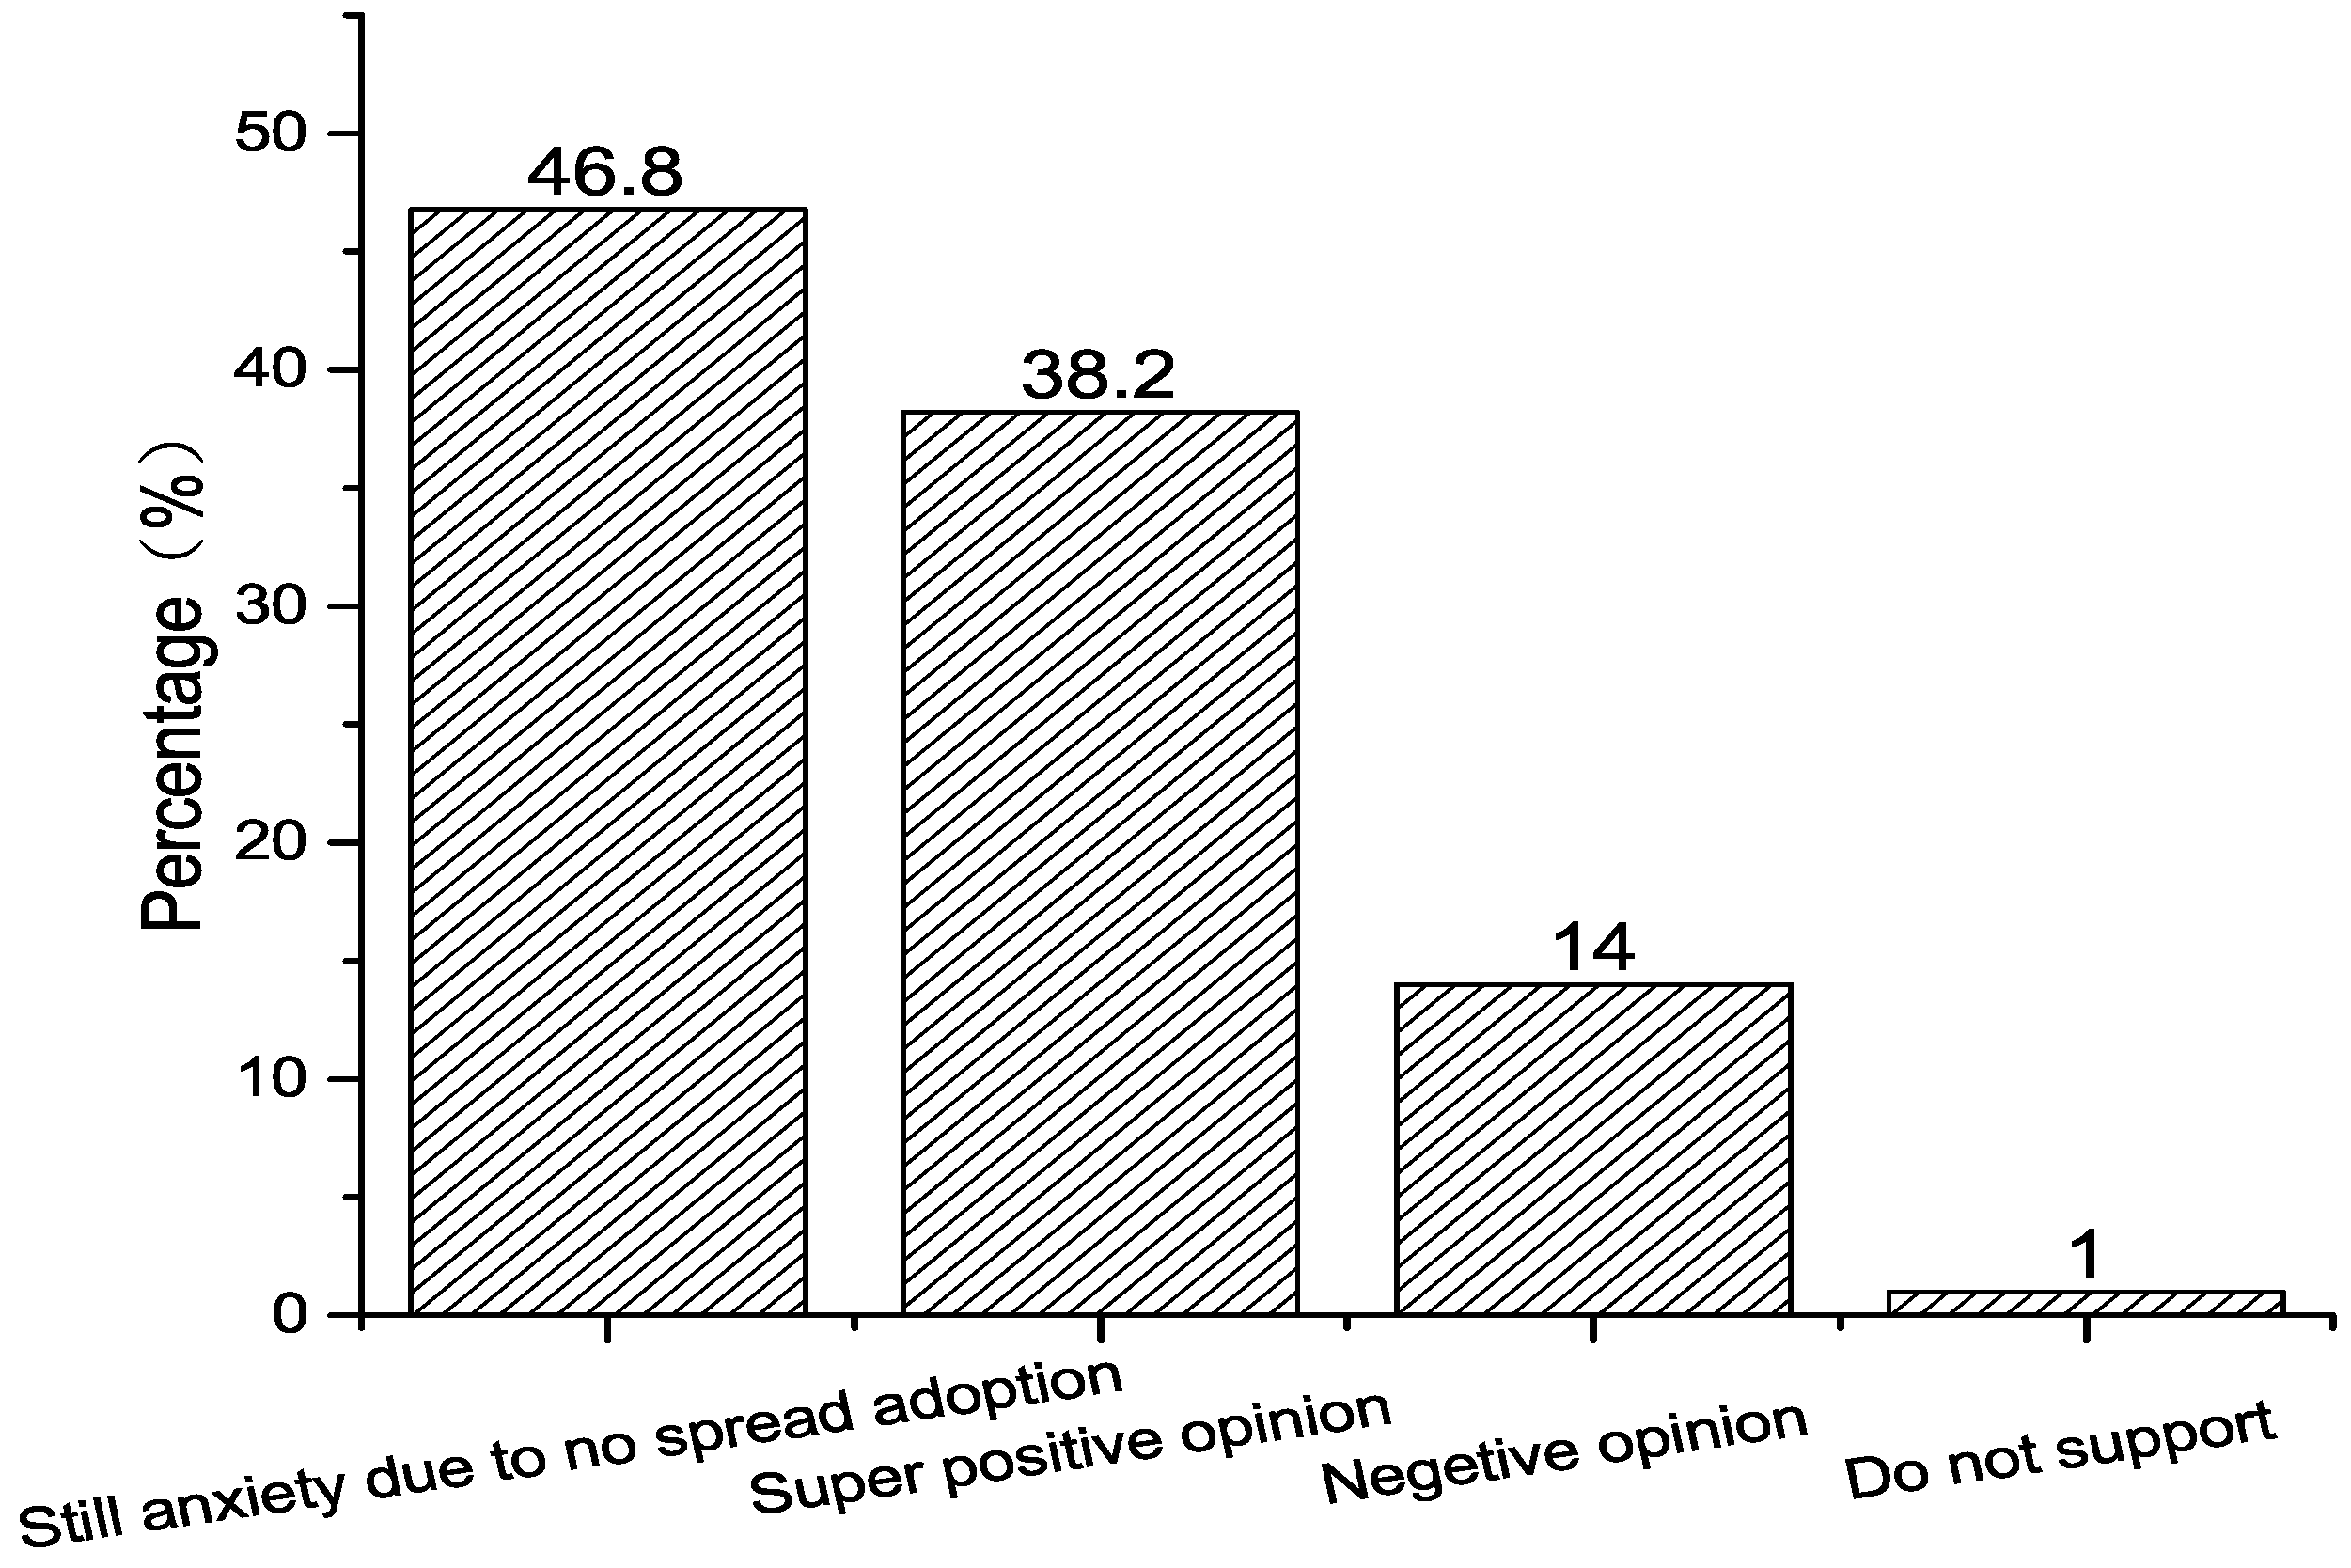
On large-scale penetration, the study showed that most members (46.8%) held a positive opinion toward EVs (Figure 9) and 38.2% members believed that EVs would be mainstream in future.
The study also conducted the factor analyze to explore the main elements in this section by SPSS. The results are shown in Table 8, Table 9 and Table 10:
The KMO (Kaiser-Meyer-Olkin) test of factor analysis carried out by SPSS is presented in Table 8, and a KMO value greater than implied that the original data was suitable for factor analysis. The total variances of all components accounted for 51.76%, which explained the variable very well. The study extracted the common elements and divided them into five groups by SPSS (Table 10):
- Perception of EVs: Feeling or sense about EVs based on experiences and knowledge.
- EVs competitiveness: EVs exceptional performance comparing with ICEVs or other fuel vehicles
- EVs prices: EVs market price.
- EVs full-charge range: Duration mileage of EVs with fully battery charge.
- EVs operation cost: Operation cost within life cycle period.
4.4. Public Policy and Price Incentive
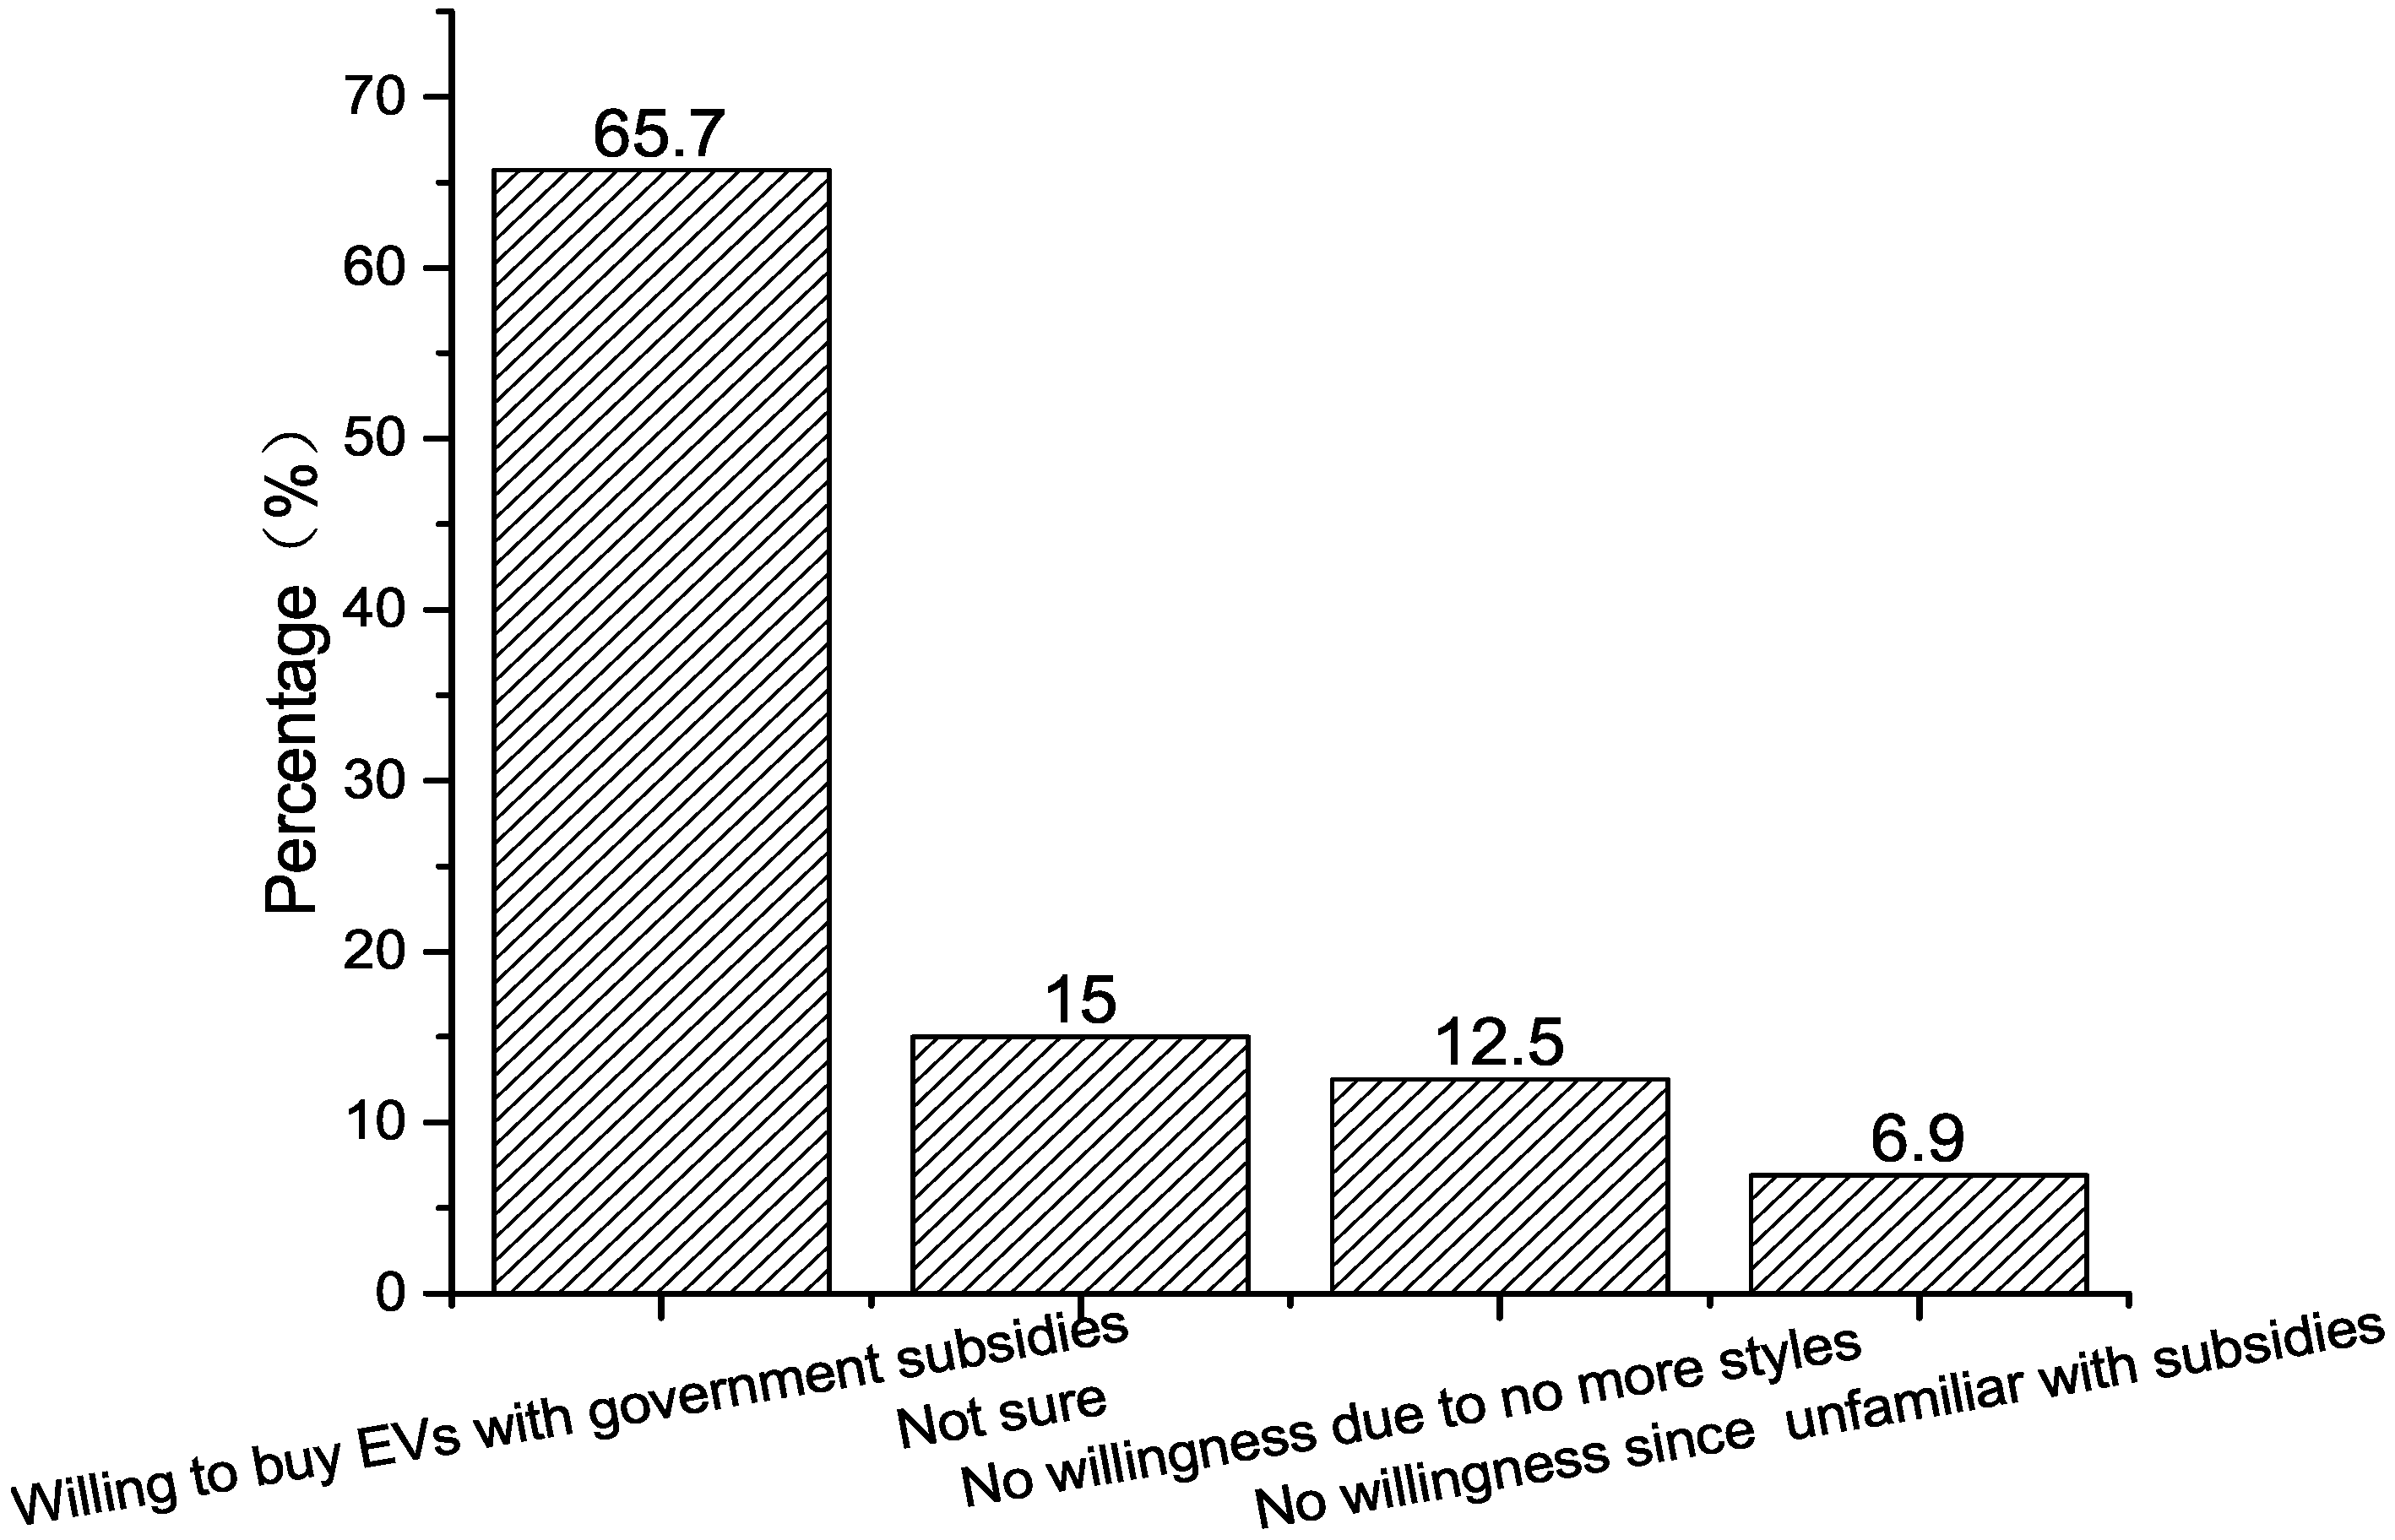
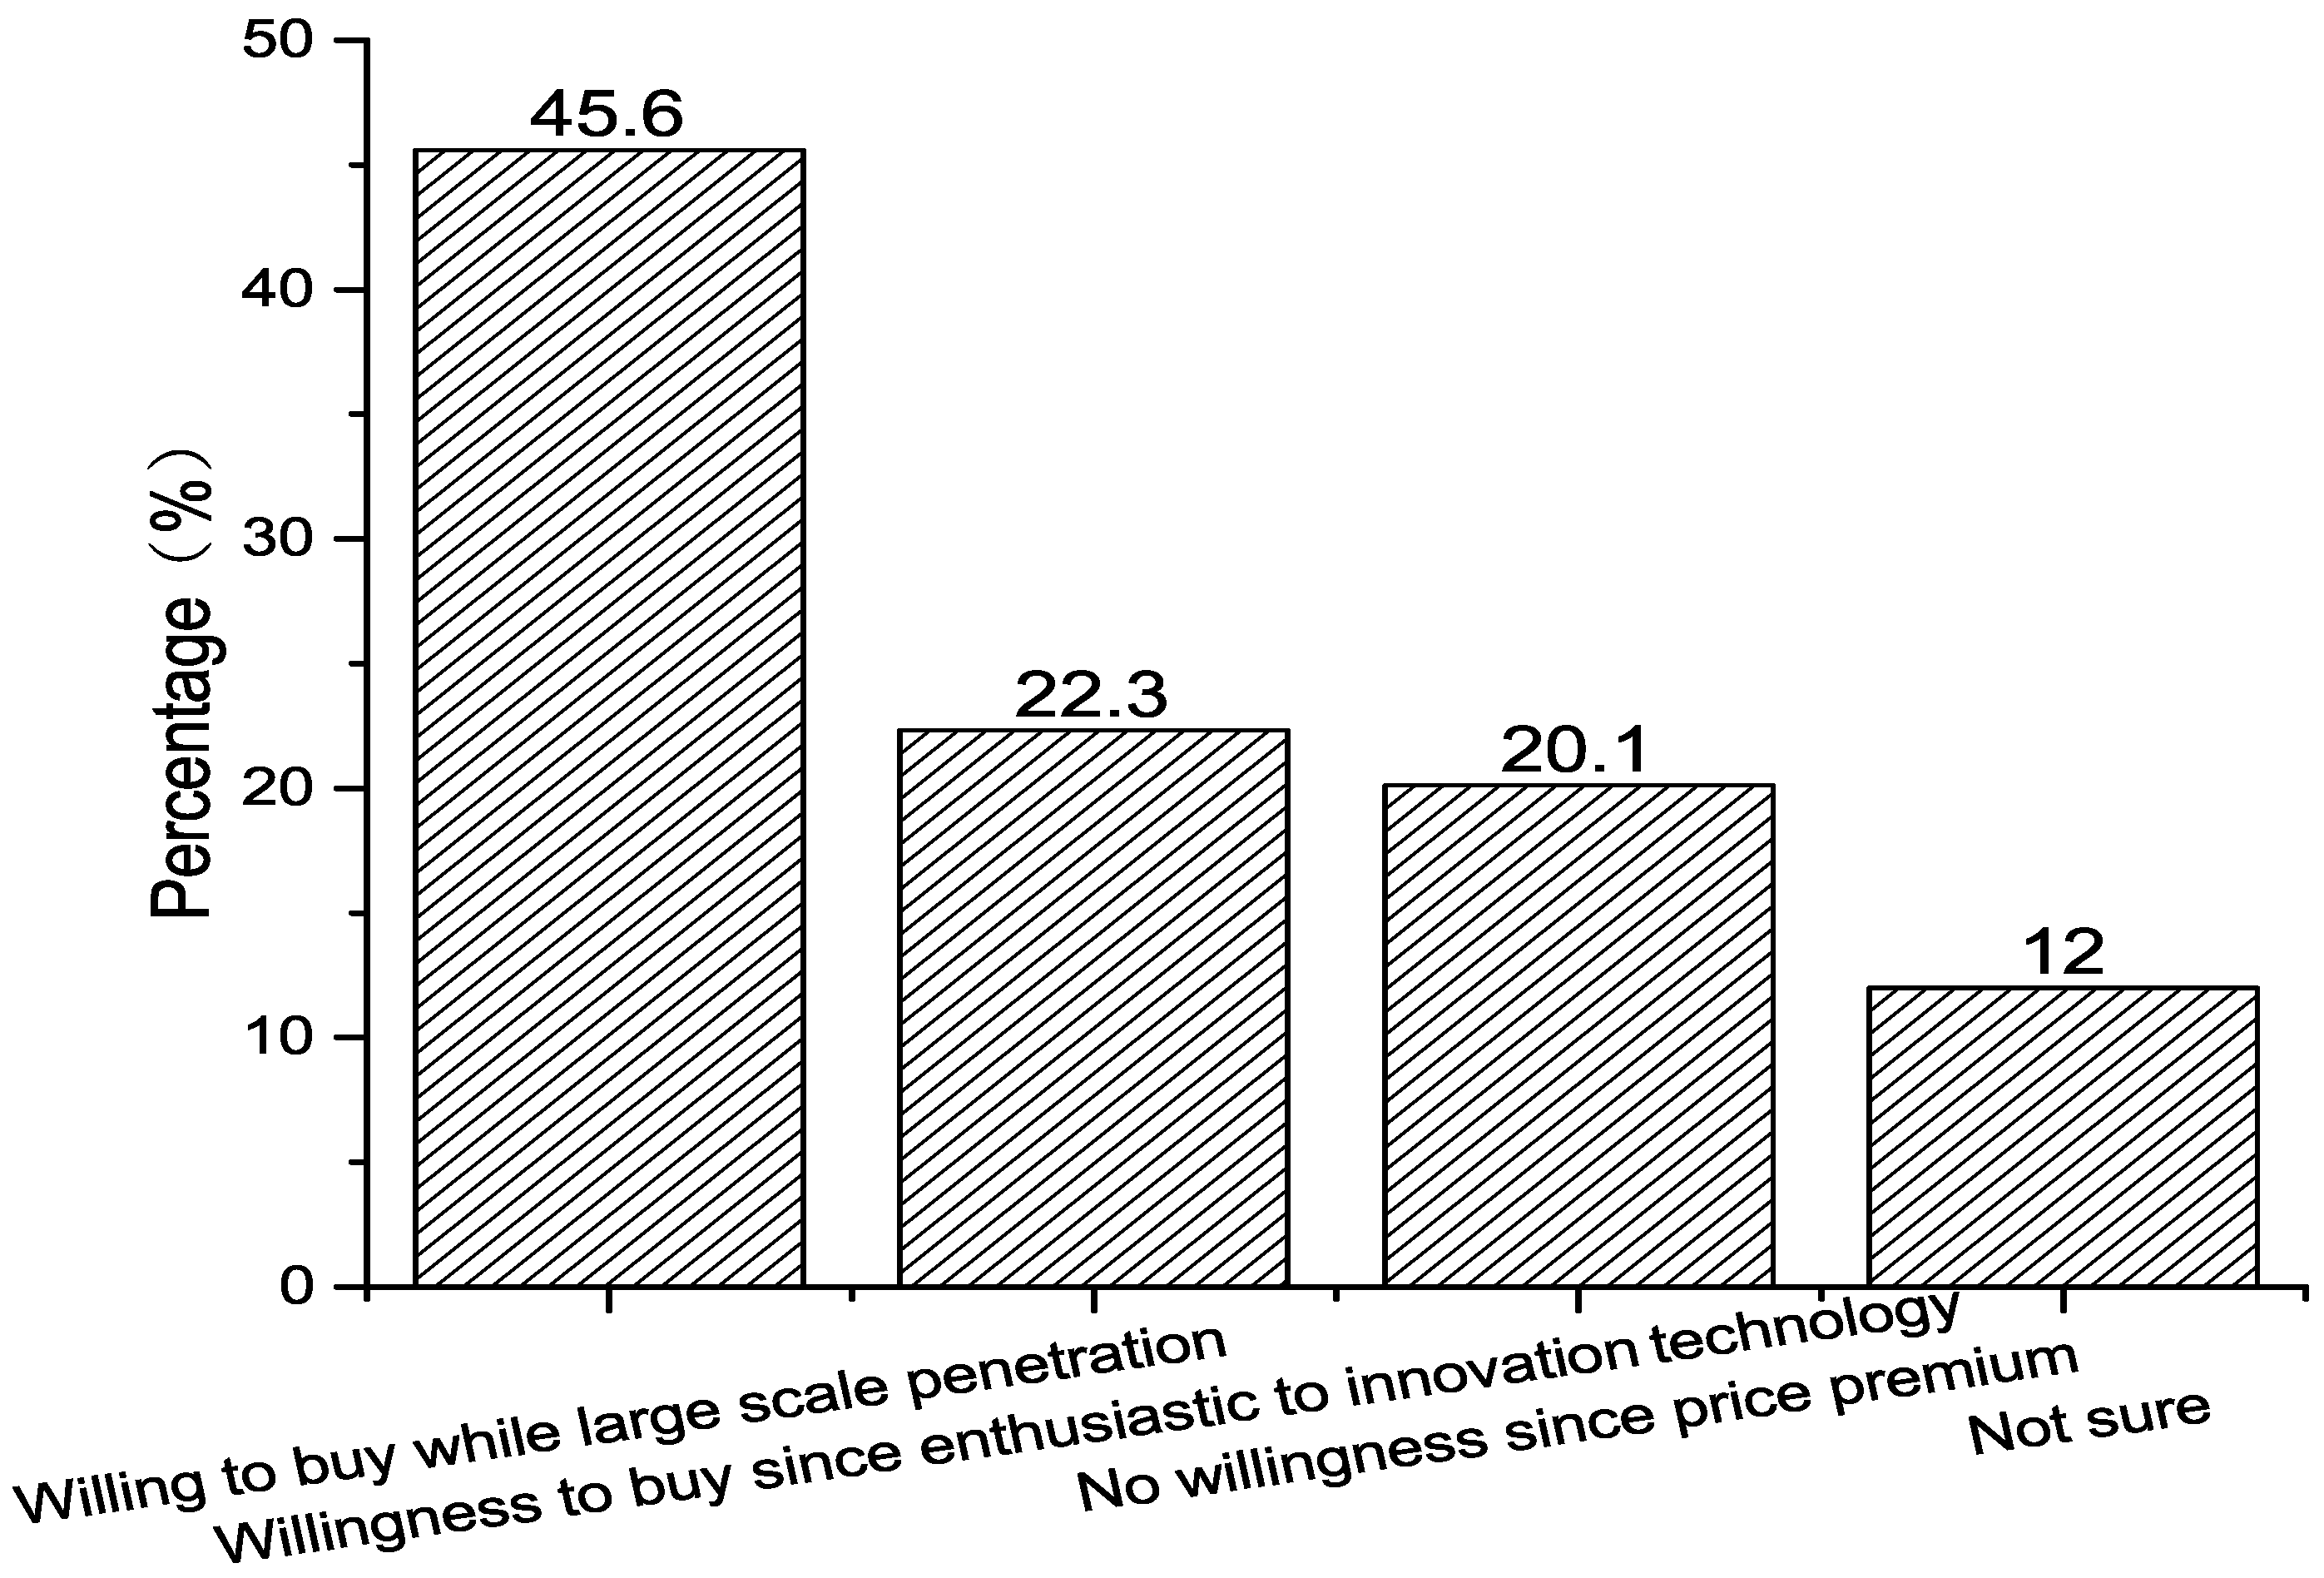
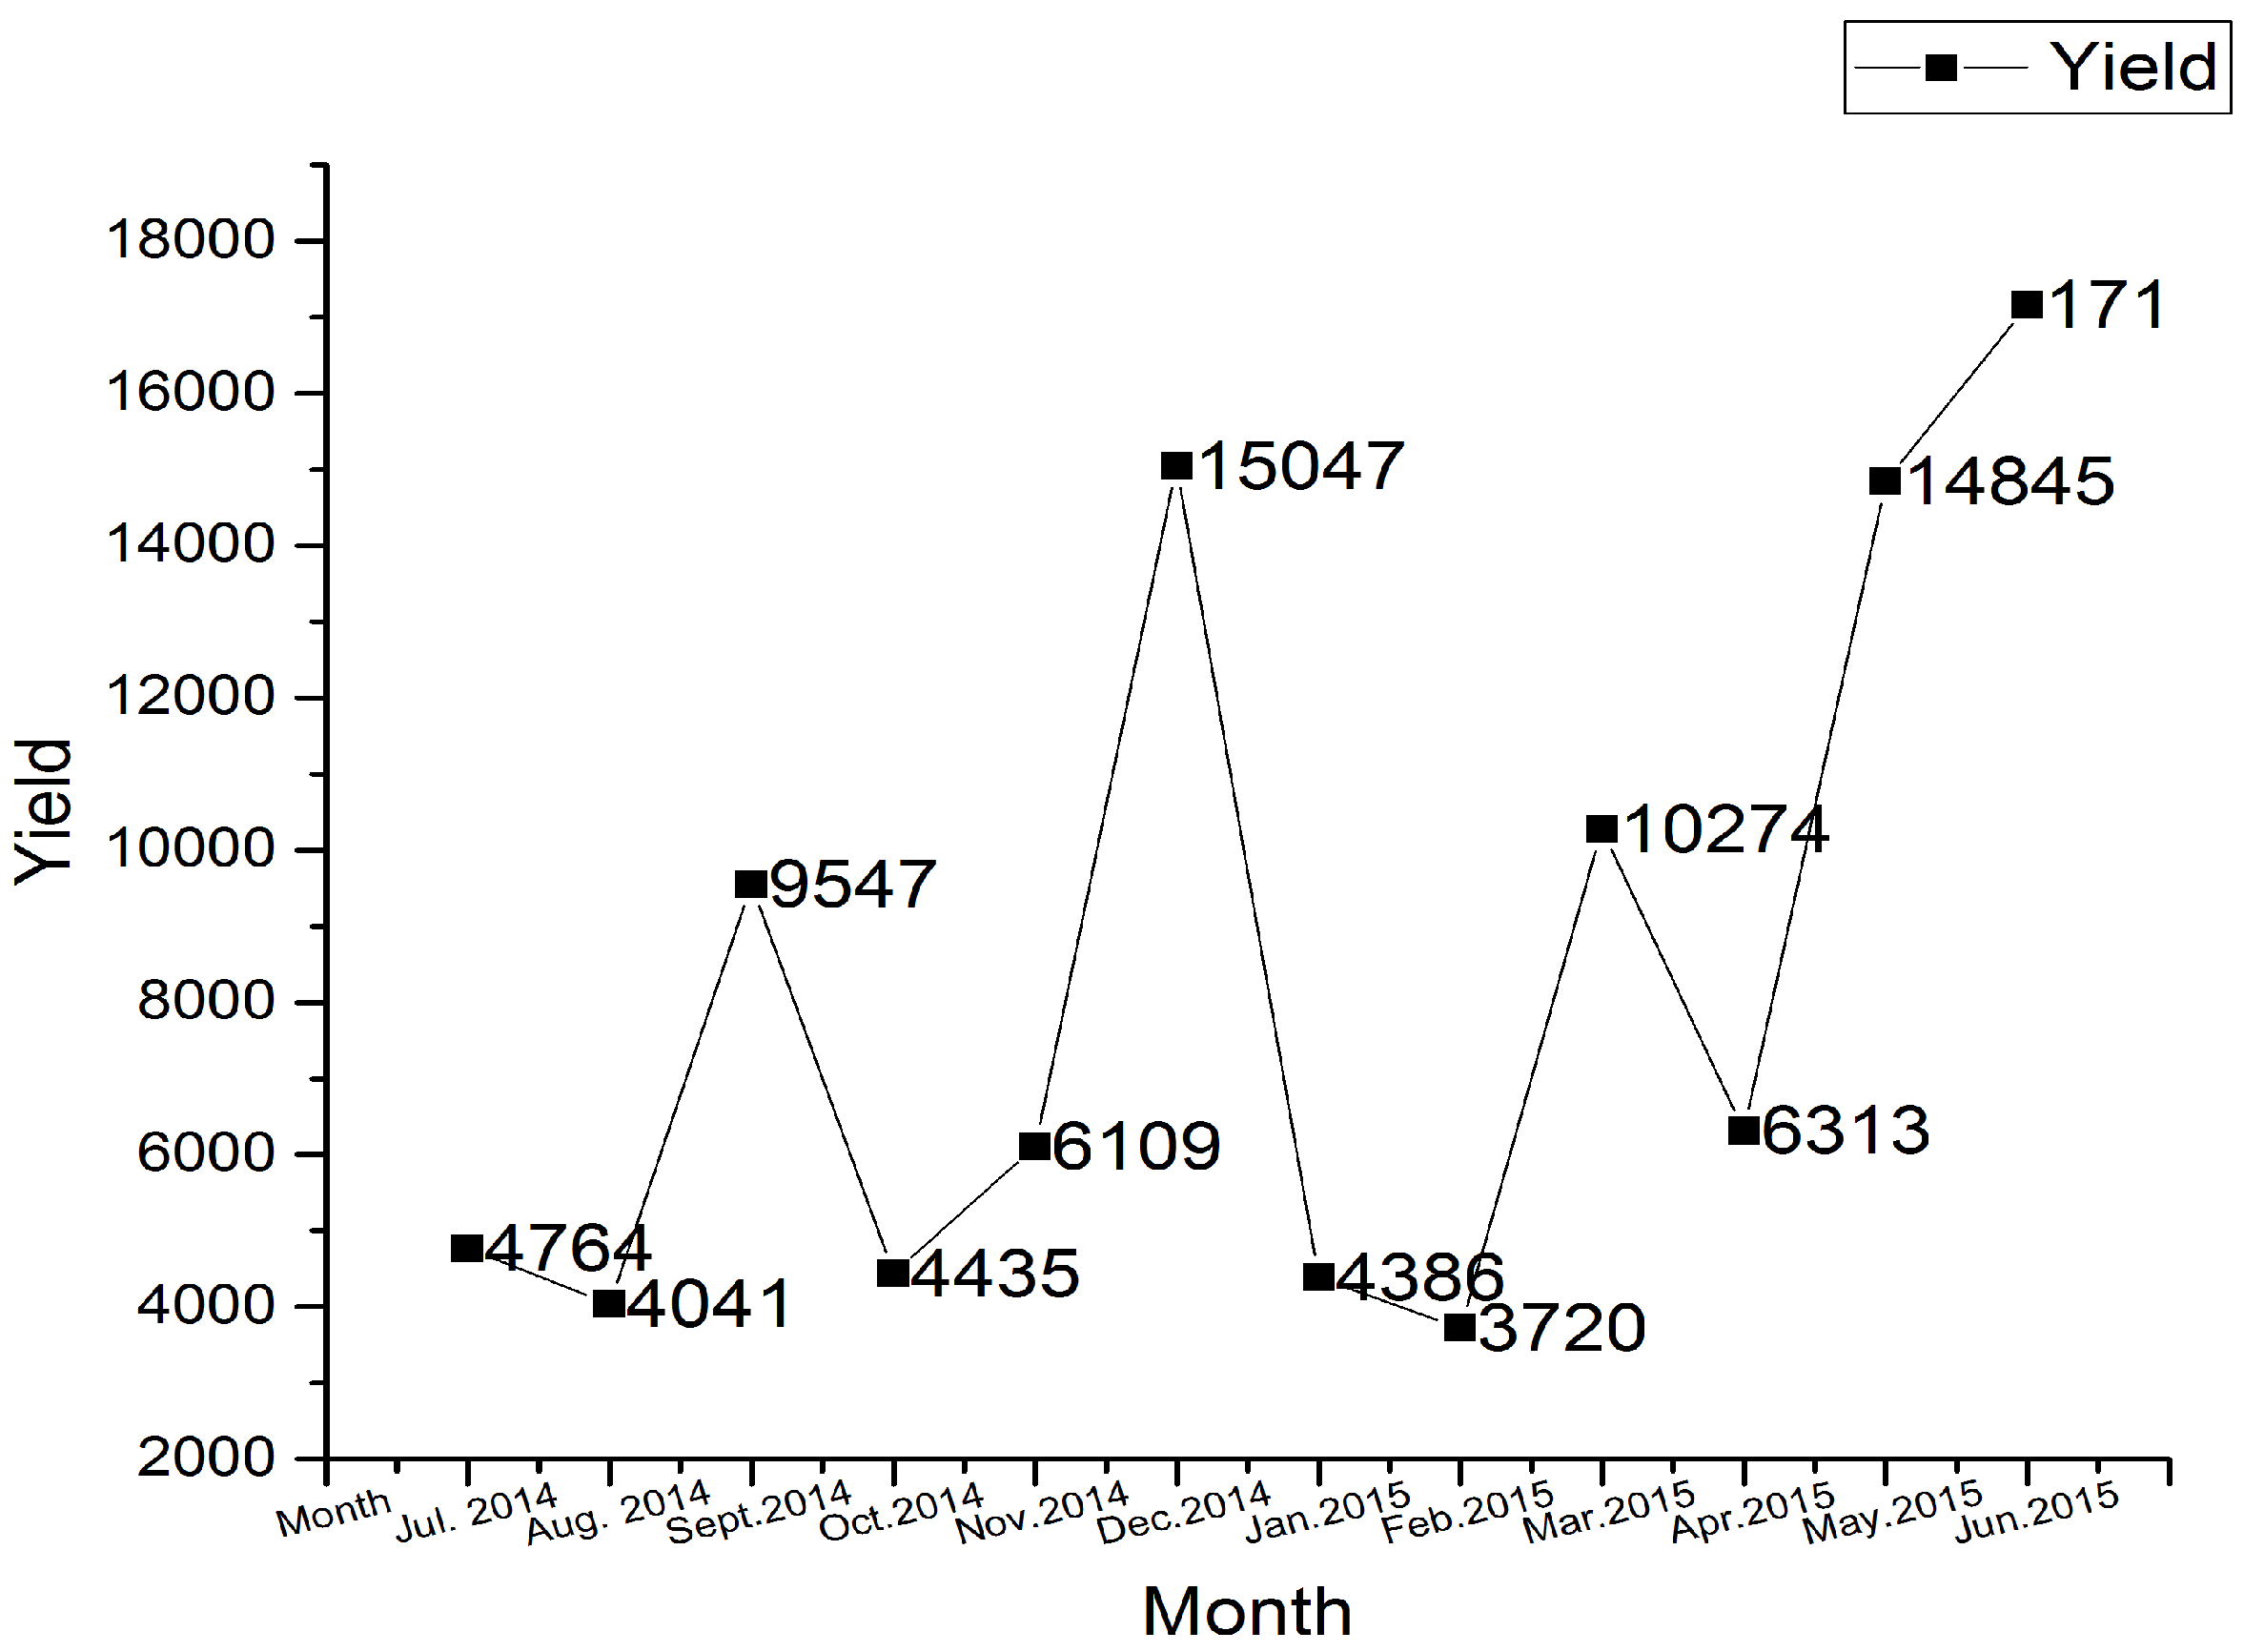
In order to encourage consumers to adopt EVs, the government introduced a series of public policies and financial subsidies to stimulate the large-scale penetration of EVs with grants supported by the Chinese government presented in Table 12 and Table 13. This study compared buying willingness as well as between financial subsidies support at current and a potential drop in the future in Figure 12, Figure 13 and Figure 14. The analysis showed that 65.7% of respondents had the desire to buy EVs based on financial subsidies, and 63.9% also had the desire to buy PHEVs based on the grant. However, if the government canceled or reduced the subsidies by 2020, buying desire would drop but not significantly. Figure 14 shows that 45.6% of respondents would still consider buying EVs because of the technology trend and market share expectation. Thus, 22.3% would still buy EVs based on their attitudes toward EVs. Furthermore, a comparison of consumer willingness status and Chinese government published data showed that EVs (Figure 15) have increased robustly in the past three years.
Regarding the EVs price premium, this study examined the acceptance degree of the price of EVs by the residents of Shenzhen. The results showed that 50% (n = 204) of the respondents expected price range was between 13,071 and 24,509 US dollars. In addition, 37.3% (n = 152) of the respondents price expectation range was between 24,509 to 40,849 US dollars. A further 10.3% (n = 42) of participants had a price expectation range between 40,849 to 65,359 US dollars, and only 2.5% would accept a price range above 65,359 US dollars. Consumer acceptance of PHEVs prices had a similar statistical result to that of the EVs.
An examination of the sale price of EVs in the Chinese market showed a price range between 24,509 and 40,849 US dollars.
Furthermore, the study conducted the factors analysis and regression by SPSS. The KMO test inferred that the data was suitable for the factor analysis, and the results presented in Table 14, Table 15 and Table 16:
The study extracted the Rotated components by SPSS and presented the common factors as below:
- Price subsidies
- Public Policy Support: Public policy supporting EVs operation conveniently.
- EVs Charge infrastructure placement: Recharge station placement for EVs spread adoption.
Additionally, the paper examined the relationship between common factors and the dependent variable by regression analysis using regression equation:
5. Discussion
5.1. Preference for EVs
This study only shows the results to support the Hypotheses by basic statistical analysis and Fisher test. However, the regression inferred that consumer’s real demand of private car fixes the preference for EVs. Thus, more research is required on potential users to evaluate their behaviors for the widespread adoption of EVs. Additionally, the results show that an awareness of environmental and national energy security has a significant influence on consumer’s preference [18], which verifies that the public policy direction and environmental knowledge education from the central and local government of China is working. Furthermore, it is consistent with previous findings that an inverse proportional to the preference in regression analysis indicates that consumers also aim for lower using cost with EVs [19,20,21].
5.2. Consumers Purchasing Willingness and Attitude
Overall, the basic statistical analysis shows that participants have a strong willingness to adopt EVs regardless if they are first-time car buyer and optimistic about the prospective of widespread EVs adoption. However, the greatest concern surrounds the convenience of recharging stations and access. Although Chinese consumers express a strong will to buy EVs, to understand the primary factors that influence the buying decisions of consumers, more quantitative analysis needs to be undertaken. The study conducted regression, which showed that the perceptions, advantages and full-charge range of EVs fixed consumer attitudes towards these types of vehicles [22,23,24]. This also supports Hypotheses 2 and 3. Additionally, the perception item has a maximum regression coefficient, which means that it influences the attitude of consumers significantly.
The regression also revealed the factors that determined the buying willingness of consumers, which included perceptions, technology advantages, price and the cost of driving EVs [25,26], where the cost of driving EVs had an reversed relationship to buying willingness. All other coefficients were positive, and the advantages of EVs accounted for a higher percentage. Thus, it can be inferred that if customers have sufficient opportunity to experience EVs, their perceptions of EVs will rise significantly, and as will buying willingness [27]. Furthermore, considering the performance of EVs, if the advantages of EVs are better than those of ICEVs, it also increases consumer desire significantly. As explained by regression analysis, the price of EVs is not the primary influence on buying willingness. These results show differences to previous findings that suggested that price premium was a critical barrier to the adoption of EVs.
5.3. Public Policy and Price Incentive
This study implies that the central government price subsidies and local government subsidies public policy on EVs affects consumer buying willingness; however, factor analysis indicated that state strategic support and charging point placement are crucial elements to the widespread adoption of EVs adoption [28,29,30,31,32], and supports Hypotheses 3 and 4. However, our result rejects Hypothesis 5, and instead shows that a future drop in subsidies will not influence consumer buying willingness significantly.
This paper inherits the general structure of the formal research, with results verifying many of the conclusions from previous studies. Furthermore, it extends on the limitations of earlier studies which found that survey respondents had no driving experiences of EVs [33,34,35,36,37,38,39]. The contribution of this study is that most surveyed participants had direct experiences of driving EVs, thus reflects the real status of consumer behavior accurately. Additionally, the study proposed five hypotheses based on formal research findings and verified the assumptions using statistical analysis. These results are invaluable for car manufacturers and governments to identify potential market trends and adjust the EV industrial policies in China.
6. Conclusions
First, the study ascertained that participants had high willingness to buy EVs, which had limited support of the hypotheses. However, considering the widespread adoption of EVs, the uptake of EVs depends more on charging access placement in the community and working place, rather than public recharging stations [40,41,42]. Second, the research showed that consumer perception of EVs could be a significant barrier to its market penetration [43,44]; however, if consumers can obtain knowledge accurately and experience electric vehicles regularly, the attitudes and willingness toward these types of vehicles will increase significantly. Furthermore, it revealed that EV car manufacturers and governments should further promote the advantages related to EV technology. Additionally, with regard to recharging behavior, it is suggested that a majority of consumers prefer to charge at home at night, rather than recharging at their work place. The study also revealed that EV competitiveness, full-charge range, price, operational costs and public policy were crucial factors to the widespread use of electric vehicles, which supports our hypotheses. However, it also pointed out that a drop in financial incentives and the price premium of electric vehicles were not considered as barriers to their acceptance, which was verified by the analysis and limited the support of the hypotheses.
There were several drawbacks in current research: first, the survey population was limited so the results may not be fully representative of the overall status. Second, future work in this area should improve the survey questionnaire and ensure its suitability for statistical analysis. Furthermore, the gender proportion should be more balanced than that in our study.
In conclusion, this study is valuable for electric vehicle car manufacturers in understanding Chinese consumer behavior regarding these types of cars. However, this study only focused on one region and the aim of future research is to conduct more comparative studies between Shenzhen and other Chinese cities regarding EV adoption. It would also be invaluable to conduct further research on the cultural differences using a global scope.
Supplementary Materials
The questionnaire mentioned in our study is available in the URL of http://www.lediaocha.com/pc/s/neutew.
Acknowledgments
The authors gratefully acknowledge the work of China BYD company and their colleagues at EVs retailer management division for checking the questionnaire used for the survey. We would also like to express our gratitude to the researchers in our lab who provide raw data check and review in the study.
In addition, this work is supported by the National Natural Science Foundation of China (Grant No. 71202022), the National Natural Science Foundation of China (Grant No. 71572090), the Natural Science Foundation of Guang Dong Province (Grant No. 2015A030313824), the Natural Science Foundation of Guang Dong Province (Grant No. 2014A030310404) and Shenzhen city Special Strategic Emerging Industry Development (Grant No. JCYJ20150331151358130)
Author Contributions
Li-Xin Miao conceived and design the study, Jia-Li Yu contributed the data analysis, Fa-Ping-Wang, Peng Yang and Bin Ye wrote the paper
Conflicts of Interest
The author declare no conflict of interest. The funding sponsors had no role in the design of the study; in the collection, analysis, or interpretation of the data; in writing of the manuscript, and in the decision to publish the results.
References
- Rezvani, Z.; Jansson, J.; Bodin, J. Advances in consumer electric vehicle adoption research: A review and research agenda. Transp. Res. Part D Transp. Environ. 2015, 34, 122–136. [Google Scholar] [CrossRef]
- Krupa, J.S.; Rizzo, D.M.; Eppstein, M.J.; Brad Lanute, D.; Gaalema, D.E.; Lakkaraju, K.; Warrender, C.E. Analysis of a consumer survey on plug-in hybrid electric vehicles. Transp. Res. Part A Policy Pract. 2014, 64, 14–31. [Google Scholar] [CrossRef]
- Axsen, J.; Kurani, K.S. The Early U.S. Market for PHEVs Anticipating Consumer Awareness, Recharge Potential, Design Priorities and Energy Impacts; Institute of Transportation Studies, University of California: Davis, CA, USA, 2008. [Google Scholar]
- Larson, P.D.; Viáfara, J.; Parsons, R.V.; Elias, A. Consumer attitudes about electric cars: Pricing analysis and policy implications. Transp. Res. Part A Policy Pract. 2014, 69, 299–314. [Google Scholar] [CrossRef]
- Carley, S.; Krause, R.M.; Lane, B.W.; Graham, J.D. Intent to purchase a plug-in electric vehicle: A survey of early impressions in large us cites. Transp. Res. Part D Transp. Environ. 2013, 18, 39–45. [Google Scholar] [CrossRef]
- Axsen, J.; Bailey, J.; Castro, M.A. Preference and lifestyle heterogeneity among potential plug-in electric vehicle buyers. Energy Econ. 2015, 50, 190–201. [Google Scholar] [CrossRef]
- Egbue, O.; Long, S. Barriers to widespread adoption of electric vehicles: An analysis of consumer attitudes and perceptions. Energy Policy 2012, 48, 717–729. [Google Scholar] [CrossRef]
- Bunce, L.; Harris, M.; Burgess, M. Charge up then charge out? Drivers’ perceptions and experiences of electric vehicles in the UK. Transp. Res. Part A Policy Pract. 2014, 59, 278–287. [Google Scholar] [CrossRef]
- Leurent, F.; Windisch, E. Triggering the development of electric mobility: A review of public policies. Eur. Transp. Res. Rev. 2011, 3, 221–235. [Google Scholar] [CrossRef]
- China to Become World’s Largest Market for New Energy Vehicles. Available online: http://www.chinadaily.com.cn/business/motoring/2015-08/13/content-21585953.htm (accessed on 13 August 2015).
- Celine Cluzel, B.L.; Standen, E. Pathways to High Penetration of Electric Vehicles; Final Report; The Committee on Climate Change: Cambridge, UK, 2013. [Google Scholar]
- Yi, J.-S.; Park, S. Cross-cultural differences in decision-making styles-a style of college students in five countries. Soc. Behav. Person. 2003, 31, 35–48. [Google Scholar] [CrossRef]
- Jamal, Z.B. Cross-cultural impact on marketing strategies: A study on automobile industry. In Proceedings of the International Conference on Business, Law and Corporate Social Responsibility, Phuket, Thailand, 1–2 October 2014. [Google Scholar]
- Axsen, J.; Kurani, K.S. Hybrid, plug-in hybrid, or electric—What do car buyers want? Energy Policy 2013, 61, 532–543. [Google Scholar] [CrossRef]
- Kim, J.; Rasouli, S.; Timmermans, H. Expanding scope of hybrid choice models allowing for mixture of social influences and latent attitudes: Application to intended purchase of electric cars. Transp. Res. Part A Policy Pract. 2014, 69, 71–85. [Google Scholar] [CrossRef]
- Wang, X.; Yang, Z.; Liu, N.R. The impacts of brand personality and congruity on purchase intention: Evidence from the chinese mainland’s automobile market. J. Glob. Market. 2009, 22, 199–215. [Google Scholar] [CrossRef]
- Zhen, W. The strategy of evs large scale penetration in Shenzhen. Auto Rev. 2014, 5, 60–64. [Google Scholar]
- Dimitropoulos, A.; Rietveld, P.; van Ommeren, J.N. Consumer valuation of changes in driving range: A meta-analysis. Transp. Res. Part A Policy Pract. 2013, 55, 27–45. [Google Scholar] [CrossRef]
- Singer, M. Consumer Views on Plug-in Electric Vehicles; National Benchmark Report; National Renewable Energy Laboratory: Golden, CO, USA, 2016.
- Higgins, A.; Paevere, P.; Gardner, J.; Quezada, G. Combining choice modelling and multi-criteria analysis for technology diffusion: An application to the uptake of electric vehicles. Technol. Forecast. Soc. Chang. 2012, 79, 1399–1412. [Google Scholar] [CrossRef]
- Van Vliet, O.P.R.; Kruithof, T.; Turkenburg, W.C.; Faaij, A.P.C. Techno-economic comparison of series hybrid, plug-in hybrid, fuel cell and regular cars. J. Power Sources 2010, 195, 6570–6585. [Google Scholar] [CrossRef]
- Hirte, G.; Tscharaktschiew, S. The optimal subsidy on electric vehicles in german metropolitan areas: A spatial general equilibrium analysis. Energy Econ. 2013, 40, 515–528. [Google Scholar] [CrossRef]
- Krause, R.M.; Carley, S.R.; Lane, B.W.; Graham, J.D. Perception and reality: Public knowledge of plug-in electric vehicles in 21 U.S. Cities. Energy Policy 2013, 63, 433–440. [Google Scholar] [CrossRef]
- Lebeau, K. Consumer Attitudes Toward Battery Electric Vehicles: A Large Scale Survey; Inderscience Enterprises Ltd.: Brussels, Belgium, 2013; Volume 5, pp. 28–40. [Google Scholar]
- Graham-Rowe, E.; Gardner, B.; Abraham, C.; Skippon, S.; Dittmar, H.; Hutchins, R.; Stannard, J. Mainstream consumers driving plug-in battery-electric and plug-in hybrid electric cars: A qualitative analysis of responses and evaluations. Transp. Res. Part A Policy Pract. 2012, 46, 140–153. [Google Scholar] [CrossRef]
- Al-Alawi, B.M.; Bradley, T.H. Total cost of ownership, payback, and consumer preference modeling of plug-in hybrid electric vehicles. Appl. Energy 2013, 103, 488–506. [Google Scholar] [CrossRef]
- Franke, T.; Krems, J.F. Understanding charging behaviour of electric vehicle users. Transp. Res. Part F Traffic Psychol. Behav. 2013, 21, 75–89. [Google Scholar] [CrossRef]
- Azadfar, E.; Sreeram, V.; Harries, D. The investigation of the major factors influencing plug-in electric vehicle driving patterns and charging behaviour. Renew. Sustain. Energy Rev. 2015, 42, 1065–1076. [Google Scholar] [CrossRef]
- Steinhilber, S.; Wells, P.; Thankappan, S. Socio-technical inertia: Understanding the barriers to electric vehicles. Energy Policy 2013, 60, 531–539. [Google Scholar] [CrossRef]
- Lane, B.; Potter, S. The adoption of cleaner vehicles in the uk: Exploring the consumer attitude–action gap. J. Clean. Prod. 2007, 15, 1085–1092. [Google Scholar] [CrossRef]
- Dijk, M.; Orsato, R.J.; Kemp, R. The emergence of an electric mobility trajectory. Energy Policy 2013, 52, 135–145. [Google Scholar] [CrossRef]
- Axsen, J.; Kurani, K.S. Anticipating plug-in hybrid vehicle energy impacts in california: Constructing consumer-informed recharge profiles. Transp. Res. Part D Transp. Environ. 2010, 15, 212–219. [Google Scholar] [CrossRef]
- Sierzchula, W. Factors influencing fleet manager adoption of electric vehicles. Transp. Res. Part D Transp. Environ. 2014, 31, 126–134. [Google Scholar] [CrossRef]
- Rolim, C.C.; Gonçalves, G.N.; Farias, T.L.; Rodrigues, Ó. Impacts of electric vehicle adoption on driver behavior and environmental performance. Procedia Soc. Behav. Sci. 2012, 54, 706–715. [Google Scholar] [CrossRef]
- Zhou, Y.; Wang, M.; Hao, H.; Johnson, L.; Wang, H.; Hao, H. Plug-in electric vehicle market penetration and incentives: A global review. Mitig. Adapt. Strateg. Glob. Chang. 2014, 20, 777–795. [Google Scholar] [CrossRef]
- Ziegler, A. Individual Characteristics and Stated Preferences for Alternative Energy; Center of Economic Research: Zurich, Switzerland, 2010. [Google Scholar]
- Klöckner, C.A. The dynamics of purchasing an electric vehicle-a prospective longitudinal study of the decision-making process. Transp. Res. Part F Traffic Psychol. Behav. 2014, 24, 103–116. [Google Scholar] [CrossRef]
- Liu, J.; Santos, G. Plug-in hybrid electric vehicles’ potential for urban transport in china: The role of energy sources and utility factors. Int. J. Sustain. Transp. 2014, 9, 145–157. [Google Scholar] [CrossRef]
- Karplus, V.J.; Paltsev, S.; Reilly, J.M. Prospects for plug-in hybrid electric vehicles in the united states and japan: A general equilibrium analysis. Transp. Res. Part A Policy Pract. 2010, 44, 620–641. [Google Scholar] [CrossRef]
- Wu, T.; Ma, L.; Mao, Z.; Ou, X. Setting up charging electric stations within residential communities in current china: Gaming of government agencies and property management companies. Energy Policy 2015, 77, 216–226. [Google Scholar] [CrossRef]
- Faria, R.; Moura, P.; Delgado, J.; de Almeida, A.T. A sustainability assessment of electric vehicles as a personal mobility system. Energy Convers. Manag. 2012, 61, 19–30. [Google Scholar] [CrossRef]
- Pasaoglu, G.; Fiorello, D.; Martino, A.; Zani, L.; Zubaryeva, A.; Thiel, C. Travel patterns and the potential use of electric cars – results from a direct survey in six european countries. Technol. Forecast. Soc. Chang. 2014, 87, 51–59. [Google Scholar] [CrossRef]
- Burgess, M.; King, N.; Harris, M.; Lewis, E. Electric vehicle drivers’ reported interactions with the public: Driving stereotype change? Transp. Res. Part F Traffic Psychol. Behav. 2013, 17, 33–44. [Google Scholar] [CrossRef]
- Bayram, I.S.; Zamani, V.; Hanna, R.; Kleissl, J. On the evaluation of plug-in electric vehicle data of a campus charging network. EEE Energycon 2016. [Google Scholar] [CrossRef]
Figure 1.
Brand Preference Analysis Demographic.
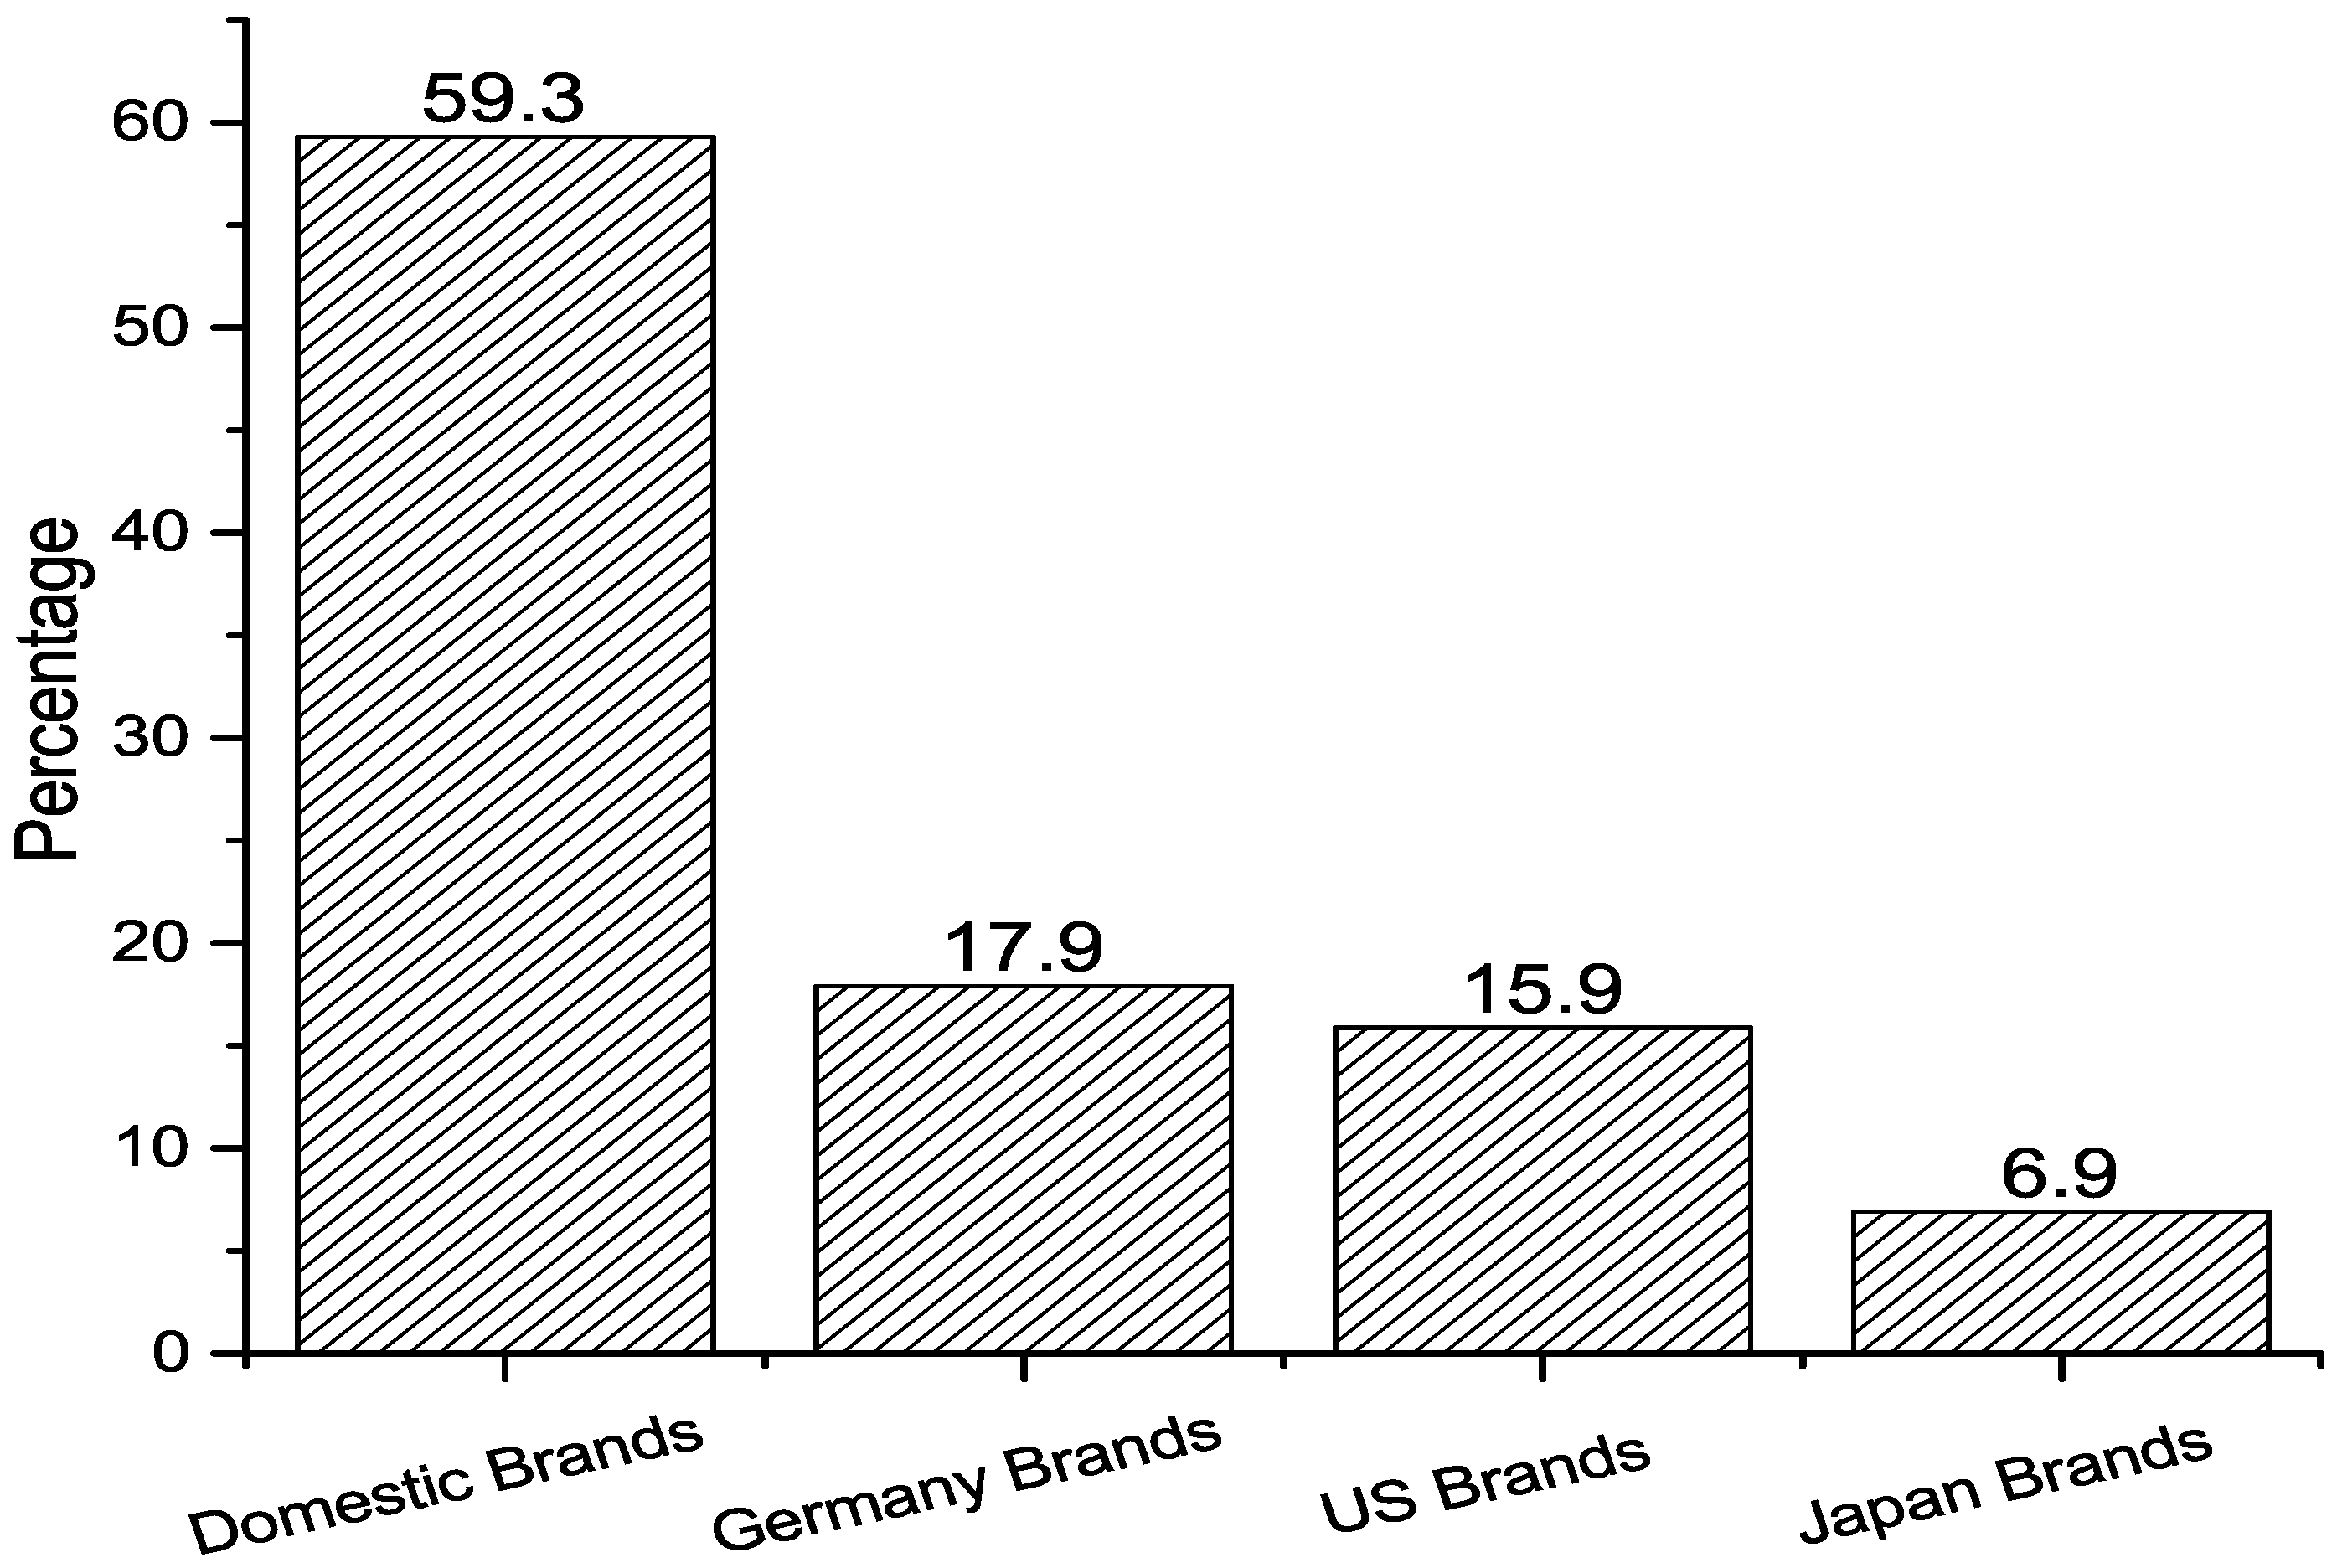
Figure 2.
EVs Driving Experiences.

Figure 3.
Regression residual distribution.
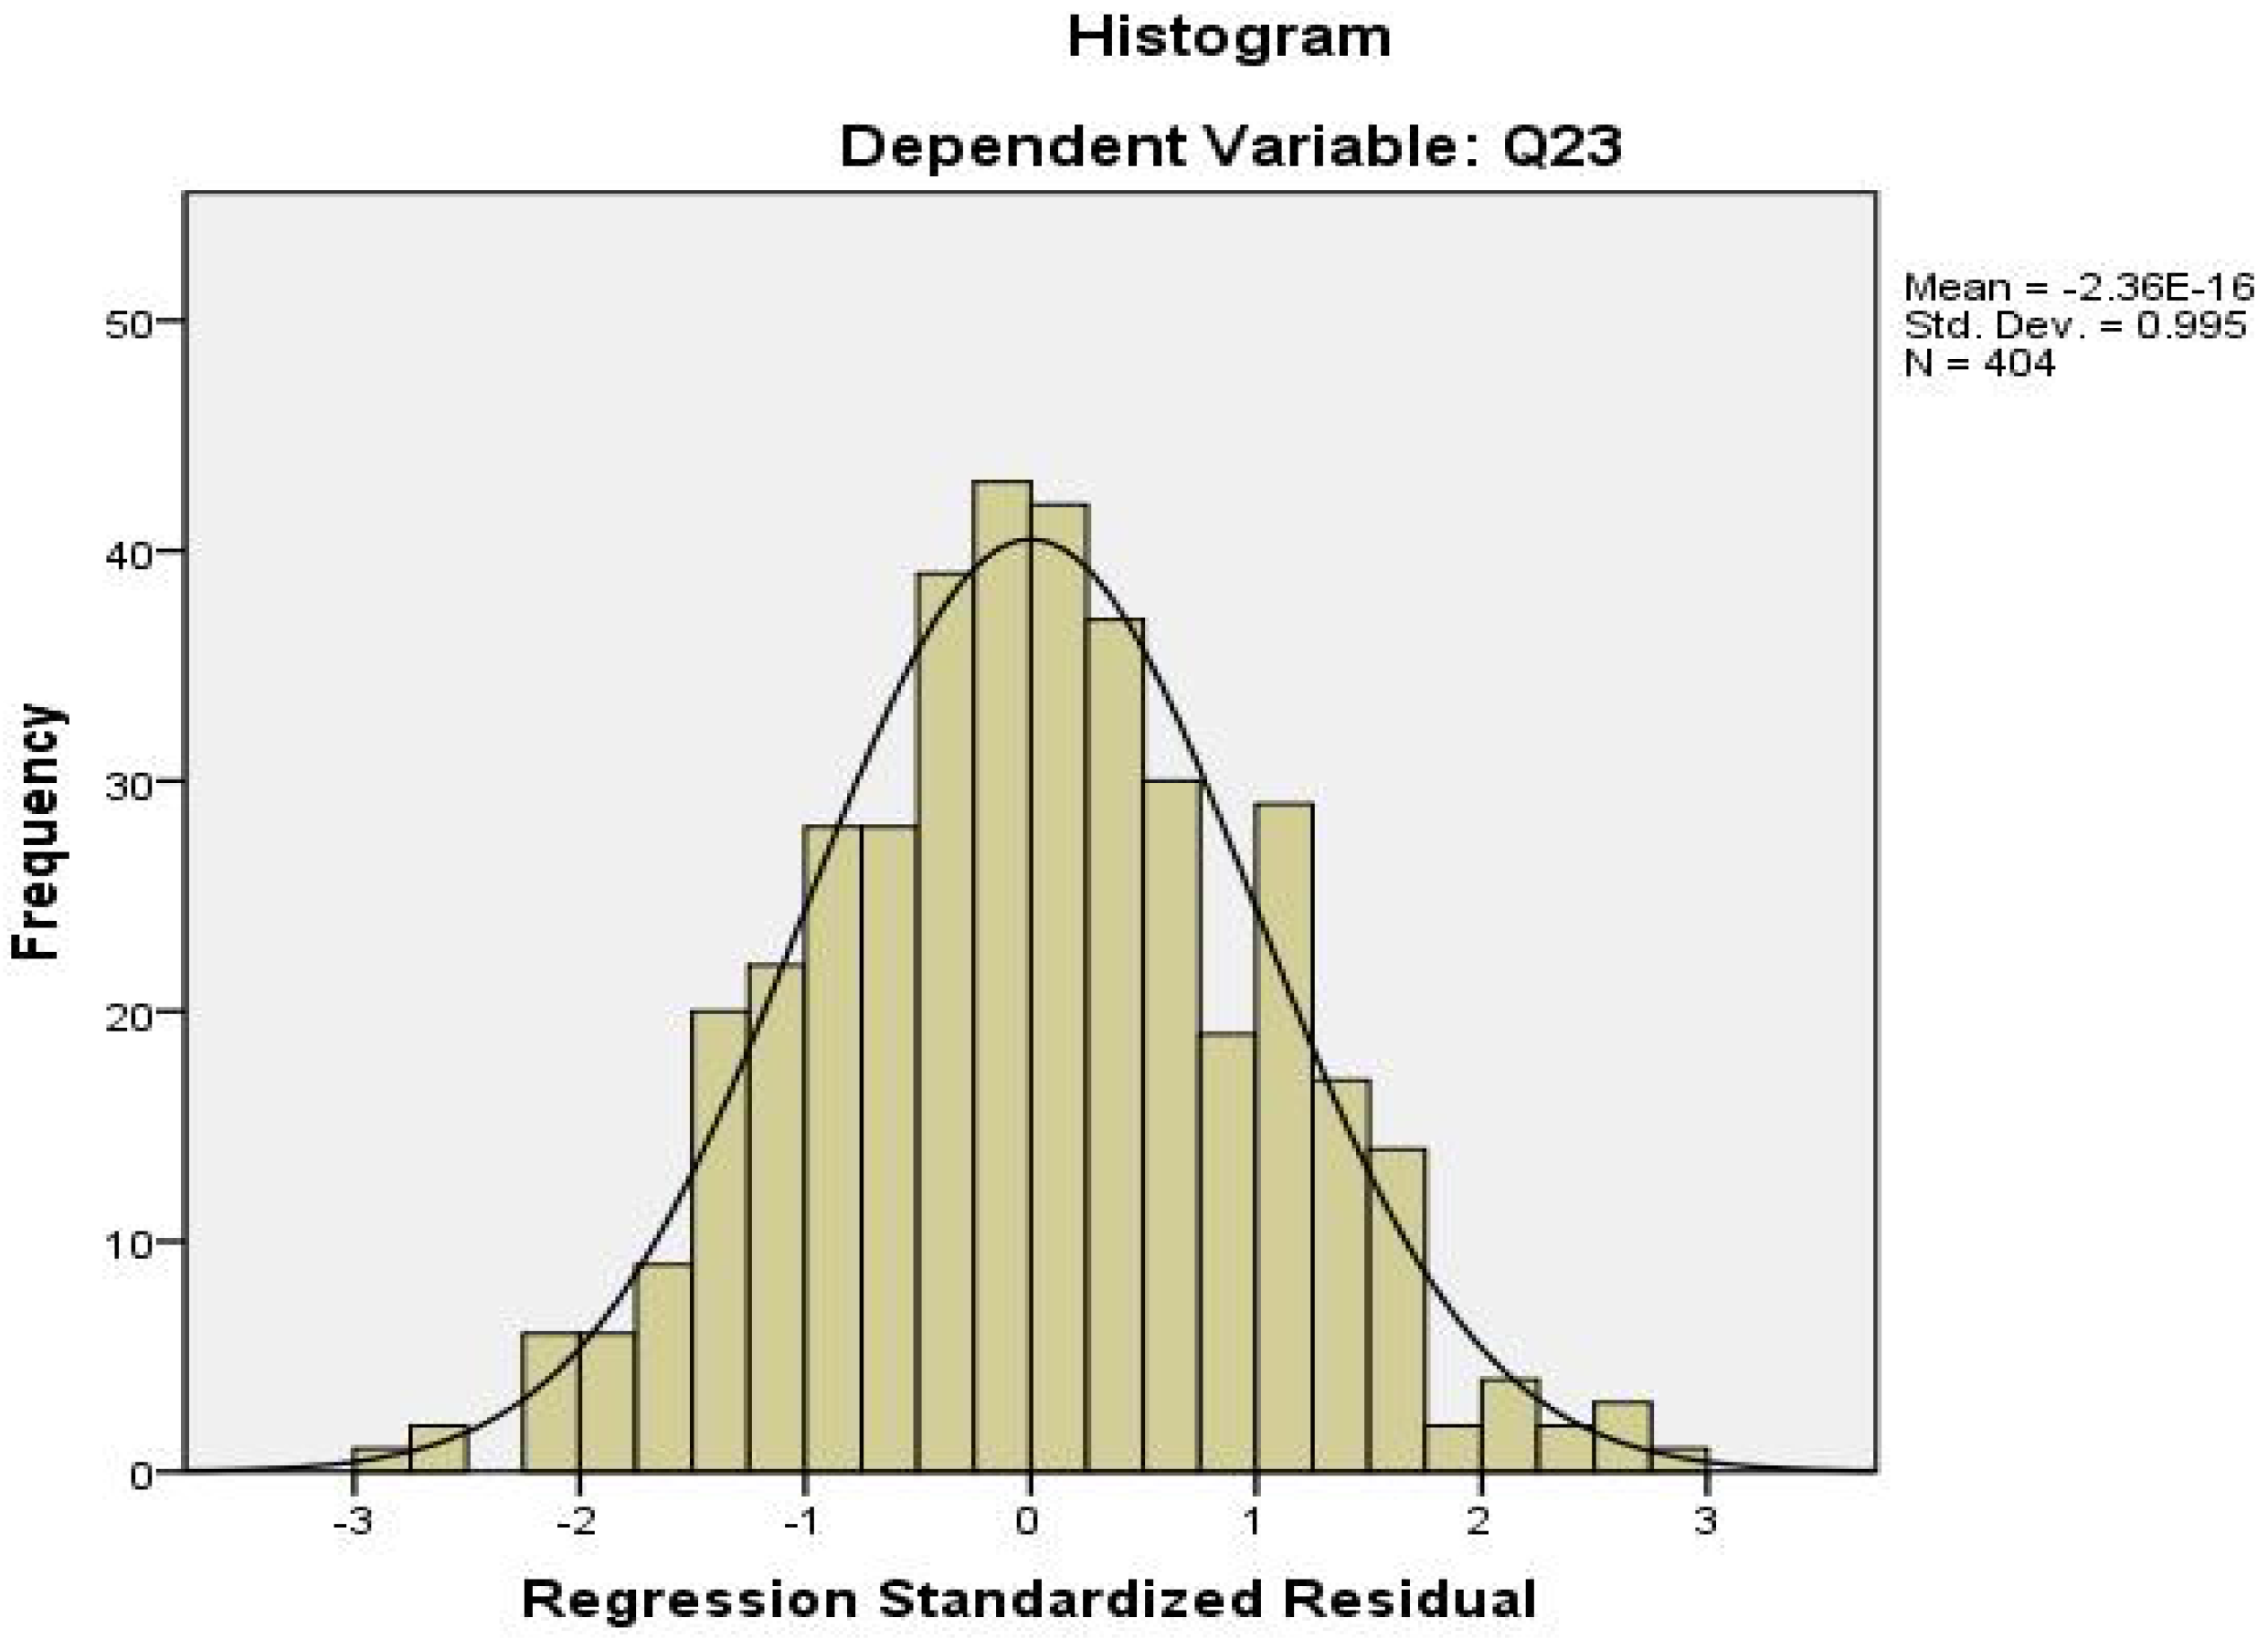
Figure 4.
Willingness of the First time car buyer.

Figure 5.
Willingness of The Second time Car Buyer.

Figure 6.
Willingness to buy EVs considering national energy safety.

Figure 7.
Purchasing willingness based on ICEVs technology Improvement.

Figure 8.
The participants attitudes toward EVs.

Figure 9.
The Participants insights of spread adoption of EVs in future.

Figure 10.
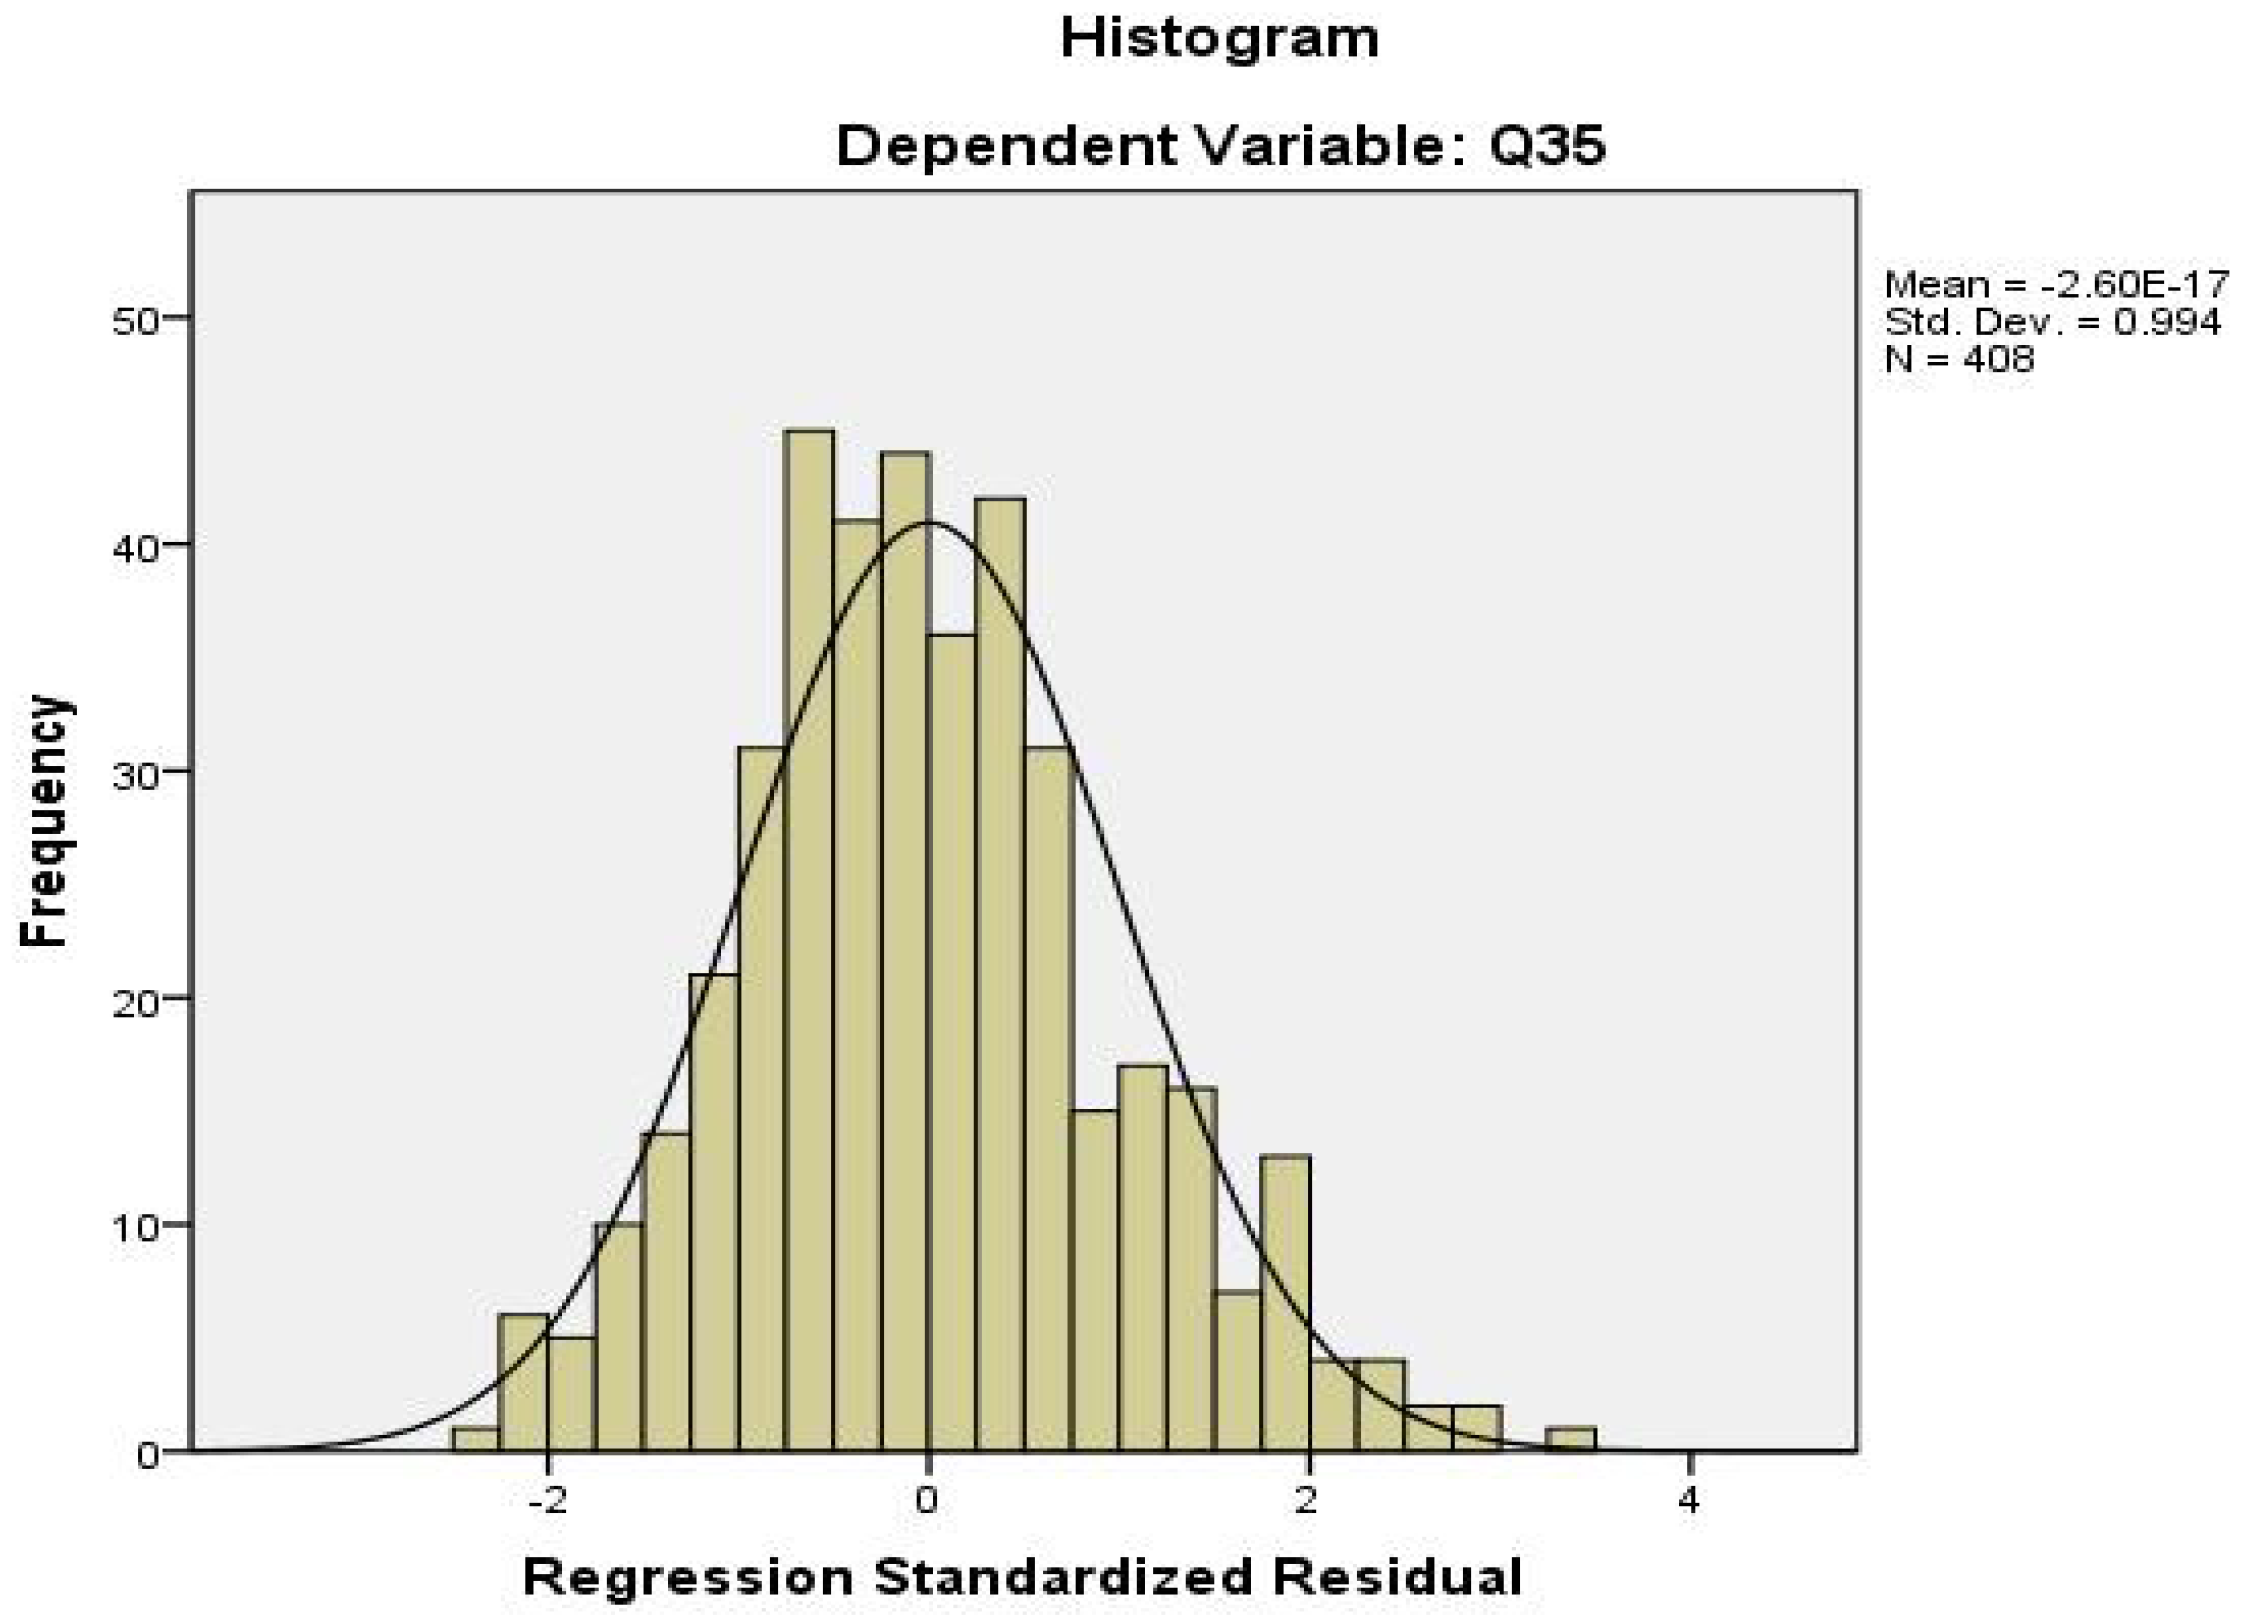
The regression standard residual of attitude toward EVs.

Figure 11.
The regression standard residual of purchasing willingness to EVs.

Figure 12.
Plug-in hybrid electric vehicles (PHEVs) purchasing Willingness Based on Incentives.

Figure 13.
EVs Purchasing Willingness Based on Inventives.

Figure 14.
Willingness Changed When Subsides Canceled by 2020.

Figure 15.
Passengers EVs Yield Past Years.


Table 1.
Sample Description.
| Gender | Male | 76.40% |
| Female | 23.60% | |
| 18–22 Years old | 1.20% | |
| Age | 22–35 Years old | 53.40% |
| Over 35 Years old | 45.30% | |
| Office worker | 40.40% | |
| Senior Manager | 21.20% | |
| Occupation | Private Firm Owner | 24.40% |
| University Student | 4.70% | |
| Research & Design Engineer | 9.40% | |
| Drive Experience | Less than 3 years | 31.50% |
| Between 3–5 years | 15.00% | |
| Between 5–8years | 19.70% | |
| Over 8 years | 33.70% | |
| Annual Income | Less than $8000 | 18.00% |
| $8000–15,000 | 33.50% | |
| $15,000–50,000 | 35.70% | |
| Over $50,000 | 12.80% | |
| Home Ownership | Owned Apartment | 54.20% |
| Rent Room | 30.80% | |
| Dormitory | 11.30% | |
| Others | 3.70% | |
| Travel Pattern | Owned Private Car | 55.70% |
| Company Scheduled Bus | 6.20% | |
| Public Bus or Metro | 26.60% | |
| Others | 11.60% |
Table 2.
Fisher test between factors and brand preference.
| Factors | Pearson Chi-Square Sig. | Fisher’s Exact Test Sig. |
|---|---|---|
| Occupation | 0.004 | 0.004 |
| Gender | 0.013 | 0.007 |
Table 3.
Fisher test between variables and electric vehicles (EVs) driving experiences.
| Factors | Pearson Chi-Square Sig. | Fisher’s Exact Test Sig. |
|---|---|---|
| Gender | 0.039 | 0.029 |
| Perception of EVs | 0.008 | 0.006 |
| Age | 0.582 | 0.643 |
| Income level | 0.321 | 0.317 |
| Occupation | 0.132 | 0.135 |
| Home Ownership | 0.224 | 0.214 |
| Origion | 0.07 | 0.07 |
Table 4.
Factor analysis test of purchasing preference.
| KMO(Kaiser-Meyer-Olkin) and Bartlett’s Test | ||
|---|---|---|
| KM0 Measure of Sampling Adequacy | 0.684 | |
| Bartlett’s Test of Sphericity | Approx. Chi-Square | 578.781 |
| df | 105 | |
| Sig. | 0.000 | |
Table 5.
Rotated components matrix.
| Component | |||||
|---|---|---|---|---|---|
| 1 | 2 | 3 | 4 | 5 | |
| Q9 | 0.534 | 0.006 | 0.122 | 0.037 | 0.379 |
| Q10 | −0.127 | 0.398 | 0.047 | 0.467 | 0.100 |
| Q11 | 0.169 | 0.179 | 0.555 | −0.155 | 0.287 |
| Q12 | 0.053 | −0.082 | −0.612 | 0.228 | 0.416 |
| Q13 | 0.022 | 0.020 | 0.083 | 0.017 | −0.790 |
| Q14 | 0.003 | −0.058 | 0.720 | 0.210 | −0.091 |
| Q15 | −0.154 | −0.192 | −0.119 | 0.610 | 0.073 |
| Q16 | 0.703 | 0.119 | 0.030 | −0.027 | −0.021 |
| Q17 | 0.751 | 0.106 | 0.063 | 0.041 | −0.032 |
| Q18 | 0.294 | 0.579 | 0.103 | 0.082 | 0.232 |
| Q19 | 0.536 | 0.240 | −0.104 | −0.016 | −0.038 |
| Q20 | 0.139 | 0.151 | 0.201 | 0.594 | −0.011 |
| Q21 | 0.137 | 0.661 | −0.078 | −0.142 | −0.167 |
| Q22 | 0.162 | 0.748 | 0.118 | 0.090 | −0.025 |
| Q23 | 0.244 | −0.039 | −0.335 | 0.531 | −0.237 |
Table 6.
Regression Coefficients.
| Model | Unstandardized Coefficients | Standardized Coefficients | t | Sig. | Collinearity Statistics | ||
|---|---|---|---|---|---|---|---|
| B | Std. Error | Beta | Tolerance | VIF | |||
| (Constant) | 2.364 | 0.030 | 77.536 | 0.000 | |||
| factor 1 | 0.212 | 0.031 | 0.244 | 6.958 | 0.000 | 1.000 | 1.000 |
| factor 3 | −0.291 | 0.031 | −0.335 | −9.549 | 0.000 | 1.000 | 1.000 |
| factor 4 | 0.462 | 0.031 | 0.531 | 15.147 | 0.000 | 1.000 | 1.000 |
| factor 5 | −0.206 | 0.031 | −0.237 | −6.752 | 0.000 | 1.000 | 1.000 |
Table 7.
Association test for willingness to buy EVs.
| Factors | Pearson Chi-Square Sig. | Fisher’s Exact Test Sig. |
|---|---|---|
| Occupation | 0.043 | 0.025 |
| Income level | 0.014 | 0.025 |
| Society network members | 0 | 0.001 |
| ICVs technology improve | 0 | 0 |
| Attitude toward Evs | 0.001 | 0.001 |
Table 8.
kMO(Kaiser-Meyer-Olkin) and Bartlett’s Test.
| KMO Measure of Sampling Adequacy | 0.771 | |
|---|---|---|
| Bartlett’s Test of Sphericity | Approx. Chi-Square | 1420.388 |
| df | 153 | |
| Sig. | 0.000 | |
Table 9.
Rotated component matrixa.
| Component | |||||
|---|---|---|---|---|---|
| 1 | 2 | 3 | 4 | 5 | |
| Q24 | 0.628 | ||||
| Q25 | 0.935 | ||||
| Q26 | 0.926 | ||||
| Q27 | 0.788 | ||||
| Q28 | |||||
| Q29 | |||||
| Q30 | |||||
| Q31 | 0.554 | ||||
| Q32 | 0.526 | ||||
| Q33 | 0.532 | ||||
| Q34 | 0.678 | ||||
| Q35 | 0.636 | ||||
| Q36 | |||||
| Q37 | 0.603 | ||||
| Q38 | 0.815 | ||||
| Q39 | 0.804 | ||||
| Q40 | |||||
| Q41 | 0.680 | ||||
Table 10.
Regression coefficients.
| Model | Unstandardized Coefficients | Standardized Coefficients | t | Sig. | Collinearity Statistics | ||
|---|---|---|---|---|---|---|---|
| B | Std. Error | Beta | Tolerance | VIF | |||
| (Constant) | 2.446 | 0.023 | 106.930 | 0.000 | |||
| factor score 1 | 0.390 | 0.023 | 0.628 | 17.011 | 0.000 | 1.000 | 1.000 |
| factor score 2 | 0.127 | 0.023 | 0.205 | 5.558 | 0.000 | 1.000 | 1.000 |
| factor score 4 | 0.073 | 0.023 | 0.118 | 3.197 | 0.001 | 1.000 | 1.000 |
Dependent Variable: Attitudes toward EVs.
Table 11.
Regression coefficients.
| Model | Unstandardized Coefficients | Standardized Coefficients | t | Sig. | Collinearity Statistics | ||
|---|---|---|---|---|---|---|---|
| B | Std. Error | Beta | Tolerance | VIF | |||
| (Constant) | 1.944 | 0.036 | 53.732 | 0.000 | |||
| factor 1 | 0.259 | 0.036 | 0.245 | 7.140 | 0.000 | 1.000 | 1.000 |
| factor 2 | 0.670 | 0.036 | 0.636 | 18.487 | 0.000 | 1.000 | 1.000 |
| factor 3 | 0.182 | 0.036 | 0.172 | 5.016 | 0.000 | 1.000 | 1.000 |
| factor 5 | −0.182 | 0.036 | −0.173 | −5.023 | 0.000 | 1.000 | 1.000 |
Dependent Variable: Purchasing willingness.
Table 12.
EVs price subsides in China.
| Vehicle Type | Range with Pure Electricity Model | |||
|---|---|---|---|---|
| 80 Km ⩽ R ⩽ 150 Km | 150 Km ⩽ R ⩽ 250 Km | R ≥ 250 Km | R ≥ 50 Km | |
| PEVs (2013) Unit: Ones | $5319.07 | $7598.67 | $9118.40 | N |
| PEVs (2014) Unit: Ones | $5319.07 | $7598.67 | $9118.40 | N |
| PHEVs (2013) Unit: Ones | $5319.07 | |||
| PHEVs (2014) Unit: Ones | $5319.07 | |||
Table 13.
EVs price subsides in Shenzhen.
| Vehicle Type | Range with Pure Electricity Model | |||
|---|---|---|---|---|
| 80 Km ⩽ R ⩽ 150 Km | 150 Km ⩽ R ⩽ 250 Km | R ≥ 250 Km | R ≥ 50 Km | |
| PEVs (2013) Unit: Ones | $5319.07 | $7598.67 | $9118.40 | N |
| PEVs (2014) Unit: Ones | $5319.07 | $7598.67 | $9118.40 | N |
| PHEVs (2013) Unit: Ones | $5319.07 | |||
| PHEVs (2014) Unit: Ones | $5319.07 | |||
Table 14.
KMO(Kaiser-Meyer-Olkin) and Bartlett’s Test.
| KMO Measure of Sampling Adequacy. | 0.818 | |
|---|---|---|
| Bartlett’s Test of Sphericity | Approx. Chi-Square | 839.176 |
| df | 66 | |
| Sig. | 0.000 | |
Table 15.
Rotated Component Matrix.
| Component | |||
|---|---|---|---|
| 1 | 2 | 3 | |
| Q42 | 0.566 | ||
| Q43 | 0.643 | ||
| Q44 | 0.663 | ||
| Q45 | 0.726 | ||
| Q46 | 0.550 | ||
| Q47 | 0.742 | ||
| Q48 | 0.733 | ||
| Q49 | 0.660 | ||
| Q50 | 0.677 | ||
| Q51 | 0.545 | ||
| Q52 | 0.620 | ||
| Q53 | 0.757 | ||
Table 16.
Regression Coefficients.
| Model | Unstandardized Coefficients | Standardized Coefficients | t | Sig. | Collinearity Statistics | ||
|---|---|---|---|---|---|---|---|
| B | Std. Error | Beta | Tolerance | VIF | |||
| (Constant) | 1.429 | 0.029 | 48.634 | 0.000 | |||
| factor score 1 | 0.225 | 0.029 | 0.296 | 7.634 | .000 | 1.000 | 1.000 |
| factor score 3 | 0.417 | 0.029 | 0.550 | 14.174 | 0.000 | 1.000 | 1.000 |
Dependent Variable: Purchasing willingness.
© 2017 by the authors. Licensee MDPI, Basel, Switzerland. This article is an open access article distributed under the terms and conditions of the Creative Commons Attribution (CC BY) license (http://creativecommons.org/licenses/by/4.0/).
Share and Cite
MDPI and ACS Style
Wang, F.-P.; Yu, J.-L.; Yang, P.; Miao, L.-X.; Ye, B. Analysis of the Barriers to Widespread Adoption of Electric Vehicles in Shenzhen China. Sustainability 2017, 9, 522. https://doi.org/10.3390/su9040522
AMA Style
Wang F-P, Yu J-L, Yang P, Miao L-X, Ye B. Analysis of the Barriers to Widespread Adoption of Electric Vehicles in Shenzhen China. Sustainability. 2017; 9(4):522. https://doi.org/10.3390/su9040522
Chicago/Turabian StyleWang, Fa-Ping, Jia-Li Yu, Peng Yang, Li-Xin Miao, and Bin Ye. 2017. "Analysis of the Barriers to Widespread Adoption of Electric Vehicles in Shenzhen China" Sustainability 9, no. 4: 522. https://doi.org/10.3390/su9040522
Note that from the first issue of 2016, this journal uses article numbers instead of page numbers. See further details here.