
Analysis of Energy Literacy and Misconceptions of Junior High Students in Taiwan


Abstract
:1. Introduction
2. Literature Review
2.1. Energy Literacy
2.2. Misconceptions about Energy
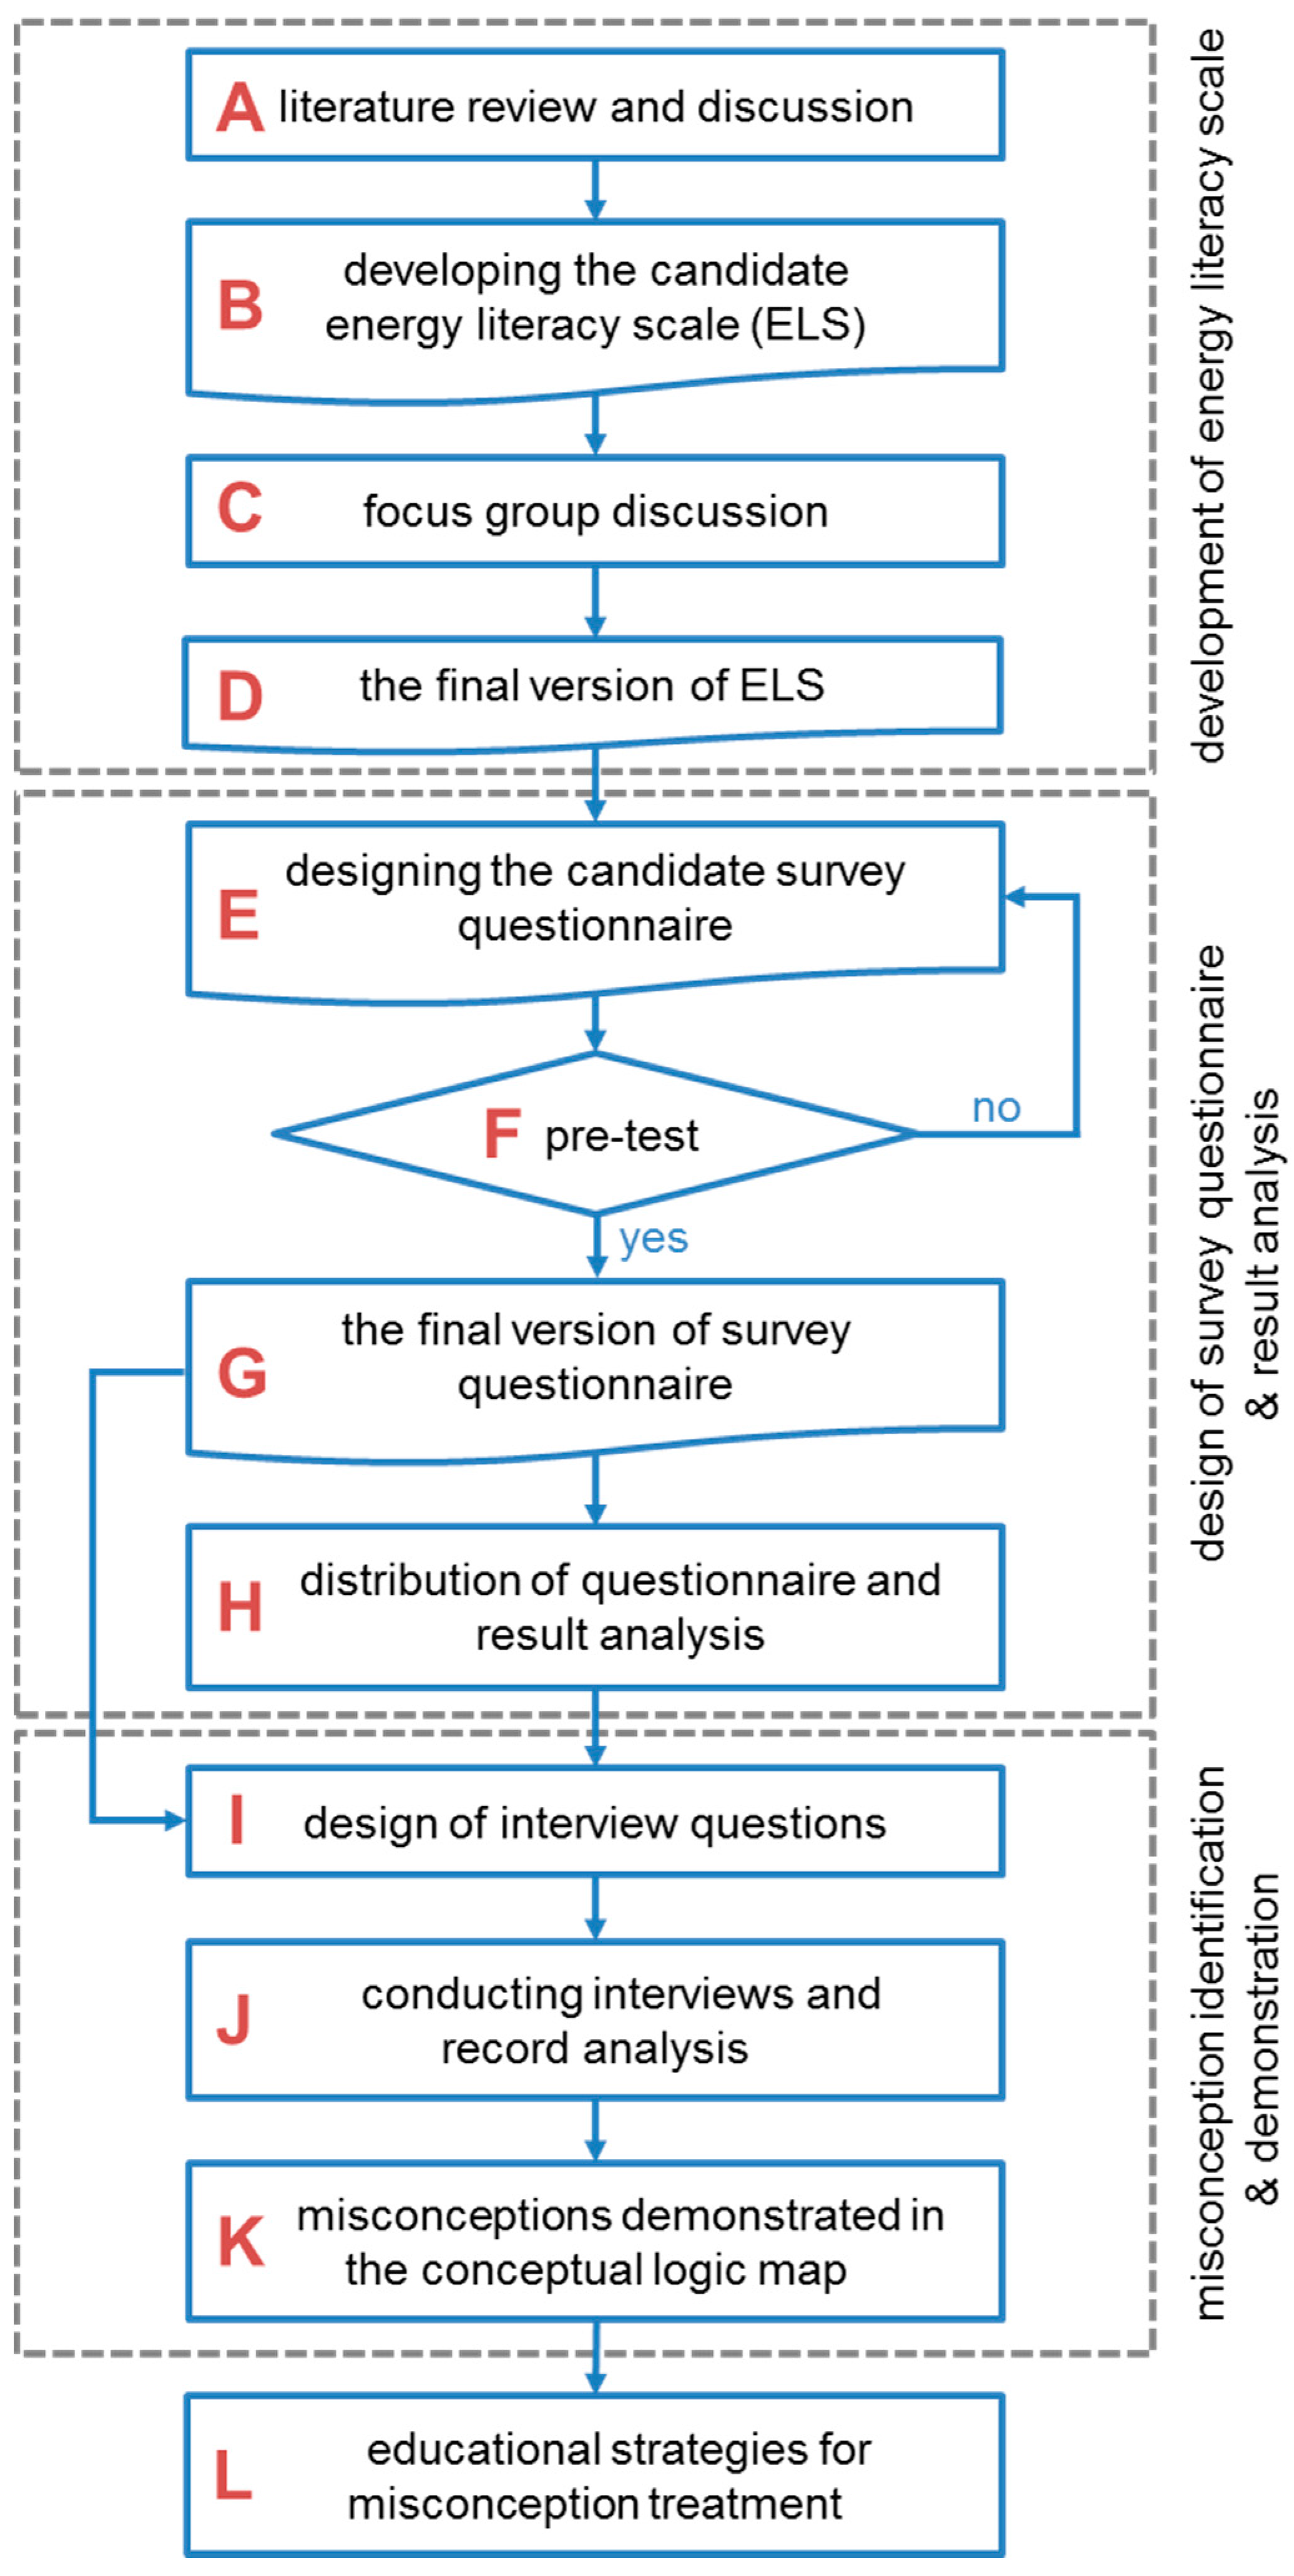
3. Methodology
3.1. Development of the Energy Literacy Scales
3.2. Development of the Questionnaire and Conducting of Survey
3.3. Interviews for Identifying Misconceptions
4. Results of the Energy Literacy Survey
4.1. Sample Description
4.2. Energy-Related Knowledge
4.3. Energy-Related Attitudes and Actions
4.4. Correlations among Components and Sub-Components
5. Results of the Interview
5.1. Implementation of the Interview
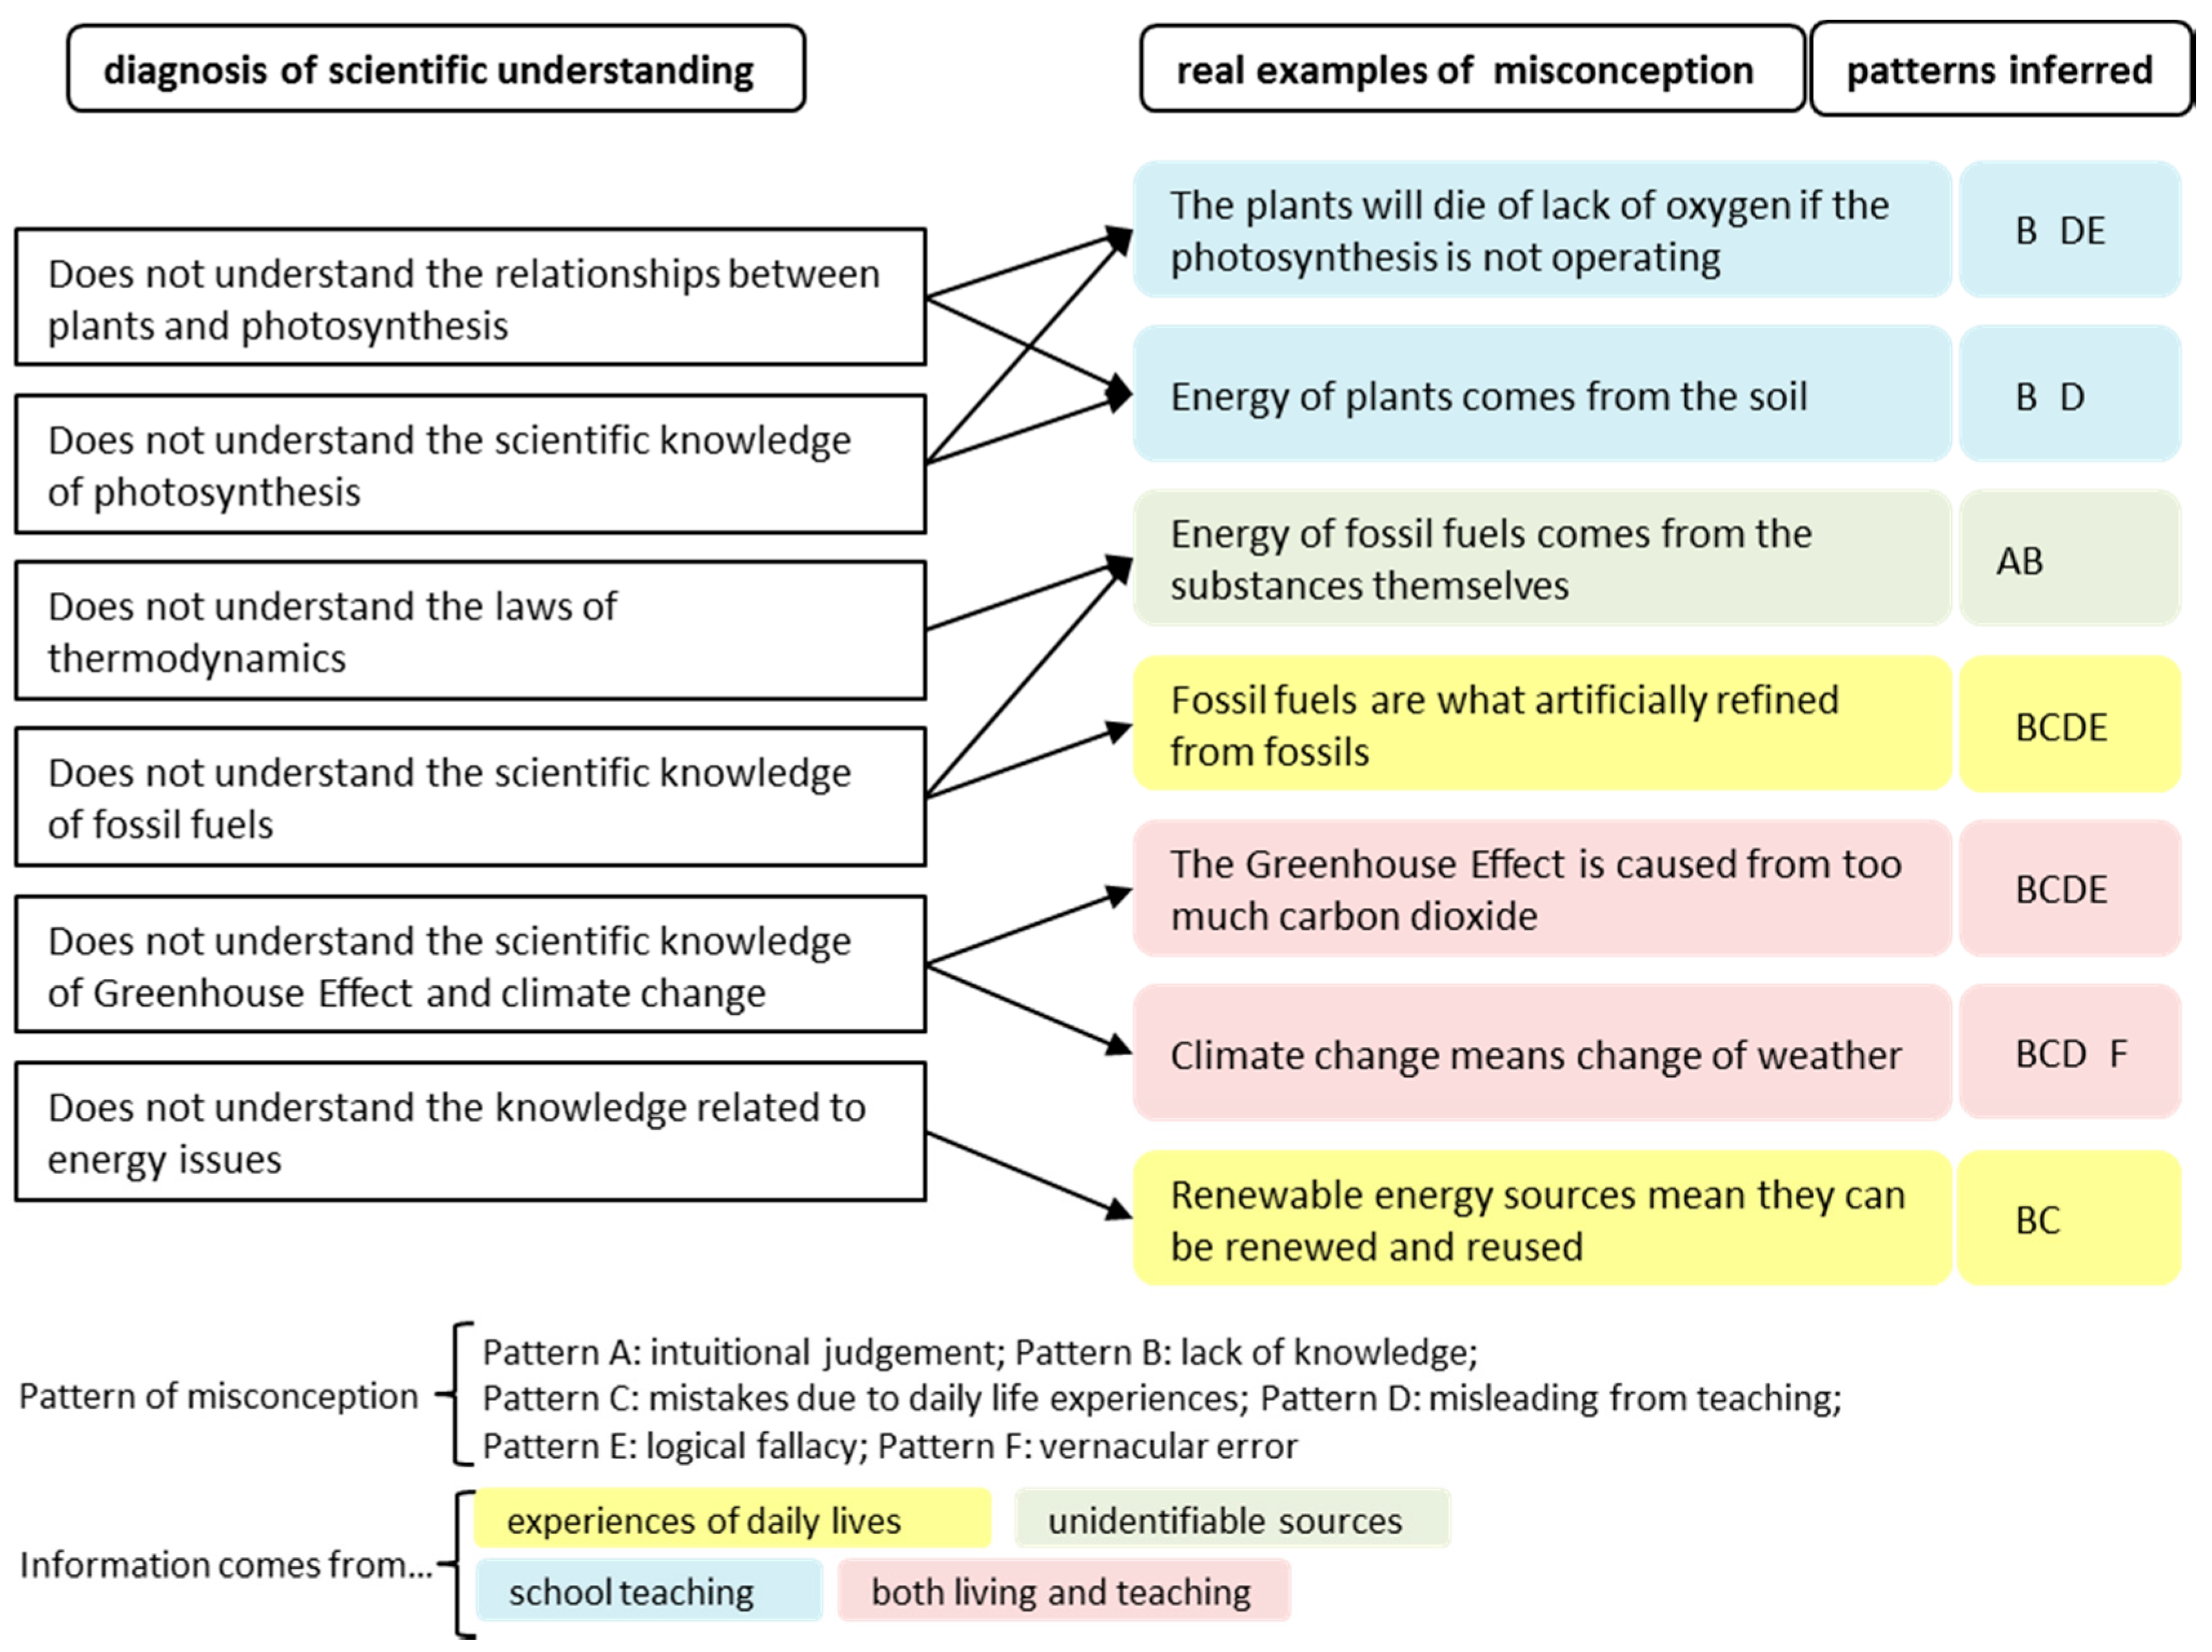
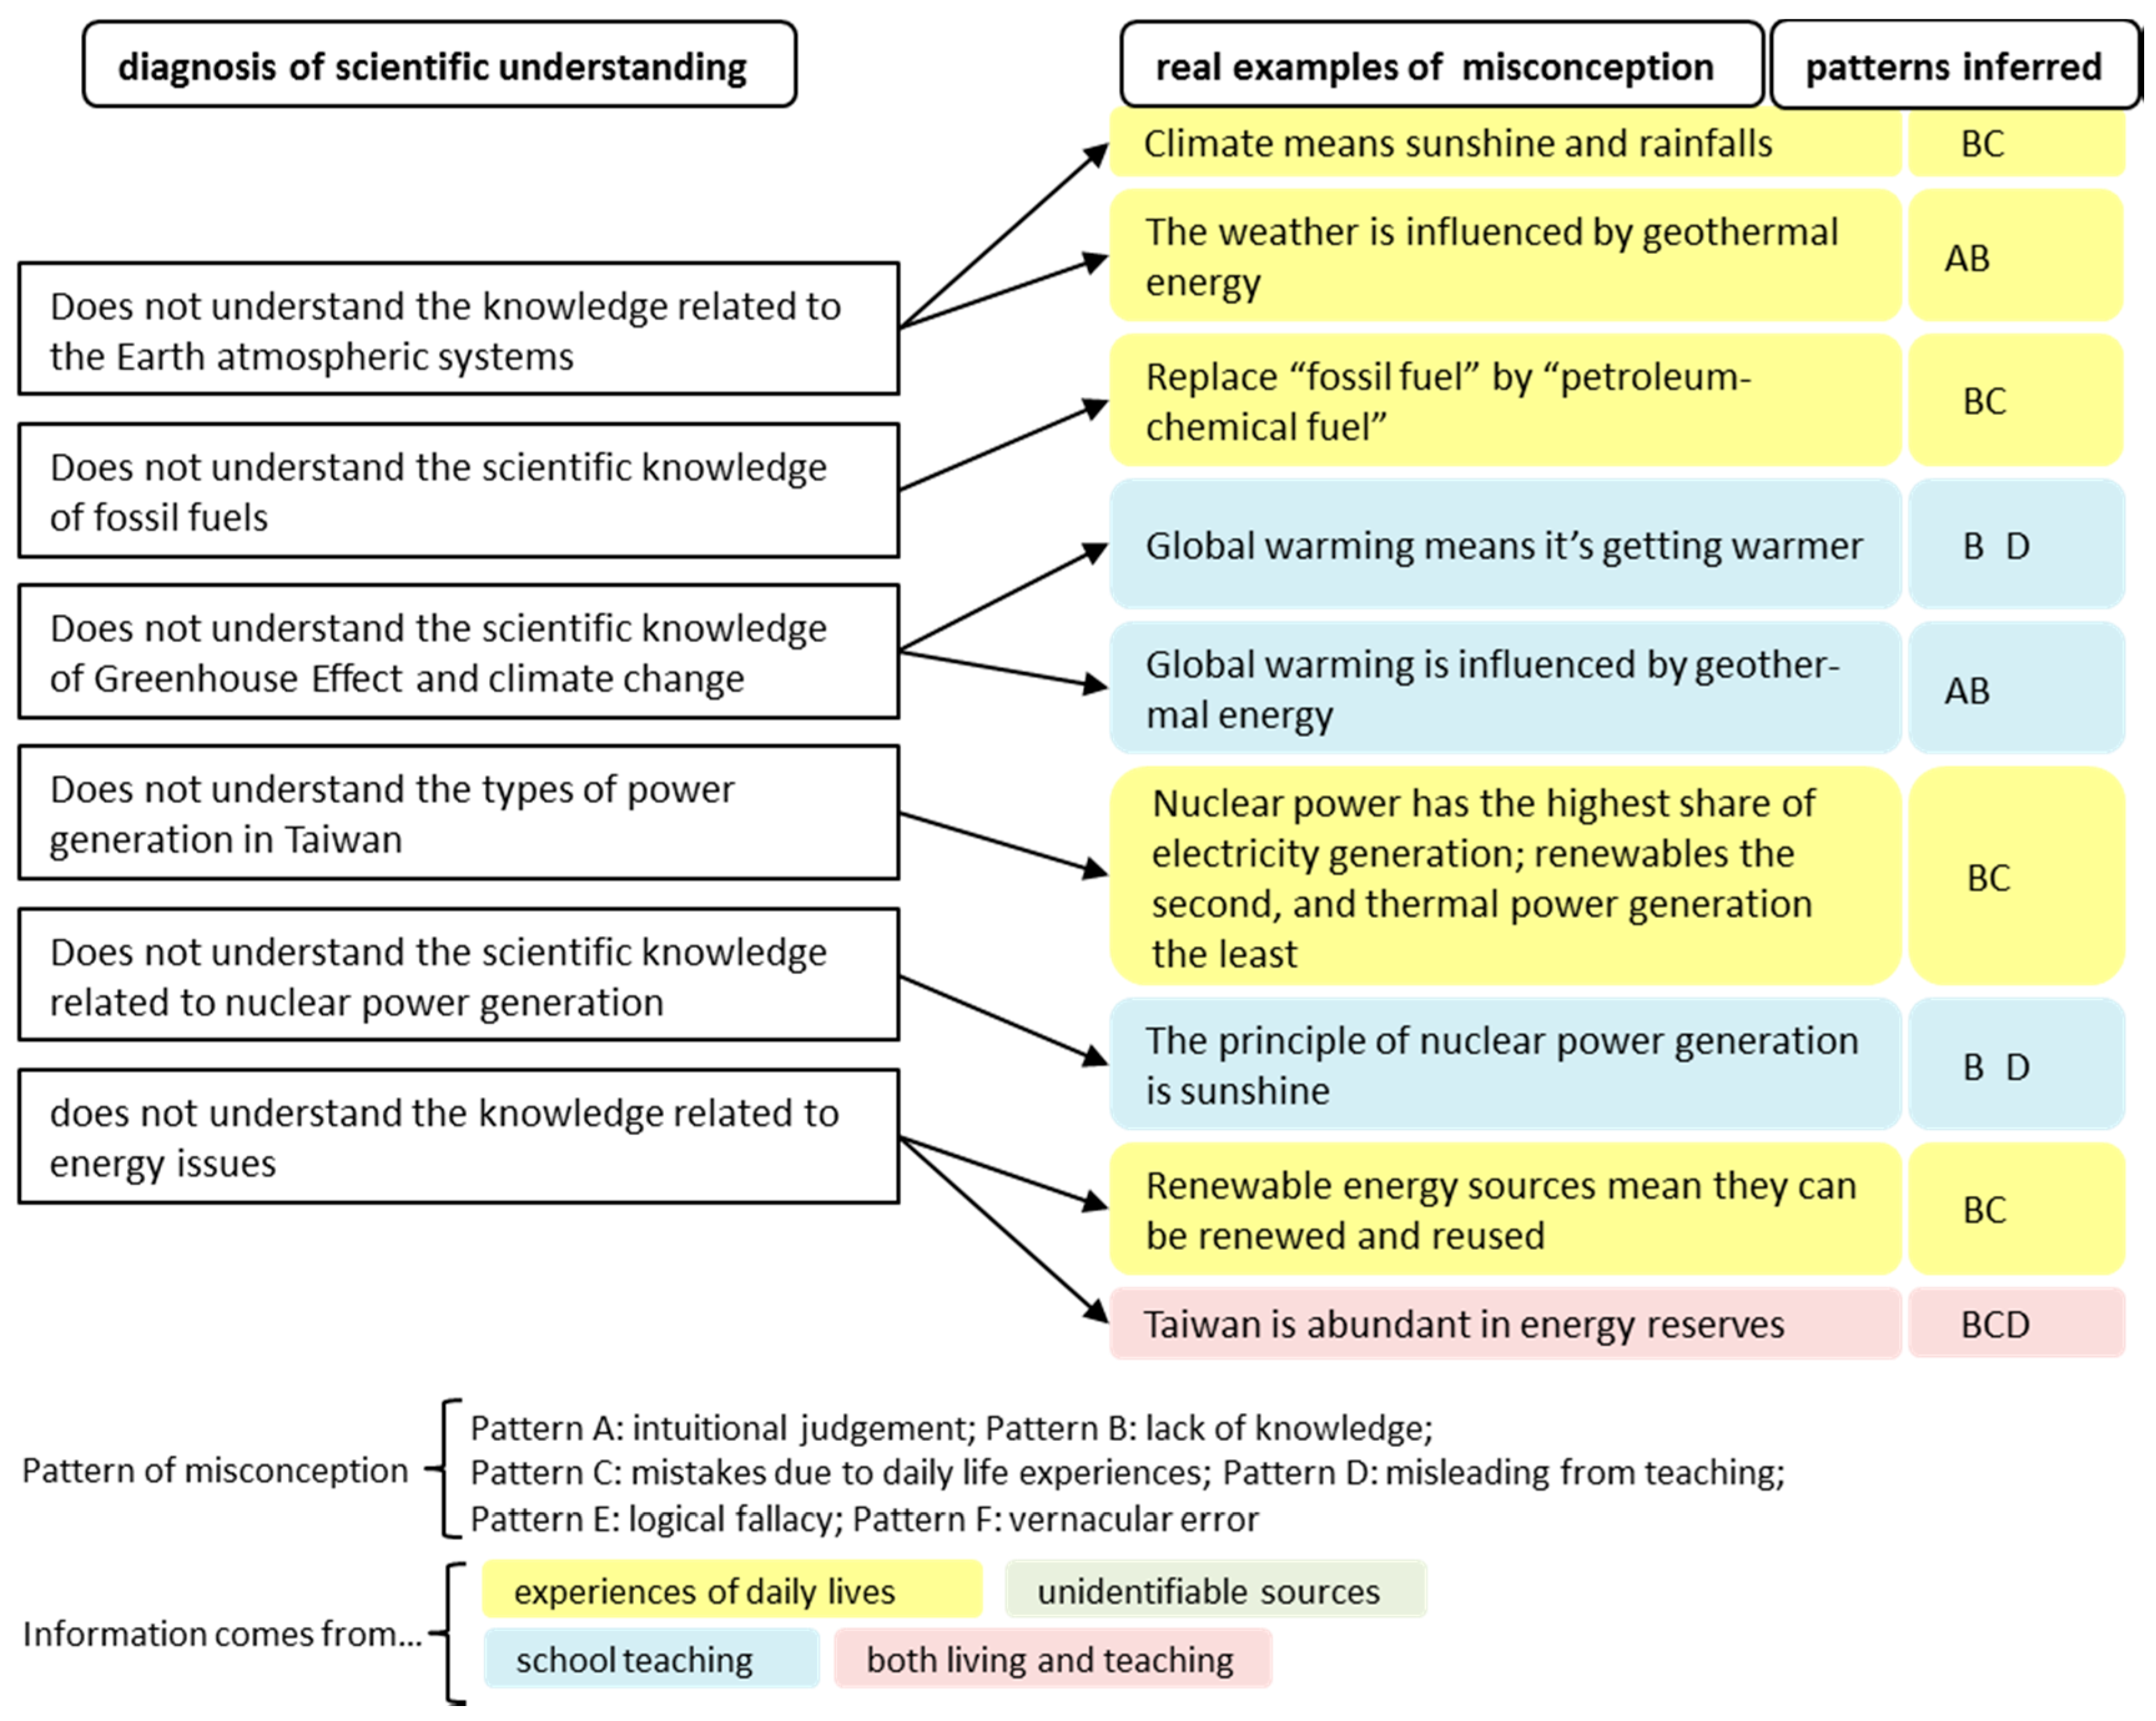
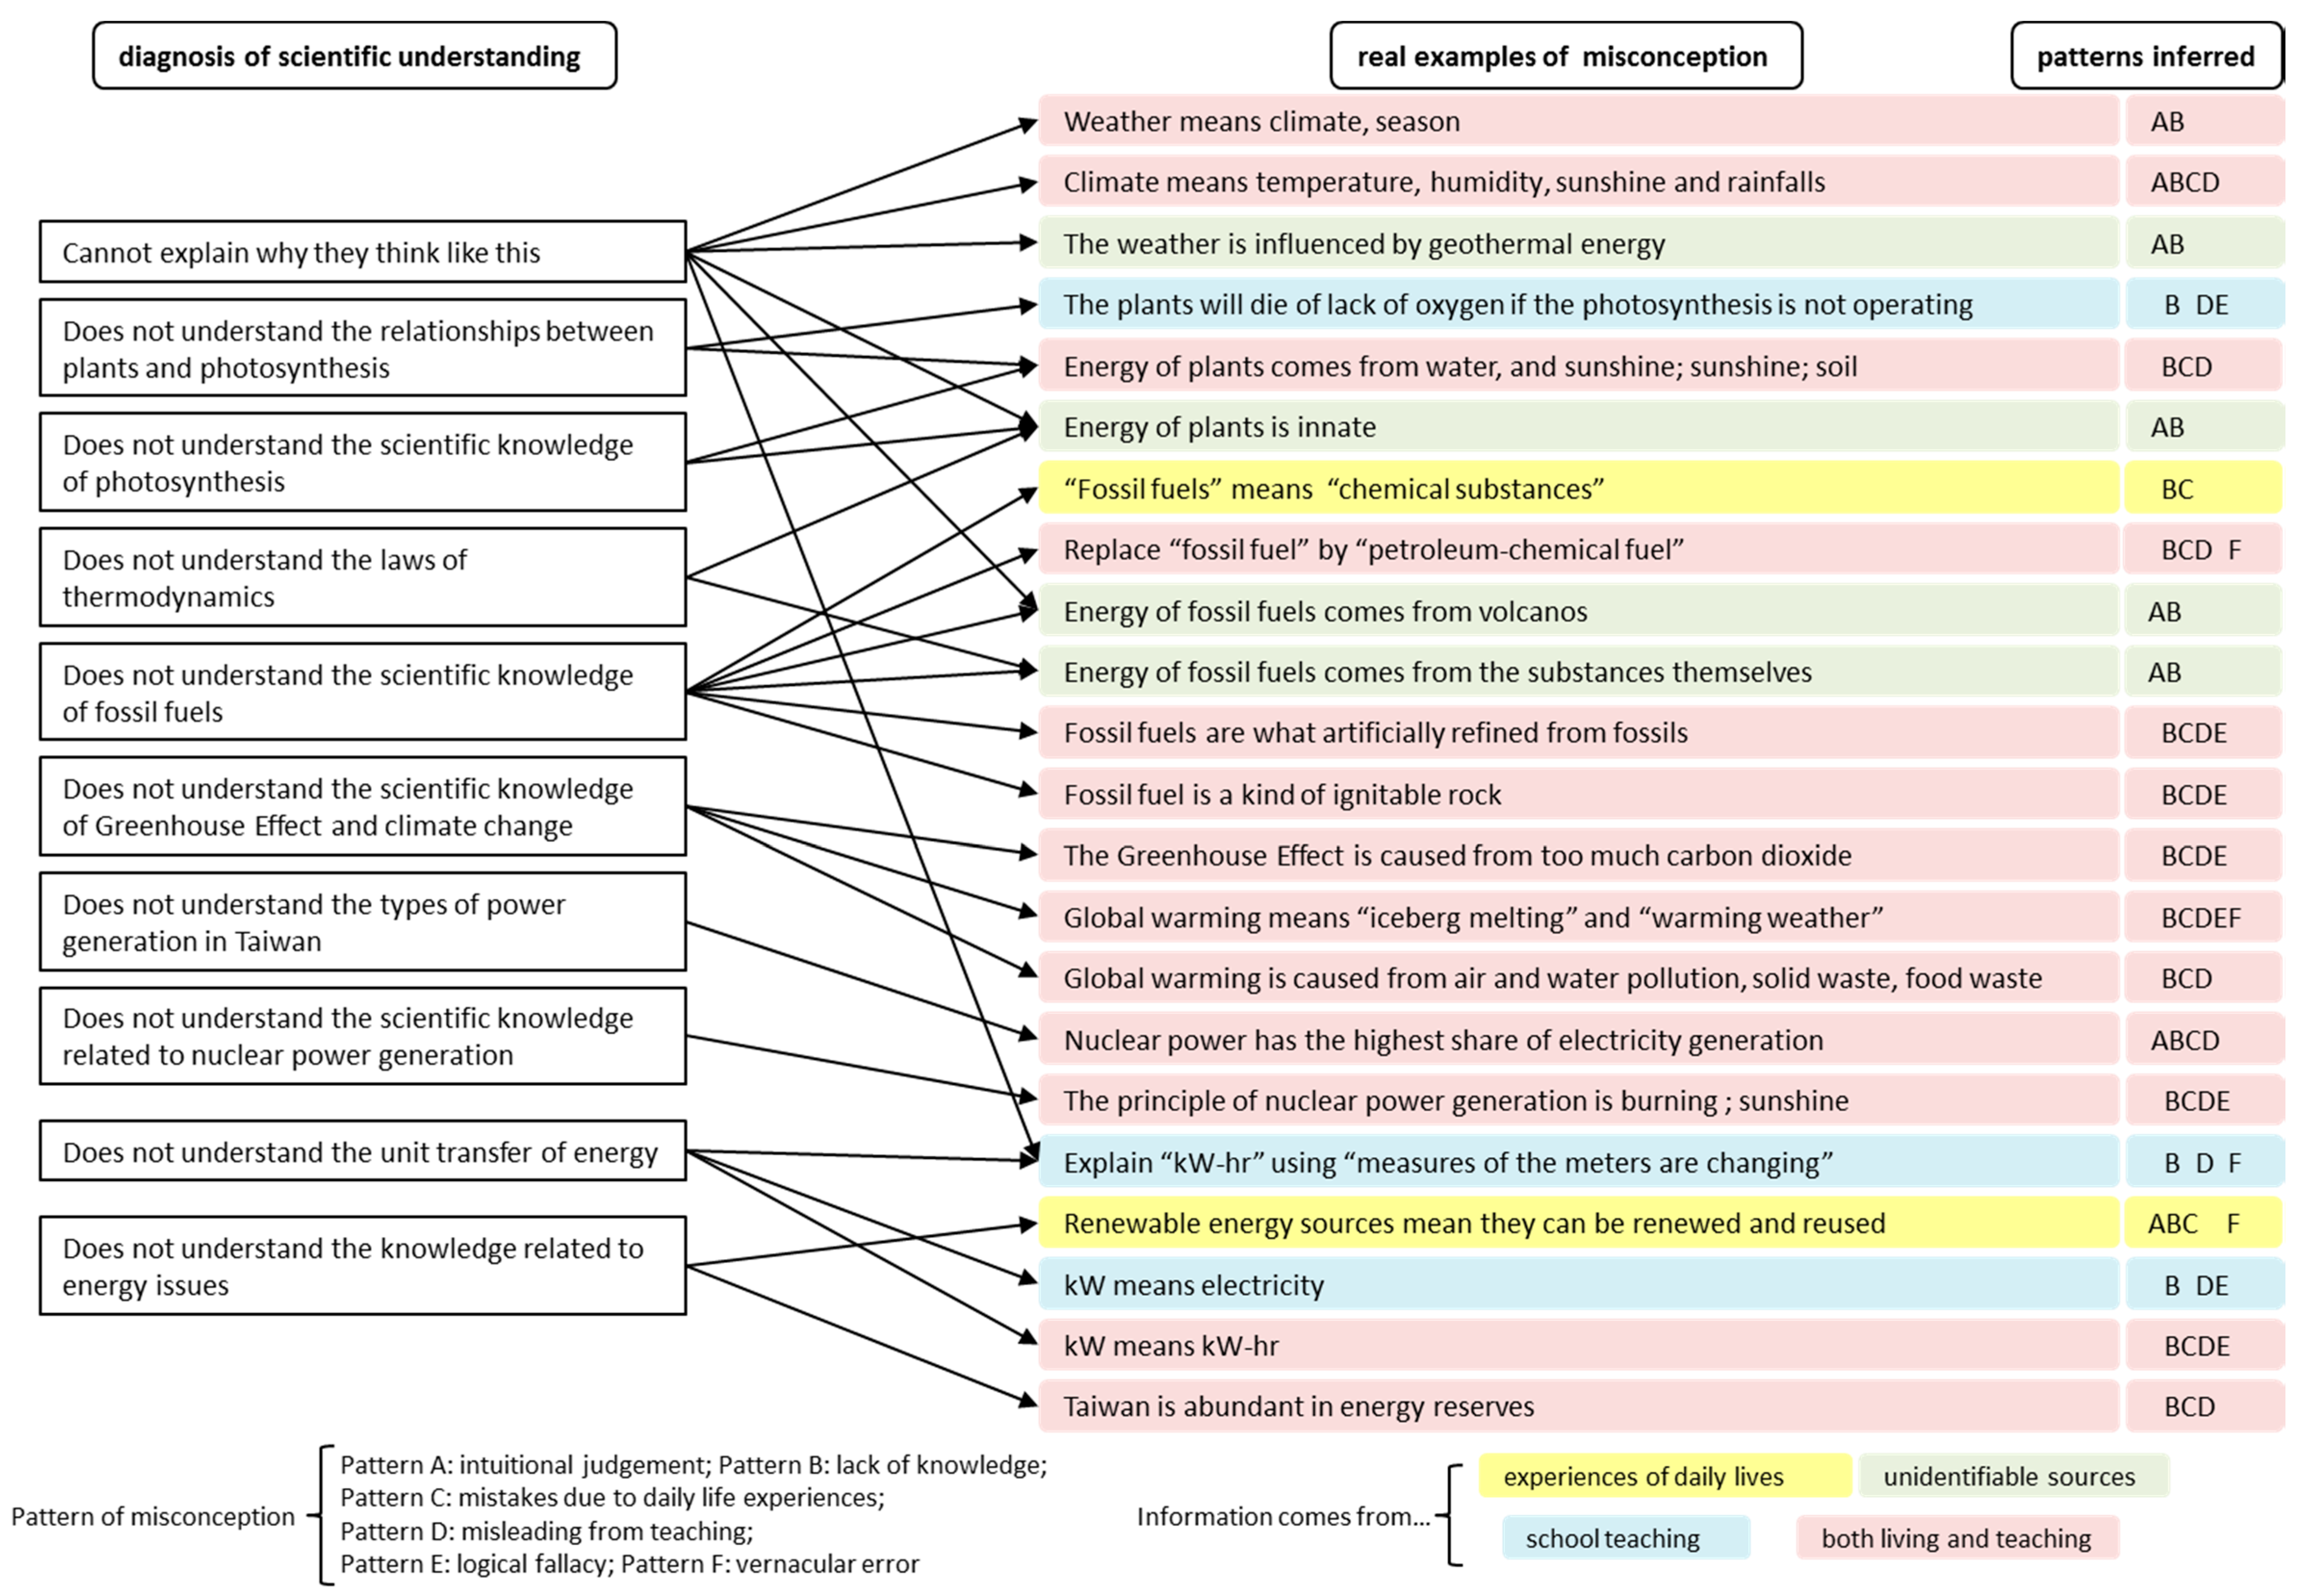
5.2. Issue-Oriented Misconception Analysis
- Participant JHS_B_01
- Q: Have you ever heard of the two terms “weather” and “climate”?
- A: Yes.
- Q: Could you explain these two terms?
- A: Weather is like…the weather is getting cold. Climate is a longer concept.
- Q: What do you mean by “a longer concept”?
- A: A concept for a longer period of time.
- Q: How does the weather happen?
- A: I don’t know (B).
- Q: Where did you hear about weather?
- A: News and TV.
- Participant JHS_B_03
- Q: Have you ever heard of the two terms “weather” and “climate”?
- A: Yes.
- Q: Could you explain these two terms or give me some examples?
- A: Weather … like the sun shines. Climate … ”temperature”? (B)
- Q: Are they the same thing? Why?
- A: No, … I don’t know. (B)
- Q: Where did you hear about them?
- A: School (D) and TV (C)
- Q: So you know they are different but don’t know why?
- A: Yes.
- Q: Then, do you know why there are weather and climate?
- A: I don’t know. (B)
- (1)
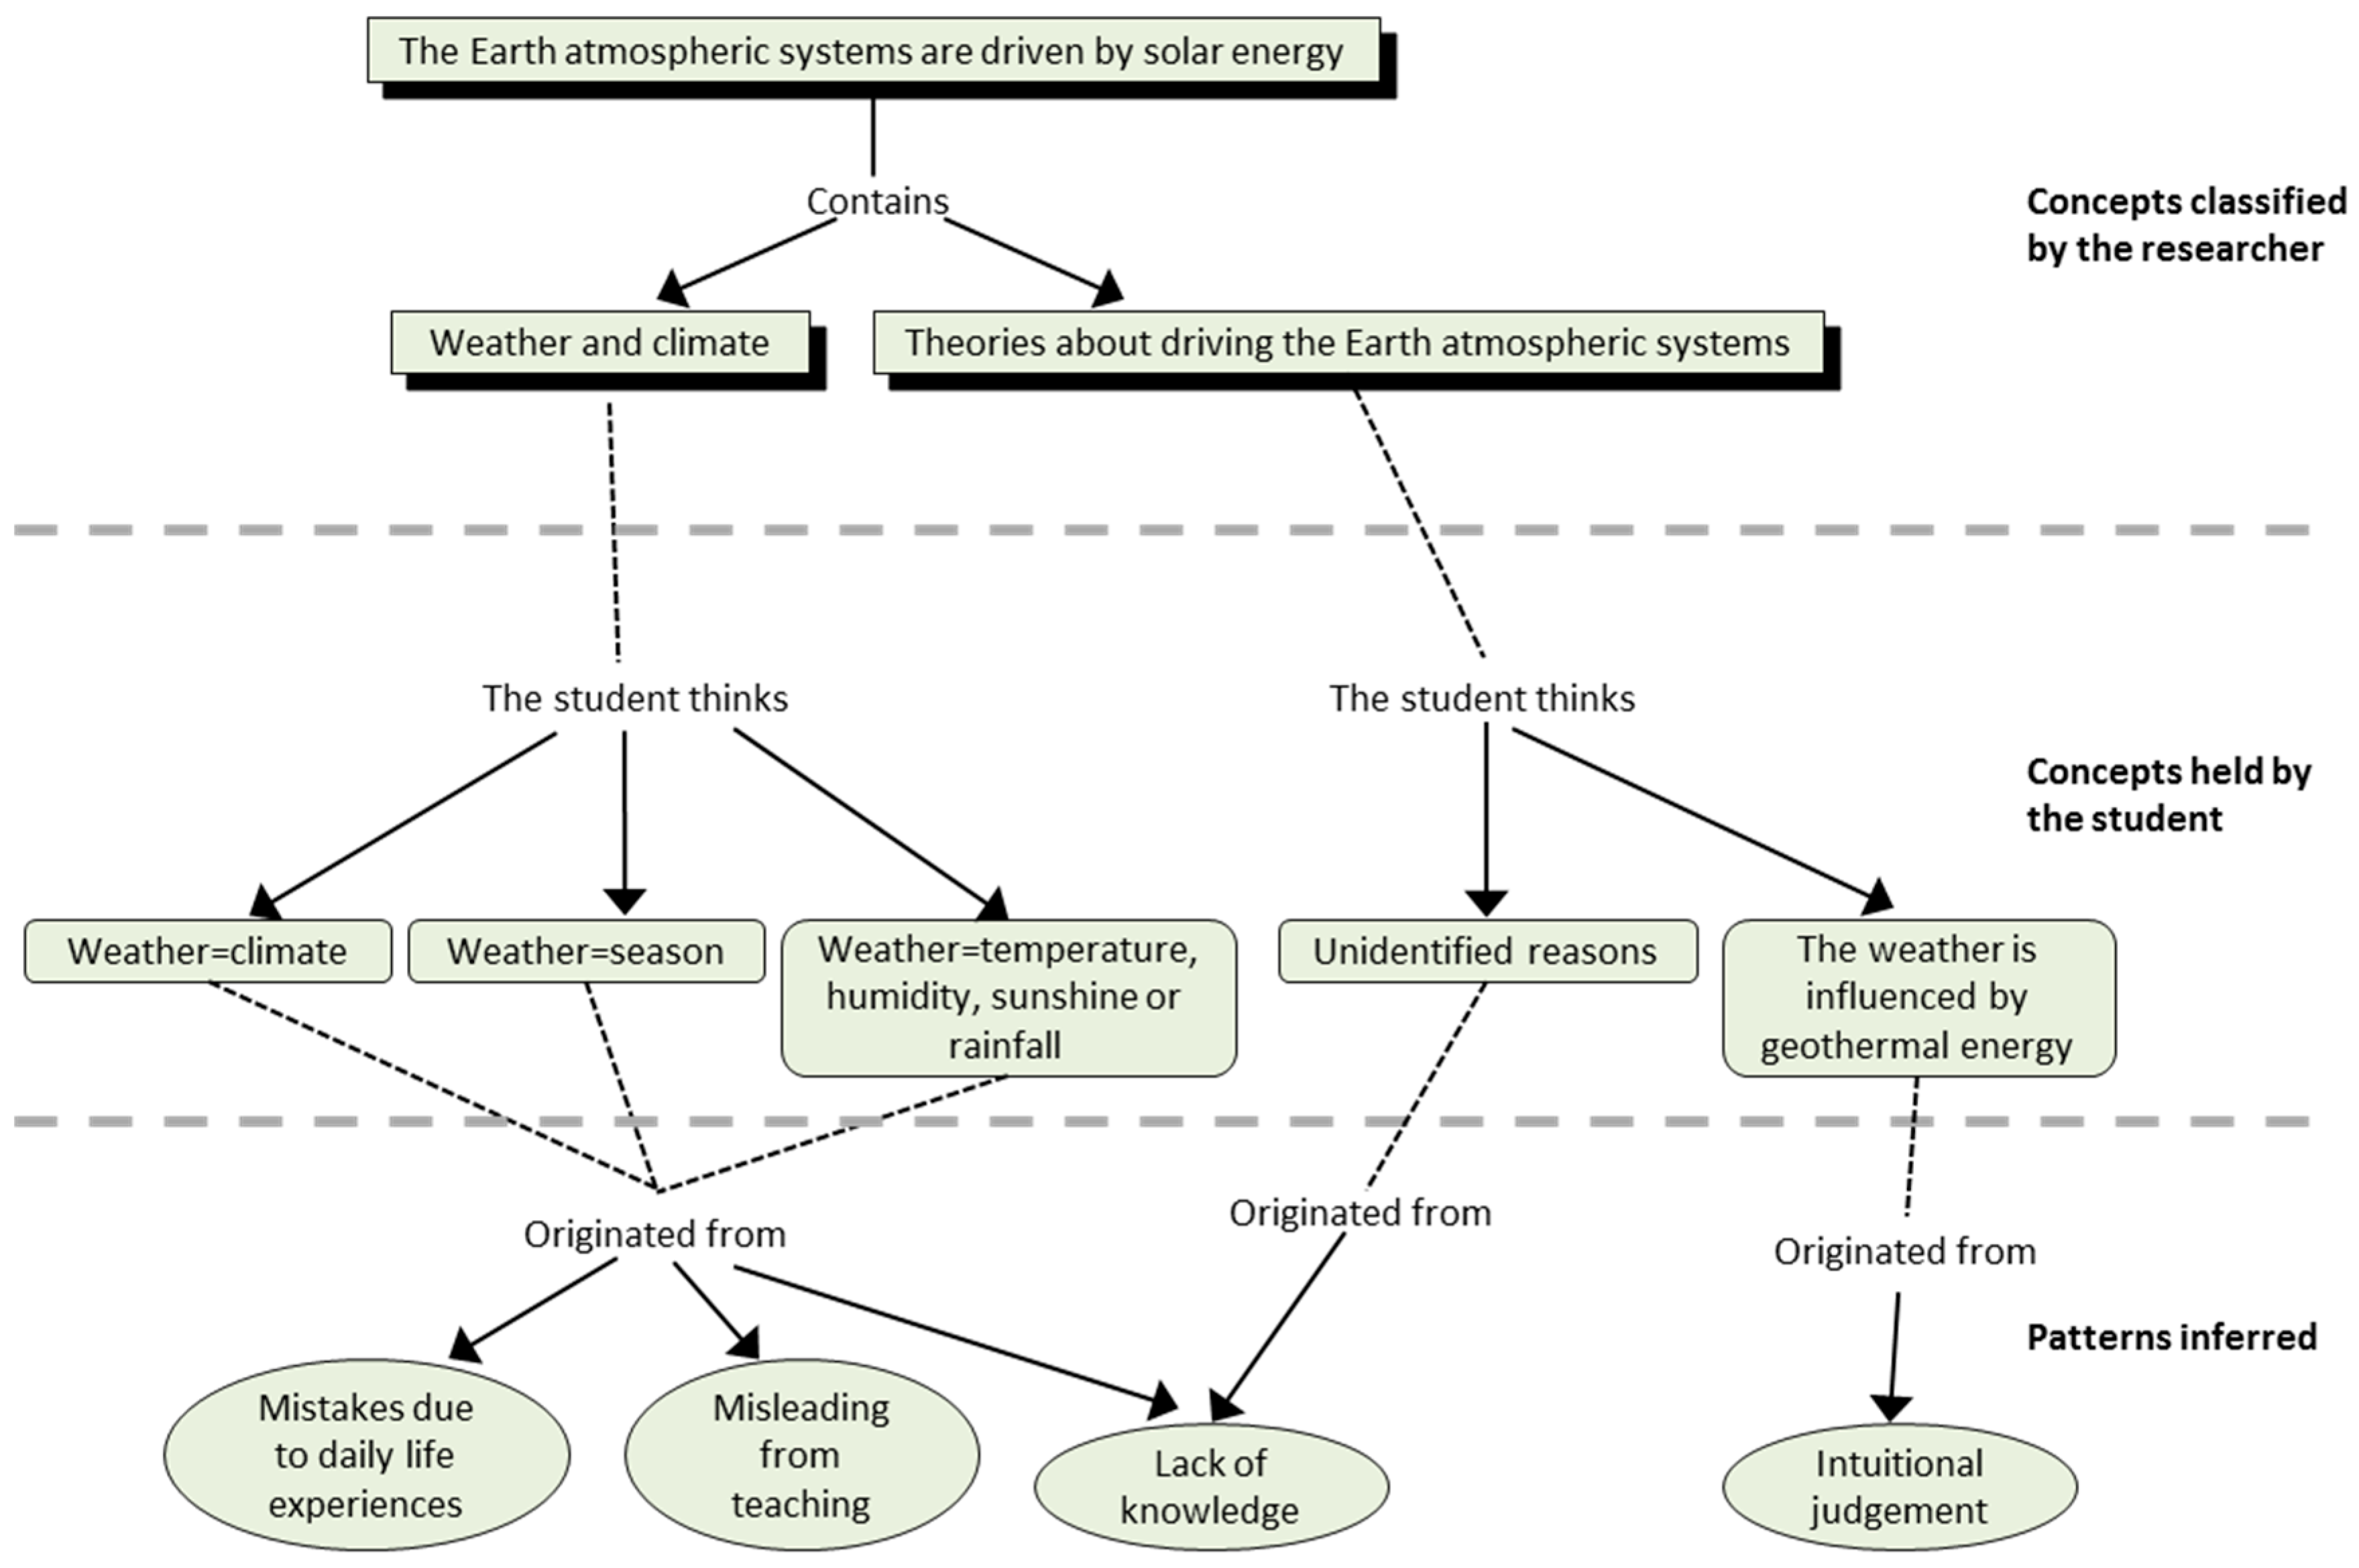
- Intuitional judgement (Pattern A)Because of a lack of knowledge and being familiar with these two terms as they are shown in school classes, the news, or on TV, the students tended to judge weather and climate intuitively. Some students could not explain the climate and weather but concluded they are different.
- (2)
- Lack of knowledge (Pattern B)It was common that the students did not have enough knowledge regarding weather and climate. Only a few students could state clearly that the time scales are different. Most students could not answer the questions correctly. Some thought the weather is about seasons while climate is about temperature, humidity, and rainfall; or thought that geothermal energy will influence weather and climate.
- (3)
- Mistakes from experiences in daily lives (Pattern C)As the students said, weather and climate are terms commonly heard in daily life, including in the news and on TV. However, they are not explained clearly and thus students did not identify the differences or have in-depth understanding. This makes the students confused.
- (4)
- Misleading teaching (Pattern D)Concepts of weather and climate were taught in school classes. However, if they were not explained clearly in teaching or inappropriate examples were mentioned, the students tended to learn incorrect knowledge.
- Participant JHS_G_07
- Q: Have you ever heard of the term “petroleum–chemical fuels”?
- A: Yes.
- Q: What are they?
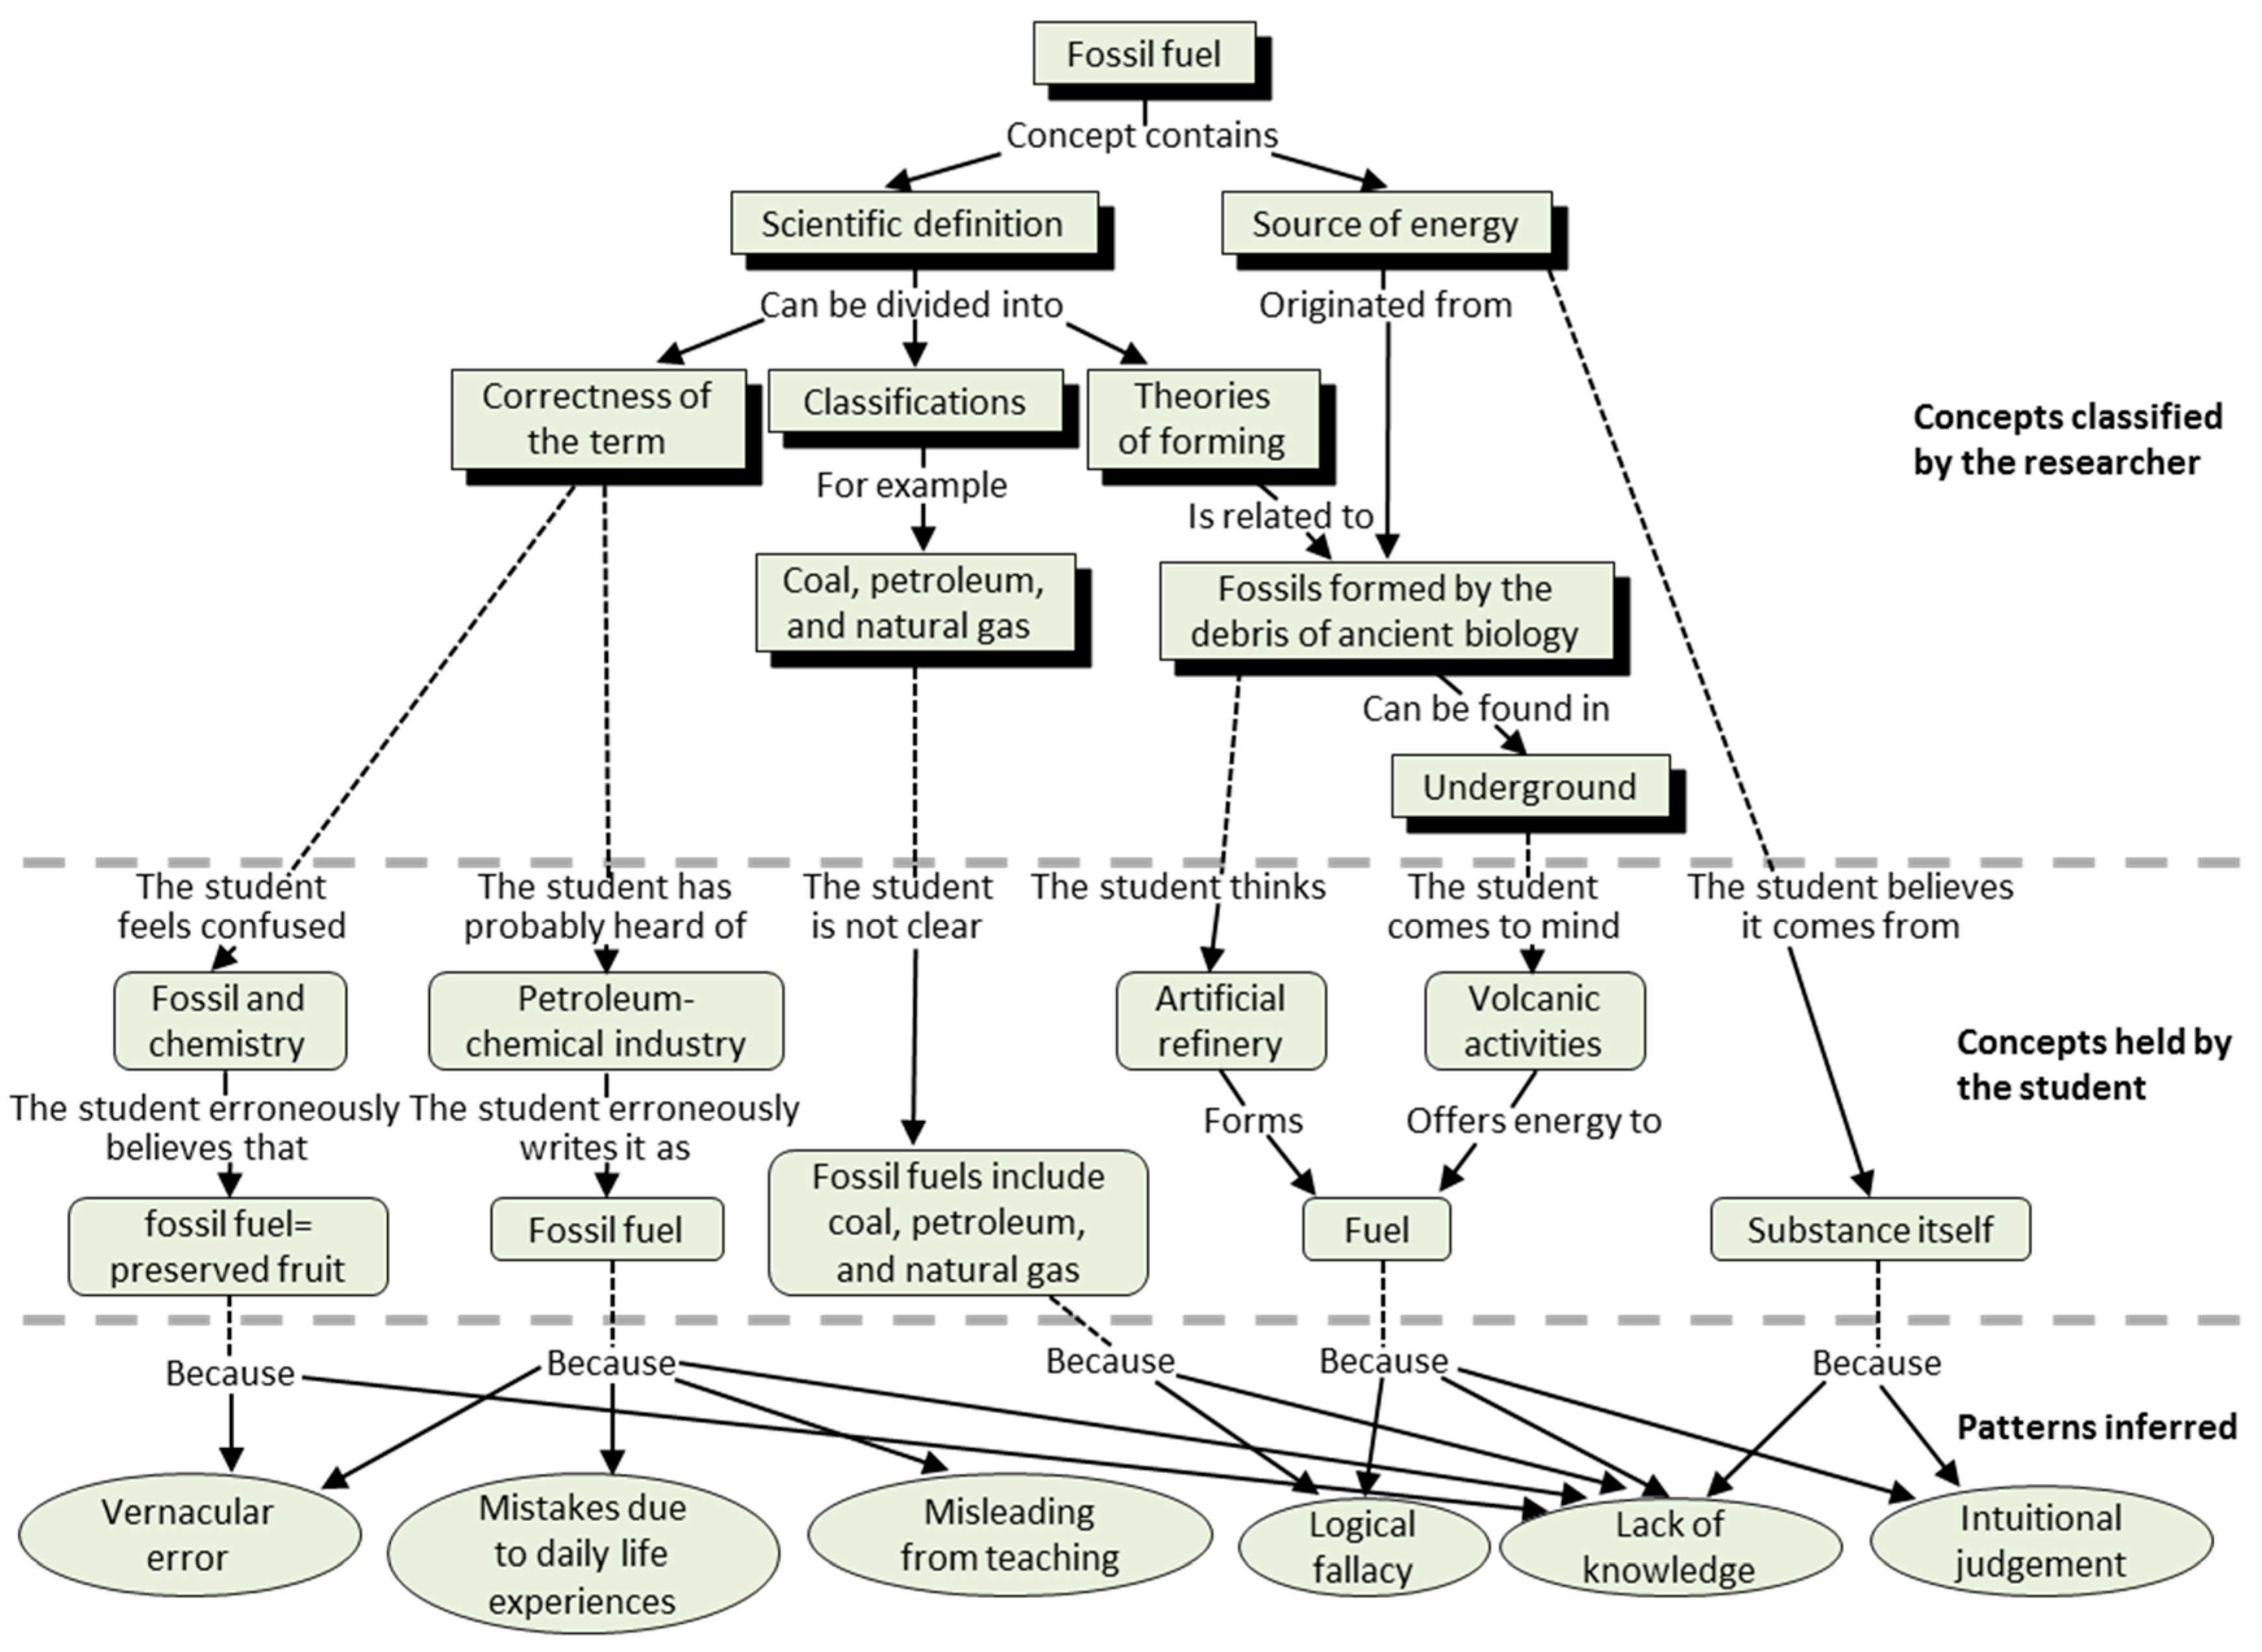
- A: Should be those things like gasoline. (F)
- Q: Have you ever heard of the term “fossil fuels”?
- A: No. (B)
- Q: Then, do you think “fossil fuels” and “petroleum–chemical fuels” are the same?
- A: No. (A).
- Q: Where did you hear about the term(s)?
- A: “Nature” class at school. (D)
- Q: Where did you read about the term(s)?
- A: Textbooks of biology. (D)
- Q: You just mentioned gasoline. How was it formed?
- A: Just like things like coal… but I did not know how it was formed. (B)
- Q: Then, where did gasoline energy come from?
- A: Geothermal energy. (B)
- Q: So, geothermal energy supplied coal or petroleum energy so that we can use the energy now?
- A: Yes!
5.3. Participant-Oriented Misconception Analysis
5.4. Potential Educational Strategies to Treat Misconceptions
6. Conclusions
Acknowledgments
Author Contributions
Conflicts of Interest
Appendix A

| Component | Subcomponent 2-1 (K): Development and Use of Energy | Subcomponent 2-1 (AC): Development and Use of Energy | Subcomponent 2-2 (K): Decision Making about Energy | Subcomponent 2-2 (AC): Decision Making about Energy | Subcomponent 2-3 (K): Energy Issues and Worldview | Subcomponent 2-3 (AC): Energy Issues and Worldview | Component 2: Energy and Life | |
|---|---|---|---|---|---|---|---|---|
| Subcomponent 3-1 (AC): personal awareness and individual actions | Pearson r | 0.002 | 0.021 | 0.048 | 0.298 ** | 0.019 | 0.111 ** | 0.150 ** |
| significance | 0.938 | 0.456 | 0.095 | 0.000 | 0.505 | 0.000 | 0.000 | |
| Subcomponent 3-2 (AC): citizen participation | Pearson r | −0.004 | −0.018 | 0.036 | 0.275 ** | −0.013 | 0.263 ** | 0.156 ** |
| significance | 0.890 | 0.524 | 0.204 | 0.000 | 0.642 | 0.000 | 0.000 | |
| Component 3: citizen responsibility and action | Pearson r | −0.001 | 0.002 | 0.045 | 0.310 ** | 0.003 | 0.202 ** | 0.166 ** |
| significance | 0.974 | 0.953 | 0.112 | 0.000 | 0.913 | 0.000 | 0.000 | |
References
- International Energy Agency (IEA). Energy, Climate Change and Environment 2016 Insights; IEA: Paris, France, 2016. [Google Scholar]
- Intergovernmental Panel on Climate Change (IPCC). Climate Change 2014 Synthesis Report Summary for Policymakers; IPCC: Geneva, Switzerland, 2014. [Google Scholar]
- International Energy Agency (IEA). Tracking Clean Energy Progress 2016—Energy Technology Perspectives 2016 Excerpt, IEA Input to the Clean Energy Ministerial; OECD/IEA: Paris, France, 2016. [Google Scholar]
- Noe-Hays, A. Energy Literacy: Learning with Body and Mind. Synergy Learn. 2011, 25, 1–3. [Google Scholar]
- Baron, R. Energy Transition after the Paris Agreement Policy and Corporate Challenges. In Proceedings of the 34th Round Table on Sustainable Development, WindEurope Summit, Hamburg, Germany, 28–29 September 2016.
- DeWaters, J.; Powers, S. Establishing Measurement Criteria for an Energy Literacy Questionnaire. J. Environ. Educ. 2013, 44, 38–55. [Google Scholar] [CrossRef]
- Newborough, M.; Probert, D. Purposeful Energy Education in the UK. Appl. Energy 1994, 48, 243–259. [Google Scholar] [CrossRef]
- St. Clair, R. Words for the World: Creating Critical Environmental Literacy for Adults. New Dir. Adult Contin. Educ. 2003, 99, 69–78. [Google Scholar] [CrossRef]
- DeWaters, J.E.; Powers, S.E. Energy Literacy of Secondary Students in New York State (USA): A Measure of Knowledge, Affect, and Behavior. Energy Policy 2011, 39, 1699–1710. [Google Scholar] [CrossRef]
- Chen, K.-L.; Liu, S.-Y.; Chen, P.-H. Assessing Multidimensional Energy Literacy of Secondary Students Using Contextualized Assessment. Int. J. Environ. Sci. Educ. 2015, 10, 201–218. [Google Scholar]
- Lee, L.-S.; Lee, Y.-F.; Altschuld, J.W.; Pan, Y.-J. Energy Literacy: Evaluating Knowledge, Affect, and Behavior of Students in Taiwan. Energy Policy 2015, 76, 98–106. [Google Scholar] [CrossRef]
- Maddock, B.; Kriewaldt, J. Post-Primary Education and Energy Literacy: An Analysis of the Potential for Geography Curricula to Contribute to Australian Students’ Energy Literacy. Geograph. Educ. 2014, 27, 39–50. [Google Scholar]
- Keramitsoglou, K.M. Exploring Adolescents’ Knowledge, Perceptions and Attitudes towards Renewable Energy Sources: A Colour Choice Approach. Renew. Sustain. Energy Rev. 2016, 59, 1159–1169. [Google Scholar] [CrossRef]
- Cotton, D.R.E.; Miller, W.; Winter, J.; Bailey, I.; Sterling, S. Developing Students’ Energy Literacy in Higher Education. Int. J. Sustain. High. Educ. 2015, 16, 456–473. [Google Scholar] [CrossRef]
- Brounen, D.; Kok, N.; Quigley, J.M. Energy Literacy, Awareness, and Conservation Behavior of Residential Households. Energy Econ. 2013, 38, 42–50. [Google Scholar] [CrossRef]
- Lee, R.P. Misconceptions and Biases in German Students’ Perception of Multiple Energy Sources: Implications for Science Education. Int. J. Sci. Educ. 2016, 38, 1036–1056. [Google Scholar] [CrossRef]
- Flener-Lovitt, C. Using the Socioscientific Context of Climate Change to Teach Chemical Content and the Nature of Science. J. Chem. Educ. 2014, 91, 1587–1593. [Google Scholar] [CrossRef]
- Tortop, H.S. Awareness and Misconceptions of High School Students about Renewable Energy Resources and Applications: Turkey Case. Energy Educ. Sci. Technol. Part B Soc. Educ. Stud. 2012, 4, 1829–1840. [Google Scholar]
- Kishore, P.; Kisiel, J. Exploring High School Students’ Perceptions of Solar Energy and Solar Cells. Int. J. Environ. Sci. Educ. 2013, 8, 521–534. [Google Scholar]
- Spiropoulou, D.; Antonakaki, T.; Kontaxaki, S.; Bouras, S. Primary Teachers’ Literacy and Attitudes on Education for Sustainable Development. J. Sci. Educ. Technol. 2007, 16, 443–450. [Google Scholar] [CrossRef]
- DeWaters, J.E.; Powers, S.E.; Graham, M. Developing an energy literacy scale. In Proceedings of the 2007 ASEE Annual Conference and Exposition, Honolulu, HI, USA, 24–27 June 2007.
- Shamshayooadeh, G. Cultural Literacy in the New Millennium: Revisiting E.D. Hirsch. Int. J. Humanit. Soc. Sci. 2011, 1, 273–277. [Google Scholar]
- Oliver, B. Why Energy Literacy Must be a National Priority. Policy Mag. 2013, 1, 51–52. [Google Scholar]
- Brewer, R.S.; Lee, G.E.; Johnson, P.M. The Kukui Cup: A Dorm Energy Competition Focused on Sustainable Behavior Change and Energy Literacy. In Proceedings of the 44th Hawaii International Conference on System Sciences (HICSS), Kauai, HI, USA, 4–7 January 2011; pp. 1–10.
- Dewaters, J.E.; Powers, S.E. Energy literacy among middle and high school youth. In Proceedings of the 38th ASEE/IEEEE Frontiers in Education Conference, Saratoga Springs, NY, USA, 22–25 October 2008.
- U.S. Department of Energy. Energy Literacy Essential Principles and Fundamental Concepts. 2013. Available online: http://www1.eere.energy.gov/education/pdfs/energy_literacy_1_0_high_res.pdf (accessed on 23 October 2015). [Google Scholar]
- Chen, K.-L.; Huang, S.-H.; Liu, S.-Y. Devising a Framework for Energy Education in Taiwan Using the Analytic Hierarchy Process. Energy Policy 2013, 55, 396–403. [Google Scholar] [CrossRef]
- Bodzin, A.M.; Fu, Q.; Peffer, T.E.; Kulo, V. Developing Energy Literacy in US Middle-Level Students Using the Geospatial Curriculum Approach. Int. J. Sci. Educ. 2013, 35, 1561–1589. [Google Scholar] [CrossRef]
- Chen, S.-J.; Chou, Y.-C.; Yen, H.-Y.; Chao, Y.-L. Investigating and Structural Modeling Energy Literacy of High School Students in Taiwan. Energy Effic. 2015, 8, 791–808. [Google Scholar] [CrossRef]
- Winter, I. Energy Concepts in Primary Education. In Energy Resources in Science Education; Pergamon Press: Oxford, UK, 1987; pp. 35–37. [Google Scholar]
- Pecen, R.R.; Humston, J.L.; Yildiz, F. Promoting STEM to young students by renewable energy applications. J. STEM Educ. 2012, 13, 62–73. [Google Scholar]
- Novak, J.D. Learning Science and the Science of Learning. Stud. Sci. Educ. 1988, 15, 77–101. [Google Scholar] [CrossRef]
- Carey, S. Conceptual Change in Childhood; MIT Press: Cambridge, MA, USA, 1985. [Google Scholar]
- Roth, K.J. Developing meaningful conceptual understanding in science. In Dimensions of Thinking and Cognitive Instruction; Jones, B.F., Idol, L., Eds.; Erlbaum: Hillsdale, NJ, USA, 1990; pp. 139–175. [Google Scholar]
- Hancock, C.H. An Evaluation of Certain Popular Science Misconceptions. Sci. Educ. 1940, 24, 208–213. [Google Scholar] [CrossRef]
- Martin, R.; Sexton, C.; Gerlovich, J. Teaching Science for all Children: Methods for Constructing Understanding; Allyn & Bacon: Boston, MA, USA, 2002. [Google Scholar]
- Sudol, L.; Jaspan, C. Analyzing the Strength of Undergraduate Misconceptions about Software Engineering. In Proceedings of the Sixth International Workshop on Computing Education Research, Aarhus, Denmark, 9–10 August 2010; pp. 31–40.
- Eggen, P.; Kauchak, D. Educational Psychology: Windows, Classrooms; Pearson Prentice Hall: Upper Saddle River, NJ, USA, 2004. [Google Scholar]
- Rule, A.C. Elementary Students’ Ideas Concerning Fossil Fuel Energy. J. Geosci. Educ. 2005, 53, 309–318. [Google Scholar] [CrossRef]
- Committee on Undergraduate Science Education; National Research Council. Science Teaching Reconsidered: A Handbook; National Academy Press: Washington, DC, USA, 1997. [Google Scholar]
- Thompson, F.; Logue, S. An Exploration of Common Student Misconceptions in Science. Int. Educ. J. 2006, 7, 553–559. [Google Scholar]
- Yasri, P. Views of the Relationship between Science and Religion and Their Implications for Student Learning of Evolutionary Biology. Ph.D. Thesis, University of Glasgow, Scotland, UK, 2014. [Google Scholar]
- Chen, S.Y. A Meta-Analysis of Misconceptions on Natural Sciences of Students in Taiwan. Master’s Thesis, National Taitung College, Taitung County, Taiwan, 2002. [Google Scholar]
- Ho, J.C. Children’s Misconceptions on Natural Geography: Take Primary Student in Taitung as an Example. Acad. Newsl. Formal Educ. 2007, 19, 277–311. [Google Scholar]
- Huang, J.Y. The Study on Energy Literacy and Energy Misconception of Junior High School Students in Taiwan. Master’s Thesis, National Taiwan Normal University, Taipei, Taiwan, 2014. [Google Scholar]
- Smith, M. Current Status of Research in Teaching and Learning Evolution: II. Pedagogical Issues. Sci. Educ. 2010, 19, 539–571. [Google Scholar] [CrossRef]
- Mazur, E. Conceptests; Prentice-Hall: Englewood Cliffs, NJ, USA, 1996. [Google Scholar]
- Esiobu, G.O.; Soyibo, K. Effects of Concept and Vee Mapping under Three Learning Modes on Students’ Cognitive Achievement in Ecology and Genetics. J. Res. Sci. Teach. 1995, 32, 971–995. [Google Scholar] [CrossRef]
- Kurt, H. Determining Biology Teacher Candidates’ Conceptual Structures about Energy and Attitudes towards Energy. J. Balt. Sci. Educ. 2013, 12, 399–423. [Google Scholar]
- Azevedo, R.; Witherspoon, A.; Graesser, A.; McNamara, D.; Rus, V.; Cai, Z.; Lintean, M.; Siler, E. MetaTutor: An Adaptive Hypermedia System for Training and Fostering Self-Regulated Learning about Complex Science Topics. In Proceedings of the Meeting of Society for Computers in Psychology, Chicago, IL, USA, 13 November 2008.
- Bethard, S.; Okoye, I.; Sultan, M.A.; Hang, H.; Martin, J.H.; Sumner, T. Identifying Science Concepts and Student Misconceptions in an Interactive Essay Writing Tutor. In Proceedings of the 7th Workshop on the Innovative Use of NLP for Building Educational Applications, Montreal, QC, Canada, 3–8 June 2012; pp. 12–21.
- Dagan, I.; Glickman, O.; Magnini, B. The PASCAL Recognizing Textual Entailment Challenge. In Machine Learning Challenges. Evaluating Predictive Uncertainty, Visual Object Classification, and Recognising Tectual Entailment; Quiñonero-Candela, J., Dagan, I., Magnini, B., d’Alché-Buc, F., Eds.; Springer: Berlin/Heidelberg, Germany, 2006; pp. 177–190. [Google Scholar]
- Barke, H.D.; Hazari, A.; Yitbarek, S. Students’ Misconceptions and How to Overcome Them. In Misconceptions in Chemistry; Springer: Berlin/Heidelberg, Germany, 2009; pp. 21–35. [Google Scholar]
- Research Foundation of the State University of New York. Solar Education for NY, Energy Misconceptions. In The Teacher Information of School Power Naturally; The State University of New York: Albany, NY, USA, 2016. [Google Scholar]
- Lee, C.K. A Conceptual Change Model for Teaching Heat Energy, Heat Transfer and Insulation. Sci. Educ. Int. 2014, 25, 417–437. [Google Scholar]
- Lee, R.P. Analysis of Psychological Determinants and Factors Influencing Energy Evaluations and Preferences: Implications for Managing the Human Dimension of Energy System. Dissertation’s Thesis, TU Bergakademie Freiberg, Freiberg, Germany, 2015. [Google Scholar]
- Engström, S.; Gustafsson, P.; Niedderer, H. Content for Teaching Sustainable Energy Systems in Physics at Upper Secondary School. Int. J. Sci. Math. Educ. 2011, 9, 1281–1304. [Google Scholar] [CrossRef]
- Tatar, E.; Oktay, M. Students’ Misunderstandings about the Energy Conservation Principle: A General View to Studies in Literature. Int. J. Environ. Sci. Educ. 2007, 2, 79–86. [Google Scholar]
- Environmental Protection Administration Taiwan. Greenhouse Gas Emission Statistics. 2015. Available online: http://www.epa.gov.tw/ct.asp?xItem=10052&ctNode=31352&mp=epa (accessed on 30 November 2016). [Google Scholar]
- Gifford, R.; Comeau, L.A. Message Framing Influences Perceived Climate Change Competence, Engagement, and Behavioral Intentions. Glob. Environ. Chang. 2011, 21, 1301–1307. [Google Scholar] [CrossRef]
- Shan, Y.F. Analysis of Misconceptions about Global Warming and the Causes of Elementary Students and Teachers in Taiwan. Master’s Thesis, National Taiwan Normal University, Taipei, Taiwan, 2010. [Google Scholar]


| Component 1: energy knowledge | |
| Sub-component 1-1: basic concepts about energy Definition: can understand the basic scientific knowledge, rules and theories, and process of energy transfer or transformation | |
| Indicators | number of goals |
| 1-1-1: basic knowledge about energy | 3 |
| 1-1-2: basic laws about energy | 3 |
| 1-1-3: energy transfer and transformation | 4 |
| Sub-component 1-2: system concepts about knowledge Definition: can understand the influences of energy flows, and the roles energy plays in ecosystems | |
| 1-2-1: understand the influence of energy flows | 5 |
| 1-2-2: understand how important energy is for ecosystems | 3 |
| Component 2: energy and life | |
| Sub-component 2-1: development and use of energy Definition: can understand the general situations for the development and depletion of energy, the processes of development and use of energy, and the corresponding environmental impacts | |
| 2-1-1: understand knowledge related to energy consumption and depletion | 4 |
| 2-1-2: understand the importance of energy development | 4 |
| 2-1-3: understand the impacts of energy development and use on the environment | 3 |
| Sub-component 2-2: decision-making about energy Definition: can understand that the decision-making process about energy contains a series of complex and multi-level assessments based on their knowledge of energy infrastructure | |
| 2-2-1: understand energy infrastructure | 3 |
| 2-2-2: understand that personal quality of life and society as a whole may be influenced by the selection of energy sources | 5 |
| 2-2-3: understand that energy-related decision-making processes have multiple levels and are complex | 5 |
| Sub-component 2-3: energy issues and worldview Definition: can understand how energy issues influence human life | |
| 2-3-1: understand issues about energy development | 4 |
| 2-3-2: understand the big issues originating from energy development | 7 |
| Component 3: citizen responsibility and action | |
| Sub-component 3-1: personal awareness and individual actions Definition: understand the impacts of personal awareness and actions upon energy selection on lives, the environment, and the economy; and are willing to take energy-saving actions in their daily lives | |
| 3-1-1: aware of the impacts of personal energy selection on lives, the environment, and the economy | 3 |
| 3-1-2: carry out energy-saving actions in daily life | 4 |
| Sub-component 3-2: citizen participation Definition: understand the impacts of development and use of energy on lives, the environment, and the economy; understand their own responsibility as a global citizen and are willing to take more aggressive energy-saving actions | |
| 3-2-1: participate in decision-making and actions about energy conservation | 5 |
| 3-2-2: actively encourage others to take useful action towards energy conservation | 4 |
| 3-2-3: practice green consumption | 3 |
| Survey Questions | Interview Questions |
|---|---|
| 4. Solar radiation is uniformly distributed on Earth. 10. The major driving force of the weather systems on Earth is geothermal energy. | Do you know the difference between weather and climate? What causes the current status of the weather and climate? |
| 13. The calories in rice were transferred from the sunlight via photosynthesis. | What do you think the importance of the Sun is for Earth, human beings, and other living things? How do living organisms utilize the energy from the sun? |
| 11. The GHG gases in the atmosphere catch the solar radiation from outer space and bring about the Greenhouse Effect. 12. As long as human beings stop emitting GHG gases, climate change and global warming will be mitigated right away. | Can you explain what causes the Greenhouse Effect? Can you give the names of two GHG gases? Where did you get this information? |
| 5. Coal, petroleum, and natural gas are called “petroleum–chemical fuels”. | Have you ever heard of “fossil fuels”? Where did you hear about them? Please explain the meaning of fossil fuels. Can you identify the differences between “petroleum–chemical fuels” and “fossil fuels”? |
| 6. Burning of gasoline is a process of releasing the stored energy of ancient biology. | How did fossil fuels form? Could you explain where the energy of fossil fuels comes from? |
| 16. The high-level nuclear waste of Taiwan is stored on Lanyu Island. | Do you know how a nuclear power plant generates electricity? Have you heard of high-level and low-level nuclear waste? From where did you learn about them? Also explain the differences between them. |
| 14. Taiwan is abundant in energy sources that supply over one-half of the domestic demand. | Do you think energy sources in Taiwan are adequate? What are the major sources of the energy used in Taiwan? How did you know this? |
| 2. Which of the following numbers is closest to the percentage of renewable energy in Taiwan? | Which among thermal power, nuclear power, and renewables is the major source of electricity? Whose cost is the highest? |
| 3. The electricity consumption of some industrial park is 50,000 kW. Is this a correct statement? | Have you heard of “kW”, “kW-hr”, “degree of electricity” 1? What are the differences among them? |
| 19. Biofuel made of corn is a kind of clean fuel developed and recommended by countries around the world. | How do you think corn-made biofuel can help the future world? Any drawbacks? How do you know this information? |
| Information Source | Yes | No |
|---|---|---|
| School course | 854 | 377 |
| 69.4% | 30.6% | |
| Books | 572 | 659 |
| 46.5% | 53.5% | |
| TV | 995 | 236 |
| 80.8% | 19.2% | |
| Internet | 893 | 338 |
| 72.5% | 27.5% | |
| Newspapers/magazines | 526 | 705 |
| 42.7% | 57.3% | |
| Other | 45 | 1186 |
| 3.7% | 96.3% |
| Question | The Percentage of Correct Answers |
|---|---|
| 5. Coal, petroleum, and natural gas are collectively called “petroleum–chemical fuels”. | 16.7% |
| 2. The share of electricity generated by solar energy sources is closest to (1) 5% (2) 10% (3) 35%, or (4) 60%. | 26.2% |
| 7. LPG stored in steel tanks is gas with high pressure that can be released to be used by customers. | 27.6% |
| 19. Biofuel made of corn is a kind of clean fuel developed and recommended by countries around the world. | 33.7% |
| 16. The high-level nuclear waste of Taiwan is stored on Lanyu Island. | 34.8% |
| 9. The efficiency of the PV modules sold in public markets is as high as 40%. | 36.5% |
| 1. Which of the following is NOT a major petroleum output country? (1) Saudi Arabia (2) Russia (3) Germany, or (4) Mexico. | 40.0% |
| Education | Sample Size | Mean/% Score | F Value | Significance (p) | Post-Hoc Analysis (Scheffe) |
|---|---|---|---|---|---|
| Ph.D./master | 152 | 11.15/58.7 | 23.33 | *** 0.000 | Ph.D./master > Senior and junior high school College/junior college > Senior and junior high school |
| College/junior college | 470 | 10.53/55.4 | |||
| Senior and junior high school | 545 | 9.47/49.8 | |||
| Elementary school and below | 9 | 9.78/51.5 | |||
| Other | 55 | 9.35/49.2 | |||
| Total score | 1231 | 10.1/53.2 |
| Question | Percentage (%) 1 | ||||
|---|---|---|---|---|---|
| Agree + | Agree | Neutral | Do Not Agree | Do Not Agree − | |
| A2. Renewable energy sources need to be developed, although they are relatively expensive. | 27.7 | 32.2 | 31.7 | 6.5 | 1.8 |
| A4. For attracting more investment from outside and facilitating economic growth, the price of gasoline used by industries should not increase. | 20.8 | 18.3 | 44.6 | 11.4 | 4.8 |
| A9. I think the best way to solve the problem of electricity shortage is building more power plants. | 11.1 | 26.1 | 41.4 | 12.9 | 8.4 |
| A11. I am willing to reduce my use of air conditioning for energy conservation. | 37.2 | 32.2 | 24.2 | 4.1 | 2.1 |
| A12. I am willing to take public transportation to reduce carbon emissions and combat climate change. | 44.2 | 32.8 | 19.8 | 2.6 | 0.4 |
| A14. I am willing to tolerate the inconveniences brought about by energy conservation. | 20.9 | 30.5 | 37.4 | 7.2 | 3.8 |
| Component | Component 1: Energy Knowledge | Component 2: Energy and Life | Component 3: Citizen Responsibility and Action | |
|---|---|---|---|---|
| Component 1: energy knowledge | Pearson r | / | 0.171 ** | −0.036 |
| significance | / | 0.000 | 0.204 | |
| Component 2: energy and life | Pearson r | 0.171 ** | / | 0.166 ** |
| significance | 0.000 | / | 0.000 | |
| Component 3: citizen responsibility and action | Pearson r | −0.036 | 0.166 ** | / |
| significance | 0.204 | 0.000 | / | |
| Question # | # of the Interviewed Student 1 | Mean 2 | μ 3 | |||||||||
|---|---|---|---|---|---|---|---|---|---|---|---|---|
| 1 | 2 | 3 | 4 | 5 | 6 | 7 | 8 | 9 | 10 | |||
| 4 | 1 | 1 | 1 | 0 | 0 | 1 | 1 | 0 | 1 | 1 | 0.700 | 0.604 |
| 10 | 1 | 1 | 1 | 0 | 1 | 1 | 0 | 1 | 0 | 1 | 0.700 | 0.569 |
| 13 | 1 | 1 | 0 | 1 | 1 | 1 | 0 | 1 | 0 | 1 | 0.700 | 0.695 |
| 11 | 0 | 0 | 0 | 0 | 1 | 0 | 0 | 1 | 0 | 0 | 0.200 | 0.429 |
| 12 | 1 | 1 | 0 | 1 | 0 | 0 | 0 | 1 | 1 | 1 | 0.600 | 0.774 |
| 5 | 0 | 0 | 0 | 0 | 1 | 1 | 0 | 0 | 0 | 1 | 0.300 | 0.167 |
| 6 | 0 | 1 | 1 | 1 | 0 | 1 | 1 | 0 | 0 | 1 | 0.600 | 0.646 |
| 16 | 1 | 1 | 0 | 1 | 0 | 0 | 1 | 1 | 1 | 0 | 0.600 | 0.348 |
| 14 | 1 | 1 | 1 | 0 | 1 | 1 | 0 | 1 | 0 | 1 | 0.700 | 0.643 |
| 2 | 0 | 1 | 1 | 0 | 0 | 1 | 0 | 0 | 0 | 1 | 0.400 | 0.262 |
| 19 | 0 | 1 | 1 | 0 | 0 | 0 | 0 | 0 | 1 | 1 | 0.400 | 0.337 |
| 3 | 0 | 1 | 0 | 0 | 0 | 0 | 0 | 1 | 1 | 0 | 0.300 | 0.570 |
| Total Score | 6 | 10 | 6 | 4 | 5 | 7 | 3 | 7 | 5 | 9 | ||
| Question | The Percentage of Incorrect Answers |
|---|---|
| 4. Energy of solar radiation is uniformly distributed on Earth | 39.6% |
| 10. The major driving force of the weather systems on the Earth’s surface is geothermal energy. | 43.1% |
| Question | The Percentage of Incorrect Answers |
|---|---|
| 5. Coal, petroleum, and natural gas are together called “petroleum–chemical fuels”. | 83.3% |
| 6. Burning petroleum is a process of releasing the energy stored in the debris of ancient organisms. | 35.4% |
| Pattern of Misconception | Deficiency/Problem | Potential Treatment Strategies |
|---|---|---|
| intuitive judgement |
|
|
| lack of knowledge |
|
|
| mistakes from experience |
|
|
| misleading from teaching |
|
|
| logical fallacy |
|
|
| vernacular error |
|
|
© 2017 by the authors. Licensee MDPI, Basel, Switzerland. This article is an open access article distributed under the terms and conditions of the Creative Commons Attribution (CC BY) license ( http://creativecommons.org/licenses/by/4.0/).
Share and Cite
Yeh, S.-C.; Huang, J.-Y.; Yu, H.-C. Analysis of Energy Literacy and Misconceptions of Junior High Students in Taiwan. Sustainability 2017, 9, 423. https://doi.org/10.3390/su9030423
Yeh S-C, Huang J-Y, Yu H-C. Analysis of Energy Literacy and Misconceptions of Junior High Students in Taiwan. Sustainability. 2017; 9(3):423. https://doi.org/10.3390/su9030423
Chicago/Turabian StyleYeh, Shin-Cheng, Jing-Yuan Huang, and Hui-Ching Yu. 2017. "Analysis of Energy Literacy and Misconceptions of Junior High Students in Taiwan" Sustainability 9, no. 3: 423. https://doi.org/10.3390/su9030423