Article

China’s Carbon Footprint Based on Input-Output Table Series: 1992–2020

School of Economics and Management, Beihang Univerisity, Beijing 100191, China
*
Author to whom correspondence should be addressed.
Sustainability 2017, 9(3), 387; https://doi.org/10.3390/su9030387
Submission received: 15 January 2017 / Accepted: 1 March 2017 / Published: 6 March 2017
(This article belongs to the Section Economic and Business Aspects of Sustainability)

Abstract

:
Reducing carbon emissions is a major concern for China’s future. This paper explores the embodied carbon footprint of Chinese final demand from the point of view of industries. It uses the Matrix Transformation Technique (MTT) to update the input-output table series from 1992 to 2020 in China. Then, we measure the embodied carbon emissions for the period 1992–2020 from 29 industry producers to the final demand, covering urban and rural residential consumption, government consumption, fixed capital formation, and net exports. The results show that construction, other services, wholesale, retail trade, accommodation and catering, industrial machinery and equipment, transport, storage and postal services, and manufacture of foods and tobacco are the industries with the greatest carbon emissions from producers, while fixed capital formation and urban consumption are the largest emitters from the perspective of final demand. The embodied carbon emission multipliers for most of the industries are decreasing, while the total carbon emissions are increasing each year. The ratio of emissions from residential consumption in terms of total emissions is decreasing. Each industry has a different main final demand-driven influencing factor on emission and, for each type of final demand, there are different industries with higher emissions.

1. Introduction

The U.S.-China Joint Announcement on Climate Change on 12 November 2014 says China hopes to reach its carbon emission peak no later than 2030. The Paris Agreement under the United Nations Framework Convention on climate change on 12 December 2015 suggests that countries should reach a global peak of greenhouse gas emissions as soon as possible for developing countries. China should realize its emission reduction target as soon as possible according to the agreement. Thus, we should present an inventory of the carbon footprint of the Chinese economy. The paper will measure the carbon emissions from industries from 1992 to 2020 in China and relate the responsibility of these emissions from producers to consumers by means of input-output analysis. At the same time, China is actively exploring the economic restructuring promoted by domestic demand, which includes rural consumption, urban consumption, government consumption, fixed capital formation, and so on. Thus, the paper will also examine the impacts of final demand on carbon emissions to help improve the decision-making process on the reduction of emissions in China.
There are two methods to measure the carbon footprint. One is the life cycle assessment technique, which is a life cycle approach about a product carbon footprint [1,2]. The other is the input-output analysis tool. This approach uses the input-output tables to track carbon emissions from industry sources through the production system to kinds of final demand. Therefore, this method is also a life-cycle approach to measure carbon emissions embodied in the goods and services consumed by a nation’s population. However, emissions are calculated from the industries in this method. The carbon footprint based on the input-output model is a popular tool to analyze the impact of household consumption on emissions [3,4,5,6,7,8,9]. The advantages of this approach are reviewed by Giljum and Hubacek [10], Wood and Dey [11]. Therefore, several studies examine the determinants of the environmental effects of household consumption [12,13,14,15,16,17,18,19,20]. On the meanwhile, some studies use this model to examine the direct and indirect carbon emissions by household consumption in China [21,22,23,24] and in Beijing [25]. The studies above are mostly based on the input-output tables for some given years to study carbon emissions caused by residential consumption without calculating year by year. Zhang et al. [26] updated the input-output tables to obtain the time series input-output tables from 2002 to 2011 in China, and use the input-output method to make a contrastive analysis of changes in carbon emissions caused by Chinese rural and urban residents’ consumption. However, this research does not update these table series after 2011. Secondly, the research talks about the carbon emissions caused by Chinese urban and rural residential consumption, but lacks a deep understanding on the final demand structure and dynamic characteristics of carbon emissions. It does not discuss the carbon emissions caused by government consumption and fixed capital formation. However, the impacts of government consumption and investment on carbon emissions also need to be considered, especially in developing countries like China.
On the other hand, several studies examine the environmental impacts associated with capital formation [27,28,29,30,31]. They indicate that the production of capital goods does cause high environmental impacts and environmental impacts from fixed capital formation level off as economies mature. Especially as for China, energy use associated with fixed capital formation was much larger than for aggregated household consumption [32,33]. This paper will discuss carbon emission associated with fixed capital formation.
Therefore, the main aim of this work is to provide an overview of the direct and indirect carbon footprint of Chinese final demand according to the input-output analysis. The specific objectives are as follows: Firstly, we update the Chinese input-output table series for the period of 1992–2020 by using the matrix transformation technique (MTT) [34]. Secondly, we calculate the embodied carbon emissions year by year for the period of 1992–2020 from 29 industry producers to final demand, covering urban and rural residential consumption, government consumption, fixed capital formation, and net export in accordance with the time series input-output tables. Finally, we analyze the Chinese carbon footprint from the three aspects: (1) carbon emissions and their structures in 2016 from producers to consumers; (2) dynamic characteristics of carbon emission multipliers from 1992 to 2020; and (3) the structure and dynamic characteristics of carbon emissions produced by Chinese final demand from the perspective of industries for the year 1992–2020.
The paper is organized as follows: We briefly outline the method of measuring embodied carbon emission according to the input-output table and describes how to update the input-output table series according to the MTT in Section 2; Section 3 measures the embodied carbon emissions year by year from 1992 to 2020 from 29 industry producers to final demand in China; an examination of the carbon footprint in China is presented in Section 4 before conclusions are drawn in Section 5.

2. Methodology

2.1. The Methodology of Calculating Emissions

The methodology of calculating emissions is outlined as follows [11]:
Direct emissions from all industrial sources are denoted Q i n d . Its elements { Q j i n d } j = 1 , , n can be calculated as follows:
Q j i n d = i M i j C i K i
where Q j i n d is the direct emission (ton) from industry sector j . M i j represents the sector j ’s consumption (ton or m3) of the i th kind of fuel. C i is the net calorific value (NCV) (ton C/ton or ton C/m3) of fuel i . K i is the carbon emission factor of fuel i .
The direct emissions intensity is then calculated to describe emissions by industry sector per value of economic output of each industry sector as follows:
q i n d = Q i n d x 1
where q i n d is the vector of direct emissions intensity (ton/10,000 yuan). Its elements { q j i n d } j = 1 , , n describe emissions by industry j per yuan of total output x of industry sector j . q i n d represents only emissions produced directly in each industry, but not in upstream supplying industries.
Total embodied emissions are then defined as all carbon emissions emitted in the production of a particular good or service. They are the full life-cycle emissions for the entire production chain and are referenced by the functional unit of final demand for the good or service. This measurement method about total embodied emissions is consistent with Life Cycle Assessment (LCA) technique. Gross output of an industry equals to the intermediate inputs of the whole industries, which cover raw material industries, energy industries, and the capital input and labor input into this industry according to the principle of the input-output table. Therefore, total embodied emission from an industry includes the emission of the whole inputs and is calculated based on the basic input–output relationship as follows.
Q e m b = q i n d ( I A ) 1 y
where y is a diagonalized matrix of the vector of final demand, A is the direct consumption coefficient matrix of the input-output table and I is the n × n identity matrix. ( I A ) 1 is the Leontief inverse matrix. In this equation, q i n d ( I A ) 1 represents the total embodied emission multiplier, which shows total life-cycle emissions associated with each yuan of final demand.

2.2. Updating Input-Ouput Table Series

Due to the fact that enormous financial costs and human efforts are required to compile input-output tables, benchmark IO tables are only published every five years by the National Bureau of Statistics of China. Additionally, they are often not harmonized over time. In order to investigate dynamic characteristics of China’s carbon footprint and forecast future trends, we need the harmonized time series input-output tables from the past to the future. Zheng et al. [35] have updated China’s input-output (IO) tables from 1992 to 2020. These IO table series are updated by MTT [34], rather than the Biproportional Scaling Method (RAS), which is most commonly applied for forecasting IO tables. The idea of MTT is to forecast the elements in the input-output matrix one by one. Considering that there are several constraints in the input-output matrix which must always be satisfied in the forecasted IO matrix, the progress of MTT can be described in the following steps:
(1)
Transform the benchmark IO matrix into an unconstrained matrix in which the elements can be freely forecasted. We divide the IO matrix into four quadrants. The first quadrant is the intermediate input and output part, the second quadrant is the final demand part, the third quadrant is the value added part and the fourth quadrant is GDP. Then the unconstrained matrix also can be divided into four quadrants. This unconstrained matrix is actually a coefficient matrix. The elements in the first quadrant of this matrix represent the proportion of the monetary value of the transactions between a pair of sectors (from Sector i to Sector j) to the total final demand of Sector i. Moreover, the elements in the third quadrant represent the ratio of each sector’s value added to the last sector’s value added;
(2)
Establish the Autoregressive Integrated Moving Average (ARIMA) model for each element (the coefficient) in the unconstrained matrix to forecast the corresponding element in the target years’ unconstrained matrix;
(3)
Back-transform the unconstrained matrix into the input-output matrix of target years by inverse computation. The back-transformation process involves three steps. First, since the sum of all sectors’ value added is equal to GDP, the first step is to use the target year’s GDP data and the third quadrant of unconstrained matrix to compute each sector’s value added. The forecast of GDP is based on China’s 13th Five Year Plan and Bai et al. [36] which use the sum of labor production growth rate and population growth rate as the GDP growth rate. Second, use the value added data of each sector and unconstrained matrix to calculate the final demand of each sector. Third, use the final demand data and unconstrained matrix to calculate every element in the IO matrix. The specific process can refer to Zheng et al. [35] and Wang et al. [34]. The prominent advantage of MTT is that it takes into account that the transaction coefficients are changing over time while almost all of the existing methods, including the RAS method, rely heavily on the assumption that they will not dramatically change [34].
This paper will subsequently calculate the direct carbon emission intensities, embodied carbon emission multipliers, and total embodied emissions of China’s 29 industries with the updated input-output table series from 1992 to 2020.

3. Measurement of Embodied Carbon Emission

In addition to the input-output table series of China, two other main data sources have been used in this study. One are the China Energy Statistical Yearbooks from 2007 to 2014 [37,38,39,40,41,42,43,44], which provide various types of energy consumption by sectors. The energy consumption data of industrial sectors are derived from tables titled Final Energy Consumption by Industrial Sector (Physical Quantity) and that of agriculture, construction, and service sectors are derived from tables titled Consumption of Total Energy and its Main Varieties by Sector. The other is the IPCC Fifth Assessment Report and Guidelines for China’s Provincial Greenhouse Gas Inventories [45] from which we can obtain net calorific values and carbon emission factors of each type of energy. It should be noted that the classification of industries in the input-output table series Zheng et al. updated is different from that of the China Energy Statistical Yearbooks, so we set 29 industries by considering the adjustment in the “National Industry Classification” (GB/T4754-2011).
With all of these data, we calculated the industry sector embodied carbon emissions of China from 1992 to 2020 by means of input-output analysis. The process can be described as follows:
Step 1:
calculate the direct carbon emissions of 29 industries with Equation (1).
Step 2:
compute the direct carbon emissions intensity of 1992–2014 with Equation (2). When it comes to year 2015 and later, we do not have access to acquire energy consumption data, and the National Bureau of statistics did not publish the input-output table data after 2012. This is also the reason why the current studies on China’s carbon footprint are still in place before 2014. However, how China’s carbon footprint will change in the future (after 2015) under the current energy consumption structure is a more important point we should focus on. In order to calculate the total embodied carbon emissions and multipliers after 2014, we only need to obtain the direct carbon emission intensities of 2015–2020 since the input-output table series updated by Zheng et al. [35] contain the tables of 2013–2020. Thus, we have made an assumption here that the direct carbon emission intensities of 2015–2020 will remain the same as that of 2014.
Step 3:
measure the 29 industries’ embodied carbon emission multipliers and total embodied carbon emissions of 29 sectors from 1992 to 2020 with Equation (3).

4. Results and Discussion

4.1. Emissions in 2016

In 2016, overall embodied carbon emissions of final goods and services which include imports, but exclude exports, are 7251.9 million tons and the emissions are shown by sector in Figure 1. Construction and manufacturing both contribute 28% of the total emissions, which are more than any other sectors. Other services, which include information transfer, software, and information technology services; finance; real estate; leasing and commercial services; research and experimental development; integrated technology service; geological prospecting, administration of water, environment, and public facilities; resident services and other services; education; health care, social insurance and social welfare; culture, sports, and entertainment; public administration and social organizations emit 27% of the total emissions, which is also relatively high.
Most of these sectors that contribute significantly to carbon emissions also contribute significantly to the economic well-being of China. The country has to make a balance between economics and environment since a lower carbon society and maintaining a growing economy are both goals to achieve. To investigate the social and economic contributions, we calculate value added to measure each sector’s GDP and compare the relative contribution of each sector to overall GDP in China in 2016 (Figure 2). As we expected, manufacturing and other services contribute 29% and 32% to the overall GDP, respectively. However, construction contributes only 7% to GDP, whilst producing 28% of China’s emissions. In contrast, wholesale, retail trades, accommodation and catering contribute 12% to GDP, while producing only 6% of China’s emissions. This is not difficult to understand since China is a country with large-scale construction. Over one-tenth of all the new buildings around the world every year come from China. In addition, the reconstruction rate of China’s construction industry is relatively high and the quality of construction is poor. Another important reason for the high embodied emissions of construction is that large quantities of raw materials (such as cement) with high carbon emissions are used in construction. Although the Chinese government has been trying to encourage transformation of the construction industry, most of the green buildings still appear as public buildings or at key areas and the applications of green technology in construction are still inadequate.
The production of carbon emissions is not driven solely by the consumption of residents in China. In addition to current consumption, emissions are also embodied in exports for foreign consumers, plus emissions are embodied in purchases for common goods (government consumption), and in goods and services flowing into fixed capital formation. These categories of final demand (including rural residential consumption, urban residential consumption, government consumption, fixed capital formation, and net exports) are disaggregated in Figure 3. We can see that carbon emissions embodied in goods and services flowing into fixed capital formations are the main source of China’s total embodied carbon emissions, and next is urban residential consumption. Within fixed capital formation, construction and manufacturing almost contribute 90% of the emissions.

4.2. Carbon Emission Multipliers from 1992 to 2020

The carbon emission multiplier of an industry shows the total life-cycle emissions associated with unit final demand. It is different from direct emission intensity, which shows only direct emission per production value. By the multipliers of final demand we can determine the industries with the highest emissions in China and tell consumers that they should reduce consumption from higher-multiplier industries in order to cut down carbon emissions. We have calculated the carbon emission multipliers of 29 industries from 1992 to 2020 by employing the method described in Section 2 (see Table 1).
Several conclusions can be made from Table 1. Firstly, we have exhibited the direct carbon intensities of 2014 to compare them with the carbon emission multipliers. The carbon emission multipliers are much higher than the direct carbon emission intensities for all industries. Thus, we should use multipliers instead of intensities as the measurement to help making low-carbon development policies because multipliers take into account the full life-cycle emissions for the entire production chain. Secondly, almost all industries’ multipliers are gradually declining over time which prove China’s low-carbon development policy in the past two decades worked efficiently. However, the multiplier ranking among the 29 industries almost remained the same during this period and, especially after 1997, transport, storage, and postal services, manufacture of non-metallic mineral products, processing of petroleum, coking, processing of nuclear fuel, smelting, and processing of metals, construction, and manufacture of chemical products stably rank near the top, while comprehensive use of waste resources, production and distribution of tap water, and wholesale, retail trade, accommodation, and catering keep ranking last. This phenomenon indicates that the industrial carbon emission structure of China did not significantly change over time. Thus, it is necessary to accelerate technology transition of high-carbon emission industries to improve the efficiency of energy utilization and to guide the customers to reduce their consumption of goods or services with high embodied carbon emission multipliers in order to reach the goal of a lower carbon society and sustainable development.

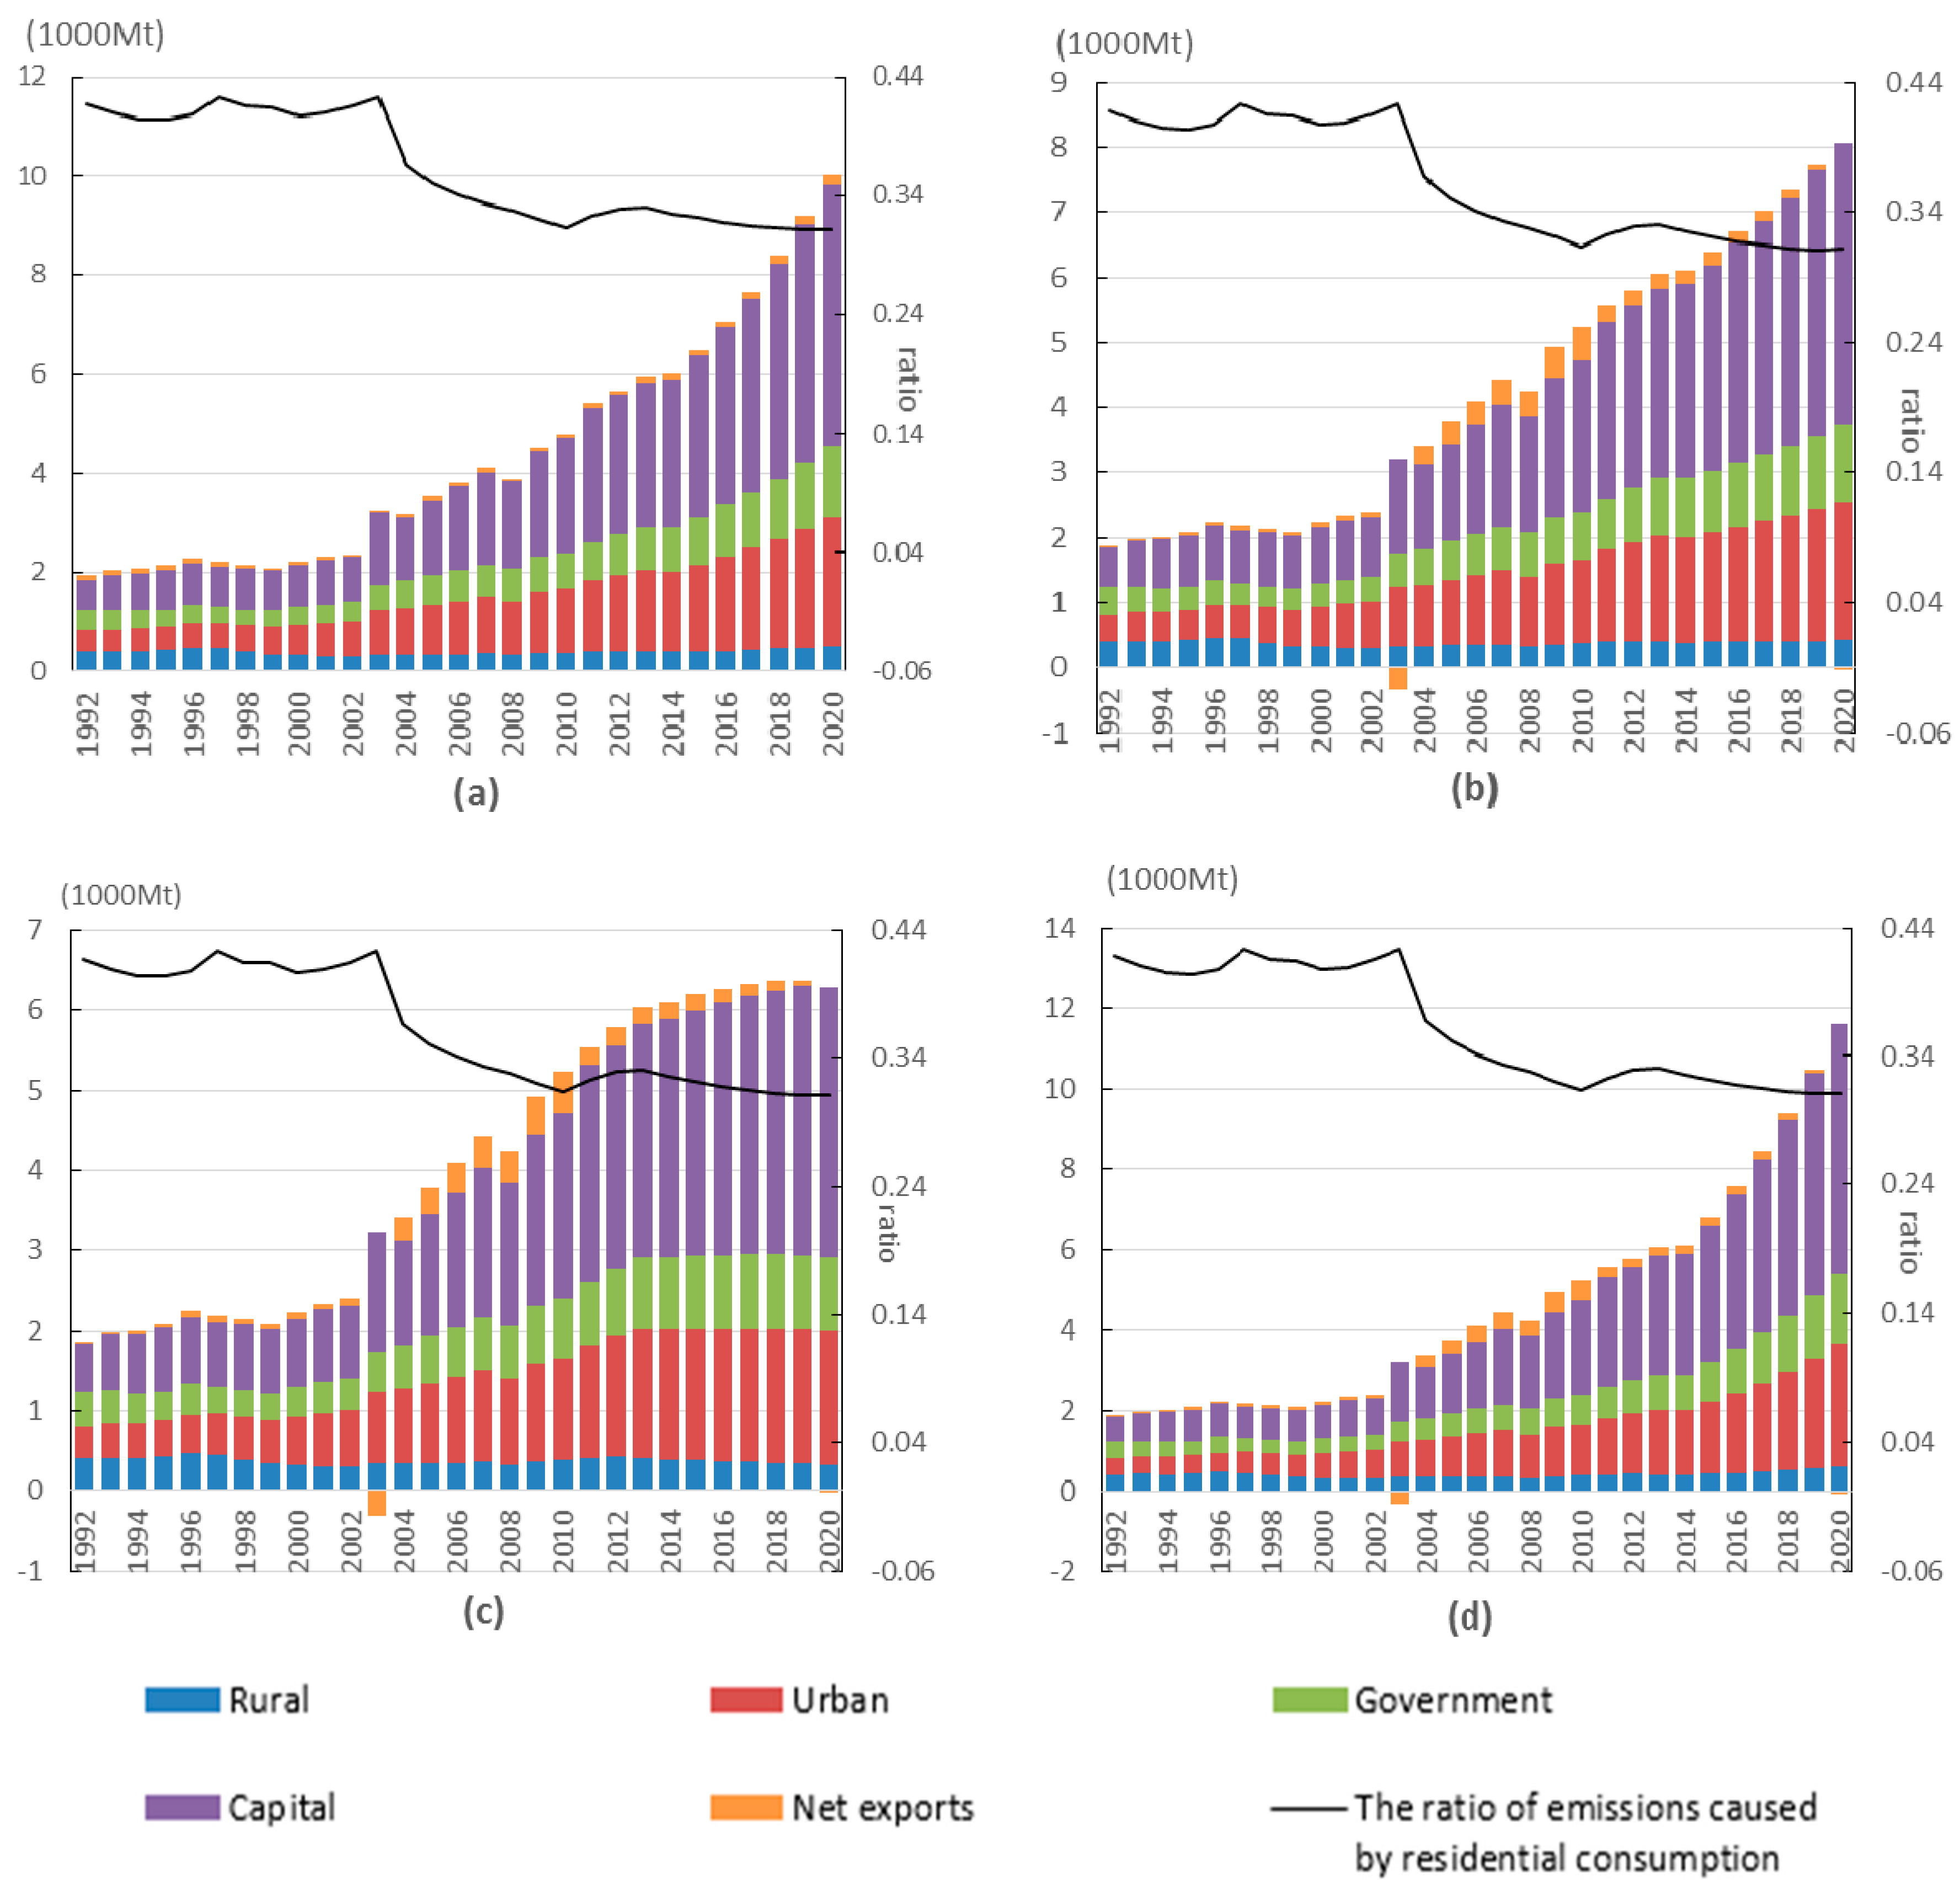
4.3. Embodied Carbon Emissions from 1992 to 2020

In this section we will analyze the embodied carbon emissions of China from four aspects. Firstly, this paper will analyze the total embodied carbon emissions from 1992 to 2020 by categories of six types of final demand in order to understand more deeply the structure and trend of China’s carbon emissions. In order to consider comprehensively, we not only calculate the embodied carbon emissions under the assumption that the direct carbon emission intensities of 2015–2020 will remain constant, but also calculate the embodied carbon emissions under three other different assumptions: the direct carbon emission intensities of 2015–2020 will decrease 3% a year, decrease 6% a year and increase 3% a year, respectively. The specific results are shown in Figure 4.
From Figure 4, we can see that there is a slight decline of the total amount of embodied carbon emissions after 2019 in Figure 4c (direct carbon emission intensities will decrease 6% a year), while in the other three figures the total amount of embodied carbon emissions of China is increasing year by year. That is to say unless China continue vigorously improves the energy consumption structure and makes the direct carbon emission intensities decrease no less than 6%, China will not reach the peak before 2020.
Figure 4 also indicates that emissions from fixed capital formation and residential consumption (especially urban residential consumption) are the main sources of carbon emissions in China and they are increasing. An additional line has been drawn in each figure to show the ratio of emissions caused by residential consumption in total national emissions and we can see it is in a downward trend but has remained above 30% over time.
Secondly, this paper determines which industries produce the largest carbon emissions and by which type of final demand these emissions are caused. In Figure 5, we chose six industries with higher emissions in 29 industries to show their total embodied carbon emissions from 1992 to 2020 by the type of final demand, respectively. These six industries are other services, construction, wholesale, retail trade, accommodation and catering, industrial machinery and equipment, transport, storage, and postal services, and foods and tobacco.
We can see that each industry’s total embodied carbon emissions are increasing by year and will not reach the peak before 2020. However, each industry has a different main influencing factor on emissions. For example, the main factors of other services are government consumption and urban residential consumption. The one of construction and manufacture of general and special purpose machinery is fixed capital formation. Especially, urban residential consumption is the increasing main factor on emission for many industries, while the gap between carbon emission caused by urban and rural residents’ consumption is wider and wider. This conclusion is similar to other studies, such as Zhu et al. [21], Zhang [22], Liu et al. [23], Fan et al. [24], and Zhang et al. [26] Otherwise, overseas demand is also a main factor on emission for the export-oriented industries, whereas net import industries have a negative impact on emission of these industries. Therefore, it can be concluded here that adjusting the final demand structure is one potential way to reduce the carbon emissions in China.
Thirdly, we come to the final demand side to analyze the distribution of emissions among 29 industrial sectors caused by each type of final demand. The specific results are shown in the following four tables. For each type of final demand we chose several sectors in which the emissions are relatively high to show their proportions of the total emissions from 1992 to 2020.
We start with the analysis of carbon emissions from rural residential consumption (Table 2). From this table, we can see that agriculture, other services and manufacture of foods and tobacco, etc., are the main emission industries caused by rural residential consumption. The total emissions of these six industries take up more than 65% of the total emission of all industries and the ratio rises from 64.9% in 1992 to 80.2% in 2020. Thus, if we want to reduce the rural residents’ emissions, their consumption of these industries’ products and services should be first taken into account.
Table 3 is about the carbon emissions from urban residential consumption. Other services, manufacture of foods and tobacco, and agriculture, etc., are the main six industries that produce carbon emissions caused by urban residential consumption, which is the same as rural residential consumption. However, the difference is that the ratio of emissions produced by other services from urban residential consumption is significantly higher than that from rural residential consumption, while the ratio of emissions produced by agriculture is in the opposite situation. The total emissions of these six industries account for more than 65% of the total emissions of all industries and the ratio rises from 68.5% in 1992 to 78.7% in 2020. Thus, if we want to reduce the urban residents’ emissions, their consumption of these industries’ products and services should be first taken into account.
Table 4 is about the carbon emissions from government consumption. We can see that, after 1997, other services, transport, storage, and postal services and agriculture produce 100% of the carbon emissions caused by government’s consumption. Especially, in terms of final consumption, agriculture, transport, storage, and postal services and other services are the three main emission industries caused by every type of final consumption (rural, urban, and government). Thus, the reduction of these three sectors’ embodied carbon emissions can cut down the emissions caused by final consumptions.
From Table 5 we can see that the total embodied carbon emissions of construction, manufacture of general and special purpose machinery, manufacture of transportation equipment, manufacture of electrical machinery and equipment, and other services take up more than 90% of the total emissions caused by fixed capital formation. Thus, through the research on these industries, we can learn about the structure of the source of carbon emissions caused by fixed capital formation.
Fourthly, we focus on the forecast part and the energy structure. Figure 6 shows the final demand of 20 industries in 1992~2020 which are forecasted by Zheng et al. [35]. Figure 7 shows the embodied carbon emissions of 20 industries from 1992 to 2020 in 4 situations—(a) the direct carbon emission intensities will stay constant; (b) the direct carbon emission intensities will decrease 3% a year; (c) the direct carbon emission intensities will decrease 6% a year; (d) the direct carbon emission intensities will increase 3% a year. From Figure 6 and Figure 7 we can get two conclusions. First, the final demands of all industry are growing by years after 2015. Moreover, those industries with higher final demand also produce higher embodied carbon emissions such as wholesale retail trades accommodation and catering, manufacture of foods and tobacco, manufacture of general and special purpose machinery and manufacture of transportation equipment. So adjusting the scale of industries with high emissions is also a way to reduce the carbon emissions of China. Second, from Figure 7, we can see under different situations, industries’ emissions are in different trend after 2015. Under situation (a), (b) and (d), the emissions of all industries are increasing after 2015 and situation (d) increases the fastest while situation (b) increases the slowest. Under situation (c), many industries’ emissions begin to decrease after 2015. This tell us improving the energy structure is an effective way to slow the increasing speed of carbon emissions and if the improvement is effective enough the carbon emissions may even begin to decrease before 2020.

5. Conclusions

This paper first calculated the carbon emissions of China’s 29 industries from 1992 to 2020 by the matrix transformation method based on input-output table series. Then we analyzed the current situation of China’s carbon footprint and predicted its trend in the future.
The process of calculating carbon emissions can be delineated as follows: first, we calculate the direct carbon emission intensities of China’s 29 industries from 1992 to 2014 by the matrix transformation method with the data from the China Energy Statistical Yearbook, Guidelines of IPCC and input-output time-table series; then we assumed that the direct carbon emission intensities of 2015–2020 remained the same as that of 2014 and used the direct carbon emission intensities of 1992–2020 to calculate the embodied carbon emission multipliers of China’s 29 industries from 1992 to 2020; finally, we calculated the total embodied carbon emissions of China’s 29 industries from 1992 to 2020 and split them by the categories of final demand. Through the analysis of the results we obtain some important conclusions.
First, we found that China could not reach the carbon emission peak before 2020. Thus, we found those industries which contribute significantly to China’s total carbon emissions and in rapid growing trends. They are construction, transport, storage, and postal services, manufacture of general and special purpose machinery, and industries associated with living consumption. Second, the embodied carbon emission multipliers for most industries are decreasing, while industrial carbon emission structures of China did not significantly change over time. Third, fixed capital formation and urban residential consumption are the largest part of emissions from the point of final demand. However, the ratio of emissions from residential consumption in total emissions is decreasing. Finally, each industry has different main final-demand-driven influencing factors on emissions and, for each type of final demand, there are different industries with higher emissions.
In terms of policy relevance, we propose the following viewpoints from the emissions inventories (production perspective) and carbon footprint (final demand perspective) in accordance with our research: Firstly, the industries relative to fixed capital formation, such as construction, and manufacture of general and special purpose machinery, should cut carbon emissions because these industries are the main emission industries and fixed capital formation is the greatest part of emissions from the perspective of final demand. Secondly, we must control the carbon emissions from residents’ consumption, especially urban residents. The government should take some measures to change residents’ consumption attitudes and to encourage them to consume with low carbon in mind.

Acknowledgments

This work was financially supported by the National Natural Science Foundation of China (grant numbers 71371021, 71401192, 71420107025, 71333014) and the National High Technology Research and Development Program of China (863 Program, grant number SS2014AA012303). The first author would also like to thank the support of the Beijing Planning Program of Philosophy and Social Science (grant number 11JGC102).

Author Contributions

Haitao Zheng conceived and designed the empirical study; Qi Fang performed the empirical study; Cheng Wang and Huiwen Wang established the model; Ruoen Ren analyzed the data; Haitao Zheng, Qi Fang and Cheng Wang wrote the paper.

Conflicts of Interest

The authors declare no conflict of interest.

References

  1. Finkbeiner, M. Carbon Footprinting—Opportunities and Threats; Springer: Berlin, Germany, 2009. [Google Scholar]
  2. Weidema, B.P.; Thrane, M.; Christensen, P.; Schmidt, J.; Løkke, S. Carbon footprint. J. Ind. Ecol. 2008, 12, 3–6. [Google Scholar] [CrossRef]
  3. Weber, C.L.; Matthews, H.S. Quantifying the global and distributional aspects of American household carbon footprint. Ecol. Econ. 2008, 66, 379–391. [Google Scholar] [CrossRef]
  4. Hertwich, E.G.; Peters, G.P. Carbon footprint of nations: A global, trade-linked analysis. Environ. Sci. Technol. 2009, 43, 6414–6420. [Google Scholar] [CrossRef] [PubMed]
  5. Minx, J.C.; Wiedmann, T.; Wood, R.; Peters, G.P.; Lenzen, M.; Owen, A.; Scott, K.; Barrett, J.; Hubacek, K.; Baiocchi, G. INPUT–OUTPUT ANALYSIS AND CARBON FOOTPRINTING: AN OVERVIEW OF APPLICATIONS. Econ. Syst. Res. 2009, 21, 187–216. [Google Scholar] [CrossRef]
  6. Park, H.C.; Heo, E. The direct and indirect household energy requirements in the Republic of Korea from 1980 to 2000—An input–output analysis. Energy Policy 2007, 35, 2839–2851. [Google Scholar] [CrossRef]
  7. Cohen, C.; Lenzen, M.; Schaeffer, R. Energy requirements of households in Brazil. Energy Policy 2005, 33, 555–562. [Google Scholar] [CrossRef]
  8. Cellura, M. Application of the Structural Decomposition Analysis to assess the indirect energy consumption and air emission changes related to Italian households consumption. Renew. Sustain. Energy Rev. 2012, 16, 199–214. [Google Scholar] [CrossRef]
  9. Das, A.; Paul, S.K. CO2 emissions from household consumption in India between 1993–94 and 2006–07: A decomposition analysis. Energy Econ. 2014, 41, 90–105. [Google Scholar] [CrossRef]
  10. Giljum, S.; Hubacek, K. Alternative approaches of physical input–output analysis to estimate primary material inputs of production and consumption activities. Econ. Syst. Res. 2004, 16, 301–310. [Google Scholar] [CrossRef]
  11. Wood, R.; Dey, C.J. Australia’s carbon footprint. Econ. Syst. Res. 2009, 21, 243–266. [Google Scholar] [CrossRef]
  12. Lenzen, M. Primary energy and greenhouse gases embodied in Australian final consumption: An input–output analysis. Energy Policy 1998, 26, 495–506. [Google Scholar] [CrossRef]
  13. Biesiot, W.; Noorman, K.J. Energy requirements of household consumption: A case study of The Netherlands. Ecol. Econ. 1999, 28, 367–383. [Google Scholar] [CrossRef]
  14. Wier, M.; Lenzen, M.; Munksgaard, J.; Smed, S. Effects of household consumption patterns on CO2 requirements. Econ. Syst. Res. 2001, 13, 259–274. [Google Scholar] [CrossRef]
  15. Lenzen, M.; Dey, C.; Foran, B. Energy requirements of Sydney households. Ecol. Econ. 2004, 49, 375–399. [Google Scholar] [CrossRef]
  16. Lenzen, M.; Wood, R.; Foran, B. Direct versus Embodied Energy. The Need for Urban Lifestyle Transitions; Elsevier: Amsterdam, The Netherlands, 2008. [Google Scholar]
  17. Druckman, A.; Jackson, T. The carbon footprint of UK households 1990–2004: A socio-economically disaggregated, quasi-multi-regional input–output model. Ecol. Econ. 2009, 68, 2066–2077. [Google Scholar] [CrossRef] [Green Version]
  18. Kerkhof, A.C.; Nonhebel, S.; Moll, H.C. Relating the environmental impact of consumption to household expenditures: An input–output analysis. Ecol. Econ. 2009, 68, 1160–1170. [Google Scholar] [CrossRef]
  19. Wiedenhofer, D.; Lenzen, M.; Steinberger, J.K. Spatial and Socioeconomic Drivers of Direct and Indirect Household Energy Consumption in Australia; CSIRO Publishing: Collingwood, Australia, 2011. [Google Scholar]
  20. Lenzen, M.; Wier, M.; Cohen, C.; Hayami, H.; Pachauri, S.; Schaeffer, R. A comparative multivariate analysis of household energy requirements in Australia, Brazil, Denmark, India and Japan. Energy 2006, 31, 181–207. [Google Scholar] [CrossRef]
  21. Zhu, Q.; Peng, X.; Wu, K. Calculation and decomposition of indirect carbon emissions from residential consumption in China based on the input–output model. Energy Policy 2012, 48, 618–626. [Google Scholar] [CrossRef]
  22. Zhang, Y. IMPACT OF URBAN AND RURAL HOUSEHOLD CONSUMPTION ON CARBON EMISSIONS IN CHINA. Econ. Syst. Res. 2013, 25, 287–299. [Google Scholar] [CrossRef]
  23. Liu, L.C.; Wu, G.; Wang, J.N.; Wei, Y.M. China’s carbon emissions from urban and rural households during 1992–2007. J. Clean. Prod. 2011, 19, 1754–1762. [Google Scholar] [CrossRef]
  24. Fan, J.; Guo, X.; Marinova, D.; Wu, Y.; Zhao, D. Embedded carbon footprint of Chinese urban households: Structure and changes. J. Clean. Prod. 2012, 33, 50–59. [Google Scholar] [CrossRef]
  25. Chen, G.Q.; Guo, S.; Shao, L.; Li, J.S.; Chen, Z.M. Three-scale input–output modeling for urban economy: Carbon emission by Beijing 2007. Commun. Nonlinear Sci. Numer. Simul. 2013, 18, 2493–2506. [Google Scholar] [CrossRef]
  26. Zhang, G.; Liu, M.; Gao, X. Dynamic Characteristic Analysis of Indirect Carbon Emissions Caused by Chinese Urban and Rural Residential Consumption Based on Time Series Input-Output Tables from 2002 to 2011. Math. Probl. Eng. 2014, 2014, 297637. [Google Scholar] [CrossRef]
  27. Södersten, C.J.; Wood, R.; Hertwich, E.G. Environmental Impacts of Capital Formation. J. Ind. Ecol. 2017. [Google Scholar] [CrossRef]
  28. Weisz, H.; Suh, S.; Graedel, T. Industrial Ecology: The role of manufactured capital in sustainability. Proc. Natl. Acad. Sci. USA 2015, 112, 6260–6264. [Google Scholar] [CrossRef] [PubMed]
  29. Müller, D.B.; Wang, T.; Duval, B.; Graedel, T.E. Exploring the engine of anthropogenic iron cycles. Proc. Natl. Acad. Sci. USA 2006, 103, 16111–16116. [Google Scholar] [CrossRef] [PubMed]
  30. Pauliuk, S.; Müller, D.B. The role of in-use stocks in the social metabolism and in climate change mitigation. Glob. Environ. Chang. 2014, 24, 132–142. [Google Scholar] [CrossRef] [Green Version]
  31. Chen, W.-Q.; Graedel, T. In-use product stocks link manufactured capital to natural capital. Proc. Natl. Acad. Sci. USA 2015, 112, 6265–6270. [Google Scholar] [CrossRef] [PubMed]
  32. Peters, G.P.; Weber, C.L.; Guan, D.; Hubacek, K. China’s Growing CO2 Emissions a Race between Increasing Consumption and Efficiency Gains. Environ. Sci. Technol. 2007, 41, 5939–5944. [Google Scholar] [CrossRef] [PubMed]
  33. Xie, S.-C. The driving forces of China’s energy use from 1992 to 2010: An empirical study of input–output and structural decomposition analysis. Energy Policy 2014, 73, 401–415. [Google Scholar] [CrossRef]
  34. Wang, H.; Wang, C.; Zheng, H.; Feng, H.; Guan, R.; Long, W. Updating Input–Output Tables with Benchmark Table Series. Econ. Syst. Res. 2015, 27, 1–19. [Google Scholar] [CrossRef]
  35. Zheng, H.; Fang, Q.; Wang, H.; Wang, C.; Ren, R. Input-output serial table’s updating and the analysis of industrial structure change in China: 1992–2020. In Proceedings of the China Economics 2016 Annual Conference, Wuhan, China, 3–4 December 2016.
  36. Bai, C.; Zhang, Q. China’s economic growth prospects. New Financ. Rev. 2014, 1, 135–151. (In Chinese) [Google Scholar]
  37. Department of Energy Statistics, National Bureau of Statistics. China Energy Statistical Yearbook 2007; China Statistics Press: Beijing, China, 2008.
  38. Department of Energy Statistics, National Bureau of Statistics. China Energy Statistical Yearbook 2008; China Statistics Press: Beijing, China, 2009.
  39. Department of Energy Statistics, National Bureau of Statistics. China Energy Statistical Yearbook 2009; China Statistics Press: Beijing, China, 2010.
  40. Department of Energy Statistics, National Bureau of Statistics. China Energy Statistical Yearbook 2010; China Statistics Press: Beijing, China, 2011.
  41. Department of Energy Statistics, National Bureau of Statistics. China Energy Statistical Yearbook 2011; China Statistics Press: Beijing, China, 2012.
  42. Department of Energy Statistics, National Bureau of Statistics. China Energy Statistical Yearbook 2012; China Statistics Press: Beijing, China, 2013.
  43. Department of Energy Statistics, National Bureau of Statistics. China Energy Statistical Yearbook 2013; China Statistics Press: Beijing, China, 2014.
  44. Department of Energy Statistics, National Bureau of Statistics. China Energy Statistical Yearbook 2014; China Statistics Press: Beijing, China, 2015.
  45. 2006 IPCC Guidelines for National Greenhouse Gas Inventories; Institute for Global Environmental Strategies: Kanagawa, Japan, 2006.
Figure 1. Total embodied carbon emissions of eight sectors in 2016.
Sustainability 09 00387 g001
Figure 2. Value added of eight sectors of China in 2016.
Sustainability 09 00387 g002
Figure 3. Total embodied emissions by type of final demand of eight sectors in 2016. Note: the unit of embodied carbon emissions in the vertical axis is million tons.
Sustainability 09 00387 g003
Figure 4. Total embodied carbon emissions by type of final demand from 1992 to 2020 in four situations. Note: figure (ad) respectively shows the embodied carbon emissions from 1992 to 2020 under four kinds of assumption that the direct carbon emission intensities of 2015–2020 will remain the same as that of 2014 (a), decrease 3% a year (b), decrease 6% a year (c) and increase 3% a year (d). The unit of embodied carbon emissions in the left vertical axis is billion tons.
Sustainability 09 00387 g004
Figure 5. Total embodied carbon emissions by type of final demand of six industries from 1992 to 2020 in China. Note: the unit of embodied carbon emissions in the vertical axis is 100 million tons.
Sustainability 09 00387 g005
Figure 6. Final demand of 20 industries in 1992–2020. Note: the numbers in the legends are industry numbers.
Sustainability 09 00387 g006
Figure 7. Total embodied carbon emissions of 20 industries from 1992 to 2020 in 4 situations. Note: the situation (ad) respectively shows the four kinds of assumption that the direct carbon emission intensities of 2015–2020 will stay constant (a), decrease 3% a year (b), decrease 6% a year (c) and increase 3% a year (d).
Sustainability 09 00387 g007aSustainability 09 00387 g007b
Table 1. Carbon emission multipliers of 29 industries from 1992 to 2020 in China.
Industry aIntensity bEmbodied Carbon Emission Multiplier
201419922000201020142015201620172020
10.213.841.370.780.580.600.620.640.74
20.5110.823.021.511.121.131.151.171.21
30.195.612.220.840.610.620.640.650.70
40.157.222.080.980.820.840.860.880.94
50.258.012.401.330.950.981.001.021.09
60.105.811.711.000.670.670.680.690.74
70.096.871.911.140.810.830.850.860.91
80.036.011.591.020.700.700.710.720.74
90.077.241.921.140.790.790.790.810.86
100.137.272.231.460.870.850.840.820.78
110.577.544.551.611.231.241.261.281.33
120.4610.523.281.941.471.481.471.471.42
131.2515.024.963.402.332.352.372.392.44
140.4410.073.751.771.391.411.431.451.54
150.047.632.601.091.021.061.101.151.25
160.036.112.161.010.910.920.930.951.00
170.025.652.141.090.870.890.910.930.99
180.0111.412.381.131.031.041.061.081.14
190.016.041.900.970.800.820.830.850.90
200.015.812.061.050.860.870.880.900.94
210.0410.552.240.880.560.590.610.630.68
220.035.370.000.330.310.330.330.340.37
230.055.352.601.040.710.700.690.690.73
240.098.905.210.880.670.680.680.680.69
250.024.471.510.690.560.560.560.560.56
260.137.702.691.631.201.221.241.261.33
271.367.064.252.512.132.152.182.202.29
280.254.951.590.800.620.630.650.680.74
290.5212.332.681.270.980.991.001.011.05
Note: a Industrial definitions: 1, Agriculture; 2, Mining and washing of coal; 3, Extraction of petroleum and natural gas; 4, Mining and processing of metal ores; 5, Mining and processing of nonmetal ores and other ores; 6, Manufacture of foods and tobacco; 7, Manufacture of textiles; 8, Manufacture of wearing apparel, leather, fur, feather, footwear, and related products; 9, Processing of timber, manufacture of furniture; 10, Printing and manufacture of paper, articles for culture, education and sports; 11, Processing of petroleum, coking, processing of nuclear fuel; 12, Manufacture of chemical products; 13, Manufacture of non-metallic mineral products; 14, Smelting and processing of metals; 15, Manufacture of metal products; 16, Manufacture of general and special purpose machinery; 17, Manufacture of transportation equipment; 18, Manufacture of electrical machinery and equipment; 19, Manufacture of computers, communication and other electronic equipment; 20, Manufacture of measuring instruments; 21, Other manufacturing; 22, Comprehensive use of waste resources; 23, Production and distribution of electric power and heat power; 24, Production and distribution of gas; 25, Production and distribution of tap water; 26, Construction; 27, Transport, storage and postal services; 28, Wholesale, retail trades, accommodation and catering; 29, Other services. b The second column titled “Intensity” are direct carbon emission intensities of each industry. The units of intensity and multiplier are both ton/thousand yuan. Due to the assumption that the direct carbon emission intensities of 2015–2020 remain unchanged, the multipliers begin to increase a little after 2017. This reflects the impact of changes in the structure of energy consumption on the multipliers.
Table 2. The ratio of carbon emissions from rural residential consumption by industries, 1992–2020.
Industry No. a1992199319941995199619971998199920002001
10.260.280.280.280.270.250.260.260.230.22
60.130.150.160.170.180.170.170.160.150.15
270.050.050.050.050.040.050.050.060.060.06
280.070.070.060.060.060.060.060.060.070.07
290.130.130.130.140.170.220.240.260.290.31
Total b0.650.670.690.710.720.750.780.800.800.81
TE (Mt) c409.8421.8419.9432.0464.7462.3394.9344.1323.5312.4
Industry No. a2002200320042005200620072008200920102011
10.220.210.200.190.170.160.150.140.140.13
60.140.150.170.170.170.170.160.190.190.19
270.060.050.050.050.050.050.050.050.060.06
280.070.080.090.100.110.120.110.100.090.08
290.330.310.310.310.320.330.330.320.320.32
Total b0.810.800.820.820.820.810.810.800.790.78
TE (Mt) c299.6345.3344.0350.5357.0365.7333.1372.2383.9414.6
Industry No. a201220132014201520162017201820192020
10.120.130.130.130.120.120.130.130.13
60.190.190.190.190.200.200.210.220.22
270.070.070.070.070.070.070.070.070.07
280.080.100.100.100.100.100.100.090.09
290.340.320.320.310.310.300.300.290.30
Total b0.800.800.800.800.800.800.800.800.80
TE (Mt) c423.8416.5397.8410.7426.1444.8466.8492.8519.3
Note: a industry numbers: 1, Agriculture; 6, Manufacture of foods and tobacco; 27, Transport, storage, and postal services; 28, Wholesale, retail trades, accommodation, and catering; 29, Other services. b the total ratio of embodied emissions produced by these six chosen industries in the total embodied emissions from rural residential consumption. c TE (Mt) is the total amount of the embodied carbon emissions caused by rural residential consumption in each year with unit of million tons.
Table 3. The ratio of carbon emissions from urban residential consumption by industries, 1992–2020.
Industry No. a1992199319941995199619971998199920002001
10.130.140.140.140.140.130.130.130.110.11
60.190.200.200.200.190.170.160.140.130.12
270.040.040.050.050.040.040.050.060.070.07
280.090.080.080.080.070.070.080.090.090.10
290.230.210.210.210.230.270.270.280.310.32
Total0.690.680.680.670.670.680.690.700.710.71
TE (Mt)409.8421.8419.9432.0464.7462.3394.9344.1323.5312.4
Industry No. a2002200320042005200620072008200920102011
10.100.090.080.080.070.060.060.060.060.06
60.110.120.140.150.150.150.140.150.150.15
270.070.060.060.050.050.050.060.060.070.07
280.100.100.110.110.110.110.110.100.100.10
290.330.330.350.370.380.390.400.390.390.39
Total0.720.700.740.750.760.760.770.760.770.77
TE (Mt)299.6345.3344.0350.5357.0365.7333.1372.2383.9414.6
Industry No. a201220132014201520162017201820192020
10.050.050.050.050.050.050.050.050.05
60.140.140.130.130.140.140.140.140.14
270.080.080.080.080.080.080.080.080.08
280.090.120.120.120.130.130.130.130.13
290.390.390.390.390.390.390.390.380.39
Total0.760.770.780.780.780.780.780.780.79
TE (Mt)423.8416.5397.8410.7426.1444.8466.8492.8519.3
Note: a industry numbers: 1, Agriculture; 6, Manufacture of foods and tobacco; 27, Transport, storage, and postal services; 28, Wholesale, retail trades, accommodation, and catering; 29, Other services.
Table 4. The ratio of carbon emissions from government consumption by industries, 1992–2020.
Industry No. a1992199319941995199619971998199920002001
10.000.000.000.000.000.000.010.010.000.01
270.020.030.040.040.040.050.050.040.040.03
290.860.870.880.900.930.950.950.950.960.96
Total0.880.900.920.940.971.001.001.001.001.00
TE(Mt)409.8421.8419.9432.0464.7462.3394.9344.1323.5312.4
Industry No. a2002200320042005200620072008200920102011
10.010.010.010.010.010.010.010.010.010.00
270.030.040.050.060.070.070.070.070.070.06
290.970.950.940.940.930.920.920.930.930.93
Total1.001.001.001.001.001.001.001.001.001.00
TE(Mt)299.6345.3344.0350.5357.0365.7333.1372.2383.9414.6
Industry No. a201220132014201520162017201820192020
10.000.010.010.010.010.010.010.010.01
270.060.050.050.050.050.060.060.070.07
290.940.940.940.940.940.940.930.930.92
Total1.001.001.001.001.001.001.001.001.00
TE(Mt)423.8416.5397.8410.7426.1444.8466.8492.8519.3
Note: a industry numbers: 1, Agriculture; 27, Transport, storage, and postal services; 29, Other services.
Table 5. The ratio of carbon emissions from fixed capital formation by industries, 1992–2020.
Industry No. a1992199319941995199619971998199920002001
160.170.200.180.160.150.130.130.130.130.12
170.060.070.070.070.070.060.060.060.060.06
180.030.020.020.020.020.020.020.020.020.02
260.640.620.650.670.680.710.700.690.690.68
290.000.000.010.010.010.020.020.020.020.03
Total0.910.920.920.930.930.930.930.920.910.91
TE(Mt)409.8421.8419.9432.0464.7462.3394.9344.1323.5312.4
Industry No. a2002200320042005200620072008200920102011
160.120.110.110.110.110.110.110.120.090.11
170.060.060.060.060.070.070.080.080.090.09
180.010.010.030.030.030.040.040.040.020.03
260.680.710.670.670.660.650.630.620.670.63
290.030.030.040.040.050.050.060.060.060.07
Total0.900.920.910.910.910.920.920.920.930.93
TE(Mt)299.6345.3344.0350.5357.0365.7333.1372.2383.9414.6
Industry No. a201220132014201520162017201820192020
160.110.110.110.110.120.120.120.120.12
170.090.090.090.090.090.080.080.080.07
180.030.040.040.040.040.040.040.040.04
260.610.610.610.610.610.620.620.620.62
290.070.070.070.070.060.060.060.050.06
Total0.930.920.920.920.920.920.920.910.91
TE(Mt)423.8416.5397.8410.7426.1444.8466.8492.8519.3
Note: a industry numbers: 16, Manufacture of general and special purpose machinery; 17, Manufacture of transportation equipment; 18, Manufacture of electrical machinery and equipment; 26, Construction; 29, Other services.

