Article

Functional Differentiation and Sustainability: A New Stage of Development in the Chinese Container Port System

1
Center for Modern Chinese City Studies, East China Normal University, Shanghai 200062, China
2
School of Urban & Regional Science, East China Normal University, Shanghai 200241, China
3
China Institute of FTZ Supply Chain, Shanghai Maritime University, Shanghai 201306, China
4
Faculty of Applied Economics, University of Antwerp, 2000 Antwerp, Belgium
5
Maritime Institute, Faculty of Law, Ghent University, 9000 Gent, Belgium
6
Faculty of Science, Antwerp Maritime Academy, 2030 Antwerp, Belgium
7
Division of Business, Hong Kong Community College, Hong Kong Polytechnic University, Hong Kong, China
8
Transport Institute, Asper School of Business, University of Manitoba, Winnipeg, MB R3T 5V4, Canada
9
Department of Supply Chain Management, Asper School of Business, University of Manitoba, Winnipeg, MB R3T 5V4, Canada
*
Author to whom correspondence should be addressed.
Sustainability 2017, 9(3), 328; https://doi.org/10.3390/su9030328
Submission received: 22 December 2016 / Revised: 6 February 2017 / Accepted: 17 February 2017 / Published: 23 February 2017
(This article belongs to the Section Economic and Business Aspects of Sustainability)

Abstract

:
Adjacent ports played a significant role in the evolution of the port system. In our study, we selected five pairs (i.e., Dalian–Yingkou, Qingdao–Yantai, Shanghai–Ningbo, Xiamen–Quanzhou, and Shenzhen–Guangzhou) of the most important adjacent ports in China to reveal the recent trend of China unique port system development; how and why will port system development be de-concentrated; and integrate the conceptual modal into in-depth analysis. The major findings are as follows: (1) There is functional differentiation in adjacent ports. To some big ports’ sustainability, they focus on foreign trade while other small ports, in order to achieve sustainable development, they focus on domestic trade; (2) First-mover advantage and dislocation competition is a mechanism of China ports functional differentiation; (3) Shanghai and Ningbo are unique in that both ports are similarly focused on foreign trade because they both have deep-water harbors, excellent geographical location, export-oriented hinterland economy, and close foreign investment relationships.

1. Introduction

In 1992, the United Nations introduced the concept of “sustainable development” in the environment and development conference. Since then, all port stakeholders discussed the port sustainable development issues. In principle, a port is a complex system. Port is not only closely linked with socio-economic and government policy, but also directly impacts on the ecological environment and resources. The concept of port sustainability includes three main perspectives: (1) an economic perspective including returns on investment, efficiency of the use of the port area, and provision of facilities for companies to maximize their performance; (2) a social scope such as the direct contribution to employment in port companies and activities connecting to the port (indirect employment, the interaction and relationship between port and city, the contribution to knowledge development and education, and the livability of the area surrounding the port); and (3) environmental performance and management including noise pollution, air quality, dredging operations, and dredging disposal [1]. In the coastal port cities, the main sources of pollution stem from port. Thus, various academic scholars increased their awareness of port environmental protection and its sustainable development [2,3]. However, there is little research on the port sustainable development from the economic aspect, especially from the intra-port division of labor perspective [4]. At the national level, improves the rational use of the coastline and promotes the sustainable use of the coastline. At the local level, it fosters port evolution into professional characteristics to create sustainable development direction.
From a historical perspective, China developed container ports at a later stage. The first container port appeared in Tianjin in 1980. In 1999, Shanghai was the only port which ranked among the world’s top ten container ports, and by 2013, seven Chinese container ports had been listed in the world’s top ten container ports [5]. Since 2010, Shanghai has exceeded Singapore and, thus, Shanghai is ranked first and reached 32.52 million TEUs or Twenty Foot Equivalent Units [6]. China has relied heavily on the port and container system for international trade, with at least 85% of China’s foreign trade and 89.6% of global trade being transported using the sea transportation [7]. The rapid rise of China’s container ports leads to substantial transformation of the Chinese port system, notably, the ports’ interrelationships.
Since the 1960s, research on port system has mainly focused on concentration and de-concentration. On the one hand, the advanced logistics systems and the hub-and-spoke traffic operations generated the concentration of container port systems. On the other hand, fierce inter-port competition led to the de-concentration of container port systems [8]. However, we suggested that concentration and de-concentration is the first layer of port system evolution under the GIS layers illustration. The second layer is a division of role between ports. In general, China adjacent ports are divided into four main roles: (1) foreign container trade; (2) domestic container trade; (3) foreign transshipment container trade; and (4) domestic transshipment container trade. We conducted a comprehensive adjacent port study that aims to: (1) reveal the recent trend of China unique port system development; (2) how and why port system become de-concentrated; and (3) find the evolution of port system, notably the implications of port function differentiation on the port sustainable development.
The evolution of the port system is directly reflected from adjacent ports. Adjacent ports refer to two or more ports being grouped into the same cluster and the ports are in close proximity. From the administrative jurisdiction, the ports are situated in different city jurisdictions. From the functional aspects, ports compete with each other in the same hinterland. Adjacent ports play a significant role in the evolution of the port system. In this study, we selected five pairs of most important China coastal adjacent ports to conduct a comparative analysis. We investigate the rapid development of foreign trade in the past decade, and recent changes in China’s existing port system.
The rest of the paper is structured as follows. The literature review can be found in Section 2. Section 3 consists of the research methodology, including the justifications of our choices of adjacent ports as stated earlier, and describes the sources and importance of data. Section 4 consists of an analysis on the evolution of the Chinese port system. Through the extensive use of data, we can divide the adjacent port system into three layers. In Section 5, we illustrate the first-mover advantage and dislocation competition point of view to investigate the causes of the evolution of the Chinese port system. Finally, discussions and conclusion can be found in Section 6.

2. Literature Review

2.1. Port System Study

Ng conducted a critical review on port geography [9]. He investigated 155 port research papers from various geography journals between 1956 and 2011. It offers an analysis of the evolution of and research trends in port geography. After WWII, the port system had received significant attention from academic scholars and researchers. In this regard, Bird is regarded and he has published several books specializing topic on port system research (e.g., Bird) [10,11,12]. Less than 10 research papers have focused on port system study before the 1990s. However, the number of research papers on port systems dramatically increased to 16 from 1991 to 2011 [9]. Port system has maintained a dominant position in different research studies.
In the 1960s, port geographers had the opportunity of pursuing Bird’s “Anyport” model or changes in inter-port dynamics through the further elaboration of the Taaffe et al. model of transport development in underdeveloped countries [13]. Taaffe et al. focused on spatial relationships of the port system [14]. The study described how concentration and de-concentration evolution over time and space is the main direction in port systems research [8,15]. In general, port activities concentrated on one or two geographical locations to enjoy economies of scale [16]. Due to extensive inland transport networks, hinterland development, technological development, containerization, and intensive regular sailing schedule, a single port system had been established during this period which had inherent competitive advantages in various factors, e.g., geographical location, water depth, proximity to metropolitan areas, etc. The system of port concentration was initially introduced by Taaffe et al. citing the situations in Ghana and Nigeria as illustrative examples. Simultaneously, Rimmer conducted similar research on the port systems in New Zealand [17], while Hilling and Ogundana used the experiences of African ports to support the port concentration model [18,19]. In this regard, Hoyle and Charlier adopted Taaffe’s model to establish East African port competition model (during 1500–1900) [20]. This port competition model demonstrated hinterland expansion and de-concentration rapidly in a fifth stage.
However, the port system also had a growing tendency to de-concentrate. Rimmer divided the Australian port system into five stages. Based on New Zealand’s four fundamental development stages, he added an additional stage, namely “Decentralization: Ports near the initial port are established to provide specialist functions enabling the initial port to concentrate on general cargo services” [21,22]. Hayuth observed the phenomenon of container port systems decentralization. He divided the port systems evolution into five main stages. He argued that the container port systems had a tendency of de-concentration, and named such a stage as “Peripheral Port Challenge” [23]. When ports experienced the traffic bottleneck syndrome, a number of port activities would shift from the city center to surrounding regions or nearby ports. Researchers such as Rimmer, Hayuth, etc. noticed the decentralization of port systems, but they ignore the functional differentiation between the ports. The impact of port functional differentiation on port sustainable development is also underestimated.
More recently, Notteboom and Rodrigue argued that the evolution of ports and port systems had reached the era of port regionalization [24]. They defined port regionalization as “inland distribution becomes of foremost importance in port competition, favoring the emergence of transport corridors and logistics poles. The port itself was not chief motivator for and instigator of regionalization. Regionalization resulted from logistics decisions and subsequent actions of shippers and third party logistics providers” [24] (p. 311). In other words, transport corridors and logistics nodes are two main factors in deciding the competitiveness of ports. However, Rimmer and Comtois held a different view, and argued that regionalization did not necessarily take place [14]. To address this issue, Ducruet selected studies on port system from 1963 to 2008 and focused on the factors of concentration or de-concentration [25].

2.2. China Port Development and System

China has transformed from a closed, planned economy to market economy with heavy reliance on export-orientated industrialization strategy in the past three decades. China’s foreign trade has demonstrated a rapid growth under the subsequent expansion of open cities in 1992 [26]. Rapid development of the Chinese port industry due to high demand for delivery goods by sea from China to different parts of the world [27] and China has a long coastline (approximately 18,000 km) with a large number of ports. 39 ports (including Hong Kong) have provided schedule container liner services in China. Indeed, more than 80% of international trade has been completed with ports’ involvement. China’s shipping industry has the potential to promote local economies and to attract foreign investment. It stimulates many cities in China and its neighboring countries who strive to become the gateway ports for respective hinterlands. The overlapping hinterlands intensified competition among the ports within the region [27]. Wang and Slack, and Slack and Fremont , who discussed as examples the ports of Hong Kong, Singapore and Shanghai, have faced competition from neighboring ports, notably Shenzhen, Tanjung Pelepas and Ningbo, respectively [28,29]. In this case, Chan and Yip proposed that Hong Kong and Shenzhen have the possibility of closer collaboration [30]; for example, a Hong Kong company, Hutchison-Whampoa, participated in developing the Yantian container port to coordinate inter-port links. Cullinane et al. argued that, by the turn of the century, Hong Kong still maintained the absolute leading hub port position despite fierce competition from Shenzhen [31]. In addition, Ningbo and Zhoushan ports have combined to maximize locational advantages, share resources and complementarily develop each other [30]. In addition, Cullinane et al. investigated the competition between Shanghai and Ningbo ports [31]. Compared with Shanghai, Ningbo has inherent comparative advantages in water depth and freight rates. Some studies on Chinese ports and port systems, for example, Bohai Sea Ports [32]; the Yangtze River Delta [33,34,35]; the Pearl River Delta [28,36,37]; and China container port system, have concerns on changing port status [14]. In this regard, several researchers have conducted in-depth studies on China’s coastal container port system and its dynamic process of the port status [38,39,40,41]. The main advantage of this method is to simplify data sorting and statistical analysis of each container port throughput.
Previous research faced a pitfall as mainly illustrative and operational research using container throughput data [42,43,44,45] and Gini coefficient [46,47,48] to quantify concentration or de-concentration. Ngonly focused on critical review study on port geography over a half century [9]. Wang et al. argued that the transformation of port’s role and functions had “outpaced scholars and policymakers’ capacity to conceptualize and interpret changes.” [35] (pp. 183–197). They have largely overlooked the relationships and functions of adjacent ports, notably China port systems. Thus, we developed the conceptual modal to examine unique China port system and investigate how and why port system development will be de-concentrated. There is currently no similar study in the literature. All such changes have created considerable research opportunities and proposed the need to identify new paradigms on the research trends of port development.

3. Research Target and Information

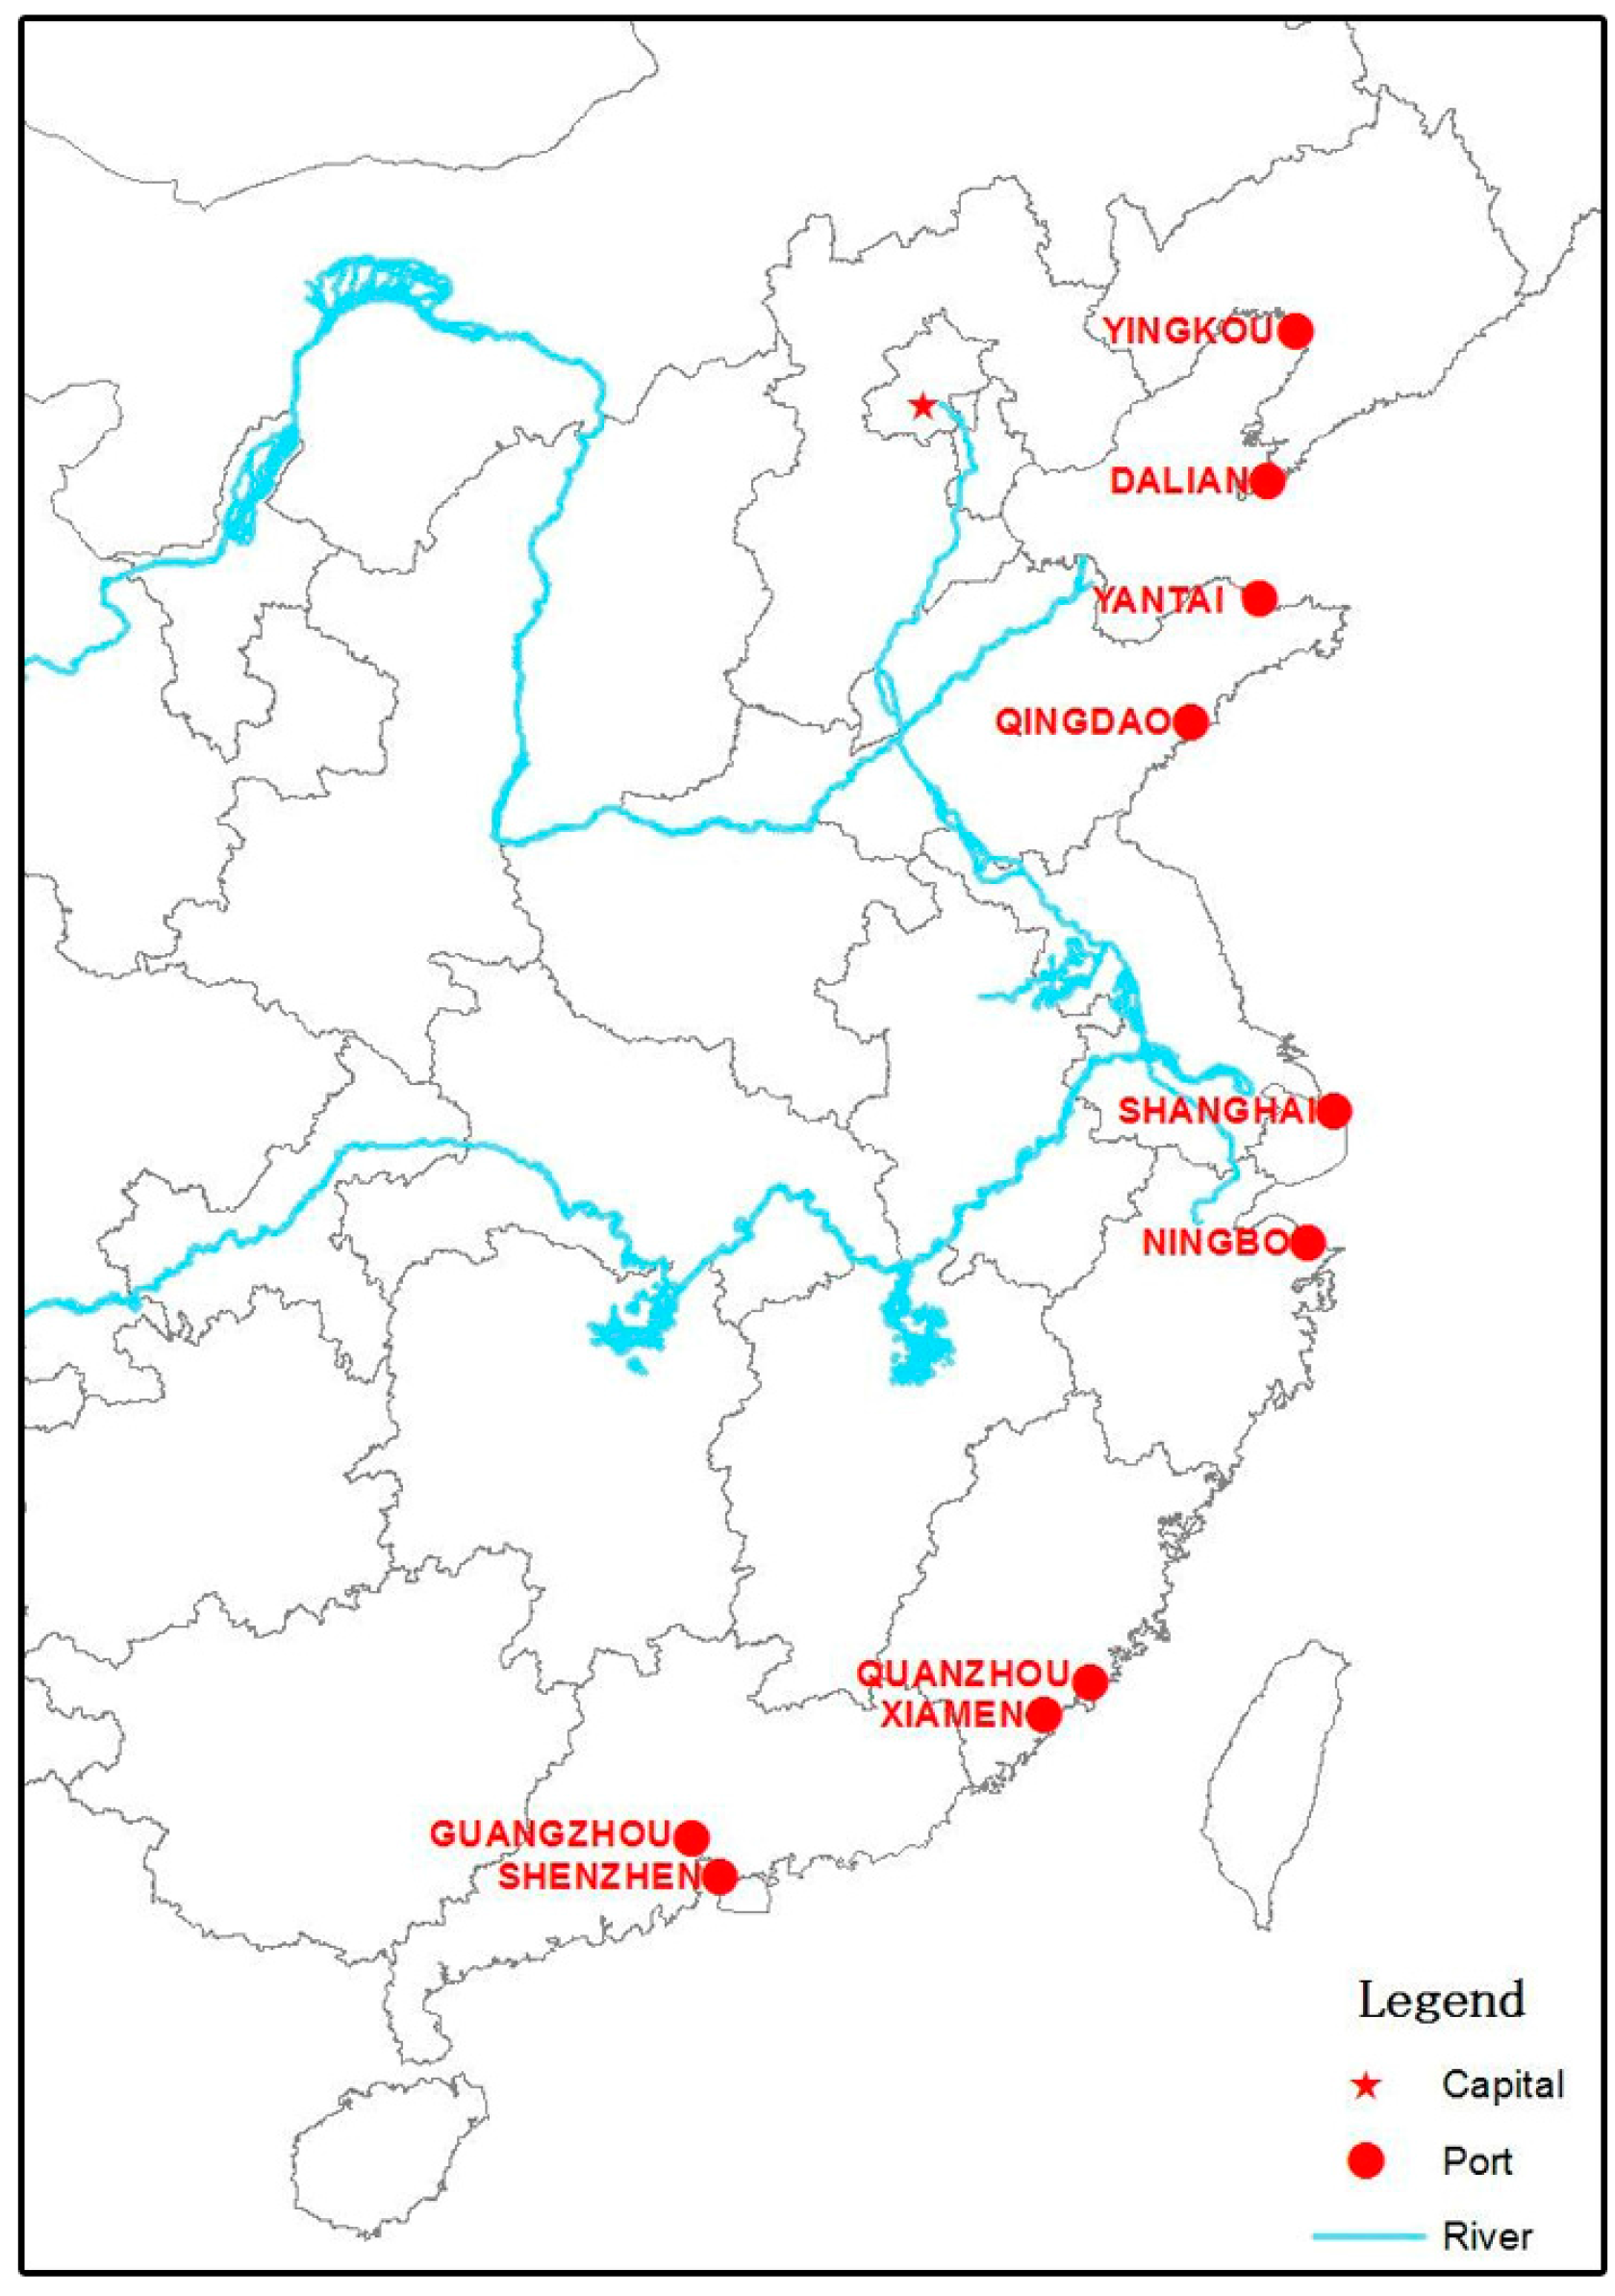
3.1. Research Target

Relationships between adjacent ports could show direct correlation with the evolution of port system. In this study, we have selected five pairs of the most important coastal adjacent ports in China as our study focus: Dalian–Yingkou, Qingdao–Yantai, Shanghai–Ningbo, Xiamen–Quanzhou, and Shenzhen–Guangzhou (Figure 1).
In 2012, these ten container ports’ throughputs reached 125 million TEUs, accounting for over 70% of China’s total container throughput. Eight out of these 10 container ports are listed in the top 10 Chinese ports. The other two ports, Yantai and Quanzhou, are 11th and 14th, respectively (see Table 1). Xiamen, Fuzhou and Quanzhou are the top three container ports in Fujian Province. The difference of container throughput between Quanzhou and Fuzhou is 130,000 TEUs [6]. Xiamen is also closer to Quanzhou [49]. Thus, Xiamen and Quanzhou is the appropriate research target in our study. In addition, some researchers start to conduct research related to the Pearl River Delta ports including Hong Kong, Shenzhen and Guangzhou. This study suggested that we could regard Hong Kong and Shenzhen as a whole because these two ports share the same waterways and navigation. For instance, the construction of Yantian International Container Port phase 1 and 2 is managed by Hutchison Whampoa Limited. Because Hutchison Whampoa Ltd. also manages and operates Hong Kong Kwai Chung container terminals, it could unify the two container transport arrangements. Thus, we selected Shenzhen and Guangzhou as our research targets.

3.2. Research Information

In our study, we could use China Statistical Yearbook, China Transportation Yearbook and Province Statistical Yearbook to conduct China port research. To obtain valuable information and comprehensive data (i.e., port’s total throughput, domestic and foreign container throughput, domestic and foreign transshipment container throughput), China Ports Yearbook was considered.

3.3. Research Methodology

Trade Competitive Power Index is also known as Trade Specialization Coefficient (TC) [50]. If the export of one product in a country is more than the import, i.e., TC value is greater than 0, the product in the country has a competitive advantage and vice versa. It is an effective tool to analyze the competitiveness of the trade structure. This study is based on Trade Competitive Power Index to analyze foreign container (foreign transshipment) and domestic container (domestic transshipment) competitive level.
T C = T E U i f T E U i d T E U i f + T E U i d
where T E U i f represents i port’s foreign container or foreign transshipment throughput; T E U i d represents i port’s domestic container or domestic transshipment throughput; and T C ranges between −1 and 1. A T C value larger than 0 indicates foreign container or foreign transshipment has a comparative advantage, and the competitive advantage is stronger when T C value is close to 1. Conversely, a T C value smaller than 0 shows the domestic container or domestic transshipment has a comparative advantage, and the competitive advantage is stronger when T C value is close to −1. A T C value of 0 demonstrates that i port’s domestic container or domestic transshipment throughput and foreign container or foreign transshipment through put is the same.

4. China Port System Evolution

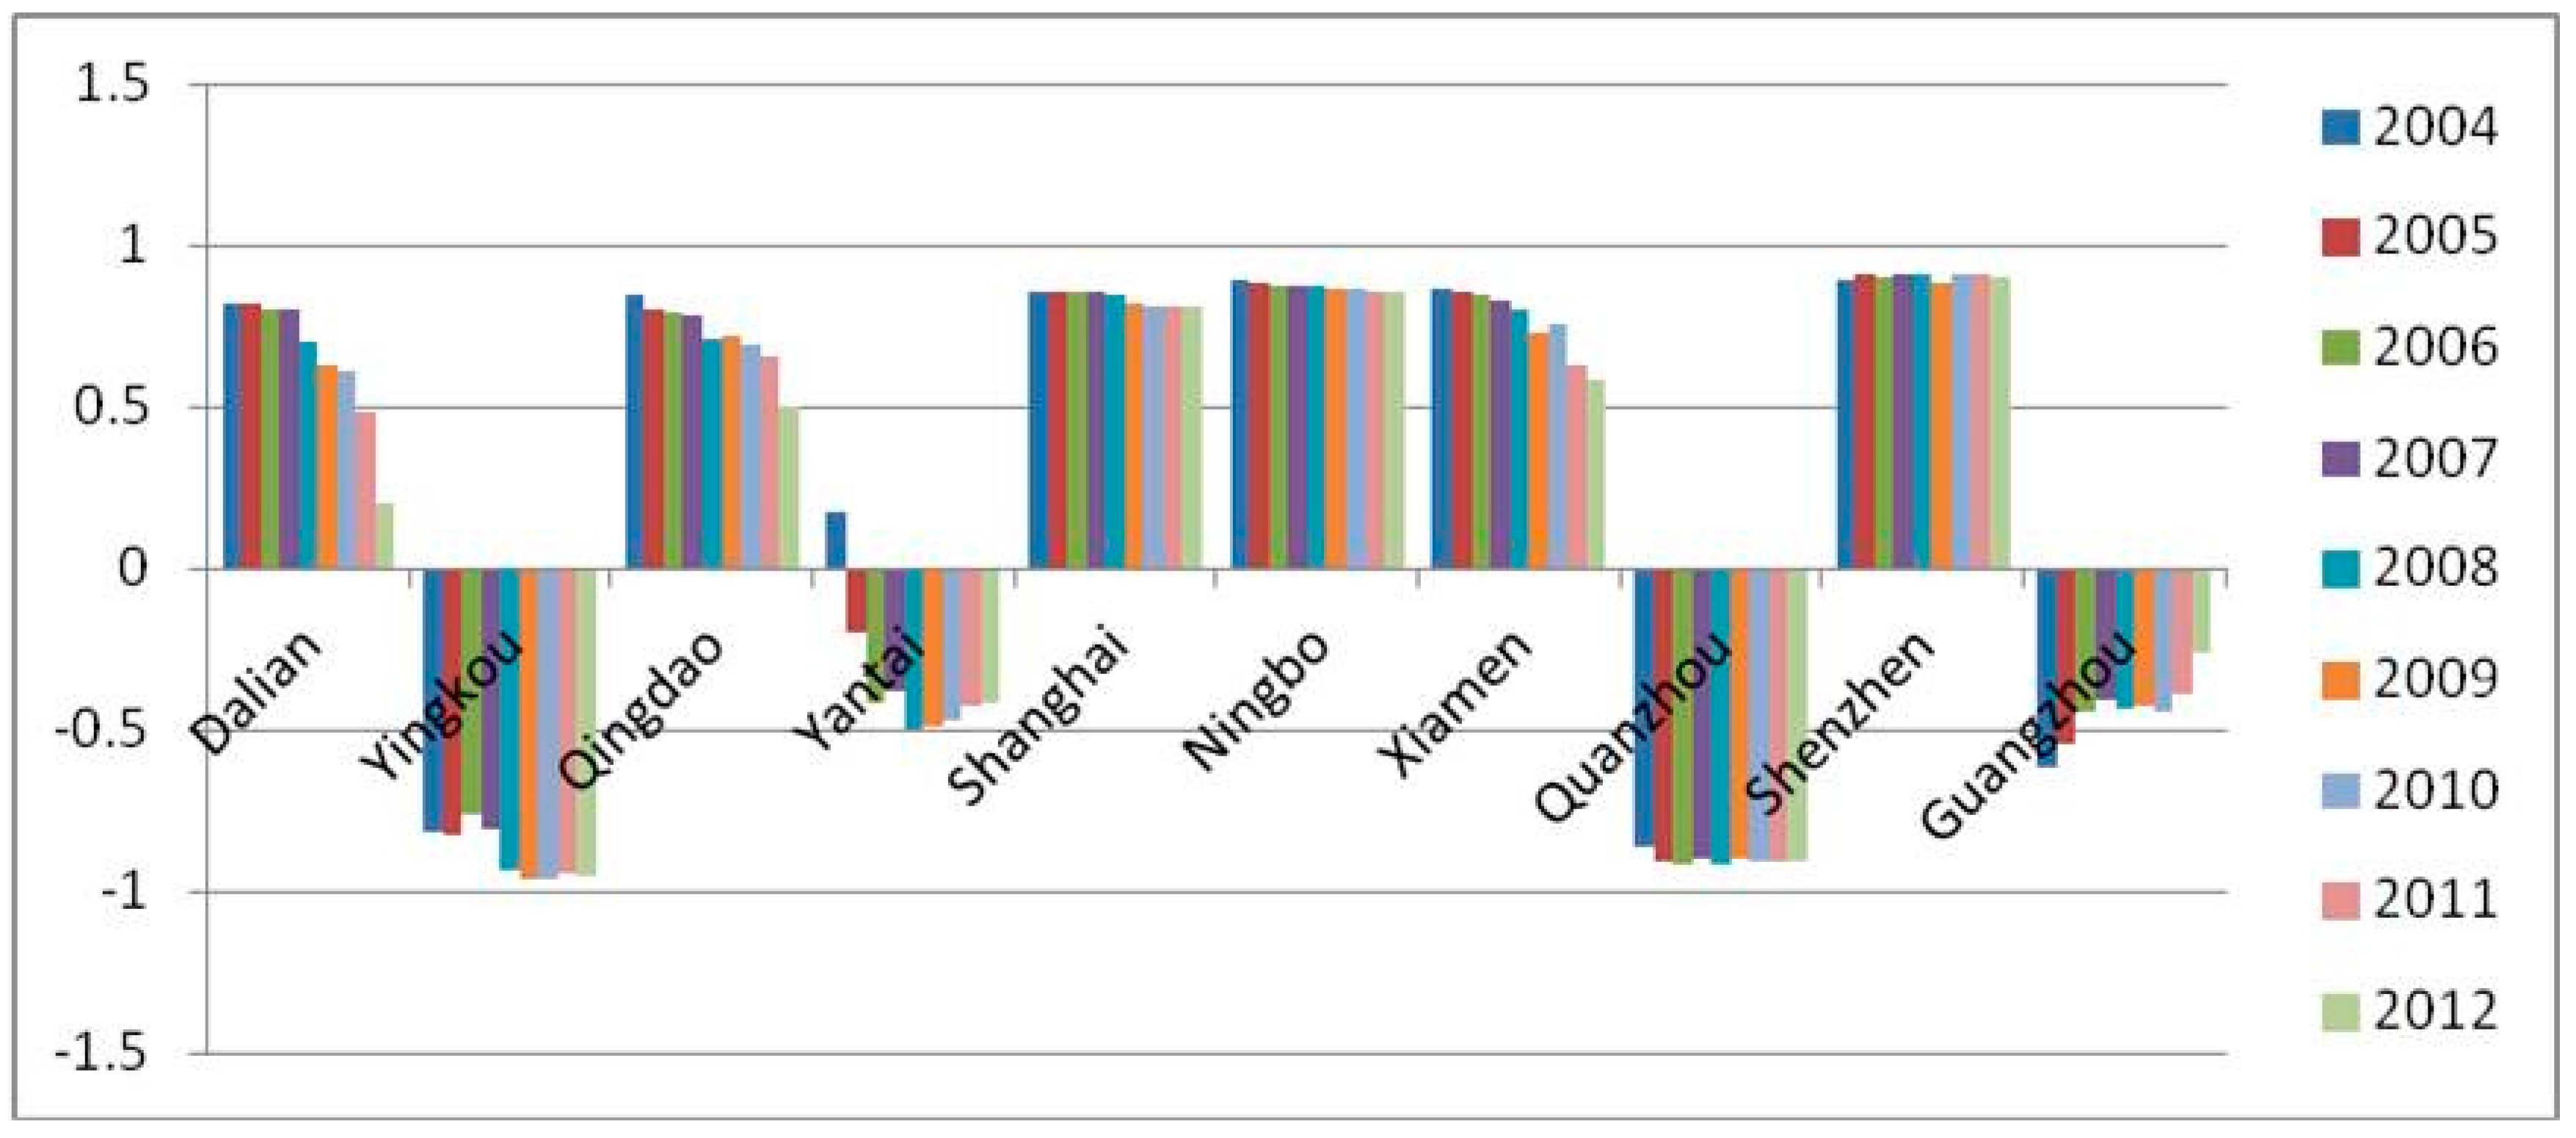
4.1. The First Layer: De-Concentration in Adjacent Ports

According to Table 2, five pairs of adjacent ports container throughput demonstrate a downward trend. In the adjacent ports, the proportion of the latter such as Yingkou, Yantai, Ningbo, Quanzhou and Guangzhou increased, which indicates that Yingkou, Yantai, Ningbo, Quanzhou and Guangzhou container throughput grew faster than neighboring ports Dalian, Qingdao, Shanghai, Xiamen and Shenzhen between 2004 and 2012. The neighboring ports create fierce competition. As mentioned before, the five pairs of port demonstrate the emergence of port system de-concentration. This phenomenon is similar to other research studies [51].

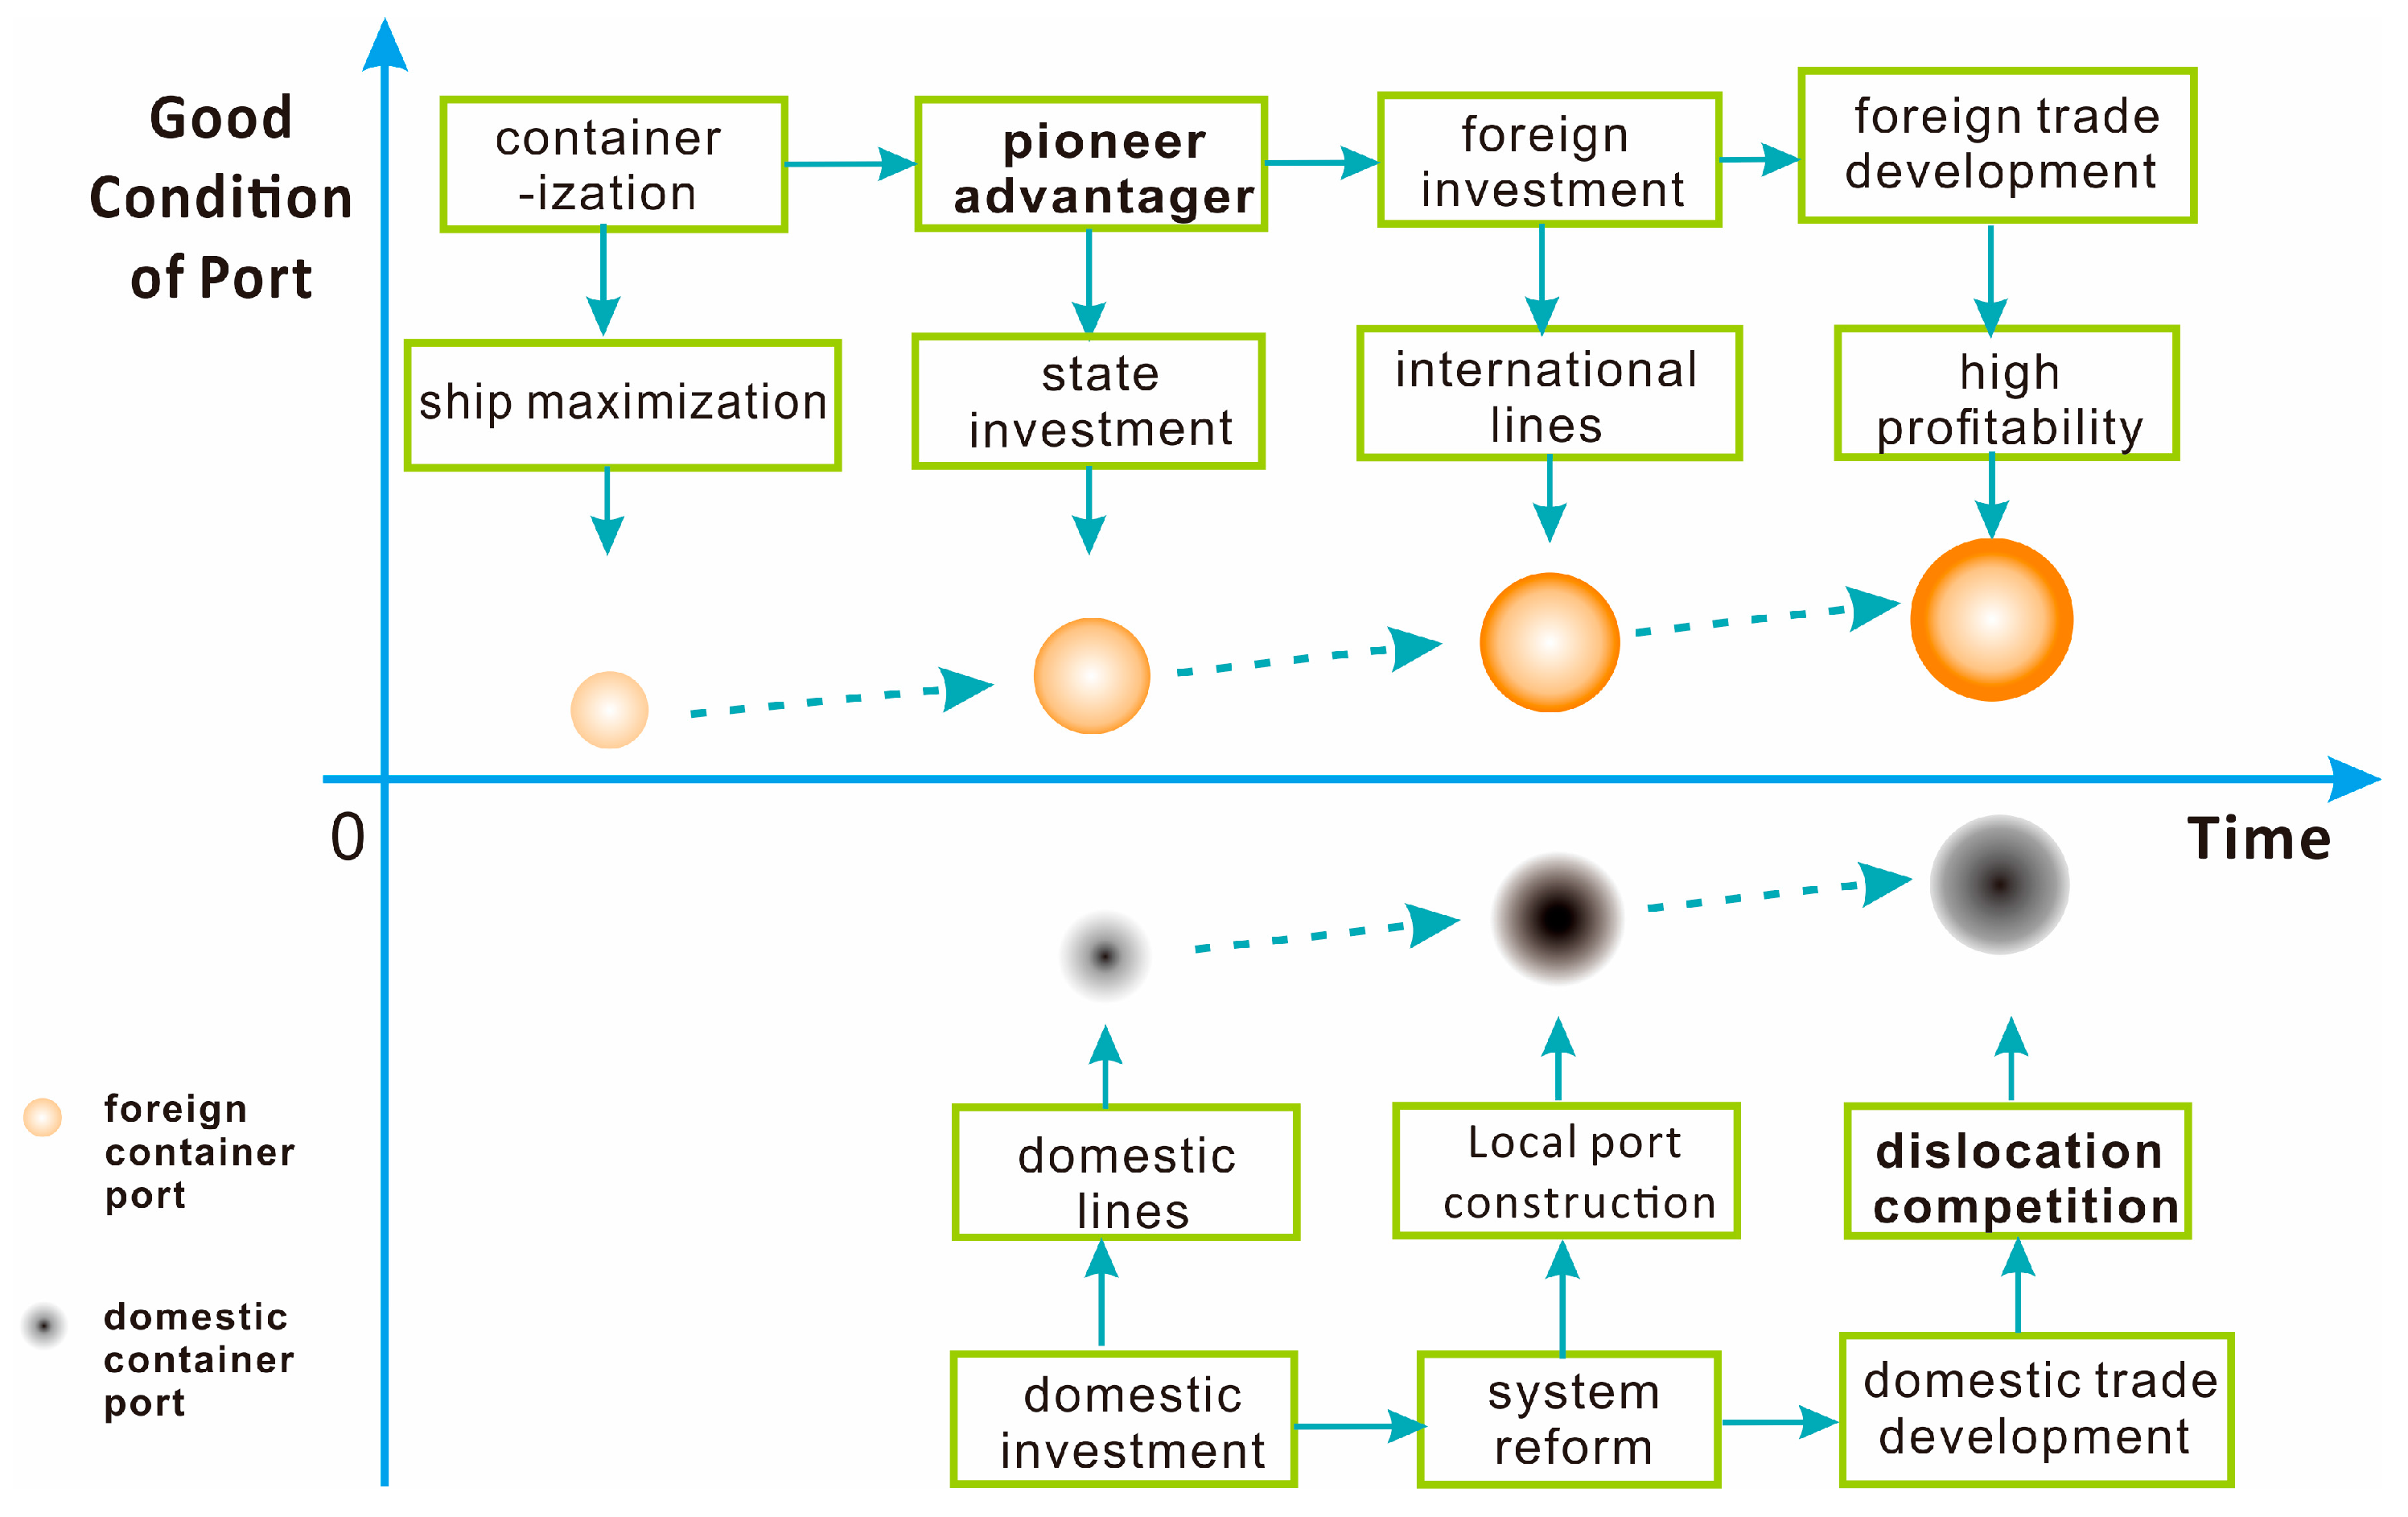
4.2. The Second Layer: Functional Differentiation in Foreign Container and Domestic Container

Each port total container throughput includes domestic and foreign trade. The proportion of domestic and foreign trade container throughput to total container throughput can indicate every port function in the port system. Based on Figure 2, five pairs of adjacent ports can be divided into two different types. One type relates to four pairs of adjacent ports: Dalian–Yingkou, Qingdao–Yantai, Xiamen–Quanzhou, and Shenzhen–Guangzhou. Dalian, Qingdao, Xiamen and Shenzhen have T C values close to 1. Thus, the above four ports dominated the role in foreign trade container transport. However, Yingkou, Yantai, Quanzhou and Guangzhou have T C values less than 0, and hence, these four ports are positioned in domestic trade container transport. Another type related to one pair of adjacent port—Shanghai and Ningbo. It is surprising that both these ports are focused on foreign trade container transport with T C values greater than 0.8.
Considering the proportion of domestic and foreign container throughput, the proportion of Dalian foreign and domestic container throughput to the total of container throughput has dramatically changed from 91:9 in 2004 to 60:40 in 2012 (Table 3). In general, foreign container has maintained dominant position even if there is a steady decline in the proportion of foreign containers. In Yingkou, the proportion of foreign and domestic container has changed from 9:91 in 2004 to 2:98 in 2012. It shows that Yingkou port became a domestic container port. In Qingdao, the proportion of foreign and domestic container has dramatically declined from 92:8 in 2004 to 75:25 in 2012. In Yantai, the proportion of foreign and domestic container has significantly changed from 59:41 in 2004 to 29:71 in 2012. In Xiamen, the proportion of foreign and domestic container has changed from 93:7 in 2004 to 79:21 in 2012. In Quanzhou, the proportion of foreign and domestic container has slightly changed from 7:93 in 2004 to 5:95 in 2012. In Shenzhen, the proportion of foreign and domestic container has remained the same (95:5) between 2004 and 2012. In Guangzhou, the proportion of foreign and domestic container has changed from 19:81 in 2004 to 37:63 in 2012. To conclude, four pairs of adjacent ports, Dalian–Yingkou, Qingdao–Yantai, Xiamen–Quanzhou, and Shenzhen–Guangzhou, show the former focused on foreign trade container transportation and the latter focused on domestic trade container transportation pattern.

4.3. The Third Layer: Functional Differentiation in Foreign Transshipment and Domestic Transshipment

In Figure 3, foreign transshipment and domestic transshipment are divided into two main types. One type relates to four pairs of adjacent ports, Dalian–Yingkou, Qingdao–Yantai, Xiamen–Quanzhou, and Shenzhen–Guangzhou. In the case of Dalian, Qingdao, Xiamen and Shenzhen, we found that T C value is greater than 0. Hence, the above four ports refer to foreign transshipment position. However, Yingkou, Yantai, Quanzhou and Guangzhou demonstrated that T C value had almost reached −1. Thus, we can conclude that the above four ports refer to domestic transshipment position. Shanghai and Ningbo is a special pair of adjacent port. Their T C value is greater than 0, indicating that Shanghai and Ningbo are positioned at foreign transshipment.
In Table 4, foreign and domestic transshipment can be classified into two main types. Dalian, Qingdao, Xiamen and Shenzhen focused on foreign transshipment while Yingkou, Yantai, Quanzhou and Guangzhou focused on domestic transshipment. In Dalian, foreign transshipment is decreasing while domestic transshipment is increasing. However, the proportion of foreign transshipment still accounts for 63%. In Yingkou, the majority of container activities have been domestic transshipment for the past eight years. It has reached nearly 100% between 2005 and 2012. Since 2005, Yingkou domestic transshipment only reached the minimum point of 85% in 2012. In Qingdao, the proportion of foreign transshipment has reached almost 100% and the minimum level was only 91% in 2012. In Yantai, the proportion of domestic transshipment has reached 99%. In Xiamen, the proportion of foreign transshipment has continually decreased from 88% in 2005 to 51% in 2012 while the proportion of domestic transshipment dramatically increased from 12% in 2005 to 49% in 2012. Foreign transshipment still dominates in Xiamen port. In Quanzhou, domestic transshipment has recorded more than 94% and foreign transshipment has played minimal role (i.e., 6% of foreign transshipment in 2012). Indeed, the role of foreign transshipment in Shenzhen is declining. The proportion of foreign transshipment has continually decreased from 91% in 2005 to 79% in 2012 while the proportion of domestic transshipment has significantly increased from 9% in 2005 to 21% in 2012. Foreign transshipment still dominates in Shenzhen port. In Guangzhou, domestic transshipment has decreased between 2007 and 2009. It started to increase and surpassed 93% in 2010. On the one hand, Dalian, Qingdao, Xiamen and Shenzhen demonstrate the decline in foreign transshipment. However, foreign transshipment is still in dominant position in the above ports. On the other hand, domestic transshipment maintains the key positions in the adjacent ports Yingkou, Yantai, Qunazhou and Guangzhou. The Shanghai and Ningbo port pair is the special case. Shanghai has recorded >80% foreign transshipment. The highest point reached 94% in 2010. Ningbo foreign transshipment has increased from 63% in 2005 to 88% in 2012. Both Shanghai and Ningbo focus on foreign transshipment containers.
There is de-concentration in adjacent ports. However, under de-concentration, there is a functional differentiation in adjacent ports. One focuses on foreign containers and the other focuses on domestic containers.

5. Functional Differentiation Mechanism

Hayuth adopted hub port dis-economies of scale to explain the trend of de-concentration of port system pertaining to ports facing a lack of space for expansion and traffic bottlenecks in the land and sea hinterland [23]. In addition, fierce competition of ports, international trade, multimodal transport integration, technological innovation, government policy and different routings creates a de-concentration in port system [23,25,46,52]. Container ship maximization tends to select ports that have deep-water channels [33]. The extensive rail and road transport networks stimulate the hinterland development [23]. Why does port de-concentration bring about adjacent port functional differentiation? This paper proposes that pioneer advantage and dislocation competition are the adjacent ports functional differentiation mechanism. The port functional differentiation process is shown in Figure 4. As time goes by, the port grows continuously. Y-axis represents the good conditions of port, for example, natural resources, climate, location, individual expertise and skills, know-how, infrastructure, technology and communication [53]. The positive side shows the port has comparative advantage in the regions.

5.1. Deep Water Conditions for Different Port Development

As ship size becomes wider and larger and generally deeper draught, there is the natural tendency to use ports that have deep-water harbors. In 1999, six container ports in China could accommodate Post-Panamax vessels: Shanghai, Shenzhen, Qingdao, Tianjin, Dalian and Ningbo. The berth and channel depth have reached between 12 and 14 m. At that time, Guangzhou, Yingkou, Yantai and Quanzhou could not serve similar vessels, leading to difficulties in generating profitability. By the end of 1999, 51 ports in China had opened international liner shipping services. Some container ports, notably Shanghai, Shenzhen, Qingdao, Tianjin and Dalian, offered weekly, regular ocean-going liner shipping services. The frequency of liner shipping services could meet the existing market demand. According to statistical records, 279 liner vessels selected ports, concentrating on Shanghai, Shenzhen, Qingdao, Tianjin, Dalian and Ningbo [54]. Expanding liner shipping routings, increasing liner shipping schedule, and enhancing operating efficiency not only improved transit time, but also facilitated transshipment. Other ports had less comprehensive shipping network coverage and fewer liner shipping schedules, leading to a slow growth of cargo volume and throughputs.
In the 1990s, Guangzhou had a physical limitation of water depth and hence could not accommodate the bigger vessels. Only the first and second generation of 2000 TEUs container vessels operating among Japan, Southeast Asia and Australia, as well as barging services between Hong Kong and Macau could enter Guangzhou port. Indeed, Guangzhou Huangpu district only had 9 m water depth which has restricted 1000 TEUs or below container vessels. To counter this weakness, Nansha Port phase 1 began construction in September 2004. From that time, Guangzhou port has a specialized deep-water container terminal to develop shipping activities. During this period, Yingkou, Yantai, and Quanzhou also faced a similar problem to Guangzhou [55]. The first container terminal of Yingkou port had only 309 m shore along the pier in the first half of the 1990s. In April 2000, Yingkou port moved to the second basin of 424 m terminal along the shore and added two cranes. Yingkou port faced a changing point in August 2003. Yingkou port has completed four phases of construction including a 4 km new, specialized and modernized container terminal along the shore and 5 million m2 of container yards. Yingkou terminal berths have increased capacity significantly. Initially, Yingkou terminal berths served only two 600 TEUs container vessels. Nowadays, Yingkou terminal berths can accommodate ten 4250 TEUs container vessels simultaneously [56]. However, 4000 TEUs container vessels are not suitable for international trade. Quanzhou port carriage capacity had only reached 2700 TEU container vessels in 2008. Thus, Quanzhou Bay has constructed an artificial navigation channel. The artificial navigation channel has 250 m width with 12.5 m water depth where 50,000-ton cargo vessels can freely enter into Quanzhou Bay [57].
Because of shallow water conditions, ports such as Yingkou, Yantai, Quanzhou, and Guangzhou adapted to container ships, and later especially the foreign trade container. After the adjacent ports have built the network of foreign trade container, to achieve sustainable development, Yingkou, Yantai, Quanzhou, and Guangzhou had to expand the development of domestic trade container. The domestic trade container’s profit is not large; however, shallow-water port facilities can accept domestic trade ships.

5.2. The Introduction of Foreign Investment and Routings

China container transport and terminals developed late. China foreign trade and port import and export activities grew substantially between the late 1970s and the early 1980s. Three ports (Tianjin, Shanghai and Guangzhou) used the first World Bank loan to build the first batch of China coastal container terminals. In 1986, the State Council promulgated the “Provisional Regulations on Sino-foreign joint construction of pier preferential treatment” which marked opening the door to international capital. In the mid-1980s, Qingdao and Shanghai built a number of multi-purpose container terminals. In 1993, the Chinese government created a favorable environment for deepening the strategy in the course of reform and opening-up. During this period, the Chinese government aimed to encourage joint ventures to operate public terminal berths, allow joint ventures to lease terminals, allow Chinese and foreign companies to collaboratively operate stevedore businesses, and provide the rights to foreign companies to establish specialized terminals and navigation channels. This symbol had started from Shanghai Container Terminal Limited in 1993. This company formed a joint venture between Hong Kong Hutchison Whampoa Limited and Shanghai Port Container Comprehensive Development Company. The total investment reached RMB 5.6 billion and Hong Kong Hutchison Whampoa Limited has a 50% share. Later, Hong Kong Hutchison Whampoa Limited formed joint venture with Shenzhen Yantian Port Group to establish Yantian International Container Terminals Limited. The registered capital is worth HKD 2.4 billion and Hong Kong Hutchison Whampoa Limited has a 73% share. In the 1990s, a number of advanced, highly efficient, and large throughput capacity container terminals were established in Xiamen, Dalian, Qingdao, Ningbo, Shenzhen (Yantian, Shekou and Chiwan), and Shantou (see Table 5).
Foreign investment played a significant role in port development. In 2001, the Chinese government provided only 10% investment funding for the hub port terminals. These little subsidiaries could not support large scale port construction project. Extensive foreign investment stimulates the rapid and sustainable port development in Shanghai, Shenzhen, Qingdao, Dalian, Ningbo, and Xiamen.
Foreign investment not only eased capital investment pressure, it also significantly improved China container terminals facilities, operations, management and technology. Some joint venture China container terminals advanced degree, operational efficiency and management level have been reached at international standard. Hence, there is a significant gap between joint venture and state-operated China container terminals.
Recently, top liner shipping companies, e.g., Maersk Line, Evergreen, OOCL, etc., have invested in the container terminals in Shanghai and Shenzhen. It could achieve first mover advantages in establishing liner shipping networks and increasing the frequency of port of calls [58].
As domestic containers are not open to foreign shipping companies, COSCO and China Shipping Container Lines were the main domestic container shipping companies. Hence, COSCO and China Shipping Container Lines become the target partners with Yingkou, Yantai, Quanzhou, and Guangzhou (see Table 6). Liner shipping companies have been introduced to invest in Guangzhou Nansha port construction project. China Shipping Container Lines has a 49% share in Nansha port construction project phase 1. Later, COSCO has a 39% share in Nansha port construction project phase 2. Thus, Nansha port could gain competitive advantages of large capital inflow and routings establishment.

5.3. Port Administration Systems Changes and Government Pressure

There are three phases in China port administration. In the first phase, China port administration systems have been governed by Chinese central government. In the second phase, the mechanism is the dual leadership of the central government and different provinces and then decentralized administration rights to different ports [28]. Since 1984, Chinese government has carried out significant port systems revolution in the coastal regions and Yangtze River. This creates Qinhuangdao port, which is under central government administration. Thirty-seven ports in coastal regions and Yangtze River are under the dual leadership of the central government and different provinces. The port management regime is provincial. Port administration right was decentralized to provinces in 2002. It has transformed from the central administration planning to local administration. Port enterprises fixed tax payment approach has been cancelled and income tax payment approach has been introduced.
The prime role of central government is to optimize the layout of coastal ports through a series of plans. In 2006, the Ministry of Communication issued National Coastal Port Layout Plan. It strengthened Dalian, Qingdao, Shanghai, Ningbo, Xiamen, Shenzhen and Guangzhou as the container hub ports, while recognizing Yingkou, Yantai and Quanzhou as feeder ports. In addition, the central government controls deep-water coastline port approval rights. According to Port Construction Management regulation (2007) and Port Coastline Approval Management Approach (2012), deep-water coastline coastal ports (i.e., applicable for the construction of various types of berths of 10,000 tons above) are required to obtain approval by the Ministry of Communication and the State Reform Committee. The shallow-water coastline coastal ports are required to get approval from the port administration management.
Provinces play a significant role in port planning and construction. Some ports and provinces suggested “Port City” strategy to conduct large scale port construction in China [31]. From the perspective of provinces, container throughput is a critical performance indicator of container ports. Container throughput will be recorded in each port city annual government report and then submitted to the National People’s Congress and society for review. Sometimes the leaders of the port authority are appointed or sacked by the provincial government depending on the port’s throughput. Container throughput becomes an important goal to pursue provinces and port authority. They often develop domestic container trade first because domestic container trade can be developed quickly without water depth, excellent management or reputation.

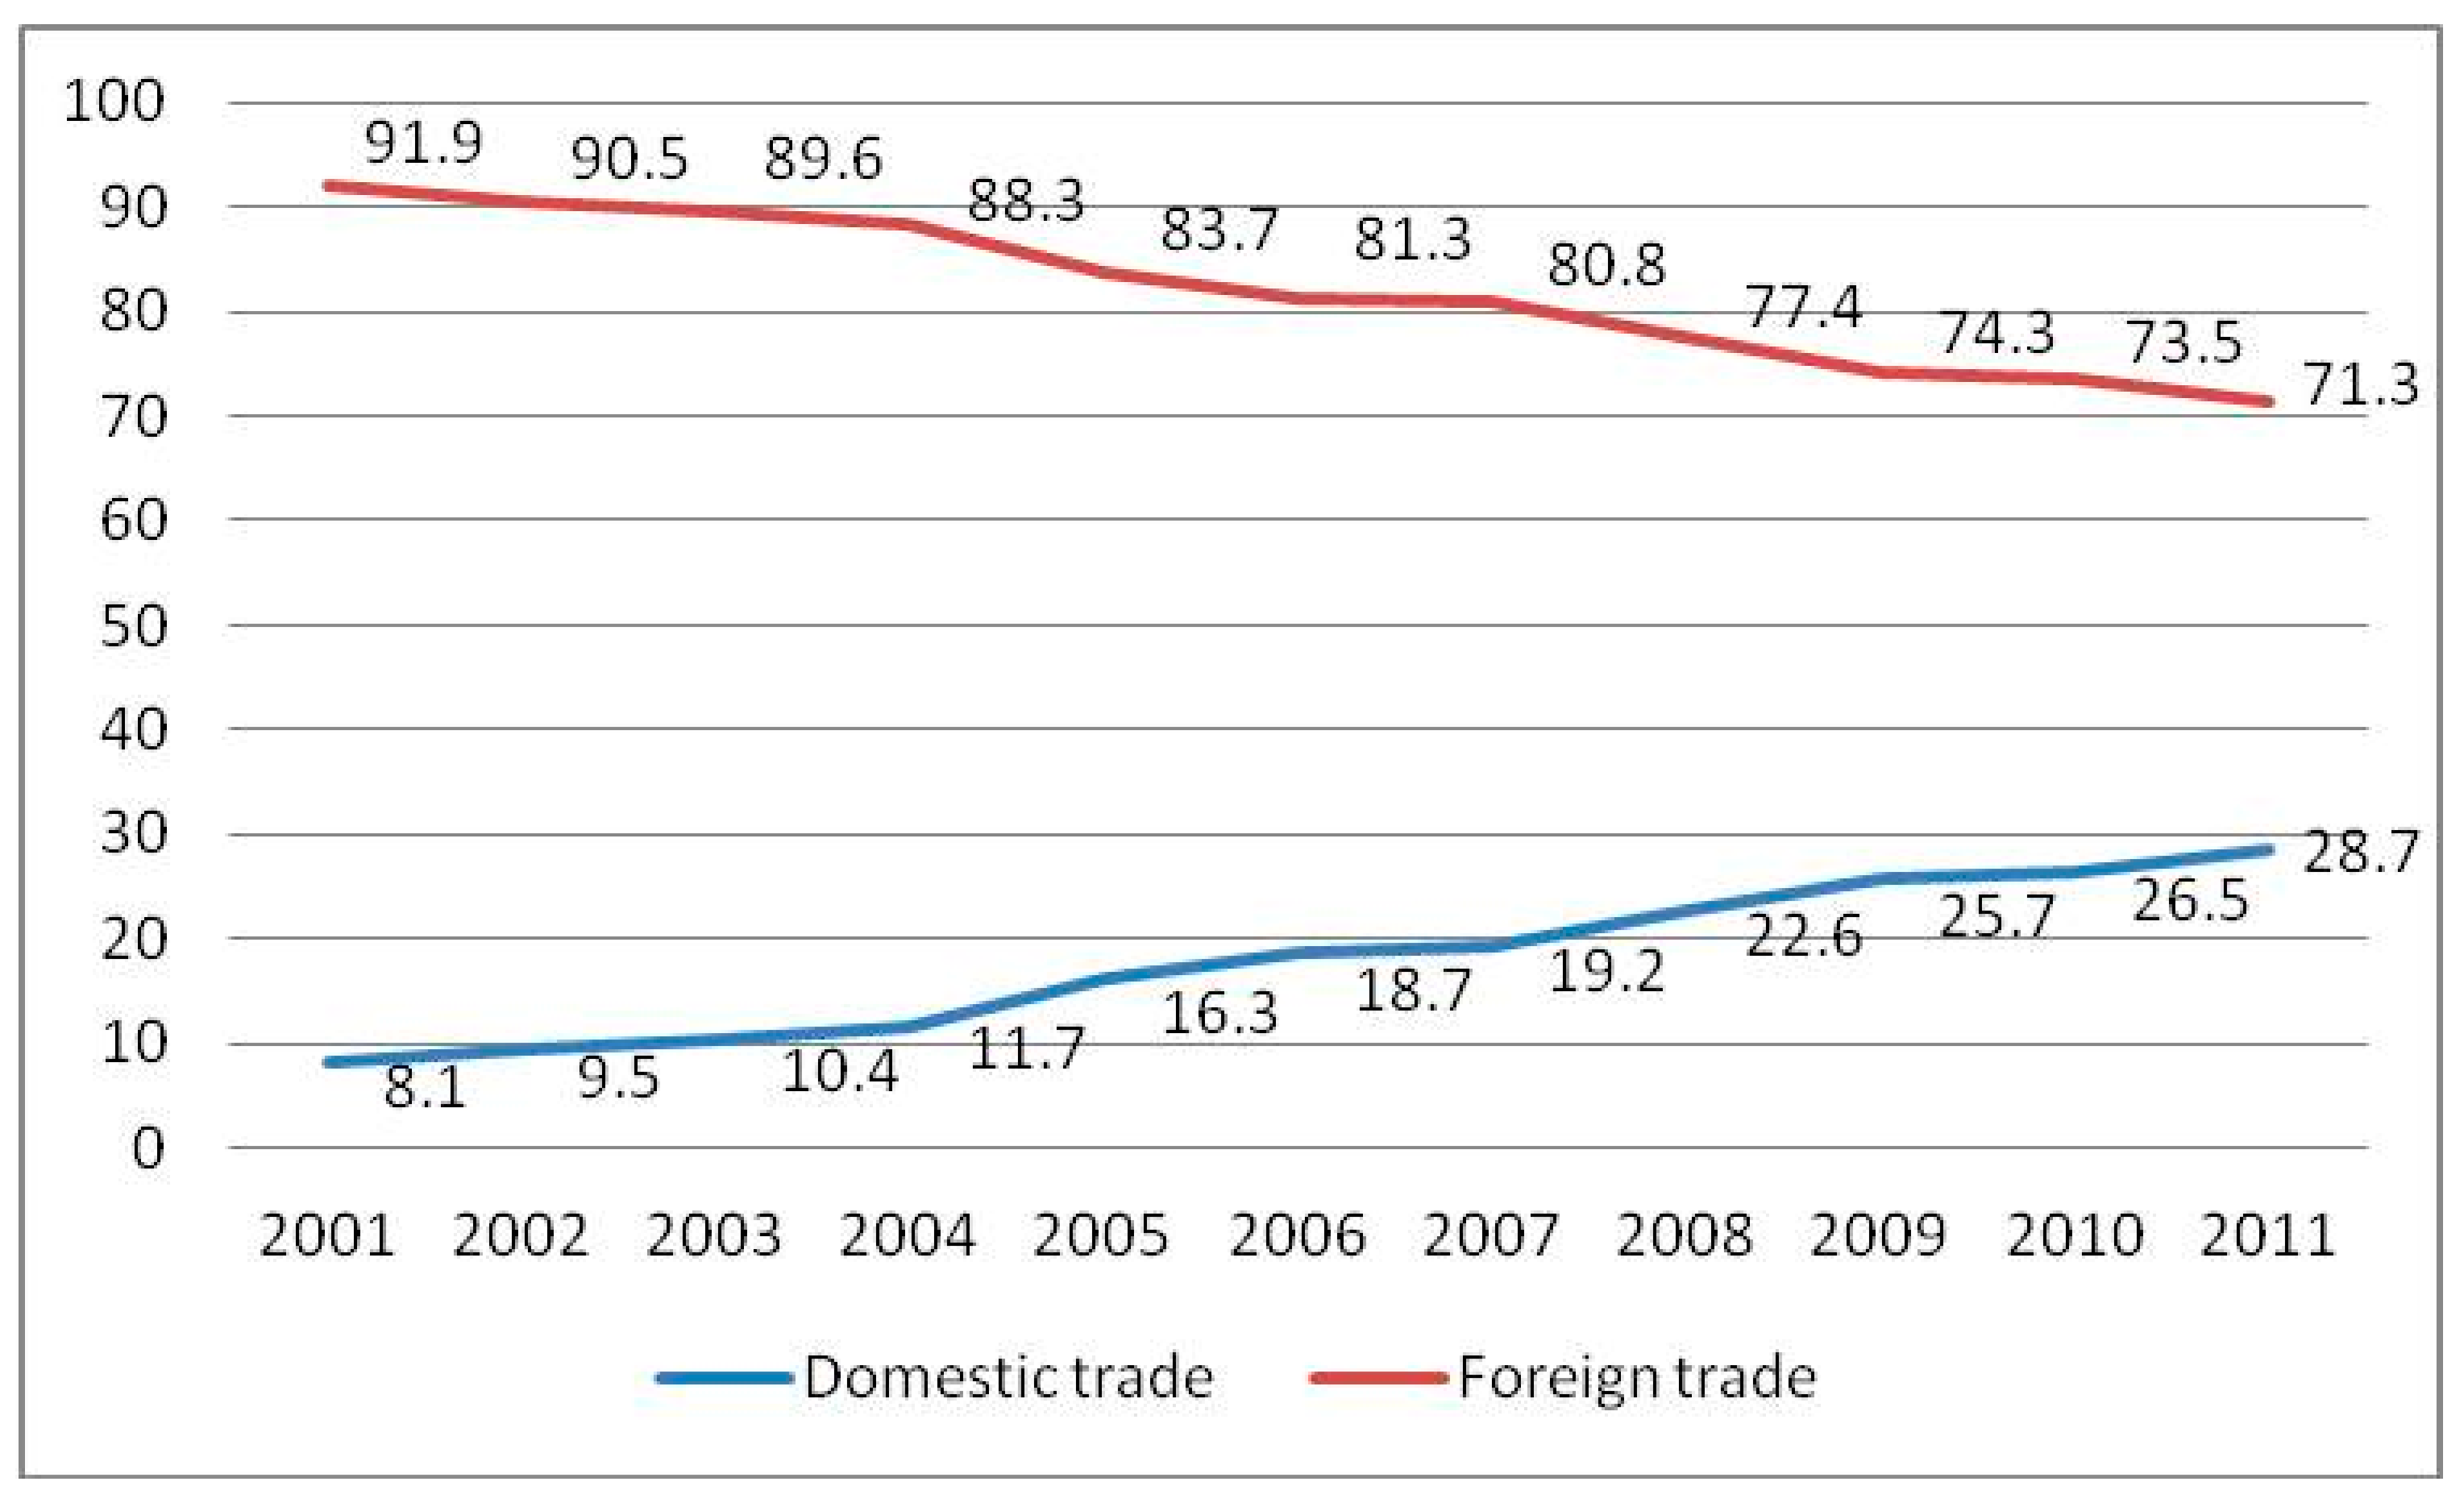
5.4. Domestic Trade and Port Systems Decentralization

China’s container port development evolved from the foreign container service which played a primary role, while the domestic service played a supplementary role. In December 1996, Shanghai Lung Wu Port Corporation launched the first domestic container routings in China. It has engaged two specialized berths in Shanghai Lung Wu Port. In March 1997, Shanghai Hai Xing Shipping Container Lines Company Limited also opened domestic container routings in China. It has invested two 614 TEUs international standardized container vessels. China domestic container development has developed at a later stage, but it has shown a rapid growth rate. The domestic container throughput has increased from 2.21 million TEUs in 2001 to 52.53 million TEUs in 2011 and had driven a growth rate of 23.8 times for a decade. The proportion of China’s container throughput had dramatically risen from 8.1% in 2001 to 28.7% in 2011 (see Figure 5).
Compared with foreign container, the standard handling charges of domestic container are relatively low. Now, each port implements the 2000 version of Domestic Sea Container Port Charges Approach which is published by Department of Transportation of the Chinese government. The handling charges of 20′ and 40′ containers are RMB 220 and RMB 330, respectively. The Chinese government allows the port authorities to charge handling fees based on cost-based approach. There are 20% floating of cost in each port. To compete with cargo sources, ports could not consider 20% floating of cost approach, whereas ports provide incentives and subsidies to shippers and liner shipping companies. During these ten years, domestic container handling charges could not catch up to rising operational cost (i.e., fuel, electricity and labor). Domestic container handling charges are only 50% of foreign container handling charges [59]. Hence, some busy and big ports are not willing to develop domestic container trade because of the low handling fee. For instance, Shenzhen would not be involved in any domestic container trade in Pearl River Delta. Up to now, only Shekou provides domestic container activities in Shenzhen. To establish the largest home cruise port, Prince Bay in South China region around December 2011, Shekou has transformed three domestic container berths into cruise ship berths. It clearly demonstrates that Shenzhen port has considered moving out domestic container trade competition [60]. To the hub ports, transshipping the foreign container trade can keep the sustainable development.
The international financial crisis and China’s foreign trade downturn exert pressure on China coastal ports sustainable development. To deal with these unfavorable circumstances, the Chinese government promotes domestic demand policy. Domestic container market becomes an important source of cargo growth. In the aspects of transportation model, domestic cargo (i.e., change from bulk-cargo to container pattern) also brings the sustainable growth of China coastal ports. For example, Yingkou Port changed the domestic cargo from bulk-cargo to container pattern from 1999. Some bulk commodities such as starch, corn, cars, coils, pipes and liquid chemicals have been packed into containerized cargo. After that, the volume of domestic container has increased significantly. Yingkou Port bulk cargo volume has reached 10 million tons and the container volume has increased 400,000 TEUs in 2011.
On the one hand, appropriate cargo stimulates domestic container volumes. On the other hand, domestic containers offer lower handling charges. These two main reasons give the ports dislocation development opportunities. For example, Guangzhou, Yingkou, Yantai, and Quanzhou have a lack of fundamental conditions to develop foreign container ports. Hong Kong and Shenzhen have developed a more mature foreign container market than Guangzhou and hence, Guangzhou developed domestic based container port. Another example is Xiamen and Fuzhou has a comparative advantage of developing foreign container port in Fujian Province. Additionally, Quanzhou port has a natural advantage in forming domestic container port. Quanzhou not only imported more than ten million tons of grain, steel, and coal from northern regions, but also exported a large volume of commodities such as shoes, garments, ceramics, tiles, and stone plates to northern regions. The majority of these commodities are expected to use containers through waterway. This facilitates domestic container throughput; thus, Quanzhou is ranked the sixth domestic container port in China [61].

6. Conclusions

In this paper, we analyzed China’s port systems evolution. In the first layer, China port systems present a de-concentrated phenomenon. This reflects de-concentration and competition in adjacent ports. In the second layer, there is functional differentiation in adjacent ports. Some ports are focused on foreign trade while other ports are focused on domestic trade to achieve sustainable development. The influence of central government uniform planning and regular market economic pattern avoid the duplication of port construction within the same cluster as well as achieve rational resource allocation of deep-water coastline coastal ports. Each port creates functional differentiation and orderly competition. Accordingly, it facilitates the sustainable use of coastline at the national level and maximizes the port benefits at the local level.
Our studies considered different perspectives of pioneer advantage and dislocation competition to explain the mechanisms of Chinese port functional differentiation. Larger size of container vessels put a higher demand for the ports. Some ports such as Dalian, Qingdao, Xiamen, and Shenzhen have a deep-water draught, which generate pioneer advantages. These ports definitely attract foreign direct investment. The multinational firms not only bring investments, but also excellent management, advanced technology, sound reputation, and a wide variety of shipping routes. Since the provinces received greater port management power, container throughput has become a significant performance indicator. Up to now, Dalian, Qingdao, Xiamen, and Shenzhen have well-established foreign trade networks. How can adjacent ports further develop and catch up? On the one hand, China’s economy model has been significantly changed and domestic demand become critically important, especially after the financial crisis in 2008. Domestic container is treated as one potential market in China port industry. On the other hand, domestic container transport generates low profitability, so foreign container orientated ports ignore domestic container sector. These main reasons give adjacent ports, including Yingkou, Yantai, Quanzhou, and Guangzhou, space to develop domestic container trade. This dislocation development leads to adjacent ports achieving sustainable economic development.
Compared with the four other pairs of adjacent ports, Shanghai and Ningbo is unique as both ports are focused on foreign trade. The common characteristics of two ports are: (1) deep water depth; (2) excellent geographical location; (3) export-oriented hinterland economy; and (4) close foreign investment relationships. Originally, Shanghai was a river port. The larger sizes of vessels generated pressure on deep-water depth. Thus, the Shanghai Municipal Government gained support from the central government in 2002. Shanghai collaborated with Zhejiang Province to establish the offshore hub in Yangshan district. Yangshan district could solve the shortcomings in Shanghai water depth issues. Without the offshore hub in Yangshan district, Shanghai port foreign trade routings might have moved to Ningbo port, and Shanghai would have hat to focus on domestic container, creating functional differentiation.
In the future, China’s “World Factory” position will weaken and domestic demand market will be enlarged. The proportion of domestic trade will be continually increased. Hence, domestic trade-oriented ports will reinforce domestic trade transport. Meanwhile, they will strive to improve the conditions of port navigation and absorb foreign trade cargo transport. Besides, foreign trade-oriented ports such as Shanghai and Shenzhen are currently adversely affected by unfavorable trade environment. To sustain port economic development, these ports will be diverted into high-end shipping services; for example, shipping finance, maritime insurance, cruise shipping, and so on.

Acknowledgments

This work was supported by the Research Grant of the National Natural Science Foundation of China (Grant No. 41371140 and 41401149), Major projects of National Social Science Fund of China (Grant No. 11&ZD092 and 16ZAD016).

Author Contributions

Liehui Wang collected and analyzed the data. Liehui Wang and Yui-yip Lau wrote the manuscript. Theo Notteboom and Adolf K.Y. Ng edited and revised the paper. All authors read and approved the manuscript.

Conflicts of Interest

The authors declare no conflict of interest.

References

  1. UNCTAD. Review of Maritime Transport, United Nations Conference on Trade and Development. Available online: http://www.unctad.org (accessed on 6 February 2017).
  2. Hiranandani, V. Sustainable development in seaports: A multi-case study. WMU J. Marit. Aff. 2014, 13, 127–172. [Google Scholar] [CrossRef]
  3. Davarzani, H.; Fahimnia, B.; Bell, M.; Sarkis, J. Greening ports and maritime logistics: A review. Transp. Res. Part D 2016, 48, 473–487. [Google Scholar] [CrossRef]
  4. Sislian, L.; Jaegler, A.; Cariou, P. A literature review on port sustainability and ocean’s carrier network problem. Res. Transp. Bus. Manag. 2016, 19, 19–26. [Google Scholar] [CrossRef]
  5. China Port Association. Chinese Port Yearbook (2014); Chinese Port Magazine Publisher: Shanghai, China, 2014. (In Chinese) [Google Scholar]
  6. China Port Association. Chinese Port Yearbook (2011–2013); Chinese Port Magazine Publisher: Shanghai, China, 2011–2013. (In Chinese) [Google Scholar]
  7. Subhan, M.; Ghani, A.B.A. An analytic hierarchy process approach in formulating growth strategy of a port system: A case study of Aceh ports in Indonesia. In Proceedings of the 3rd International Forum on Shipping, Ports and Airport, Chengdu, China, 15–18 October 2010; pp. 196–207.
  8. Fremont, A. Global maritime networks: The case of Maersk. J. Transp. Geogr. 2007, 15, 431–442. [Google Scholar] [CrossRef]
  9. Ng, A.K.Y. The evolution and research trends of port geography. Prof. Geogr. 2013, 65, 65–86. [Google Scholar] [CrossRef]
  10. Bird, J. Ports and Harbors, 2nd ed.; Hutchinson: London, UK, 1961. [Google Scholar]
  11. Bird, J. The Major Seaports of the United Kingdom; Hutchinson: London, UK, 1963. [Google Scholar]
  12. Bird, J. Seaports and Seaport Terminals; Hutchinson: London, UK, 1971. [Google Scholar]
  13. Taaffe, J.; Morrill, R.L.; Gould, P.R. Transport expansion in underdeveloped countries: A comparative analysis. Geogr. Rev. 1963, 53, 503–529. [Google Scholar] [CrossRef]
  14. Rimmer, P.J.; Comtois, C. China’s container-related dynamics, 1990–2005. GeoJournal 2009, 74, 35–50. [Google Scholar] [CrossRef]
  15. Wang, J.J.; Oliver, D.; Notteboom, T.; Slack, B. Ports, Cities and Global Supply Chains; Ashgate: Aldershot, UK, 2007. [Google Scholar]
  16. Mayer, H.M. Current trends in Great Lakes shipping. GeoJournal 1978, 2, 117–122. [Google Scholar] [CrossRef]
  17. Rimmer, P.J. Recent changes in the status of seaports in the New Zealand coastal trade. Econ. Geogr. 1967, 43, 231–243. [Google Scholar] [CrossRef]
  18. Hilling, I.D. The evolution of a port system: The case of Ghana. Geography 1977, 62, 97–105. [Google Scholar]
  19. Ogundana, B. The location factor in changing seaport significance in Nigeria. Niger. Geogr. 1971, 14, 71–88. [Google Scholar]
  20. Hoyle, B.; Charlier, J. Inter-port competition in developing countries: An East African case study. J. Transp. Geogr. 1995, 3, 87–103. [Google Scholar] [CrossRef]
  21. Rimmer, P.J. The changing status of New Zealand seaports, 1853–1960. Ann. Assoc. Am. Geogr. 1967, 57, 88–100. [Google Scholar] [CrossRef]
  22. Rimmer, P.J. The search for spatial regularities in the development of Australian seaports 1861–1961. Geogr. Ann. Ser. B Hum. Geogr. 1967, 49, 42–54. [Google Scholar] [CrossRef]
  23. Hayuth, Y. Containerization and the load center concept. Econ. Geogr. 1981, 57, 160–176. [Google Scholar] [CrossRef]
  24. Notteboom, T.E.; Rodrigue, J.P. Port regionalization: Towards a new phase in port development. Marit. Policy Manag. 2005, 32, 297–313. [Google Scholar] [CrossRef]
  25. Ducruet, C. Going West? Spatial polarization of the North Korean port system. J. Transp. Geogr. 2009, 17, 357–368. [Google Scholar] [CrossRef]
  26. Notteboom, T.E. Challenges for container river services on the Yangtze River: A case study for Chongqing. Res. Transp. Econ. 2012, 35, 41–49. [Google Scholar] [CrossRef]
  27. Yuen, C.L.A.; Zhang, A.; Cheung, W. Port competitiveness from the users’ perspective: An analysis of major container ports in China and its neighboring countries. Res. Transp. Econ. 2012, 35, 34–40. [Google Scholar] [CrossRef]
  28. Wang, J.J.; Slack, B. The evolution of a regional container port system: The Pearl River Delta. J. Transp. Geogr. 2000, 8, 263–275. [Google Scholar] [CrossRef]
  29. Slack, B.; Fremont, A. Fifty years of organizational change in container shipping: Regional shifts and the role of family firms. GeoJournal 2009, 74, 23–34. [Google Scholar] [CrossRef]
  30. Chan, W.Y.T.; Yip, T.L. Port spatial development and theory of constraints. In Proceedings of the 3rd International Forum on Shipping, Ports and Airport, Chengdu, China, 24–27 May 2009; pp. 421–430.
  31. Cullinane, K.; Teng, Y.; Wang, T. Port competition between Shanghai and Ningbo. Marit. Policy Manag. 2005, 32, 331–346. [Google Scholar] [CrossRef]
  32. Lee, S.Y.; Rodrigue, J.P. Trade reorientation and its effects on regional port systems: The Korea–China link along the Yellow Sea Rim. Growth Chang. 2006, 37, 597–619. [Google Scholar] [CrossRef]
  33. Comtois, C.; Dong, J. Port competition in the Yangtze River Delta. Asia Pac. Viewp. 2007, 48, 299–311. [Google Scholar] [CrossRef]
  34. Notteboom, T.E. Strategic challenges to container ports in a changing market environment. In Devolution, Port Governance and Port Performance; Brooks, M.R., Cullinane, K., Eds.; Elsevier: Oxford, UK; Amsterdam, The Netherlands, 2007; pp. 29–52. [Google Scholar]
  35. Wang, J.J.; Oliver, D. Shanghai and Ningbo: In search of an identity for the Changjiang Delta Region. In Asian Container Ports. Development, Competition and Co-Operation; Cullinane, K., Song, D.W., Eds.; Palgrave Macmillan Ltd.: New York, NY, USA, 2007; pp. 183–197. [Google Scholar]
  36. Cheung, R. The transition from freight consolidation to logistics: The case of Hong Kong. J. Transp. Geogr. 2003, 11, 245–253. [Google Scholar] [CrossRef]
  37. Loo, B.P.Y.; Hook, B. Interplay of international, national and local factors in shaping container port development: A case study of Hong Kong. Transp. Rev. 2002, 22, 219–233. [Google Scholar] [CrossRef]
  38. Cao, Y.; Cao, W.; Jin, S. The evolution mechanism of the coastal container port system of China. Acta Geogr. Sin. 2003, 58, 424–432. (In Chinese) [Google Scholar]
  39. Cao, Y.; Li, H.; Chen, W. The spatial structure and the competition pattern of the container port system of China. Acta Geogr. Sin. 2004, 59, 1020–1027. (In Chinese) [Google Scholar]
  40. Han, Z. Distribution and container transportation network in China. Acta Geogr. Sin. 2002, 57, 479–488. (In Chinese) [Google Scholar]
  41. Wang, C. The Evolution Mechanism of Container Port Network; Science Press: Beijing, China, 2012. [Google Scholar]
  42. Notteboom, T.E. Traffic inequality in seaport systems revisited. J. Transp. Geogr. 2006, 14, 95–108. [Google Scholar] [CrossRef]
  43. Yap, W.Y.; Lam, J.S.L. Competition dynamics between container ports in East Asia. Transp. Res. Part A 2006, 40, 35–51. [Google Scholar] [CrossRef]
  44. Cheon, S.H.; Dowall, D.E.; Song, D.W. Evaluating impacts of institutional reforms on port efficiency changes: Ownership, corporate structure, and total factor productivity changes of world container ports. Transp. Res. Part E 2010, 46, 546–561. [Google Scholar] [CrossRef]
  45. Veenstra, A.; Notteboom, T. The development of the Yangtze River container port system. J. Transp. Geogr. 2011, 19, 772–781. [Google Scholar] [CrossRef]
  46. Hayuth, Y. Rationalization and de-concentration of the U.S. container port system. Prof. Geogr. 1988, 40, 279–288. [Google Scholar] [CrossRef]
  47. Cidell, J. Concentration and decentralization: The new geography of freight distribution in US metropolitan areas. J. Transp. Geogr. 2010, 18, 363–371. [Google Scholar] [CrossRef]
  48. Ducruet, C.; Lee, S.W.; Ng, A.K.Y. Centrality and vulnerability in liner shipping networks: Revisiting the Northeast Asian port hierarchy. Marit. Policy Manag. 2010, 37, 17–36. [Google Scholar] [CrossRef]
  49. Zhou, M. (Ed.) The World Atlas of Port Traffic; Sino Maps Press: Beijing, China, 2016. (In Chinese)
  50. Deardorff, A. The general validity of the law of comparative advantage. J. Political Econ. 1980, 88, 941–957. [Google Scholar] [CrossRef]
  51. Li, K.X.; Luo, M.; Yang, J. Container port system in China and the USA: A comparative study. Marit. Policy Manag. 2012, 39, 461–478. [Google Scholar] [CrossRef]
  52. Heaver, T.D. The evolving roles of shipping lines in international logistics. Int. J. Marit. Econ. 2002, 4, 210–230. [Google Scholar] [CrossRef]
  53. Lau, Y.Y. An application of the Porter’s diamond framework: The case of Hong Kong airfreight industry. In Proceedings of the 3rd International Forum of Shipping, Ports and Airports, Hong Kong, China, 24–27 May 2009.
  54. Tian, X. The Study on the Developing Strategy for China Container Port; Dalian Maritime University: Dalian, China, 2001. (In Chinese) [Google Scholar]
  55. Sun, B. The present situation and prospect of the foreign container trade shipment in Nansha District of Guangzhou port. China Ports 2008, 11, 24–27. (In Chinese) [Google Scholar]
  56. Zhi, Y. Yingkou port: The successful road-map of domestic container. Marit. China 2012, 7, 32–34. (In Chinese) [Google Scholar]
  57. Cheng, Z. Quanzhou Port Enter into the Era of Ship Maximization. Available online: http://www.fjjtxw.com/show.aspx?id=235&cid=12 (accessed on 6 February 2017). (In Chinese)
  58. Yang, Y. Foreign investment is taking a gamble in China’s wharfs. Foreign Invest. China 2002, 9, 16–18. (In Chinese) [Google Scholar]
  59. Zhang, T.; Cao, L. Domestic Containers Drive the New Development of China’s Ports. Available online: http://www.chyxx.com/news/2012/0709/160478.html (accessed on 6 February 2017). (In Chinese)
  60. Liu, L. The competition and cooperation of domestic trade containers in Pearl River Delta. Containerization 2012, 23, 4–6. (In Chinese) [Google Scholar]
  61. Cai, Z. Expand the development path with own characteristics. China Port 2008, 1, 5–7. (In Chinese) [Google Scholar]
Figure 1. Five pairs of adjacent port in China.
Sustainability 09 00328 g001
Figure 2. Trade competitive power index (domestic and foreign container). Source: China Ports Yearbook (2005–2013).
Sustainability 09 00328 g002
Figure 3. Trade competitive power index (domestic and foreign transshipment). Source: China Ports Yearbook (2005–2013).
Sustainability 09 00328 g003
Figure 4. China port functional differentiation mechanism.
Sustainability 09 00328 g004
Figure 5. The proportion of foreign and domestic container in Chinese port (%) (2001–2011). Source: China Ports Association.
Sustainability 09 00328 g005
Table 1. The throughputs and rankings of 10 ports in 2012.
DalianYingkouQingdaoYantaiShanghaiNingboXiamenQuanzhouShenzhenGuangzhou
Throughout (Ten thousand TEU)806.4485.11450185.043252.91683720.17169.692294.131474.4
Rank in China7105111381424
Rank in province1212111312
Distance on the sea (nautical mile)1842191098457
Distance onshore (kilometer)225229235140163
Source: China ports yearbook editor office, 2011–2013, Chinese Port Yearbook (Shanghai, China: Chinese port magazine publisher) (in Chinese). Note: The distance between two ports (sea and onshore) is calculated by BLM-Shipping and Google Map).
Table 2. The proportion of the port throughput to adjacent port (2004–2012).
Dalian/YingkouQingdao/YantaiShanghai/NingboXiamen/QuanzhouShenzhen/Guangzhou
20043.6821716.904123.7486745.2586745.942204
20053.00730910.070213.4244525.2475814.821663
20062.7765527.2274583.0315074.4728023.526394
20072.6748858.429882.7567994.0895522.882006
20082.3404327.159812.5619073.7685812.39639
20091.9893448.2286772.4412463.335662.072999
20101.8887518.9300642.2738342.949492.299585
20111.6218359.0108112.2255923.7301422.008294
20121.67791410.089282.0415813.9258681.92134
Source: China Ports Yearbook (2005–2013).
Table 3. The Proportion of the Foreign Container to Domestic Container (%).
200420052006200720082009201020112012
DalianForeign91.0091.1590.0890.0285.1881.2980.3474.1560.08
Domestic9.008.859.929.9814.8218.7119.6625.8539.92
YingkouForeign9.298.7312.019.633.282.081.792.582.27
Domestic90.7191.2787.9990.3796.7297.9298.2197.4297.73
QingdaoForeign92.1689.9889.4389.1285.6886.0084.7982.8974.94
Domestic8.5111.1311.8212.2116.7216.2817.9420.6433.44
YantaiForeign58.6640.0729.1331.0924.9325.6826.4528.6729.26
Domestic41.3459.9370.8768.9175.0774.3273.5571.3370.74
ShanghaiForeign92.7892.8192.7592.7992.4890.8090.6190.6790.40
Domestic7.797.197.817.218.139.2010.369.3310.61
NingboForeign94.6793.9693.7393.7593.6193.0793.2992.7492.85
Domestic5.336.046.276.256.396.936.717.267.15
XiamenForeign93.3292.7992.5391.6290.2686.5287.6881.2279.31
Domestic6.687.217.478.389.7413.4812.3218.7820.69
QuanzhouForeign6.954.813.944.993.925.154.414.544.79
Domestic93.0595.1996.0695.0196.0894.8595.5995.4695.21
ShenzhenForeign94.7295.4095.1995.5895.5994.1595.5995.6695.07
Domestic5.284.604.814.424.415.854.414.344.93
GuangzhouForeign19.1222.7027.8629.5828.1828.8827.7430.5037.08
Domestic80.8877.3072.1470.4271.8271.1272.2669.5062.92
Source: China Ports Yearbook (2005–2013). A special case is Shanghai–Ningbo. In Shanghai, the proportion of foreign and domestic container has changed from 93:7 in 2004 to 91:9 in 2012. In Ningbo, the proportion of foreign and domestic container has changed from 95:5 in 2004 to 93:7 in 2012. Compared to the other four pairs, foreign containers played a dominant role in both Shanghai and Ningbo.
Table 4. The Proportion of the Foreign Transshipment to Domestic Transshipment (%).
20052006200720082009201020112012
DalianForeign100.00100.0092.0490.4978.8481.6770.0762.86
Domestic0.000.007.969.5121.1618.3329.9337.14
YingkouForeign0.000.000.000.010.390.000.0015.11
Domestic100.00100.00100.0099.9999.61100.00100.0084.89
QingdaoForeign0.00100.00100.0097.2798.4699.10100.0090.47
Domestic0.000.000.002.731.540.900.009.53
YantaiForeign0.000.000.040.000.000.271.211.23
Domestic0.000.0099.96100.00100.0099.7398.7998.77
ShanghaiForeign86.6382.5685.8185.1481.0393.7780.6480.91
Domestic13.3717.4414.1914.8618.976.2319.3619.09
NingboForeign62.6175.9898.3098.3199.0194.5888.9188.10
Domestic37.3924.021.701.690.995.4211.0911.90
XiamenForeign88.0984.0181.7860.5350.1862.1851.4150.86
Domestic11.9115.9918.2239.4749.8237.8248.5949.14
QuanzhouForeign0.000.580.610.954.661.881.576.25
Domestic100.0099.4299.3999.0595.3498.1298.4393.75
ShenzhenForeign91.3694.5195.8888.4180.4686.5384.5879.33
Domestic8.645.494.1211.5919.5413.4715.4220.67
GuangzhouForeign0.000.0032.8727.4525.050.354.237.16
Domestic100.00100.0075.2678.4679.9799.6595.9493.32
Note: Foreign transshipment includes international transshipment, import and export coastal transshipment, and import and export river transshipment; domestic transshipment includes coastal and coastal transshipment, coastal and river transshipment, river and river transshipment. Source: China Ports Yearbook (2005–2013).
Table 5. Foreign investment in Chinese port (1990–2012).
PortForeign Company (Time)
ShenzhenSITC (1990); CMHI (1991); Swire (1991); P&O (1991); HPH (1994); CMHI (2002); Allegro investments (2003); MTL (2005)
ShanghaiHPH (1993); APM (2002); HPH (2003); HPH (2005)
DalianPSA (1996); PSA (1999); PSA (2004); APM (2004); NYK (2007)
XiamenHPH (1996); NWS (1997); APM (2005)
QingdaoP&O (1999); Maersk (1999); PE (2009)
GuangzhouPSA (2001)
NingboHPH (2001); Cyber Chic Company Limited (2003); Ninterin Ltd. (2004); Lloyd Triestino (2004); OOCL (2006)
YantaiDubai Port World (2003); ICTSI Hong Kong (2005)
Source: China Ports Yearbook (2005–2013).
Table 6. Joint Venture in China Ports.
PortCompany (Time)
GuangzhouPSA (2001); CSCL (2003); COSCO (2006)
YantaiDubai Port World (2003); ICTSI Hong Kong (2005)
YingkouCOSCO (2004); CSCL (2007)
QuanzhouCOSCO (2006); COSCO (2008)
Source: China Ports Yearbook (2005–2013).

