Article

How to Set the Allowance Benchmarking for Cement Industry in China’s Carbon Market: Marginal Analysis and the Case of the Hubei Emission Trading Pilot

1
College of Environmental Science and Forestry, State University of New York, Syracuse, NY 13210, USA
2
Institute for International Studies, CICTSMR, Wuhan University, Wuhan 430072, China
3
Research Center for Climate Chang and Energy Economic (CCEE), Wuhan University, Wuhan 430072, China
4
Research Center for Contemporary Management, Tsinghua University, Beijing 100084, China
5
State Grid Energy Research Institute, Beijing 102209, China
*
Author to whom correspondence should be addressed.
Sustainability 2017, 9(2), 322; https://doi.org/10.3390/su9020322
Submission received: 24 January 2017 / Revised: 16 February 2017 / Accepted: 17 February 2017 / Published: 22 February 2017

Abstract

:
Greenhouse gas (GHG) benchmarking for allocation serves as rewards for early actions in mitigating GHG emissions by using more advanced technologies. China Hubei launched the carbon emission trading pilot in 2014, with the cement industry represented as a major contributor to the GHG emissions in Hubei. This article is set to establish a general benchmarking framework by describing and calculating the marginal abatement cost curve (MACC) and marginal revenue and then comparing the different GHG benchmarking approaches for the cement industry in the Hubei Emission Trading Pilot (Hubei ETS) case. Based on the comparison of three GHG benchmarking approaches, the Waxman-Markey standard, the European Union Emission Trading Scheme (EU ETS) cement benchmarking, and the benchmarking approach applied in California Cap-and-Trade program, it is found that; (1) the Waxman-Markey benchmark is too loose to apply in Hubei as it provides little incentive for companies to mitigate; (2) the EU ETS benchmark approach fits the current cement industry in Hubei ETS; and (3) the GHG benchmarking standard in the California Cap-and-Trade Program is the most stringent standard and drives the direction of the future development for Hubei ETS.

1. Introduction

In a Cap-and-Trade system, there are three basic ways of free allocation; allocating based on historical emissions (grandfathering), allocating based on greenhouse gas (GHG) benchmarking, and auction. Compared with grandfathering, a benchmark for allocations rewards early moves and more efficient installations and/or companies. Under Cap-and-Trade, the primary reason for free benchmark allocation is to avoid carbon leakage, while preserving the price signal and rewarding top performers that have undertaken ‘early action’ [1]. There are different types of GHG emission benchmark in varied categories; input/output based benchmark, top-down/bottom-up benchmark, and product/process based benchmark. Among the major carbon emission trading systems, an output-based product GHG emission benchmark is the most commonly adopted benchmarking approach [2].
China Hubei launched its carbon emission trading pilot on 6 April 2014, with 324 million metric tons of CO2 allowances given to 138 enterprises from 12 sectors including power, steel, cement, and chemicals [3]. The cement industry is a major contributor to the total carbon emissions in Hubei. Instead of benchmarking, the current allocation of emission allowances to the cement industry is based on grandfathering. In the cement sector, as the processes and products are relatively simple and uniform, the authors believe that an output based benchmarking approach is more rational and rewarding for early actions taken to reduce CO2 emissions.
There have been many studies worldwide exploring the ways to reduce GHG emissions in cement industries, and a few of them looked at the cost of different mitigation measures. Ali et al. (2012) provided an extensive overview of emerging technologies for reducing the CO2 emission and improving the energy efficacy of cement and concrete production [4]. Hong et al. (2015) looked at the GHG emission mitigation measures in the cement industry of Taiwan [5]. Kajaste and Hurme (2016), in their study of management options and abatement costs, pointed out that the highest near-term potential to avoid/reduce the CO2 emission in cement production is to replace clinker with mineral components. However, the best future options are through carbon capture technologies and other advanced technologies [6]. The authors found that none of these investigated the marginal abatement cost in the context of the cement industry under the carbon emission trading scheme.
Scholars and practitioners claim that the two major advantages of the benchmarking approach over grandfathering are, firstly, that the benchmarking approach serves as the link between firms’ emissions intensity and the allowances received and, secondly, under the benchmarking scenario, demand-side abatement incentives are preserved for nontrade-exposed products [7]. As an example, fixed sector benchmarking is adopted in Phase III of the EU ETS. (The EU ETS refers to the carbon emission trading scheme in the European Union, which operates in 31 countries (including all 28 EU countries plus Iceland, Liechtenstein, and Norway), limits emissions from more than 11,000 heavy energy-using installations (power stations and industrial plants) and airlines operating between these countries, and covers around 45% of the EU’s GHG emissions [8].) Although there is consensus on how benchmarking approaches outweigh grandfathering approaches in terms of rewarding early carbon emission reduction efforts, there are lots of debates on benchmarking for cement sector, including (1) the selection of products and whether to benchmark based on cement or clinker; (2) the measurement of emission by direct and/or indirect emissions; (3) the stringency of the benchmark, namely, whether the average, better-than average, or the top-performing level becomes the benchmark; and (4) the adjustment of benchmark, namely whether an industrial assistance factor should be considered. Till now, there have been several main approaches for cement GHG benchmarking, including the Waxman-Markey Scenario (Waxman-Markey Bill refers to the American Clean Energy and Security Act of 2009 (ACES), which was an energy bill in the 111th United States Congress (H.R. 2454) that would have established a variant of an emissions trading plan similar to the EU Emission Trading Scheme, but was defeated in the Senate. It was proposed in the bill to provide for allowances to Protecting Energy-Intensive Trade-Exposed (EITE) industries on the basis of a benchmark (also called ‘carbon factors’) emission level, defined as the sector’s average direct emissions per unit of production output [9]) that adopts the average benchmarking approach; the EU ETS cement benchmark with a 10% of best performance approach [10]; and the California Cap-and-Trade cement benchmark with 90% of the average benchmarking approach [11], which is the most stringent benchmark so far. From the national, regional, and state level scales of the above benchmarking approaches, lessons can be learned for the cement benchmarking design in Hubei ETS, with the possibility of generalization for national adoption.
The ,marginal abatement cost curve (MACC, a curve that describes the change of cost in reducing one more unit of pollution), which has been used commonly by scholars to demonstrate the merits of emission trading [12], provides an answer to the question of how to determine the best benchmarking approach for specific industrial sectors covered in the Cap-and-Trade program. Scholars in resource economics have been applying the MACC for all kinds of economic analysis on the selection of energy efficiency or renewable energy approaches in saving energy and reducing GHG emissions [13,14]. In the Cap-and-Trade program, carbon traders can use MACC to decide whether to mitigate GHG emissions by applying more advanced technologies or by purchasing the emission allowances from the market to meet the compliance requirements. The most efficient level of GHG emission reductions is achieved when the marginal cost of adopting technologies to abate GHG emissions equals the marginal revenue of selling the same value of GHG allowances on the carbon market.
The existing literature on CO2 emission reduction measures in cement production, the different approaches for free allocation (grandfathering, benchmarking, and auction), and the theoretical approach of MACC does not provide an answer for individual carbon markets such as the Hubei ETS regarding which is the best GHG benchmarking approach for their program. To answer this question, this study establishes the MACC for the Hubei cement sector covered in the Hubei Emission Trading Pilot and lays out the basic assumption that the best benchmarking approach for Hubei will achieve equilibrium, wherein the marginal abatement cost of adopting advanced technologies to mitigate GHG emissions equals or is closest to the marginal revenue of purchasing/selling the carbon emission allowances, which is the carbon price, from the carbon market. To compare the three GHG emission benchmarking approaches, the Waxman Bill, the EU ETS, and the California GHG benchmarking, this study applies the three scenarios for calculation of total emission reductions under three scenarios and identifies the best approach for the Hubei cement industry.
Therefore, this study explores the way to establish an output-based GHG benchmark for allocating the allowance in Hubei’s cement industry. In Section 2, the three major benchmark approaches adopted in the cement industry covered in Cap-and-Trade programs are discussed. Section 3 explains the methodology of this study including where the data comes from, the MACC in theory and its application in this study. Section 4 and Section 5 discuss the scenarios under different benchmark approaches and the carbon price reflected in MACC and provide conclusions.

2. Cement Benchmarking in the Cap-and-Trade Program

2.1. Basic Benchmarking Principles

In a Cap-and-Trade program, GHG emissions calculated based on benchmarking have general advantages over grandfathering in terms of rewarding early actions to mitigate GHG emissions by adopting new technologies and innovations. To ensure the program functions correctly and delivers the expected incentives for mitigation, it is critical to set the emission benchmarks correctly. There are some basic benchmarking principles that the EU ETS and the California Cap-and-Trade program follows [15], which are summarized below:
(1)
One product, one benchmark. Do not use technology-specific benchmarks for technologies producing the same product;
(2)
Do not differentiate between existing and new plants;
(3)
Do not apply corrections for plant age, plant size, raw material quality, and climatic circumstances;
(4)
Only use separate benchmarks for different products if verifiable production data is available, based on unambiguous and justifiable product classifications;
(5)
Use separate benchmarks for intermediate products if these products are traded between installations.
However, in real practical circumstances, there might be more than one benchmark available for a single product. To choose from different benchmarks, a fallback order is necessary. Taking the EU ETS benchmark, for instance (Table 1), the fallback order (In the EU ETS, starting from the third trading phase (2013–2020), the free allocation of emission allowances adopts a combination of benchmark approaches; produce benchmarks, three fallback benchmark approaches, and the heat, fuel, and process emission benchmarks. The product benchmark is relatively easier to apply to companies. However, where there is no produce benchmark available, using the fallback benchmarks will add administrative costs to the companies as the companies have to measure and report the heat and/or fuel and/or process emission of products) of selecting different benchmarks can be described as follows; if a product benchmark is available, then use a product-based benchmark (t CO2/unit product); if no product benchmark is available, but a heat measurement is available, then use a heat-based benchmark (t CO2/TJ); if no product benchmark is available and heat is not measurable but fuel is combusted, then use a fuel-based benchmark (t CO2/TJ of fuel); finally, if no product-based benchmark is available, heat is not measurable, emissions are not resulting from the combustion of fuel, and ‘process emissions’ were produced, then use a process based benchmark (EU ETS: 97% of historical emissions).

2.2. Benchmarking Approaches

In the cement sector covered by the Cap-and-Trade program, this study looks into three major benchmarking approaches to GHG emissions; (1) the average approach, i.e., the Waxman-Markey benchmark; (2) the above-average approach, i.e., the EU ETS benchmark; and (3) the best-in-class approach, i.e., the California cement benchmark. On the one hand, these three approaches are benchmarking based on production output. On the other hand, they vary between benchmark products, stringency, and calculation. To be specific, the comparison among these three approaches can be described in Table 2.
The EU Commission describes their choice of benchmark stringency as; installations that meet the benchmarks (and thus are among the most efficient installations in the EU) will, in principle, receive all the allowances they need. Installations that do not meet the benchmark will have a shortage of allowances and the option to either lower their emissions (e.g., through engaging in abatement) or to purchase additional allowances to cover their excess emissions [10].
In California, the product-based GHG emissions intensity benchmarks are a key part of the calculation methodology to determine the annual number of free allowances allocated to each eligible industrial facility in the Cap-and-Trade program. The current targeted level of stringency is created by evaluating each industrial sector’s production-weighted average emissions intensity during a historical base period and targeting the benchmark to allocate 90% of this level per unit of product [17]. Generally, this stringency approach works for most of the sectors, but, in some cases, such a level would be more stringent than the current emissions intensity of any existing Californian facility. For such occasions, the ‘best-in-class’ (i.e., the emissions intensity of the most GHG-efficient Californian facility) approach is applied [11]. The main reason for this approach is that using the California cement benchmark (best-in-class approach) allows for lower-GHG mineral additives to be substituted for cement. In the staff’s initial statement of reasons (ISOR) for the California program, the ‘adjusted output metric’ was proposed by taking into consideration the average level of mineral additives in the cement shipped from the California cement facilities. To calculate this metric, the ISOR adopted the equation: Adjusted Clinker and Mineral Additives Produced = Clinker Produced × (1 + (Limestone and Gypsum Consumed)/Clinker Consumed). The ISOR further points out that greater use of mineral additives should provide a viable method for California cement facilities to produce the cement with fewer GHGs. Therefore, to find out whether the benchmark approach works best for Hubei’s situation, we use the above three approaches as the three scenarios for applying further analysis and calculations.

3. Methodology

3.1. Data Collection

In this study, we use the Hubei Industrial GHG Emission Inventory data (2012) from the years 2009 to 2011, which has been reported by individual companies and verified by third parties in Hubei Province. The CO2 emission data for the cement industry was collected from 35 individual manufacturers in Hubei, which includes the clinker production and cement production from the years 2009 to 2011 (some facilities have the data from 2009 to 2012) and the GHG emission data from 2009 to 2011 in both direct and indirect emissions. In addition, we obtained the Chinese national cement industrial data from the China Statistical Yearbook 2010 to 2012. The total clinker production and total CO2 emissions (2009–2011) for the 35 cement factories in Hubei are summarized in Table 3.
In establishing the Marginal Abatement Cost Curve (MACC) for cement manufacturing industry, the 40 Best-Available-Technology (BATs) for mitigating GHG emission in the cement industry were selected and evaluated. The selection of BATs was conducted based on the 1st to the 6th version of the Chinese Cement Industry GHG emission mitigation BAT list, released by the China National Development and Reform Committee and the China Ministry of Industry and Information Technology. The resources for evaluating the abatement cost of the technologies include the China Energy Yearbook (2013), the National Bureau of Statistics of People’s Republic of China, the IPCC Report, and the China Electricity Yearbook (2013). In addition, we also used available data from the Industrial Efficiency Technology Database (IETD), the ‘Assisting Developing Country Climate Negotiators through Analysis and Dialogue: Report of Energy Savings and CO2 Emission Reduction Analysis in China Cement Industry’ (Tsinghua University, 2008) [18], and the ‘Energy Efficiency Improvement and Cost Savings Opportunities for Cement Making: An Energy Star Guide for Energy and Plant Managers’ (USEPA, 2013) [19]. The fuel and electricity savings, CO2 emissions reduction, and current adoption rate for the 40 BATs in this research are summarized in Table 4, also referenced in Appendix A.

3.2. Basic Assumptions

In the calculation of the MACC of cement production, the following assumptions were made:
(1)
The conversion factor for calculating electricity used in cement production: according to China Power Yearbook (2013), the net generation heat rate is 0.33, based on the year 2012, and the transition loss rate is 6.74%. The conversion factor from electricity to primary energy used in this study is 2.9 Kwh/kgce.
(2)
The carbon conversion factor for calculating CO2 emissions from energy: according to the Intergovernmental Panel on Climate Change (IPCC) Report (2013) and China Energy Yearbook 2013, the emission factors of electricity and fuel energy are 0.77 Kg/Kwh and 83.81 kG/GJ, respectively.
(3)
The price of fuel (coal) is set as 700 RMB/ton, which was obtained from China Coal Trading Market Website.
(4)
The price of electricity is set as 760 RMB/MWh, which was obtained from China Power Yearbook 2013.
(5)
The share of production to which the measure is applied: given that the adoption rate of BATs varies, the share of production to which the measure applies is estimated based on the total production of cement in Hubei plus the adoption rate of certain BATs.
(6)
The scope of benchmarking: clinker is chosen as the benchmarking product instead of cement due to data availability. Abatement based on clinker helps drive kiln and process efficiency upgrades but fails incentives for the use of clinker substitutes (such as fly ash and slag) in blending to reduce emissions. A benchmark based on cement would provide an incentive for the blending of clinker substitutes but could lead to restructuring of the cement industry. In particular, if the benchmark were only applied to cement, cement facilities may choose to no longer make emissions-incentive clinker themselves, importing it or else purchasing it from facilities that only grind clinker and do not make cement (therefore potentially exempting themselves from the cement-based benchmark. The EU ETS’s benchmark for cement manufacturing is based on clinker because the compliance is counted by installations, while in the California Cap-and-Trade program, the benchmark is based on cement production because the compliance is counted based on firms.
(7)
Direct or indirect CO2 emissions from cement production: a combination of direct and indirect CO2 emissions were chosen in this study. During the cement production process, there are direct CO2 emissions and indirect CO2 emissions. The direct emissions come from fuel use, combustion, and the calcination process, while the indirect emissions come from transportation and electricity, which accounts for about 10% of the total emissions during the production and transportation process.
(8)
The carbon price: the carbon price in this study is assumed to change between a price range, calculated based on the carbon price of the seven ETS pilots in China, which is not static. Another price factor considered, but not reflected in the MACC, is the difference of carbon allowances traded within the cement industry and those traded between the cement industry and other covered industries. In addition, the secondary carbon exchange market is too small to consider at this stage. Therefore, it is assumed that the cement industrial price equilibrium is achieved when the marginal abatement cost equals the marginal revenue from the carbon market, which is reflected in the macro carbon market.

3.3. Estimation of the Total CO2 Emission Reduction

As we understand it, different benchmark stringencies can lead to a different amount of free allocation. With the available dates of actual CO2 emission data, we can calculate the estimated total emission reduction under different levels of benchmark stringency. For each scenario of benchmarking, we specify the benchmarking products, define the benchmark measurement boundaries, and set the stringencies. After that, we calculate the total emission reduction ( Δ T E i ) (unit as Mt) as in the following Equation (1):
Δ T E i = C E i F A i
where:
  • Δ T E i : Total emission reduction
  • C E i : estimate CO2 emission
  • F A i : Free Allocation

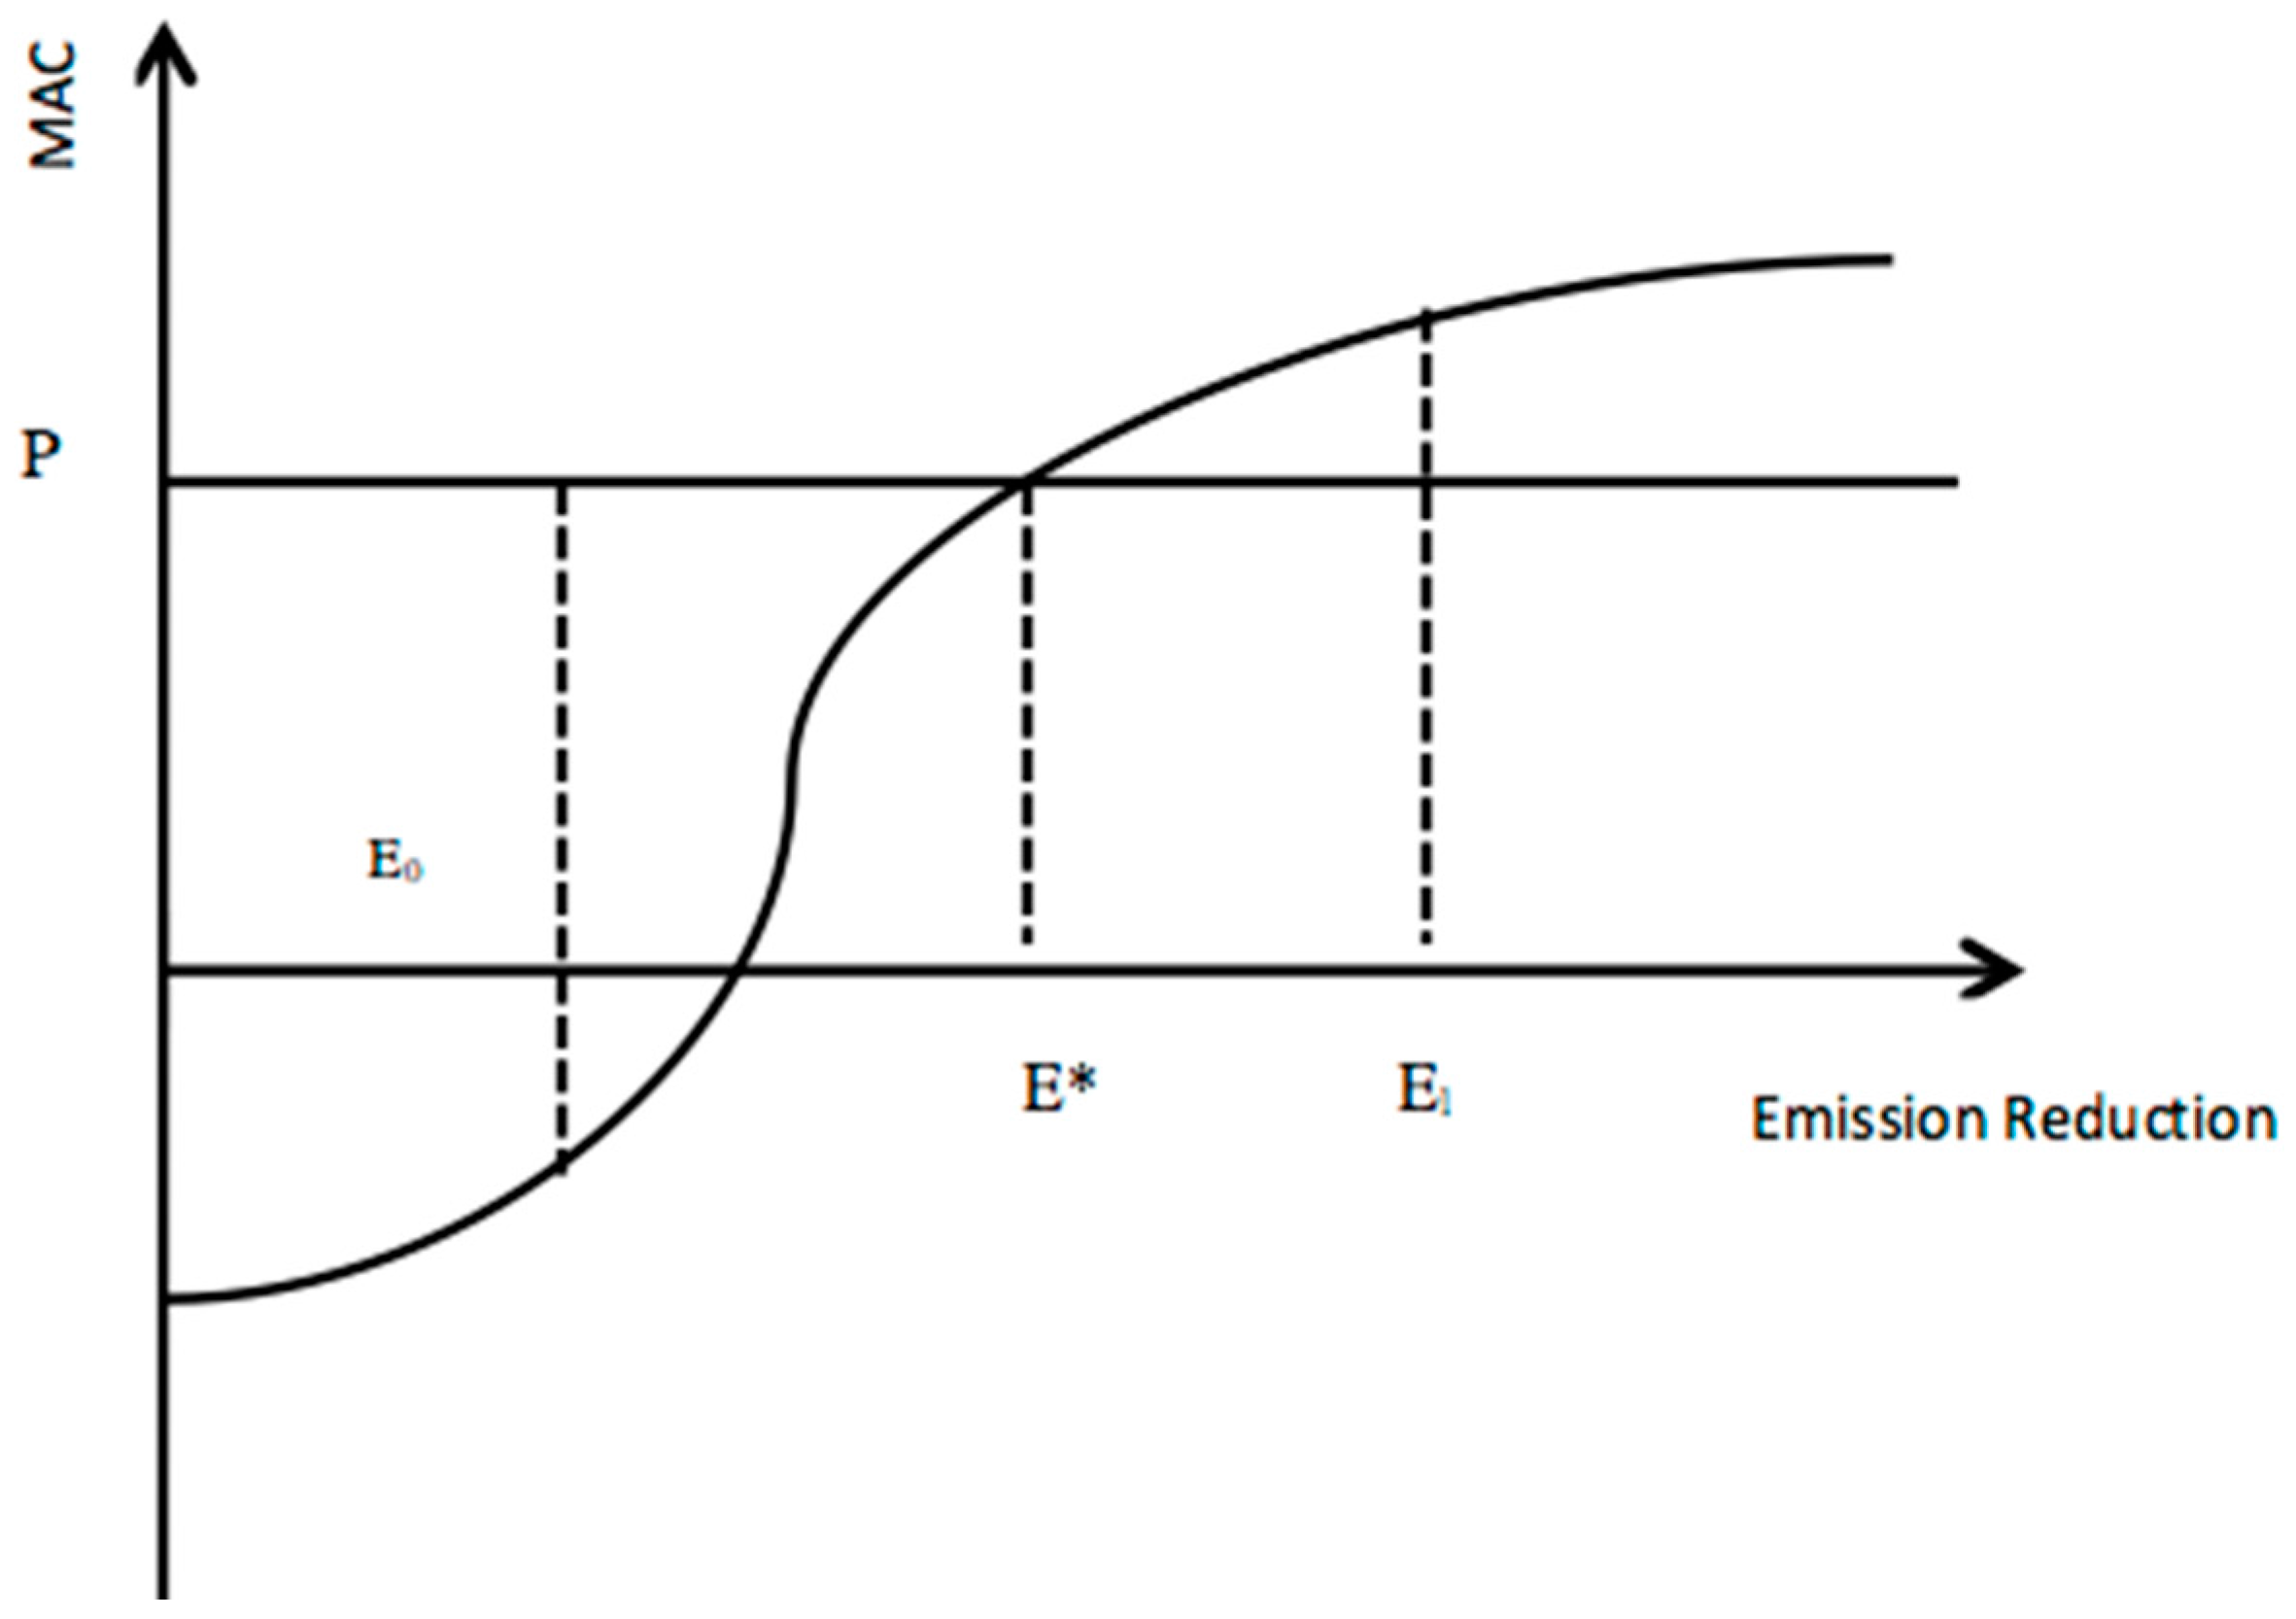
3.4. CO2 Emission Marginal Abatement Cost Curve

As discussed above in the theory of MACC, the equilibrium occurs when the marginal abatement cost equals the marginal revenue. In this case, the equilibrium ideally can occur when the marginal cost of mitigating GHG emissions for cement production is the closest to the carbon price on the Hubei carbon market. As described in Figure 1, it is when the cement producer achieves the CO2 mitigation at E* that the MACC equals to the MR from the emission trading market. In this study, a static carbon price is estimated as P, because, based on statistical analysis of the carbon price in Hubei and six other Cap-and-Trade pilots in China, we found that the price remained stable in the range of 24–55 RMB/t CO2e, the average price of the seven Chinese ETS pilots, and at about 24 RMB/t CO2e, the average price of Hubei’s carbon market [26]. In addition, we only consider the cement industry in this study; the price in a single industry does not place a significant impact on the overall market. Therefore, the basic hypotheses are:
(1)
when BM0 leads to emission reduction E0, carbon price (P) > MACC
(2)
when BM* leads to E*, P = MACC
(3)
when BM1 leads to E1, P < MACC
According to the methodologies in Section 3.3, emission reduction can be calculated under different stringencies, the question becomes how we can establish the MACC. In this study, we calculate the total abatement cost by establishing the MACC of the cement manufacturing industry in Hubei, with consideration of 40 technological measures in mitigating CO2 emissions, as shown in Equations (2) and (3) [14].
M A C i = d × C C i 1 ( 1 + d ) n + Δ O M i Δ E i
Δ E i = P × c × [ ( 100 % P R ) × T A ]
where:
  • P: Cement production
  • c: CO2 emission reduction per ton cement
  • PR: Penetration Rate
  • TA: Technical Applicability
  • MAC: Marginal Abatement Cost
  • d: discount rate
  • C C i : capital cost
  • Δ O M i : increased Operation and Maintenance cost
  • n: lifetime of emission reduction technology
  • Δ E i : emissions reduction

4. Analysis and Discussion

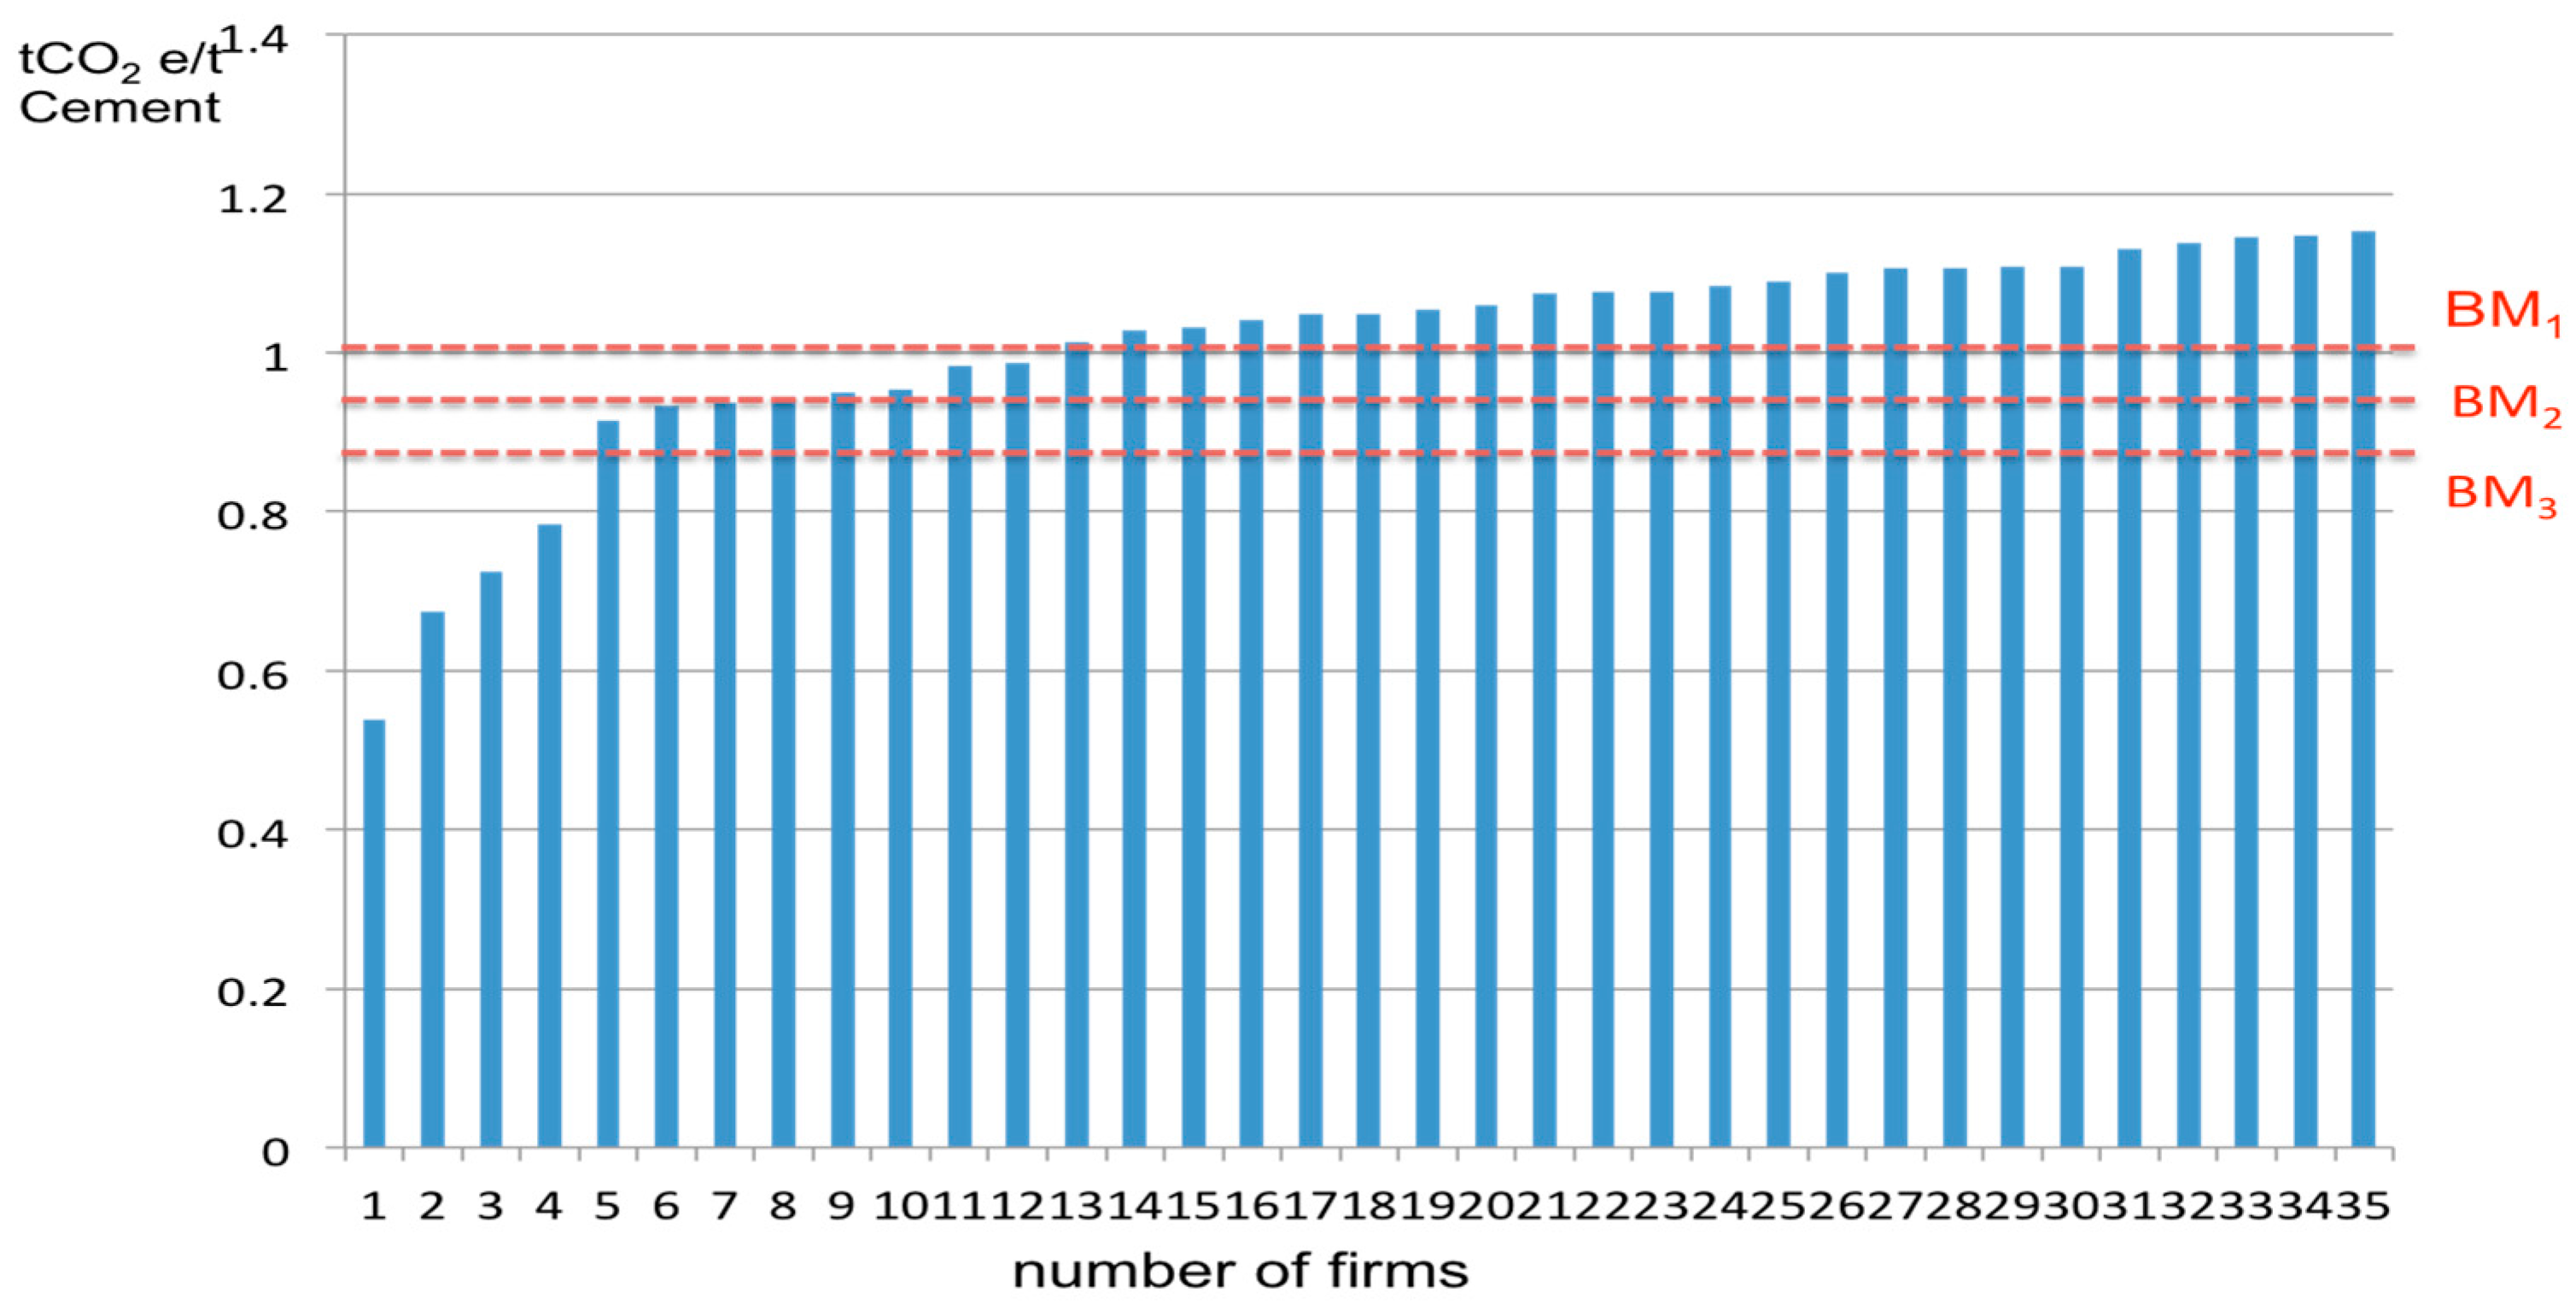
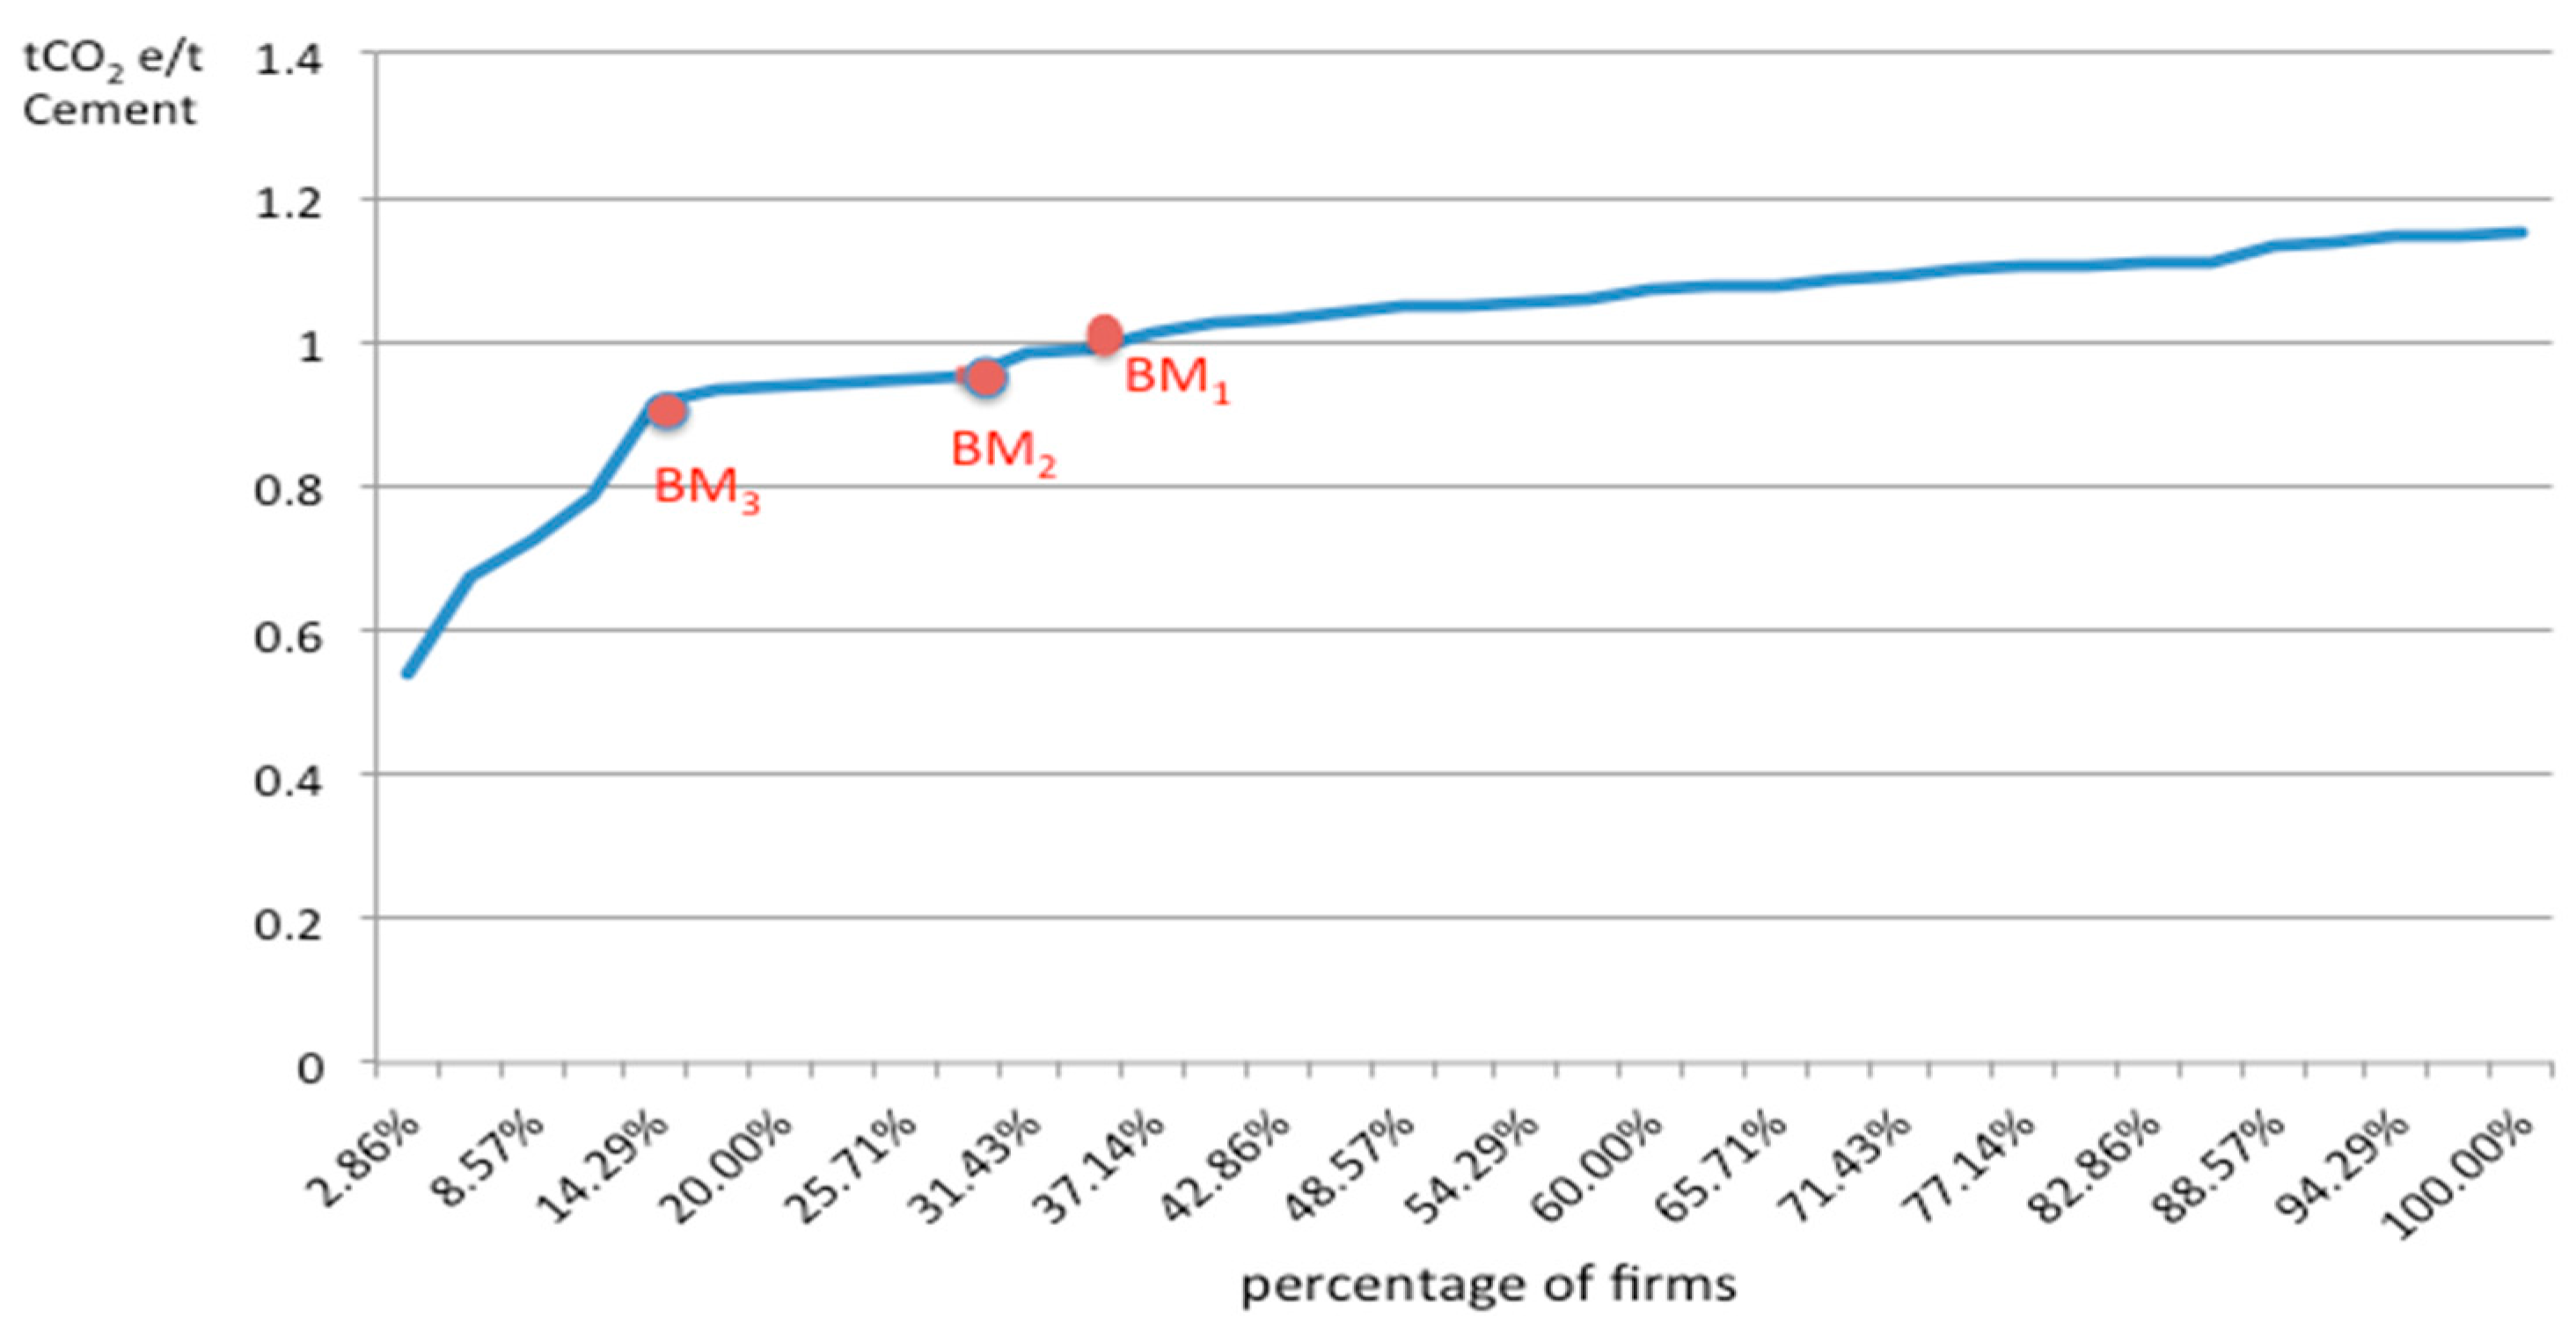
4.1. Benchmark Curve and Benchmarking Stringency

The benchmark curve is a common way to evaluate whether individual firms meet certain environmental requirements in the process of production. To establish the benchmark curve for the cement sector covered in the Hubei ETS pilot, this study applies the Waxman Bill GHG emissions benchmarking, the EU ETS GHG emissions benchmarking, and the California Cap-and-Trade cement sector GHG benchmarking approaches in the calculation of three different benchmarking curves for the Hubei cement sector. In order to compare the impact of different carbon emission benchmarking approaches on rewarding early carbon emission mitigation technologies and actions, the three benchmarking approaches assessed can be summarized as below:
(1)
BM1: the Waxman-Markey Scenario (2009), which adopts the average benchmarking approach;
(2)
BM2: the EU ETS cement benchmark with 10% of the best performance;
(3)
BM3: the California Cap-and-Trade cement benchmark at the level of 90% of the average benchmarking approach.
To quantify the benchmark approaches, this study converts the three benchmarks into comparable output-based benchmarks, which are typically expressed as a quantity of emissions per unit of output, as in the following equation:
G H G   B e n c h m a r k = E m i s s i o n s   ( t o n s   C O 2 e ) U n i t   o f   O u t p u t   ( t o n s , $ , o r   o t h e r   m e t r i c )
In this study, the GHG Benchmark value is calculated based on the average of two years (2010–2011) or three years (2009–2011) of carbon emissions and cement production from the 35 cement factories in the Hubei Industrial GHG Emissions Inventory (2012). In order to obtain the baseline benchmarking value (BM0), the individual emission data and production data were assessed. Therefore, the benchmarking values under each approach are:
BM1 = average performance = 1.00 t CO2e per ton cement product
BM2 = 10% of the best performance = 0.95 t CO2e per ton cement product
BM3 = 90% of the average performance = 0.89 t CO2e per ton cement product
According to the benchmark curve (described in Figure 2 and Figure 3), by adopting the first benchmarking approach (Waxman-Markey approach with benchmarking as average performance), about 37% (12 cement factories) of the industry can meet the standard; by adopting the second benchmarking approach (the EU ETS benchmarking as 10% of the best performance), about 26% (9 cement factories) of the industry can meet the standard; and by adopting the third benchmarking approach (California cement benchmarking approach as 90% of the average performance), about 11% (4 cement factories) of the industry can meet the standard. Therefore, as indicated in the benchmark curve, the California cement benchmarking approach would create the most stringent standard, while the Waxman-Markey benchmarking approach is the loosest if adopted in Hubei’s cement industry.

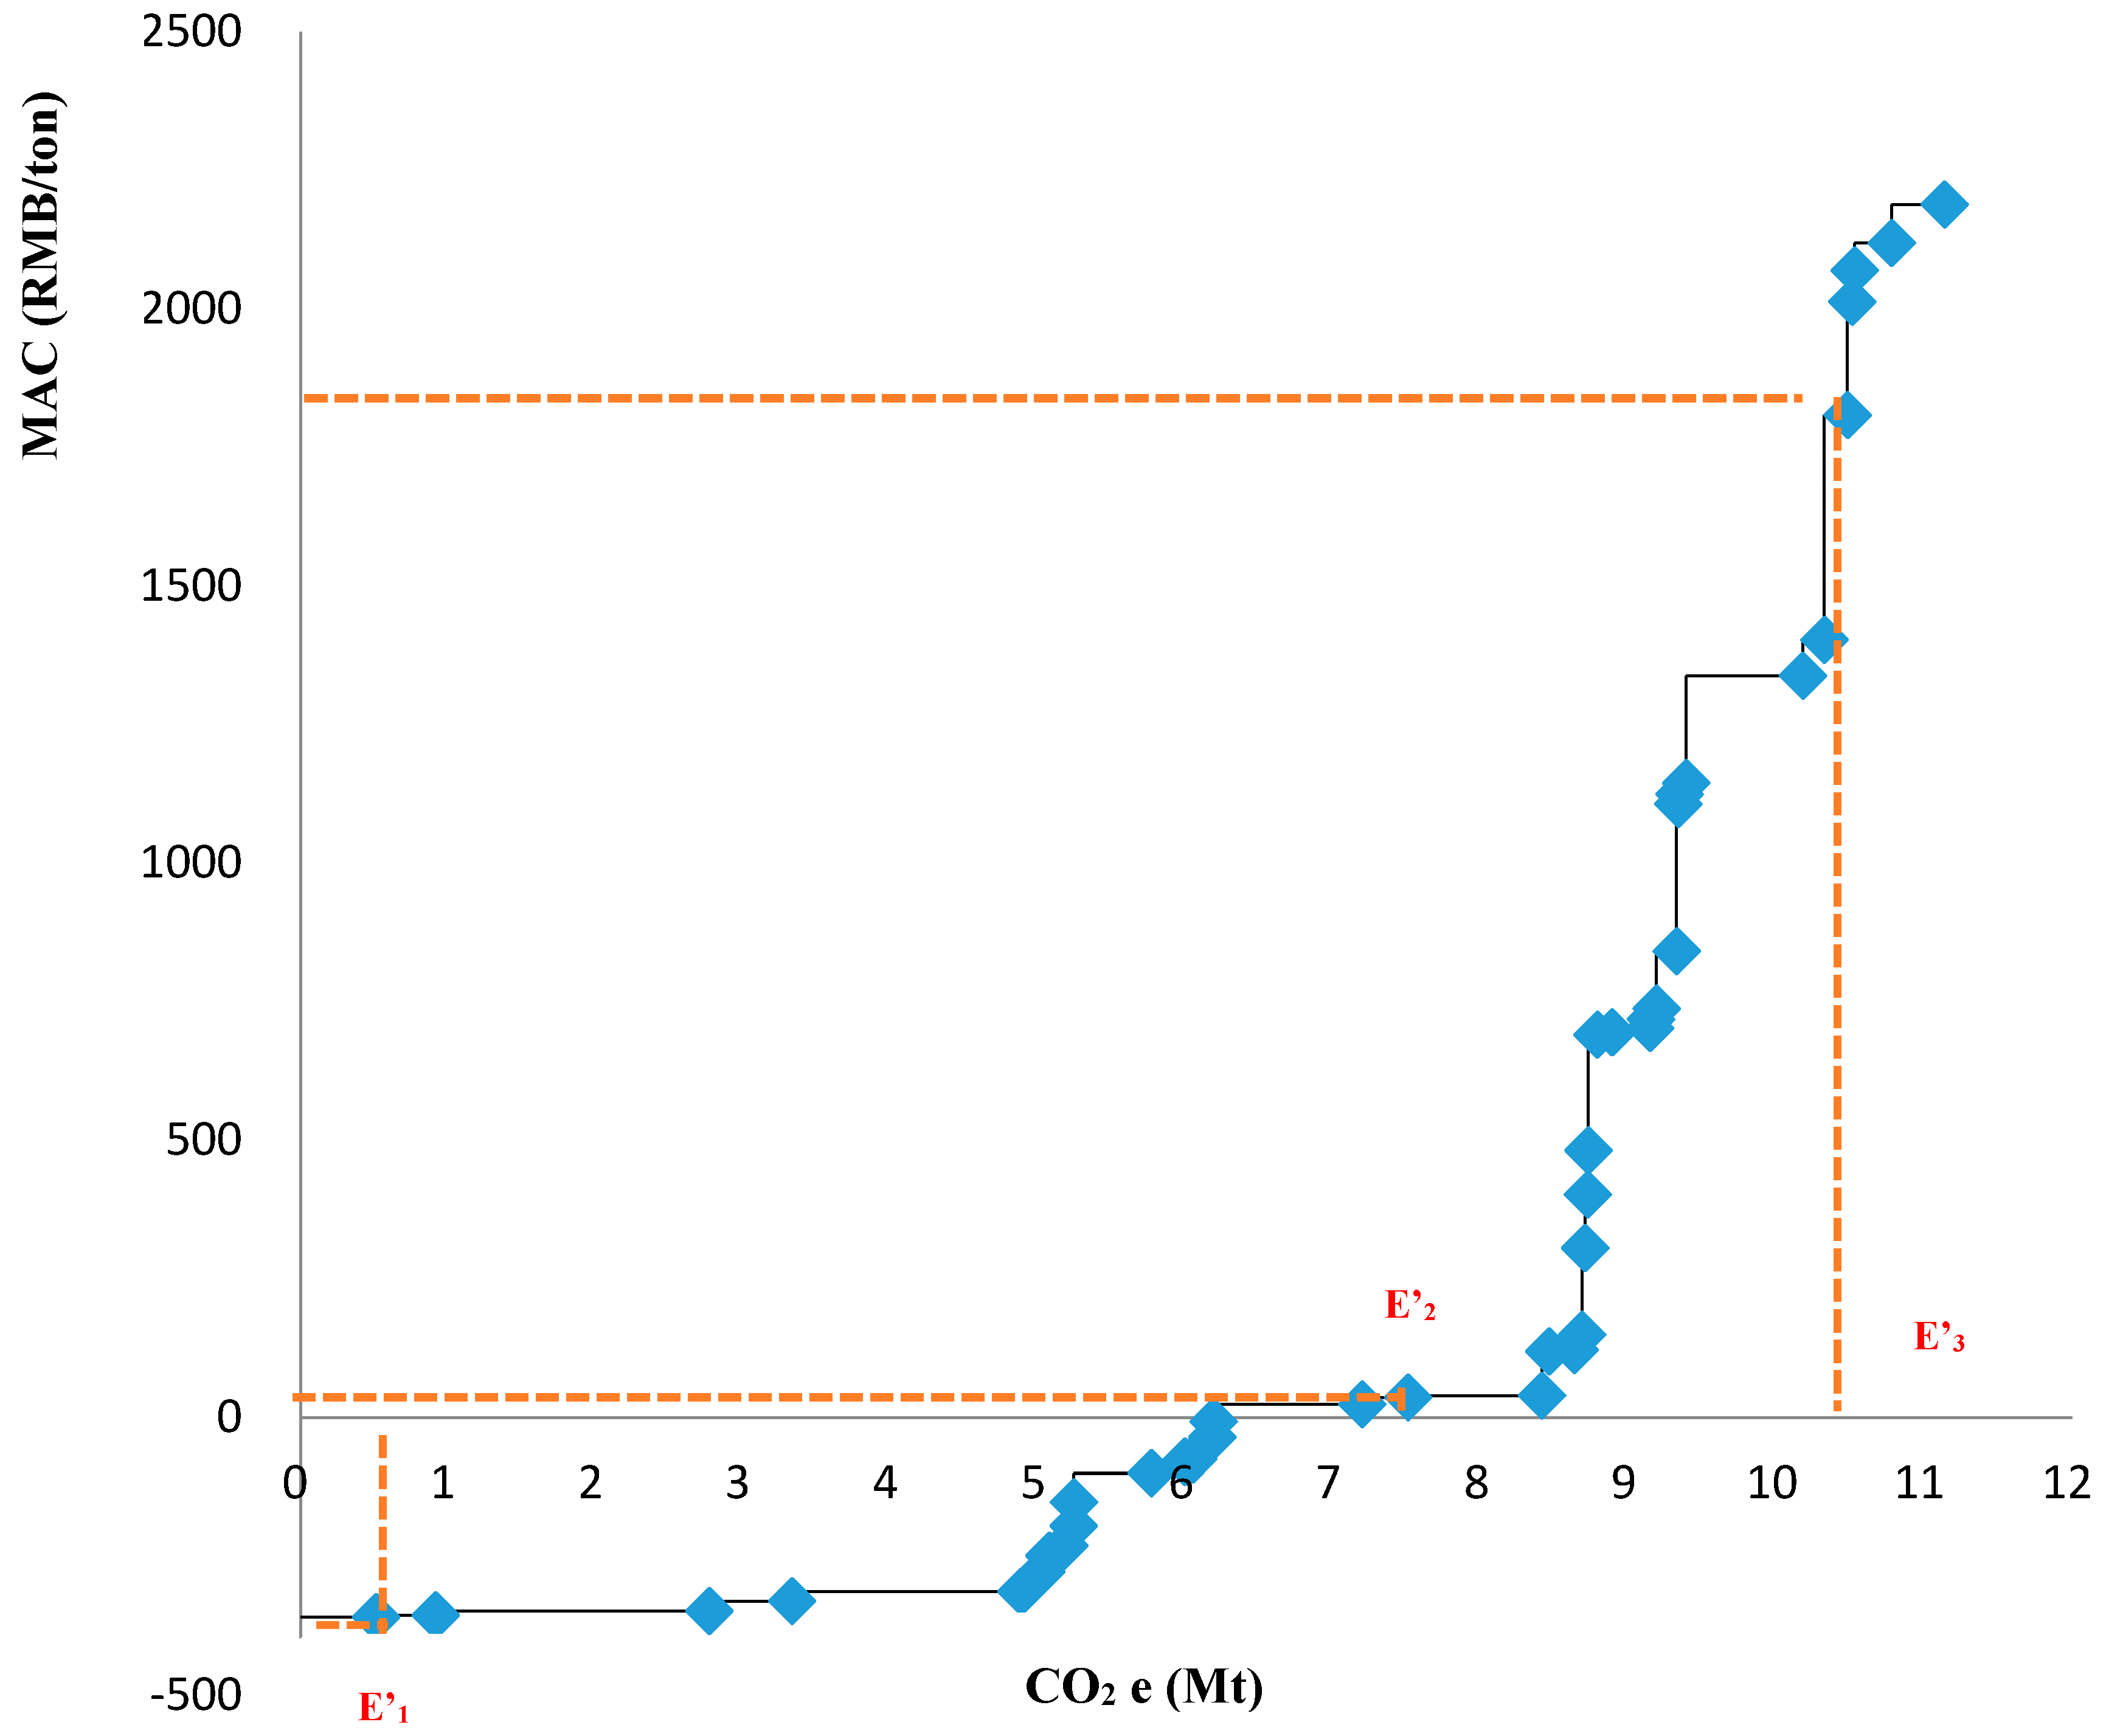
4.2. Expected CO2 Emissions Reduction

According to the three different cement benchmarking approaches, the allocation of CO2 emissions under each scenario (AL1, AL2, and AL3) and the expected emission reduction (E’1, E’2, and E’3) can be calculated as shown in Table 5. Apparently, by adopting the Waxman-Markey benchmarking, there will be hardly any reduction needed to accommodate the allocation; however, emission reductions are expected under both the EU ETS and California cement benchmarking approaches. Between these two, the latter requires more emission reductions as it sets a more stringent benchmark.
As discussed above, the expected total emission reduction becomes the horizontal axis of the MACC, while the marginal abatement cost of per ton CO2e becomes the vertical axis of the MACC. The average carbon price in Hubei for 2014 is about 24 RMB/ton, while in the same year the average carbon price in the seven China ETS pilots varies from 24 RMB/ton to 55 RMB/ton in the year 2014 [21].
Note that, in the calculation of the MACC, we used the industry production data from the China National Bureau of Statistics (2013) instead of the total cement production data accounting from the 35 Hubei cement factories because all 40 BATs are industrial wide technologies. They are not the technologies exclusively adopted by the 35 Hubei cement factories.
The Marginal Abatement Cost Curve of the per ton CO2e of each unit of cement production is described in Figure 4. According to the MACC, a few findings can be summarized as below:
(1)
If the Waxman-Markey benchmark is adopted in Hubei, the expected carbon emission reduction (E’1) is about 0.51 million tons CO2e, wherein the marginal abatement cost of reducing the per ton carbon emission is below zero (about –RMB 360/t CO2e), which means that the carbon market in Hubei does not provide any incentive for cement producers to mitigate their carbon emission by adopting advanced technologies;
(2)
If the EU ETS cement benchmark is adopted in Hubei, the expected carbon emission reduction (E’2) is about 7.4 million tons CO2e, wherein the marginal abatement cost of reducing the per ton carbon emission is between 24 to 36 RMB/t CO2e, which is within the actual price range of ETS pilots in China. To achieve this level of carbon emission reduction, about 18 BATs will need to be applied in cement production. Under this scenario, the market is predictable and provides certain incentives to adopt advanced technologies to mitigate the emissions;
(3)
If the California cement benchmark is adopted in Hubei, the expected carbon emission reduction (E’3) is about 10.4 million tons CO2e, wherein the marginal abatement cost of reducing the per ton carbon emission is about 1400 RMB/t CO2e, which is much more than the current price in either China (24–55 RMB/t CO2e) or Hubei’s market (the average price is about 24 RMB/t CO2e). To achieve this level of carbon emission reduction, about 37 BATs would need to be applied in cement production. Under this scenario, most cement producers would have to choose to purchase the carbon allowances to emit because the marginal abatement cost is much higher than the price of carbon. The scarcity of carbon emission allowances would be a tremendous problem for the functioning of Hubei’s carbon market if Hubei uses California’s cement benchmarking approach. However, there is the potential to drive down the marginal abatement cost if the cost of single technologies goes down, which means the California cement benchmarking approach is a better fit for more technologically ready and advanced places rather than the current Hubei cement industry and its carbon market.

5. Conclusions and Policy Implications

In this study, the benchmark scenarios were basically assumed by adopting the Waxman-Markey approach, the EU ETS benchmarking approach, and California ETS approach. Based on the value of E’2 and E’3 in Figure 4, which reflects different carbon prices, the conclusions at which we arrive for the best GHG emission benchmarking approach for the cement industry of Hubei are:
(1) The Waxman-Markey benchmark is too loose to apply in Hubei as it provides little incentives for the companies to mitigate their GHG emissions. Once it is adopted, there will be supply surplus for the GHG emission allowances; as a result, the carbon price can be lower than its expected value as there are no incentives for covered firms to adopt new technologies or innovations to mitigate. In addition, if there is no flooring price mechanism, the lowering of the carbon price will become too unpredictable for market operators and industrial polluters to make the right decisions, which can lead to a malfunctioning of the carbon market.
(2) The EU ETS benchmark approach, which at the lower carbon price compared to the California ETS approach is a better starting approach for Hubei, on the one hand because it is easier for the market to adjust to, given that the price is closer to the real carbon price in Hubei’s current carbon market, and on the other because a relatively lower expected emission reduction will give the cement producers more flexibility and room to adjust their production process and adopt technology. It also provides the industry some time to adjust to the carbon market, but, at the same time, early actions are appropriately rewarded.
(3) The California approach is a better fit for Hubei when the program aims at the most stringent GHG benchmarking standard, as at the early stage there might be too few companies that qualify for the standard, and, as indicated in the MACC, the current market will not achieve relative equilibrium if the California benchmarking approach is adopted at this stage. However, when the cement sector is better developed and equipped with more advanced technologies and is able to meet more stringent carbon emission standards, it will be time for the sector to transit to the California approach of GHG emissions for the cement producers covered in the Hubei ETS pilot.
Based on the findings, there are a few policy recommendations to the sector wide GHG emissions benchmarking for the design and implementation of the Chinese national carbon emission trading program. Firstly, GHG emissions benchmarking requires solid emissions reporting and data as the basic foundation for the design of benchmarking approach. For the cement industry, cement and/or clinker production data, as well as the GHG emissions data from cement production, are essential for setting up sector wide GHG emissions benchmarking. In addition, mandatory reporting and third-party verification and monitoring measures need to be put in place to ensure the availability of data for benchmarking. Secondly, both GHG emissions reduction and economic vitality should be taken into consideration for the choice of benchmark stringency. If the benchmark is too stringent, there will be fewer firms in the industry that can meet the standard, which could lead to either the scarcity of emission allowances or the unaffordable abatement cost of emission reduction. In addition, to prevent the cement enterprises from relocating to other jurisdictions where the abatement cost is lower, the adjustment factor needs to be considered.

Acknowledgments

The authors would like to thank the China Scholarship Council for supporting Fan Dai, Ling Xiong, and Ding Ma in conducting this joint research. The authors would like to thank David H. Newman for his review and advice in improving this manuscripts. The authors would also like to thank Bo Shen of the Lawrence Berkeley National Laboratory for his review and valuable comments and thank Michael Gibbs of California Air Resource Board for his valuable help in answering the questions we had.

Author Contributions

Fan Dai, Ling Xiong, and Ding Ma conceived and designed the methodologies; Fan Dai, Ling Xiong, and Ding Ma analyzed the data; Ling Xiong contributed the original GHG emissions data for analysis; Fan Dai wrote the paper.

Conflicts of Interest

The authors declare no conflict of interest. The founding sponsors had no role in the design of the study; in the collection, analyses, or interpretation of data; in the writing of the manuscript; or in the decision to publish the results.

Appendix A. The List of Energy-Efficiency BATs for the Cement Industry in Hubei

1
Energy management and process control in grinding
2
Dry cement kiln energy monitoring system technology optimization
3
Grinding efficient energy-saving technology optimization
4
Upgrade clinker cooler
5
Efficient transport system for raw materials preparation
6
Combustion system improvements
7
Four-channel PCI combustion energy-saving technology
8
Energy efficient separator technology
9
Multi-channel combustion technology
10
Adjustable speed drives
11
Increasing number of preheater stages in rotary klins
12
The new energy-saving technologies cement pre-grinding system
13
Alternative fuel
14
Product and speed stock change
15
New efficient coal separator
16
High solid-gas ratio of cement suspension preheater decomposition
17
Slag powder production
18
Low temperature heat recovery for power generation
19
Installation of variable frequency drive
20
Klin shell heat loss reduction
21
Leaf Curl series centrifugal fan technology
22
Flexible drive permanent magnetic vortex energy-saving technology
23
Energy management and process control in clinker making
24
High efficiency motors
25
ERP system
26
Optimize grate cooler
27
Efficient grate cooler technology
28
High efficiency drying for slag
29
Replacing vertical shaft klins with new suspension
30
Flue gas heat recovery for power generation
31
High pressure roller press for ball mill pregrinding
32
Raw mill blending system
33
Steady popularity propelled clinker cooling technology
34
Conversion to grate cooler
35
Saving copper clad aluminum busbar technology
36
Raw material vertical mill technology
37
Low pressure drop cyclones for suspension preheater
38
High efficiency classifiers
39
Efficient roller and mills
40
Vertical cement grinding mill technology

References

  1. Erickson, P.; Lazarus, M.; Hermann, H. Issues and Options for Benchmarking Industrial GHG Emissions. Available online: http://www.sei-us.org/Publications_PDF/SEI-BenchmarkingWAWhitePaper-10.pdf (accessed on 10 November 2014).
  2. Bushnell, J.; Peterman, C.; Wolfram, C. Local Solutions to Global Problems: Climate Change Policies and Regulatory Jurisdiction. Rev. Environ. Econ. Policy 2008, 2, 175–193. [Google Scholar] [CrossRef]
  3. Yu, Y.; Pan, G. Problems in China’s Cap-and-Trade program. Eastern Law J. 2009, 6, 78–86. [Google Scholar]
  4. Hasanbeigi, A.; Price, L.; Lin, E. Emerging energy-efficiency and CO2 emission-reduction technologies for cement and concrete production: A technical review. Renew. Sustain. Energy Rev. 2012, 16, 6220–6238. [Google Scholar] [CrossRef]
  5. Hong, G.; Ma, C.; Hsiao, C.; Chang, C. A case study of greenhouse gas inventory and mitigation measures in the cement industry of Taiwan. Carbon Manag. 2015, 6, 141–150. [Google Scholar] [CrossRef]
  6. Kajaste, R.; Hurme, M. Cement industry greenhouse gas emissions—Management options and abatement cost. J. Clean. Prod. 2016, 112, 4041–4052. [Google Scholar] [CrossRef]
  7. PMR, ICAP & World Bank. Emissions Trading in Practice: A Handbook on Design and Implementation. 2016. Available online: https://icapcarbonaction.com/en/component/content/article?id=379:icap-pmr-ets-handbook (accessed on 25 October 2016).
  8. The European Commission (EC). The EU Emission Trading System. 2017. Available online: http://ec.europa.eu/clima/policies/ets_en (accessed on 14 February 2017).
  9. Center for Climate and Energy Solutions (C2ES). The American Clean Energy and Security Act (Waxman-Markey Bill). 2017. Available online: https://www.c2es.org/federal/congress/111/acesa (accessed on 14 February 2017).
  10. EC. Proposal for a Regulation on Indices Used as Benchmarks in Financial Instruments and Financial Contracts—Frequently Asked Questions. 2013. Available online: http://europa.eu/rapid/press-release_MEMO-13–799_en.htm (accessed on 11 December 2014).
  11. California Air Resource Board (CARB). Cap-and-Trade: Market Oversight and Enforcement, Appendix B: Development of Product Benchmarks for Allowance Allocation. 2011. Available online: www.arb.ca.gov (accessed on 11 December 2014). [Google Scholar]
  12. EIA. Cement Roadmap. 2009. Available online: https://www.iea.org/publications/freepublications/publication/etp2010.pdf (accessed on 10 November 2014).
  13. Criqui, P.; Mima, S.; Viguier, L. Marginal abatement costs of CO2 emission reductions, geographical flexibility and concrete ceilings: An assessment using the POLES model. Energy Policy 1999, 27, 585–601. [Google Scholar] [CrossRef]
  14. Kong, L.; Hasanbeigi, A.; Price, L.; Liu, H. Analysis of Energy-Efficiency Opportunities for the Pulp and Paper Industry in China. Available online: https://eetd.lbl.gov/publications/analysis-energy-efficiency-opportunities-pulp-and-paper-industry-china (accessed on 16 February 2017).
  15. Wyns, T. Benchmarking in an Emission Trading System, Hubei, China. 2013. Available online: http://ccap.org/assets/Introduction-and-Application-of-a-Benchmarking-Approach_Tomas-Wyns_CCAP.pdf (accessed on 20 December 2014).
  16. ECOFYS. Methodology for the Free Allocation of Emission Allowances in the EU ETS Post 2012. Available online: https://ec.europa.eu/clima/sites/clima/files/ets/allowances/docs/bm_study-project_approach_and_general_issues_en.pdf (accessed on 20 February 2017).
  17. California Air Resource Board (CARB). Appendix J: Allowance Allocation. 2010. Available online: https://www.arb.ca.gov/cc/capandtrade/allowanceallocation/allowanceallocation.htm (accessed on 11 December 2014). [Google Scholar]
  18. Tsinghua University of China, Assisting Developing Country Climate Negotiators through Analysis and Dialogue: Report of Energy Saving and CO2 Emission Reduction Analysis in China Cement Industry. 2008. Available online: http://ccap.org/assets/Energy-Saving-and-CO2-Emission-Reduction-Analysis-in-China-Cement-Industry_CCAP-Nov-2008.pdf (accessed on 20 December 2014).
  19. Worrell, E.; Kermeli, K.; Galitsky, C. Energy Efficiency Improvement and Cost Saving Opportunities for Cement Making An ENERGY STAR® Guide for Energy and Plant Managers; USEPA Document, Number 430-R-13-009; United States Environmental Protection Agency: Washington, DC, USA, 2013.
  20. National Development and Reform Commission (NDRC). National Extension Directory of Important Energy Conservation Technology 1. 2008. Available online: http://www.sdpc.gov.cn/zcfb/zcfbgg/200806/t20080617_217974.html (accessed on 16 February 2017). (In Chinese) [Google Scholar]
  21. NDRC. National Extension Directory of Important Energy Conservation Technology 2. 2009. Available online: http://www.sdpc.gov.cn/fzgggz/hjbh/jnjs/201001/W020100111473815430168.pdf (accessed on 16 February 2017). (In Chinese) [Google Scholar]
  22. NDRC. National Extension Directory of Important Energy Conservation Technology 3. 2010. Available online: http://www.ndrc.gov.cn/zcfb/zcfbgg/201012/t20101208_385094.html (accessed on 16 February 2017). (In Chinese) [Google Scholar]
  23. NDRC. National Extension Directory of Important Energy Conservation Technology 4. 2011. Available online: http://www.ccchina.gov.cn/WebSite/CCChina/UpFile/File1177.pdf (accessed on 16 February 2017). (In Chinese) [Google Scholar]
  24. NDRC. National Extension Directory of Important Energy Conservation Technology 5. 2012. Available online: http://www.sdpc.gov.cn/zcfb/zcfbgg/201212/W020121225564226268616.pdf (accessed on 16 February 2017). (In Chinese) [Google Scholar]
  25. NDRC. National Extension Directory of Important Energy Conservation Technology 6. 2013. Available online: http://www.sdpc.gov.cn/zcfb/zcfbgg/201401/W020140110618068932215.pdf (accessed on 16 February 2017). (In Chinese) [Google Scholar]
  26. Qi, S.; Chen, S. The 2015 Annual Review of Low Carbon Development in China. 2015. Available online: https://www.brookings.edu/events/reviewing-chinas-low-carbon-development-and-tackling-climate-change/ (accessed on 16 February 2017).
Figure 1. The marginal abatement cost curve (MACC) in theory.
Sustainability 09 00322 g001
Figure 2. The benchmark curve of the Hubei cement industry (by the percentage of firms).
Sustainability 09 00322 g002
Figure 3. The benchmark curve of the Hubei cement industry (by the number of firms).
Sustainability 09 00322 g003
Figure 4. The MACC of Hubei Cement Industry.
Sustainability 09 00322 g004
Table 1. Greenhouse gas (GHG) benchmark methodologies of the European Union Emission Trading Scheme (EU ETS).
MethodologyValueUnitsConditionsRelevant Emissions
Product-basedDepends on productt CO2/unit productIf a product benchmark is availableEmissions within the system boundaries of the product
Heat benchmark62.3 t CO2/TJIf no product benchmark is available
If heat is measurable
Emissions relating to production of the consumed measurable heat, not covered by a product benchmark
Fuel benchmark56.1t CO2/TJIf no product benchmark is available
If heat is not measurable
If fuel is combusted
Emission originating from the combustion of fuels, not covered by product or heat production benchmark
Process emission approach97% of historical emissions (t CO2)t CO2/TJIf no product benchmark is available
If heat is not measurable
If emissions do not result from combustion of fuel
If emissions are ‘process emissions’
All emissions with the installation not covered by the previously mentioned approaches
Source: ECOFYS, 2009 [16].
Table 2. Comparison of three GHG benchmark approaches for the cement sector.
ApproachPeriodApplied UnitBenchmark ProductStringency
Waxman-Markey benchmarkDefeated in 2009FirmsCementAverage of performance
EU ETS benchmark3rd phase of the EU ETS (2013–2020)InstallationsClinker (Without consideration of the level of blending with mineral additives)Average 10% of the best performance
California Cement benchmarkPost-2013FirmsCement90% of average performance
Source: ECOFYS, 2009 [16]; CARB, 2011 [11].
Table 3. Total cement production and CO2 emissions (2009–2012) from the 35 cement factories.
Year200920102011
Total cement production (Mt)29.545.554.4
Total CO2 emission (Mt)36. 647.054.9
Notes: (1) CO2 emissions calculated in this study are total emissions, which include both direct and indirect emission from the cement production process; (2) A conversion factor of 0.93 from clinker to cement and a conversion factor 1.55 from raw materials to cement were used in the calculation of cement production, where the cement factories provide either clinker production or raw material amount sinstead of the actual quantity of cement produced (The conversion factors adopted in this study for clinker to cement (0.93) and raw materials to cement (1.55) were obtained from the U.S. Environmental Protection Agency ‘Energy Efficiency Improvement and Cost Saving Opportunities for Cement Making’, August 2013. The conversion calculation in this article takes into account the emission based on fuel use, combustion, and the calcination process, which has been adopted by previous studies); (3) The Hubei cement production data were from the Hubei GHG Inventory (2009–2012) based on the 35 cement factories’ production of clinker and cement.
Table 4. Fuel and electricity savings, CO2 emissions reduction, fuel and electricity Savings, CO2 emissions reduction, and the adoption rate for the 40 selected technologies.
Energy Efficiency Technology/MeasureFuel Saving (PJ)Electricity Saving (Kwh/ton)CO2 Reduction (Mt)Current Adoption Rate
Fuel Preparation
Four-channel PCI combustion energy-saving technology0.6-0.05 0.01
Installation of variable frequency drive0.6-0.05 0.05
New efficient coal separator0.090.360.01 0.30
Raw Materials Preparation
Efficient transport system for raw materials preparation18.55 -1.55 0.15
High efficiency classifiers0.19 5.080.02 0.90
Raw mill blending system0.10 2.660.01 0.900
Raw material vertical mill technology1.9 90.16 0.45
Clinker Making
Conversion to grate cooler9.44 25.930.79 0.03
Dry cement kiln energy monitoring system technology optimization4.82 -0.40 0.00
Efficient grate cooler technology3.0 20.25 0.10
Energy efficient separator technology1.2 5.0 0.10 0.35
Energy management and process control in clinker making0.22 1.470.02 0.60
ERP system0.7 20.06 0.05
Flexible drive permanent magnetic vortex energy-saving technology0.25 -0.02 0.01
Flue gas heat recovery for power generation1.6 -0.14 0.50
High solid-gas ratio of cement suspension preheater decomposition12.0 -1.01 0.20
Increasing number of preheater stages in rotary klins6.28 2.50.53 0.05
Klin shell heat loss reduction2.03 60.17 0.1
Low pressure drop cyclones for suspension preheater0.39 2.60.03 0.6
Low temperature heat recovery for power generation10.8 360.91 0.20
Multi-channel combustion technology0.7 -0.06 0.05
Optimize grate cooler1.20 80.10 0.6
Replacing vertical shaft klins with new suspension0.46 6.10.04 0.8
Saving copper clad aluminum busbar technology1.73 -0.15 0.10
Steady popularity propelled clinker cooling technology0.6 1.50.05 0.02
Upgrade clinker cooler6.69 -0.56 0.3
Finish Grinding
Efficient roller and mills3.0 100.25 0.20
Energy management and process control in grinding6.08 −7.20.51 0.9
Leaf Curl series centrifugal fan technology0.6 -0.05 0.01
The new energy-saving technologies cement pre-grinding system2.71 -0.23 0.01
Vertical cement grinding mill technology4.3 120.36 0.05
Grinding efficient energy-saving technology optimization22.1 40.0 1.85 0.20
High pressure roller press for ball mill pregrinding0.11 10.01 0.7
General Measures
Adjustable speed drives0.02 0.130.00 0.5
Alternative fuel0.66 2.50.06 0.3
Combustion system improvements1.60 −20.13 0.5
High efficiency motors0.05 0.160.00 0.20
Product Change
High efficiency drying for slag0.09 1.20.01 0.80
Slag powder production3.72 110.31 0.10
Product and speed stock change1.55 4.580.13 0.10
Note: The data in this table were obtained from the China National Development and Reform Commission, the National Extension Directory of Important Energy Conservation Technology (1–6) [20,21,22,23,24,25], and the China Ministry of Industry and Information Technology (2014).
Table 5. The expected CO2 emissions reduction under the three benchmarking approaches.
Benchmark Stringency
(t CO2e per ton product)
BM1BM2BM3
1.000.950.89
Allocation of CO2 Emission allowances
(Mt CO2e)
AL1AL2AL3
54.447.544.5
Expected CO2 Emission reduction
(Mt CO2e)
E’1E’2E’3
0.57.410.4
Note: (1) The benchmarking value is calculated based on the individual emission and production data of the 35 cement factories in Hubei; (2) The cement product amount used in the calculation of the allocation of CO2 emission allowances is the 2012 production data from the 35 individual cement factories in Hubei; (3) The actual total CO2 emission used in the calculation of the expected CO2 emission reductions from the total emission data of the 35 individual cement factories in the year 2012; (4) The correction factor used in the calculation of allocation is 0.92 for the three benchmarking approaches; (5) The industrial assisting factor is not considered in this calculation because of the impact of its value in EU ETS and California Cap-and-Trade Program is minimal.

