Article

Integrated Supplier Selection Framework in a Resilient Construction Supply Chain: An Approach via Analytic Hierarchy Process (AHP) and Grey Relational Analysis (GRA)

1
BIM Research Center, School of Construction Management and Real Estate, Chongqing University, Chongqing 400045, China
2
School of Built Environment, Curtin University, Perth, WA 6845, Australia
3
Department of Housing and Interior Design, Kyung Hee University, Seoul 02447, Korea
*
Author to whom correspondence should be addressed.
Sustainability 2017, 9(2), 289; https://doi.org/10.3390/su9020289
Submission received: 21 December 2016 / Accepted: 12 February 2017 / Published: 16 February 2017

Abstract

:
Construction supply chain management is a unique and problematic issue within the construction industry due to its inevitable external risks and variations. The resilience capability of a supplier is of significance in supplier selection; a supplier selected in the context of a resilient construction supply chain (RCSC) is referred to in this research as a “resilient construction supplier”. This paper proposes a supplier selection framework tailored to effective information integration for supply chain management. The proposed framework works by integrating building information modeling (BIM) and a geographic information system (GIS) in a RCSC. BIM and GIS together provide highly transparent construction material information, enhanced supply chain status visualization, and workable access information for supplier selection. Supplier performance is evaluated via seventeen resilient criteria under a combined methodology consisting of the analytic hierarchy process (AHP) and grey relational analysis (GRA); AHP and GRA weigh the criteria and rank the suppliers respectively. By varying the weightings given to each criterion, sensitivity analysis was conducted to identify the criteria of resilience which impact the selection priorities of suppliers. An illustrative example is also provided to show the overall process of the proposed framework.

1. Introduction

In recent years, many researchers have emphasized the need for supply chain management in the construction process due to the increased complexity and size in construction projects [1]. Efficient construction supply chain management has the ability to improve the performance of a project and reduce waste caused by inefficient materials management and control [2]. Construction supply chains are not simple chains or processes, but are complex networks that require planning and control of construction materials throughout the entire construction process [2]. This increases the risk and difficulty associated with construction supply chains [1].
Construction projects with complexity and uniqueness often trigger various changes and unexpected situations during the delivery process, where disruptions can occur at any time because of both internal and external sources. Suppliers in most cases are inevitable sources of external risks [1]. The selection of suppliers in construction supply chain is a multi-criteria decision making (MCDM) problem that involves the consideration of both qualitative and quantitative factors. Suppliers in the construction supply chains should be able to provide an efficient and effective response to possible disruptions. Traditionally, managers only pay attention to purchasing from suppliers who can provide them with materials and services at a lower price, a higher quality, and a shorter lead time without considering other performance, such as their flexibility performance, risk management abilities and environmental performance [3].
“Resilience”, or the adaptive capability of the system to respond to disruptions, is an important aspect of any supply chain [4]. A construction supply chain that is able to respond to its original state (or better) after a disturbance can be defined as an RCSC. As described by Rajesh and Ravi [1], a supplier to be selected in a resilient supply chain is, by definition, a “resilient supplier”. The supplier’s ability to manage risk and contingencies better than their competitors is the essence of supplier resilience [5]. In a word, this paper define a resilient construction supplier as, “suppliers who are able to provide good quality products such as construction materials at economy rates and flexible enough to accommodate demand fluctuations with shorter lead times over a lower ambience of risk without compromising on safety and environment practices in a construction supply chain” [1]. One of the most appropriate approaches is varying the weights of criteria to select the appropriate supplier in order to reduce the impact on the entire construction supply chains when a risk occurs [1,6]. While there have been studies dedicated to selecting resilient suppliers in the manufacturing industry, there have been few dedicated to doing so within the unique context of the construction supply chain.
A closer look at the construction industry shows that a considerable amount of information delay and resource waste is produced due to improper management of the material supply chain (e.g., delivery services, inventory, and communications) [7]. In this regard, the use of information technology (IT) may facilitate better material management and control to minimize waste and delays [8]. Construction supply chain management is known to benefit from IT applications [7] such as BIM and GIS, two efficient tools that support information exchange and decision making analysis, especially in regards to construction projects [7].
The objectives of this research are: (1) to explore the detailed operations and the information flow of an integrated BIM and GIS applications among various RCSC stages and processes; (2) to identify appropriate resilient supplier evaluation criteria and establish a mathematical resilient construction supplier selection model; (3) to present the whole process of the proposed supplier selection mechanism with an illustration case.
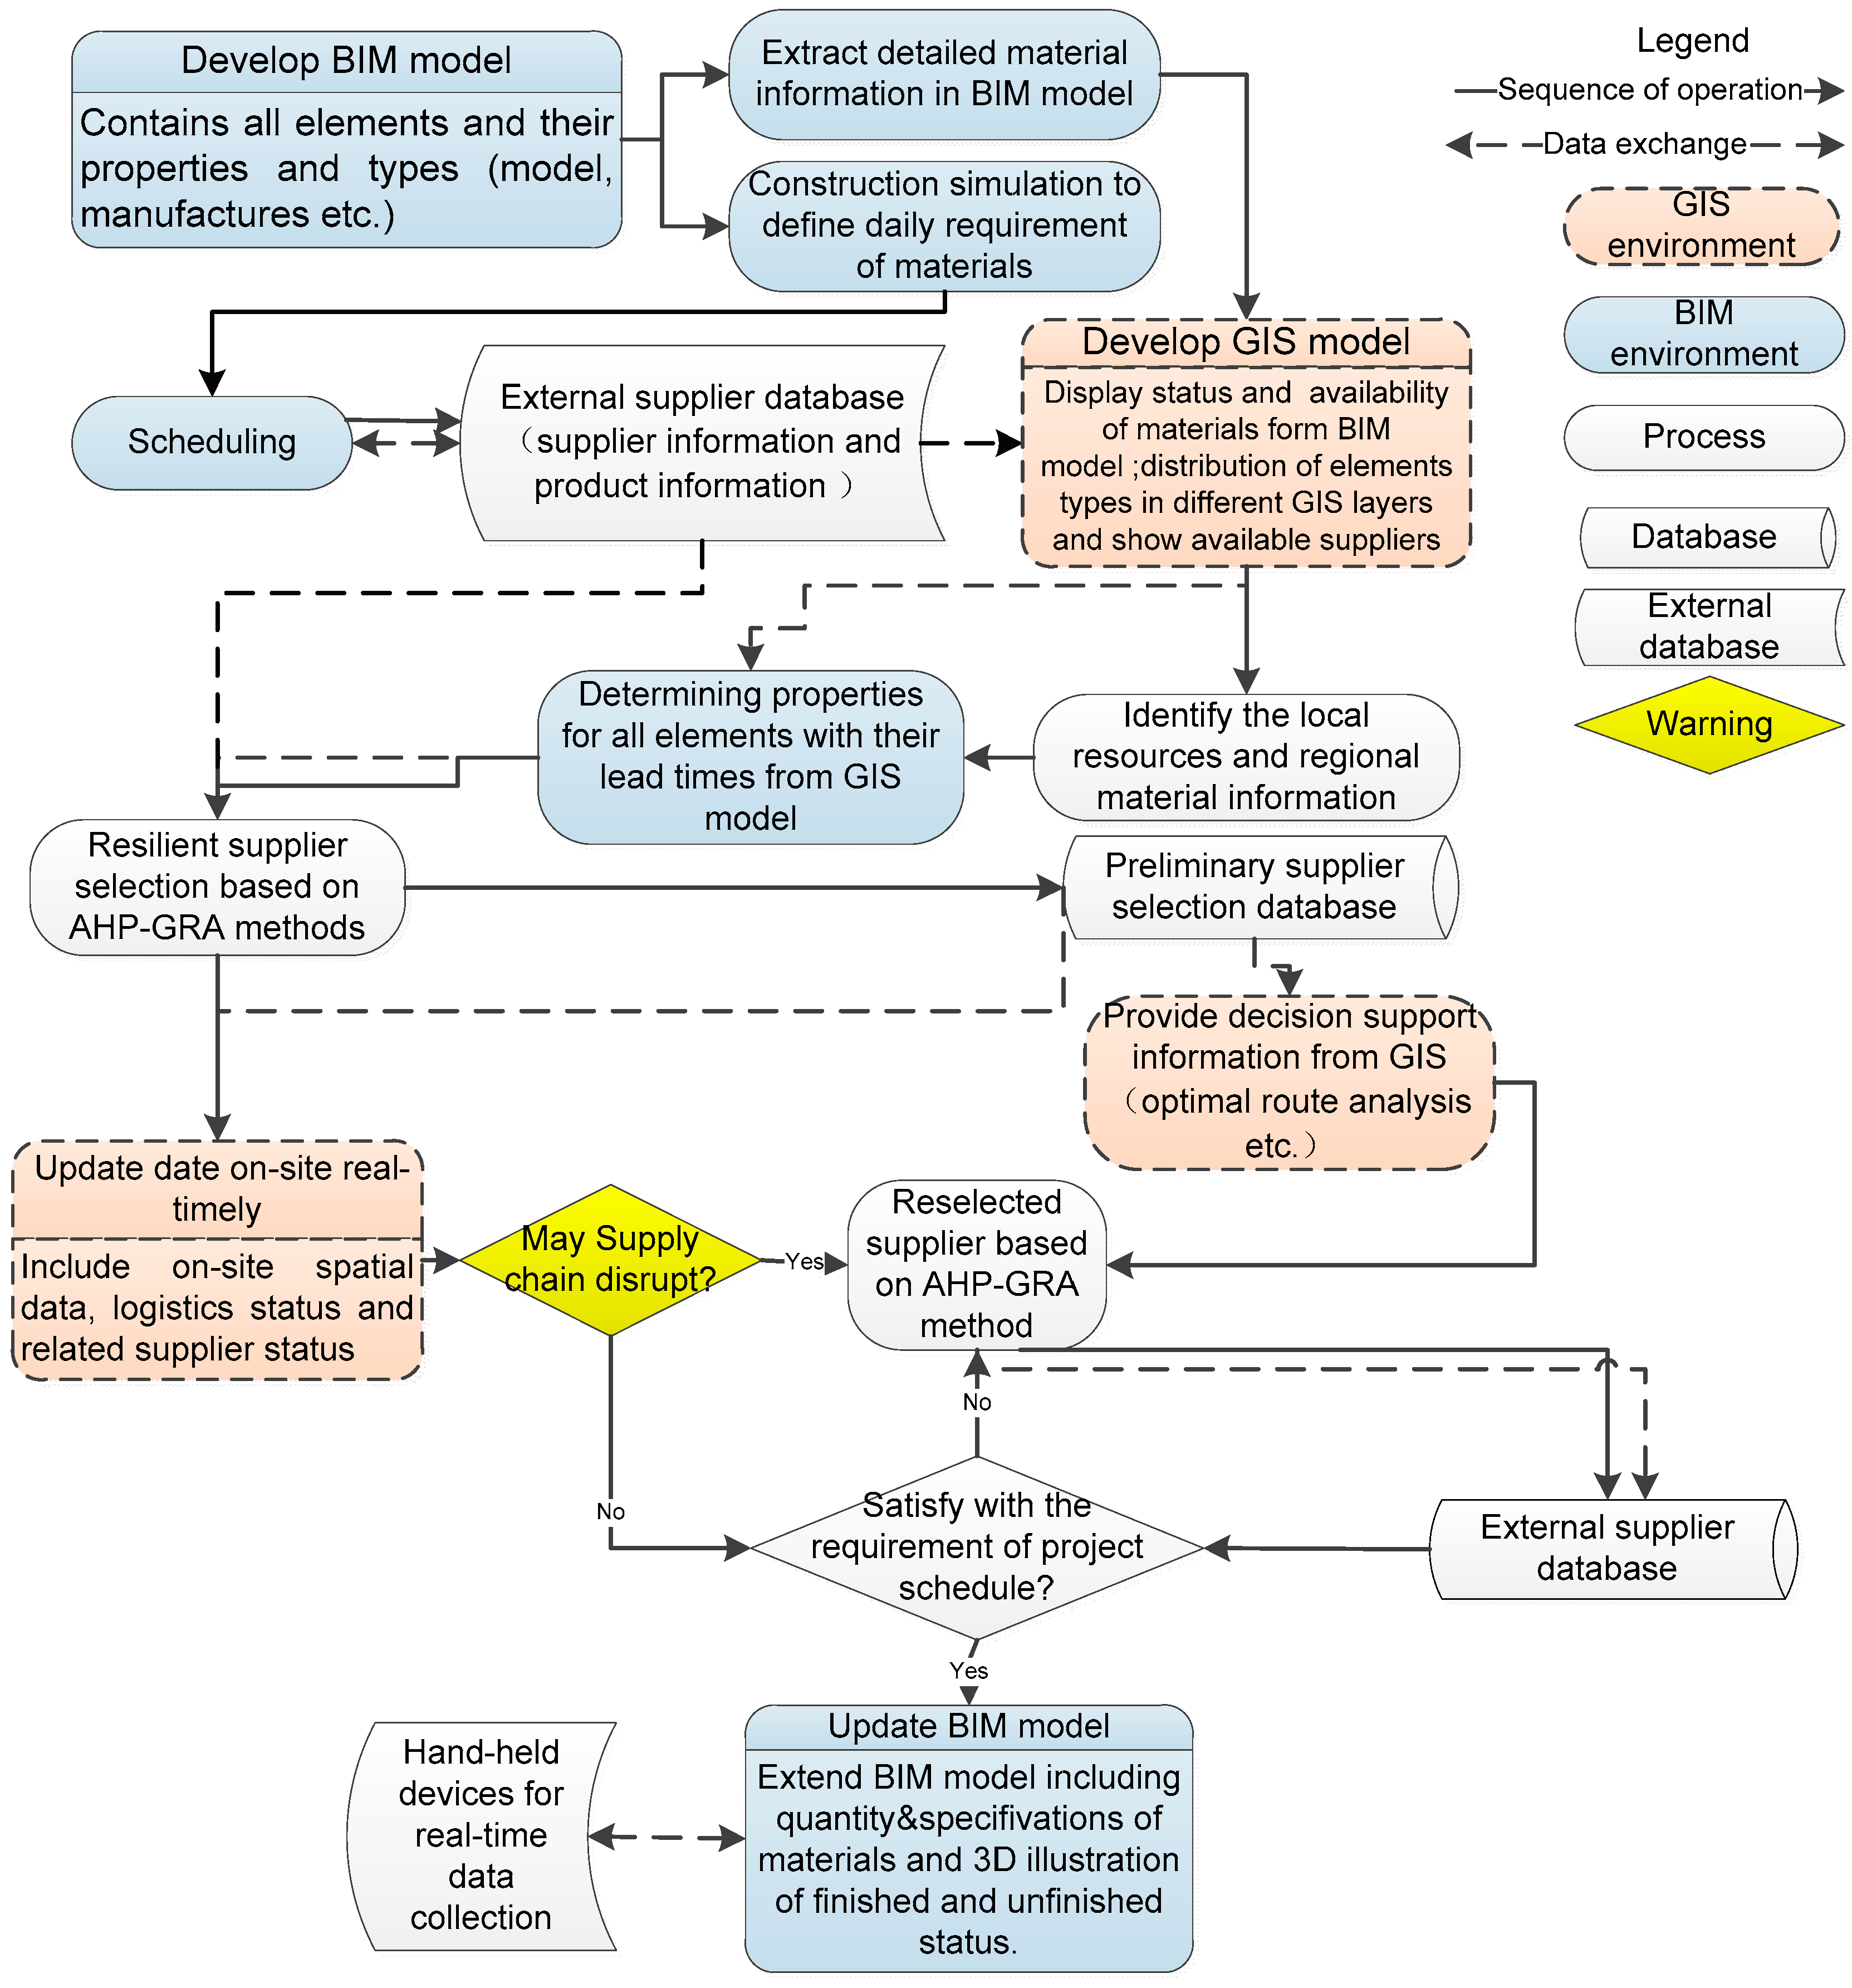
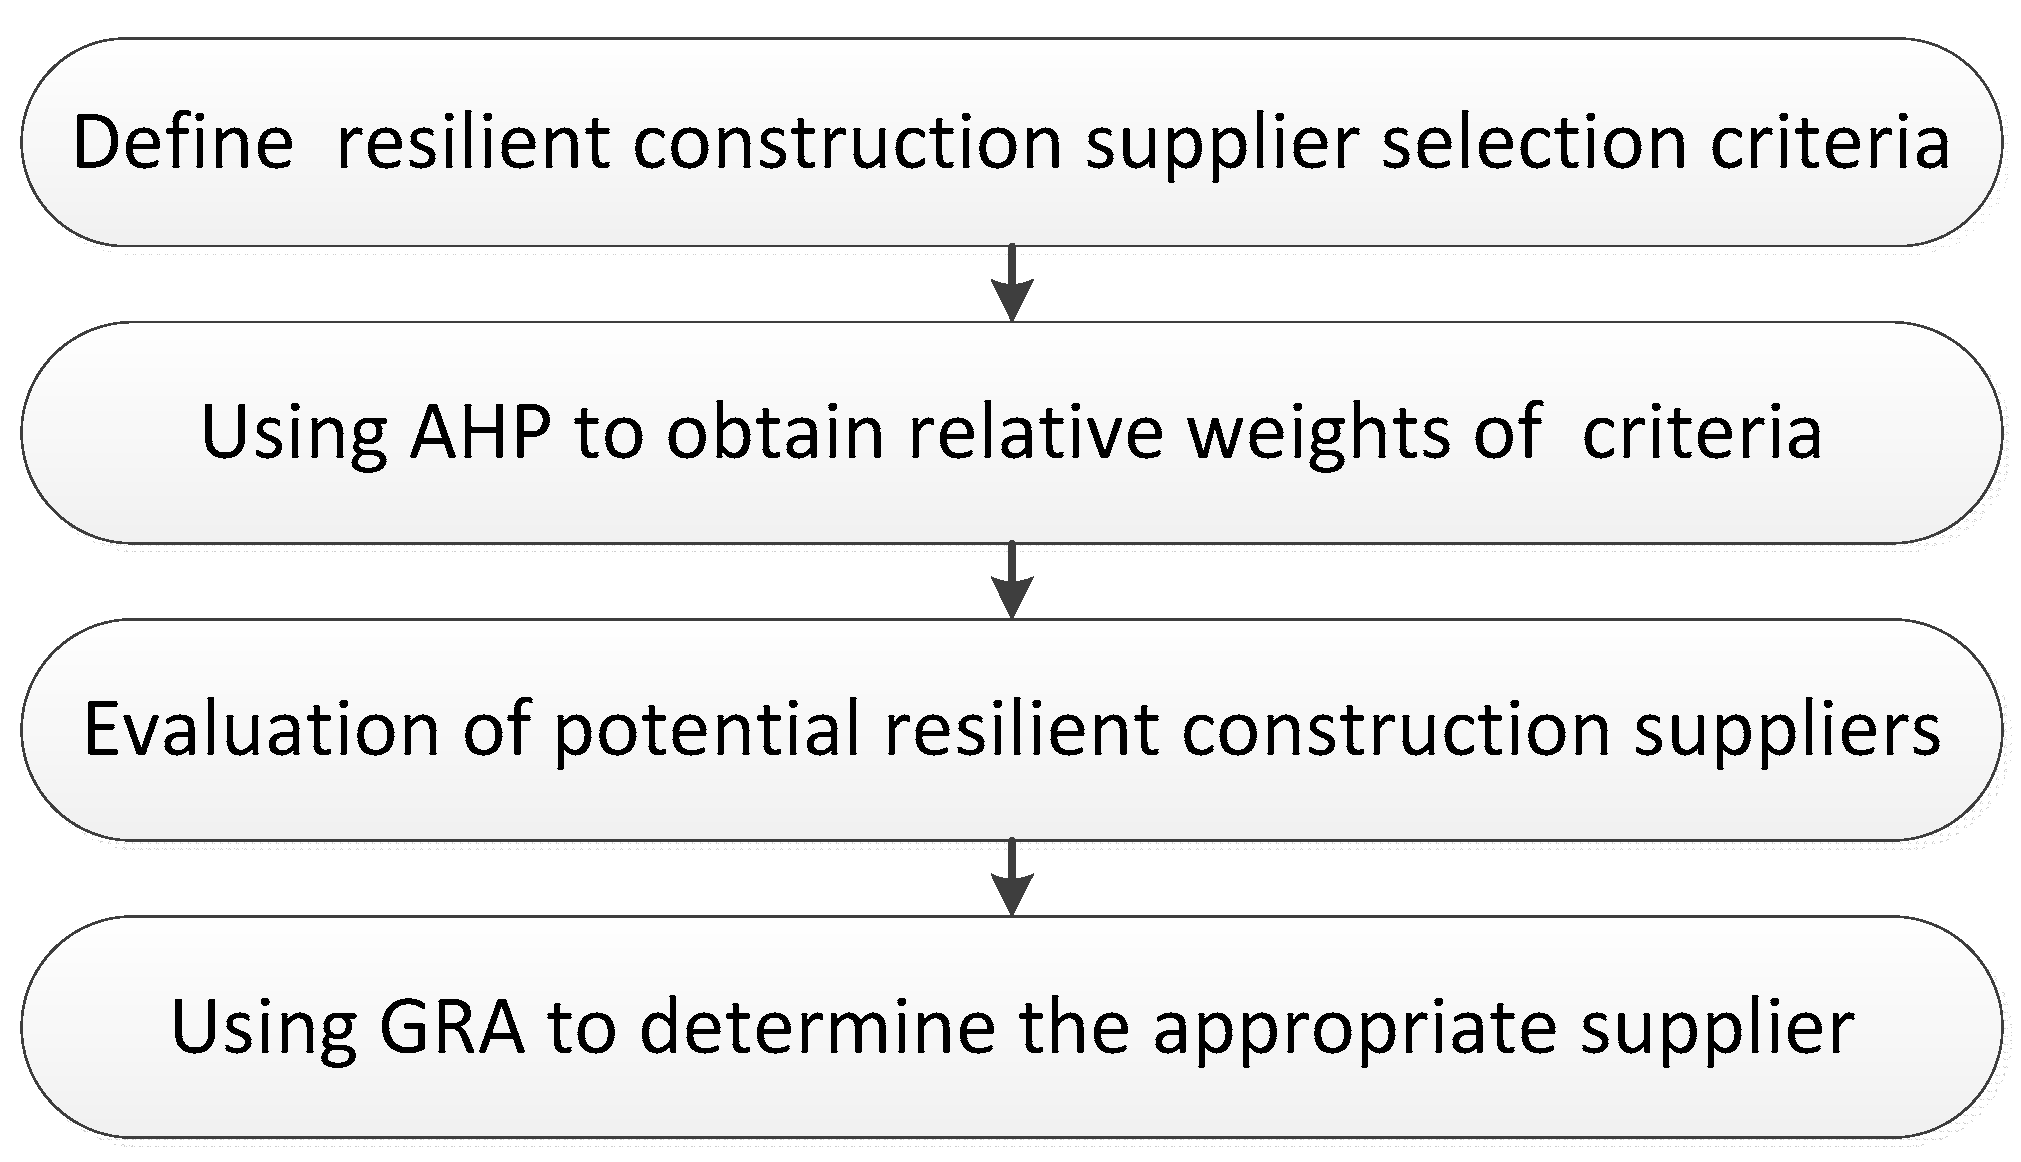
This paper presents a multi-criteria, RCSC-based, supplier-selection evaluation mechanism. The AHP is used to systematically integrate various judgments from separate evaluators in order to set the weights of the criteria; the supplier selection criteria discussed here originate from literature, thus representing a generalized framework. The AHP “evaluators” of said criteria consist of a committee of procurement analysts. AHP does not apply, however, to uncertain relationships between one main factor and all the other factors in a system. Constitutionally, said connection can be considered as a “grey set”. GRA, a well-accepted solution to decision-making problems, combines both qualitative and quantitative data by considering of larger—the better or smaller—the better evaluation criteria [9]. In summary, the proposed methodology combines AHP and GRA to assess potential suppliers; the sufficient and instant supplier information is obtained via a combination of BIM and GIS.
The benefits and the role of adopting BIM and GIS in our framework can be identified based on previous researches. BIM technology provides digital representations of a facility [10], from the decision-making process to the final facility management stage. This technology can efficiently help visualize detailed information of project materials and support decision making in the early stage [11]. GIS is excellent at data processing and allows presentation and analysis of the integration of existing objects, geographic information, and surroundings in abstract ways [12]. When GIS layout data is linked with three-dimensional (3D) site models, the entire material circulation path in the site can be vividly simulated [13]. The substantial input data required within the construction supply chain is often derived from both automated sources (software applications, bar code readers, sensors, and analytical instruments) and manual interactions. Applications of GIS, Radio Frequency Identification (RFID), and the Global Positioning System (GPS) have the advantage of tracing the status of materials, minimizing the collection of labor-intensive information, and avoiding the defects usually seen in human transcription [14,15]. They can not only improve the efficiency, but also reduce errors and labor costs caused by human entry. The advantage of exchanging real-time and updated information allows the timely finding of CSC disruptions while conducting the supplier selection process.
Based on an existing set of Level of Development (LOD), LOD 300 is on the documentation of a product and consists of non-graphical information. Typically, LOD 300 is more precise in terms of quantity, size, shape, location, and orientation that is specifically required in the construction stage of a construction project [16]. Therefore, BIM with LOD 300 has been used in this research as a method to define discrete quantifiable elements to show detailed material and component properties. The quantity information included in BIM can be exported to a spreadsheet or an external database [17]. It is important to note that some information cannot be extracted or calculated from BIM and instead must be manually entered. For example, when an element (e.g., scaffolding) does not exist in the building model or a needed quantity cannot be calculated based the component properties [12]. Here, the BIM visualization capability is exploited to generate reports and alerts graphically; this drastically reduces the amount of time needed to generate bills of quantities and yields a 3D visualization of the material status instantaneously by comparing the incoming quantity versus the planned quantity without necessitating statistical reports [7]. Many BIM tools can also link construction schedules to the 3D model to build visualizations of the sequential construction of the buildings [18]. This is important because when physical obstacles occur, materials status cannot easily be seen on a construction site—computer-aided visualization is necessary to facilitate process status reporting. Once the visual report based on a BIM workup becomes available, the status of materials and their final locations can be easily seen. The entire material status will be ultimately monitored and made clear [19].
To evaluate logistic constraints in the material delivery process, GIS is an effective tool for displaying geographic and spare information (e.g., location of suppliers within the transportation network, simulated transportation paths) in the entire supply chain process by using special analysis function [13]. In this sense, some GIS modules (e.g., the transportation network analysis tool) of the framework yield valuable information for material manager by depicting supplier locations in order to suggest ideal solutions to minimum transport paths in a specific network [20].
The specific monitoring process, tools, and results they yield to assist design decisions are not the primary focus of this research though BIM and GIS do assist in facilitating the entire supplier selection process. The primary role of these technologies within the proposed framework is to provide efficient, sufficient, and instant information (e.g., detailed construction quantity take-off, construction schedule, construction simulations) for effective resilient supplier selection. A combined AHP and GRA form the core of the supplier selection methodology of the framework.
This paper is organized as follows: Section 2 presents a thorough literature review on resilient supply chains, supplier selection problems and IT applications in supply chain management. The framework of supplier selection integrating BIM and GIS is developed and described in detail in Section 3. Section 4 identifies the resilient criteria and procedure for the integrated AHP and GRA methodology in the supplier selection process of the proposed framework. Section 5 applies the proposed framework to an illustration of a scenario construction project, and Section 6 presents the results followed by a sensitivity analysis. Section 7 concludes the paper and discusses the research limitations and scope of future work.

2. Literature Review

2.1. Resilient Supply Chains and Supplier Selection Problems

Supply chain management is traditionally sought to encompass the planning and management of all activities involved in sourcing and procurement, conversion, and all logistics management activities [21]. Vrijhoef and Koskela [22] presented four roles and possibilities of supply chain management in the construction industry. They also highlighted different arrangements between the project site, immediate suppliers, and/or the extended supply chain of construction industry [22]. Dubois and Gadde [23] analyzed the couplings among activities, resources and actors in different dimensions to find that the pattern of coupling seems to favor short-term productivity while hampering innovation and learning. Winch [24] stated that manufacturing models can be applied to the construction industry by carefully modifying them per certain concepts and the complex systems they represent—especially those associated with project management and the role of systems integrators. Segerstedt and Olofsson [25] discussed various problems and opportunities associated with supply chain management in the project-based construction industry; they assert that if a construction company wants to establish a new concept, for example, from “engineer to order” to “configure to order”, it must be engaged early on and with other than usual customers, which might complicate the process.
Modern supply chain management is a complex function incorporating wide variety of risks, ranging from minor risks such as delays to risks such as disruption of an entire chain [26]. Identifying flexibility and resilience within the supply chain is critical for reducing potential risks [4]. Lee [27] proposed the triple “A” principle of “Alignment, Adaptability and Agility” as strategies for supply chain resilience. Christopher and Peck [28] suggested in Building the Resilient Supply Chain that three important aspects should be considered in creating the resilient supply chain, which are resilience designed in, high level of collaborative working and agility implementation. Tang identified the flexible supply base as one of the prime enabler of supply chain resilience [29]. Mensah et al. [30] stated that supply chain vulnerability is a major concern in many organizations. They used Information Communications Technology (ICT) in collaboration with certain strategies to develop a resilient supply chain. Kristianto et al. [31] designed a reconfigurable supply chain network by optimizing inventory allocation and transportation routing. Chowdhury and Quaddus [32] developed a 0–1 multi-objective optimization model based on Quality function deployment (QFD) methodology to mitigate supply chain vulnerabilities. Gong et al. [33] designed and constructed a resilient supply chain model with focus on restoration strategies to limit impact of disruptions on customers. Kristianto et al. [31] designed a two-stage programming with fuzzy shortest path model of resilient supply chain network. Torabi et al. [4] proposed a bi-objective mixed possibilistic, two-stage stochastic programming model to address supplier selection and order allocation problem to build the resilient supply base under operational and disruption risks.
Mitra et al. [34] assert that a supplier requires resilience to mitigate the risks through suppliers with high visibility. Mitra et al., Sawik, and Torabi et al. [4,34,35] separately pointed out several critical factors in designing a resilient supply chain and selecting resilient suppliers. Peck [36] found that high levels of collaboration with suppliers and flexibility in the enterprise itself can improve resilience. Quality, delivery, cost, and other traditional economic criteria in supplier selection models should also be analyzed during the supplier selection process [3]. An increasing number of scholars are addressing supplier selection in the light of increasing stringent requirements for environmental and friendliness and sustainability, as well [37,38,39]. Hashemi et al. [40] stated that both environmental (e.g., pollution production, resource consumption, and eco-design) and conventional factors need to be considered when selecting the most appropriate supplier for partnership. Rajesh and Ravi [1] established a framework of resilience imparting attributes to select suppliers in the context of an electronic supply chain, and stressed that issues related to the environment and sustainability should be emphasized for a future resilient supply selection model.
Banker and Khosla [41] proved that the supplier selection process is an important decision making area in operations management. Verma and Pullman explored the supplier selection process based on the relative importance of different criteria such as quality, price, flexibility and delivery performance [42]. Several decision-making approaches for supplier selection have been introduced over the past decades including the Analytic Hierarchy Process (AHP), Analytic Network Process (ANP), the genetic algorithm (GA), Grey Relational Analysis (GRA), and data envelopment analysis (DEA). Generally, these methods focus on improving the accuracy of supplier selection/evaluation for final ranking and selecting suppliers. De Boer et al. [39] provided a helpful literature review on supplier selection methods encompassing all stages from initial problem definition to final choice of qualified suppliers.
Schade et al. [43] proposed a BIM-based decision-making framework using a performance-based design process in the early design phase. According to Ho et al. [44], multi-criteria approaches are better than traditional cost-based approaches. Rajesh and Ravi stated that the three major evaluation models for supplier selection are linear programing (LP), non-linear programming, and mixed integer programming [1]. Mitra et al. [34] analyzed the resilience of supply chains, and built a fuzzy mathematical programming model. Klibi and Martel [45] designed a mixed integer programming supplier selection model for disruptions and for allocating order quantities among appropriately selected suppliers. Sawik [35] proposed a mixed-integer programming model to deal with supplier selection issue in a supply chain under disruption risks. In short: There has been a wealth of research on various supplier selection methods in a variety of contexts [37,46,47].
This research intended to develop a combined AHP-GRA resilient supplier selection model. The concepts of grey theory introduced by Deng in 1982 combine concepts of system theory, space theory, and control theory [48]. Grey-based methods are able to capture, process, and integrate uncertainty in the decision-making process. Hashemi et al. [40] summarized some advantages of choosing grey theory [49] as a supplier selection method. Firstly, the Grey approach considers the condition of fuzziness and flexibility regarding the inconsistent information in group decision-making situations [49]. This methodology also allows supply chain analysts express the rating of attributes in natural language expressions, which can be associated with preassigned grey values [1]. Another major advantage of Grey system theory is that it can achieve satisfactory outcomes using a rather small amount of data or with a large amount of variability in the factors [50]. For these reasons, GRA has been suggested as one of the best approaches to decision making in the supplier selection applications [40].
However, there are some notable drawbacks and limitations of the existing developed GRA models in the literature. For example, GRA generally ignores the aggregation of the decision-makers’ preferences, where there has either been a lack of a weighting method or the use of a simple arithmetic mean of different opinions for weighting the criteria [40]. Methods like AHP [51] can be utilized to mitigate this drawback. AHP is capable of reflecting the natural preference of the human brain to sort components of a system into distinctive levels and group similar components in each level. It is commonly used to define weights in linear index systems [46]. Integrating AHP with GRA method maximizes the advantages of both and addresses criteria weighting problem inherent to the GRA model while facilitating multi-objective supplier performance evaluation. In the integrated methodology proposed here, GRA is applied to the resilient construction supplier selection process; AHP is used to determine the evaluation criteria weights [52]. The detailed steps for AHP-GRA are described in Section 4.

2.2. Information Technology Applications in Supply Chain Management

According to Cus-Babic et al. [53], the integration of information flows in relation to material management throughout the construction supply chain can improve supply chain transparency in terms of specific construction projects. Mahalik and Kim [54] employed IT in food supply chains, for example, to improve product safety and quality [54].
BIM is a digital technology that can, as discussed above, improve the efficiency and quality of construction projects [55]. Timo et al. found [56] that 3D/4D models have been applied successfully for virtually reviewing facility designs during the design phase and for visually analyzing construction sequencing during the construction phase. This research also pointed out that further researchers need to explore work and business processes that integrate 3D/4D models into the currently prevailing processes of the construction industry [56]. Aram et al. [57] developed an information flow process model for concrete reinforcement over its supply chain; in doing so, they proved that that BIM tools are applicable to four specific areas: (1) design and modeling; (2) editing, updating and optimization; (3) interoperability; and (4) project and construction management.
Zhang et al. [58] presented an interactive four-dimensional (4D) Construction Site Management System (CSMS) within which a 4D site management model is linked to a 3D construction project model with a project activity schedule, allowing the entire material circulation path in the site to be visually simulated. Farshid Shadram [59] proposed a framework that supports design decisions and enables assessment of the embodied energy associated with the building materials supply chain based on suppliers’ Environmental Product Declarations (EPDs). Hinkka and Tätilä [13] presented an RFID tracking implementation model for technical trade and construction industries. According to Ergen et al. [60], an automated system using both RFID and GPS technologies can improve efficiency and reduce data entry errors and labor costs. In this regard, an integrated automatic information system can indeed improve supply chain transparency.
Irizarry et al. [7] integrated BIM and GIS technology into a unique system that improves the visual monitoring of construction supply chain management, enabling the system manager to track supply chain statuses and heed warning signals to ensure the delivery of materials. The input data required for construction supply chain management is often derived from both automated sources and manual interactions [61]. Irizarry et al. [7] also insisted that a completed framework process should be firstly established to clarify the entire process of construction supply chain management. They classified the key works of each construction stage as follows: (1) In the pre-design decision process, the distribution of suppliers and identification of resource availability; (2) In the sourcing process, the total cost should be analyzed in order to determine suppliers of various materials and the impact of their locations on cost and schedules for the project; (3) The logistic process involves the key works of visualizing logistics patterns and track material or resources; (4) The performance management process requires defining the key performance indicators (KPIs) such as cost and time, and preparation of a plan reflective of real-world situations; (5) Finally, in the monitoring inspection process, visual monitoring should be conducted [7].
In this context, a workflow of this study’s framework is first established shown in Figure 1 in order to get full appreciation of the entire process of supplier selection. The key works of each stage in a typical construction project are described in Table 1. It should be noted that MS Access serves as a central database where all BIM data, GIS data and supplier’ data can be exported/imported as 2D/3D objects into the database.

2.3. Research Gaps

The literature review indicates several issues related to supplier selection. First, although some studies have established supplier evaluation criteria systems, only a few have included both economic and environmental criteria in a single construction supplier selection framework. Moreover, there are limited studies has established resilient supplier selection criteria in the context of construction supply chains [1,40]. Most studies are centered around exploring new selection methodologies. Some studies have explored new concepts to improve the efficiency, transparency and resilience in supply chain management; green supplier selection has been considered as necessary concept to support sustainable construction in recent years as well. Previous researchers have used a variety of IT applications for construction supply chain management including BIM and GIS [7,12,63], but there has been no fully successful integration of the two tools to provide sufficient and real-time information during construction supplier selection processes. The extant research does not properly address the selection of a supplier by integrating BIM, GIS, and multi-attribute decision making (MADM) tools in the context of the RCSC; this study was conducted in an effort to close this gap. Therefore, the goal of this research is to propose an integrated BIM and GIS supplier selection framework in an RCSC. A grey-based resilient supplier selection model was also established in this study by integrating two techniques, the AHP and GRA.
The results of this study may provide a workable approach for construction firms seeking to enhance their resilient capabilities. On the other hand, this attempt could also facilitate construction supply chain management by taking advantage of data richness and visualization capabilities of BIM and GIS in a single system. This has motivated the authors to develop a framework for the same.

3. Integrated BIM and GIS Supplier Selection Framework

An integrated BIM and GIS system is used to visualize the interaction of information and to improve the efficiency and transparency of the supplier selection process. If the suppliers selected preliminarily do not fulfill the project schedule when emergencies or variations emerge in a project process, they may be reselected.
The overview of the RCSC-based supplier selection framework, including the sequence of operations and the flow of information among various stages and processes, is shown in Figure 2. The different stages of the proposed framework are detailed in the sub-sections below.

3.1. Step 1—BIM Model Development: Material Procurement Information

In the first step, the BIM model includes detailed elements of a building and corresponding types (model and manufacturers), and can be developed for procurement use. The building information required (graphical and related semantic information) is provided as an IFC file [7] and can be manipulated by BIM tools as needed. Each data inputs can be checked and modified for completeness and consistency per its corresponding supply chain information. These inputs play an essential role for the entire supplier selection process. Each piece of data is inputted only once in the main BIM module [12].
Following the previous steps, information including the material delivery schedule, the building components and their installation locations, and the schedule of their relevant activities can be extracted for further use by the GIS. Construction simulations should be conducted in this stage to define specific daily types, properties, and quantities of materials. By extending the use of BIM from the design into the construction stage by linking the quantity take-off of building components with construction recipes, BIM can be utilized to estimate the resource needed in the construction supply chain [64]. The construction recipe contains information about how the components are built and consists of the separate works tasks and resources to construct a specific components [64]. Normally, the schedule can be generated based on recipes and location-based quantity take-off, related to the construction site and resource constraints [65,66].
However, it should be noted that material demand forecasting from the project schedules are sometimes uncertain due to the existence of various constraints [7]. Each simulation run can use the intelligent simulation engine in BIM (e.g., Weizhuo and Tomoas’s integrated simulation engine [64], Revit Nevisworks application) to read information from the BIM database automatically to ease this constraint. Alternatives in the BIM modeling process such as design modifications (sometimes called “design uncertainties”), alternative construction methods and different resource allocations can be explored without manually checking and re-formalizing the simulation model [64]. This allows the BIM model to make a more detailed estimation, taking into account the variation in productivity of the workers, the capacity of the supply chain and the uncertainty on the construction site [64].
MS Access serves as a central database from which all BIM and GIS data and external supplier data can be exported/ imported as 2D/3D objects [7]. The external supplier database should be established a priori by the project contractor include the basic information of potential suppliers (e.g., contact information and resources provided), their locations, their internal and external competitiveness (e.g., management level, reputation and prestige) and any other performance indicators. The contractor establishes this information through previous collaborations with suppliers as well as external resources; good Supplier Relationship Management (SRM) is of considerable significance in this regard. The external supplier database should also be linked with the project schedule to allow real-time information update.

3.2. Step 2—Developing the GIS Model: Material and Supplier Information Visualization

A GIS model with information gleaned from the previous step (e.g., material delivery schedule, building components and their installation locations, and schedule of their relevant activities) must be developed to determine the relative distance between the available resources defined via BIM and the construction site itself, and ultimately to assist in effective supplier selection. A GIS-based spatial analysis such as a network analysis can be used to provide an optimal solution for supplier selection. Following the distribution of different types of elements in different layers, the manager can determine the appropriate suppliers of each material to fulfill schedule requirements with the help of a GIS analysis. The transportation time for each building element can also be calculated with support from the GIS, facilitating the successful management of the entire flow of materials to the project. The GIS data can also be easily updated in real time to find any contingency or risk for better reselection of resilient suppliers.

3.3. Step 3—Preliminary Selection of Resilient Suppliers

Following the previous steps, the majority of required information for supplier selection has been assured. Considering both economic and environment criteria in the RCSC, a resilient construction supplier selection criterion can be established accordingly. The integrated AHP and GRA method are employed in this step to select the most resilient possible suppliers. Each supplier selection criterion is weighted, then appropriate suppliers of each material are determined by procurement analysts to establish the preliminary supplier database.

3.4. Step 4—Reselection of Resilient Suppliers

As discussed above, a modern supply chain is a complex network of risks and disruptions. This increases both the internal and external risks associated with supply chains. In most cases suppliers are inevitable sources of external risks that can impact the entire project schedule. There are four levels of risks to which a typical construction projects is subject: (1) Process and value stream related risks (i.e., variations and certificates); (2) assets and infrastructure related risks; (3) organizational and inter-organizational risks (i.e., managerial changes); and (4) risks related with the environment (e.g., earthquakes or other natural disasters) [26]. Once unforeseen circumstances are caused by these risks, the preliminary selected suppliers may alter the project schedule or even delay of the entire project. Under the proposed framework, the relative criteria are re-evaluated and the suppliers are reselected as necessary to stay on schedule if any emergency occurs.

3.5. Step 5—Updating the BIM Model

The quantities of materials, specifications and status of constructed/unconstructed project components should be updated. This allows data to be collected by various hand-held devices (i.e., barcode, RFID, and GPS).

4. Selection Methodology in the Framework—The AHP-GRA Method

The proposed supplier selection model consists of two-level criteria, weight coefficient defined and standard and methods of evaluation. The application of the integrated model includes four main steps as shown in Figure 3 [52]. The following context will provide a description of these steps.

4.1. Supplier Selection Criteria

Considering that the supplier selection criteria are complicated and multifold, some main criteria can be selected as representatives including both qualitative and quantitative indexes. After reviewing the literature, quality, cost, and delivery are considered to be the dominant criteria in most supplier selection systems [4,35]. In addition, a supplier needs to be able to organize the level of management, ability of risk reduction, and responsiveness. To achieve supply chain resilience, a supplier should be flexible with regard to time, product, and quantity. Apart from this, it is preferable for suppliers to have a robust research and development (R&D) division (i.e., new technology and new product) to ensure sustainable competitiveness. Moreover, considering the scarcity of social resources and the deterioration of the ecological environment, a supplier should be responsive enough to environmental protection to ensure sustainability of a construction project. Therefore, a green criterion such as an eco-design should also be considered [68,69]. Consideration of all these criteria in a single framework can lead to selection and ranking of suppliers with resilient capabilities, especially in a construction supply chain. In this context, this research proposed a two-level criteria system. The primary criteria include primary performance factors, namely flexibility, enterprise capacity, R&D, and green capability. The second level includes seventeen sub criteria. The primary and sub criteria considered for the selection of suppliers in a RCSC are shown in Table 2. It should be noted that these criteria established are suitable for general situations of construction companies for selecting a resilient construction supplier.
As for the service distance criteria of every supplier, the performance value can be derived from GIS analytical results when specialists rate the criteria. According to the first two steps of developing the BIM and GIS models, the majority of required information for supplier selection has been assured. The external supplier database can provide a variety of suppliers and their products information. Criteria considered in this context for the selection of a resilient supplier, other than commodity price and cost (C12), delivery and service (C13), quantity flexibility (C23), and service distance are qualitative in nature and can be described subjectively in terms of linguistic labels. A combined evaluation method consisting of an AHP and GRA could judiciously be used to define criteria weights and assess potential suppliers.

4.2. Supplier Selection Based on the AHP-GRA Method

AHP is a popular technique under the MCDM process [91]. Both qualitative and quantitative factors are combined by using AHP in the decision-making process [44]. The AHP method is one of the most important techniques under MCDM for analyzing supplier selection issues. It has been commonly used in the definition of weights in index system of linear [46]. However, it does not investigate uncertain relationships between one main factor and all the other factors in a system. Constitutionally, such a connection can be considered as a grey set, which is significant in the criteria established.
The concepts of grey theory introduced by Deng in 1982 are a combination of system theory, space theory, and control theory [48]. The methodology of grey systems can deal with many ambiguities generated from imprecise human decisions and improve the quality of judgments by amalgamating any part of the decision-making process. One of the major advantages of the GRA methodology is to use a relatively small amount of data or with great variability in factors without requiring many samples or scatter diagrams [47,92]. Grey theory has been used in a wide variety of decision making environments related to engineering and the industry. According to the characteristics of the criteria “large-is-better” or “smaller-is-better”, the GRA method can easily compare the “distance” between the data and the ideal referential value. Additionally, considering the quantitative and qualitative characteristics of the criteria, this methodology also allows supply chain analysts to present the rating of criteria in natural language expressions, which can be related to the grey values determined [93].
Based on this, a combined evaluation method consisting of AHP and GRA has been applied to assess resilient suppliers in this study. As discussed above, GRA has been applied to the resilient construction supplier selection process. AHP has been utilized to determine the evaluation criteria weights, and transform the subjective evaluation to digital processing, consequently weakening the subjective influence of experts scoring on the selection results and establishing a multi-objective decision making model.
The integrated methodology includes: (i) Applying AHP to systematically integrate different judgments from procurement analysts and obtain the weights of criteria; (ii) Using the determined weights of the qualitative and qualitative criteria to calculate the grey weighted correlation coefficient; (iii) Using GRA to analyze the qualitative and quantitative data to perform the evaluation of supplier selection.
The detailed steps for the AHP-GRA method are as follows.

4.2.1. Determining Weights of Criteria by the AHP Approach

This paper proposes a generalized framework while also considering the fact that different organizations have various considerations for defining criteria weighs in a resilient supply chain. Thus, for each organization, a committee consisting of procurement analysts of the construction company should be established. A prepared questionnaire can be used for data collection from the committee to identify normalized weights for each primary criteria (five) and secondary criteria (seventeen). Then, the committee can analyze and determine the weights of supplier selection criteria by using the AHP method.
Generally, the process of applying AHP can be divided into following steps. First, establish a hierarchical structure by recursively decomposing the decision problem. Figure 4 illustrates the hierarchical structure of the AHP of the resilient construction supplier selection issue. Second, construct a pairwise comparison matrix to indicate the relative importance of alternatives including the total level of sorting and single level sorting. A numerical rating including nine rank scales is suggested as shown in Table 3. Afterwards, a judgment matrix shown by Equation (1) can be procured.
p = ( p i j ) n × n
Then, the geometric mean of each matrix to obtain weight vectors is determined according to Equation (2) as follows:
W = i = 1 n p i j n
Equation (3) is used to normalize the weight vectors as follows:
W i = W i i = 1 n W i , i = ( 1 , 2 , 3 , ... , m )
The relative weights and largest eigenvalue λ max are then calculated according to the following equation:
P W = λ max W
Accordingly, the consistency radio is calculated using Equation (5) where CI can be computed by Equation (6). RI denotes the random consistency index whose value can be extracted from Table 4.
C R = C I / R I
C I = ( λ max n ) n 1
When λ max = n , matrix P is a completely consistent matrix. If C R 0.1 matrix P is considered as being acceptable. Otherwise, the comparison matrix needs to be adjusted.
Similarly, the weights of the secondary criteria are calculated. Finally, the weights in every hierarchy are summarized and the total consistency radio is calculated by Equation (7), where w i represents the weights of the primary criteria, C 1 i denotes the corresponding consistency radio of the secondary criteria, and R 1 i stands for the random consistency index of the corresponding secondary criteria which can also be illustrated in Table 4. If C R t o t a l 0.1 , the matrix is considered as being acceptable.
C R t o t a l = i = 1 n w i C 1 i i = 1 n w i R 1 i

4.2.2. Ranking Alternative Suppliers by the GRA Method

GRA conducts a comparative analysis to quantify the tendency of a system. The essence of the GRA methodology is to compare the similarity of the curve composed by a number of a sequence and the curve composed by the ideal number of the sequence. The higher the similarity is, the greater is the correlation, and the rank of the correlation can reflect the extent of the priority of criteria.
The detailed steps for GRA are as follows:
(1) Identifying the potential alternate suppliers and linguistic to the grey scale of assessment of qualitative criteria
A committee consisting of supply chain analysts examined the information of suppliers who were appropriate for the operational capabilities of both the company and the situation of the project. Let S i = { S 1 , S 2 , S 3 , ... , S m } be the m set of supplier alternatives, where i = ( 1 , 2 , 3 , ... , m ) .
As for some qualitative criteria such as delivery and service (C13), quantity flexibility (C23), and service distance, the five-scale linguistic evaluations of the suppliers vary from Very Good to Poor viz, Very Good, Good, Medium, Poor, Very Poor. The sets of grey numbers associated with the ratings are determined to be 1, 0.8, 0.6, 0.4, and 0.2, respectively [67].
(2) Establishing the grey decision matrix and the ideal referential set of supplier selection alternatives
With n criteria, V i k denotes the expert decision on the selected supplier’s evaluation i of criteria k (for clarity, criteria k presents the specific secondary criteria directly), where i = ( 1 , 2 , 3 , ... , m ) and k = ( 1 , 2 , 3 , ... , n ) . V i = { V i k | i = 1 , 2 , ... , m , k = 1 , 2 , ... , n } presents the comparison sequence whose matrix form is shown as follows:
V i k = [ V 11 V 12 V 1 n V 21 V 22 V 2 n V m 1 V m 2 V m n ]
Set the optimum value V 0 k of every criteria as the entity of the ideal referential sequence which can be represented as follows:
V 0 = { V 0 k | k = 1 , 2 , ... , n }
i.e.,
V 0 = ( V 01 , V 02 , ... , V 0 n )
where V 0 k = O p t i m u m ( V i k ) , i = ( 1 , 2 , 3 , ... , m ) and k = ( 1 , 2 , 3 , ... , n ) . The optimum value can be either minimization (cost criteria) or maximization (benefit criteria).
(3) Normalizing the grey decision matrix
Equation (3) is adopted to ensure that the criteria are comparable for the normalization of the grey decision matrix. The maximization criteria is normalized as follows:
V i k = V i k max i V i k
The minimization criteria is normalized as follows:
V i k = min i V i k V i k
Normalization of Equations (1) and (2) gives a new matrix V i k * which is shown below:
V i k * = [ V 11 * V 12 * V 1 n * V 21 * V 22 * V 2 n * V m 1 * V m 2 * V m n * ]
(4) Calculating the correlation coefficient ζ i k
The correlation coefficient ζ i k is calculated by the following equation:
ζ i k = min i min k | V 0 K V i K | + α max i max k | V 0 K V i K | | V 0 K V i K | + α max i max k | V 0 K V i K |
The matrix form can be presented as follows:
ζ = ζ i k = [ ζ 11 ζ 12 ζ 1 n ζ 21 ζ 22 ζ 2 n ζ m 1 ζ m 2 ζ m n ]
where | V 0 K V i K | denotes the relative difference value between a comparative sequence and the ideal referential sequence of k criteria. Meanwhile, α represents the resolution ratio between [ 0 , 1 ] and usually takes a value of 0.5.
(5) Calculating the grey weighted correlation coefficient
Since the number of the correlation coefficient is too scattered and is not easy to compare, it is necessary to centralize the correlation coefficient value of different time. Thus, calculating the average value based on Equation (15) is a method of such information centralized processing.
r i k = 1 n k n ζ i ( k )
The grey weighted relation correlation coefficient is calculated according to the weights of every criterion. The priorities weights of a certain hierarchy by the AHP method before is given by W = ( w 1 , w 2 , ... , w t ) , where t denotes the number of this hierarchy, with j = 1 t w j = 1 . Hence, the grey weighted correlation coefficient of supplier ‘i’ relates to the ideal referential set of alternatives as follows:
R i = r i j w j
(6) Prioritizing the suppliers
After obtaining the correlation coefficient R i , prioritization is carried out for the suppliers. If the value of R i is larger, the supplier is better and closer to the ideal referential supplier and vice versa.

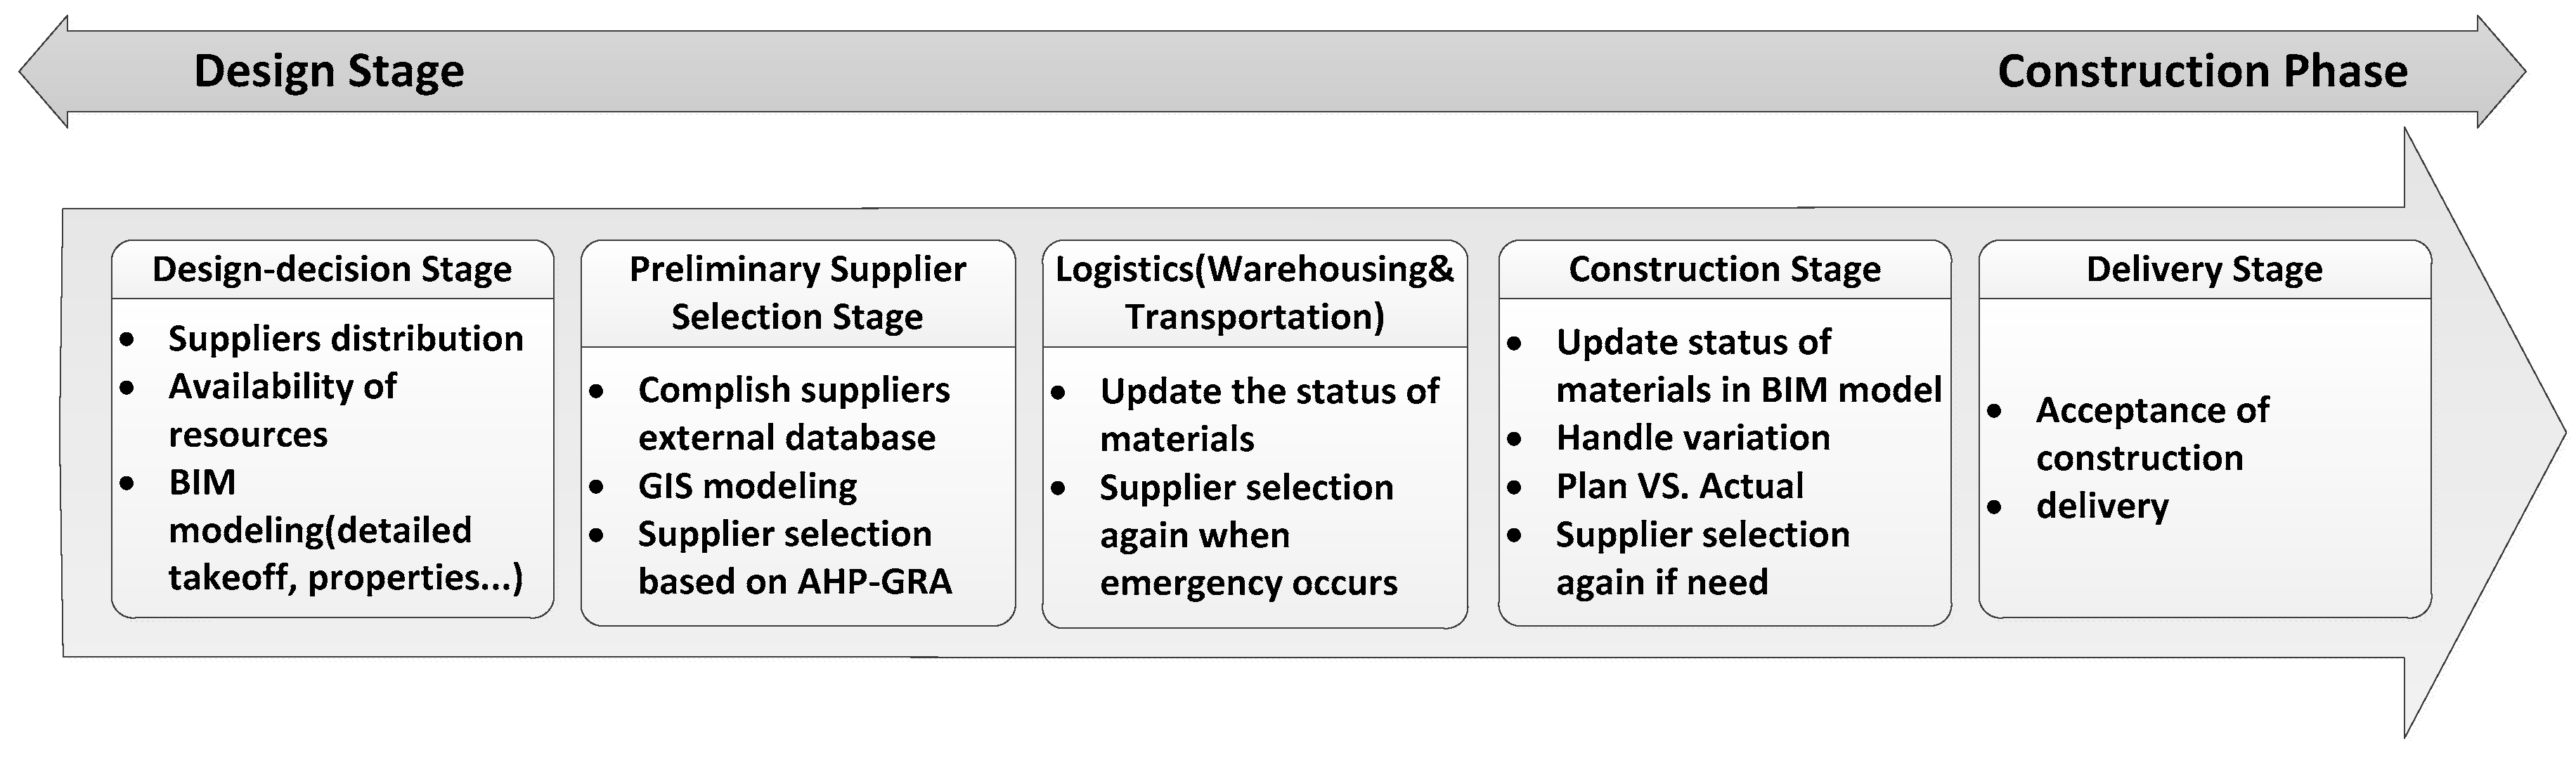
5. Framework Illustration

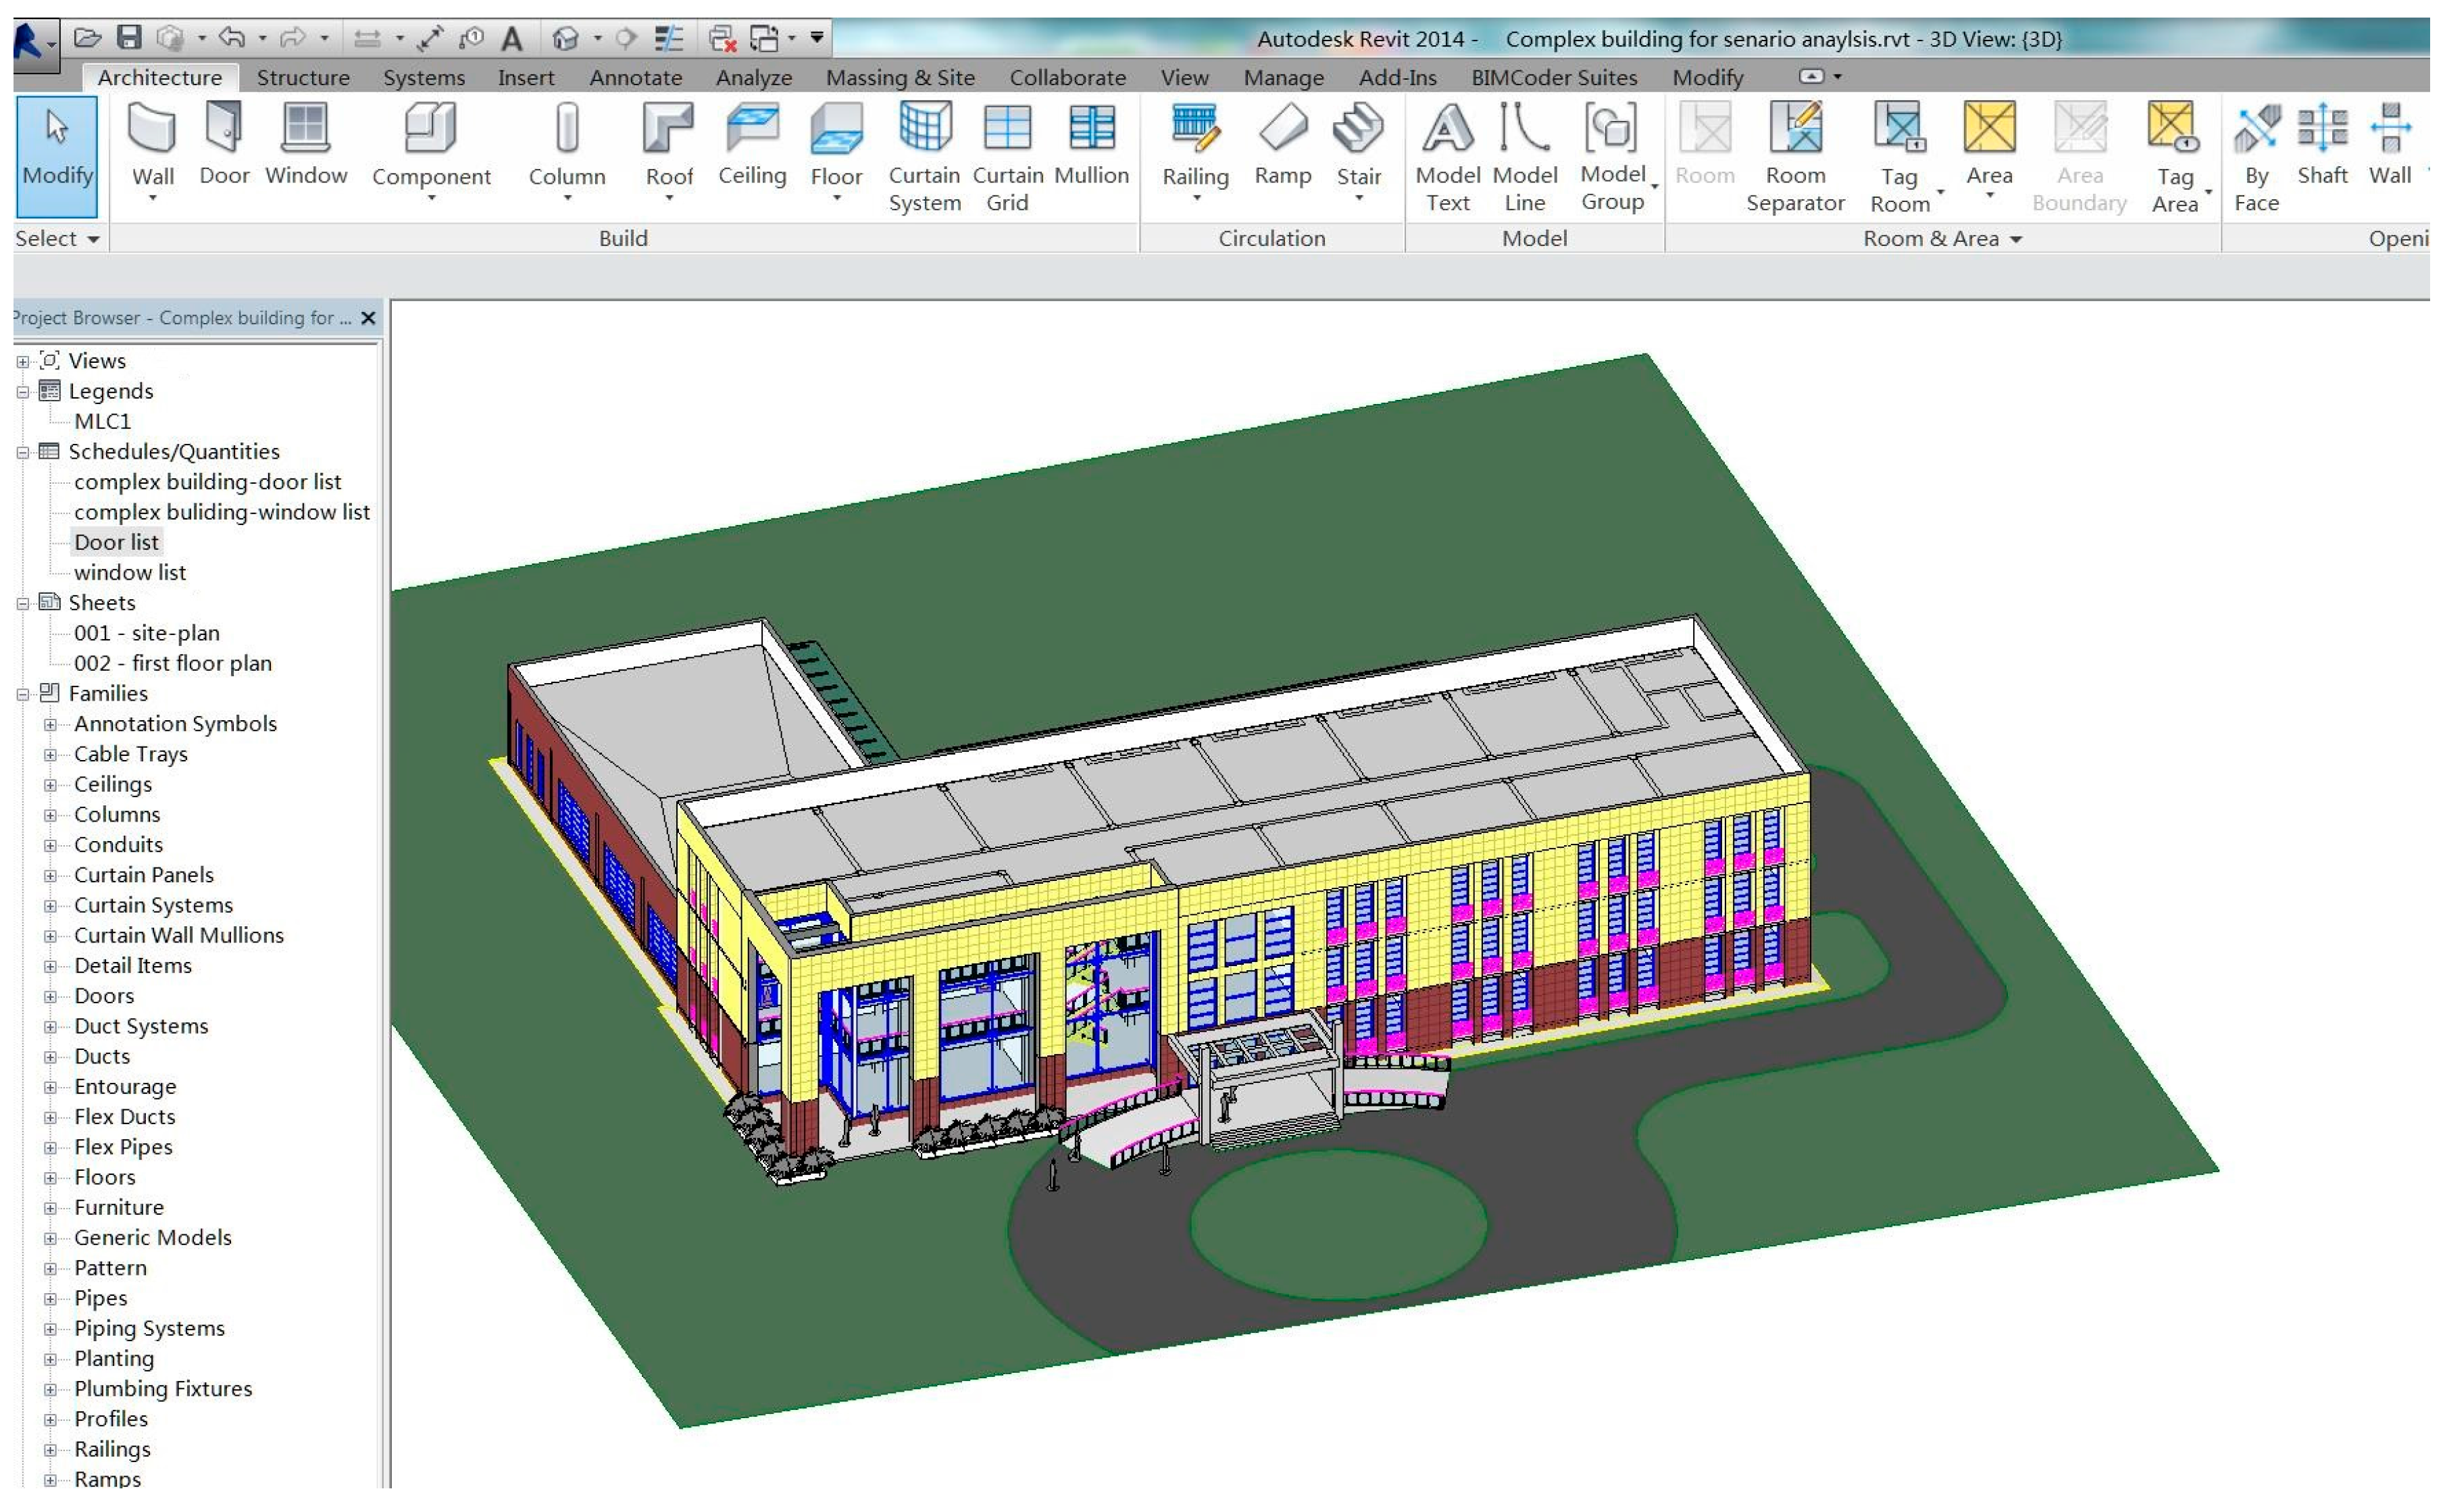
In this study, a two-story complex construction project was simulated to illustrate the entire process of the proposed framework. 
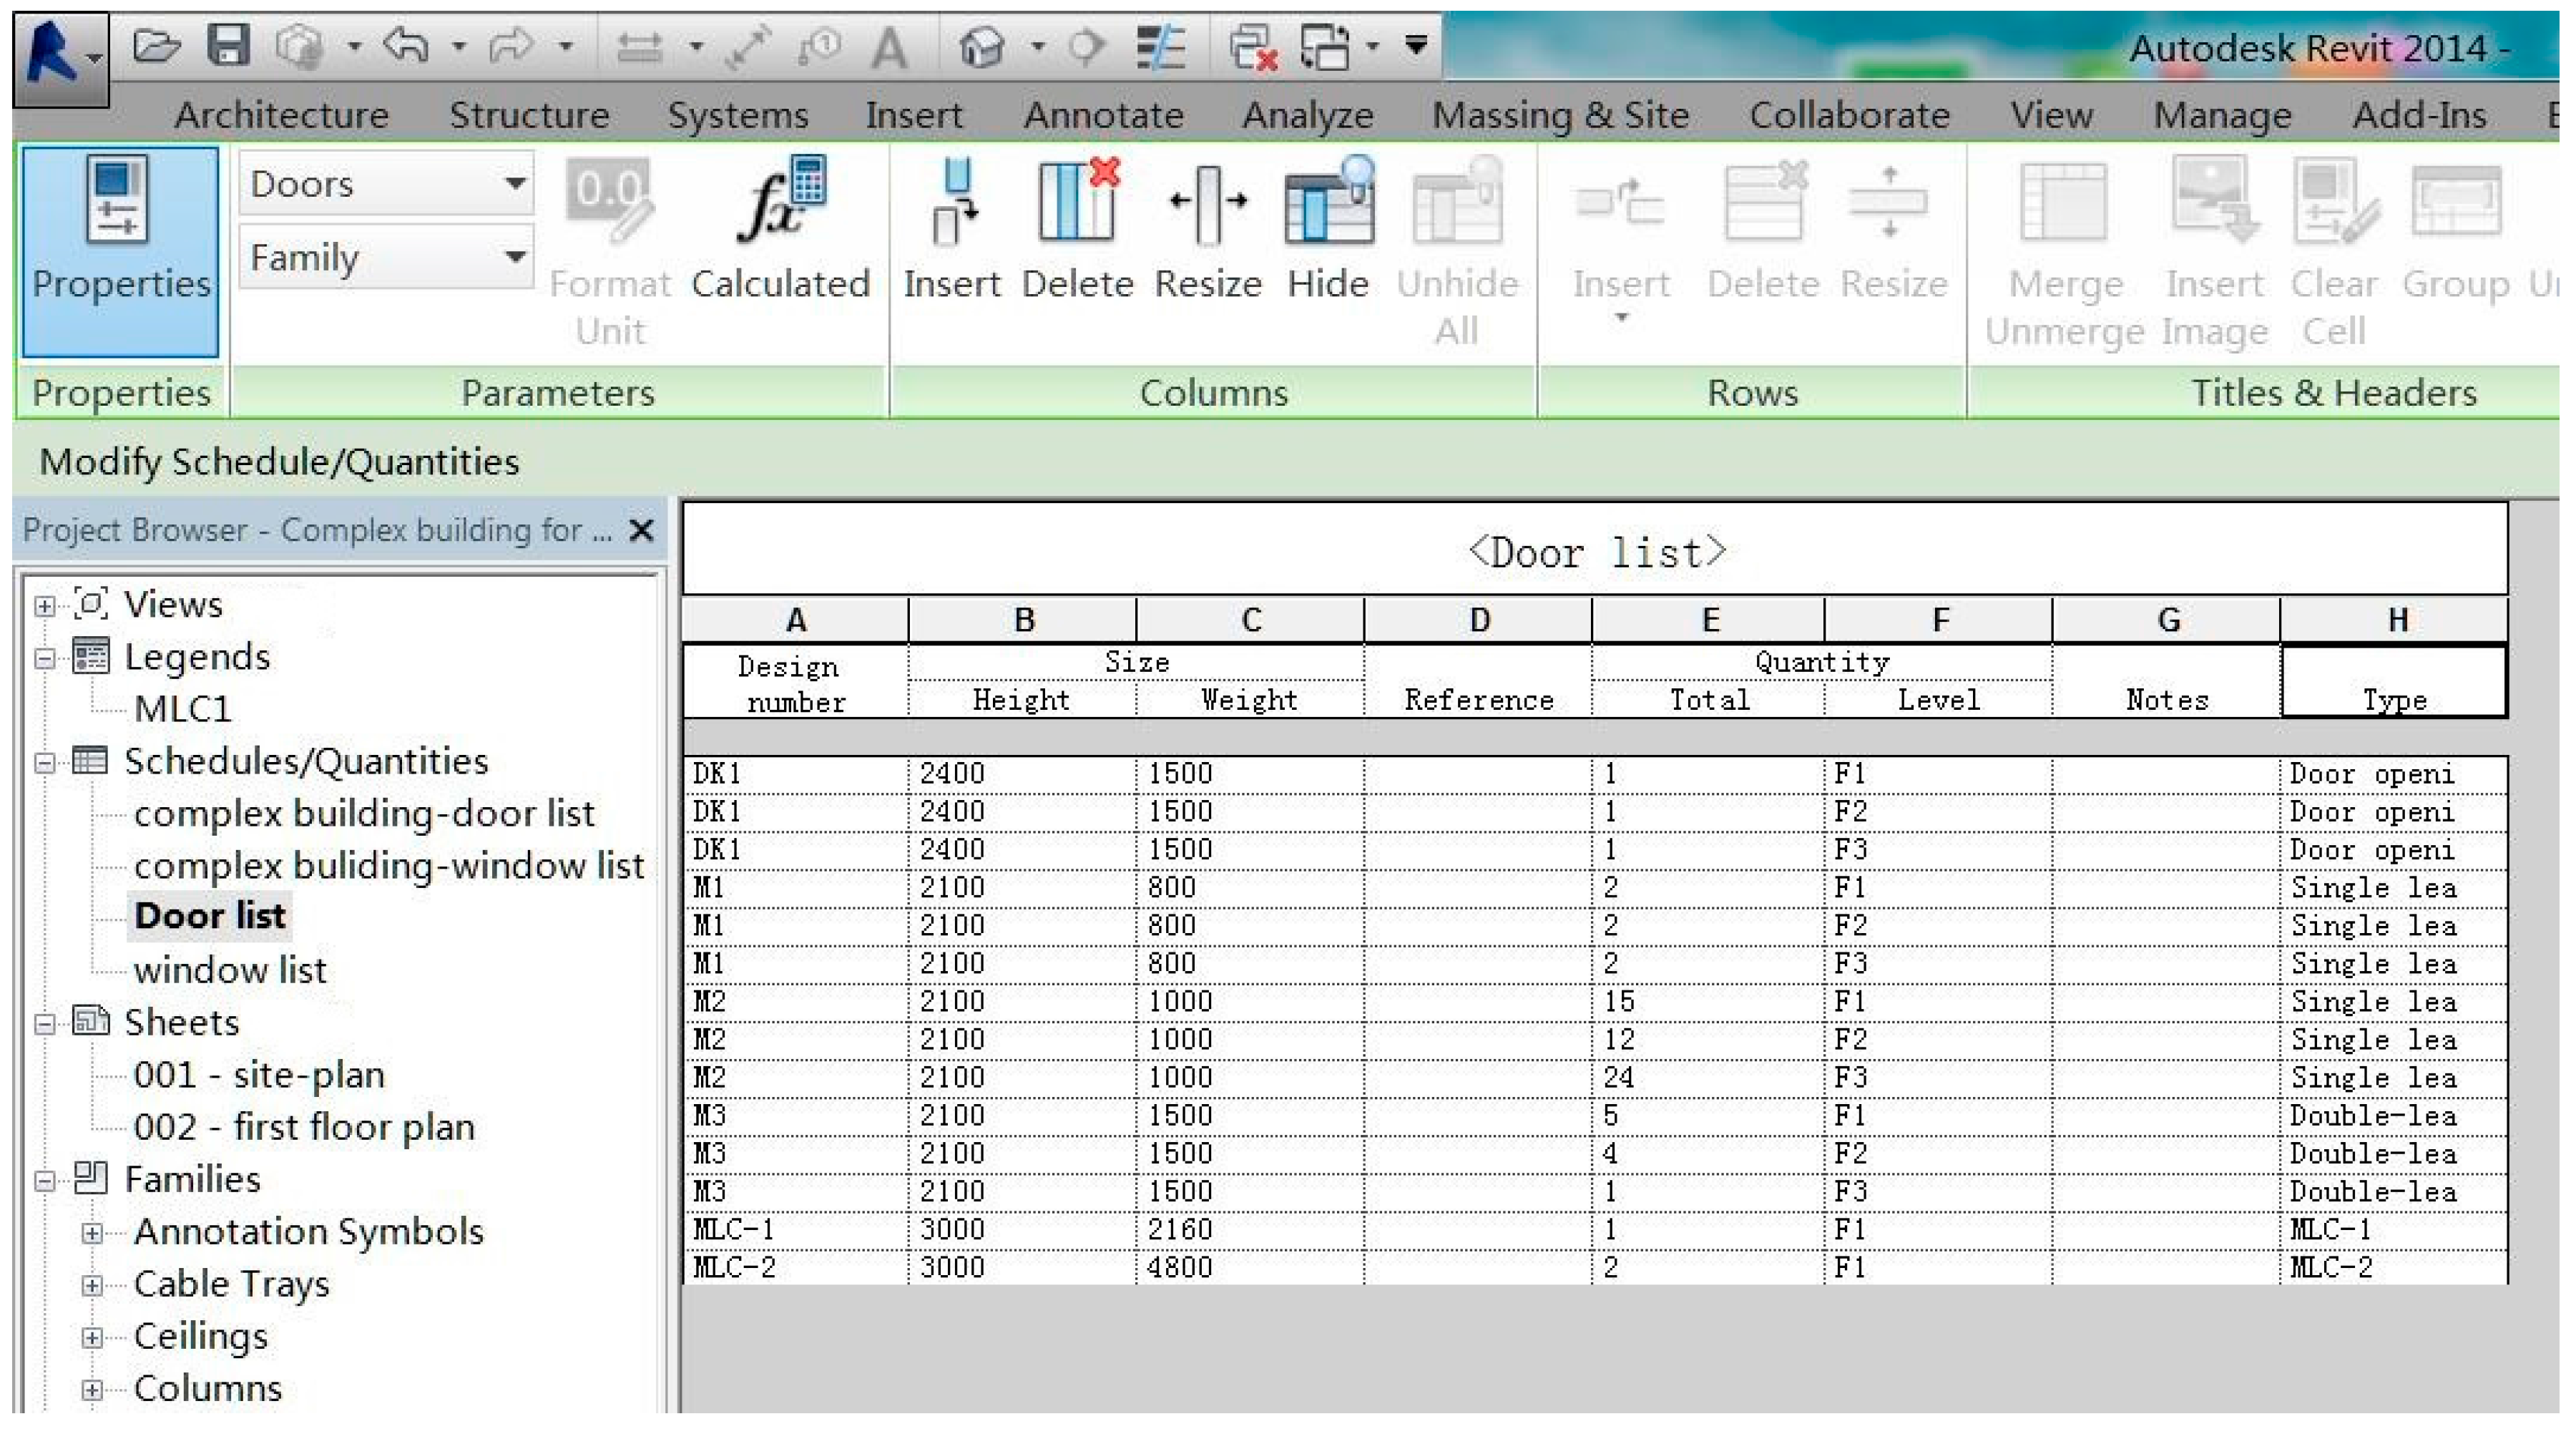
Figure 5 illustrates the 3D model of the project, developed in Autodesk Revit 2014. As discussed above, BIM can automatically quantify specific materials and export the properties for objects selected by the users to a central database (e.g., MS Access) [7]. For research purposes, a typical door component of the aforementioned two-story project was selected as the sample. The schedule information of construction work was extracted from the project schedule, while detailed property information of building components such as door size and type were obtained directly from the BIM. The installation date of the door can be determined by simulating the construction process.
This case estimated the date of one type and the size of the door “DK1” (shown in Figure 6). The installation of DK1 is on 7 November 2015 and there were four hypothetical accessibly suppliers can be selected based on their historical data in the external supplier database.
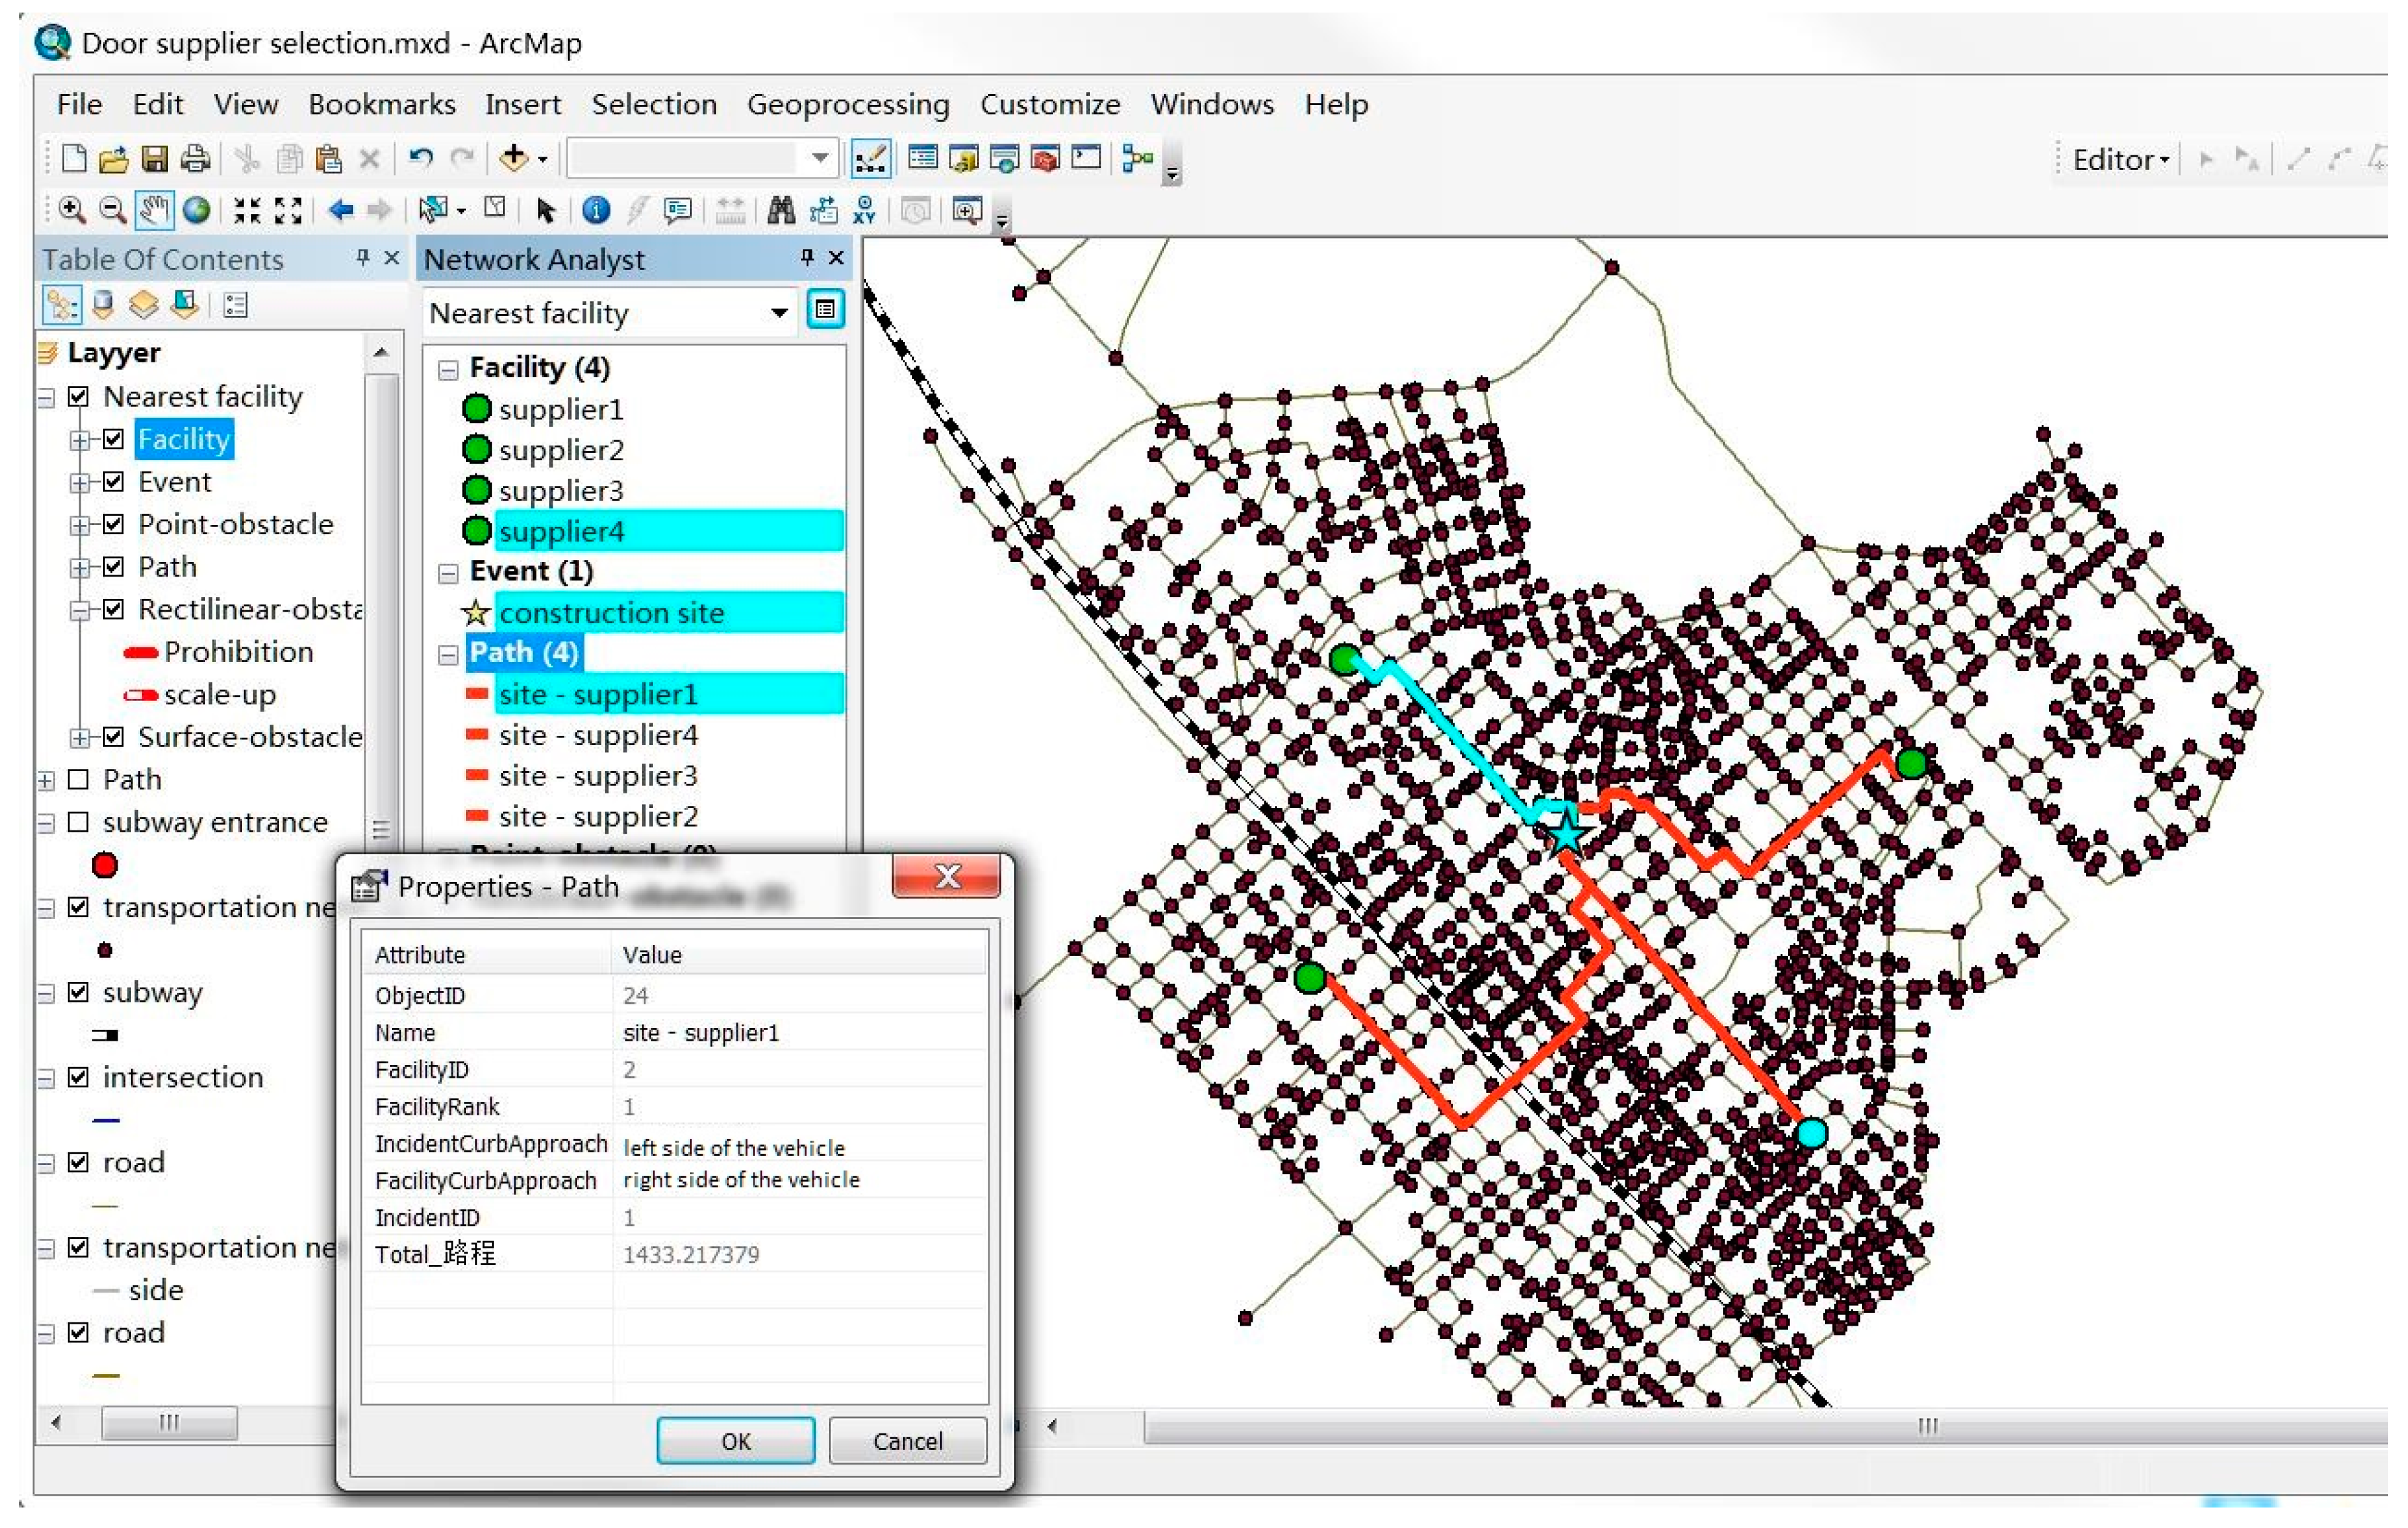
In the next step, all the descriptive and geographical information in the central database can be exported to the GIS application to map the available resources. The location of the construction site and each supplier can be represented as a set of 2D points having x and y coordinates [7]. Different suppliers can be distributed into different layers according to different constraints; the most common constraint to determine suppliers is to limit the distance to the construction site [7]. Their geographic distribution of resources could be analyzed according to transportation network analysis in GIS. GIS provides a wealth of decision-making support information in the supplier selection process, in fact, especially in evaluating supplier criteria (e.g., shortest path analysis).
First, a completed transportation network map was simulated via ArcGIS (Version 10.2) (Essri Information Technology Co. Ltd., Redlands, CA, USA, 2013). The construction site and four door suppliers are illustrated on the map. The shortest path from the supplier to the construction site was calculated by a network analyst as illustrated in Figure 7. Supplier 1 exhibited the shortest path, which could also provide suggestions for the committee on criteria (C35) for each supplier.
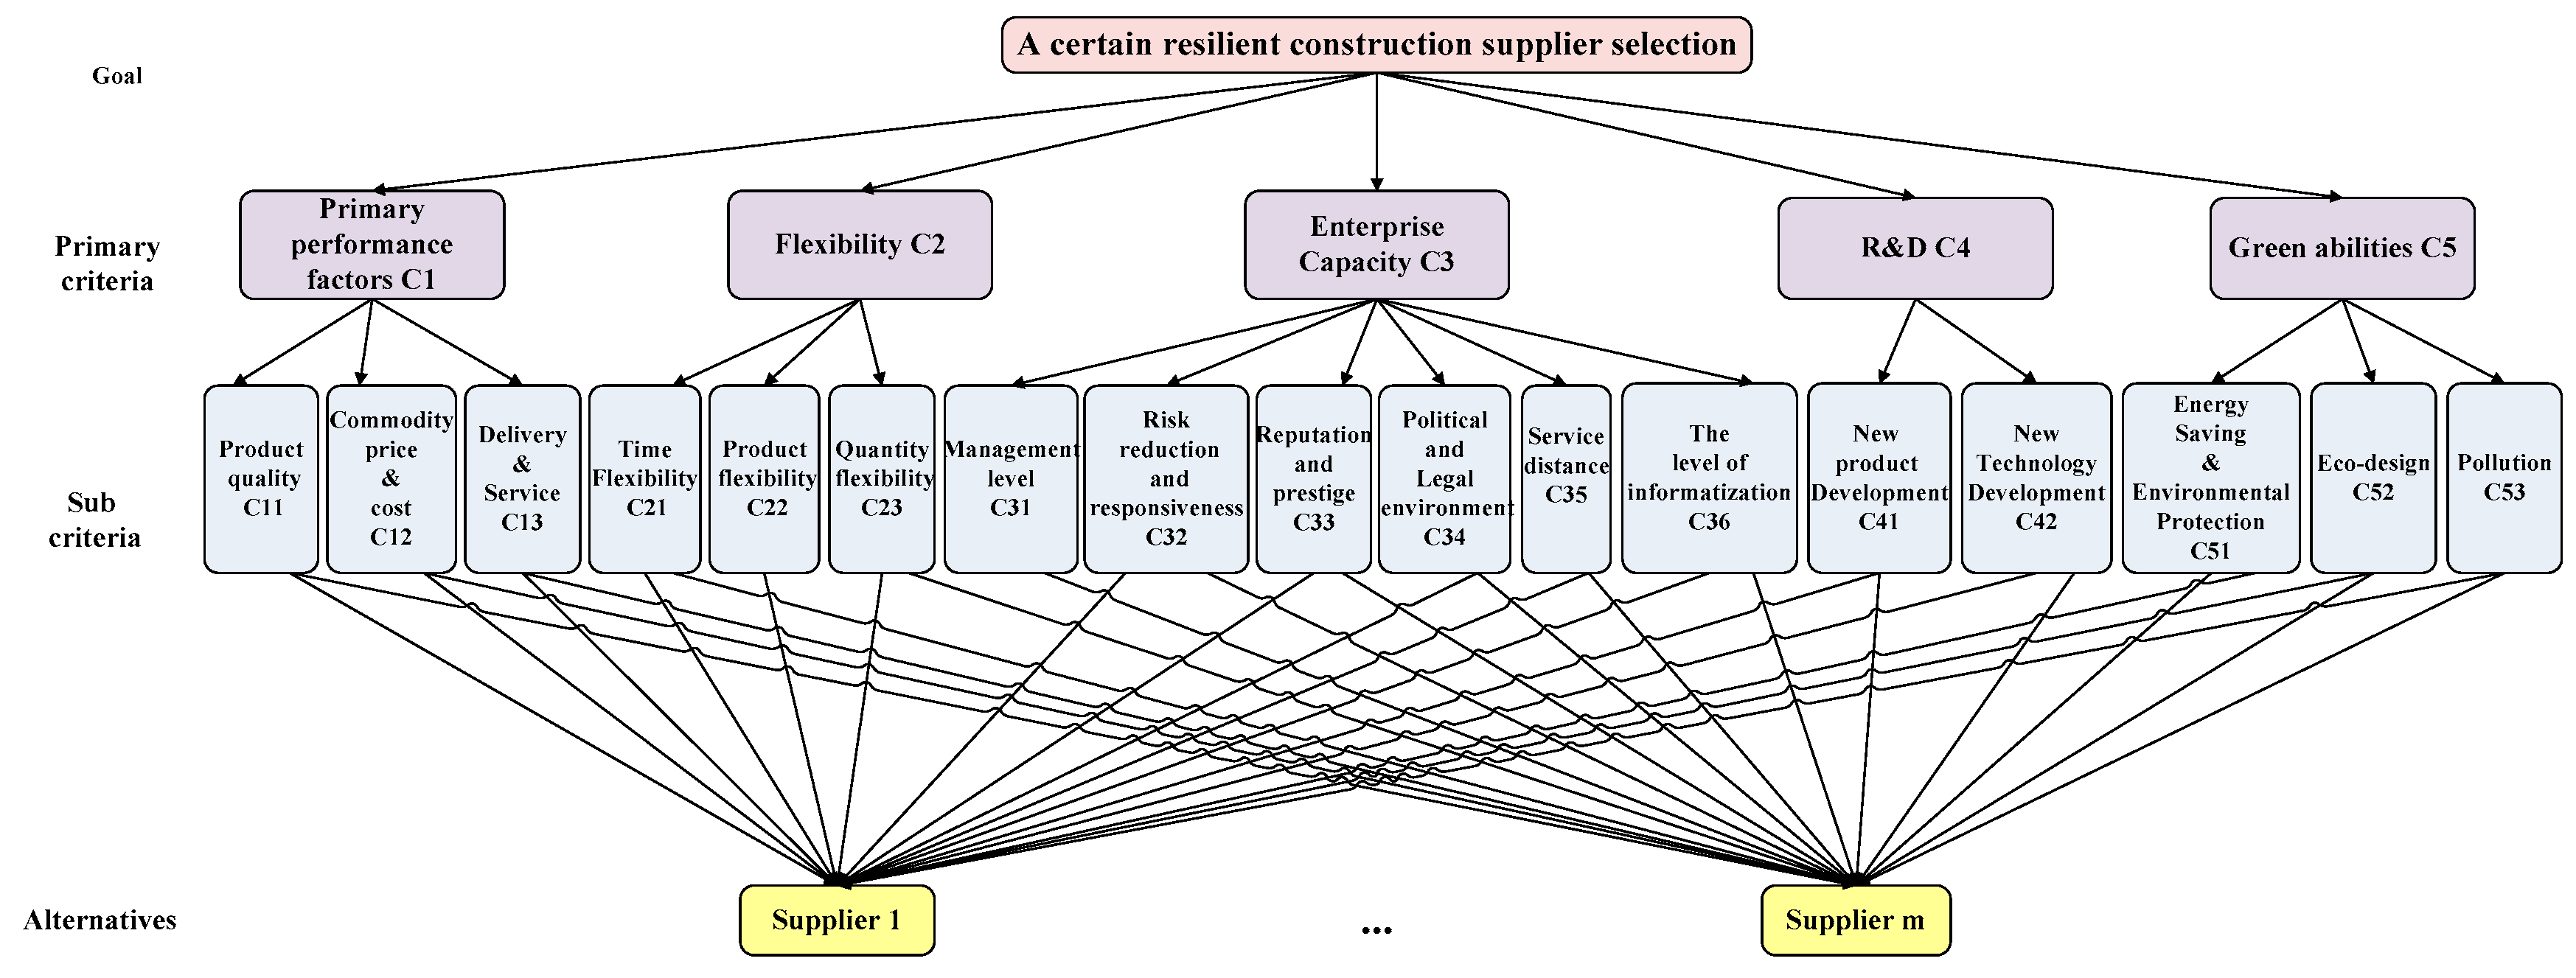
Once all the data in the supply chain is available, the next step was the preliminary selection of resilient door suppliers. The committee (consisting of three supply chain management experts) rated the importance of criteria for imparting criteria as weights via AHP. AHP also facilitated the aggregation of the committee’s judgments. Criterion weights were calculated in yaahp (version 7.5) (Foreology Software Ltd., Beijing, China, 2013), an algorithmic software. The final judgment matrix had satisfactory consistency. Table 5 depicts the weights of secondary criteria along with the primary criteria determined via AHP. Four alternatives of door suppliers were ranked using the GRA method and the correlation coefficient was calculated. The four alternative suppliers and corresponding value of related criteria are shown in Table 6.
Next, the grey decision matrix was normalized to obtain a grey number value between [ 0 , 1 ] . The normalized grey decision matrix V i k * was obtained according to Equations (10)–(12) as follows:
V i k * = [ 1.000 0.833 0.990 0.600 0.500 1.000 0.600 0.800 1.000 1.000 1.000 0.600 0.200 0.600 0.600 0.600 0.200 0.800 1.000 0.938 0.800 0.750 0.667 0.800 0.400 0.400 1.000 0.400 0.800 0.200 0.800 0.600 0.400 0.400 1.000 0.800 0.958 0.600 0.500 0.400 0.800 0.600 0.800 1.000 0.600 0.600 0.400 0.600 0.400 0.800 0.200 0.800 0.870 1.000 1.000 0.800 0.533 0.600 0.800 1.000 1.000 0.800 0.800 0.400 0.600 0.600 0.600 0.200 ]
Then, the correlation coefficient was calculated ζ i k using Equation (13). The matrix is shown below:
ζ = ζ i k = [ 1.000 0.643 0.966 0.429 0.375 1.000 1.000 1.000 1.000 1.000 1.000 1.000 0.600 1.000 1.000 1.000 0.600 0.600 1.000 0.828 0.600 0.545 0.474 1.000 0.429 0.333 1.000 0.333 1.000 0.600 1.000 1.000 0.429 1.000 1.000 0.600 0.878 0.429 0.375 0.333 1.000 0.600 0.600 1.000 0.429 0.600 1.000 0.600 0.600 1.000 0.600 0.600 0.697 1.000 1.000 0.600 0.391 0.600 1.000 1.000 1.000 0.600 1.000 1.000 0.600 1.000 0.600 0.600 ]
According to the weights obtained by using AHP, the grey weighted correlation coefficient calculated by using Equation (15) as follows:
r i k = [ 0.837 0.521 1.000 0.867 0.817 0.803 0.553 0.698 0.867 0.762 0.809 0.388 0.680 0.733 0.766 0.687 0.718 0.880 0.733 0.650 ]
The final correlation coefficient of the criteria using Equation (16) was:
R i = ( 0.784 , 0.725 , 0.674 , 0.726 )
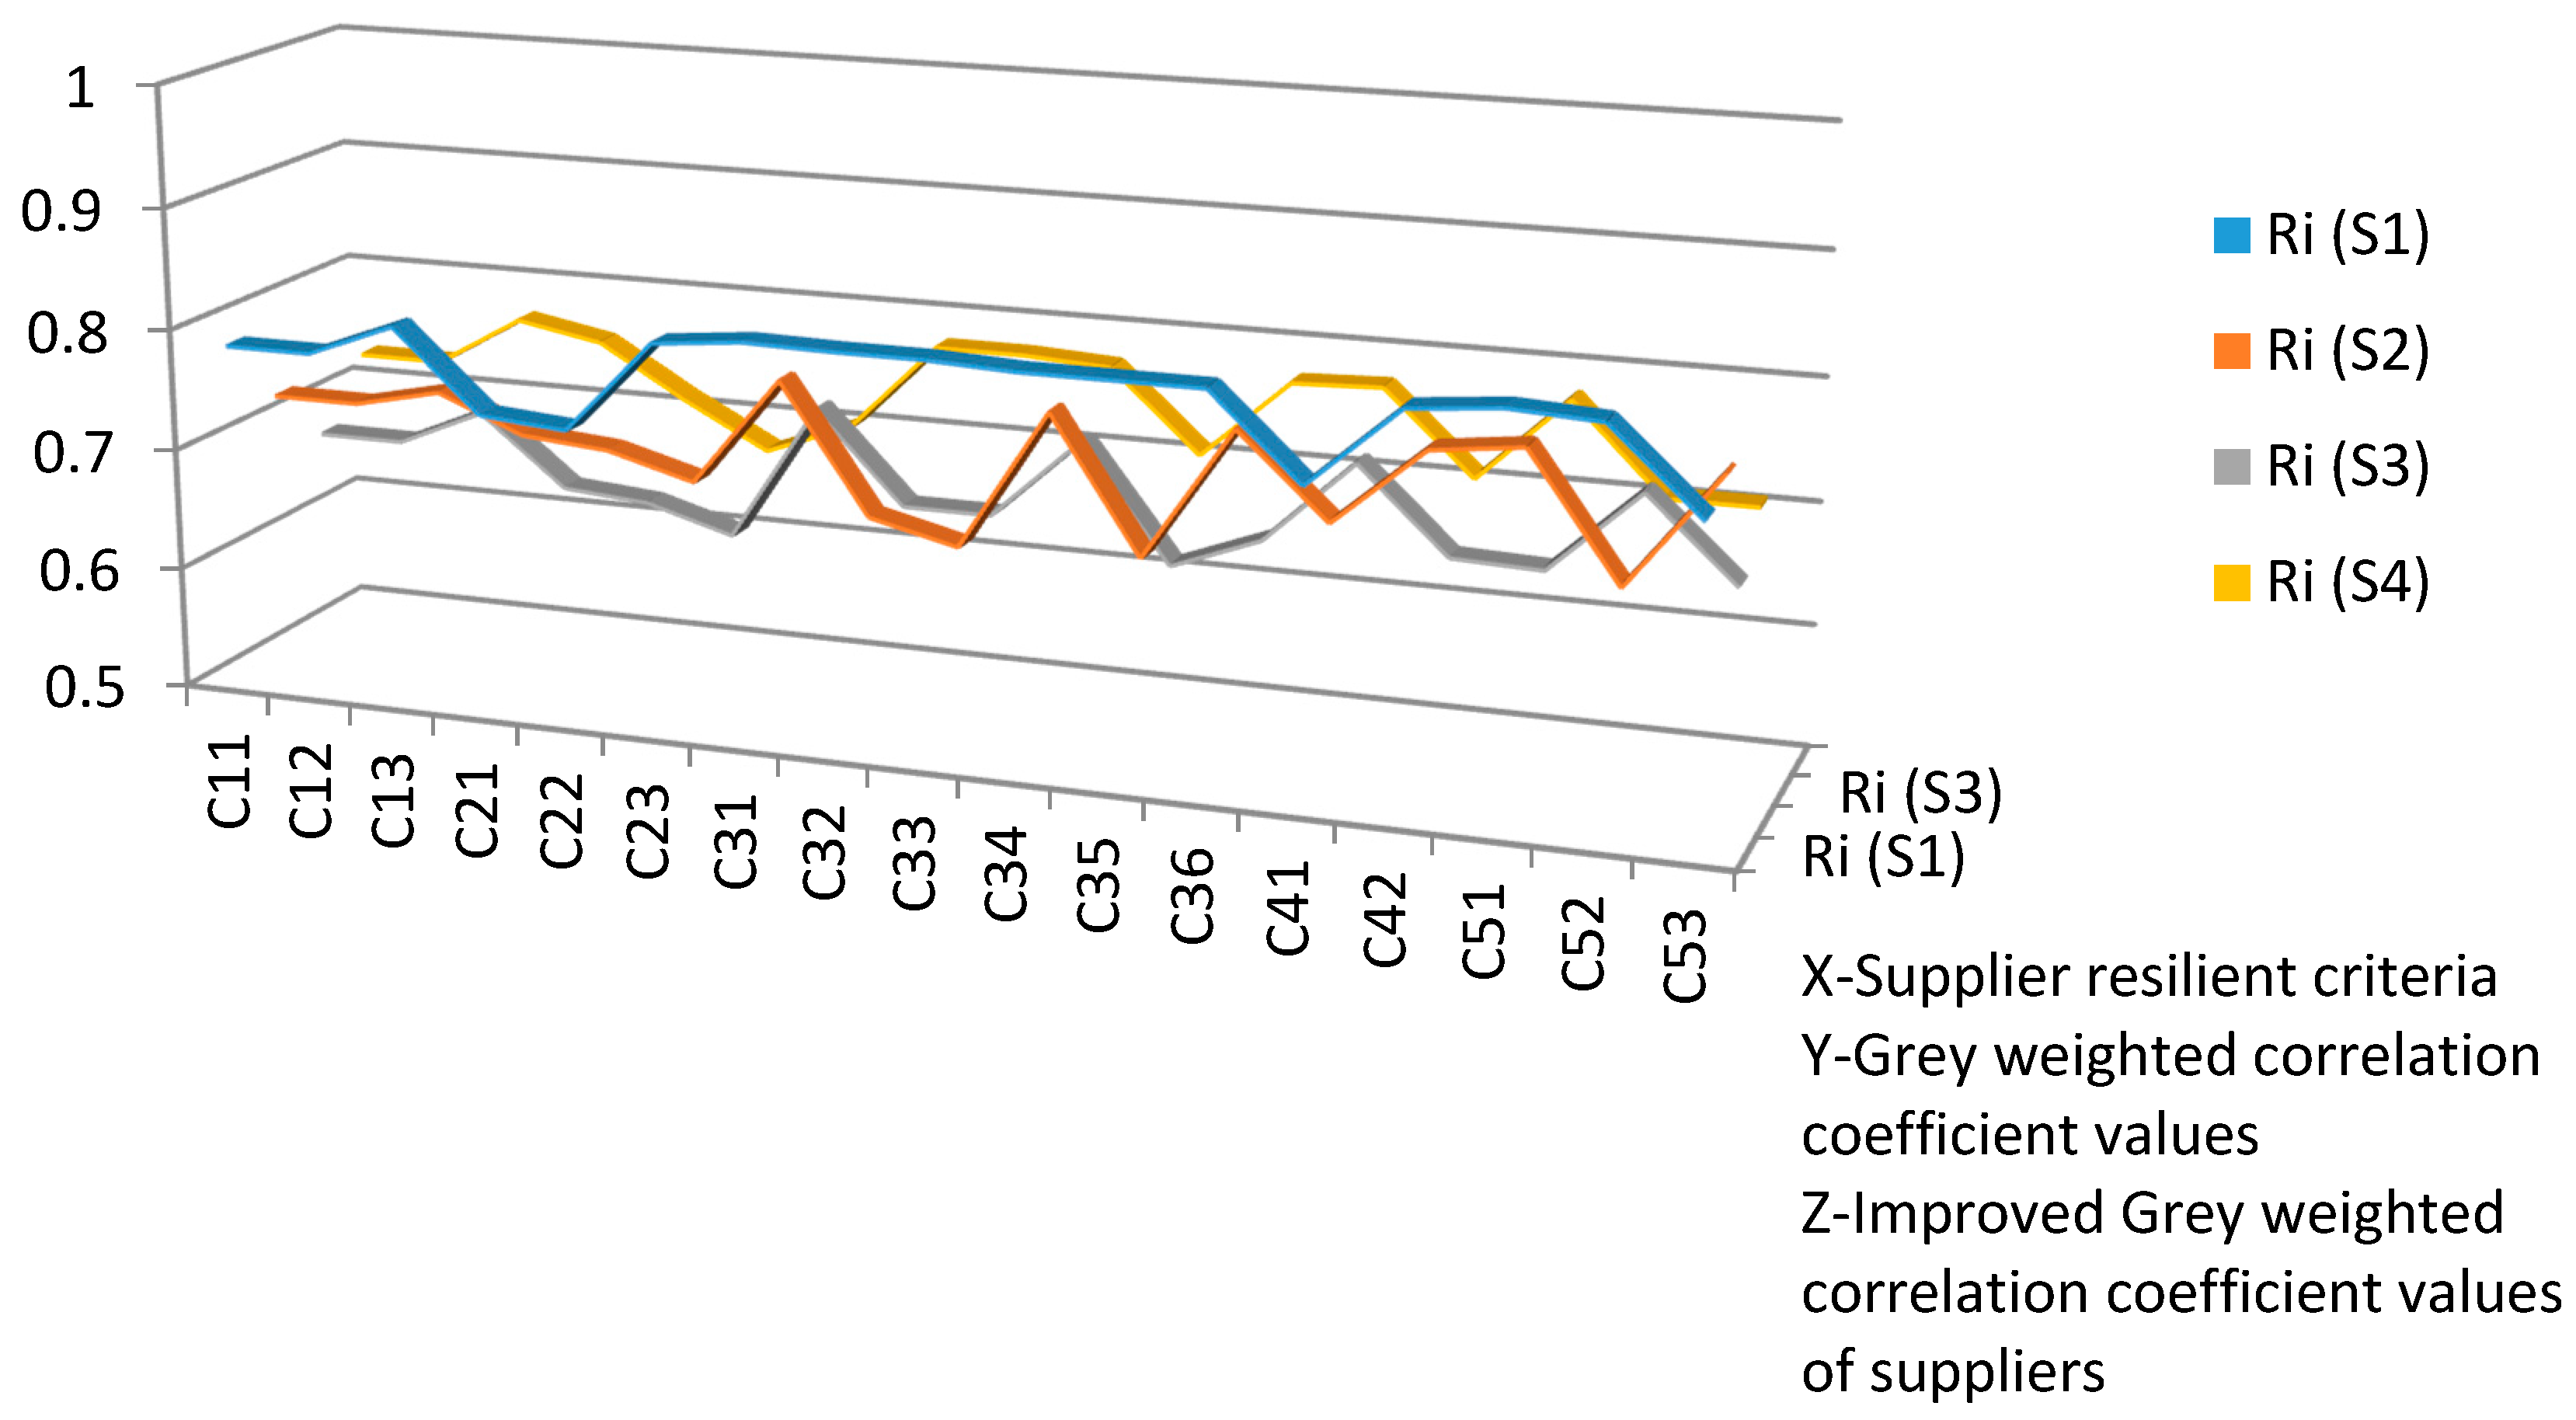
The suppliers as per their final correlation coefficient were then prioritized. The highest correlation coefficient showed that the supplier was closer to the ideal referential supplier. Supplier 1 was the first choice of door supplier in this scenario, while supplier 4 was the least preferred choice in terms of their resilient capabilities.

6. Results and Discussion

Supplier selection is an MCDM problem that needs consideration of both qualitative and quantitative criteria. Suppliers should be able to provide an efficient and effective response to possible disruptions [1]. With the assistance of IT tools, especially BIM and GIS, sufficient information in construction supply chain can be provided to support supplier selection process. By applying AHP-GRA, this research have calculated the exact closeness of each supplier with the ideal referential supplier as well as critical criteria contributing towards resilience of suppliers
Based on the results shown in Table 5, relative criteria weights can easily be prepared. Primary performance factors C1 (0.4407) were considered more significant than other primary criteria. Under this category, three secondary criteria were ranked based on importance. The weights for Product quality (C11) and Commodity price and cost (C12) are the same (0.4444), while Delivery and service (C13) is considerably lower (0.1111). Criteria under the Flexibility (C2) category are second important primary criteria (0.2506). Time and Product flexibility (C21, C22) in this category were both assigned a weight of 0.4, while Quantity flexibility (C23) was slightly lower (0.2). This is evidence that traditional supplier performance factors and flexibility factors are taken as primary resilience performance indicators for the selection of suppliers in the construction supply chain.
Around six secondary all under the Enterprise Capacity (C3) category, among which Political and legal environment (C34), Service distance (C35) and the level of informalization (C36) were ranked together as most significant. Risk reduction and responsiveness (C32) and Reputation and prestige (C33) were second-most significant based on their weights (both 0.1205). Management level (C31) acted as the 3rd important criteria in terms of supplier resilience. Criteria under the R&D category (C4) are important factors after Green abilities (C5) category of primary criteria. The supplier’s technological capability must be high enough to keep pace with modern innovations [1]; this is reflected in the fact that New technology development (C42) is considerably weighter than New product development C42 (0.6667 and 0.3333, respectively). Three selection criteria are ranked under the C5 category. Increasing awareness of pollution reduction C53 proved most significant (0.4579), followed by Eco-design (C52) and Energy saving and environmental protection (C51).
This research contributes several important managerial implications. For instance, stakeholders in the construction supply chain can cooperate with each other to provide detailed information for the construction project. The complexity of the construction supply chain and rapid technological advancements within the construction market make it essential for contractors to implement new technologies effectively to stay competitive. Further, to expand their external supplier database, contractors must be able to appropriately gather supplier information through historical and other external sources.
Top managers from the contractor’s organization can ascertain the level to which each of their alternative suppliers stand at any time point based upon the grey weighted correlation coefficient values. In the illustrative example, supplier 1 seems like a suitable supplier considering the level of resilience. At the other extreme, supplier 3 could be avoided on account of weak resilient capabilities. Supplier 4 and 2 serve as re-selections if supplier 1 is unavailable at any time point.
Upon the real-time examination of a construction site and per the real-time logistics status, some variations may occur preventing the primary door supplier from adhering to the construction schedule. In this situation, a new door supplier should be reselected. However, the method of prioritizing supplier selection if particular supplier criteria are given the highest priority for selection by keeping the same relative old weightings for other criteria by using AHP is an issue. To address this question, a sensitivity analysis was performed, results of which are shown in Table 7. In this example, a design variation was simulated which made Time flexibility (C21) the most significant in terms of supplier resilience while other criteria remained their original weights [1]. The final correlation coefficient of criterion was calculated via Equation (16) as R i = ( 0.7466 , 0.7118 , 0.6481 , 0.7552 ) and supplier 4 was identified as the ideal replacement for supplier 1.
The sensitivity analysis results show that after changing the weights of the resilient criteria to their maximum values separately, supplier 1 has highest probability of selection (i.e., highest grey weighted correlation coefficient value) in most cases. When Time flexibility and Energy saving and environmental protection criteria are given the highest priority, supplier 4 has the most resilient capacities. The selection order for the other suppliers varied as the criteria assigned different weights. It is observed that supplier 2 exceled in Quantity flexibility, Management level and New technology development compared to other criteria; supplier 3 performed poorly across most criteria. A graphical representation of the sensitivity analysis is provided in Figure 8.

7. Conclusions

As suppliers are the vital sources of vulnerability, a supplier selection process with an advanced strategy can assist in building resilience, thereby reducing potential risks in a supply chain as a whole. An integrated resilient supplier selection framework tailored to a typical construction supply chain was proposed in this paper. First, the operations and information flow from integrated BIM and GIS applications across various stages and processes in an RCSC were established.
The BIM model includes detailed components of a building and corresponding types (i.e., models and manufacturers), and can be developed for procurement use. A GIS model is fed with the BIM information (e.g., material delivery schedule) to conduct spatial analysis and visualize the suppliers’ logistics information. There are several major advantages of integrating BIM and GIS in this framework. The data they provided can efficiently and effectively support better supplier selection (and reselection) throughout the construction process. The excellent intelligent simulation functions in BIM (e.g., Weizhuo and Tomoas’s integrated simulation engine [64], Revit Nevisworks application) can also makes it easier and more agile to explore the changes in building information modeling process, such as design modifications, different resource allocations and alternative construction methods. In this way, the variation in the productivity of workers, the capacity of the supply chain and the uncertainty on the construction site can be detailed estimated to mitigate risks. After determining the available suppliers in the form of maps, GIS can help to provide an optimal suggestion through transport network analysis for evaluation of the Service distance criteria in the latter supplier selection process. Further, under the proposed framework, suppliers can be reselected and the corresponding information in the BIM model can be updated in real time if a disruptions to the construction process (or risk thereof) should emerge. In summary, the proposed framework yields instant, comprehensive, and workable supplier resilience information across the construction supply chain.
A detailed resilient construction supplier selection model was developed by an integrated AHP-GRA approach. This model can be used to evaluate the resilience of selected suppliers within the RCSC context. The whole framework encompasses of operation process, workflow and the established supplier selection model was then illustrated by using an experimental case of a construction project. This paper considered seventeen resilient construction selection criteria under five separate categories based on a thoroughly literature review. The proposed criteria for supplier selection used in this research are quite generic for the construction industry and thus with minor modifications can be used of construction companies with a variety of considerations. AHP was employed to determine the relative weights of the primary and the secondary criteria. The AHP results shown that traditional primary performance factors (e.g., quality, cost) and flexibility factors play a key role in the resilient criteria category over three other categories (enterprise capacity, R&D and green abilities). GRA was utilized to rank the suppliers by their resilient respective resilience. Sensitivity analysis was also conducted to help in identifying the criteria of resilience which impact the selection priorities of suppliers.
Construction companies could benefit from the proposed approach in reducing potential vulnerabilities associated with their construction supply chains, as it results in selection of a resilient supplier. Another notable advantage of the AHP-GRA is that it is possible to vary the weightings given to criteria so that priorities for criteria can be varied at any point of time to fit with current construction market requirements. This integrated method also allows managers to present the rating of criteria in natural language expressions easily [49], which end up with a set of grey weighted correlation coefficient values for supplier selection.
While the proposed framework has theoretical research value, this study still exists some limitations. The research objective of providing information in the construction supply chain requires early identification of data requirements and stakeholders’ responsibilities for data provision. In practice this may be time-consuming or labor-intensive due to the large amount of data that must be exchanged and shared among different stakeholders. The proposed method for resilient supplier selection only works when project schedules and quantity take-off information are available in BIM. Manual data entry is necessary for information that is not readily available in BIM (e.g., temporary facilities). The external supplier database encompasses of market survey results and supplier historical data can be used for the real case analysis. Nevertheless, that information might not always be available. Because the proposed framework is strongly dependent on a priori information accuracy, it necessitates effective collaboration among different levels of management and different stakeholders. Future research could be conducted to explore ways to motivate and manage stakeholders in the RCSC when integrated information technologies are employed.
While the proposed supplier selection framework has been illustrated by a simulation case, the results are limited by the specificity of the experimental setting. In order to further test and verify the results and implications of this research, real data, cases and practices should be applied in the future research. For example, actual construction project situations (e.g., contract types) and different construction supply chain structures can be taken into consideration. Moreover, the proposed framework suffers from a lack of consideration of global construction supply chain situations that may be critical for the successful construction of overseas projects (e.g., some typical engineer/procure/construct, EPC). Although the most general situations have been discussed in this study, where the suppliers were located nearby (in the local or national area) in a general construction supply chain, global construction supply chain network heightens their profile. Global sourcing strategies have enabled many construction companies to take advantage of resources and production capacities available in different parts of the world [94]; global construction suppliers also need to achieve a certain level of resilience to respond to varying demands.
Additionally, weightings and criteria ratings by committee members are subjective and dependent upon their respective knowledge and expertise. The results of this study may accordingly be slightly subjective. It is also worth attempting to expand the diversity of criteria from the five categories and seventeen sub-categories utilized here.

Acknowledgments

The writers would like to extend their appreciation to project No. 106112016CDJSK03XK06 supported by the Fundamental Research Funds for the Central Universities (China) for vital support.

Author Contributions

Ting-Kwei Wang and Qian Zhang contributed research ideas and developed research methodology as well as proposed framework. Heap-Yih Chong helped revise research objectives. Xiangyu Wang provided constructive suggestions.

Conflicts of Interest

The authors declare no conflict of interest.

References

  1. Rajesh, R.; Ravi, V. Supplier selection in resilient supply chains: A grey relational analysis approach. J. Clean. Prod. 2015, 86, 343–359. [Google Scholar] [CrossRef]
  2. O’Brien, W.J.; Formoso, C.T.; Vrijhoef, R.; London, K.A. Construction Supply Chain Management Handbook. Constr. Manag. Econ. 2009, 27, 1265–1266. [Google Scholar]
  3. Kannan, D.; Khodaverdi, R.; Olfat, L.; Jafarian, A.; Diabat, A. Integrated fuzzy multi criteria decision making method and multi-objective programming approach for supplier selection and order allocation in a green supply chain. J. Clean. Prod. 2013, 47, 355–367. [Google Scholar] [CrossRef]
  4. Torabi, S.A.; Baghersad, M.; Mansouri, S.A. Resilient supplier selection and order allocation under operational and disruption risks. Transp. Res. E Logist. Transp. Rev. 2015, 79, 22–48. [Google Scholar] [CrossRef]
  5. Sheffi, Y. Building a resilient supply chain. Harv. Bus. Rev. 2005, 1, 1–4. [Google Scholar]
  6. Tao, W. Using Bayesian Network to develop a probability assessment approach for construction safety risk. China Civ. Eng. J. 2010, 43, 384–391. [Google Scholar]
  7. Irizarry, J.; Karan, E.P.; Jalaei, F. Integrating BIM and GIS to improve the visual monitoring of construction supply chain management. Autom. Constr. 2013, 31, 241–254. [Google Scholar] [CrossRef]
  8. Omar, B.; Ballal, T. Intelligent wireless web services: Context-aware computing in construction-logistics supply chain. Electron. J. Inf. Technol. Constr. 2009, 14, 289–308. [Google Scholar]
  9. Gnanasekaran, S.; Velappan, S.; Sivasangari, A. Development of a Supplier Selection System by Combining Analytic Hierarchy Process and Grey Relational Analysis: An Automobile Industry Case Study. ICFAI J. Supply Chain Manag. 2008, 5, 82–94. [Google Scholar]
  10. Eastman, C.; Teicholz, P.; Sacks, R.; Liston, K. BIM Handbook: A Guide to Building Information Modeling for Owners, Managers, Designers, Engineers, and Contractors; John Wiley & Sons: Hoboken, NJ, USA, 2011. [Google Scholar]
  11. Barlish, K.; Sullivan, K. How to measure the benefits of BIM—A case study approach. Autom. Constr. 2012, 24, 149–159. [Google Scholar] [CrossRef]
  12. Rafiee, A.; Dias, E.; Fruijtier, S.; Scholten, H. From BIM to Geo-analysis: View Coverage and Shadow Analysis by BIM/GIS Integration. Procedia Environ. Sci. 2014, 22, 397–402. [Google Scholar] [CrossRef]
  13. Hinkka, V.; Tätilä, J. RFID tracking implementation model for the technical trade and construction supply chains. Autom. Constr. 2013, 35, 405–414. [Google Scholar] [CrossRef]
  14. Verdouw, C.N.; Beulens, A.J.M.; Reijers, H.A.; van der Vorst, J.G.A.J. A control model for object virtualization in supply chain management. Comput. Ind. 2015, 68, 116–131. [Google Scholar] [CrossRef]
  15. Duong, L.N.K.; Wood, L.C.; Wang, X. Review of RFID Applications in Perishable Inventory Management. In Handbook of Research on Global Supply Chain Management; IGI Global: Hershey, PA, USA, 2015; pp. 139–146. [Google Scholar]
  16. Latiffi, A.A.; Brahim, J.; Mohd, S.; Fathi, M.S. Building Information Modeling (BIM): Exploring Level of Development (LOD) in Construction Projects. Appl. Mech. Mater. 2015, 773–774, 933–937. [Google Scholar] [CrossRef]
  17. Shou, W.; Wang, J.; Wang, X.; Chong, H. A Comparative Review of Building Information Modelling Implementation in Building and Infrastructure Industries. Arch. Comput. Methods Eng. 2015, 22, 291–308. [Google Scholar] [CrossRef]
  18. Lopez, R.; Chong, H.; Wang, X.; Graham, J. Technical Review: Analysis and Appraisal of Four-Dimensional Building Information Modeling Usability in Construction and Engineering Projects. J. Constr. Eng. Manag. 2015, 142, 6015005. [Google Scholar] [CrossRef]
  19. Sacks, R.; Treckmann, M.; Rozenfeld, O. Visualization of Work Flow to Support Lean Construction. J. Constr. Eng. Manag. 2009, 135, 1307–1315. [Google Scholar] [CrossRef]
  20. Li, H.; Kong, C.W.; Pang, Y.C.; Shi, W.Z.; Yu, L. Internet-based geographical information systems system for E-commerce application in construction material procurement. J. Constr. Eng. Manag. 2003, 129, 689–697. [Google Scholar] [CrossRef]
  21. Mentzer, J.T.; Dewitt, W.; Keebler, J.S.; Min, S.; Nix, N.W.; Smith, C.D.; Zacharia, Z.G. Defining Supply Chain Management. J. Bus. Logist. 2001, 22, 1–25. [Google Scholar] [CrossRef]
  22. Vrijhoef, R.; Koskela, L. The four roles of supply chain management in construction. Eur. J. Purch. Supply Manag. 2000, 6, 169–178. [Google Scholar] [CrossRef]
  23. Dubois, A.; Gadde, L. The construction industry as a loosely coupled system: Implications for productivity and innovation. Constr. Manag. Econ. 2002, 20, 621–631. [Google Scholar] [CrossRef]
  24. Winch, G. Models of manufacturing and the construction process: The genesis of re-engineering construction. Batiment Int. Build. Res. Pract. 2003, 31, 107–118. [Google Scholar] [CrossRef]
  25. Segerstedt, A.; Olofsson, T. Supply chains in the construction industry. Supply Chain Manag. 2010, 15, 347–353. [Google Scholar] [CrossRef]
  26. Taillandier, F.; Taillandier, P.; Tepeli, E.; Breysse, D.; Mehdizadeh, R.; Khartabil, F. A multi-agent model to manage risks in construction project (SMACC). Autom. Constr. 2015, 58, 1–18. [Google Scholar] [CrossRef]
  27. Lee, H.L. Aligning Supply Chain Strategies with Product Uncertainties. IEEE Eng. Manag. Rev. 2002, 44, 26. [Google Scholar] [CrossRef]
  28. Christopher, M.; Peck, H. Building the Resilient Supply Chain. Int. J. Logist. Manag. 2004, 15, 1–14. [Google Scholar] [CrossRef] [Green Version]
  29. Tang, C.S. Perspectives in supply chain risk management. SSRN Electron. J. 2005, 103, 451–488. [Google Scholar] [CrossRef]
  30. Mensah, P.; Merkuryev, Y.; Longo, F. Using ICT in Developing a Resilient Supply Chain Strategy. Procedia Comput. Sci. 2015, 43, 101–108. [Google Scholar] [CrossRef]
  31. Kristianto, Y.; Gunasekaran, A.; Helo, P.; Hao, Y. A model of resilient supply chain network design: A two-stage programming with fuzzy shortest path. Expert Syst. Appl. 2014, 41, 39–49. [Google Scholar] [CrossRef]
  32. Chowdhury, M.M.H.; Quaddus, M.A. A multiple objective optimization based QFD approach for efficient resilient strategies to mitigate supply chain vulnerabilities: The case of garment industry of Bangladesh. Omega 2015, 57, 5–21. [Google Scholar] [CrossRef]
  33. Gong, J.; Mitchell, J.E.; Krishnamurthy, A.; Wallace, W.A. An interdependent layered network model for a resilient supply chain. Omega 2014, 46, 104–116. [Google Scholar] [CrossRef]
  34. Mitra, K.; Gudi, R.D.; Patwardhan, S.C.; Sardar, G. Towards resilient supply chains: Uncertainty analysis using fuzzy mathematical programming. Chem. Eng. Res. Des. 2009, 87, 967–981. [Google Scholar] [CrossRef]
  35. Sawik, T. Selection of resilient supply portfolio under disruption risks. Omega 2013, 41, 259–269. [Google Scholar] [CrossRef]
  36. Peck, H. Drivers of supply chain vulnerability: An integrated framework. Int. J. Phys. Distrib. Logist. Manag. 2005, 35, 210–232. [Google Scholar] [CrossRef]
  37. Verma, R.; Pullman, M.E. An analysis of the supplier selection process. Omega 1998, 26, 739–750. [Google Scholar] [CrossRef]
  38. Govindan, K.; Rajendran, S.; Sarkis, J.; Murugesan, P. Multi criteria decision making approaches for green supplier evaluation and selection: A literature review. J. Clean. Prod. 2015, 98, 66–83. [Google Scholar] [CrossRef]
  39. Galankashi, M.R.; Chegeni, A.; Soleimanynanadegany, A.; Memari, A.; Anjomshoae, A.; Helmi, S.A.; Dargi, A. Prioritizing Green Supplier Selection Criteria Using Fuzzy Analytical Network Process. Procedia CIRP 2015, 26, 689–694. [Google Scholar] [CrossRef]
  40. Igarashi, M.; de Boer, L.; Fet, A.M. What is required for greener supplier selection? A literature review and conceptual model development. J. Purch. Supply Manag. 2013, 19, 247–263. [Google Scholar] [CrossRef]
  41. Hashemi, S.H.; Karimi, A.; Tavana, M. An integrated green supplier selection approach with analytic network process and improved Grey relational analysis. Int. J. Prod. Econ. 2015, 159, 178–191. [Google Scholar] [CrossRef]
  42. Banker, R.D.; Khosla, I.S. Economics of operations management: A research perspective. J. Oper. Manag. 1995, 12, 423–435. [Google Scholar] [CrossRef]
  43. Schade, J.; Olofsson, T.; Schreyer, M. Decision-making in a model-based design process. Constr. Manag. Econ. 2011, 29, 371–382. [Google Scholar] [CrossRef]
  44. Ho, W.; Xu, X.; Dey, P.K. Multi-criteria decision making approaches for supplier evaluation and selection: A literature review. Eur. J. Oper. Res. 2010, 202, 16–24. [Google Scholar] [CrossRef]
  45. Klibi, W.; Martel, A. Scenario-based Supply Chain Network risk modeling. Eur. J. Oper. Res. 2012, 223, 644–658. [Google Scholar] [CrossRef]
  46. Mathiyazhagan, K.; Diabat, A.; Al-Refaie, A.; Xu, L. Application of analytical hierarchy process to evaluate pressures to implement green supply chain management. J. Clean. Prod. 2015, 107, 229–236. [Google Scholar] [CrossRef]
  47. Memon, M.S.; Lee, Y.H.; Mari, S.I. Group multi-criteria supplier selection using combined grey systems theory and uncertainty theory. Expert Syst. Appl. 2015, 42, 7951–7959. [Google Scholar] [CrossRef]
  48. Ju-Long, D. Control problems of grey systems. Syst. Control Lett. 1982, 1, 288–294. [Google Scholar] [CrossRef]
  49. Deng, J.L. Introduction to grey system theory. J. Grey Syst. 1989, 1, 1–24. [Google Scholar]
  50. Fu, X.; Zhu, Q.; Sarkis, J. Evaluating green supplier development programs at a telecommunications systems provider. Int. J. Prod. Econ. 2012, 140, 357–367. [Google Scholar] [CrossRef]
  51. Saaty, T.L. The Analytic Hierarchy Process: Planning, Priority Setting, Resource Allocation; McGraw-Hill: New York, NY, USA, 1980. [Google Scholar]
  52. Yang, C.C.; Chen, B.S. Supplier selection using combined analytical hierarchy process and grey relational analysis. J. Manuf. Technol. Manag. 2006, 17, 926–941. [Google Scholar] [CrossRef]
  53. Čuš-Babič, N.; Rebolj, D.; Nekrep-Perc, M.; Podbreznik, P. Supply-chain transparency within industrialized construction projects. Comput. Ind. 2014, 65, 345–353. [Google Scholar] [CrossRef]
  54. Mahalik, N.; Kim, K. 2—The Role of Information Technology Developments in Food Supply Chain Integration and Monitoring. Available online: http://www.sciencedirect.com/science/article/pii/B9781782424475000022 (accessed on 21 June 2015).
  55. Abanda, F.H.; Vidalakis, C.; Oti, A.H.; Tah, J.H.M. A critical analysis of Building Information Modelling systems used in construction projects. Adv. Eng. Softw. 2015, 90, 183–201. [Google Scholar] [CrossRef]
  56. Hartmann, T.; Ju, G.; Fischer, M. Areas of Application for 3D and 4D Models on Construction Projects. J. Constr. Eng. Manag. 2008, 134, 776–785. [Google Scholar] [CrossRef]
  57. Aram, S.; Eastman, C.; Sacks, R. Requirements for BIM platforms in the concrete reinforcement supply chain. Autom. Constr. 2013, 35, 1–17. [Google Scholar] [CrossRef]
  58. Zhang, J.P.; Ma, Z.Y.; Pu, C. 4D visualization of construction site management. In Proceedings of the Fifth International Conference on Information Visualisation, London, UK, 25–27 July 2001; pp. 382–387.
  59. Shadram, F.; Johansson, T.D.; Lu, W.; Schade, J.; Olofsson, T. An integrated BIM-based framework for minimizing embodied energy during building design. Energy Build. 2016, 128, 592–604. [Google Scholar] [CrossRef]
  60. Ergen, E.; Akinci, B.; Sacks, R. Tracking and locating components in a precast storage yard utilizing radio frequency identification technology and GPS. Autom. Constr. 2007, 16, 354–367. [Google Scholar] [CrossRef]
  61. Ma, Z.Y.; Shen, Q.P.; Zhang, J.P. Application of 4D for dynamic site layout and management of construction projects. Autom. Constr. 2005, 14, 369–381. [Google Scholar] [CrossRef]
  62. Fahimnia, B.; Tang, C.S.; Davarzani, H.; Sarkis, J. Quantitative models for managing supply chain risks: A review. Eur. J. Oper. Res. 2015, 247, 1–15. [Google Scholar] [CrossRef]
  63. Mignard, C.; Nicolle, C. Merging BIM and GIS using ontologies application to urban facility management in ACTIVe3D. Comput. Ind. 2014, 65, 1276–1290. [Google Scholar] [CrossRef]
  64. Lu, W.; Olofsson, T. Building information modeling and discrete event simulation: Towards an integrated framework. Autom. Constr. 2014, 44, 73–83. [Google Scholar] [CrossRef]
  65. Jongeling, R.; Olofsson, T. A method for planning of work-flow by combined use of location-based scheduling and 4D CAD. Autom. Constr. 2007, 16, 189–198. [Google Scholar] [CrossRef]
  66. Ospina-Alvarado, A.M.; Castro-Lacouture, D. Interaction of Processes and Phases in Project Scheduling Using BIM for A/E/C/FM Integration. In Proceedings of the Construction Research Congress, Banff, AB, Canada, 8–10 May 2010; pp. 407–424.
  67. Jiang, S. Study on vendor-selection based on grey relevant analysis. J. Harbin Univ. Commer. 2004, 13, 1843–1846. [Google Scholar]
  68. Genovese, A.; Acquaye, A.A.; Figueroa, A.; Koh, S.C.L. Sustainable supply chain management and the transition towards a circular economy: Evidence and some applications. Omega 2017, 66, 344–357. [Google Scholar] [CrossRef]
  69. Shen, L.; Olfat, L.; Govindan, K.; Khodaverdi, R.; Diabat, A. A fuzzy multi criteria approach for evaluating green supplier’s performance in green supply chain with linguistic preferences. Resour. Conserv. Recycl. 2013, 74, 170–179. [Google Scholar] [CrossRef]
  70. Karsak, E.E.; Dursun, M. An integrated fuzzy MCDM approach for supplier evaluation and selection. Comput. Ind. Eng. 2015, 82, 82–93. [Google Scholar] [CrossRef]
  71. Ashtiani, M.; Azgomi, M.A. A multi-criteria decision-making formulation of trust using fuzzy analytic hierarchy process. Cognit. Technol. Work 2015, 17, 465–488. [Google Scholar] [CrossRef]
  72. Ayhan, M.B.; Kilic, H.S. A two stage approach for supplier selection problem in multi-item/multi-supplier environment with quantity discounts. Comput. Ind. Eng. 2015, 85, 1–12. [Google Scholar] [CrossRef]
  73. Ghodsypour, S.H.; O’Brien, C. A decision support system for supplier selection using an integrated analytic hierarchy process and linear programming. Int. J. Prod. Econ. 1998, 56–57, 199–212. [Google Scholar] [CrossRef]
  74. Parthiban, P.; Zubar, H.A.; Garge, C.P. A Multi Criteria Decision Making Approach for Suppliers Selection. Procedia Eng. 2012, 38, 2312–2328. [Google Scholar] [CrossRef]
  75. Scott, J.; Ho, W.; Dey, P.K.; Talluri, S. A decision support system for supplier selection and order allocation in stochastic, multi-stakeholder and multi-criteria environments. Int. J. Prod. Econ. 2015, 166, 226–237. [Google Scholar] [CrossRef]
  76. Bruno, G.; Esposito, E.; Genovese, A.; Simpson, M. Applying supplier selection methodologies in a multi-stakeholder environment: A case study and a critical assessment. Expert Syst. Appl. 2016, 43, 271–285. [Google Scholar] [CrossRef]
  77. Katsikeas, C.S.; Paparoidamis, N.G.; Katsikea, E. Supply source selection criteria: The impact of supplier performance on distributor performance. Ind. Mark. Manag. 2004, 33, 755–764. [Google Scholar] [CrossRef]
  78. Mafakheri, F.; Breton, M.; Ghoniem, A. Supplier selection-order allocation: A two-stage multiple criteria dynamic programming approach. Int. J. Prod. Econ. 2011, 132, 52–57. [Google Scholar] [CrossRef]
  79. Govindan, K.; Khodaverdi, R.; Jafarian, A. A fuzzy multi criteria approach for measuring sustainability performance of a supplier based on triple bottom line approach. J. Clean. Prod. 2013, 47, 345–354. [Google Scholar] [CrossRef]
  80. Babazadeh, R.; Razmi, J.; Rabbani, M.; Pishvaee, M.S. An integrated data envelopment analysis-mathematical programming approach to strategic biodiesel supply chain network design problem. J. Clean. Prod. 2015, in press. [Google Scholar] [CrossRef]
  81. Bottani, E.; Rizzi, A. An adapted multi-criteria approach to suppliers and products selection—An application oriented to lead-time reduction. Int. J. Prod. Econ. 2008, 111, 763–781. [Google Scholar] [CrossRef]
  82. Kubler, S.; Voisin, A.; Derigent, W.; Rondeau, E.; Thomas, A. A fuzzy analytic hierarchy process for group decision making: Application for embedding information on communicating materials. In Proceedings of the 2012 2nd International Conference on Communications, Computing and Control Applications (CCCA), Marseilles, France, 6–8 December 2012.
  83. Sener, E.; Sener, S. Evaluation of groundwater vulnerability to pollution using fuzzy analytic hierarchy process method. Environ. Earth Sci. 2015, 73, 8405–8424. [Google Scholar] [CrossRef]
  84. Chai, J.; Ngai, E.W.T. Multi-perspective strategic supplier selection in uncertain environments. Int. J. Prod. Econ. 2015, 166, 215–225. [Google Scholar] [CrossRef]
  85. Jadidi, O.; Cavalieri, S.; Zolfaghari, S. An improved multi-choice goal programming approach for supplier selection problems. Appl. Math. Model. 2015, 39, 4213–4222. [Google Scholar] [CrossRef]
  86. Ekici, A. An improved model for supplier selection under capacity constraint and multiple criteria. Int. J. Prod. Econ. 2013, 141, 574–581. [Google Scholar] [CrossRef]
  87. Żak, J. Comparative Analysis of Multiple Criteria Evaluations of Suppliers in Different Industries. Transp. Res. Procedia 2015, 10, 809–819. [Google Scholar] [CrossRef]
  88. Chu, T.; Varma, R. Evaluating suppliers via a multiple levels multiple criteria decision making method under fuzzy environment. Comput. Ind. Eng. 2012, 62, 653–660. [Google Scholar] [CrossRef]
  89. Wu, C.; Barnes, D. An integrated model for green partner selection and supply chain construction. J. Clean. Prod. 2016, 112, 2114–2132. [Google Scholar] [CrossRef]
  90. Kremer, G.E.; Haapala, K.; Murat, A.; Chinnam, R.B.; Kim, K.; Monplaisir, L.; Lei, T. Directions for instilling economic and environmental sustainability across product supply chains. J. Clean. Prod. 2016, 112, 2066–2078. [Google Scholar] [CrossRef]
  91. Saaty, T.L.; Hu, G. Ranking by Eigenvector versus other methods in the Analytic Hierarchy Process. Appl. Math. Lett. 1998, 11, 121–125. [Google Scholar] [CrossRef]
  92. Li, Z.; Wen, G.; Xie, N. An approach to fuzzy soft sets in decision making based on grey relational analysis and Dempster-Shafer theory of evidence: An application in medical diagnosis. Artif. Intell. Med. 2015, 64, 161–171. [Google Scholar] [CrossRef] [PubMed]
  93. Liang, X.; Wang, X.; Shu, G.; Wei, H.; Tian, H.; Wang, X. A review and selection of engine waste heat recovery technologies using analytic hierarchy process and grey relational analysis. Int. J. Energy Res. 2015, 39, 453–471. [Google Scholar] [CrossRef]
  94. Ruiz-Torres, A.J.; Mahmoodi, F.; Zeng, A.Z. Supplier selection model with contingency planning for supplier failures. Comput. Ind. Eng. 2013, 66, 374–382. [Google Scholar] [CrossRef]
Figure 1. Supplier selection workflow of the framework integrating building information modeling (BIM) and geographic information system (GIS).
Sustainability 09 00289 g001
Figure 2. Supplier selection framework in the resilient construction supply chain (RCSC).
Sustainability 09 00289 g002
Figure 3. The four main steps for the AHP-GRA method [67].
Sustainability 09 00289 g003
Figure 4. The hierarchical structure of the resilient supplier selection problem [51].
Sustainability 09 00289 g004
Figure 5. 3D building model of the illustrative case.
Sustainability 09 00289 g005
Figure 6. Specifications of project door in BIM.
Sustainability 09 00289 g006
Figure 7. Results of the network analyst in the GIS.
Sustainability 09 00289 g007
Figure 8. Sensitivity analysis of suppliers on resilience criteria.
Sustainability 09 00289 g008
Table 1. Key works in each construction stage.
Construction StageDescription of Key Works
Design-decision stageBIM tools are used to design and model a given construction project. Material requirements at any specified time and their detailed take-off can be presented by BIM tools. The quantities of building elements and information including the materials to be procured, both temporary and permanent are exported. Quantities that cannot be extracted via BIM directly would need to be manually entered [7].
Preliminary supplier selection stageThe external supplier database is established in advance. Based on procurement needs, available material suppliers and the impact of their locations on schedules for the project are searched and evaluated. The GIS module is fed descriptive information (e.g., a transportation network) and the geographical locations of suppliers to map the supply chain process. In this regard, useful information can be extracted and used in supporting the supplier selection process based on the comprehensive AHP and GRA approach. The hierarchical structure of the evaluation process is established first, then the Grey relational coefficient matrix is obtained via GRA. In other words, GRA is used for the resilient construction supplier selection process while AHP is used to determine the evaluation criteria weights.
Logistics stageLogistics management involves a range of activities of material flows between different suppliers and the construction site to meet the requirements of a given project (including transportation, inventory, warehousing, material handling, and logistics information). By integrating the Global Positioning System (GPS) and radio frequency identification (RFID) technologies with the geographic information system (GIS), the logistics process can be very conveniently monitored and renewed [62]. Once a supply chain disruption occurs, the supply chain manager can reselect an appropriate supplier when necessary by using GIS to provide decision support information (e.g., to define the optimal path) and prioritizing weighting-related resilient criteria.
Construction stageThe material status is updated to visualize the discrete elements available in BIM. Ensure that the project schedule can be met. If a delay emerges, suppliers may be reselected.
Delivery stageThe project will go through the final acceptance of construction and go into service. All related documents of the construction project (e.g., project’s as-built drawings and documentation, MS Access database) can be handover to the owner/client.
Table 2. Resilient construction supplier selection criteria.
Primary CriteriaSub-CriteriaRemarks and Related Attributes in the LiteratureRelevant Literature
Primary performance factors C1Product quality C11Return rates of products, rejection from customers, acceptability rate, product qualification ratio as reference[32,69,70,71,72,73,74,75,76,77,78]
Commodity price and cost C12Product quotation or comprehensive product cost[9,34,69,70,73,74,78,79,80]
Delivery and service C13Includes appropriateness of the delivery date (%), waiting time, and delivery efficiency[9,69,73,74,77,79,80,81,82]
Flexibility C2Time flexibility C21 *Delivery time flexibility [1,9,32,35,69,76,78,81]
Product flexibility C22 *Range of alternative products [9,32,33,34,35,69,74,83]
Quantity flexibility C23 *The maximum number under profitable conditions[9,32,33,45,69,74,76,79]
Enterprise Capacity C3Management level C31Management methods, management philosophy, philosophy of operation, organization, and advanced level of management process[1,9,69,72,77,79,84,85]
Risk reduction and responsiveness C32Supplier should be aware of the various levels of risks, be able to cope with risks and emergencies, and be responsible[9,33,45,47,70,74,82,84]
Reputation and prestige C33Cooperation intention, performance, prestige in the Architecture Engineering Construction (AEC) industry[9,30,39,69,74,75,79,80,85]
Political and legal environment C34Compliance with local law [1,39,52,69,74,75,86,87]
Service distance C35 **Convenience between the supplier and the construction site [1,9,39,71,74,75,78,82,88]
The level of informatization C36Information equipment assembly rate, and comprehensive utilization of information equipment[9,52,74,75,79,80,85,86,87]
R&D C4New product development C41Suppliers should have a strong research and development ability to incorporate innovations in technology and adapt to market turbulences [9,46,69,70,73,74,75,79]
New technology development C42[17,46,61,69,70,75,78,80]
Green abilities C5Energy saving and environmental protection C51Environmental certifications, green process planning, production or product for reducing the impact on natural resources, supplied energy source minimizing[38,39,40,46,59,69,72,74,89]
Eco-design C52Deign for resource efficiency, design of products for reuse, recovery of materials, design for reduction or elimination of hazardous materials, design for minimizing embodied energy[31,39,40,45,59,69,75,79,89,90]
Pollution C53Average volume of pollution, waste water, solid waste and release of harmful materials[9,37,40,46,52,69,74,79,89,90]
* Significant relative criteria may have a high probability of priority when a disruption in the construction supply chain occurs; ** the criteria can consult the solution from GIS when specialists grade the supplier of relative criteria.
Table 3. Numerical ratings in the AHP method [51].
ScaleMeaning (A Factor Compared to B)
1A is equally important as B
3A is moderately more important than B
5A is strongly more important than B
7A is demonstrated more important than B
9A is extremely more important than B
2, 4, 6, 8Intermediate values
ReciprocalsWhen B is compared to A
Table 4. Random consistency index RI [51].
n1, 2345678910
RI00.520.891.121.121.361.411.461.49
Table 5. Local weights of the primary and secondary criteria.
Primary CriteriaRelative Weights for Primary Criteria Using AHPSecondary CriteriaRelative Weights for Secondary Criteria Using AHP
Primary performance factors C10.4407Product quality C110.4444
Commodity price and cost C120.4444
Delivery and service C130.1111
Flexibility C20.2506Time flexibility C210.4000
Product flexibility C220.4000
Quantity flexibility C230.2000
Enterprise Capacity C30.1581Management level C310.0696
Risk reduction and responsiveness C320.1205
Reputation and prestige C330.1205
Political and legal environment C340.2298
Service distance C350.2298
The level of informatization C360.2298
R&D C40.0729New product development C410.3333
New technology development C420.6667
Green abilities C50.0777Energy saving and environmental protection C510.1260
Eco-design C520.4161
Pollution C530.4579
Table 6. Four alternative suppliers and the corresponding values of the related criteria and the optimum values.
Suppliers (Si) Criteria
C11C12C13C21C22C23C31C32C33C34C35C36C41C42C51C52C53
Referential sequence 11009610.81500.80.81110.80.40.80.60.80.4
S11120950.60.41500.60.81110.60.20.60.60.60.2
S20.8100900.80.61000.80.40.410.40.80.20.80.60.40.4
S31125920.60.4600.80.60.810.60.60.40.60.40.80.2
S40.81159610.8800.60.8110.80.80.40.60.60.60.2
Table 7. Sensitivity analysis of supplier selection criteria.
CriteriaGrey Weighted Correlation Coefficient Values RiPrioritization of Suppliers
Ri (S1)Ri (S2)Ri (S3)Ri (S4)
C11 a0.78450.72510.67420.7261S1 > S4 > S2 > S3
C120.78450.72510.67420.7261S1 > S4 > S2 > S3
C130.81250.74090.70560.7684S1 > S4 > S2 > S3
C210.74660.71180.64810.7552S4 > S1 > S2 > S3
C220.74100.70600.64240.7127S1 > S4 > S2 > S3
C230.81750.68650.62190.6748S1 > S2 > S4 > S3
C310.82470.77650.73500.7025S1 > S2 > S3 > S4
C320.82330.67170.66080.7755S1 > S4 > S2 > S3
C330.82330.65450.66080.7755S1 > S4 > S3 > S2
C340.82010.77060.72810.7714S1 > S4 > S2 > S3
C350.82010.66030.63350.7052S1 > S4 > S2 > S3
C360.82010.77060.66190.7714S1 > S4 > S2 > S3
C410.75200.70310.73140.7742S1 > S4 > S2 > S3
C420.81780.76760.66270.7066S1 > S2 > S4 > S3
C510.82490.77670.66020.7776S1 > S4 > S2 > S3
C520.82090.67500.72920.7048S1 > S3 > S4 > S2
C530.75380.77080.66180.7051S4 > S1 > S6 > S3
a C11 represents the Product quality criterion; and the corresponding Ri (S1) indicates the grey weighted correlation coefficient value determined by assigning maximum possible weight to C11. Similarly, other elements of table can be read.

