
The Influence of Household Heterogeneity Factors on the Green Travel Behavior of Urban Residents in the East China Region

Abstract
:1. Introduction
2. Literature Review and Research Hypothesis
2.1. Literature Review
2.2. Research Hypothesis
3. Research Method and Data Sources
3.1. Research Method
3.2. Data Sources
3.3. The Test of Reliability and Validity
4. Result Analysis and Discussion
5. Conclusions and Policy Implications
Acknowledgments
Author Contributions
Conflicts of Interest
References
- Niu, W.Y. Chinese New-Type Urbanization Report 2012; Science Press: Beijing, China, 2012. (In Chinese) [Google Scholar]
- ChinaIRN.com. DiDi Published Chinese Urban Transportation Report of 2016 First Half Year. 2016. Available online: http://www.chinairn.com/news/20160714/16425045.shtml (accessed on 14 July 2016). (In Chinese)
- Li, X.; Zhang, G.H.; Huang, K.P. The green way to the development of Chinese urban transportation. Urban Plan. Forum 2008, 6, 51–56. (In Chinese) [Google Scholar]
- People.com. What Is Green Travel? 2010. Available online: http://env.people.com.cn/GB/178688/180057/10798248.html (accessed on 19 January 2010). (In Chinese)
- International Energy Agency (IEA). CO2 Emissions from Fuel Combustion Highlights. 2015. Available online: http://www.iea.org/publications/freepublications/publication/co2-emissions-from-fuel-combustion-highlights-2015.html (accessed on 24 March 2016).
- Wang, Z.H.; Liu, W. The impacts of individual behavior on household daily travel carbon emissions in Beijing, China. Energy Procedia 2014, 61, 1318–1322. [Google Scholar] [CrossRef]
- SOHU.com. Motor Vehicle Exhaust Emission Is Exceeding, and Is Hazardous for Human Health. 2015. Available online: http://mt.sohu.com/20151016/n423438354.shtml (accessed on 16 October 2015).
- China State Statistics Bureau. China Statistical Yearbook. Available online: http://www.stats.gov.cn/tjsj/ndsj/ (accessed on 24 January 2017). (In Chinese)
- China Big Data Industrial Observation. AMAP Published Analysis Reports of Urban Traffic in Major Chinese Cities of 2015. 2016. Available online: http://www.cbdio.com/BigData/2016–01/21/content_4524265.htm (accessed on 21 January 2016). (In Chinese)
- Atmospheric Environment Center of Yale-Nanjing University of Information Science & Technology. Study of Chinese PM2.5 Spatial and Temporal Distribution. 2015. Available online: http://news.mydrivers.com/1/451/451740.htm (accessed on 15 October 2015). (In Chinese)
- Hines, J.M.; Hungerford, H.R.; Tomera, A.N. Analysis and synthesis of research on responsible environmental behavior: A meta-analysis. J. Environ. Educ. 1986, 18, 1–8. [Google Scholar] [CrossRef]
- Hsu, S.J.; Roth, R.E. An assessment of environmental literacy and analysis of predictors of responsible environmental behavior held by secondary teachers in the Hualien area of Taiwan. Environ. Educ. Res. 1998, 4, 229–249. [Google Scholar] [CrossRef]
- Sia, A.P.; Hungerford, H.R.; Tomera, A.N. Selected predictors of responsible environmental behavior: An analysis. J. Environ. Educ. 1986, 17, 31–40. [Google Scholar] [CrossRef]
- Smith-Sebasto, N.J.; D’Costa, A. Designing a likert-type scale to predict environmentally responsible behavior in undergraduate students: A multistep process. J. Environ. Educ. 1995, 27, 14–21. [Google Scholar] [CrossRef]
- Stern, P.C. Toward a coherent theory of environmentally significant behavior. J. Soc. Issues 2000, 56, 407–424. [Google Scholar] [CrossRef]
- Gatersleben, B.; Steg, L.; Vlek, C. Measurement and determinants of environmentally significant consumer behavior. Environ. Behav. 2002, 34, 335–362. [Google Scholar] [CrossRef]
- Brounen, D.; Kok, N.; Quigley, J.M. Energy literacy, awareness, and conservation behavior of residential households. Energy Econ. 2013, 38, 42–50. [Google Scholar] [CrossRef]
- Han, Q.; Nieuwenhijsen, I.; Vries, B.; Blokhuis, E.; Schaefer, W. Intervention strategy to stimulate energy-saving behavior of local residents. Energy Policy 2013, 52, 706–715. [Google Scholar] [CrossRef]
- Huang, S.S.; Song, R.; Tao, Y. Behavior of urban residents travel mode choosing and influencing factors—Taking Beijing as an example. Commun. Stand. 2008, 9, 24–128. (In Chinese) [Google Scholar]
- Xu, F.; Xiao, Q.; Xu, G.H. Factor analysis of urban residents’ green travel modes choice based on SPSS. China Collectiv. Econ. 2011, 7, 104–105. (In Chinese) [Google Scholar]
- Golob, T.F.; Hensher, D.A. Greenhouse gas emissions and Australian commuters’ attitudes and behaviour concerning abatement policies and personal involvement. Transp. Res. D Transp. Environ. 1998, 3, 1–18. [Google Scholar] [CrossRef]
- Prillwitz, J.; Barr, S. Moving towards sustainability? Mobility styles, attitudes and individual travel behavior. J. Transp. Geogr. 2011, 19, 1590–1600. [Google Scholar] [CrossRef]
- Simma, A.; Axhausen, K.W. Structures of commitment in mode use: A comparison of Switzerland, Germany and Great Britain. Transp. Policy 2001, 8, 279–288. [Google Scholar] [CrossRef]
- Polk, M. The influence of gender on daily car use and on willingness to reduce car use in Sweden. J. Transp. Geogr. 2004, 12, 185–195. [Google Scholar] [CrossRef]
- Plaut, P.O. Non-motorized commuting in the US. Transp. Res. D Transp. Environ. 2005, 10, 347–356. [Google Scholar] [CrossRef]
- Klineberg, S.L.; McKeever, M.; Rothenbach, B. Demographic predictors of environmental concern: It does make a difference how it’s measured. Soc. Sci. Q. 1998, 79, 734–753. [Google Scholar]
- Singh, N. Exploring socially responsible behavior of Indian consumers: An empirical investigation. Soc. Responsib. J. 2009, 5, 200–211. [Google Scholar] [CrossRef]
- Liu, Q. Sustainable Consumption Which Support the Development of Low-Carbon Economy; Economic Science Press: Beijing, China, 2010. (In Chinese) [Google Scholar]
- Wang, J.M. Empirical study on urban residents’ resource-efficient consumption behavior. Economist 2007, 1, 38–44. (In Chinese) [Google Scholar]
- Ma, J.H.; Liao, N. Investigation of urban residents’ low-carbon travel in Xi’an. New West 2015, 16, 19. (In Chinese) [Google Scholar]
- Böhler, S.; Grischkat, S.; Haustein, S.; Hunecke, M. Encouraging environmentally sustainable holiday travel. Transp. Res. A 2006, 40, 652–670. [Google Scholar] [CrossRef]
- Jackson, D.T. Household energy consumption in the UK: A highly geographically and socio-economically disaggregated model. Energy Policy 2008, 36, 3167–3182. [Google Scholar]
- Franzen, A.; Meyer, R. Environmental attitudes in cross-national perspective: A multilevel analysis of the ISSP 1993 and 2000. Eur. Sociol. Rev. 2010, 26, 219–234. [Google Scholar] [CrossRef]
- Yue, T. Study on Influencing Factors and Guiding Policies of Urban Residents’ Energy-Saving Behavior. Ph.D. Thesis, China University of Mining and Technology, Xuzhou, China, 2014. [Google Scholar]
- Liu, J.X.; Yan, H.W.; Liu, G.Y. Investigation of community residents’ green consuming behavior and related message propagation. J. Taiwan Health Educ. 2000, 13, 189–212. [Google Scholar]
- Black, J.S.; Sterm, P.; Elworth, J.T. Personal and contextual influences on household energy adaptions. J. Appl. Psychol. 1985, 70, 3–21. [Google Scholar] [CrossRef]
- Painter, J.; Semenik, R.; Belk, R. Is there a generalized conservation ethic? A comparison of the determinants of gasoline and home heating energy conservation. J. Econ. Psychol. 1983, 3, 317–331. [Google Scholar] [CrossRef]
- Aydinalp, M.; Ugursal, V.I.; Fung, A.S. Modeling of the appliance, lighting, and space-cooling energy consumptions in the residential sector using neural networks. Appl. Energy 2002, 71, 87–110. [Google Scholar] [CrossRef]
- Susilo, Y.O.; Williams, K.; Lindsay, M.; Dair, C. The influence of individuals’ environmental attitudes and urban design features on their travel patterns in sustainable neighborhoods in the UK. Transp. Res. D: Transp. Environ. 2012, 17, 190–200. [Google Scholar] [CrossRef]
- Vining, J.; Ebreo, A. What makes a recycler? A comparison of recyclers and non-recyclers. Environ. Behav. 1990, 22, 55–73. [Google Scholar] [CrossRef]
- Schultz, P.W.; Oskamp, S.; Mainieri, T. Who recycles and when: A review of personal and situational factors. J. Environ. Psychol. 1995, 15, 105–121. [Google Scholar] [CrossRef]
- Marcinkowski, T.J. An Analysis of Correlates and Predictors of Responsible Environmental Behavior. Ph.D. Thesis, Southern Lllionois University, Carbondale, IL, USA, 1988. [Google Scholar]
- Scheiner, J. Does individualisation of travel behaviour exist? Determination of travel participation and mode choice in West Germany, 1976–2002. Die Erde 2006, 137, 355–377. [Google Scholar]
- Hjorthol, R. Daily mobility of men and women—A barometer of gender equality? In Gendered Mobilities; Uteng, T.P., Cresswell, T., Eds.; Ashgate: Aldershot, UK, 2008; pp. 193–210. [Google Scholar]
- Samdahl, D.M.; Robertson, R. Social determinants of environmental concern: Specification and test of the model. Environ. Behav. 1989, 21, 57–81. [Google Scholar] [CrossRef]
- Curtis, F.; Simpson-Housley, P.; Drever, S. Household energy conservation. Energy Policy 1984, 12, 452–456. [Google Scholar] [CrossRef]
- Wang, J.M.; Wang, J.H. The influencing elements of the public low-carbon consumption, and the governments’ regulatory policies. Manag. World 2011, 4, 58–68. (In Chinese) [Google Scholar]
- Sun, Y. Study on the influence of household heterogeneity factors on the energy use behavior of urban residents. J. Beijing Inst. Technol. (Soc. Sci. Ed.) 2013, 15, 23–28. (In Chinese) [Google Scholar]
- Gao, X.L.; Hou, C.Z. Review of family functional theories. Sci. Soc. Psychol. 2008, 23, 29–33. (In Chinese) [Google Scholar]
- Qu, Y.; Pan, J.Y. Empirical analysis of influencing factors of China urban residents’ green travel behavior. Liaoning Urban Rural Environ. Sci. Technol. 2014, 6, 62–66. (In Chinese) [Google Scholar]
- Pan, J.Y. Influencing Factors of Residents’ Green Travel Behavior in Large-Medium Cities. Master’s Thesis, Dalian University of Technology, Dalian, China, 2014. [Google Scholar]
- Wang, Y.Q. Analysis of Crows Characteristics and Behavior Change Countermeasure of Urban Residents’ Green Travel. Master’s Thesis, Dalian University of Technology, Dalian, China, 2014. [Google Scholar]
- Yang, R.R.; Long, R.Y. Affecting factors of theoretical model in urban residents’ green travel behavior: Based on grounded theory. Wuhan Univ. J. (Philos. Soc. Sci.) 2014, 67, 13–19. (In Chinese) [Google Scholar]
- Green Travel. Available online: http://www.china.com.cn/chinese/zhuanti/lscx/1220797.htm (accessed on 24 January 2017).
- Green Commuting. Available online: http://www.cleanair.net.cn/ (accessed on 24 January 2017).
- Sun, Y. Study on Residents’ Environmental Behavior and Its Influencing Factors. Ph.D. Thesis, Dalian University of Technology, Dalian, China, 2006. [Google Scholar]
- Schahn, J.; Holzer, E. Studies of individual environmental concern: The role of knowledge, Gender, and background variables. Environ. Behav. 1990, 22, 767–786. [Google Scholar] [CrossRef]
- Yang, R.R.; Long, R.Y. Analysis of the influencing factors of the public willingness to participate in public bicycle projects and intervention strategies—A case study of Jiangsu Province, China. Sustainability 2016, 8, 349. [Google Scholar] [CrossRef]


| Number | Research Hypothesis |
|---|---|
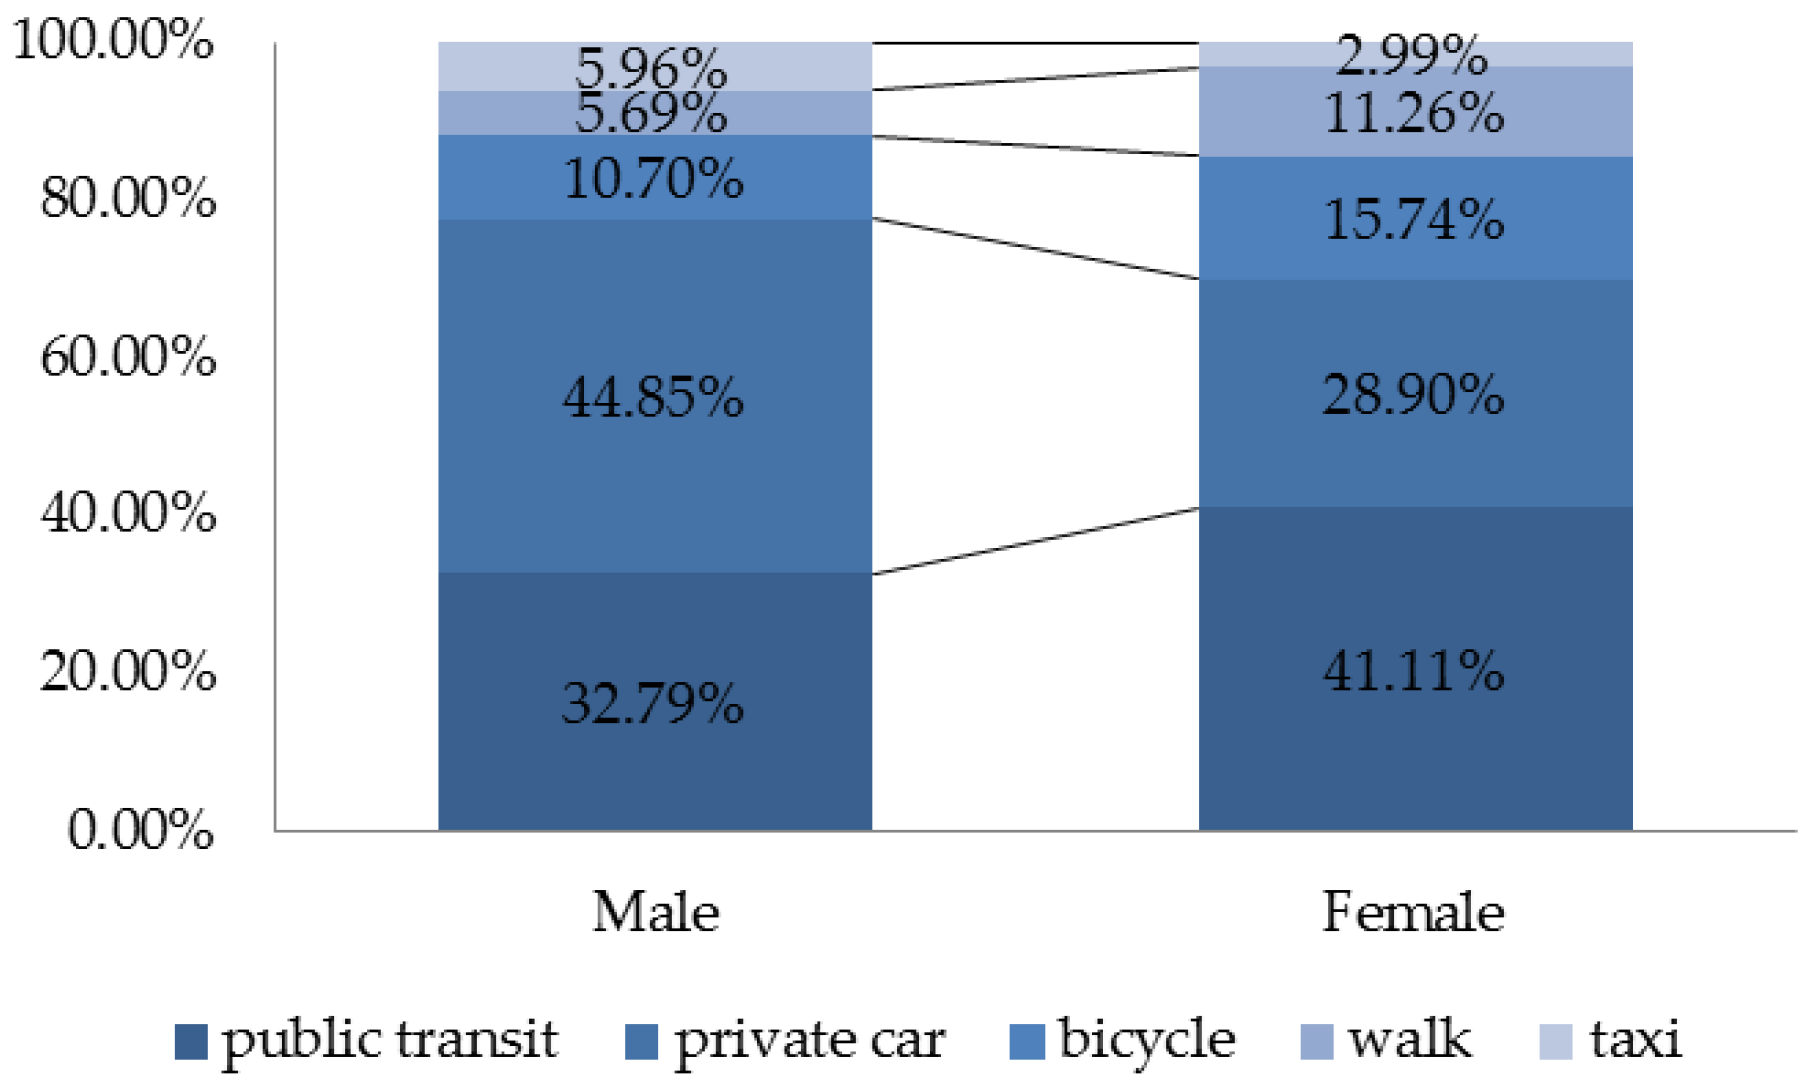
| H1 | Green travel behavior is different for men and women |
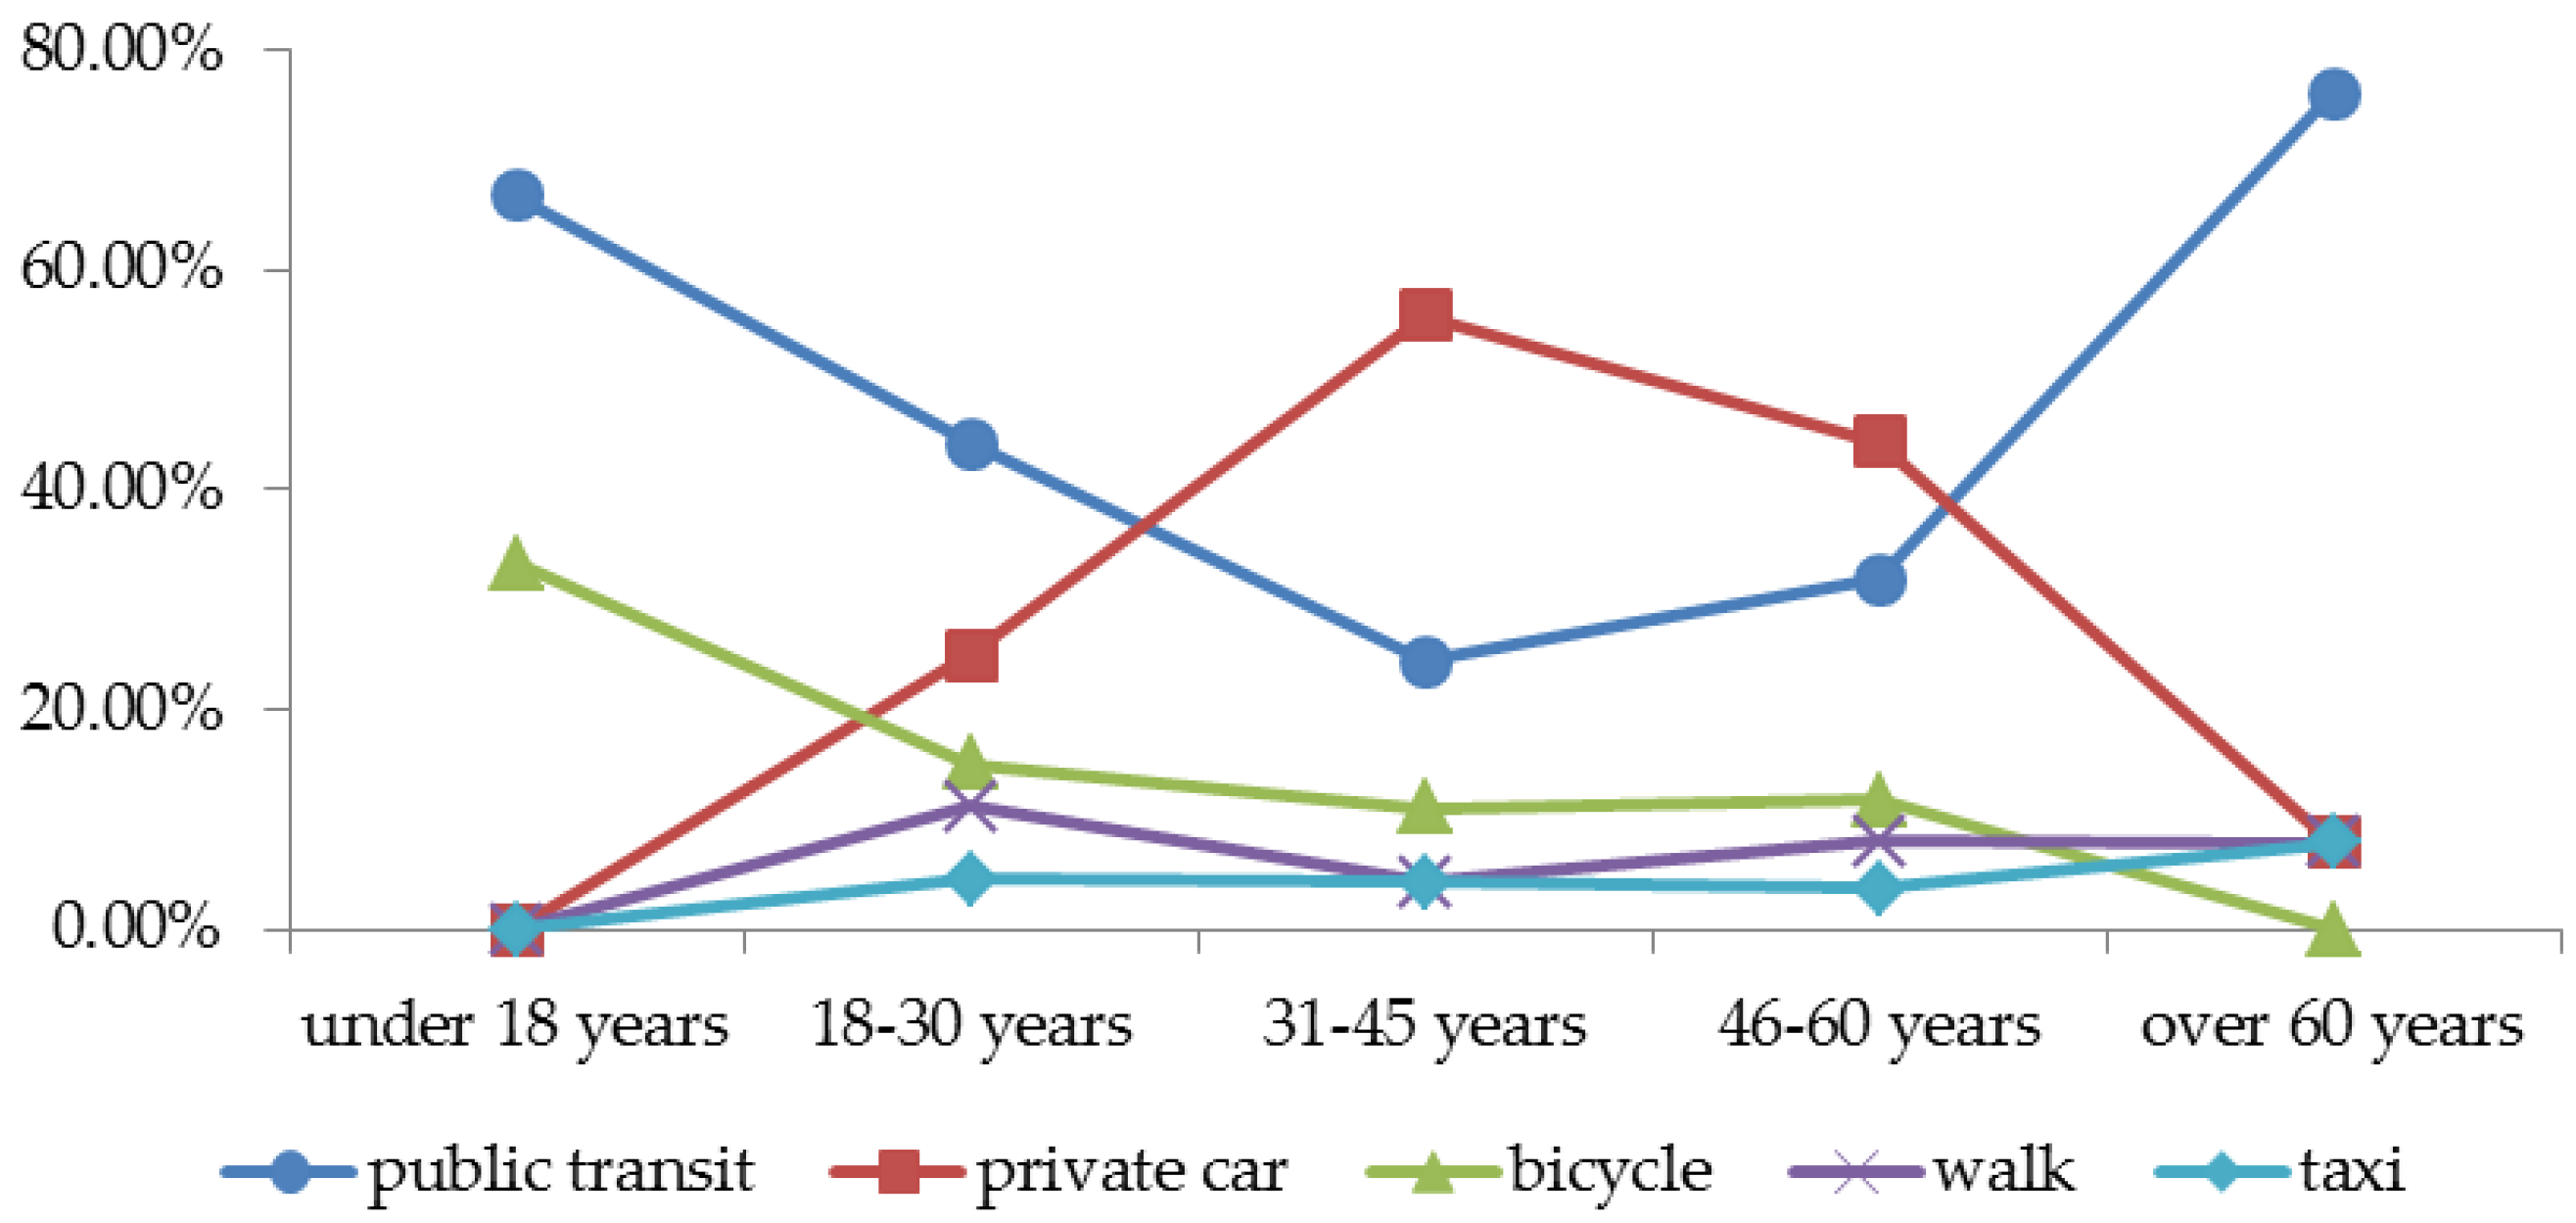
| H2 | Green travel behavior is different for various age ranges |
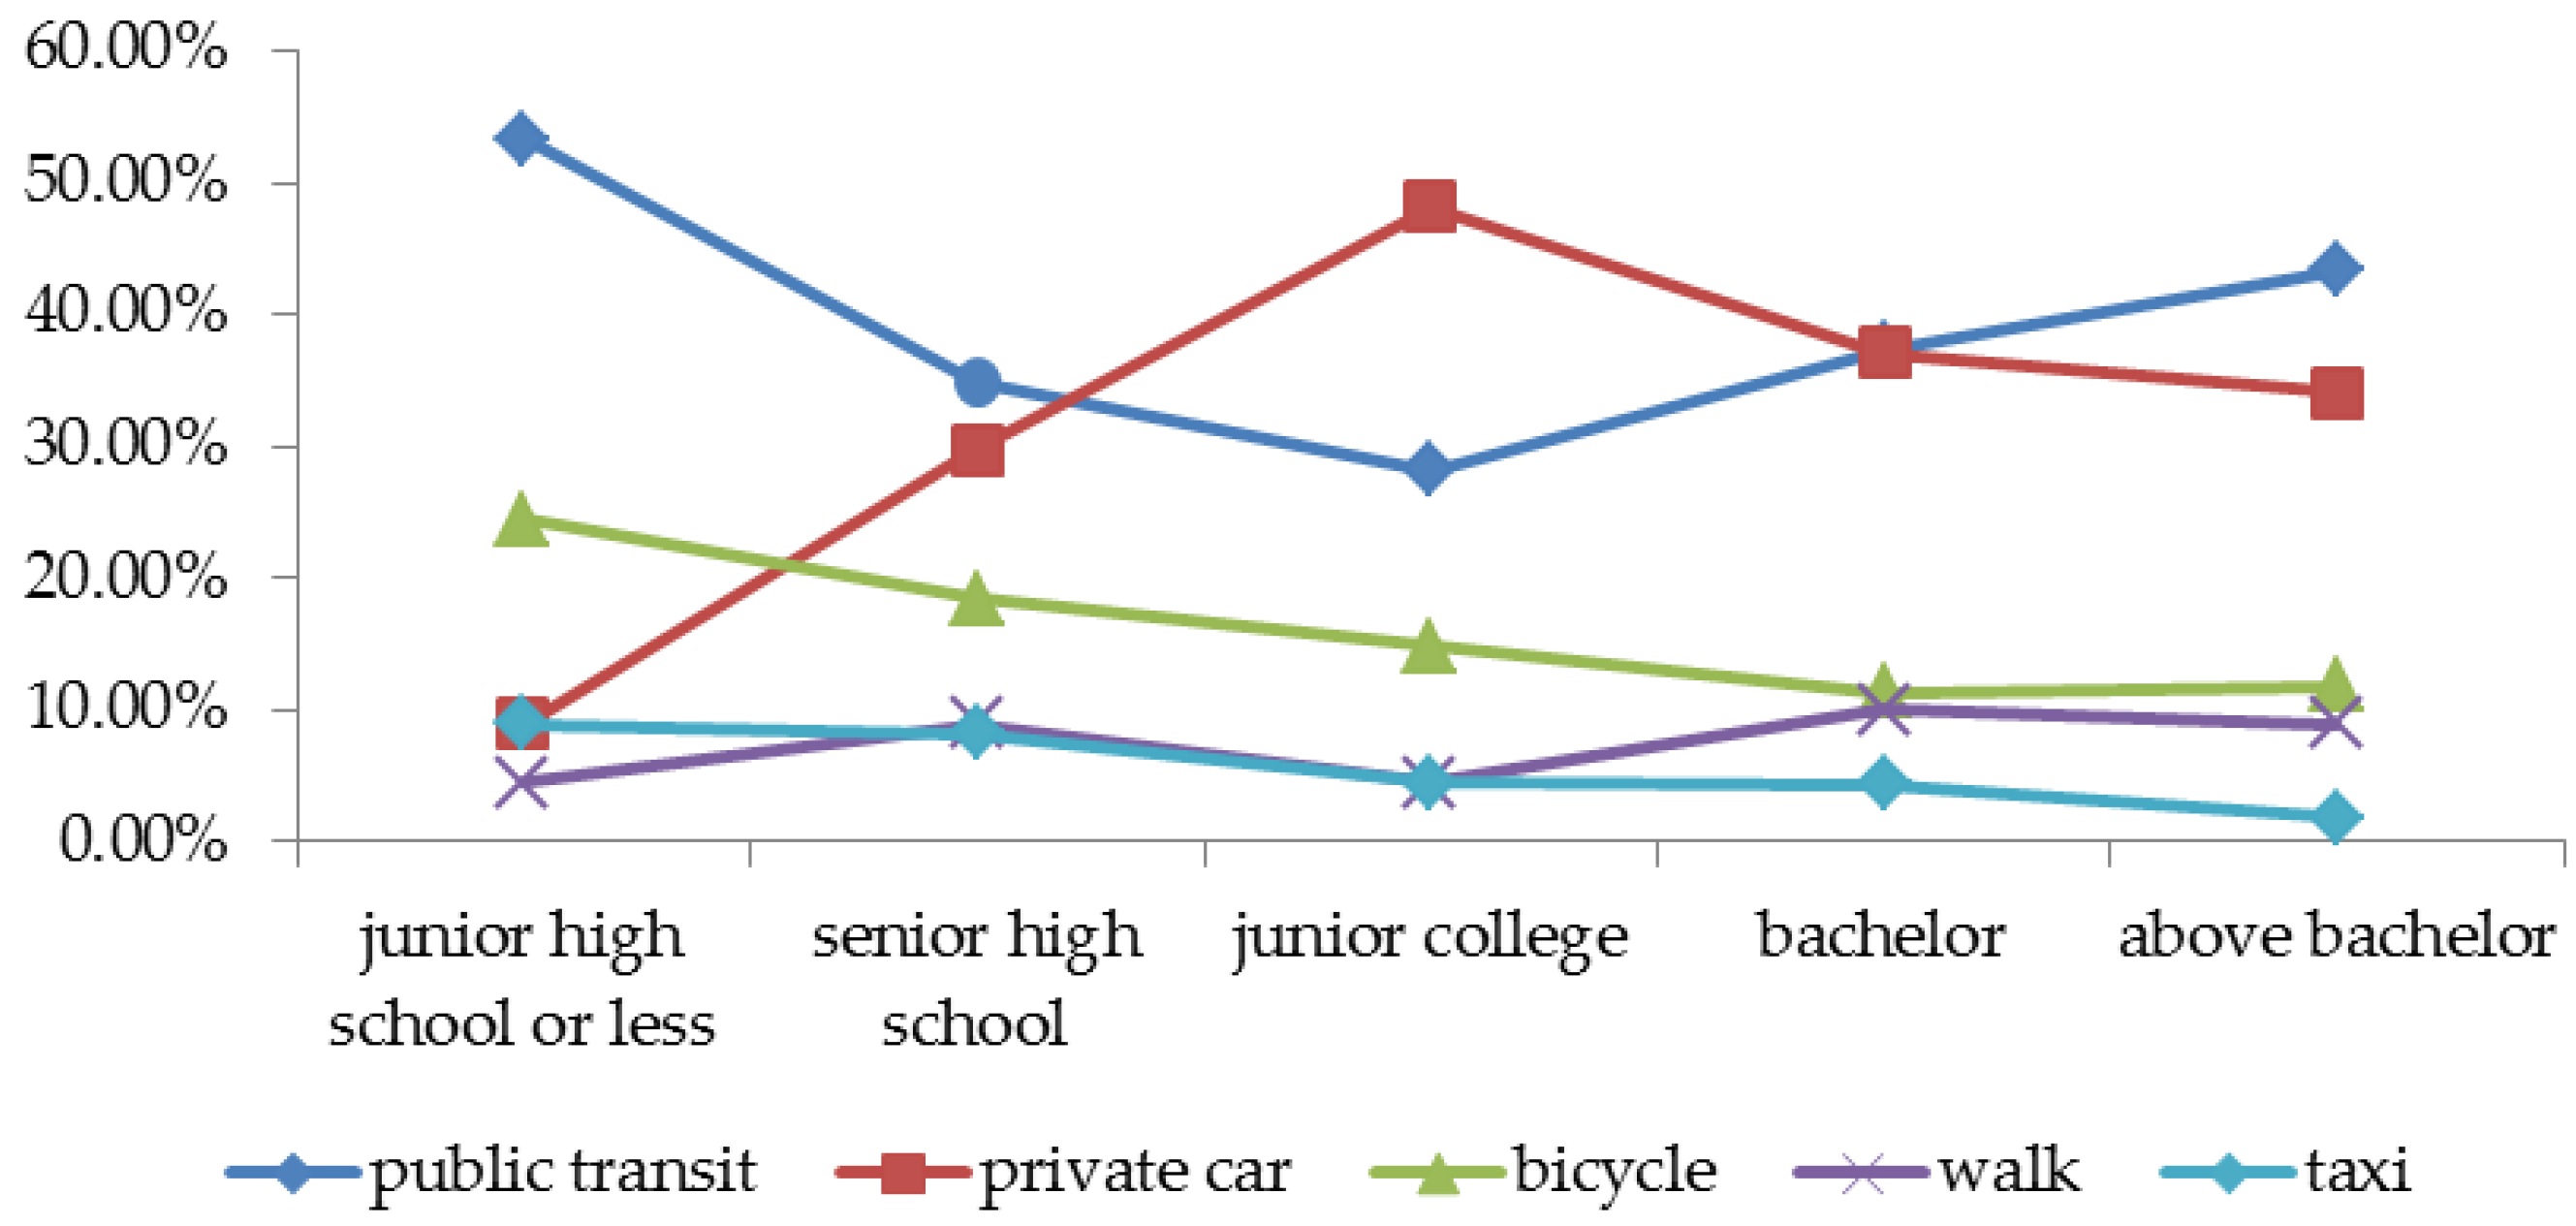
| H3 | Green travel behavior varies depending on educational background |
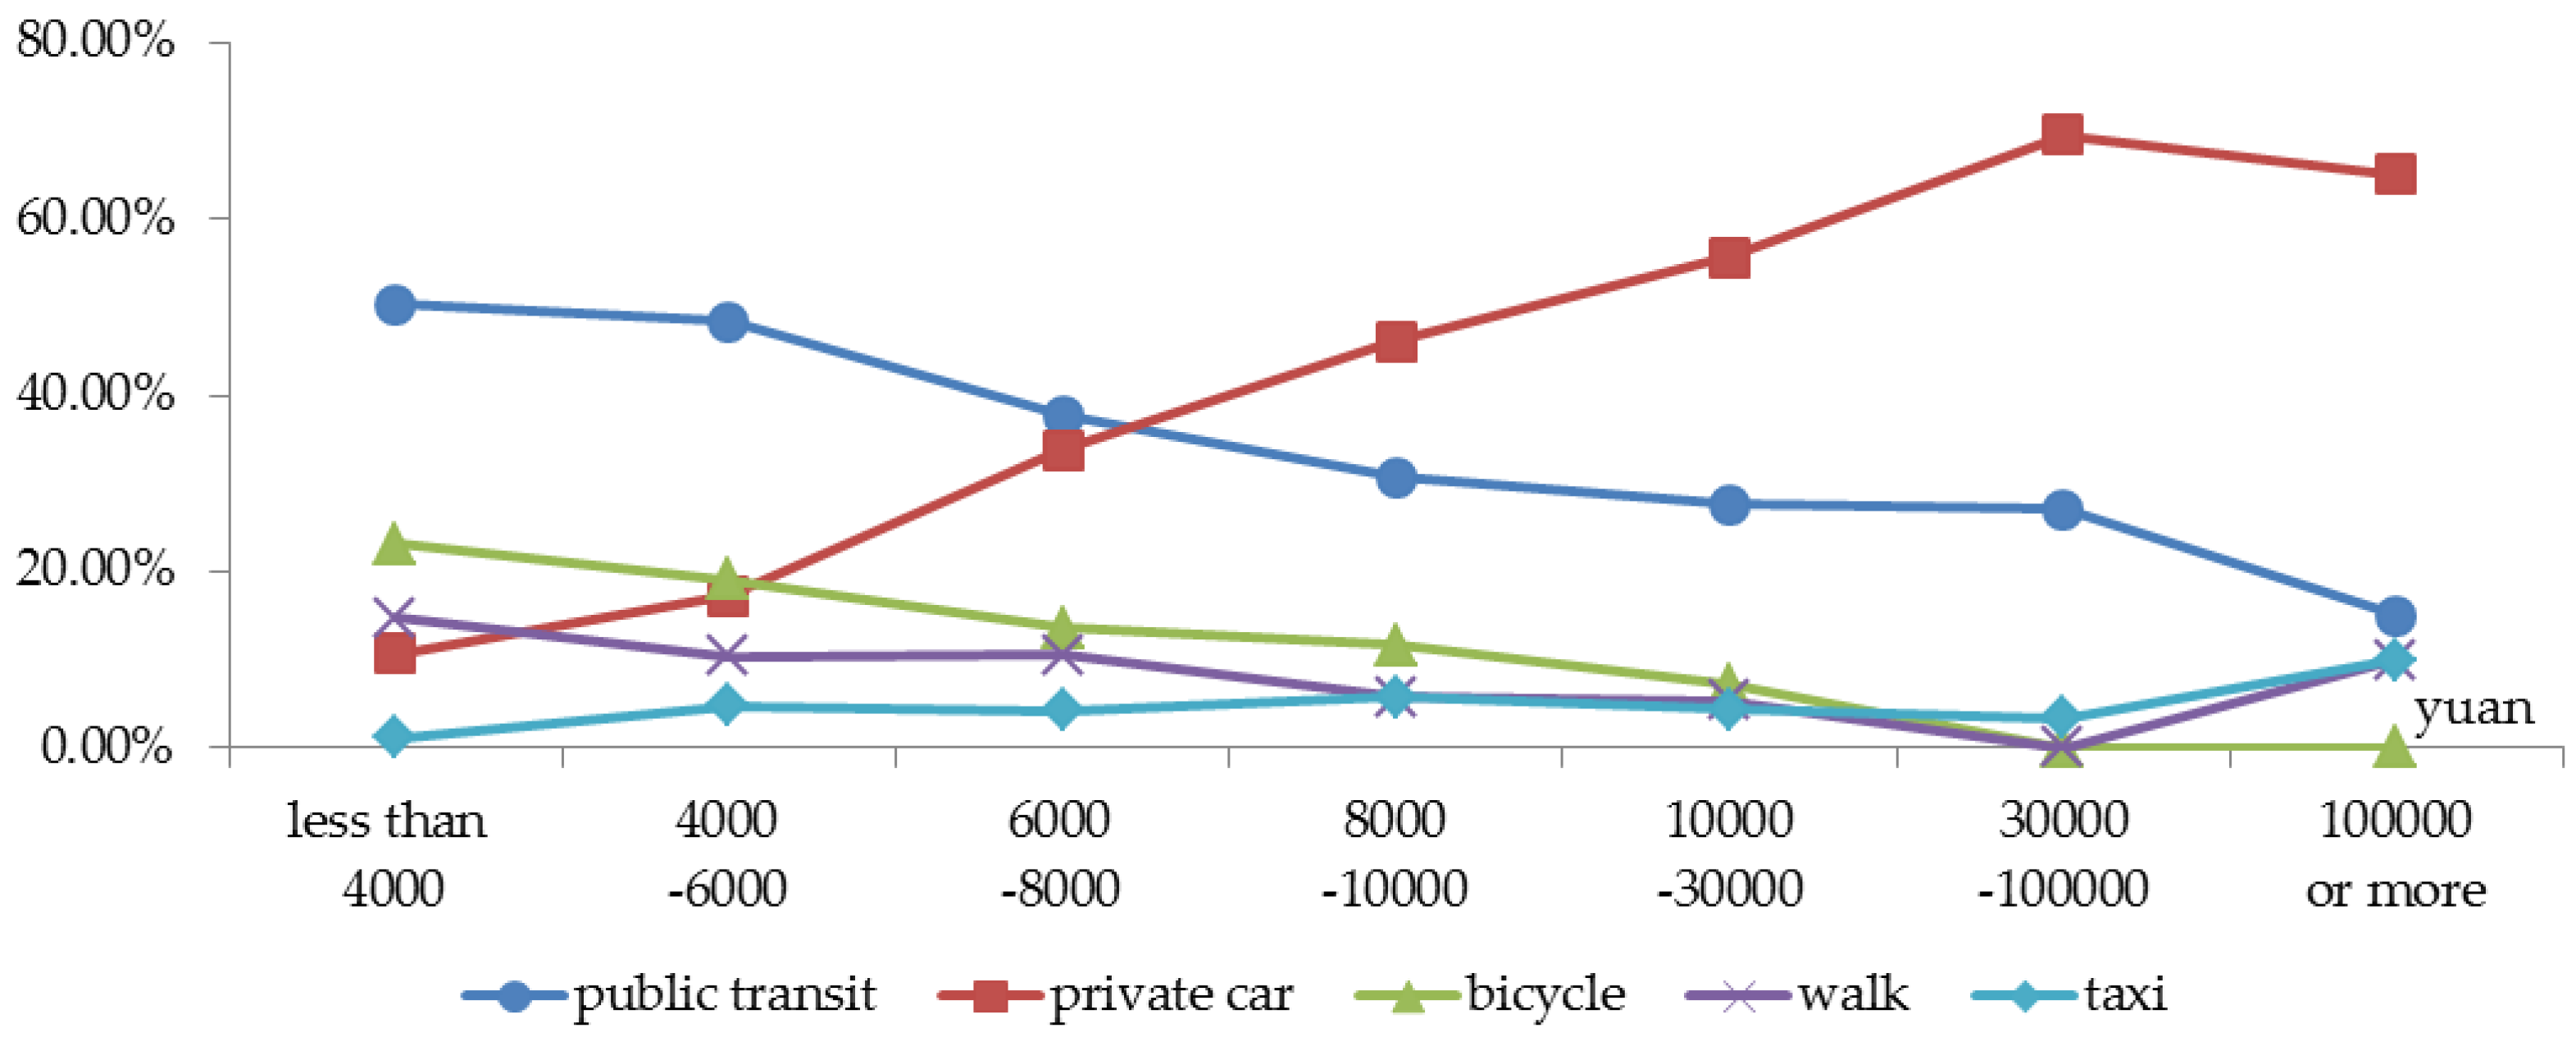
| H4 | Green travel behavior varies depending on family monthly income |
| H5 | Green travel behavior varies with various positional status |
| H6 | Green travel behavior varies with various professional status |
| H7 | Green travel behavior varies with various positional tiers |
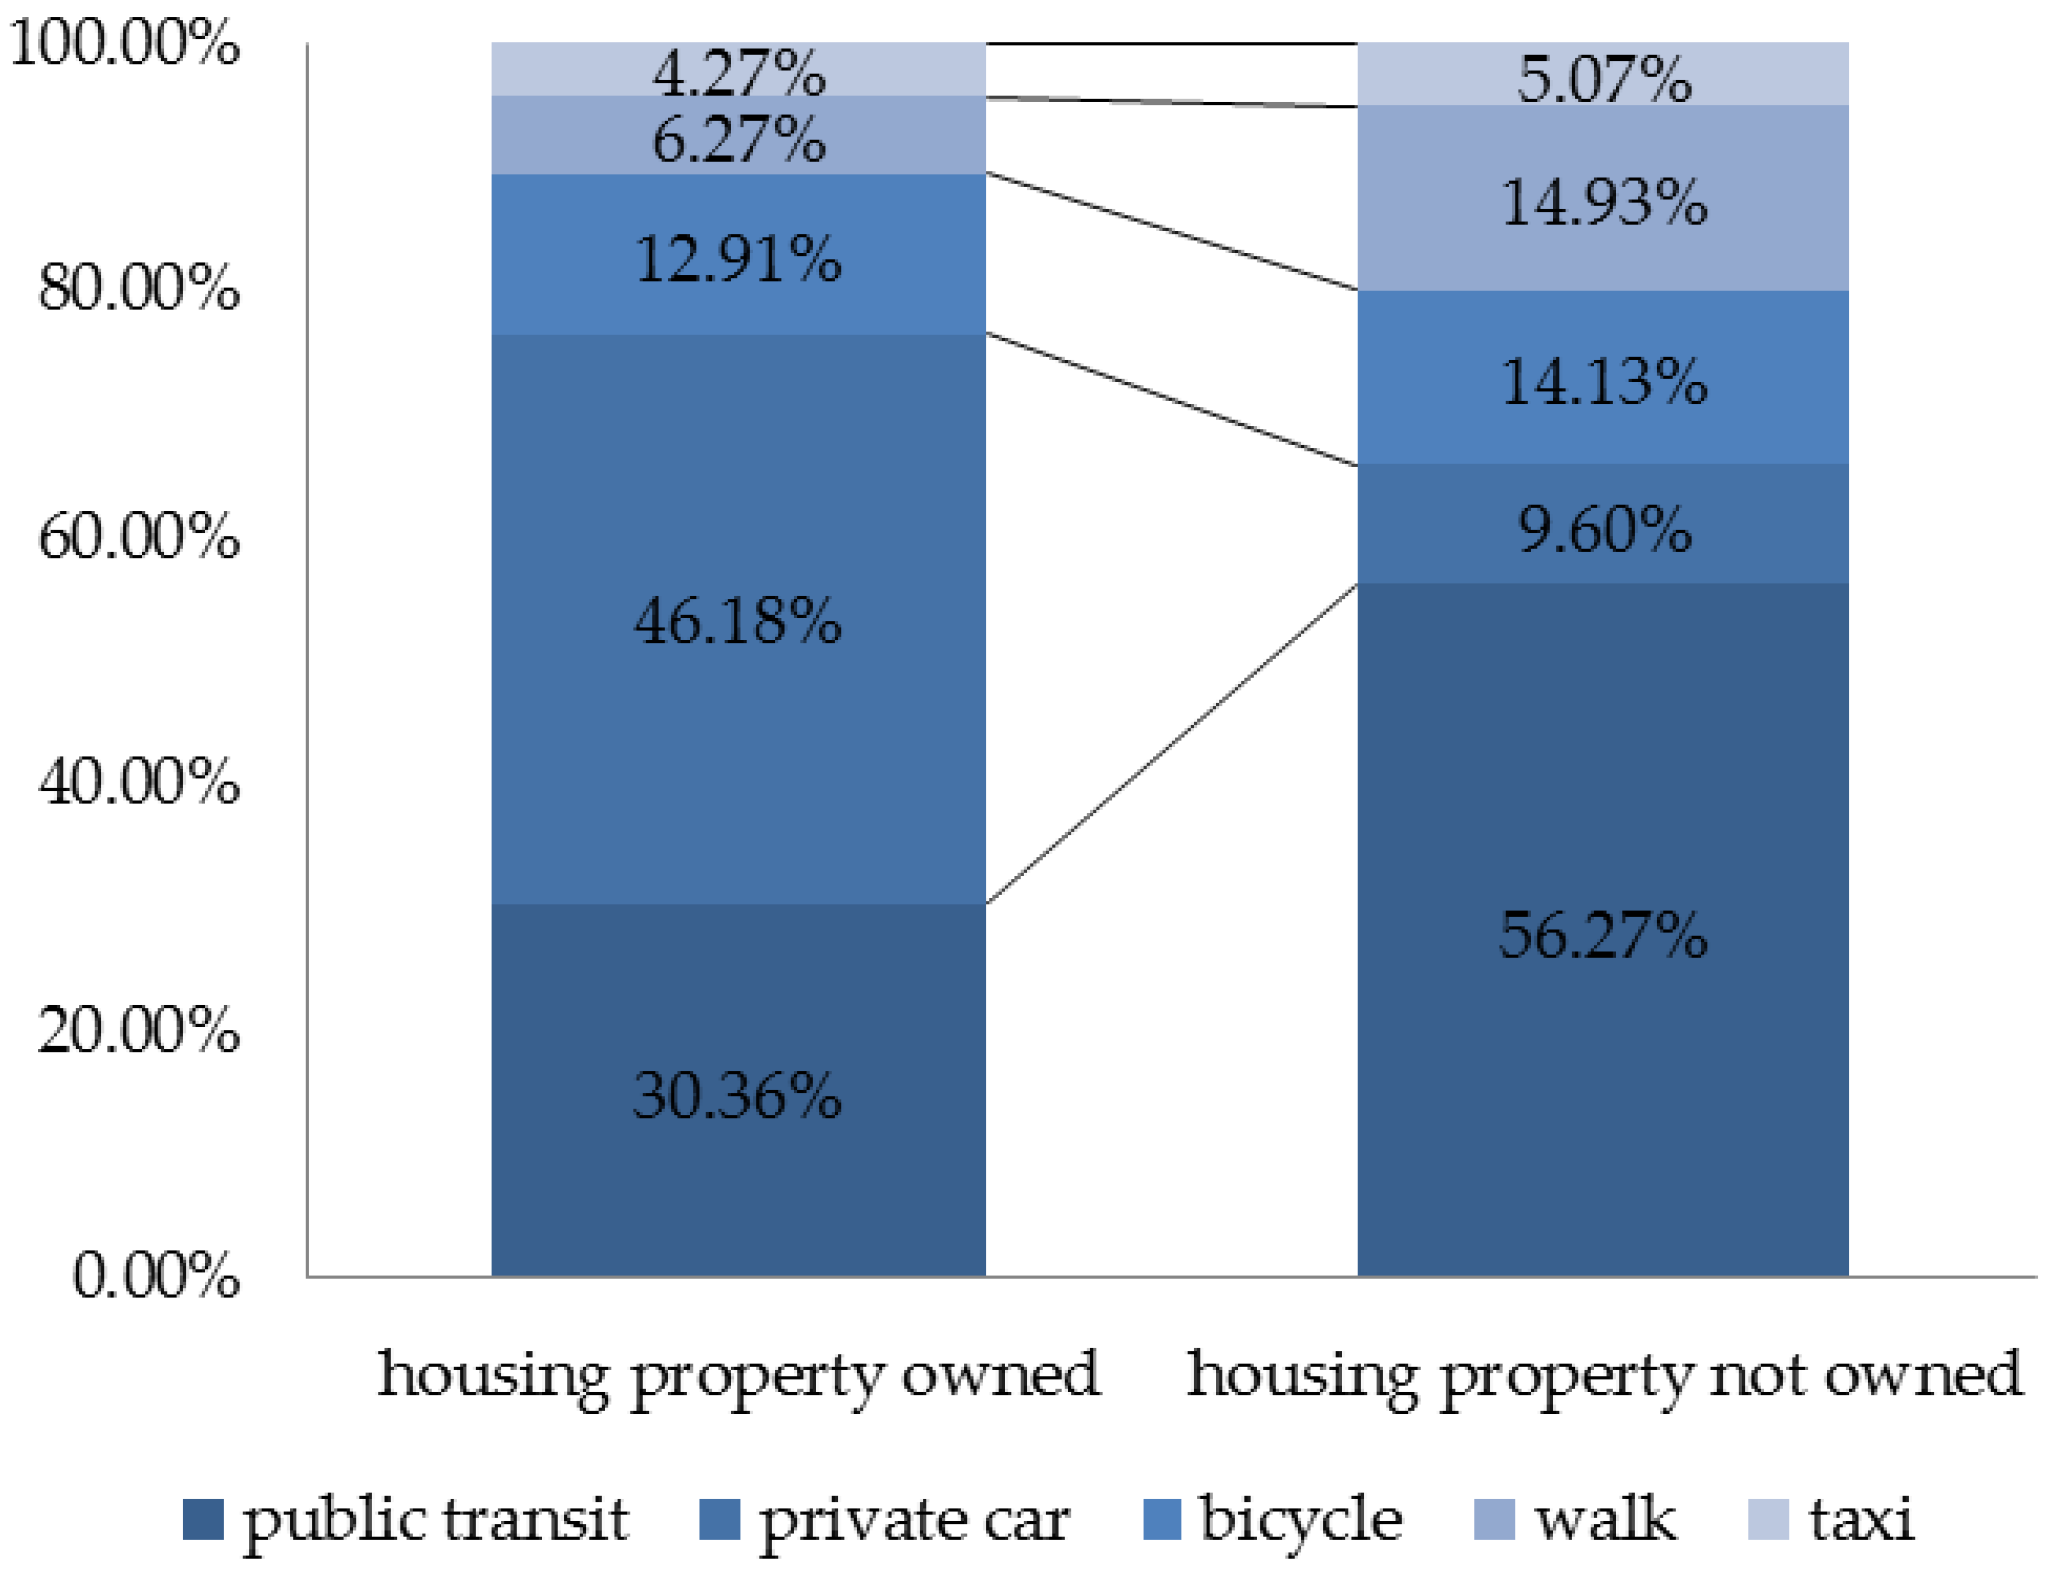
| H8 | Green travel behavior is different for different housing types |
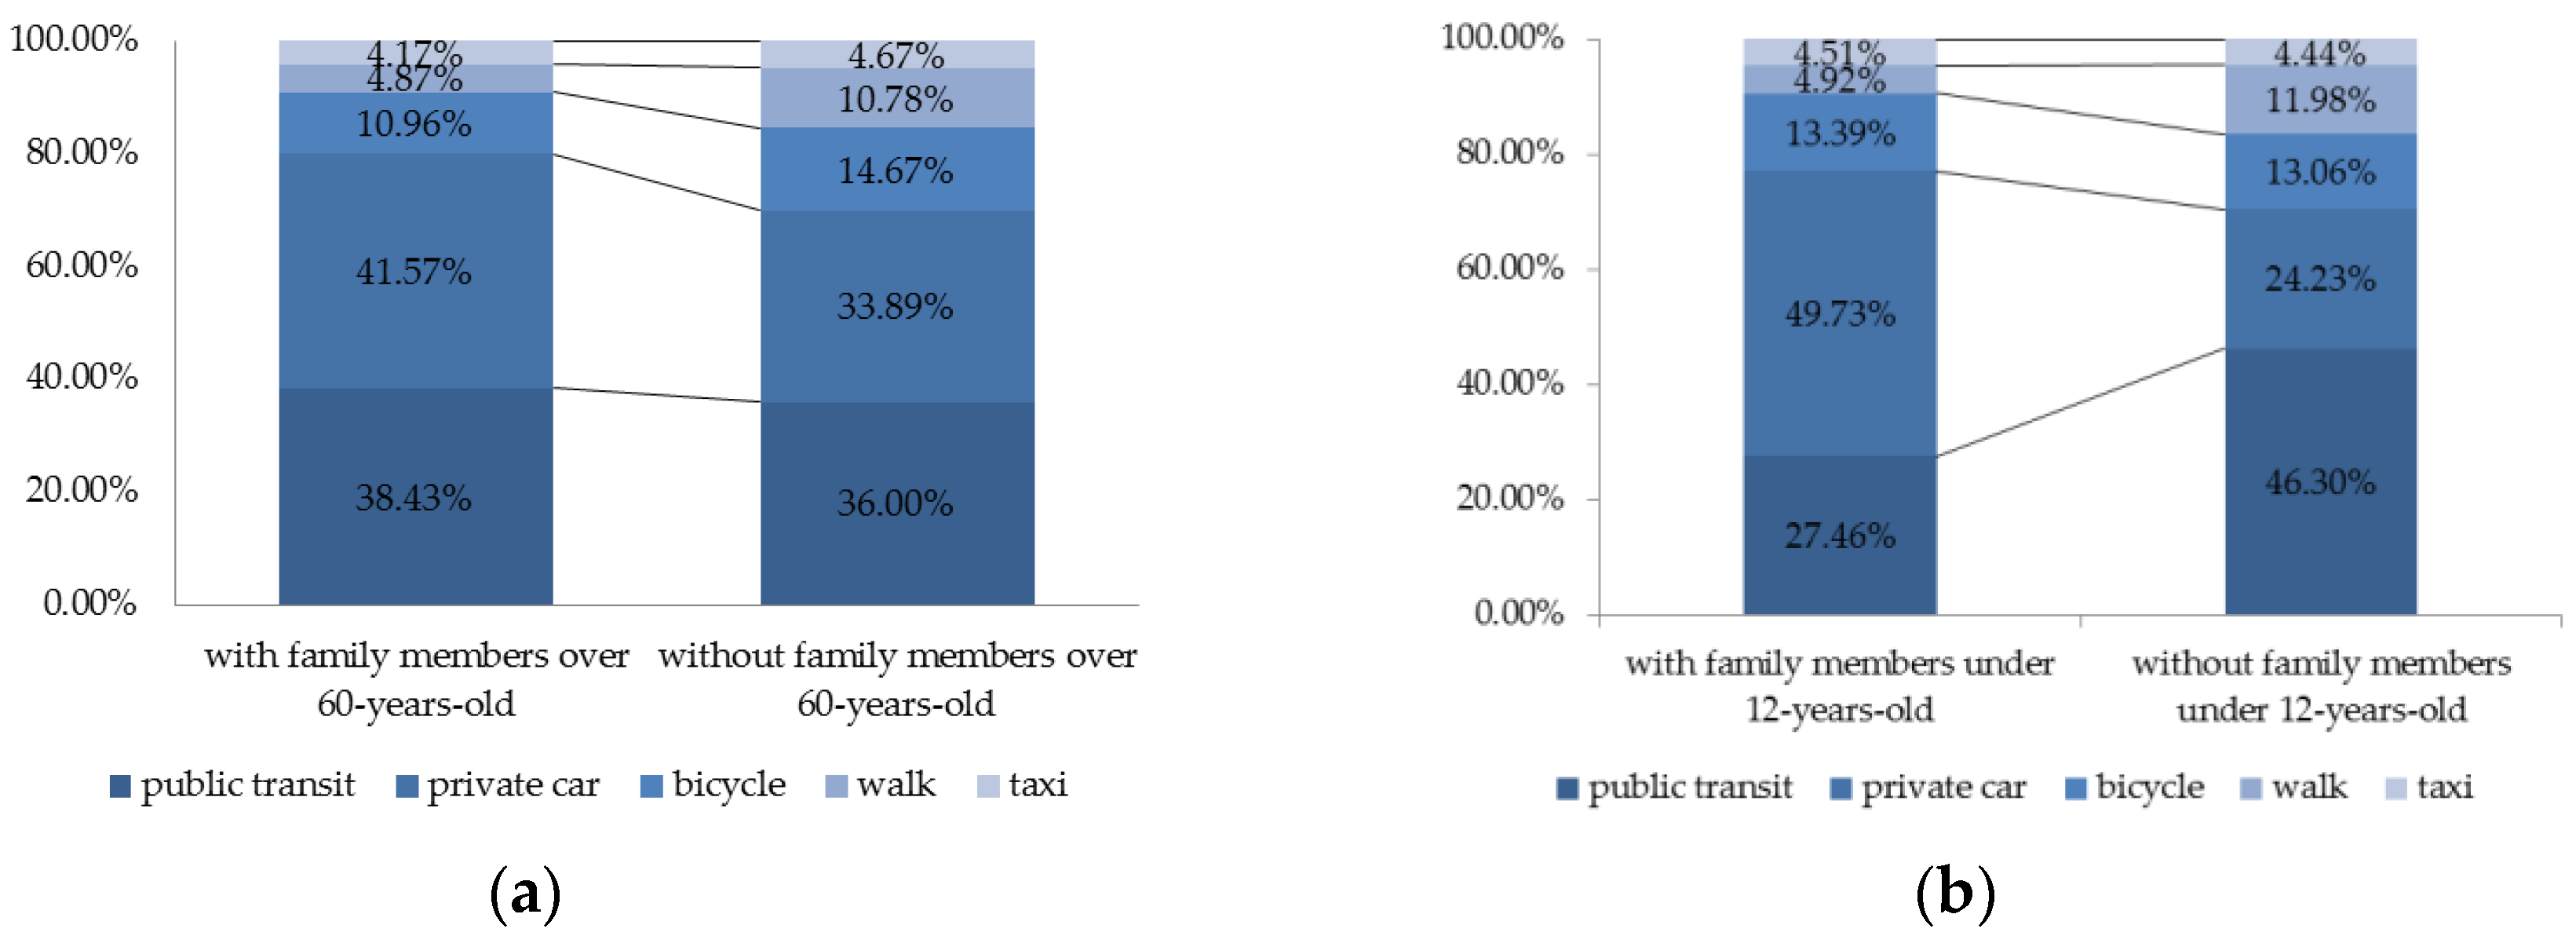
| H9 | Green travel behavior shows significant variations by whether there are elderly people over 60 years old in the family |
| H10 | Green travel behavior shows significant variations by whether there are children under 12 years old in the family |
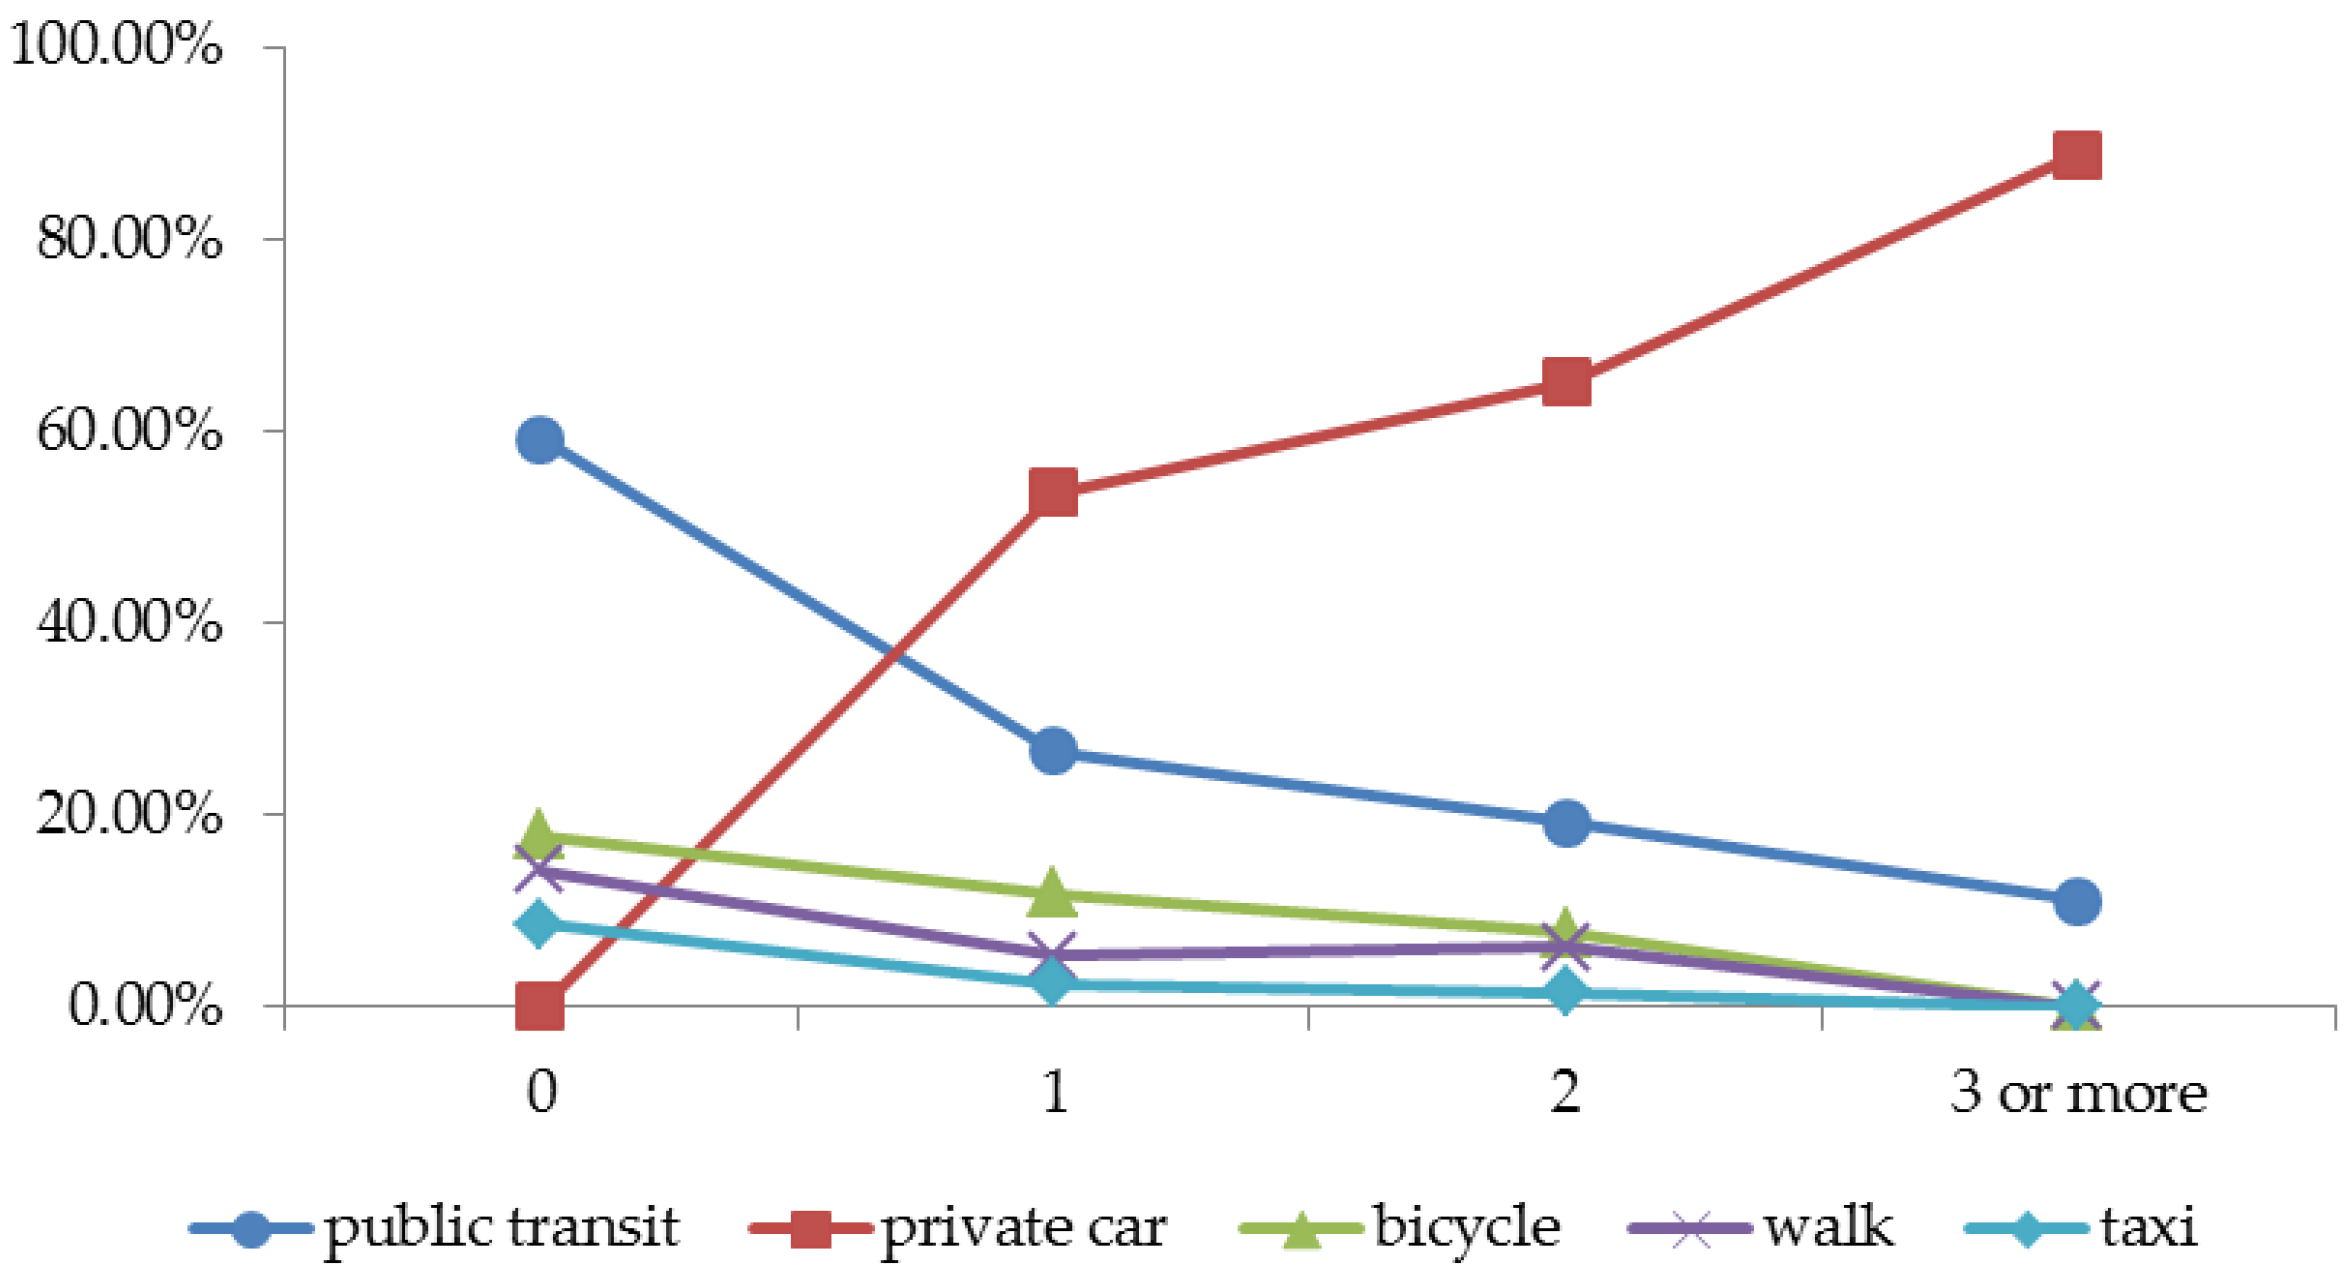
| H11 | Green travel behavior varies depending on the amount of private cars |
| Province/City | Valid Questionnaires | Proportion |
|---|---|---|
| Beijing | 104 | 7.05% |
| Tianjin | 236 | 16.00% |
| Hebei | 96 | 6.51% |
| Shandong | 340 | 23.05% |
| Jiangsu | 314 | 21.29% |
| Shanghai | 89 | 6.03% |
| Zhejiang | 105 | 7.12% |
| Fujian | 69 | 4.68% |
| Guangdong | 65 | 4.41% |
| Hainan | 57 | 3.86% |
| Total | 1475 | 100.00% |
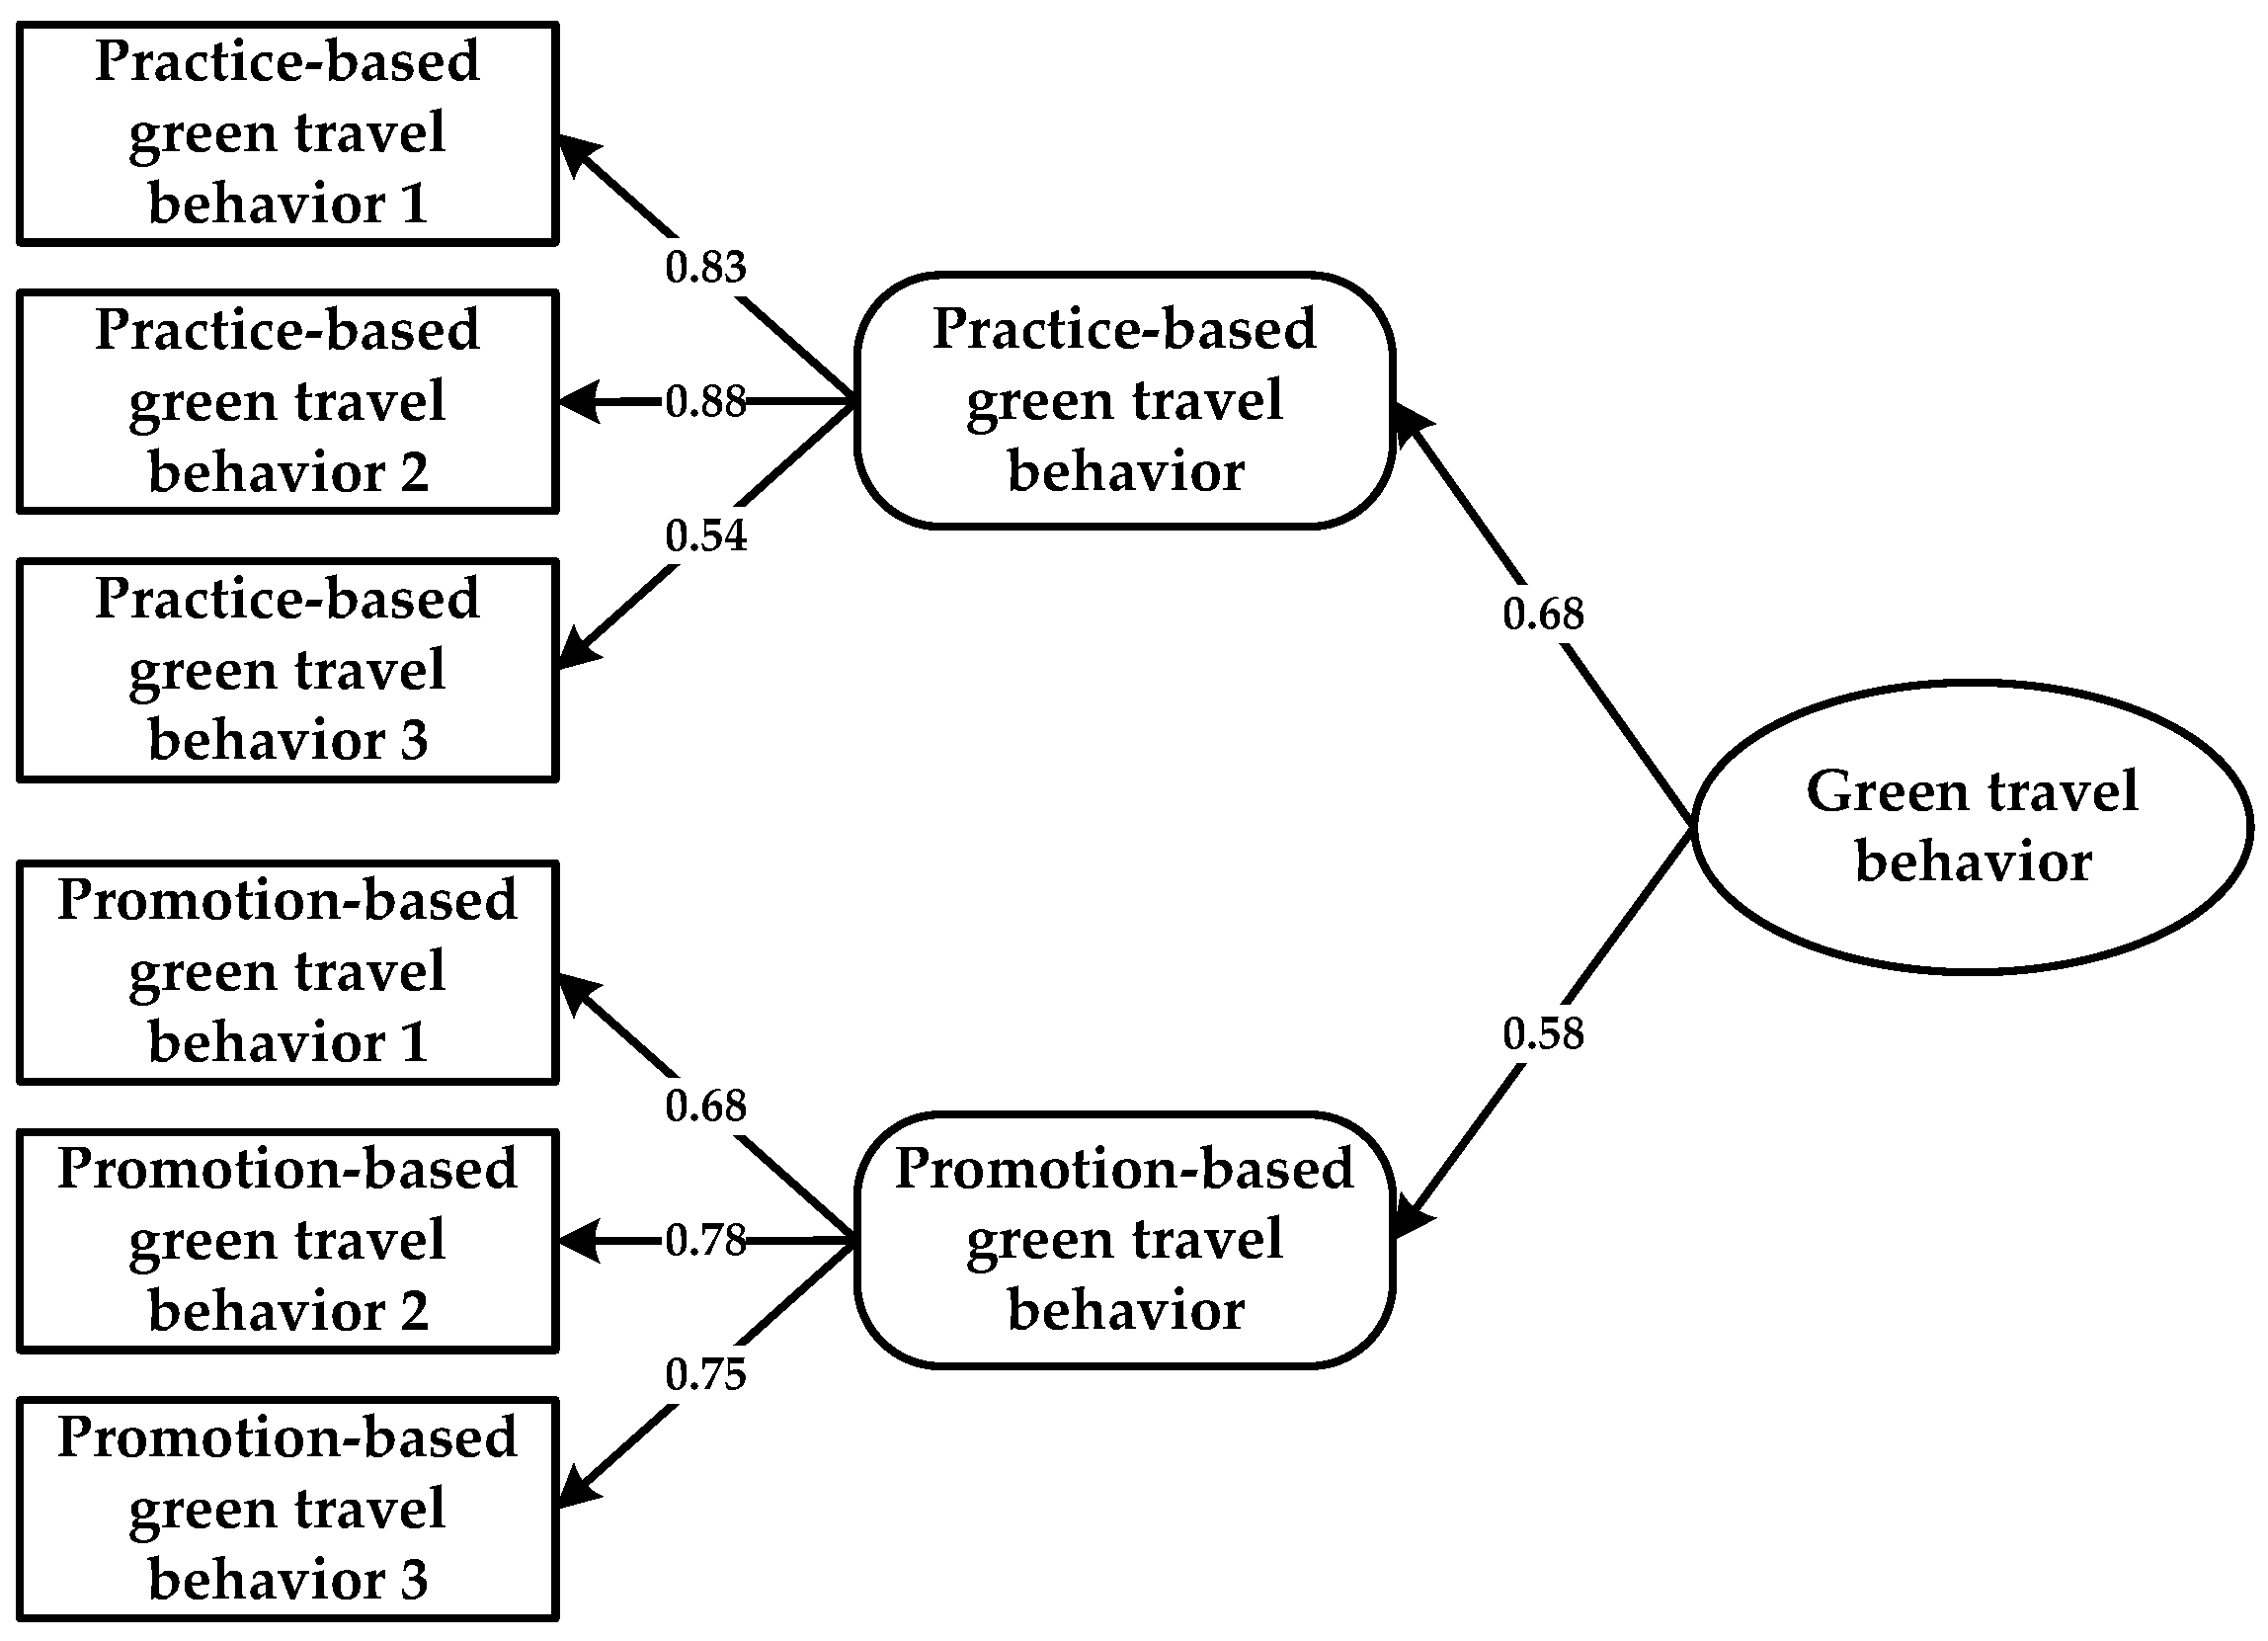
| Variables | Items | Cronbach’s α Coefficient | KMO Value | Bartlett Test | Sig. | |
|---|---|---|---|---|---|---|
| Green travel Behavior | Practice-based green travel behavior | 3 | 0.750 | 0.707 | 2973.060 | 0.000 |
| Promotion-based green travel behavior | 3 | 0.778 | ||||
| Variables and Attributes | Practice-Based Green Travel Behavior | Promotion-Based Green Travel Behavior | |||
|---|---|---|---|---|---|
| Significance | Mean Value | Significance | Mean Value | ||
| Gender | Male (738, 50.0%) | 0.000 | 3.372 | 0.005 | 3.244 |
| Female (737, 50.0%) | 3.637 | 3.389 | |||
| Housing type | Property owned (1100, 74.6%) | 0.000 | 3.387 | 0.003 | 3.272 |
| Property not owned (375, 25.4%) | 3.850 | 3.445 | |||
| Family members over 60-years-old | Yes (575, 39.0%) | 0.000 | 3.390 | 0.067 | 3.258 |
| No (900, 61.0%) | 3.577 | 3.354 | |||
| Family members under 12-years-old | Yes (732, 49.6%) | 0.000 | 3.244 | 0.054 | 3.267 |
| No (743, 50.4%) | 3.389 | 3.365 | |||
| Variables and Attributes | Practice-Based Green Travel Behavior | Promotion-Based Green Travel Behavior | |||
|---|---|---|---|---|---|
| Significance | Mean Value | Significance | Mean Value | ||
| Age | Under 18 years (6, 0.5%) | 0.000 | 4.111 | 0.017 | 3.222 |
| 18–30 years (797, 54.0%) | 3.690 | 3.380 | |||
| 31–45 years (487, 33.0%) | 3.246 | 3.220 | |||
| 46–60 years (160, 10.8%) | 3.281 | 3.242 | |||
| Over 60 years (25, 1.7%) | 3.920 | 3.653 | |||
| Educational background | Junior high school or less (45, 3.1%) | 0.002 | 3.704 | 0.025 | 3.163 |
| Senior high school (158, 10.7%) | 3.291 | 3.095 | |||
| Junior college (270, 18.3%) | 3.410 | 3.312 | |||
| Bachelor (732, 49.6%) | 3.528 | 3.357 | |||
| Above bachelor (270, 18.3%) | 3.627 | 3.367 | |||
| Family monthly income (Yuan) | Less than 4000 (169, 11.5%) | 0.000 | 3.953 | 0.000 | 3.548 |
| 4000–6000 (335, 22.7%) | 3.695 | 3.214 | |||
| 6000–8000 (257, 17.4%) | 3.715 | 3.463 | |||
| 8000–10,000 (293, 19.9%) | 3.373 | 3.358 | |||
| 10,000–30,000 (322, 21.8%) | 3.215 | 3.222 | |||
| 30,000–100,000 (59, 4.0%) | 3.000 | 3.209 | |||
| 100,000 or more (40, 2.7%) | 2.700 | 2.867 | |||
| Amount of private cars | 0 (520, 35.3%) | 0.000 | 3.969 | 0.013 | 3.414 |
| 1 (736, 49.9%) | 3.342 | 3.271 | |||
| 2 (192, 13.0%) | 2.948 | 3.276 | |||
| 3 or more (27, 1.8%) | 2.938 | 2.951 | |||
| Positional status | None (1224, 83.0%) | 0.003 | 3.550 | 0.152 | 3.324 |
| Family-level (171, 11.68%) | 3.349 | 3.207 | |||
| Department-level (34, 2.3%) | 3.098 | 2.971 | |||
| Stall or Bureau level (18, 1.2%) | 3.074 | 3.407 | |||
| Provincial or ministerial-level (28, 1.9%) | 3.560 | 3.429 | |||
| Professional status | None (828, 56.1%) | 0.000 | 3.586 | 0.003 | 3.296 |
| Primary (244, 16.5%) | 3.526 | 3.295 | |||
| Intermediate (282, 19.1%) | 3.457 | 3.482 | |||
| Sub-senior (85, 5.8%) | 3.035 | 3.020 | |||
| Senior (36, 2.4%) | 2.963 | 3.324 | |||
| Positional tiers | None (299, 20.3%) | 0.000 | 3.699 | 0.005 | 3.495 |
| Junior staff (561, 38.0%) | 3.668 | 3.282 | |||
| Front-line manager (284, 19.3%) | 3.524 | 3.324 | |||
| Middle manager (253, 17.2%) | 3.225 | 3.196 | |||
| Senior manager (78, 5.3%) | 2.778 | 3.239 | |||
© 2017 by the authors. Licensee MDPI, Basel, Switzerland. This article is an open access article distributed under the terms and conditions of the Creative Commons Attribution (CC BY) license ( http://creativecommons.org/licenses/by/4.0/).
Share and Cite
Yang, R.; Long, R.; Bai, Y.; Li, L. The Influence of Household Heterogeneity Factors on the Green Travel Behavior of Urban Residents in the East China Region. Sustainability 2017, 9, 237. https://doi.org/10.3390/su9020237
Yang R, Long R, Bai Y, Li L. The Influence of Household Heterogeneity Factors on the Green Travel Behavior of Urban Residents in the East China Region. Sustainability. 2017; 9(2):237. https://doi.org/10.3390/su9020237
Chicago/Turabian StyleYang, Ranran, Ruyin Long, Yu Bai, and Lanlan Li. 2017. "The Influence of Household Heterogeneity Factors on the Green Travel Behavior of Urban Residents in the East China Region" Sustainability 9, no. 2: 237. https://doi.org/10.3390/su9020237