Article

DEA Efficiency of Energy Consumption in China’s Manufacturing Sectors with Environmental Regulation Policy Constraints

1
School of Economics and Management, Nanjing University of Information Science and Technology, Nanjing 210044, China
2
Collaborative Innovation Center on Forecast and Evaluation of Meteorological Disasters, Nanjing University of Information Science and Technology, Nanjing 210044, China
*
Author to whom correspondence should be addressed.
Sustainability 2017, 9(2), 210; https://doi.org/10.3390/su9020210
Submission received: 19 December 2016 / Revised: 16 January 2017 / Accepted: 26 January 2017 / Published: 4 February 2017

Abstract

:
Because overall energy consumption intensity in China’s manufacturing industry is extremely high, the study of energy efficiency in that industry, with an analysis of the policy impacts of energy intensity reduction and other key factors, will no doubt improve energy utilization in the industry and stimulate sustainable development within it. This paper uses 2004–2014 panel data of 28 manufacturing industries and a piecewise linear utility function to construct a data envelopment analysis (DEA) model of energy consumption with environmental regulations constraints. We also examine the DEA evaluation of energy efficiency in manufacturing industries. We integrate environmental regulations as qualitative variables into the energy consumption evaluation model to research the coupling effects on energy consumption intensity of energy consumption structure, opening up, environmental regulations, technological progress, and competition within industries. The research shows that energy efficiency policy intensity is not the major effect on the development of low or moderate energy-consumption industries, whereas low-energy-efficiency policy is very favorable for the development of high energy-consumption industries.

1. Introduction

Manufacturing is the pillar industry of China. The added value of China’s manufacturing industry in 2010 surpassed that of the United States to rank first in the world. The total energy consumption of that industry has had sustained growth, from 1.15 billion tons of standard coal in 2004 to 2.45 billion tons in 2014. Energy consumption of the Chinese manufacturing industry usually accounts for a large percentage of the total Chinese energy consumption; this percentage rose from 56.7% in 2004 to 57.4% in 2014.
China’s manufacturing industry is currently facing many serious challenges, such as strong energy demands, energy shortages, low energy efficiency, and substantial energy consumption. The overall level of China’s energy consumption intensity is high, almost 1.9 times the world average, 4.1 times that of Japan, and 2.5 times that of the United States [1]. Studying energy efficiency and analyzing key factors for energy consumption intensity reduction will lower the consumption level of China’s manufacturing industry, thereby promoting its economic development. Research shows that the main effects on energy consumption efficiency are energy consumption structure, opening up, competition within industries, technological progress, environmental regulation, and energy efficiency policy intensity.
Because energy consumption intensity strongly affects industrial development, analyzing its influence factors helps to propose relevant energy policies, improve industrial competitiveness, and ultimately promote industrial growth. Many academic studies have shown that technological progress, opening up, and enterprise scale are the major factors for reducing energy consumption intensity [2,3,4,5].
Some researchers have stated that multiple factors may co-drive China’s energy efficiency. Specifically, reducing energy consumption intensity requires a combination of energy consumption structure, environmental regulations (energy-saving policies), and competition within industries [6,7,8].
Environmental decontamination is characterized by external diseconomies, so the government needs to formulate policies and measures to regulate manufacturers’ economic activities, thereby maintaining coordinated development of the environment and economy. Environmental regulations and government actions have various impacts on energy efficiency in distinct sectors. An increasing number of scholars have argued that environmental regulations and government actions are important for energy efficiency [9]. However, previous research has only regarded energy-saving policy as a reference variable, and this was not involved in calculation models. In fact, energy-saving policies have a substantive impact on output as energy consumption intensity. This paper takes energy efficiency policy intensity as a qualitative variable in energy evaluation models and examines the coupled impact of five quantitative variables on that intensity, such as energy-saving policy, energy consumption structure, opening up, environmental regulations, technological progress, and competition within industries. Environmental regulations and government actions affecting energy efficiency can be categorized into three areas:
  • Environmental regulations and government actions can improve energy efficiency in industry. Impacts on economic growth of environmental regulations and energy restriction mechanisms in the energy economy are both explored. Research shows that environmental regulations are beneficial to improving energy efficiency, so the energy development path has been put forward [10,11].
  • Environmental regulations and government actions show various impacts on energy efficiency due to different industries. Empirical research on the implementation of energy-saving and emission reduction shows that the complementary and synergy of different policies should be made full use of between various industries [12,13].
  • Environmental regulations and government actions can reduce energy efficiency of industries. According to requirements of China’s fiscal decentralization and performance evaluation, studies have shown that government intervention substantially weakens the promotion of environmental regulations, which is a concern [14,15].
There is strong divergence among scholars’ conclusions regarding the reasons for China’s energy consumption intensity decline. However, nearly all agree that this decline overall has been caused by a diminishment of manufacturing. Some scholars have elaborated on the relationship between which input and output variables are selected. For example, increasing input will lead to changes in output or the correlation between variables, and so on [16,17]. However, this paper focused on the comparative analysis with energy efficiency policy or not on the energy efficiency. As the influence of other variables on energy efficiency was also indispensable, all inputs were as a whole not separate to study its effects. According to current economic development in the country, six fundamental factors were selected in the present work as input indicators. Energy consumption intensity of manufacturing is an output indicator. In addition, data envelopment analysis (DEA) was used to assess energy efficiency of the manufacturing industry in China. Energy efficiency policy intensity is regarded as a qualitative indicator because it cannot be accurately measured. Thus, sub-paragraph utility functions are introduced in the paper to quantitatively measure the willingness to implement distinct energy efficiency policy intensities of various industries. Specifically, energy policies are divided into three scenarios: strong, moderate, and weak. In this paper, the DEA method was used to study the impact of energy efficiency policy variables on energy efficiency.
Following is the structure of the paper: Section 2 gives the methods, mainly introducing an original CCR model, data sources, variables description, and national policies. Section 3 is the results of constructing a left-leaning, right-deviation, intermediate segmented utility function, simulating energy efficiency policy intentions under various industrial policy situations. Empirical analysis of Chinese manufacturing is elaborated. Section 4 gives discussions and conclusions.

2. Methods

2.1. Original CCR Model

DEA, introduced by Charnes, Cooper, and Rhodes [18] is usually applied to assess relative efficiency for DMUs with multiple inputs and single or multiple output(s). DEA is a non-parametric method in operations research and economics for the estimation (empirical heuristics standing for impractical or unattainable analytical optimization). It is used to empirically measure productive efficiency of decision-making units. Non-parametric approaches have the benefit of not assuming a particular functional form or shape for the frontier, but do not provide a general relationship (equation) relating output and input. In the DEA methodology, efficiency is defined as a ratio of the weighted sum of outputs to a weighted sum of inputs, where the weights structure is calculated by means of mathematical programming [19,20,21,22,23]. The efficiency score Z 0 can be obtained by the following CCR model:
M o d e l ( 1 ) :   Z 0 = max k = 1 s μ k Y i 0 k t s . t . { j = 1 m v j X i 0 j t = 1 ( 1 - 1 ) k = 1 s μ k Y i k t j = 1 m v j X i j t 1 , i = 1 , 2 , , n ( 1 - 2 ) μ 0 , v 0 ( 1 - 3 )
Model (1) is constructed to evaluate the efficiency of the DMU i 0 , i N = 1 , 2 , , n for the t th year. Where k is the output, k = 1 , 2 , , s , j is the input, j = 1 , 2 , , m ; and X i j t is the quantity of the j th input for the i th DMU, Y i k t is the quantity of the k th output for the i th DMU; Obviously, v j represents the input weights and μ k the output weights, respectively. The more output gained by a fixed input of DMU i 0 , the greater the value of the objective function Z 0 will be. DMU i 0 is considered to be efficient if and only if Z 0 equals 1; otherwise, it is referred to as non-efficient. The relative validity of DMU i 0 compared with the residual DMUs is analyzed through optimal solution to a linear programming Model (1).
The behavior of DMUs, such as enacting policies or regulations, usually has certain consequences, characterized by utility functions [24]. Based on the Model (1), the DMU preferences are considered input indicators (qualitative variables) in DEA models. Assuming that the range of values for DMU behavioral variables is represented by the interval [0, 1], the larger the values, the greater the willingness of behavior-driven DMUs. One or more of the DMU interval values correspond to a particular utility value. In other words, the DMU preference is reflected in the following two aspects.
(1)
Within the interval [0, 1], values for behavioral variables of DMUs denote some preference characteristic (represented by a certain utility function);
(2)
DMUs expect greater preference utility, characterizing stronger impact of behavior results.
The DEA Model (2) with DMU behavioral variables constraints is constructed as follows:
M o d e l ( 2 ) :   Z = max k = 1 s μ k Y i 0 k t + λ s . t . { j = 1 m v j X i 0 j t = 1 ( 2 - 1 ) k = 1 s μ k Y i k t j = 1 m v j X i j t 1 , i N ( 2 - 2 ) λ U ( X i j t ) , i N , j = 1 , 2 , , l ( 2 - 3 ) X i j t [ X i j l t , X i j u t ] , i N , j = 1 , 2 , , l ( 2 - 4 ) μ 0 , v 0 ( 2 - 5 )
In Model (2), t represents multipliers related to a particular year, n is the number of DMUs, output indicators expressed as Y i k t (which are all quantitative values), and input indicators expressed as X i j t (which are hybrid variables, including both quantitative indicators and DMU behavioral (qualitative) indicators). Assuming that the l input indicators above are qualitative variables and residual M l indicators are quantitative ones, the qualitative indicators are typically bounded by interval [0, 1]. The preference interval of qualitative indicators for each DMU i ( i N ) can be expressed as X i j t = [ X i j l t , X i j u t ] , where X i j l t and X i j u t are the lower and the upper bounds of DMU preferences, respectively. U ( X i j t ) is a measure of preference utility function with qualitative variables, and the utility interval varies from 0 to 1 (the detailed utility function is shown in Section 3).
The above model mainly solves the following two problems:
  • Decision variables in constraints, including qualitative variables.
  • Utility function in constraints represents DMU preferences within a certain interval and the objective function λ represents the DMU utility. The larger the utility value, the greater the willingness of behavior-driven DMU.

2.2. Data Sources

Energy consumption intensity represents the ratio of total energy consumption of a certain industry to its corresponding economic value over a given period, which is the energy consumption per unit gross domestic product (GDP) for the industries. This can reflect energy utilization efficiency in production and also be an important indicator of energy economy and a basis for measuring the quality of economic growth. China’s largest energy-consumption industry is manufacturing, so studying the energy consumption of manufacturing is important to overall improvement of energy efficiency in the country. Indicators that influence the energy consumption intensity of manufacturing include energy consumption structure, opening up, environmental regulations, technological progress and others. These data come from the China Statistical Yearbook (2005–2015), China Energy Statistical Yearbook (2005–2015), China Statistical Yearbook of Science and Technology (2005–2015), China Environmental Yearbook (2005–2015), and China Industrial Statistical Yearbook (2005–2015). Data of discarded resources and waste material recovery is largely lacking, so these two industries are ignored.
It is well known that the data coverage of China Environmental Yearbooks is different with other statistical yearbooks. Thus, we need to adjust the data coverage difference. Otherwise, data values is underestimated. In order to improve the reliability of Chinese Statistics, it will be important to ensure the independence of statistical bureaus from other agencies and political influence [25].

2.3. Description of Indicator Variables

Table 1 shows a simple description of the quantitative data.
Energy consumption intensity. Under the constraints of environmental regulations, energy consumption intensity is the amount of energy consumed by a certain industry in terms of GDP. Statistical data of manufacturing GDP could not be accessed, so we used energy consumption per unit GDP for the industries instead. Based on the ratio of energy consumption of each sector to all manufacturing (except exhaust gas metal resources and equipment repair industry), all sectors were divided into three types, high, moderate, and low energy-consumption industries (see Table A1 for industry classification).
Energy consumption structure. China’s oil and natural gas resources are relatively inadequate, whereas coal resources are rich. This has been behind the coal-based energy structure in the country. Hence, we took the ratio of industry coal consumption to total energy consumption as the energy consumption structure. This structure is positively correlated with energy consumption intensity, i.e., the greater the proportion of coal consumption, the higher the energy consumption intensity.
Opening up. We used the ratio of industrial export value to prime operating revenue of each industry to measure industrial openness. A larger ratio indicates greater export delivery value per unit GDP within the sectors, greater degree of opening up is higher, and lower energy consumption intensity.
Technological progress. This progress is the result of innovation. Research and development (R and D) is able to produce a new invention, foster continuous improvement, and enhance the product process. Because it is difficult to find elements actually measuring “technological progress”, we used R and D internal expenditure instead. Greater R and D internal expenditure means more technological progress and lower energy consumption intensity.
Competition within industries. The more intense is the competition within the industries, the more urgent the need to promote technological innovation; competition often produces more research and development incentives than monopolies [26]. Generally, if the number of firms within the industries increases, competition within them is enhanced. Therefore, we regard the number of enterprises within the industries to represent this competition.
Environmental regulations. (1) The first includes quantifiable indicators. Increasing the environmental regulation intensity may improve the efficiency of energy utilization. The “Potter hypothesis” [27] proposed that environmental regulation will lead companies to reduce pollutant emissions, improve the utilization rate of waste, thereby reducing energy consumption. So, the indicator of comprehensive utilization of industrial solid waste is used to measure environmental regulations; the higher the value of this indicator, the stronger the environmental regulations and the lower the energy consumption intensity, herein we use the comprehensive utilization rate of industrial solid waste as a quantitative method. To avoid the effects of the differences in data coverage for energy consumption data, economic data, and pollution data, method can be learned from the practice [28]; (2) The second category embraces qualitative indicators such as Energy efficiency policy intensity. The influences of various energy efficiency policy intensities for industrial energy efficiency are not identical. We express this effect by constructing a utility function as follows: We assume that (1) high-energy-consumption industries conform to the left-leaning policy utility function, i.e., low-intensity policy promotes development of the industries; (2) moderate-energy-consumption industries tend toward the intermediate policy utility, i.e., moderate-intensity policy can promote the development level of industries; (3) low-energy-consumption industries are in line with the right-deviation policy utility function, i.e., high-intensity policy enhances development of the industries (see Section 3 for a detailed explanation).

2.4. China’s Policies on Energy Conservation and Emission Reduction

Since 1998, the state has enacted and implemented new environmental and energy policies, laws, and regulations closely related to energy-saving emission reduction (Table 2). Analysis shows that the country has continued to increase policy intensity. Policy characteristics vary by industry. For very energy-intensive and heavy-polluting industries (mainly heavy industries), the country has mainly implemented very strict regulations and suppression policies. For low-energy-consumption and light-polluting industries (mainly high-tech and clean or environmental protection ones), the government has mainly pursued policies of encouragement. For moderate-energy-consumption industries (mainly livelihood manufacturing sectors and certain heavy industries), policies with both encouragement and suppression have been advanced. Based on the relationship between the intensity of various energy efficiency policies and interests of the industries, the next section constructs the left-leaning, right-deviation, and intermediate utility functions.

3. Results

3.1. Utility Functions with Qualitative Indicators

The energy efficiency policy intensity is represented by an indefinite dummy variable as [ X i j l t , X i j u t ] [ 0 , 1 ] . The larger the value, the stronger that intensity. Any value in X i j t [ X i j l t , X i j u t ] corresponds to a utility value U ( X i j t ) . Suppose U ( X i j t ) is a continuous linear piecewise function of a single variable X i j t satisfying U ( X i j t ) [ 0 , 1 ] , where X i j t is characterized as the utility value of energy efficiency policy in a particular industry. U ( X i j t ) can be understood as the industrial development of policy intensity as X i j t , embodied in the degree of willingness to implement policy in the industries.

3.1.1. Utility Function Based on Piecewise Linear Left-Leaning—High Energy-Consumption Enterprises

The basic assumption of the left-leaning utility function is that the willingness of the manufacturing industry to implement energy-efficiency policy is greater in the weak policy stage and less in the strong policy stage, and that the marginal utility of fulfilling the policy intention is declining. For high energy-consumption industries (such as chemical industries, petroleum processing, coking, and nuclear fuel processing), even if the government increases the energy efficiency policy intensity and gives a certain amount of compensation, the capital demand of industries conducting technological innovation to achieve the goal of energy-saving is greater. Therefore, the industry implementation of high-intensity energy efficiency policy decreases. As the energy-efficiency policy intensity increases, marginal revenue of the industry development may decline, as does the marginal utility of the industries to fulfill the high-intensity energy efficiency policy. Accordingly, the left-leaning utility function is constructed as follows (Figure 1).
The left-leaning piecewise linear utility function is constructed as:
M o d e l ( 3 ) : U ( o i ) = { 1 i f O i < b i 1 1 ( 3 - 1 ) b i 8 1 O i b i 8 1 b i 1 1 , i f b i 1 1 O i < b i 3 1 ( 3 - 2 ) b i 7 1 O i b i 7 1 b i 2 1 , i f b i 3 1 O i < b i 5 1 ( 3 - 3 ) b i 6 1 O i b i 6 1 b i 4 1 , i f b i 5 1 O i < b i 6 1 ( 3 - 4 ) 0 i f O i b i 6 1 ( 3 - 5 )
Here, U ( O i ) is the willingness to execute energy efficiency policy in the industries, O i is their willingness to implement energy-efficiency policies, and b i j 1 , i N , j = 1 , 2 , , 8 represent energy efficiency policy intensities of the government. The larger the value of b i j 1 , the stronger the energy efficiency policy intensity proposed by the government. In the initial stage of [ b i 1 1 , b i 3 1 ] , that intensity is low, and the willingness to implement the energy efficiency policy in industries is greater. In the moderate range of [ b i 3 1 , b i 5 1 ] , the energy efficiency policy intensity of the government continues to increase, the industry willingness toward implementation declines, and the marginal utility value of interval [ b i 1 1 , b i 3 1 ] is less than that of interval [ b i 3 1 , b i 5 1 ] . In the later stage of [ b i 5 1 , b i 6 1 ] , the energy efficiency policy intensity of government maximizes, and the industry willingness to implement wanes rapidly. At that time, the marginal effect maximizes, and is greater than the marginal utility value of [ b i 3 1 , b i 5 1 ] .

3.1.2. Utility Function Based on Piecewise Linear Right-Deviation—Low Energy-Consumption Enterprises

The basic assumption of the right-deviation utility function is that the willingness of the manufacturing industry to implement energy efficiency policy is less in the weak policy stage, greater in the strong policy stage, and that the marginal utility of fulfilling the policy intention decreases. For low energy-consumption industries (such as environmental protection and energy-saving enterprises), government increases the energy efficiency policy intensity, energy-saving enterprises receive policy support to guide the marketization of energy industries. This promotes the rapid development of those enterprises, and their willingness to implement high-intensity energy policy grows. However, the impact of the national high-intensity energy efficiency policy on energy-saving industries is relatively small, and is not the main factor restricting the development of those industries; therefore, the marginal utility of the industries to fulfill that policy declines. Based on this, we constructed the right-deviation utility function as follows (Figure 2).
The right-deviation piecewise linear utility function is constructed as:
M o d e l ( 4 ) : U ( o i ) = { 0 i f O i < b i 3 2 ( 4 - 1 ) O i b i 3 2 b i 5 2 b i 3 2 , i f b i 3 2 O i < b i 4 2 ( 4 - 2 ) O i b i 2 2 b i 7 2 b i 2 2 , i f b i 4 2 O i < b i 6 2 ( 4 - 3 ) O i b i 8 2 b i 8 2 b i 1 2 , i f b i 6 2 O i < b i 8 2 ( 4 - 4 ) 1 i f O i b i 8 2 ( 4 - 5 )
Here, U ( O i ) is the willingness to perform energy efficiency policy in the industries, O i is the willingness to perform energy efficiency policy of the industries, and b i j 2 , i N , j = 1 , 2 , , 8 represent the energy efficiency policy intensity of the government. The larger the value b i j 2 , the stronger the energy efficiency policy intensity of the government. In the initial stage of [ b i 3 2 , b i 4 2 ] , government energy efficiency policy intensity is low, and the willingness to implement the energy efficiency policy of industries is less. In the moderate range of [ b i 4 2 , b i 6 2 ] , the aforementioned intensity continues to increase, and the industry willingness of to implement is improved. Then, the marginal utility value of interval [ b i 3 2 , b i 4 2 ] is greater than that of interval [ b i 4 2 , b i 6 2 ] . In the later stage of [ b i 6 2 , b i 8 2 ] , government energy efficiency policy intensity maximizes, and the willingness of the industries to implement energy efficiency policy improves rapidly. At this time, the marginal effect weakens and is less than the marginal utility value of [ b i 4 2 , b i 6 2 ] .

3.1.3. Utility Function Based on Piecewise Linear Intermediate—Moderate Energy-Consumption Enterprises

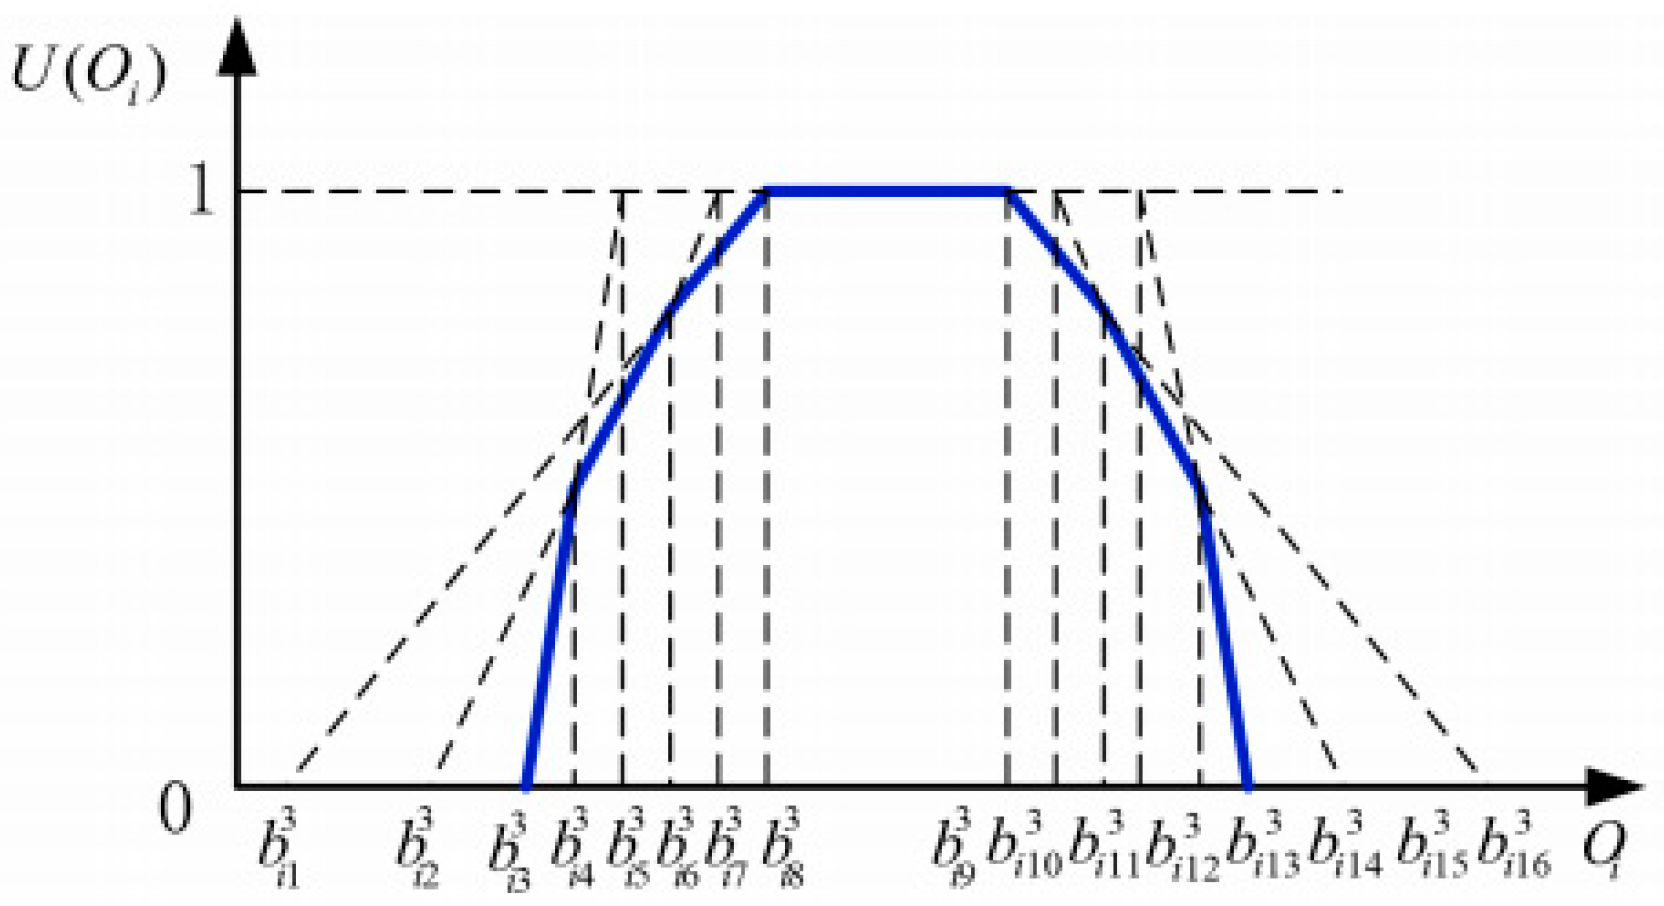
The following is according to the basic hypothesis of intermediate utility function. In the weak efficiency-energy policy stage, the willingness of manufacturing industry to fulfill the energy-efficiency policy intensity is an increasing function, similar to the left-leaning utility function. In the middle stage of the policy, that willingness reaches a maximum and stabilizes. In the strong efficiency-energy policy stage, the willingness of the manufacturing sectors declines, similar to the right-deviation utility function. For moderate energy-consumption industries (such as wood processing, paper, and paper products), the willingness may be seen as a combination utility function of left-leaning and right-deviation. Accordingly, the intermediate utility function is constructed as follows (Figure 3).
The intermediate piecewise linear utility function is constructed as:
M o d e l ( 5 ) : U ( o i ) = { 0 i f O i < b i 3 3 ( 5 - 1 ) O i b i 3 3 b i 5 3 b i 3 3 , i f b i 3 3 O i < b i 4 3 ( 5 - 2 ) O i b i 2 3 b i 7 3 b i 2 3 , i f b i 4 3 O i < b i 6 3 ( 5 - 3 ) O i b i 1 2 b i 8 3 b i 1 3 , i f b i 6 3 O i < b i 8 3 ( 5 - 4 ) 1 i f b i 8 3 O i < b i 9 3 ( 5 - 5 ) b i 8 3 O i b i 8 3 b i 1 3 , i f b i 9 3 O i < b i 11 3 ( 5 - 6 ) b i 8 3 O i b i 8 3 b i 1 3 , i f b i 11 3 O i < b i 13 3 ( 5 - 7 ) b i 8 3 O i b i 8 3 b i 1 3 , i f b i 13 3 O i < b i 14 3 ( 5 - 8 ) 0 i f O i b i 14 3 ( 5 - 9 )
Here, U ( O i ) is the willingness to perform energy efficiency policy intensity for the industries, O i is the willingness to perform energy efficiency policy intensity of the industries. b i j 3 , i N , j = 1 , 2 , , 16 represent the energy efficiency policy intensity of government. The greater the value of b i j 3 , the stronger the government energy efficiency policy intensity. In the initial stage of [ b i 3 3 , b i 8 3 ] , that intensity is low, and industry willingness to fulfill energy efficiency policy will be the left-leaning utility. In the medium range of [ b i 8 3 , b i 9 3 ] , the intensity continues to increase, and industry willingness to implement the policy remains unchanged. In the later stage of [ b i 9 3 , b i 16 3 ] , the government energy efficiency policy intensity continues to increase, and the industry willingness to implement is the right-deviation utility.

3.2. Energy Efficiency Assessment of China’s Manufacturing Sectors

In this section, the 28 Chinese manufacturing sectors are regarded as different DMUs. We took energy consumption intensity as the output indicator, and competition within the industries, technological progress, energy consumption structure, opening up, environmental regulations, and energy efficiency policy intensity of the 28 DMUs each year (2004–2014) as input indicators. Considering that the environmental regulation indicators include qualitative and quantitative variables, we separately constructed energy efficiency evaluation models of the manufacturing sectors, using only quantitative indicators of environmental regulations and coupling qualitative and quantitative indicators of environmental regulations. The results of numerical comparison show that energy efficiency policy intensity had little impact on the development of low or moderate energy-consumption industries, and the low-intensity energy-efficiency policy encourages the development of high energy-consumption industries.
The DEA evaluation model of energy efficiency in manufacturing sectors with only quantitative indicators is constructed as:
M o d e l ( 6 ) :   Z 0 = max μ 1 Y i 0 1 t s . t . { j = 1 5 v j X i 0 j t = 1 , ( 6 - 1 ) μ 1 Y i 1 t j = 1 5 v j X i j t 1 , i = 1 , 2 , , 28 ( 6 - 2 )
Model (6) is the energy-efficiency evaluation of manufacturing sectors d i 0 for year t ( t = 2004 , 2005 , , 2014 ) . In the constraint, X i j ( i { 1 , 2 , , 28 } , j { 1 , 2 , , 5 } ) is the amount of input for industries i for the indicators j and Y i 1 of energy consumption intensity for sector i . v j is weight of the input indicator and μ 1 is weight of the energy consumption intensity. Equation (6-1) is the constraint on the industrial input indicator, and Equation (6-2) is that on the input-output ratio of energy efficiency in the manufacturing sectors.
The DEA energy efficiency assessment model of manufacturing sectors with energy-efficiency policy intensity (qualitative variables) is constructed as:
M o d e l ( 7 ) :   Z 0 = max ( μ 1 Y i 0 1 t + λ ) s . t . { j = 1 5 v j X i 0 j t = 1 ( 7 - 1 ) μ 1 Y i 1 t j = 1 5 v j X i j t 1 , i = 1 , 2 , , 28 ( 7 - 2 ) λ U ( X i 6 t 2 / 3 ) ; i = 1 , 2 , , 9 ( 7 - 3 ) λ U ( X i 6 t + 0.1 0.9 + 0.1 ) ; i = 1 , 2 , , 9 ( 7 - 4 ) λ U ( X i 6 t + 1 / 2 1 + 1 / 2 ) ; i = 1 , 2 , , 9 ( 7 - 5 ) λ U ( X i 6 t 0.1 1.3 / 3 0.1 ) ; i = 10 , 11 , , 19 ( 7 - 6 ) λ U ( X i 6 t 2 / 25 12 / 25 2 / 25 ) ; i = 10 , 11 , , 19 ( 7 - 7 ) λ U ( X i 6 t 0.5 ) ; i = 10 , 11 , , 19 ( 7 - 8 ) λ U ( 1.1 X i 6 t 0.5 ) ; i = 10 , 11 , , 19 ( 7 - 9 ) λ U ( 5.1 / 5 X i 6 t 5.1 / 5 3.1 / 5 ) ; i = 10 , 11 , , 19 ( 7 - 10 ) λ U ( 1 X i 6 t 1 2 / 3 ) ; i = 10 , 11 , , 19 ( 7 - 11 ) λ U ( 1 X i 6 t 1 2 / 3 ) ; i = 20 , 21 , , 28 ( 7 - 12 ) λ U ( 2.7 X i 6 t 2.7 0.2 ) ; i = 20 , 21 , , 28 ( 7 - 13 ) λ U ( 1.02 X i 6 t 1.02 0.62 ) ; i = 20 , 21 , , 28 ( 7 - 14 ) X i 6 t [ X i 6 l t , X i 6 u t ] ; i = 1 , 2 , , 28 ( 7 - 15 )
Model (7) is the energy efficiency evaluation of manufacturing sectors d i 0 and the willingness of energy efficiency policy intensity in year t ( t = 2004 , 2005 , , 2014 ) . In the constraint, X i j ( i { 1 , 2 , , 28 } , j { 1 , 2 , , 5 } ) is the amount of DMU i for the input indicators j and Y i 1 , the output value of energy consumption intensity for sector i . v j is the weight of input indicator j and μ 1 is that of energy consumption intensity. Equation (7-1) is a certain input constraint on industries, and Equation (7-2) is the input-output ratio constraint on energy efficiency of manufacturing. Equation (7-3) through (7-11) represent the utility constraint of energy efficiency policy intensity, and Equation (7-3) through (7-5) the effective constraints on that intensity. Equation (7-12) through (7-14) represent the utility constraint of energy efficiency policy intensity, and Equation (7-15) the qualitative variables of that intensity, which is represented by interval [0, 1] (Figure 4).
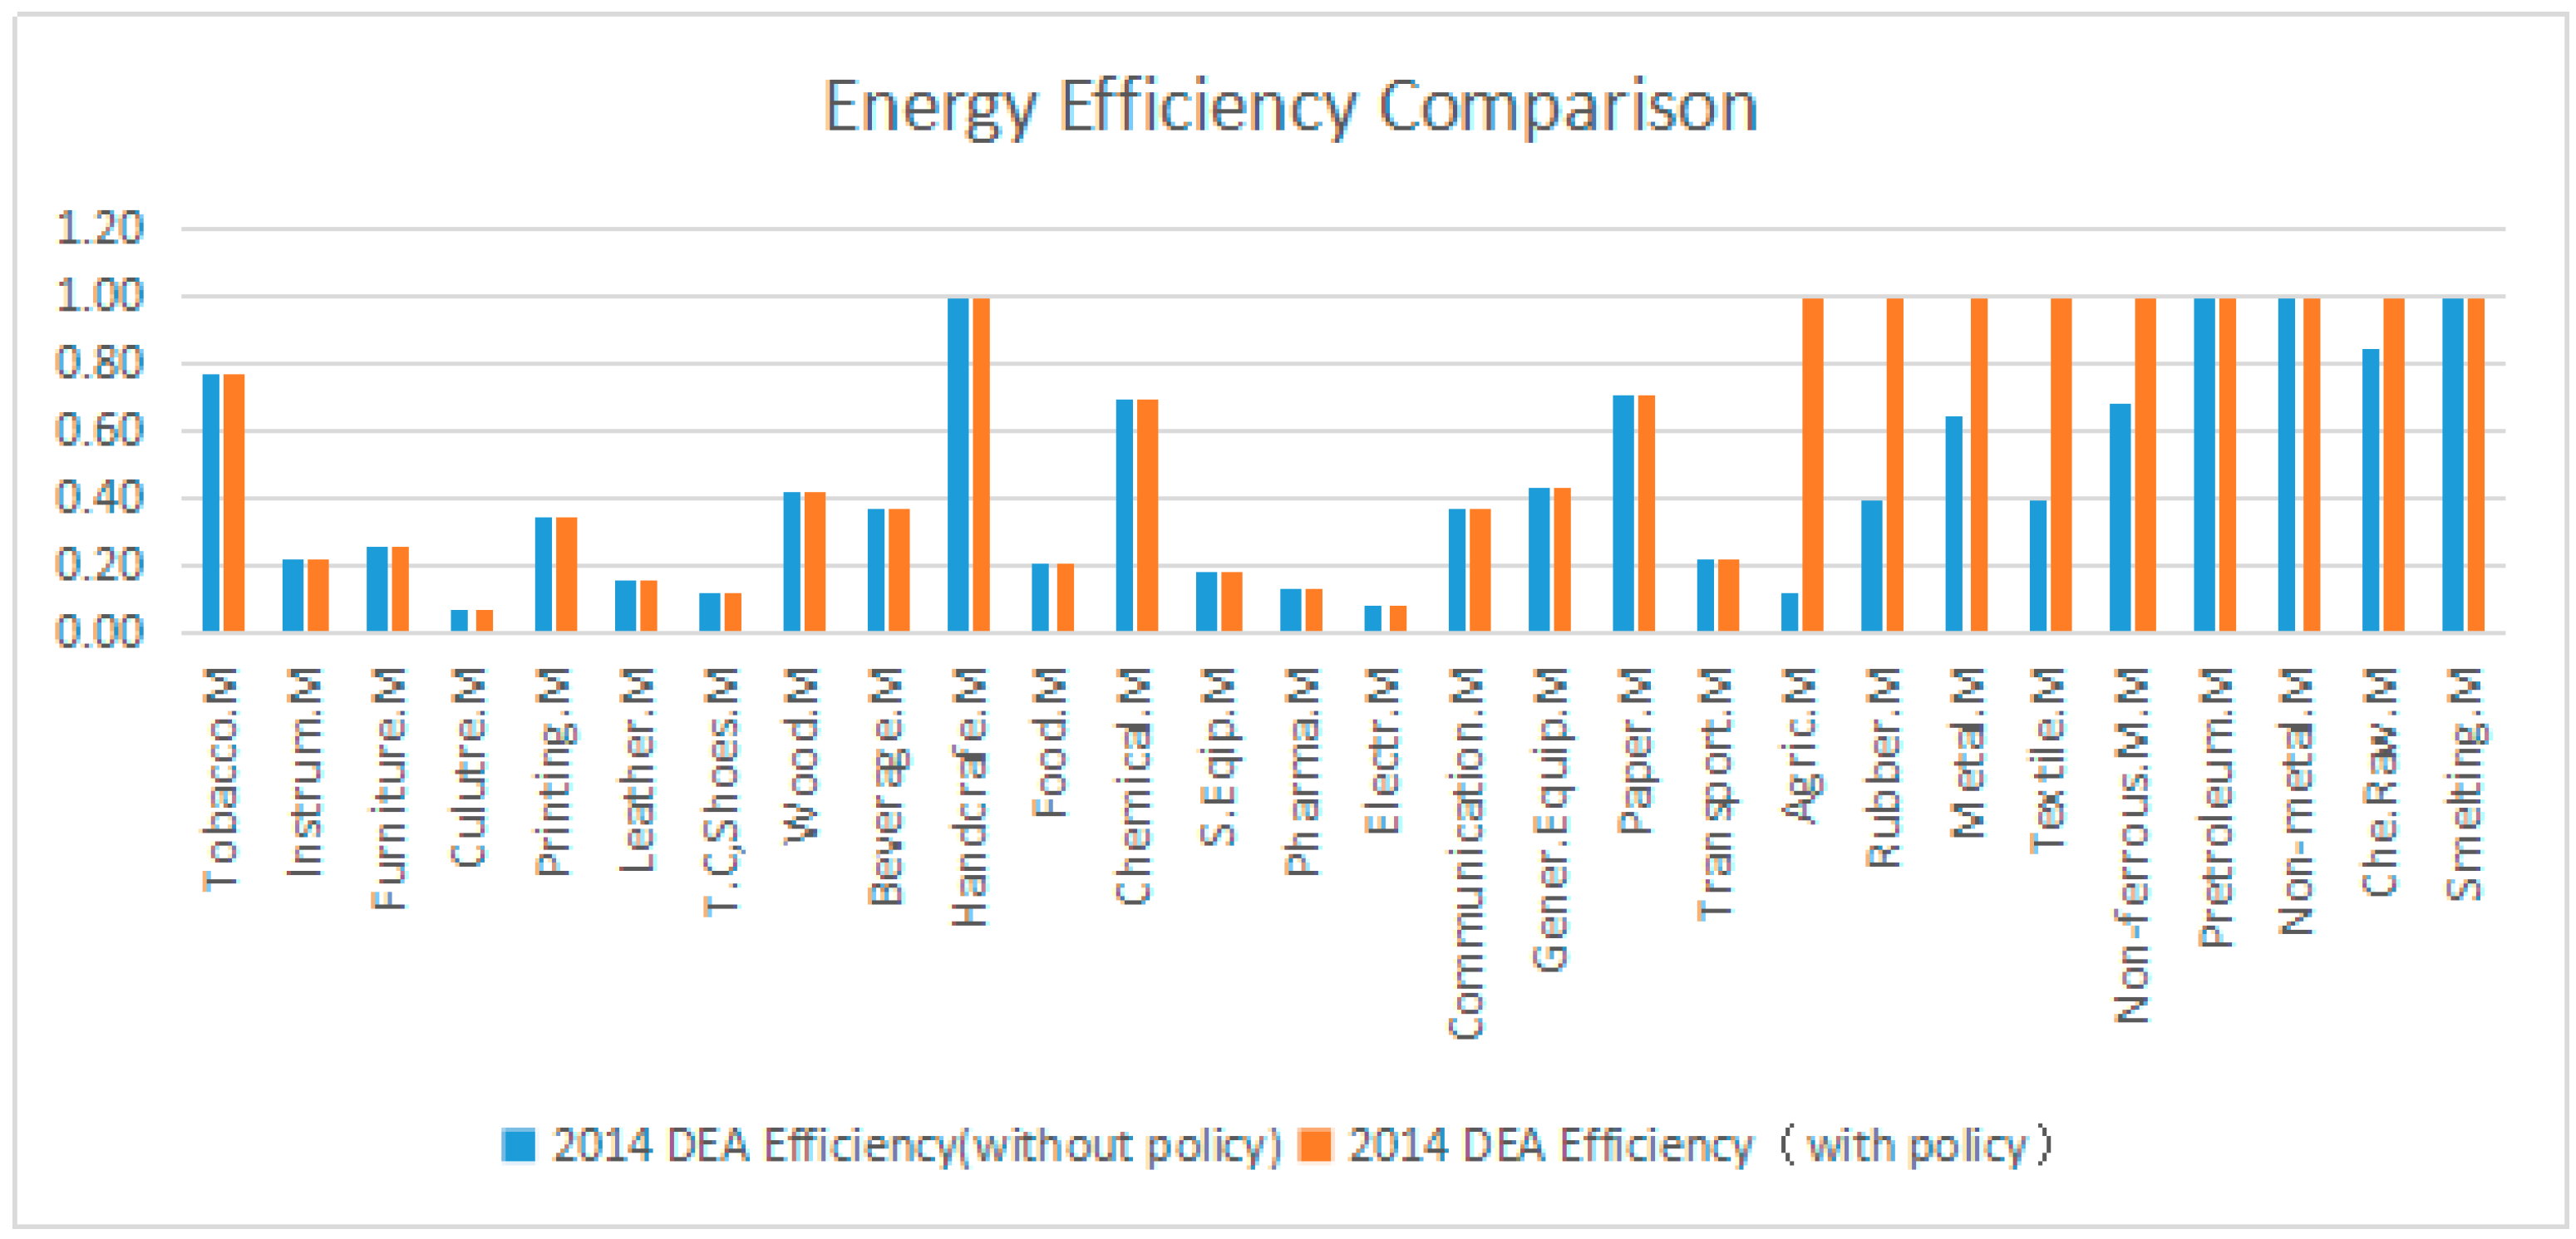
In Models (6) and (7), the energy efficiency comparison value of each industry can be obtained by taking different t values. In the contexts with and without energy efficiency policy intensity constraints, Figure 5 shows a comparative estimation of DEA energy efficiency for all sectors in 2014 (Table A2); other years are similar.
The next section is based on standpoint of time and the industries, per the two aforementioned contexts, and compares values of DEA energy efficiency evaluation.

3.2.1. DEA Energy Efficiency Evaluation Comparisons of Different Industries in the Same Year

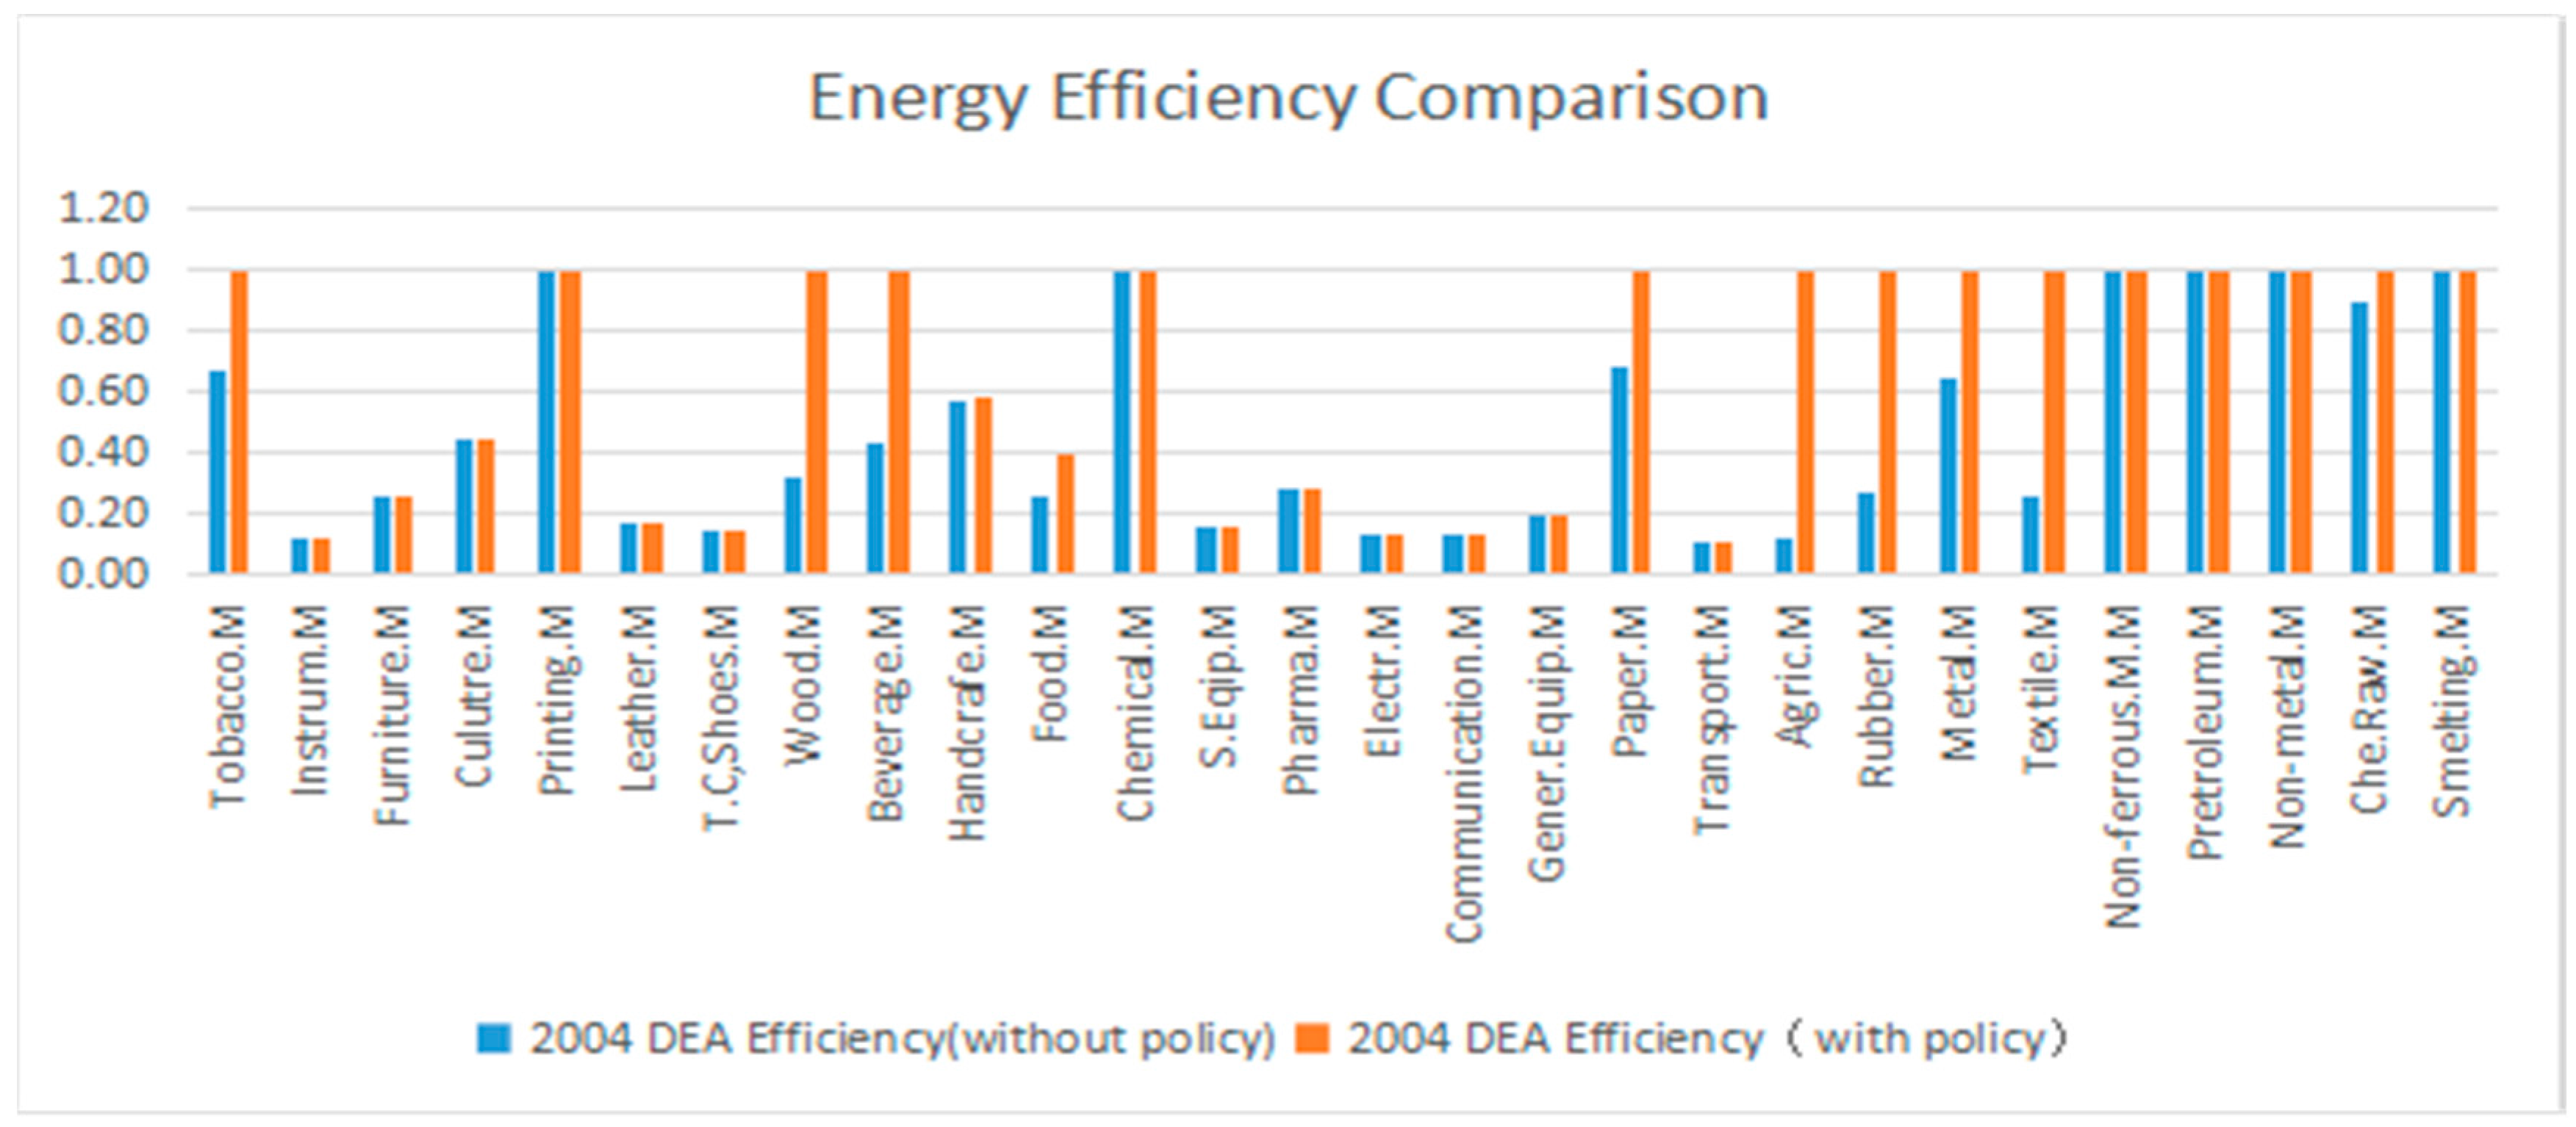
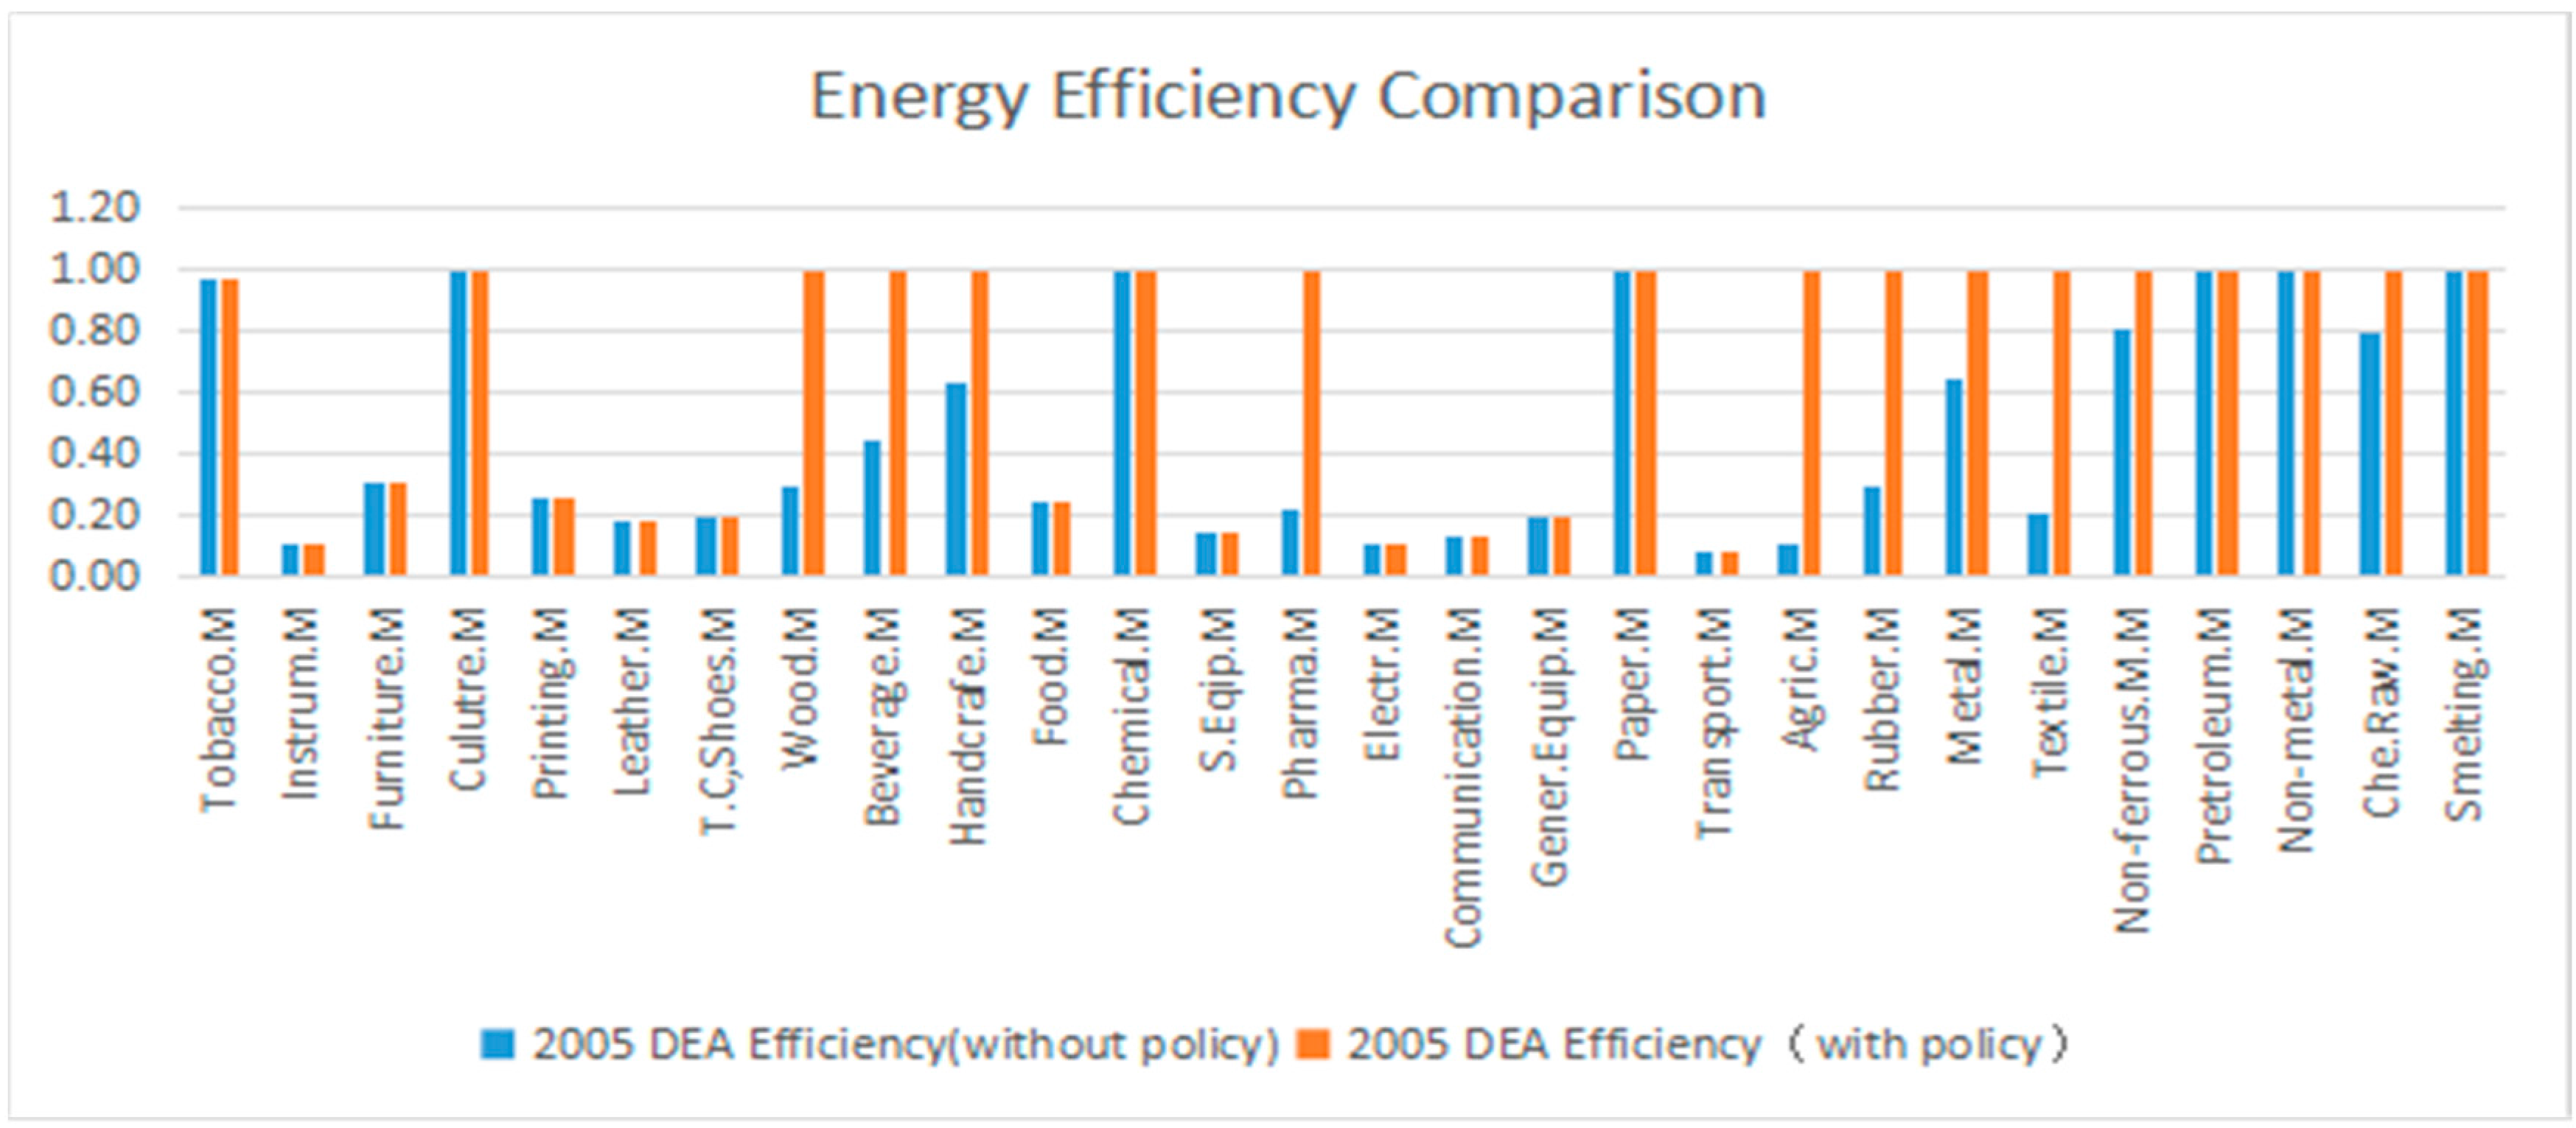
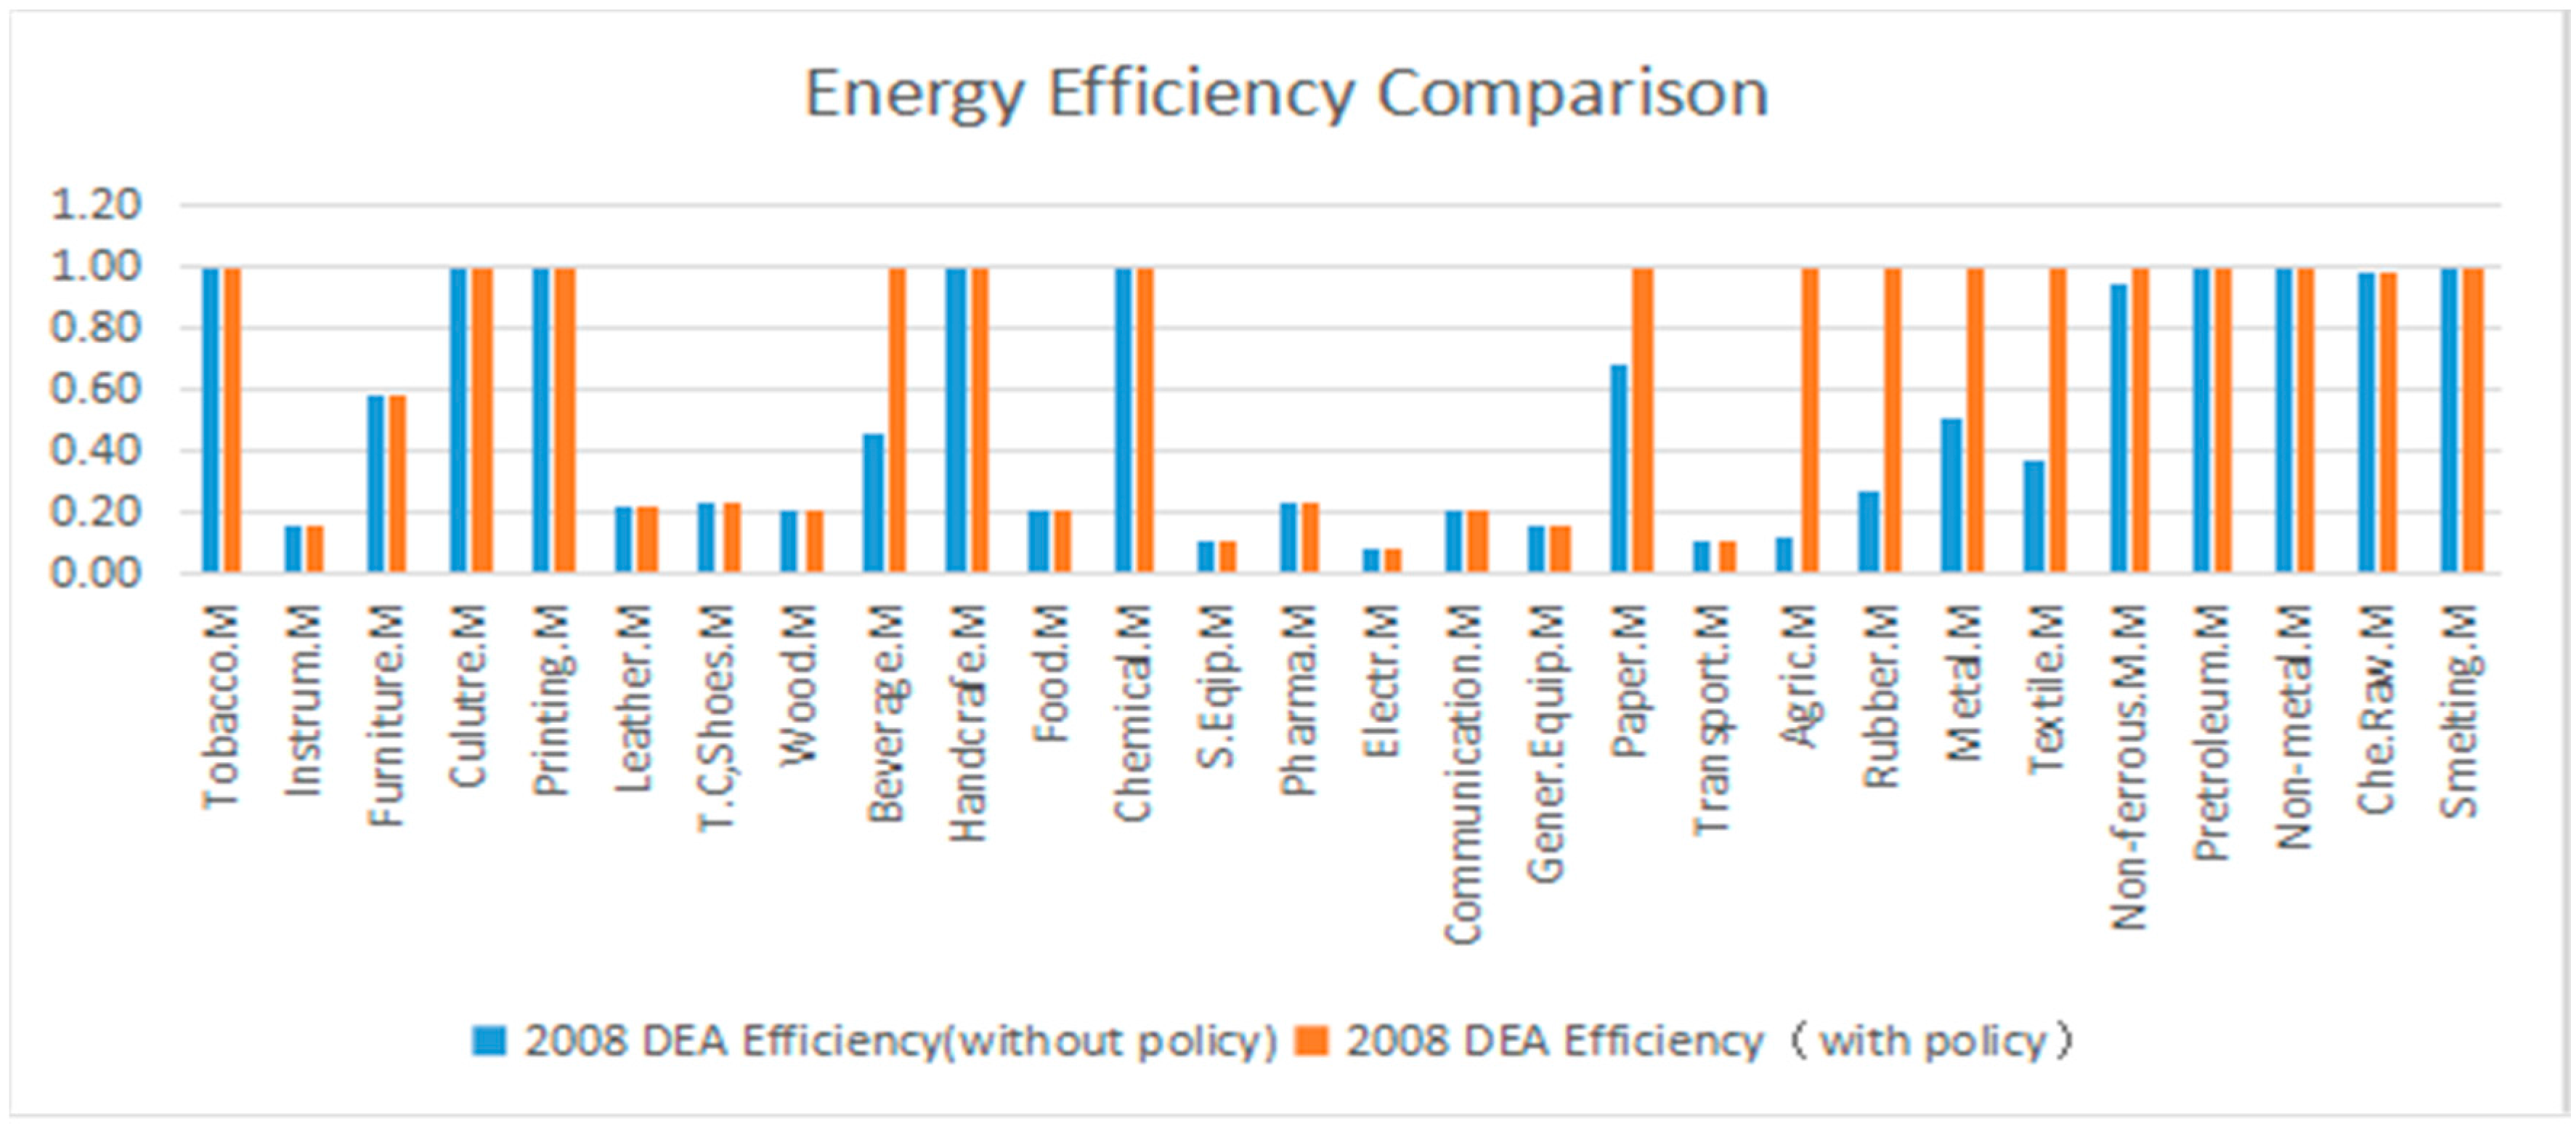
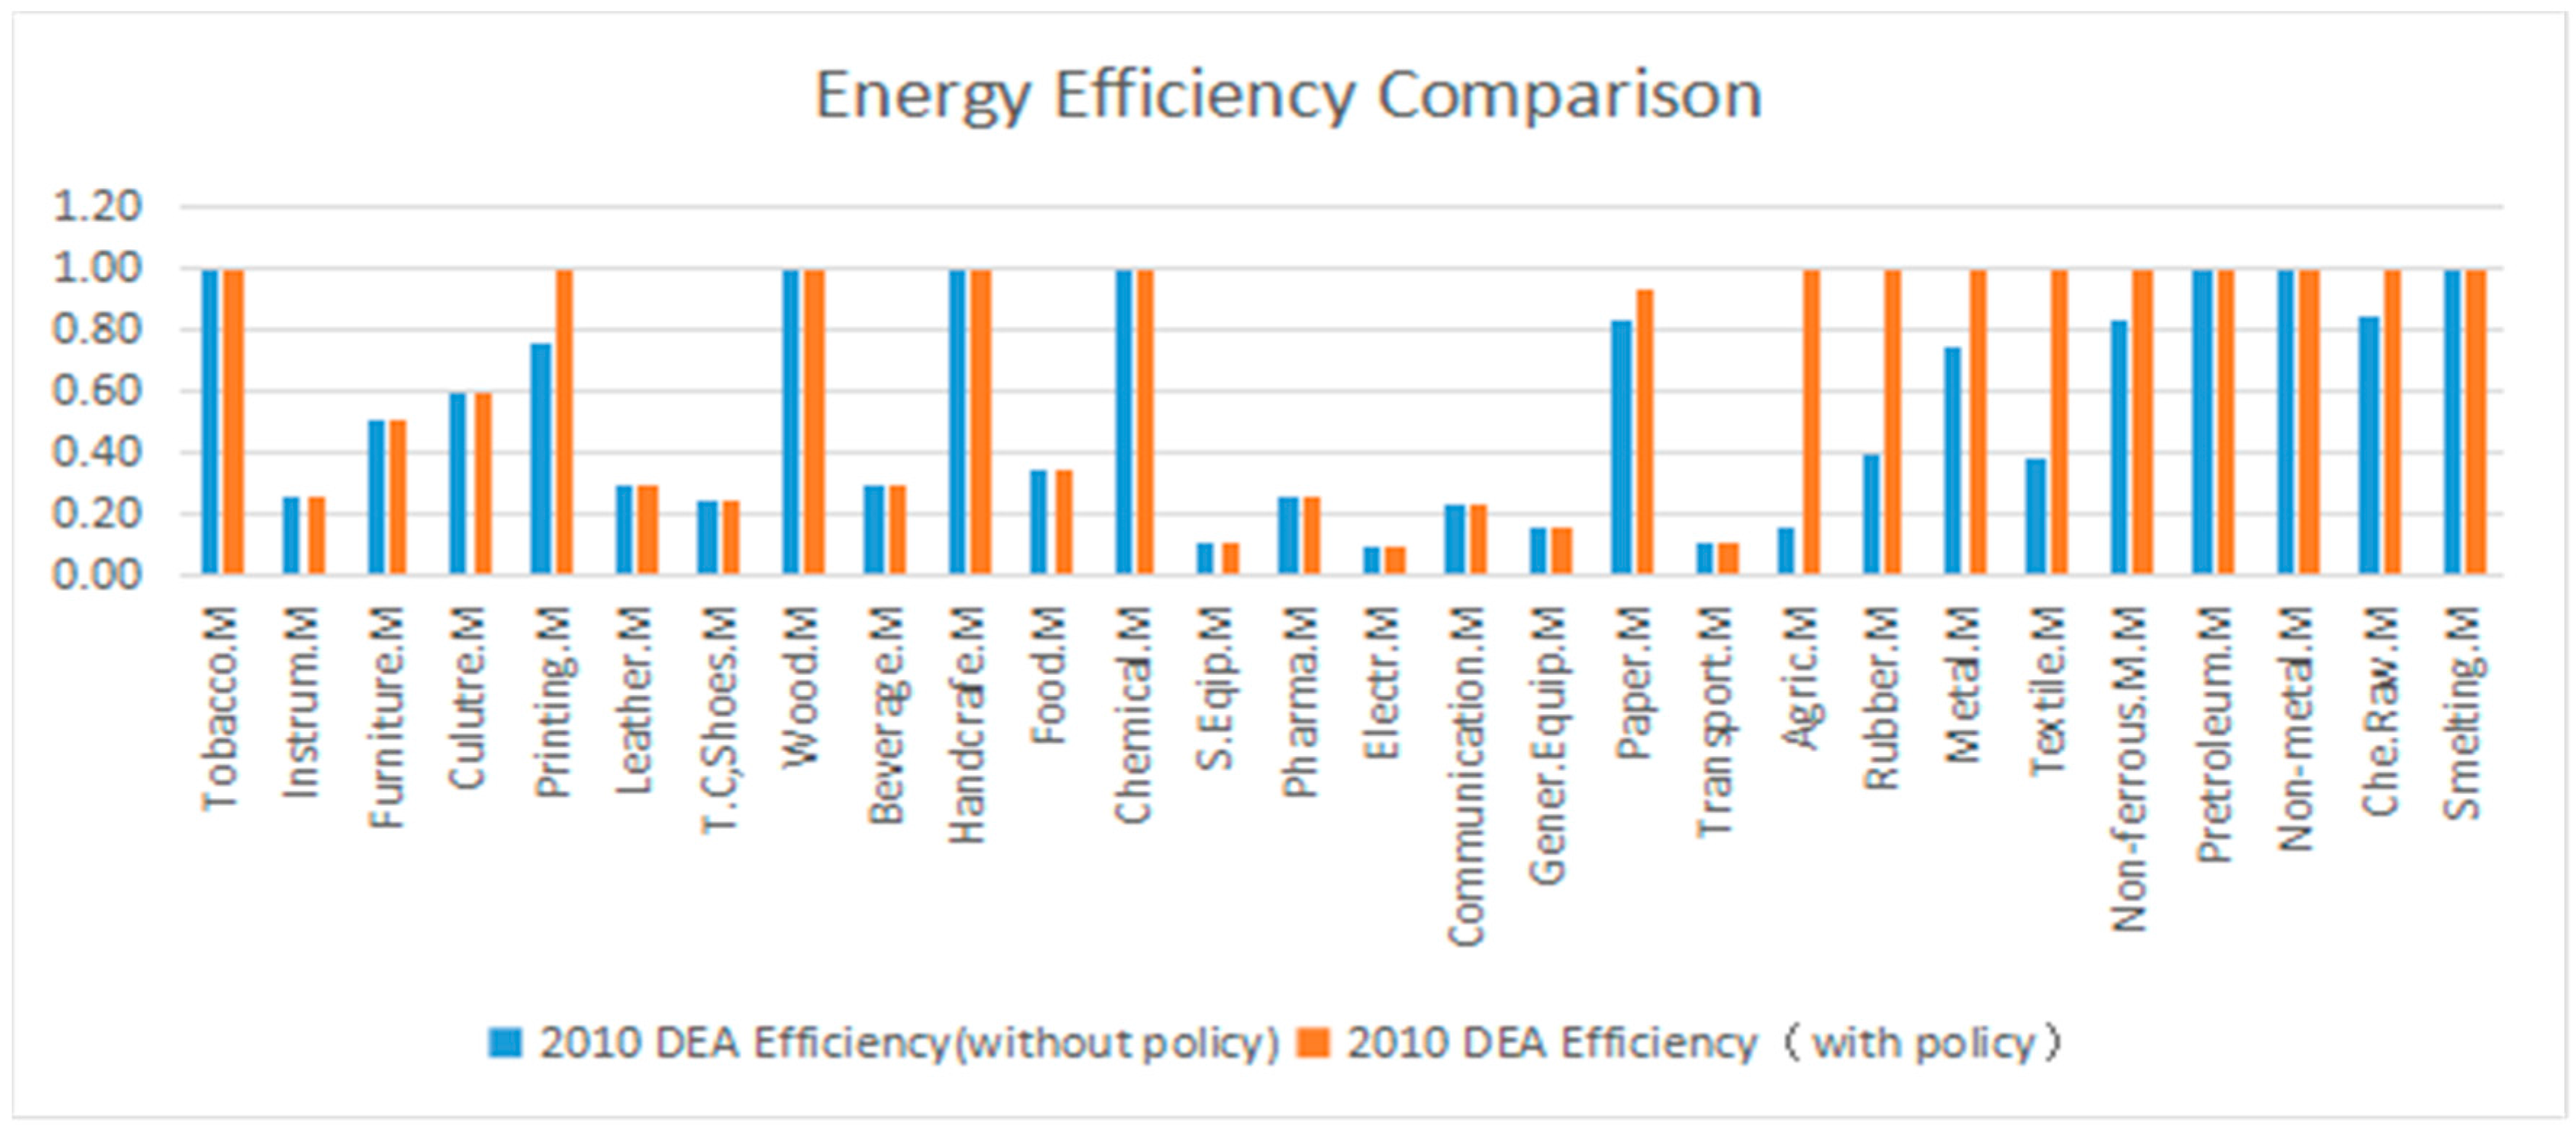
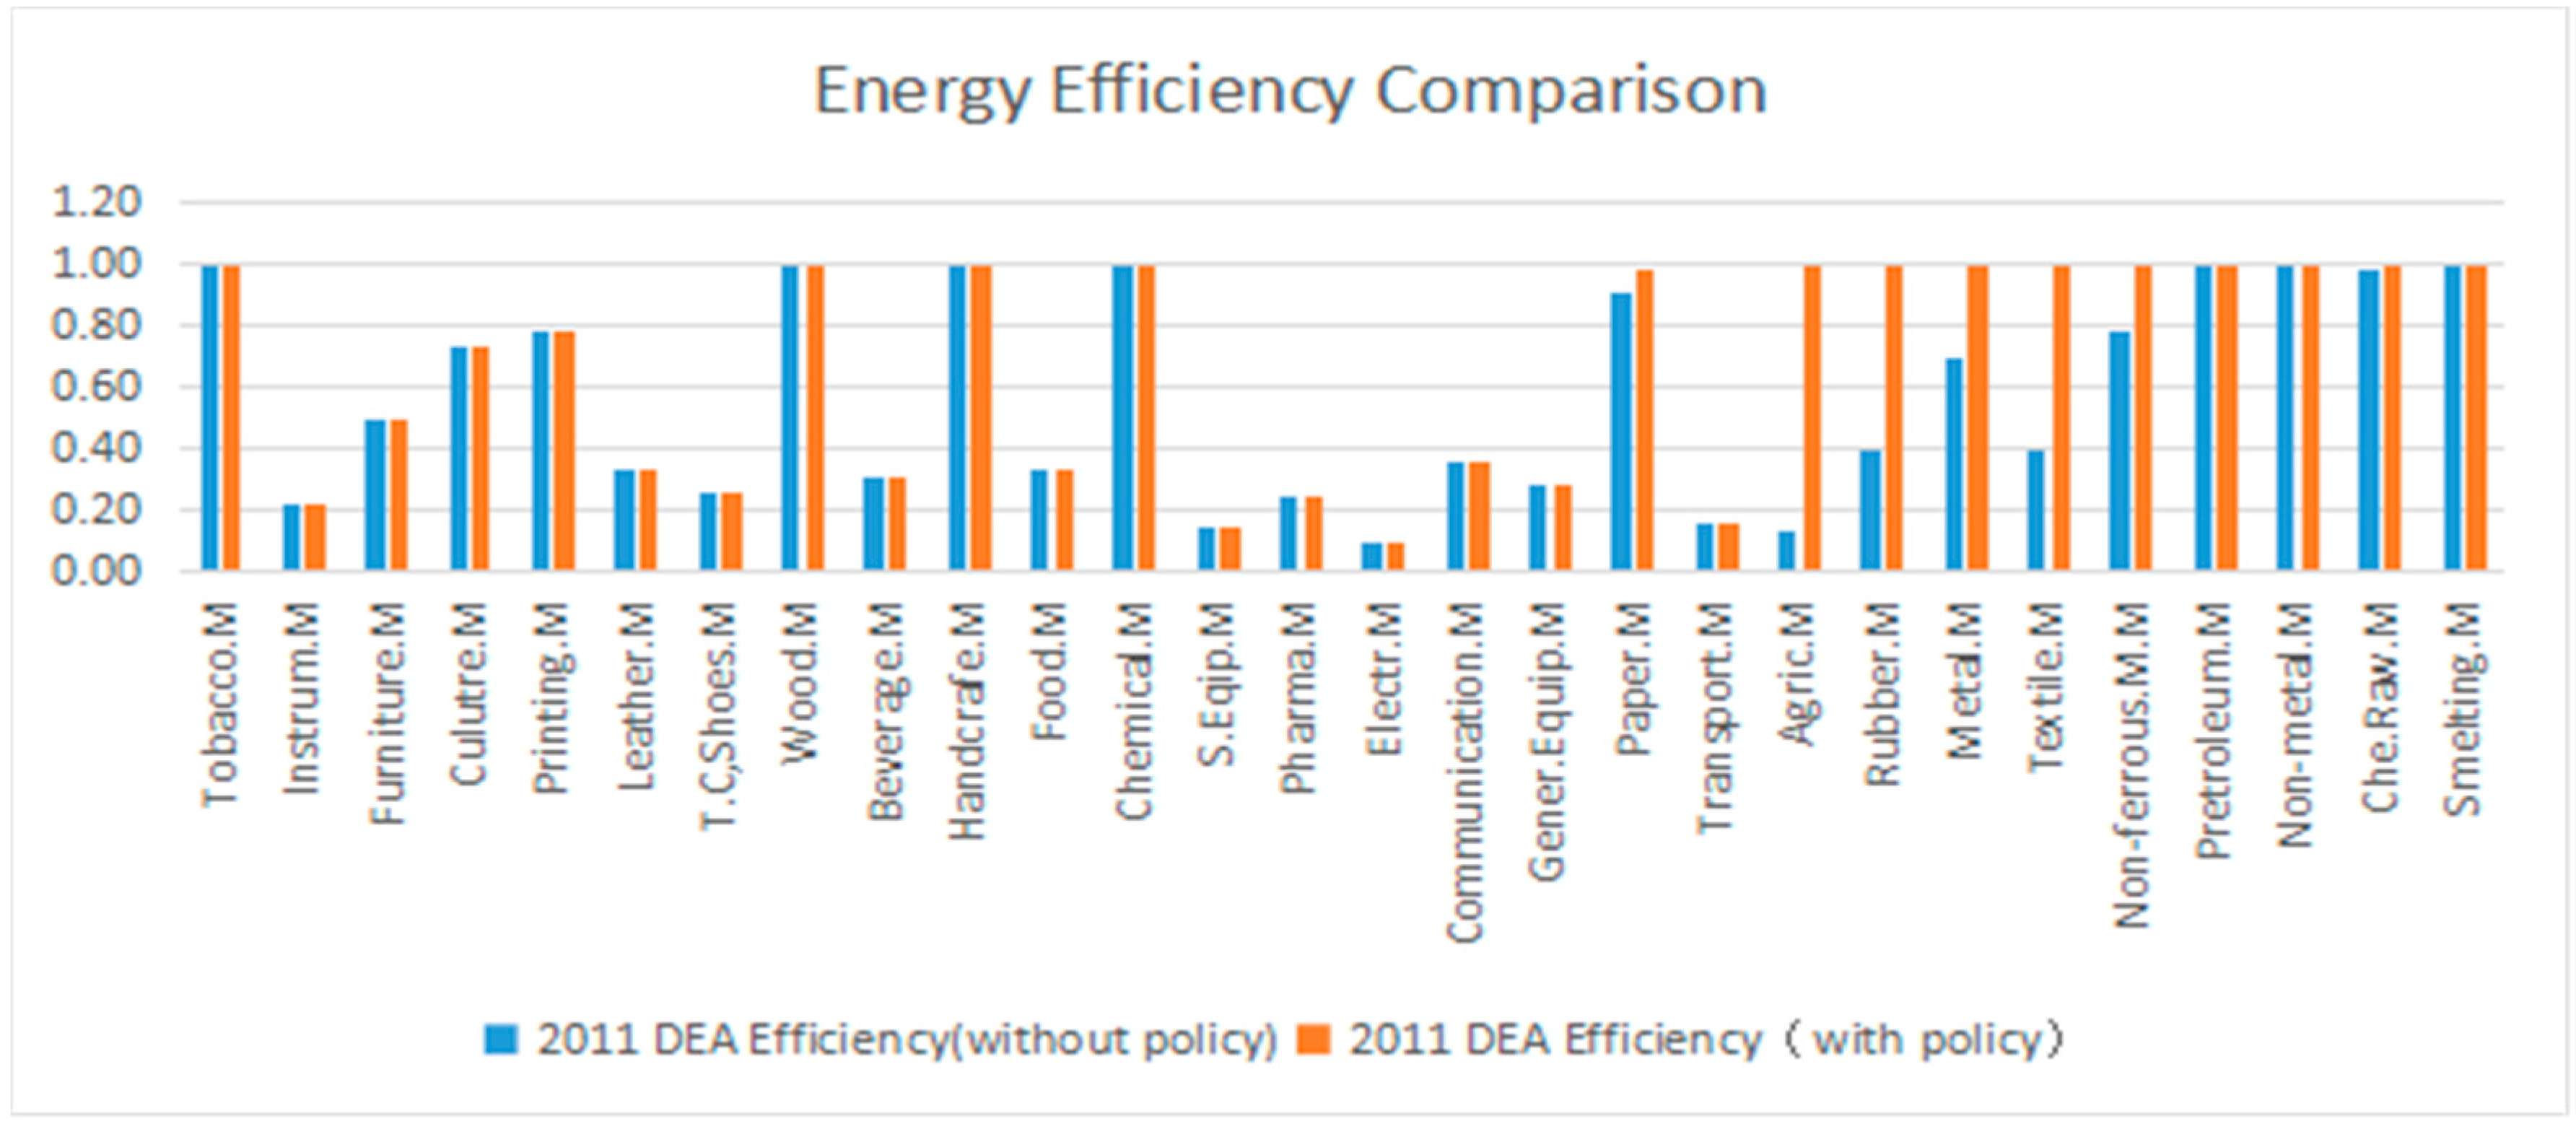
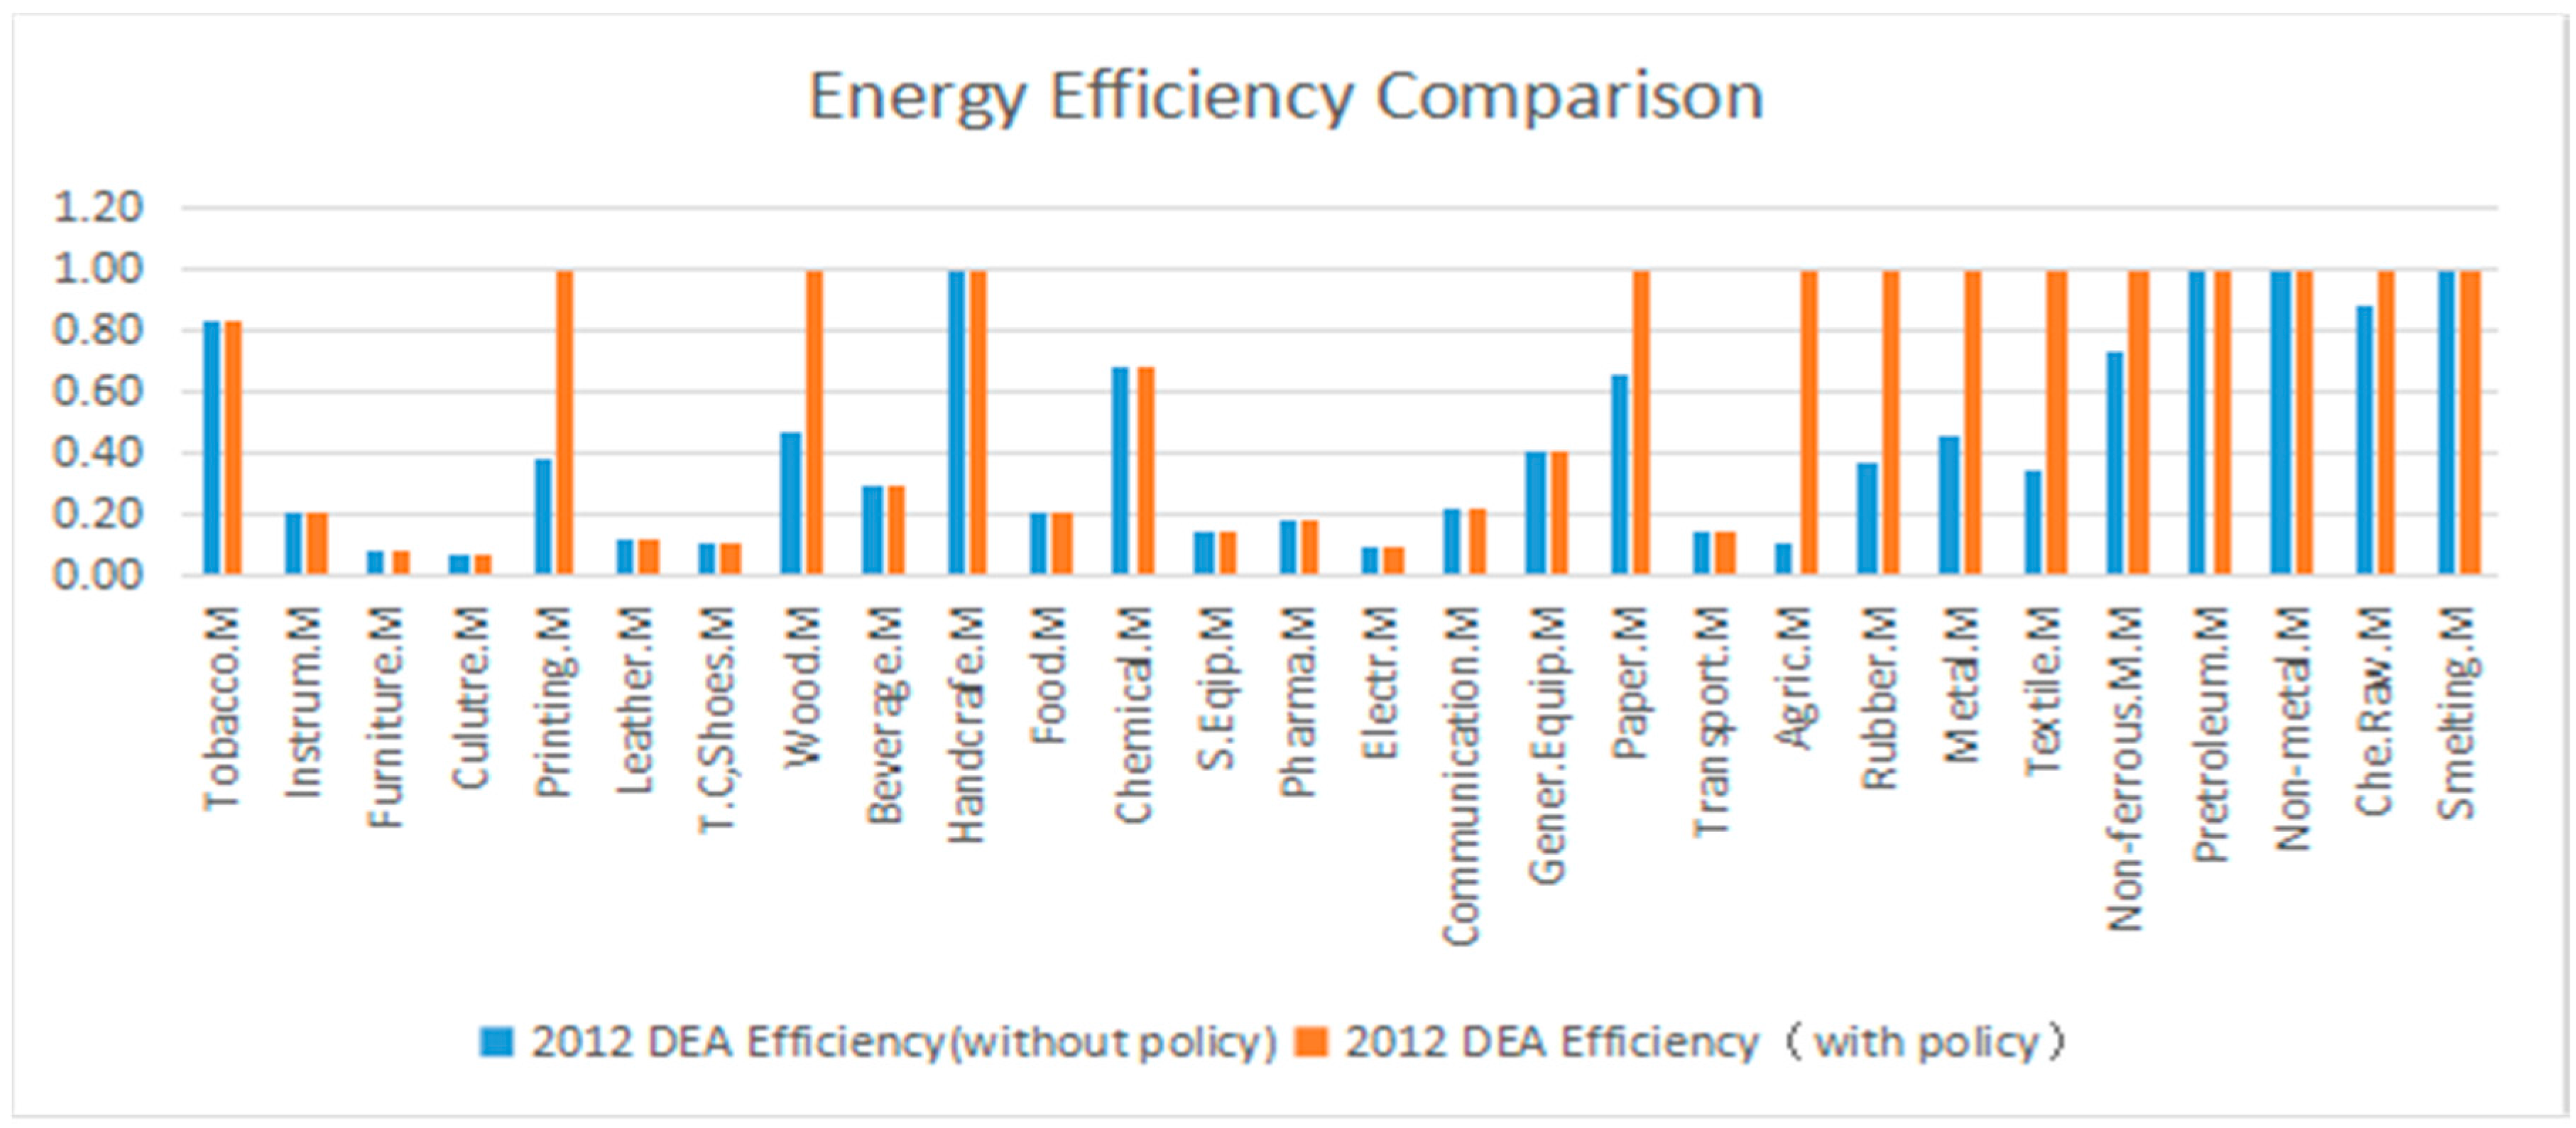
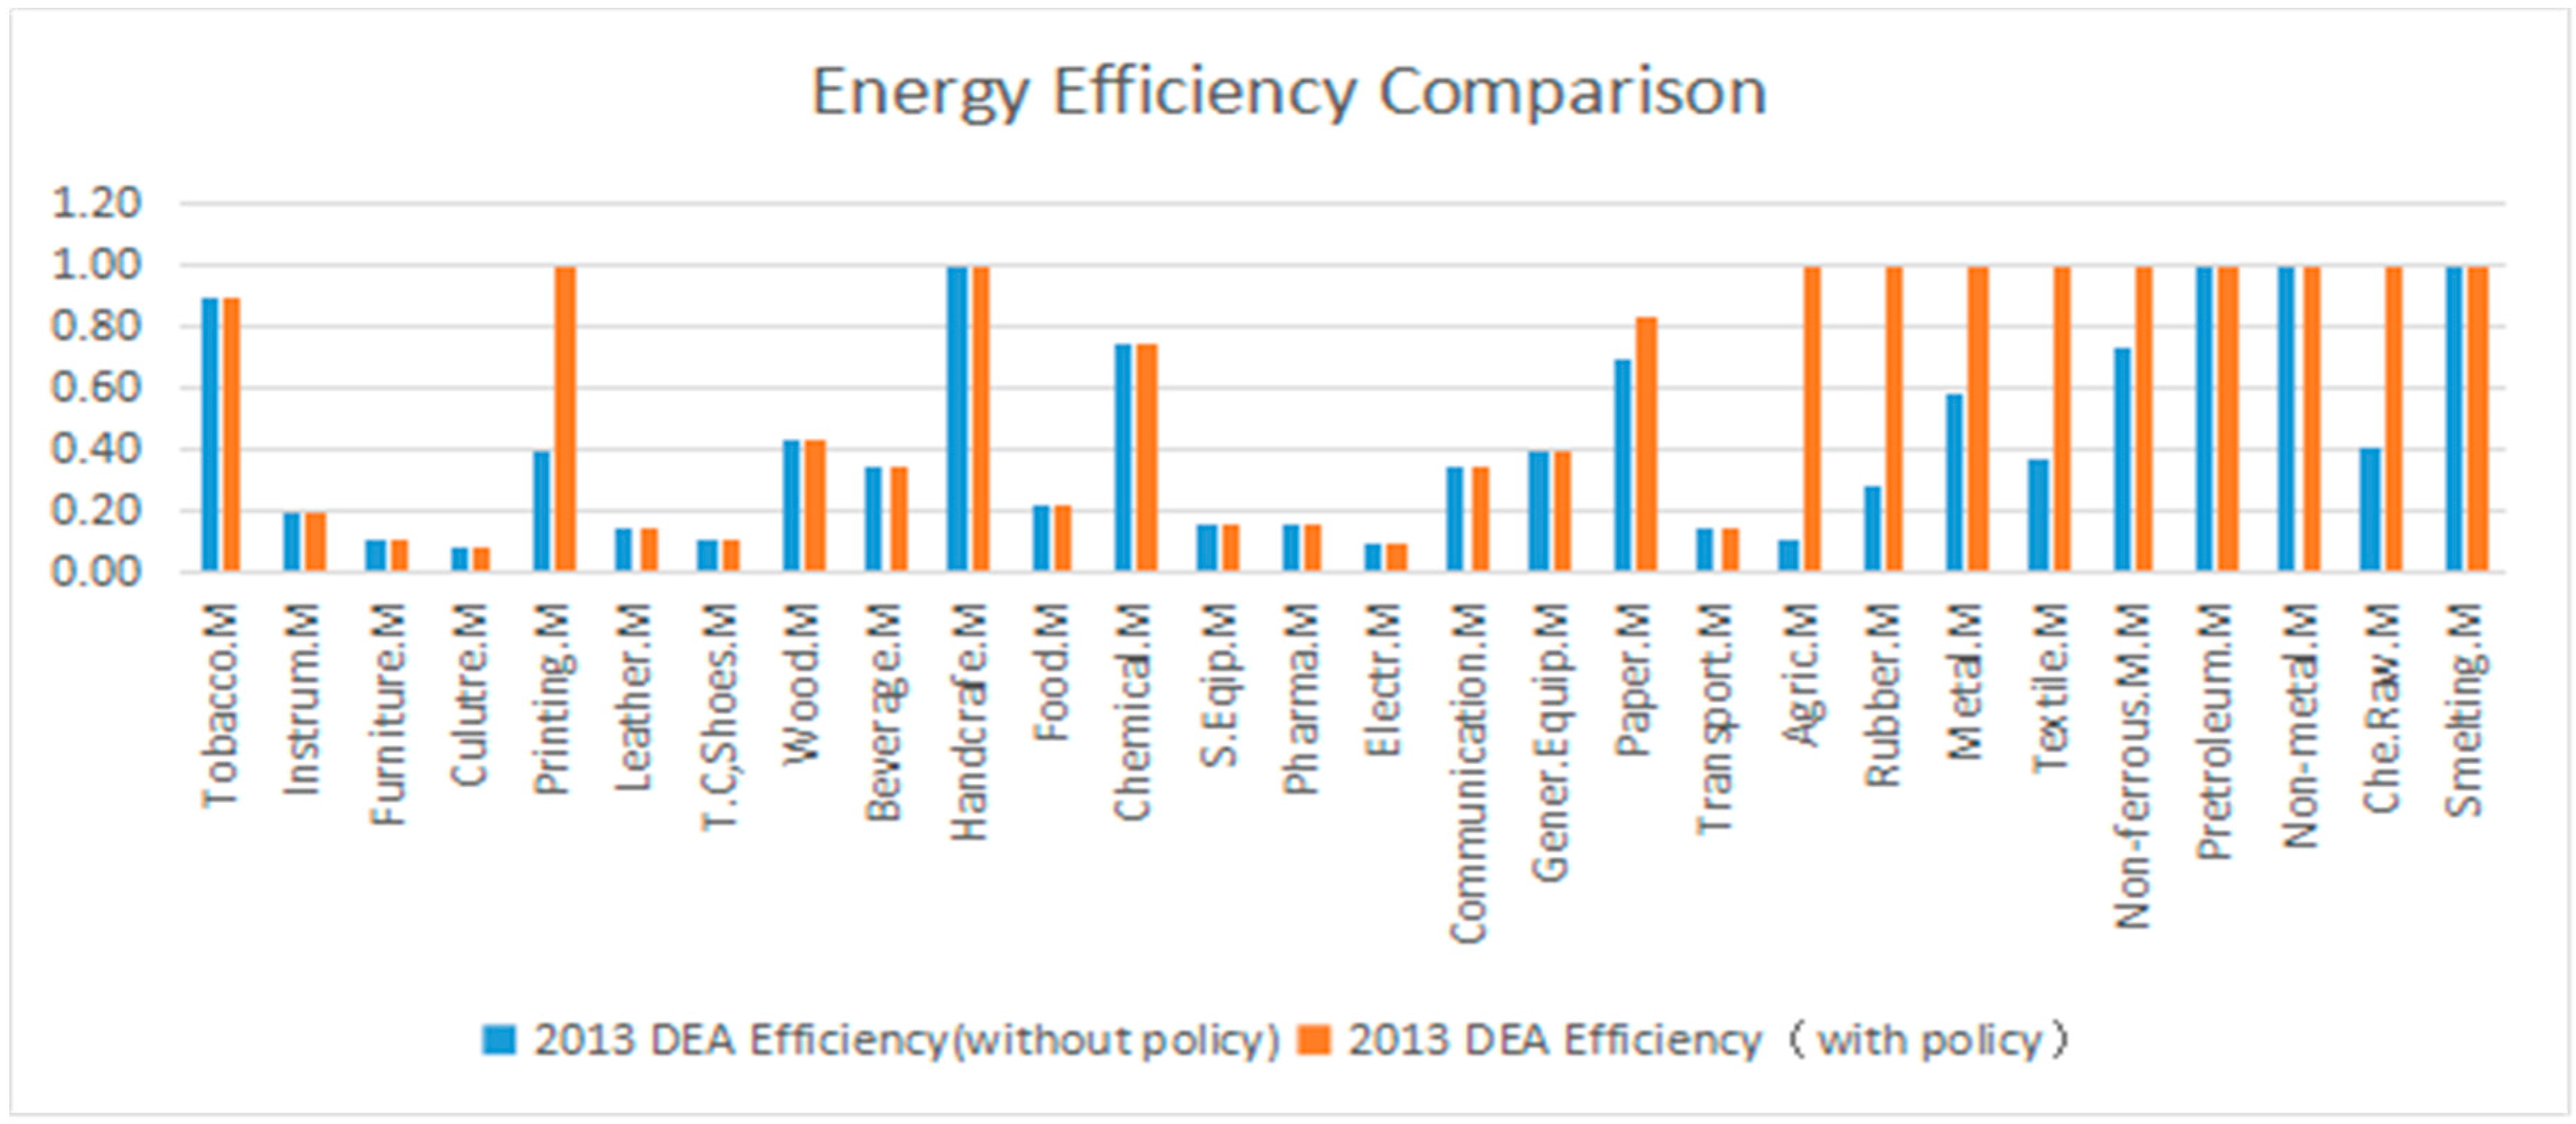
Compared with the results of the industry efficiency in all the years, the results of this paper are similar to that of the energy efficiency policy in 2014. For DEA energy efficiency comparison in other years, see Appendix B.
For the low-energy-consumption industries, even if the energy efficiency policy intensity maximizes (at which time the willingness to implement the energy efficiency policy of industries is the greatest), it does not affect the DEA energy efficiency evaluation value of those industries. Thus, energy efficiency policy intensity is not the main effect on the development of low energy-consumption industries. For moderate-energy-consumption industries, even if that intensity has a middle value (at which time the willingness to implement the energy efficiency policy of industries is maximum), there is no impact on the DEA energy efficiency evaluation value of industries, so energy efficiency policy intensity is not a major effect on the development of such industries. For high-energy-consumption industries, when the energy efficiency policy intensity is minimum (at which time the willingness to implement the energy efficiency policy of industries is the greatest), their DEA energy efficiency evaluation value should improve. In the low-efficiency energy policy, that value of industries is maximum. In other words, energy efficiency policy intensity is not conducive to energy efficiency of high-energy-consumption industries.

3.2.2. Comparisons of DEA Energy Efficiency Evaluation for the Same Industry and Different Years

By only adding energy-efficiency policy intensity, DEA evaluation values of energy efficiency for low-energy-consumption industries did not change with year. That is, energy efficiency policy did not have a major effect on the development of those industries. The DEA energy efficiency evaluation value of moderate-energy-consumption industries across years did not change with the addition of energy efficiency policy intensity; that policy was thus not the main factor in the development of such industries. The DEA value for high-energy-consumption industries improved over the years by adding energy efficiency policy intensity, i.e., that policy was beneficial to the development of low-energy-consumption industries. In summary, energy efficiency policy intensity was not a major effect on the DEA efficiency in low or moderate-energy-consumption industries, whereas low-energy-efficiency policies were conducive to improving the energy efficiency of high energy-intensive industries.
The results show that DEA energy efficiency of the majority of low-energy-consumption industries is relatively low. These industries include instrumentation and culture, office machinery manufacturing, furniture manufacturing, leather and fur and their product industries, textiles and garments, shoes, hat manufacturing, special equipment manufacturing, electrical machinery and equipment, communications equipment, computers, and other electronic equipment, general equipment manufacturing, and transportation equipment. This means that selected input indicators were not the main factors in DEA energy efficiency, so later we can reselect the input indicators of that efficiency in industries. DEA efficiency of moderate or high-energy-consumption industries was high in some years. These industries include tobacco, culture and education, sports, printing and recording media, wood processing, bamboo, rattan, palm and grass products, beverage manufacturing, handicrafts and other manufacturing, food, chemical fiber and pharmaceutical manufacturing, paper products, agricultural and sideline food processing, rubber, plastic and metal products, textiles, non-ferrous metal smelting, petroleum processing, coking and nuclear fuel processing, non-metallic mineral products, chemical raw materials and chemical products manufacturing, and ferrous metal smelting and processing. This means that the selected input indicators had strong impacts on DEA energy efficiency of industrial output indicators.

4. Discussion and Conclusions

The present research used the method of piecewise linear utility function and panel data of 28 manufacturing sectors from 2004 to 2014. We considered energy consumption structure, opening up, environmental regulations, technological progress, competition within industries, and energy efficiency policy intensity as input indicators, and energy consumption intensity as an output indicator. The DEA evaluation model with energy efficiency policy constraints was constructed, which assessed DEA energy efficiency of manufacturing sectors. In the DEA efficiency evaluation model, various utility functions were used to characterize energy policy variables. The study showed that energy efficiency policy was not the main driver of the development of low or moderate energy-consumption industries. The low efficiency-energy policy promoted the development of high energy-consumption industries.
Only by optimizing the energy consumption structure, raising the level of technological progress, increasing the degree of opening up, and enhancing competition within industries can we reduce energy consumption intensity. Through comparison and analysis of the DEA efficiency evaluation of 28 industries, we found that when formulating energy-saving and emission-reduction targets for various industries, the measurement of DEA energy efficiency and its influence factors should be considered. It is necessary to consider the differences between the industries, which is the only way to develop both targeted and practical energy-saving goals. The following recommendations are, therefore, made.
For the low-energy-consumption industries, energy efficiency policy does not much affect DEA energy efficiency, and can, thus, be a relaxed policy. For the high energy-consumption industries, low efficiency-energy policy improves DEA energy efficiency. This indicates that implementation willingness of energy policy monitored by the government is inadequate, or that this willingness within the industries is inadequate. Therefore, the government should vigorously strengthen policy supervision. At the same time, it should accelerate technological innovation, adjust energy consumption structure, encourage the development of high-end manufacturing projects, maintain coordinated development of energy and environmental protection, promote the progress of high energy-consumption industries, and improve the energy efficiency of high energy-consumption industries.

Acknowledgments

The authors would like to thank the editor and all anonymous referees for their valuable comments and suggestions. This research was supported by the National Natural Science Foundation of China (71571104, 71171115, 70901043). Qing Lan Project, the Six Talent Peaks Project in Jiangsu Province (2014-JY-014), the Project Funded by the Priority Academic Program Development of Jiangsu Higher Education Institutions and the Natural Science Foundation of Jiangsu, China (grant No. BK20141481).

Author Contributions

Xiaoqing Chen was responsible for the model development and first draft, and finalized the manuscript. Zaiwu Gong conceived the main idea of the experiments and supervised the whole process of model development and manuscript drafting. All coauthors made significant contributions to the research contained in this article.

Conflicts of Interest

The authors declare no conflict of interest.

Appendix A

The top five industries of energy consumption from 2004 to 2014 were basically the same, followed by ferrous metal smelting and rolling processing, chemical raw materials and chemical product manufacturing, non-metallic mineral manufacturing, petroleum processing, coking, and nuclear fuel, non-ferrous metal smelting and rolling processing. The five sectors accounted for 84.19% of the total energy consumption of manufacturing. The six industries that consumed the least energy (accounting for only 0.784%) were furniture manufacturing, tobacco manufacturing, culture, education, sports and recreational articles, instrument and meter manufacturing, printing and recording media reproduction, leather, fur, feathers and their products. The 28 manufacturing industries were divided into three types: high-, moderate-, and low-energy-consumption.
Table A1. Ranking of energy consumption in manufacturing.
Industry NameTotal Energy Consumption (Million Tons of Standard Coal)Contribution to Total Energy Consumption in Manufacturing (%)
Smelting and pressing of ferrous metals69,34230.580
Chemical raw materials and chemical products processing47,52820.911
Non-metallic mineral products36,59216.099
Petroleum, coking and nuclear fuel processing20,2178.895
Smelting and pressing of nonferrous metals17,5107.704
Textile industries69603.062
Metal products industries48112.117
Rubber and plastic products44591.962
Agricultural and sideline products processing41191.812
Transportation manufacturing40861.798
Paper and paper products40411.778
General equipment manufacturing36341.599
Computer, communications, and other electronic equipment manufacturing28711.307
Electrical machinery and equipment25891.139
Pharmaceutical manufacturing21850.961
Special equipment manufacturing19870.874
Chemical fiber manufacturing18330.806
Food industries18270.804
Handicraft manufacturing17410.766
Beverage manufacturing15160.667
Wood processing and bamboo, rattan, brown, grass manufacturing15130.666
Textile and apparel, apparel industries9380.413
Leather, fur, feathers and their products manufacturing6190.272
Printing and recording media reproduction4660.205
Cultural, educational, sports products manufacturing4000.176
Furniture manufacturing3590.158
Instrumentation manufacturing3190.140
Tobacco manufacturing2380.105
Table A2. Calculated results of industrial efficiency in 2014.
Industries NameEfficiency of an Indefinite VariableEfficiency of a Definite Variable
Tobacco manufacturing0.70.77
Instrumentation manufacturing0.220.22
Furniture manufacturing0.260.26
Cultural, educational and sporting goods manufacturing industries0.070.07
Printing and recording media reproduction0.350.35
Leather, fur, feathers and their manufacturing0.160.16
Textile and garment manufacturing0.120.12
Wood, wood, bamboo, rattan, brown, grass manufacturing0.420.42
Beverage manufacturing0.370.37
Handicrafts and their manufacturing11
Food industries0.210.21
Chemical fiber manufacturing0.700.70
Special equipment manufacturing0.180.18
Pharmaceutical manufacturing0.130.13
Electrical machinery and equipment0.080.08
Communications equipment, computers0.370.37
General equipment manufacturing0.430.43
Paper and paper products0.710.71
Transportation equipment manufacturing0.220.22
Agricultural and sideline food processing0.121
Rubber and plastics manufacturing0.391
Metal products industries0.651
Textile industries0.391
Non-ferrous metal smelting0.681
Petroleum processing, coking and nuclear fuel processing11
Manufacture of non-metallic minerals11
Chemical raw materials and chemical products0.851
Smelting and pressing of ferrous metals11

Appendix B

Figure A1. Description of DEA energy efficiency comparisons of industries in 2004.
Sustainability 09 00210 g006
Figure A2. Description of DEA energy efficiency comparisons of industries in 2005.
Sustainability 09 00210 g007
Figure A3. Description of DEA energy efficiency comparisons of industries in 2006.
Sustainability 09 00210 g008
Figure A4. Description of DEA energy efficiency comparisons of industries in 2007.
Sustainability 09 00210 g009
Figure A5. Description of DEA energy efficiency comparisons of industries in 2008.
Sustainability 09 00210 g010
Figure A6. Description of DEA energy efficiency comparisons of industries in 2009.
Sustainability 09 00210 g011
Figure A7. Description of DEA energy efficiency comparisons of industries in 2010.
Sustainability 09 00210 g012
Figure A8. Description of DEA energy efficiency comparisons of industries in 2011.
Sustainability 09 00210 g013
Figure A9. Description of DEA energy efficiency comparisons of industries in 2012.
Sustainability 09 00210 g014
Figure A10. Description of DEA energy efficiency comparisons of industries in 2013.
Sustainability 09 00210 g015

References

  1. Shen, L.T. Research on the Effect of Technology Progress on Energy Efficiency Based on Spatial Heterogeneity; Beijing Forestry University: Beijing, China, 2016; pp. 1–52. [Google Scholar]
  2. Wang, S.S.; Qu, X.E. Research on Total Factor Energy Efficiency Change of China Manufacturing Industry Considering Environmental Effects: Based on DEA-Malmquist Index Empirical Study. China Popul. Res. Environ. 2011, 21, 130–137. [Google Scholar]
  3. Xu, H.X. A Study on the Mechanism of Technical Transformation on manufacturing Upgrading of Our Country; Nanjing University: Nanjing, China, 2016; pp. 1–53. [Google Scholar]
  4. Zhou, W.Q. Heterogeneous Impacts of Energy Price, Efficiency Improvement and Technological Progress on Energy Intensity of Industrial Sectors. Quant. Tech. Econ. 2016, 33, 130–143. [Google Scholar]
  5. Chen, J. Chinese Industrial Sectors’ Energy Consumption Intensity and Industrial Opening-up—Based on panel threshold regression model. Sci. Econ. Soc. 2016, 143, 46–50. [Google Scholar]
  6. Huang, S.S.; Tan, Q.M. Study on the energy efficiency and its influence factors of manufacturing industry. Technol. Econ. Manag. Res. 2010, 6, 14–18. [Google Scholar]
  7. Li, J.; Wang, K.L. A study on the decomposition, regional disparity and affecting factors of China’s energy efficiency change under multi-objectives constraint. East China Econ. Manag. 2013, 27, 66–71. [Google Scholar]
  8. Luo, H.J.; Fan, R.G.; Luo, M. Measure and analysis on the evolutionary process of energy efficiency in China. Quant. Tech. Econ. 2015, 5, 54–71. [Google Scholar]
  9. Zhao, Y.M.; Zhu, F.M.; He, L.L. Definition, classification and evolution of environmental regulations. China Popul. Res. Environ. 2009, 19, 85–90. [Google Scholar]
  10. Hu, A.G.; Yan, Y.L.; Wang, Y.H. The development of the main objectives and targets China ‘12th Five-Year’. J. Tsinghua Univ. (Philos. Soc. Sci. Ed.) 2010, 25, 105–112. [Google Scholar]
  11. Zhang, R. Environmental Regulation, Energy Productivity and Economic Growth in China. Ph.D. Thesis, Chongqing University, Chongqing, China, June 2013; pp. 1–136. [Google Scholar]
  12. Wang, B.B.; Qi, S.Z. The Effect of Market oriented and command-and-control policy tools on Emission Reduction Innovation—An Empirical Analysis Based on China’s Industrial Patents Data. China Ind. Econ. 2016, 6, 91–108. [Google Scholar]
  13. Zhang, J.X.; Cai, N.; Mao, J.S.; Yang, C. Independent innovation, technology introduction and green growth of industry in China: An empirical research based on industry heterogeneity. Stud. Sci. Sci. 2015, 33, 185–271. [Google Scholar]
  14. Fan, M.Q. The Impact of Environmental Regulations on Total-factor Energy Efficiency. Dongbei Univ. Financ. Econ. 2016, 1, 1–39. [Google Scholar]
  15. Chen, D.M.; Zhang, R. The influence of environmental regulation on China’s total factor energy efficiency: An empirical study based on provincial panel data. Econ. Sci. 2012, 4, 49–65. [Google Scholar]
  16. Abbas, M.; Edmundas, K.Z.; Dalia, S.; Ahmad, J.; Masoumeh, K. A comprehensive review of data envelopment analysis (DEA) approach in energy efficiency. Renew. Sustain. Energy Rev. 2016, 12. [Google Scholar] [CrossRef]
  17. Fujii, H.; Cao, J.; Managi, S. Firm-level environmentally sensitive productivity and innovation in China. Appl. Energy 2016, 184, 915–925. [Google Scholar] [CrossRef]
  18. Charnes, A.; Cooper, W.W.; Rhodes, E. Measuring the efficiency of decision making units. Eur. J. Oper. Res. 1978, 2, 428–444. [Google Scholar] [CrossRef]
  19. Fujikura, R.; Kaneko, S.; Nakayama, H.; Sawazu, N. Coverage and reliability of Chinese statistics regarding sulfur dioxide emissions during the late 1990s. Environ. Econ. Policy Stud. 2006, 7, 415–434. [Google Scholar] [CrossRef]
  20. Guo, C.; Shureshjani, R.A.; Foroughi, A.A.; Zhu, J. Decomposition weights and overall efficiency in two-stage additive network DEA. Eur. J. Oper. Res. 2017, 257, 896–906. [Google Scholar] [CrossRef]
  21. Lim, S.; Zhu, J. A note on two-stage network DEA model: Frontier projection and duality. Eur. J. Oper. Res. 2016, 248, 342–346. [Google Scholar] [CrossRef]
  22. Wu, J.; Yin, P.; Sun, J.; Liang, L. Evaluating the environmental efficiency of a two-stage system with undesired outputs by a DEA approach: An interest preference perspective. Eur. J. Oper. Res. 2016, 254, 1047–1062. [Google Scholar] [CrossRef]
  23. Cook, W.D.; Ruiz, J.L.; Sirvent, I.; Zhu, J. Within-group common benchmarking using DEA. Eur. J. Oper. Res. 2017, 256, 901–910. [Google Scholar] [CrossRef]
  24. Erol, A.; Jeremy, V.C.; Marcus, W.F.; Joan, R. A theory for the evolution of other-regard integrating proximate and ultimate perspectives. Proc. Natl. Acad. Sci. USA 2009, 106, 19061–19066. [Google Scholar]
  25. Coelho, D.A. Association of CCR and BCC Efficiencies to Market Variables in A Retrospective Two Stage Data Envelope Analysis. In International Conference on Human Interface and the Management of Information; Springer: Berlin, Germany, 2014; pp. 151–159. [Google Scholar]
  26. Arrow, K. Economic Welfare and the Allocation of Resources for Invention. In The Rate and Direction of Inventive Activity: Economic and social Factors; Princeton University Press: Princeton, NJ, USA, 1962; pp. 609–626. [Google Scholar]
  27. Porter, M.C.; Van, D.L. Toward a new conception of the environment competitiveness relationship. J. Econ. Perspect. 1995, 9, 97–118. [Google Scholar] [CrossRef]
  28. Fujii, H.; Managi, S.; Kaneko, S. Decomposition analysis of air pollution abatement in China: Empirical study for ten industrial sectors from 1998 to 2009. J. Clean. Prod. 2013, 59, 22–31. [Google Scholar] [CrossRef]
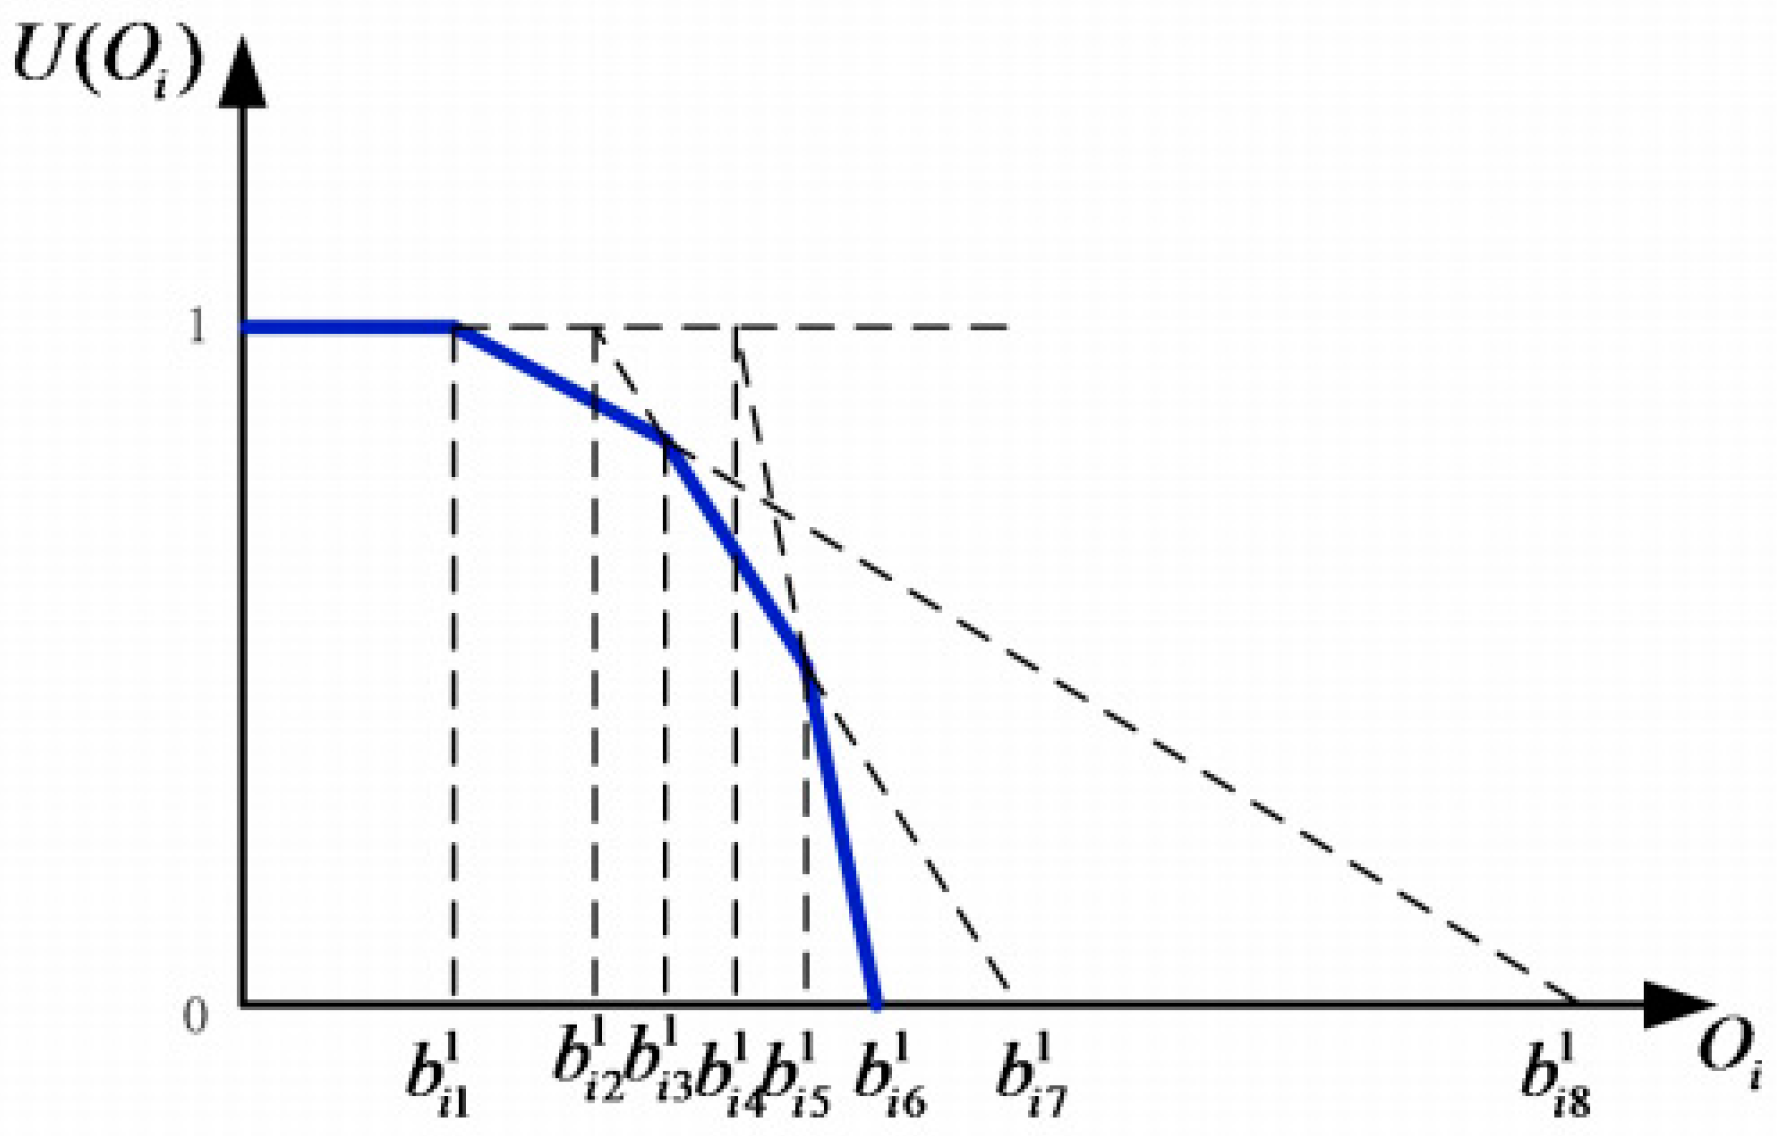
Figure 1. Description of Graph of left-leaning piecewise linear utility function in the first panel.
Sustainability 09 00210 g001
Figure 2. Description of Graph of the right-deviation piecewise linear utility function in the second panel.
Sustainability 09 00210 g002
Figure 3. Description of Graph of the intermediate piecewise linear utility function in the third panel.
Sustainability 09 00210 g003
Figure 4. Description of Graphical representation in empirical analysis.
Sustainability 09 00210 g004
Figure 5. Description of the DEA energy efficiency comparisons of industries from two evaluation models.
Sustainability 09 00210 g005
Table 1. Simple description of the quantitative data.
First IndicatorSecondary IndicatorsVariable Measurement Description
Output indicatorEnergy consumption intensityEnergy consumption per unit GDP for the industries
Input indicatorsEnergy consumption structureRatio of industry coal consumption to total energy consumption
Opening upRatio of industry export value to prime operating revenue of each industry
Environmental regulationsComprehensive utilization rate of industrial solid waste
Technological progressR and D internal expenditure
Competition within industriesNumber of enterprises within the industries
Table 2. National partial energy policy.
YearSpecific PolicyObject
1998“Regulations on the Management of Environmental Protection of Construction Projects” and industrial construction projects as clean production processes with low energy consumption and less pollutants put forward by the State CouncilIndustry
2002National research, demonstration and training in cleaner production and implementation of national key projects of cleaner production technology conductedEnterprise
2004Comprehensive utilization of enterprises, energy-saving, improved resource utilization, pollution prevention and other clean projects increase investment compensationEnterprise
2005Intensity of polluting industries, level of auditing of power, chemical, paper, and other high-energy-consuming industries controlledEnterprise
2006Ten key energy-saving projects are implemented, such as increased industrial pollution control efforts, vigorous promotion of cleaner production, development of circular economy, and reduced pollutionEnterprise
2007Strength of administrative management and elimination of backward production capacity of high-energy-consumption polluting industries are increasedEnterprise
2008Goals of increasing energy conservation and environmental protection efforts, and intensity energy-saving emission reduction, should have been reachedEnterprise
2011Industrial structure and vigorous development of the circular economy adjusted and optimized; energy-saving emission reduction technology development and application accelerated; energy-saving emission reduction economic policy improvedEnterprise
2013Goal of energy-saving environmental protection industries becoming pillar industries of the national economy put forwardEnterprise
2015Polluters should be responsible for their solid waste according to law; solid waste recycling system establishedEnterprise