Article

Urban Growth and Flood Disasters in the Coastal River Basin of South-Central Chile (1943–2011)

1
Faculty of Environmental Sciences and EULA Chile Centre, Department of Territorial Planning, Universidad de Concepcion, Concepcion 4089100, Chile
2
Faculty of Architecture, Urban Planning and Geography, Department of Geography, Universidad de Concepcion, Concepcion 4089100, Chile
3
Faculty of History, Geography and Political Science, Institute of Geography, Pontificia Universidad Católica de Chile, Santiago 7820436, Chile
4
Oceanographic and Hydrographic Engineering (E.O.H.), Viña del Mar 2520000, Chile
*
Author to whom correspondence should be addressed.
Sustainability 2017, 9(2), 195; https://doi.org/10.3390/su9020195
Submission received: 8 October 2016 / Revised: 23 January 2017 / Accepted: 24 January 2017 / Published: 29 January 2017
(This article belongs to the Section Sustainable Urban and Rural Development)

Abstract

:
Urban flooding is an increasing problem in developing countries, thus understanding flood dynamics is necessary to establish guidelines on urban development and flood management. This paper studied the lower reaches of the Andalien River basin, situated on the coast of the Greater Concepcion Metropolitan Area (CMA), the second most urbanized area in Chile. This basin experienced a record 21 flood events in the last 50 years. Patterns in the evolution of urban growth were evaluated using a historical analysis (1943–2011) that specifically focused on how these patterns interact with zones that are prone to flooding over different return periods. Our model applied to the CMA, but is sufficiently transversal to be applied in similar areas. It was determined that the built-up area increased by 1457 ha and had an urban form vulnerable to future flooding due to its location on landforms exposed to flood risk, with altitudes of <8 m and slopes of <0.5°. The bankfull channel of the Andalien River lost 18.4% of its area. Upstream, management of the river decreased smaller floods for a return period of two, five, and 10 years; however, for a return period of 500 years, risk remained at high levels. These findings help to rethink and improve urban planning and the response of Chilean cities in relation to flood hazard.

1. Introduction

Floods are natural processes in river systems [1,2]; however, humans have occupied and urbanized floodplains for their urbanization attractiveness due to planar morphology and water availability [3,4]. The latter has translated into the growth of flood risk zones for human settlements and infrastructure due to a greater concentration of people and structures [5,6]. Recent urban growth has not taken into consideration the space that rivers require to temporarily store flows during floods [3]. Global efforts have focused more on implementing flood control infrastructure such as dykes, dams, and channelization, but despite these efforts, modern cities remain vulnerable to flood risk [7].
Throughout the world, cities have been affected by the increasing impacts of floods; in the period 1998–2008, more than 2900 events were registered [8]. Recent estimates indicate that urban zones exposed to flooding will increase 2.7 times by the year 2030 [9]. Globally, the previewed scenario shows an increase in the frequency and magnitude of floods due to the changes in precipitation patterns resulting from climate change and accelerated urban expansion [10,11,12,13]. It is estimated that by 2050, 70% of the world’s population will be concentrated in urban areas. Of principal concern is the urban growth along low-elevation coastal zones, which are more susceptible to floods and is expected to grow by 230% by 2030 [9,11,14].
Consequently, urban growth in coastal areas have a great environmental impact on urban rivers by lowering water quality, degrading ecosystems, and worsening floods [15,16,17]. Effects such as the impermeabilization of the soil and the reduction of infiltration in the basin, which causes higher peak flooding and more rapid discharge are increasingly seen [16,18,19,20]. Baba [21] and Chin [22] mention irreversible changes induced by urbanization on fluvial morphology and hydraulic geometry due to the adaptation of the landscape for construction, such as the construction of bridges, the extraction of sand and gravel and the dredging of channels. This is linked with an increase in the frequency and magnitude of floods due to the inadequate management of river channels and the floodplain, affecting the river’s capacity to absorb flooding [4,23,24,25,26].
These rapid changes in the floodplains are exacerbated by the lack of rigorous urban planning [6], which is expressed in urban populations exposed to situations of higher risk, and spaces that are increasingly vulnerable to flood disasters [4,27,28,29,30]. In this sense, Morelli et al. [27] and Hansson et al. [31] recognize that urban planning and integrated flood management are a necessity that can only be developed by the adequate study of the elements that compose the risk and its temporal-spatial dynamics in detail. To do so, methodological contributions are necessary to orient the planning and design of urban occupation, requiring an understanding of how cities grow, and what the impacts of growth are on flooding [6,17] and management to arrive at a sustainable solution.
Flood management can be reactive or proactive and while both may be effective; in developing countries, the reactive approach is more prevalent. In this manner, risk management should take a more proactive approach to increasing management efficiency and reducing the loss of life and property [4,32]. Poverty in these countries contributes to vulnerability through inadequate dwellings and higher population densities on floodplains [31]. Many cities in Latin America represent these conditions, where flooding has been registered in areas of growing urbanization with high levels of vulnerability [15,33,34,35,36,37]. For these reasons this study evaluated how patterns of urban growth evolved over time (1943–2011), and how these patterns interacted with areas prone to catastrophes provoked by urban flooding in different return periods associated with the Andalien river in the Concepcion Metropolitan Area of Chile (CMA), one of the urbanized countries in Latin America (with over 80% of the population). The findings of this research suggest that an increase in the built-up areas over the last 68 years have caused a modification of the drainage network, and that there is a progressive increase in the risk of flooding in geomorphological units susceptible to these processes. These findings indicate that it is necessary to rethink and improve urban planning and the response of Chilean cities in relation to flood hazards.
Studying urban flooding in the area of CMA offered several important insights: first, Chile has been identified as being at increased risk for flooding due to its geographical characteristics, which includes zonal climatic variety, mountainous terrain, environmental changes, and urban expansion on floodplains [38,39]; Second, the occurrence of floods appears to be more prevalent in recent years, coincidentally in areas where rapid urbanization has been taking place [40,41], principally in the Chilean Mediterranean zone [39], whose settlements exceed 11 million people (73% of the national population) [42]; Third, a local relation indicates that the accelerated urban growth in floodplains and frequent flooding with an elevated magnitude in the lower course of the Andalien River could be considered as a representative model to help other cities in developing countries; Fourth, the methodological and technical approach is integrated, including: Photointerpretation, geomorphological analysis, and risk assessment. In summary, the integrated proposal application could help provide recommendations and guidelines for urban development and flood management in developing South American cities.

2. Materials and Methods

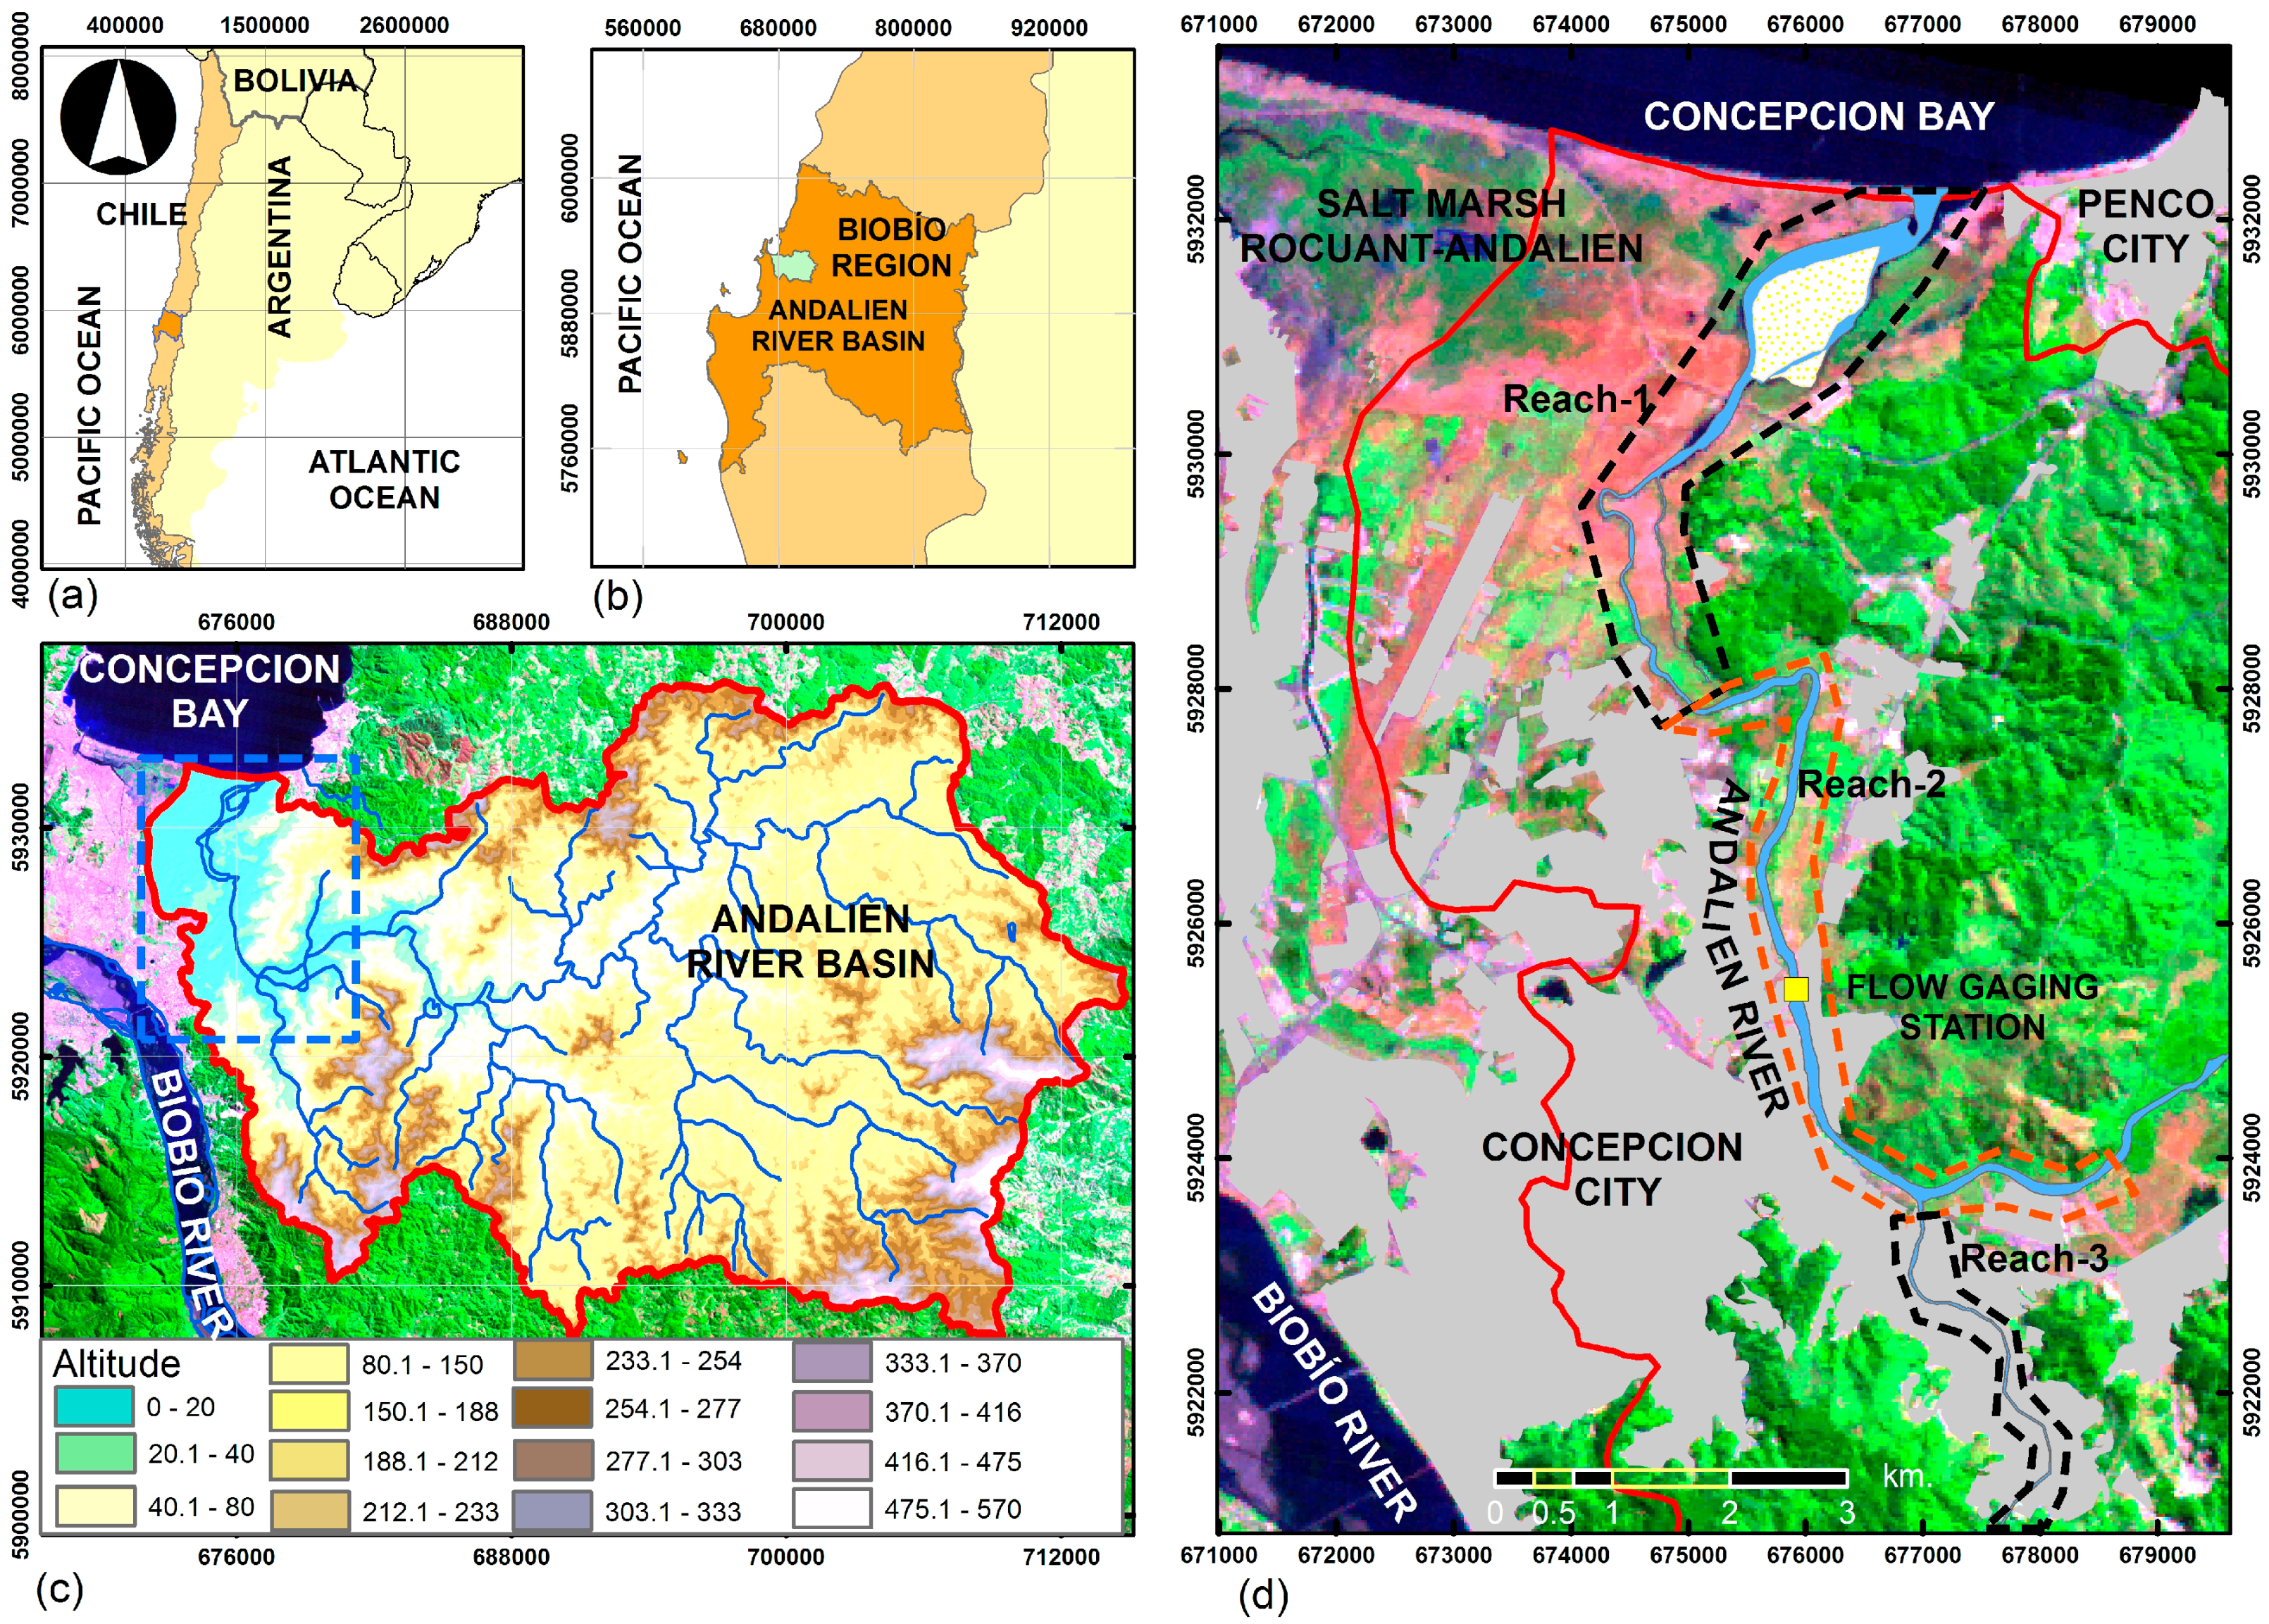
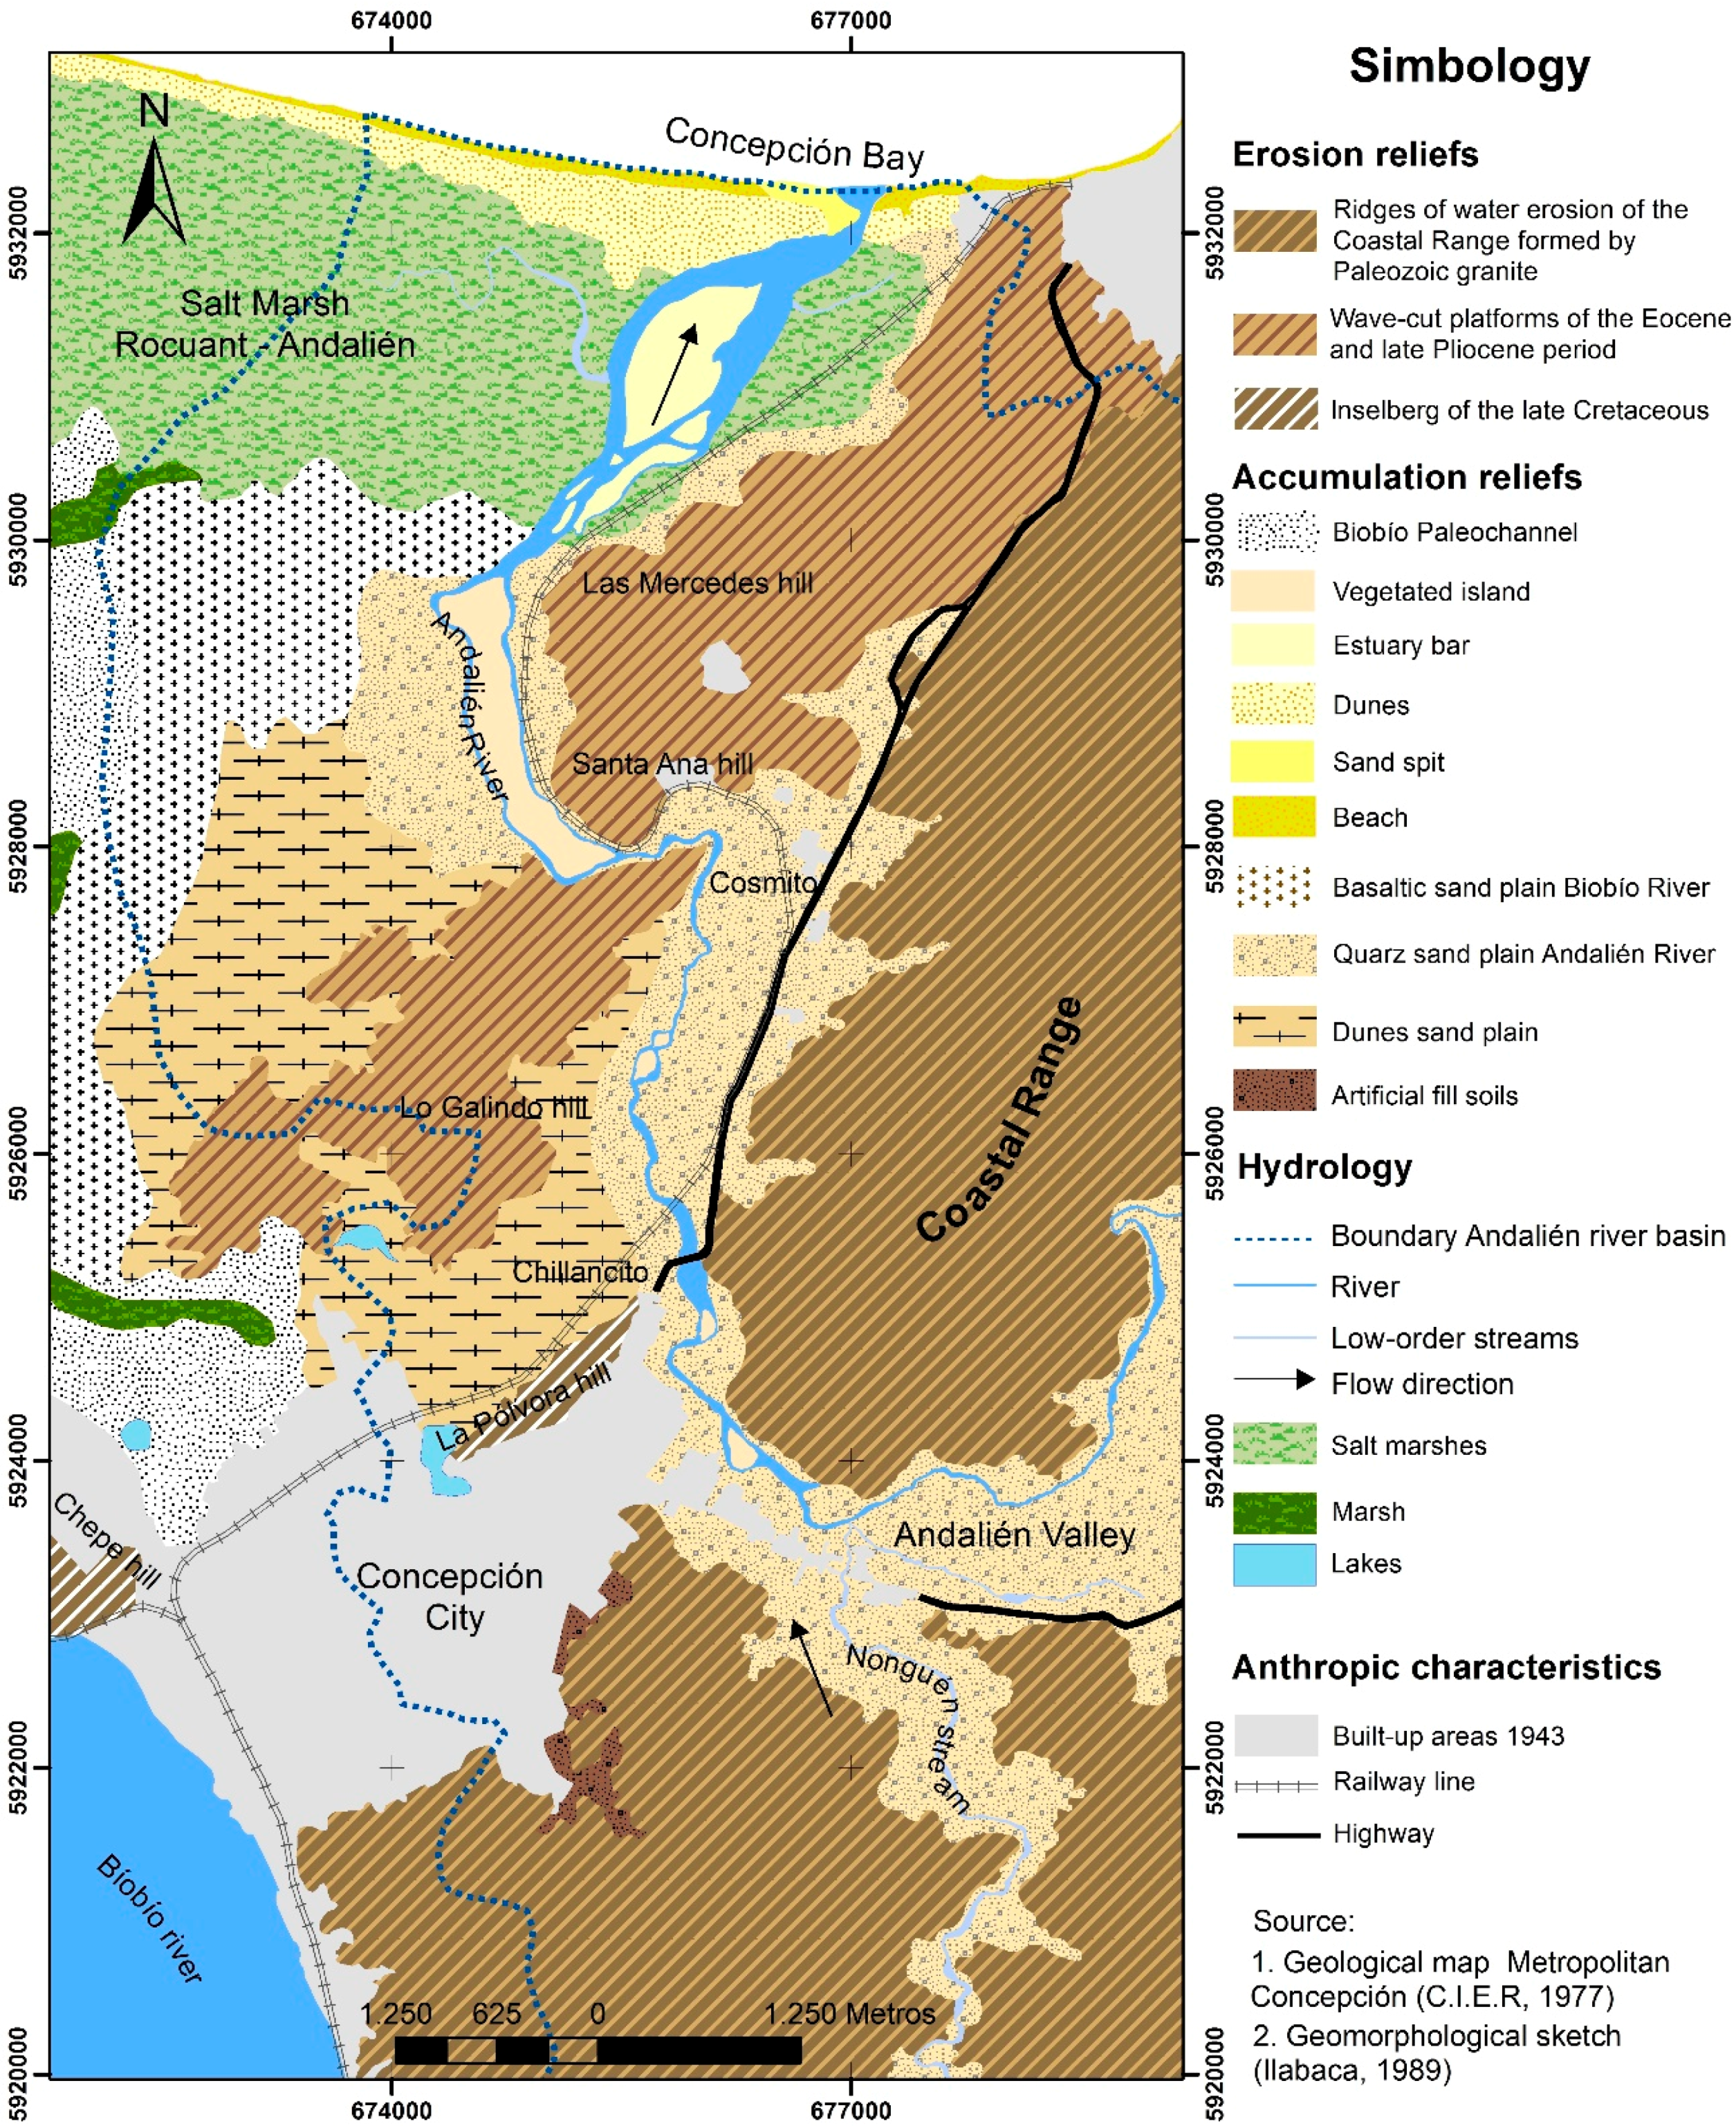
2.1. Area of Study (CMA)

In this study, the effects of urban flooding were examined in the Andalien River Basin (715 km2), located in the area of CMA (region of Biobio, Chile) (Figure 1) (36° S). The lower section of the Andalien River represents 4% of its area; however, 90% of the basin population resides within that section [43,44], in the municipalities of Concepcion and Talcahuano, where poverty rates reach 14.6% and 17.6%, respectively [45]. Urban occupation is characterized by urban sprawl and low density, especially in the periphery [46,47]. Urbanization has modified large sections of the river channel, resulting in various environmental effects including: biodiversity and habitat reduction; deterioration of vegetation cover; and waterlogging and flooding [48,49,50,51,52]. In particular, flooding in the Andalien basin is recurrent and in the period of 1960–2010, 21 events were recorded. The cost of the 2005 flood disaster was $6.5 million USD at the regional level, affecting both periphery and consolidated urban zones [53,54].
Regarding the physical aspects, the basin is predominantly mountainous (granite ridges occupy more than 60% of the area). Granitic platforms occupy 20% of the total area, while alluvial plains and terraces represent less coverage downstream [55,56]. The annual precipitation ranges from 1200 mm in the lower reaches of the basin, to 1600 mm in the top section due to orographic control [57]. The precipitation in the basin is concentrated in 4 winter months (70%), where episodes of five days of continuous precipitation were common, with 124 mm/24 h in June in both 1974 and 2006 [43,46,54]. The average annual discharge reaches 14 m3/s at the closing flow gaging station of the basin, and reaches 565 m3/s and 634 m3/s during a flood of T = 50 and T = 100 years, respectively, with a time of concentration at 10–12 h [58]. In its lower reaches, the main tributary corresponds to the Nonguen stream, which establishes a regular flow with an average discharge rate of 1 m3/s. However, during storms, this rate can reach 83 m3/s for T = 100 years [59].

2.2. Methodology

This study employs the approach that integrates geospatial data on floods levels, which were analyzed with regard to landforms transformations and their relationship to urban growth, using aerial photographs from the period 1943–2011, georeferenced using GPS instruments. Subsequently, flood disaster modeling was performed for different return periods (T) considering the interaction of three risk factors: hazard, historical recurrence, and vulnerability.

2.2.1. Analysis of Landform Transformations and their Relationship to Urban Sprawl

Analysis concerning urban growth was performed by detecting the built-up area in the period of 1943–2011, then contrasting it with the loss of naturalness of different geomorphic units prone to floods in the lower reaches of the basin. Aerial photographs corresponding to the years 1943 (Trimetrogon–IGM, 1:40,000); 1955 (Hycon–IGM, 1:70,000); 1961 (OEA-IGM, 1:20,000); 1978 (SAF-IGM, 1:20,000); 1992 (SAF-FONDEF, 1:20,000); 1998 (GEOTEC, 1:70,000); and 2011 (SAF, 1:30,000) and covering a period of approximately 11 years were interpreted. For georeferencing, we used the Trimble R-4 dual-frequency GPS model with geodetic linkage. The procedure was performed in ArcGIS 9.3 (ESRI: Redlands, CA, USA), using second order polynomial transformations. We obtained the pixel representativeness (PR) (Equation (1), Table 1) and the root mean square error (RMSE) (Equation (2), Table 1) [60].
PR = 2.54 × 10 2 ( m ) × S c a l e r e s o l u t i o n ( dpi )
RMSE = i = 1 N ( X i X i ) 2 + ( Y i Y i ) 2 N .
RMSE was calculated through input and output coordinates of the fit model. Where, X i and Y i correspond to original input coordinates from the control points (GCPs); X i and Y i correspond to output coordinates according to the fit functions in the same point of the image. N is equivalent to the number of control points used in the process of georeferencing. Values of RMSE for this study ranged from 0.24 m to 2.26 m.
We used a geomorphological sketch and the previous geological classes as a basis for production of the geomorphological map [61,62]. Identification and classification of detailed landforms and updates of recent geomorphological and urban changes were made in two field campaigns, and were supported by the use of GPS and aerial photographs from 2011. Two geomorphological maps were obtained, the first representing the baseline year of 1943, and the second the evolution of built-up areas and recent geomorphological changes. Linear regression was used to evaluate the tendencies of geomorphological units in relation to urbanization.
Changes in the river drainage network were evaluated considering the channel length and bankfull area [63]. To do this, the lower section of the basin was divided into three reaches according to their physical characteristics: Reach-1 was from the mouth of the river to 6.2 km, representing a section of the estuary. Reach-2 was from 6.2 km to 15 km, presenting typical river characteristics (this segment has concentrated urbanization). Finally, Reach-3 corresponded to the Nonguen stream. To assess significant trend changes in the river drainage network we used the Mann-Kendall test and Sen’s estimator [64,65,66].

2.2.2. Analysis of River Disasters

The Total Flood Risk ( R T ) was defined using a model which considered the interaction of three factors: Hazard (HR); Historical Recurrence (RH); and Vulnerability ( V T ) [67]. In this model, flood hazard, depth and velocity are essential components in which to evaluate potential damage [68]. Vulnerability corresponds to the conditions (economic, social, physical) that can increase the susceptibility of a community to the impact of flooding [4]. Historical recurrence was defined as a validating factor for hazard analysis, representing the significant history of the flood area on a temporal and spatial level; for the purposes of this study, it corresponded to the flood of 2006. The Total Flood Risk is represented mathematically as Equation (3):
R T = ( HR ( RH ) ) × V T
The hazard rating of flooding (HR) was defined in terms of probability of damaging humans using the velocity and depth of flow shown in Equation (4). The hazard map was made for the return periods (T) of two, five, 10, 25, 50, 100, and 500 years. HR was calculated in raster format according to the Environment Agency Flood and Coastal Defence Programme of London [69]:
HR = h   ( v + 0.5 ) + d f
where h corresponds to flood depth (m), v to velocity (m/s) and d f to debris factor (0–1 score). The degree of flood hazard for people is low if HR < 0.75, moderate if 0.75 < HR < 1.5, high if 1.5 < HR < 2.5, and extreme if HR > 2.5.
Velocity and flood depth were calculated using one-dimensional (1D) hydraulic modeling with HEC River Analysis System HEC-RAS 4.1 software developed by the US Army Corps of Engineers [70]. The discharge data for different periods of return were obtained from Arrau Ingeniería [56]. The most critical downstream flow boundary conditions for days when there were flooding events in the basin were obtained from the tide gauge records of Talcahuano Port and the Tide Tables provided by the Hydrographic and Oceanographic Service of the Chilean Navy (SHOA in Spanish). A downstream flow boundary condition was defined as 1.97 m.
To obtain geometric data of the lower section of the river, we carried out a topo-bathymetric survey post-2010 Chilean earthquake (Mw = 8.8). Topography was completed by two LIDAR (Light Detection and Ranging) flights; the first one with a resolution of 2.5 m (Maritime Port Research Centre; CIMP in Spanish), while the area closest to the river channel was completed with a one meter resolution flight (Administration of Hydraulic Works). Due to the problems that LIDAR flights have penetrating beneath the surface of the water, the bathymetry was made using two data sources: (1) from the mouth of the river to four kilometers, using the GARMIN echo sounder model FF400C, whose transducer was installed on the side of a fishing boat and supported by a TRIMBLE R-4 dual-frequency GPS, and linked to geodetic points; (2) from 4 to 12 km, considering the low depth, a correction of the river channel was performed for the criteria of the slope [56]. The coordinate system used corresponded to WGS_1984_UTM_Zone 18 S, and altitude data was referred to the mean sea level (MSL).
Corrected LIDAR data generated a DEM (Digital Elevation Model), through which 272 cross-sections, developed through the HECgeo-RAS 4.3.1 extension of ArcGIS 9.3, were obtained [71]. Each profile had a variable equidistance between 50 and 100 m according to conditions of local topography. Manning’s n value coefficient was used for the channel and floodplain in each section [72], which were obtained by observation and geo-referenced photographs in the field. The Manning’s coefficient was calibrated using previous work [73]. The validation of the hazard model was performed using the flood of 2006, interview data obtained in the field (Figure 2), aerial photographs, and collected press data [50].
Total vulnerability ( V T ) spatially refers to the location of exposed and vulnerable elements, and the deficiencies of their structures to absorb or recover from a flood [67]. We defined six thematic layers of interest (Table 2) in raster format (1 m × 1 m). For variables 1–5, demographic information by city block was used from the 2002 census (National Statistics Institute) [74,75]. Vulnerability scores were determined on a scale of 0–10 [29], where the maximum value corresponded to a high level of vulnerability. Individual classes of variables 1–4 were normalized using Equation (5) [41]. The classes of variables five and six were established by previous studies [41,76,77].
N u m b e r   o f   n o r m a l i z e d   h a b i t a n t s   ( N H N ) = 10 × N H m a n z N H m a n z m a x
where N H N represents the normalized (0–10) value for the number of inhabitants per block. H m a n z the number of habitants of each block and N H m a n z m a x the maximum number of inhabitants per block of study area.
The thematic layers were integrated through multi-criteria evaluation. Relative weights of each sector were established by a survey of 10 experts using the Delphi method. To determine the degree of agreement of the assessments provided by the experts, Kendall’s coefficient of concordance W (∝ = 0.05) was applied. The value of W = 0.60 was obtained, indicating that experts applied the same standards to assign weight to thematic layers (p = 0.003). Subsequently, a normalized matrix was made, allowing us to use a linear average to obtain the individual vectors associated with each thematic variable of interest. Integration of the layer was performed using the Weighted Overlay extension of ArcGIS 9.3 Spatial Analyst Tools for Equation (6):
V T = ( F 1   ×   W 1 ) + ( F 2   × W 2 ) + ( F n   × W n )
where F represents each factor of the vulnerability score reclassified (Score vulnerability), and W (relative weight) is the relative score by weight of influence.
Total vulnerability was reclassified into five categories: (1) very low; (2) low; (3) moderate; (4) high; and (5) extreme. The total risk for each period of return ( R T ) was measured according to the factors of hazard and vulnerability that were integrated into a matrix. Through multiplication, four levels of risk were obtained: low, moderate, high, and extreme, with scores of 1–20 (Table 3).

3. Results

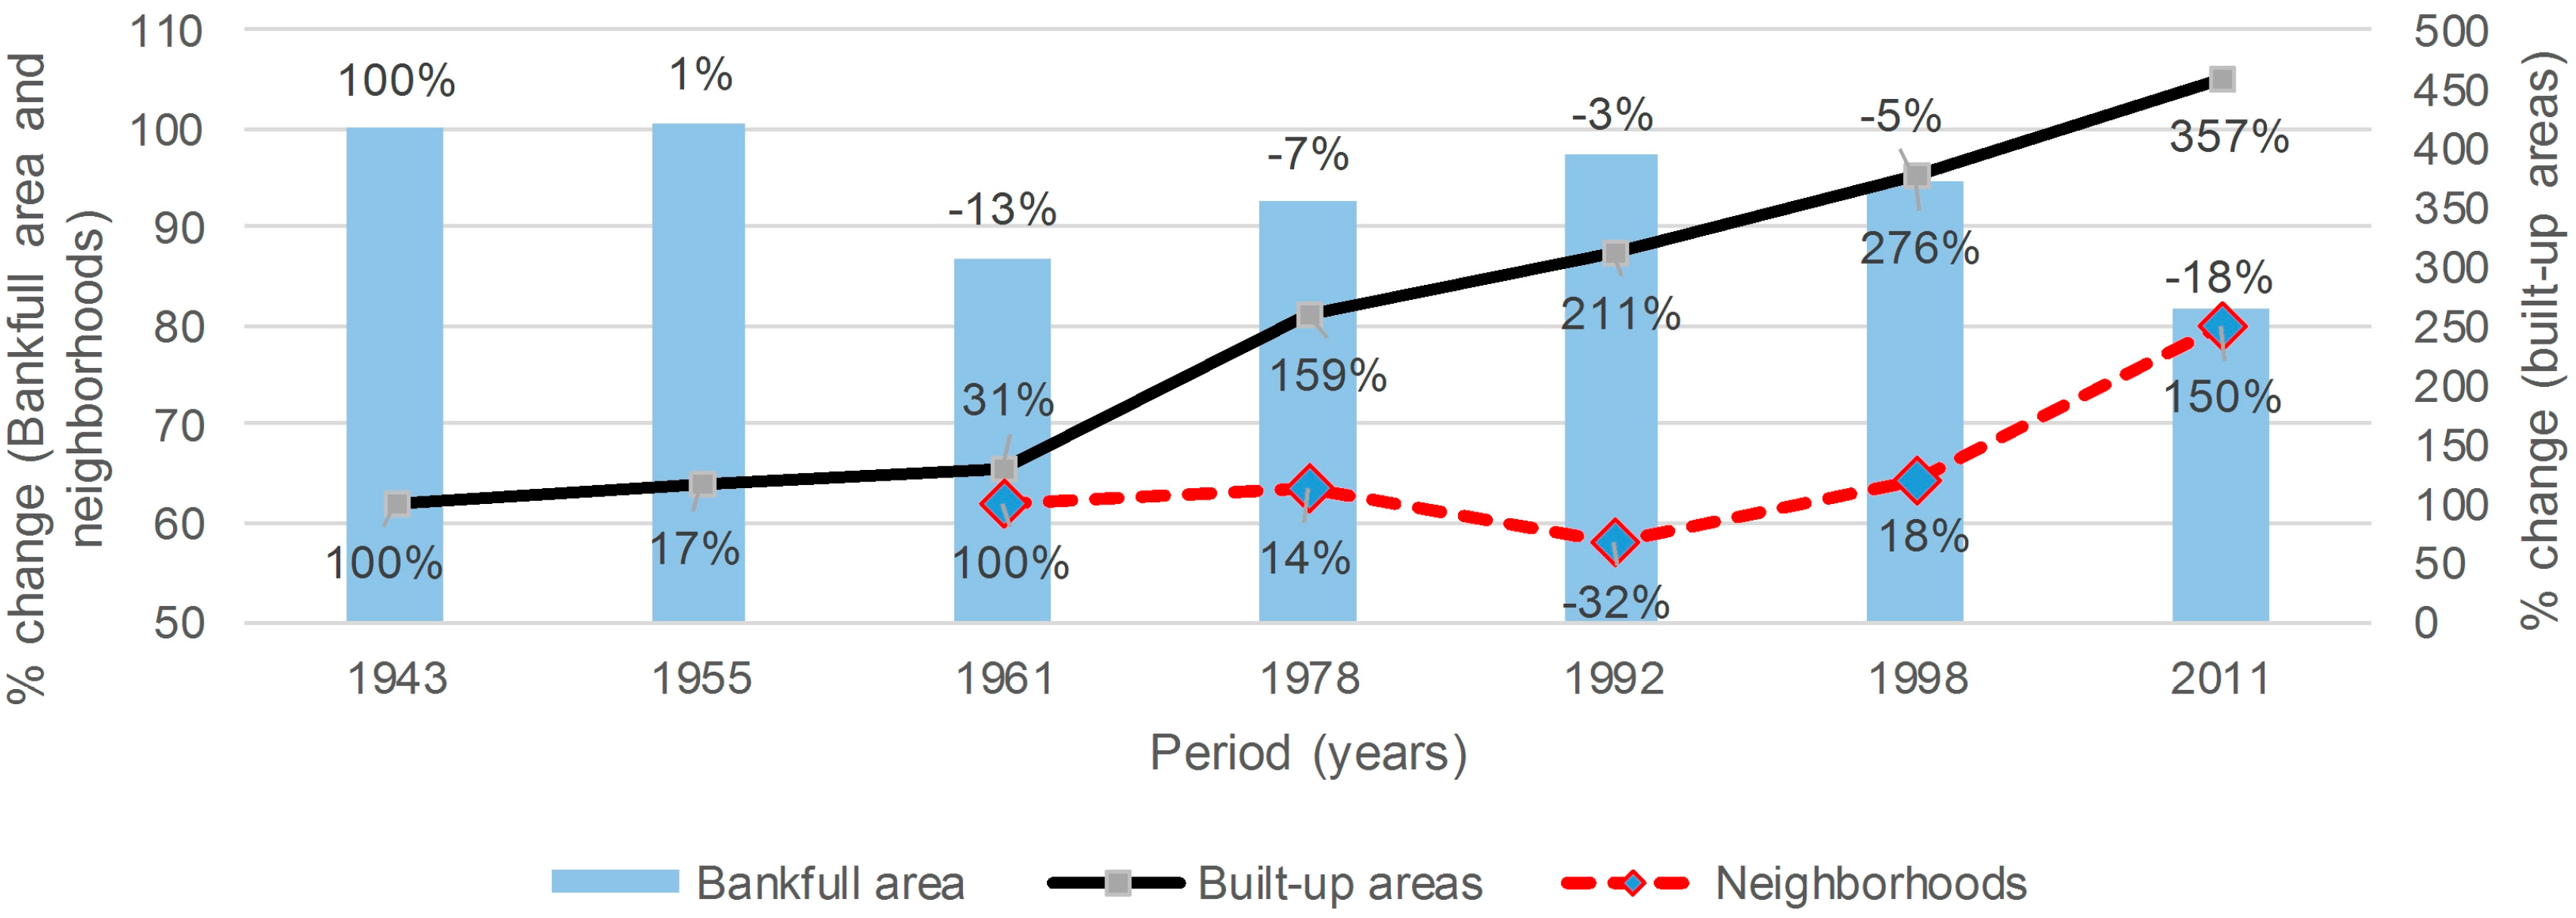
3.1. Analysis of Physical Transformations and their Relationship to Urban Growth

Figure 3 shows the geomorphology and the built-up area occupied by the city of Concepción in 1943. Within this area, the lower reaches of the Andalien River basin occupied 13,597 ha. Erosion relief accounted for 69.5% of the area and the main units corresponded to: ridges of water erosion of the Coastal Range formed by Paleozoic granite, which represented 62.7% of the relief sector; and 6.5% corresponded to wave-cut platforms of the Eocene and late Pliocene period. All these reliefs had altitudes higher than 20 m.
The main accumulation reliefs are located next to the river and the coast. 12.4% corresponded to the quartz sand plain of the Andalien River; 6.72% to the black basalt sand plain of Biobio River from the recent Pleistocene–early Holocene period, and the unit of the plain that was modeled in the dunes; and finally, 5.5% to hydromorphic units made up of marshes, lakes, and channels.
The sand plain of the Andalien River (type of accumulation relief) stands out for their importance in river flooding of the CMA. This plain is made up of a mixture of fine sand, silt, and clay that is in some cases associated with colluvial deposits that have a thickness of approximately three meters. These materials have moderate permeability, and large fluctuations in their water table. In the summer, the zone of saturation drops to three meters, and in winter we can find it close to or at the surface [78]. These variations increase susceptibility to urban flood and waterlogging processes.
In the period 1943–2011, the city increased its built-up area by 1457 ha (p = 0.0001). In 1943, the area of Concepción City amounted to 408 ha, in 1978 it reached 1055 ha, and by 2011 that area had increased again to 1865 ha. The highest rate of urban growth occurred between 1961 and 1978, and 1992–1998, with 30.7 ha/year and 44.14 ha/year, respectively. From 1998 to 2011 the annual growth trend decreased to 25.53 ha/year. A general aerial view for the year 2011 (Figure 4) showed negative trends in geomorphological landforms produced by urban expansion in seven units (p ≤ 0.05) (Table 4). Of these units, four are accumulation reliefs, where the city increased by 951 ha, the units mainly being flood-prone due to their low altitude <8 m, such as the systems of the river quartz sand plain of the Andalien river (−538 ha), the sand dune plain (−350 ha), and the basaltic sand plain of Biobio River (−54 ha). Other changes established in 2011 show an increase in artificial fill soils zones destined for future urban expansion (41.5 ha) located on the quartz sand plain of the Andalien River, indicating that the trend of urbanization in these landforms continues.
Increase of the built-up area in the lower reaches of the Andalien River has caused a modification in the river drainage network, and a progressive increase in its exposure to the risk of fluvial flooding. In the period between 1943 and 2011 the Andalien River lost 18.4% of its bankfull channel (Table 5). Fluvial section analysis indicated that the loss was concentrated in Reach-1 (mouth of the river to 6.2 km), where the channel decreased 50.3 ha. Conversely, Reach-2 (6.2 km to 15 km) increased its area 20.2 ha. The Nonguen stream (Reach-3) has presented major cycles of increasing or decreasing its area. During the period analyzed, the loss was 1.2 ha. In the period of 1998–2001 the increase of the bankfull area of Reach-2 and Reach-3 was linked to the deepening, dredging and construction of levees of the river that had taken place between 7 and 15 km, and extended to 3.2 km from the mouth of the river [59].
Trend analysis carried out on bankfull area and total length on the different water courses between 1943 and 2011 showed that the total length of the river has decreased (Table 6) at a rate of −0.134 km/decade (p = 0.05), similar to the trend observed for the Nonguen stream (Reach-3) of −0.036 km/decade (p = 0.1). The decrease was highly significant in Reach-2 at −0.294 km/decade (p = 0.01), while Reach-1 had a growing trend of +0.152 km/decade (p = 0.05). In relation to the area containing the network of channels, it was observed that the bankfull area had decreased −3.008 ha/decade, with a higher intensity in Reach-1 of −6.324 ha/decade. The highest gain of bankfull area was found in Reach-2 of 3.864 ha/decade, which could be associated to structural mitigation measures.
In Figure 5, an increase can be seen from built-up areas in the period 1943–2011. The correspondence was observed between the decrease in the bankfull area of the Andalien River (−18%) with the increase of reported urban surface area (357%). In addition, the increase of neighborhoods affected by flooding grew 150% in the period 1961–2011 [79], which would be related to higher occupation of the floodplains since 1943 as reported in Figure 4.

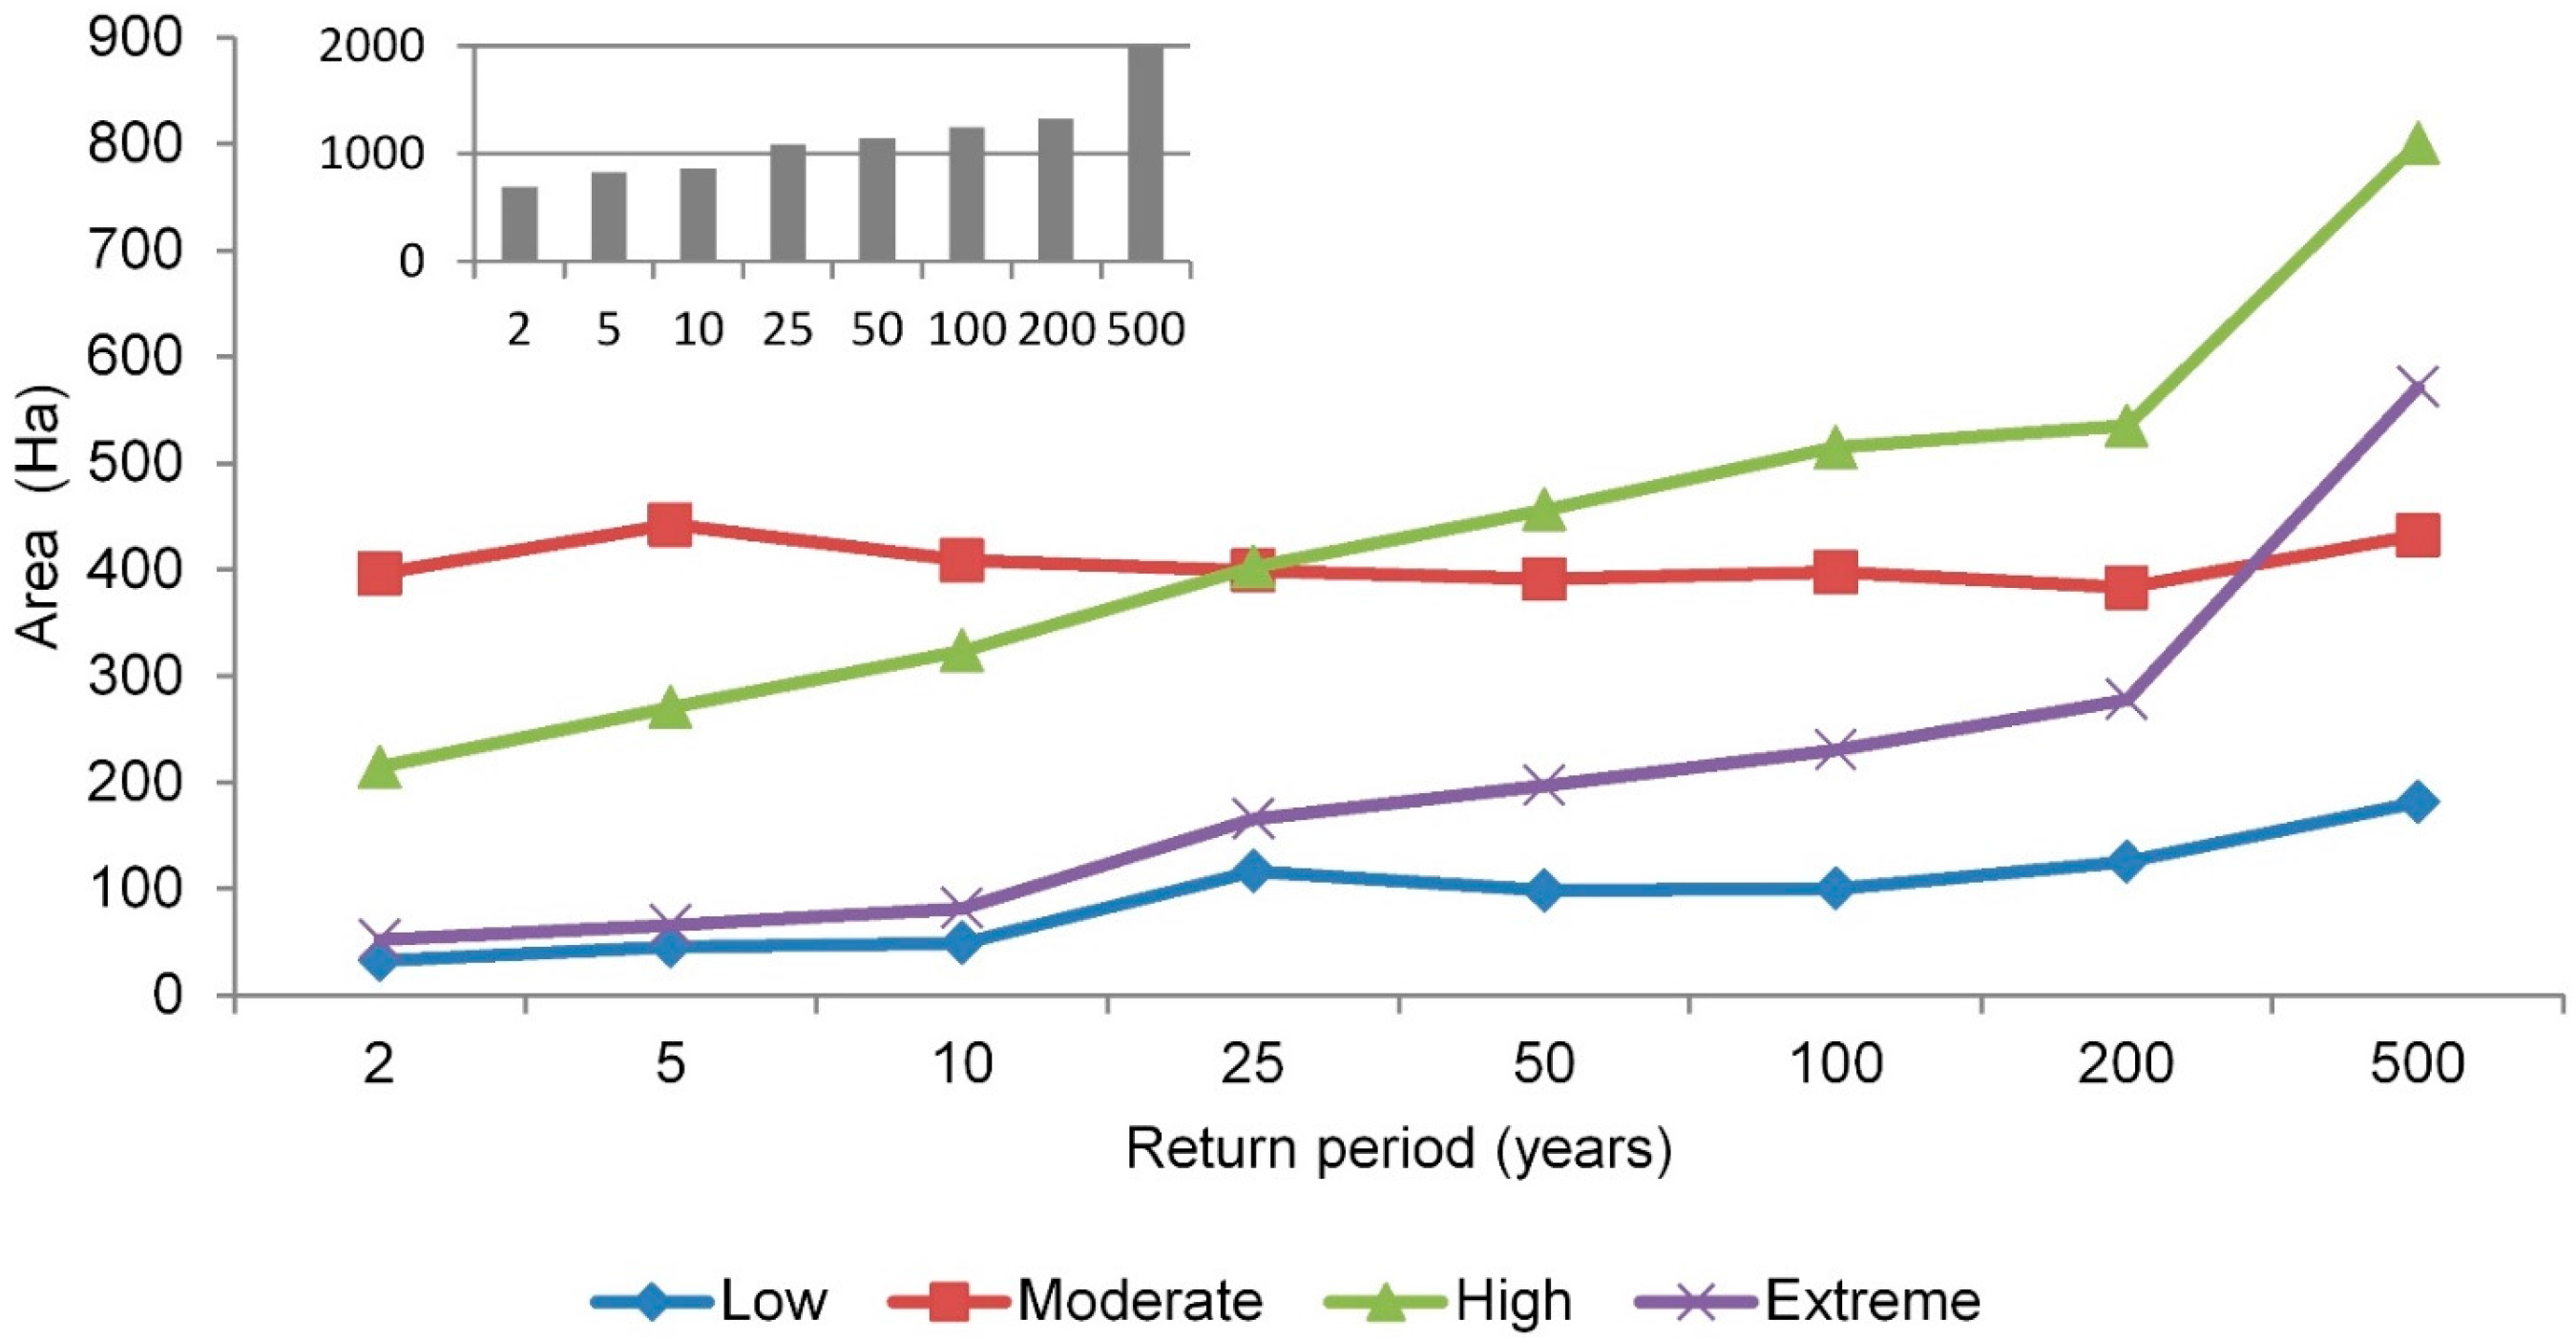
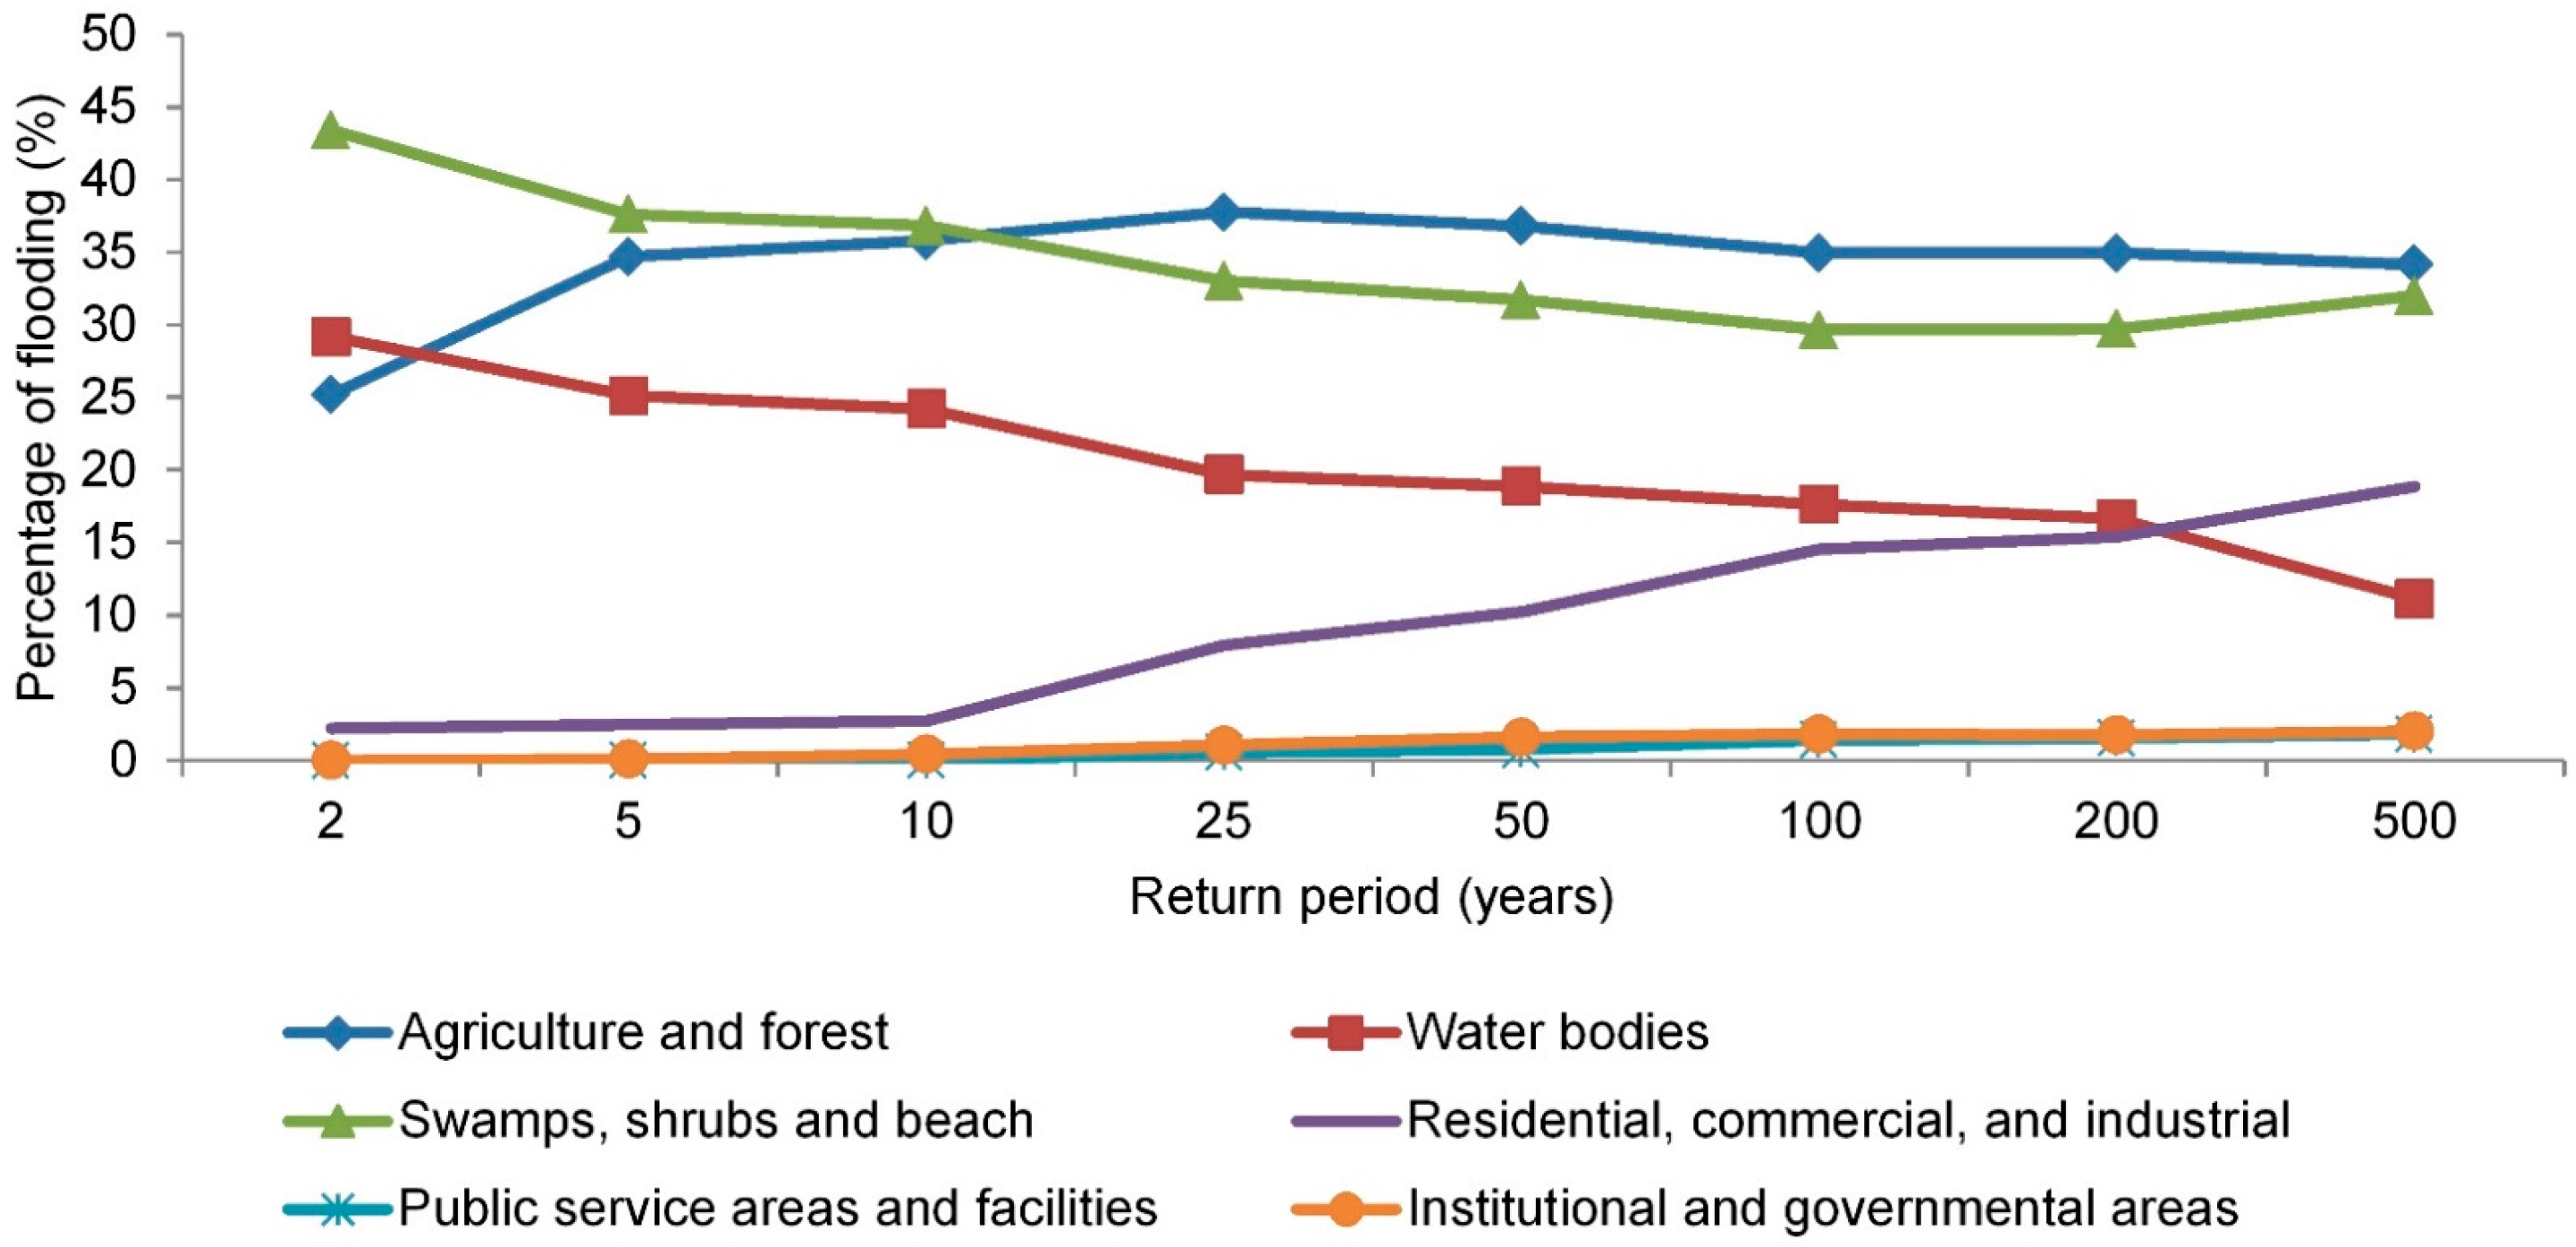
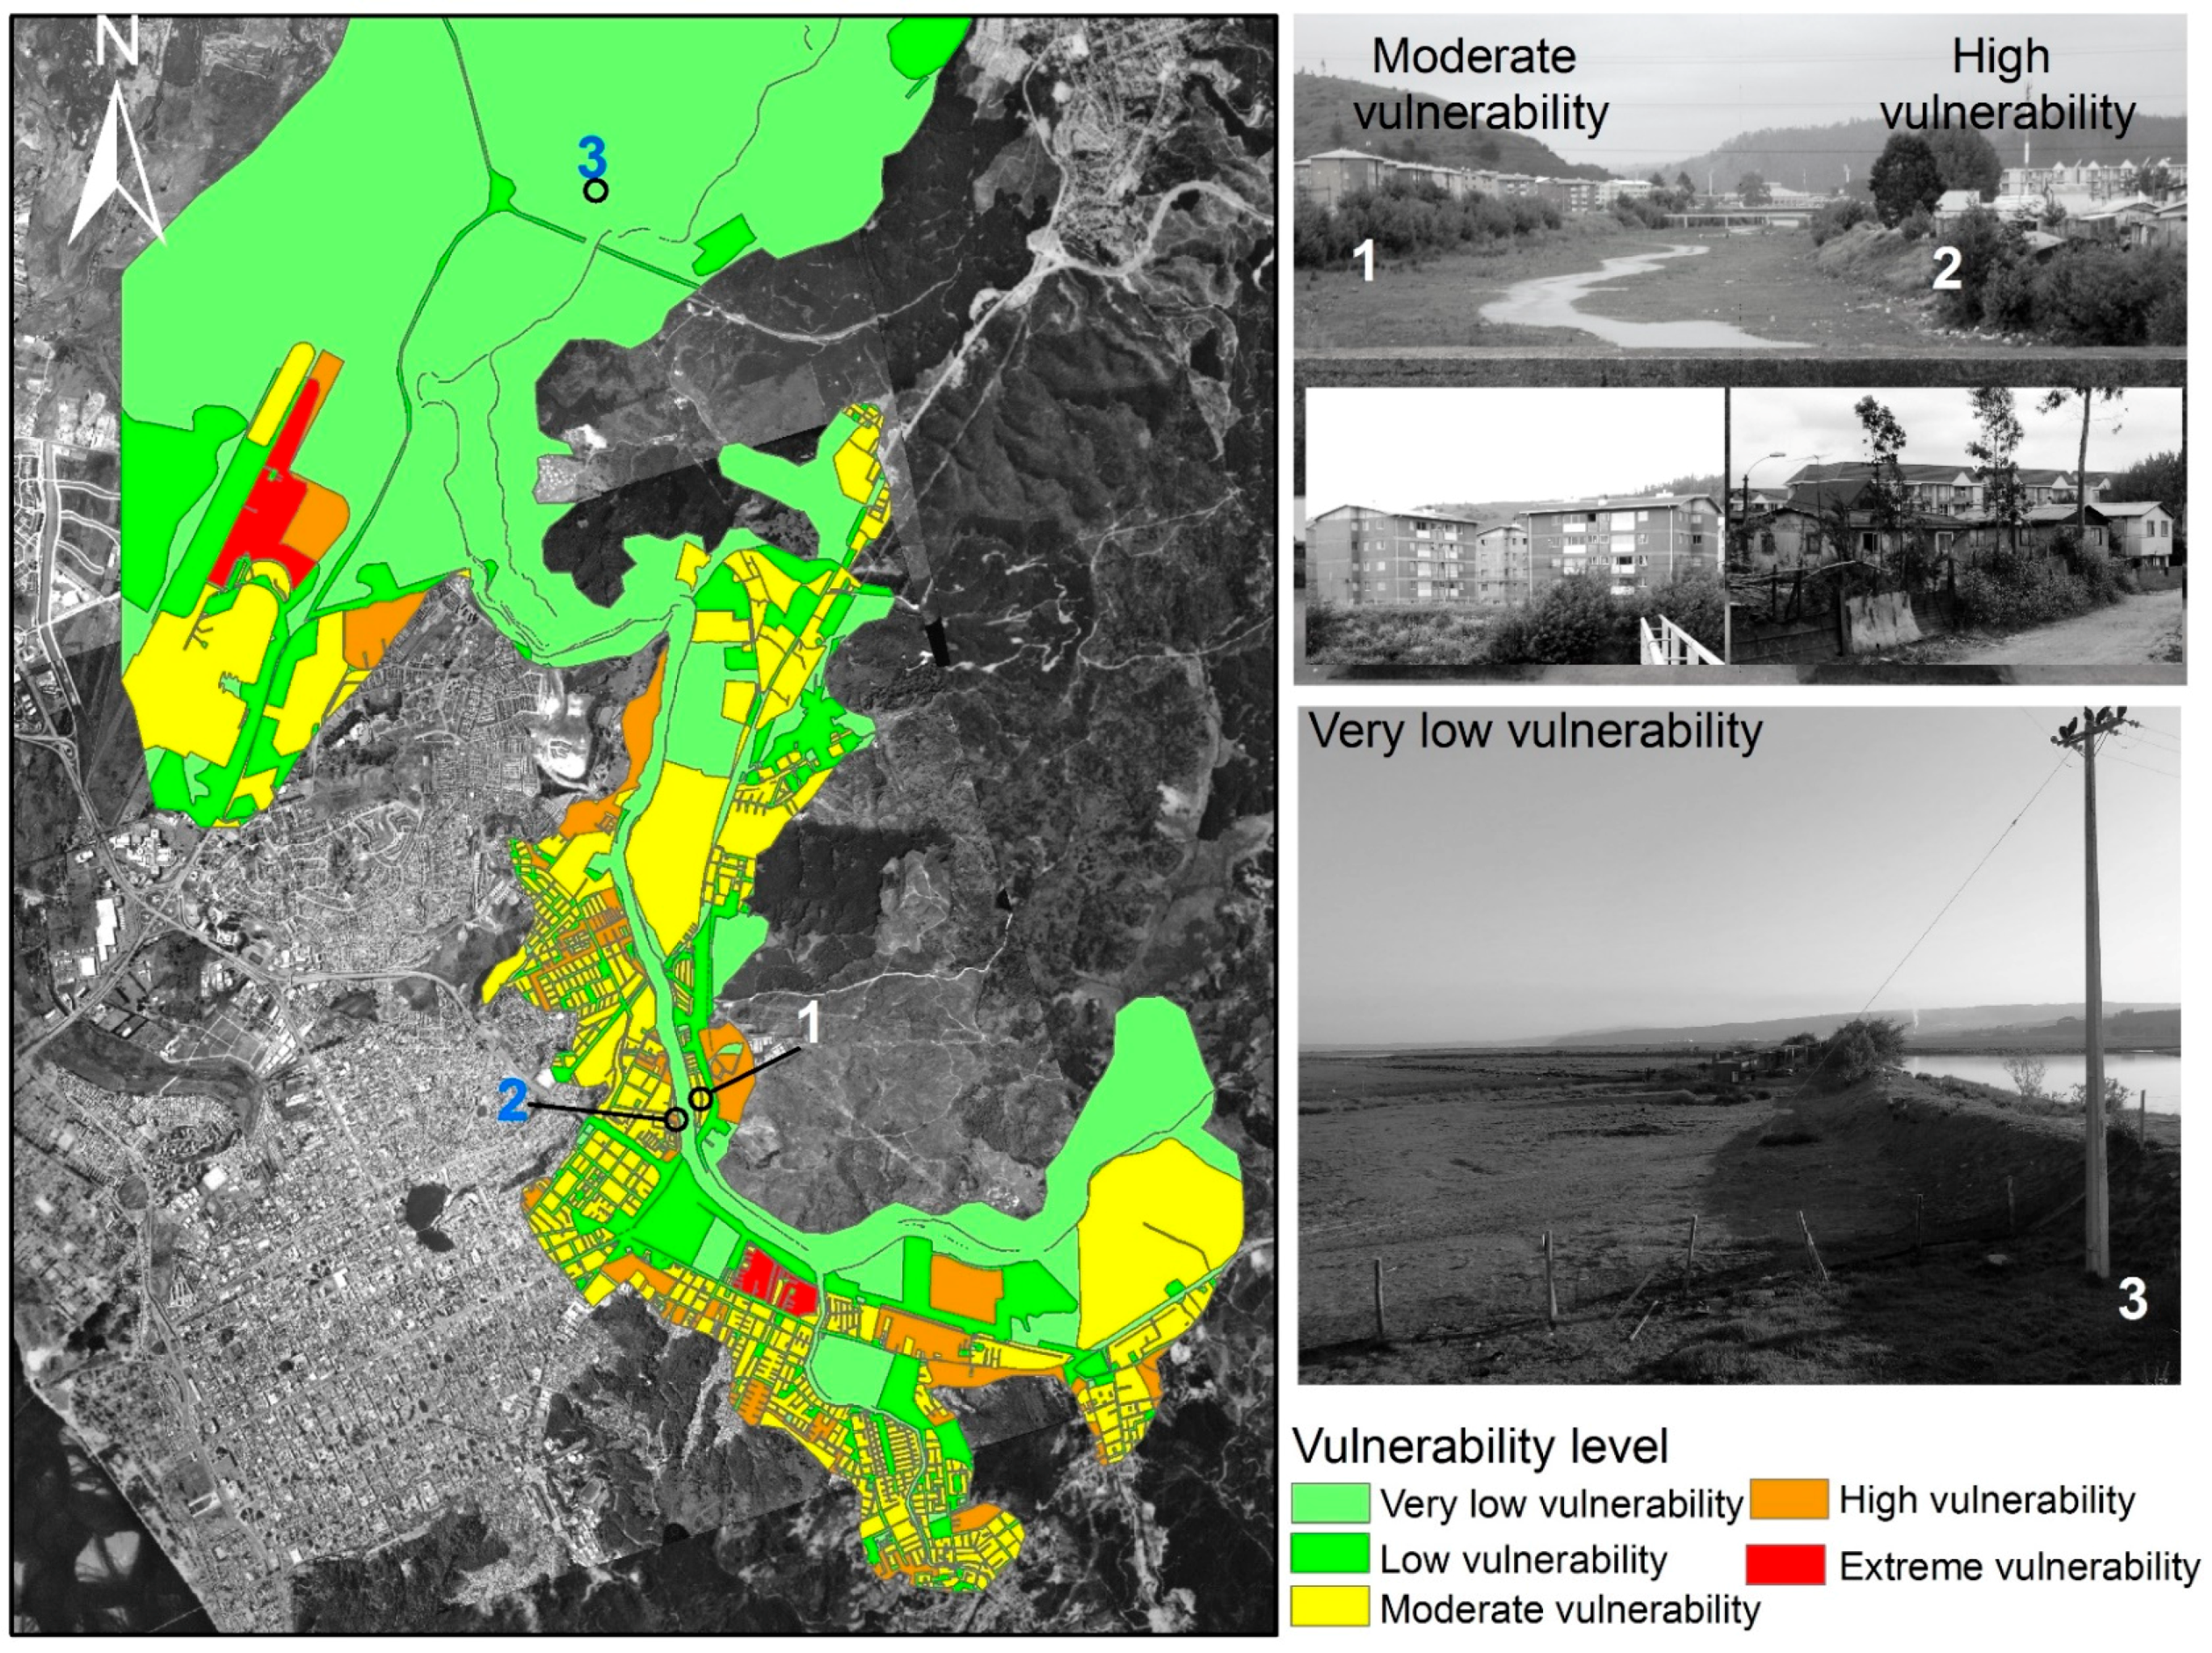
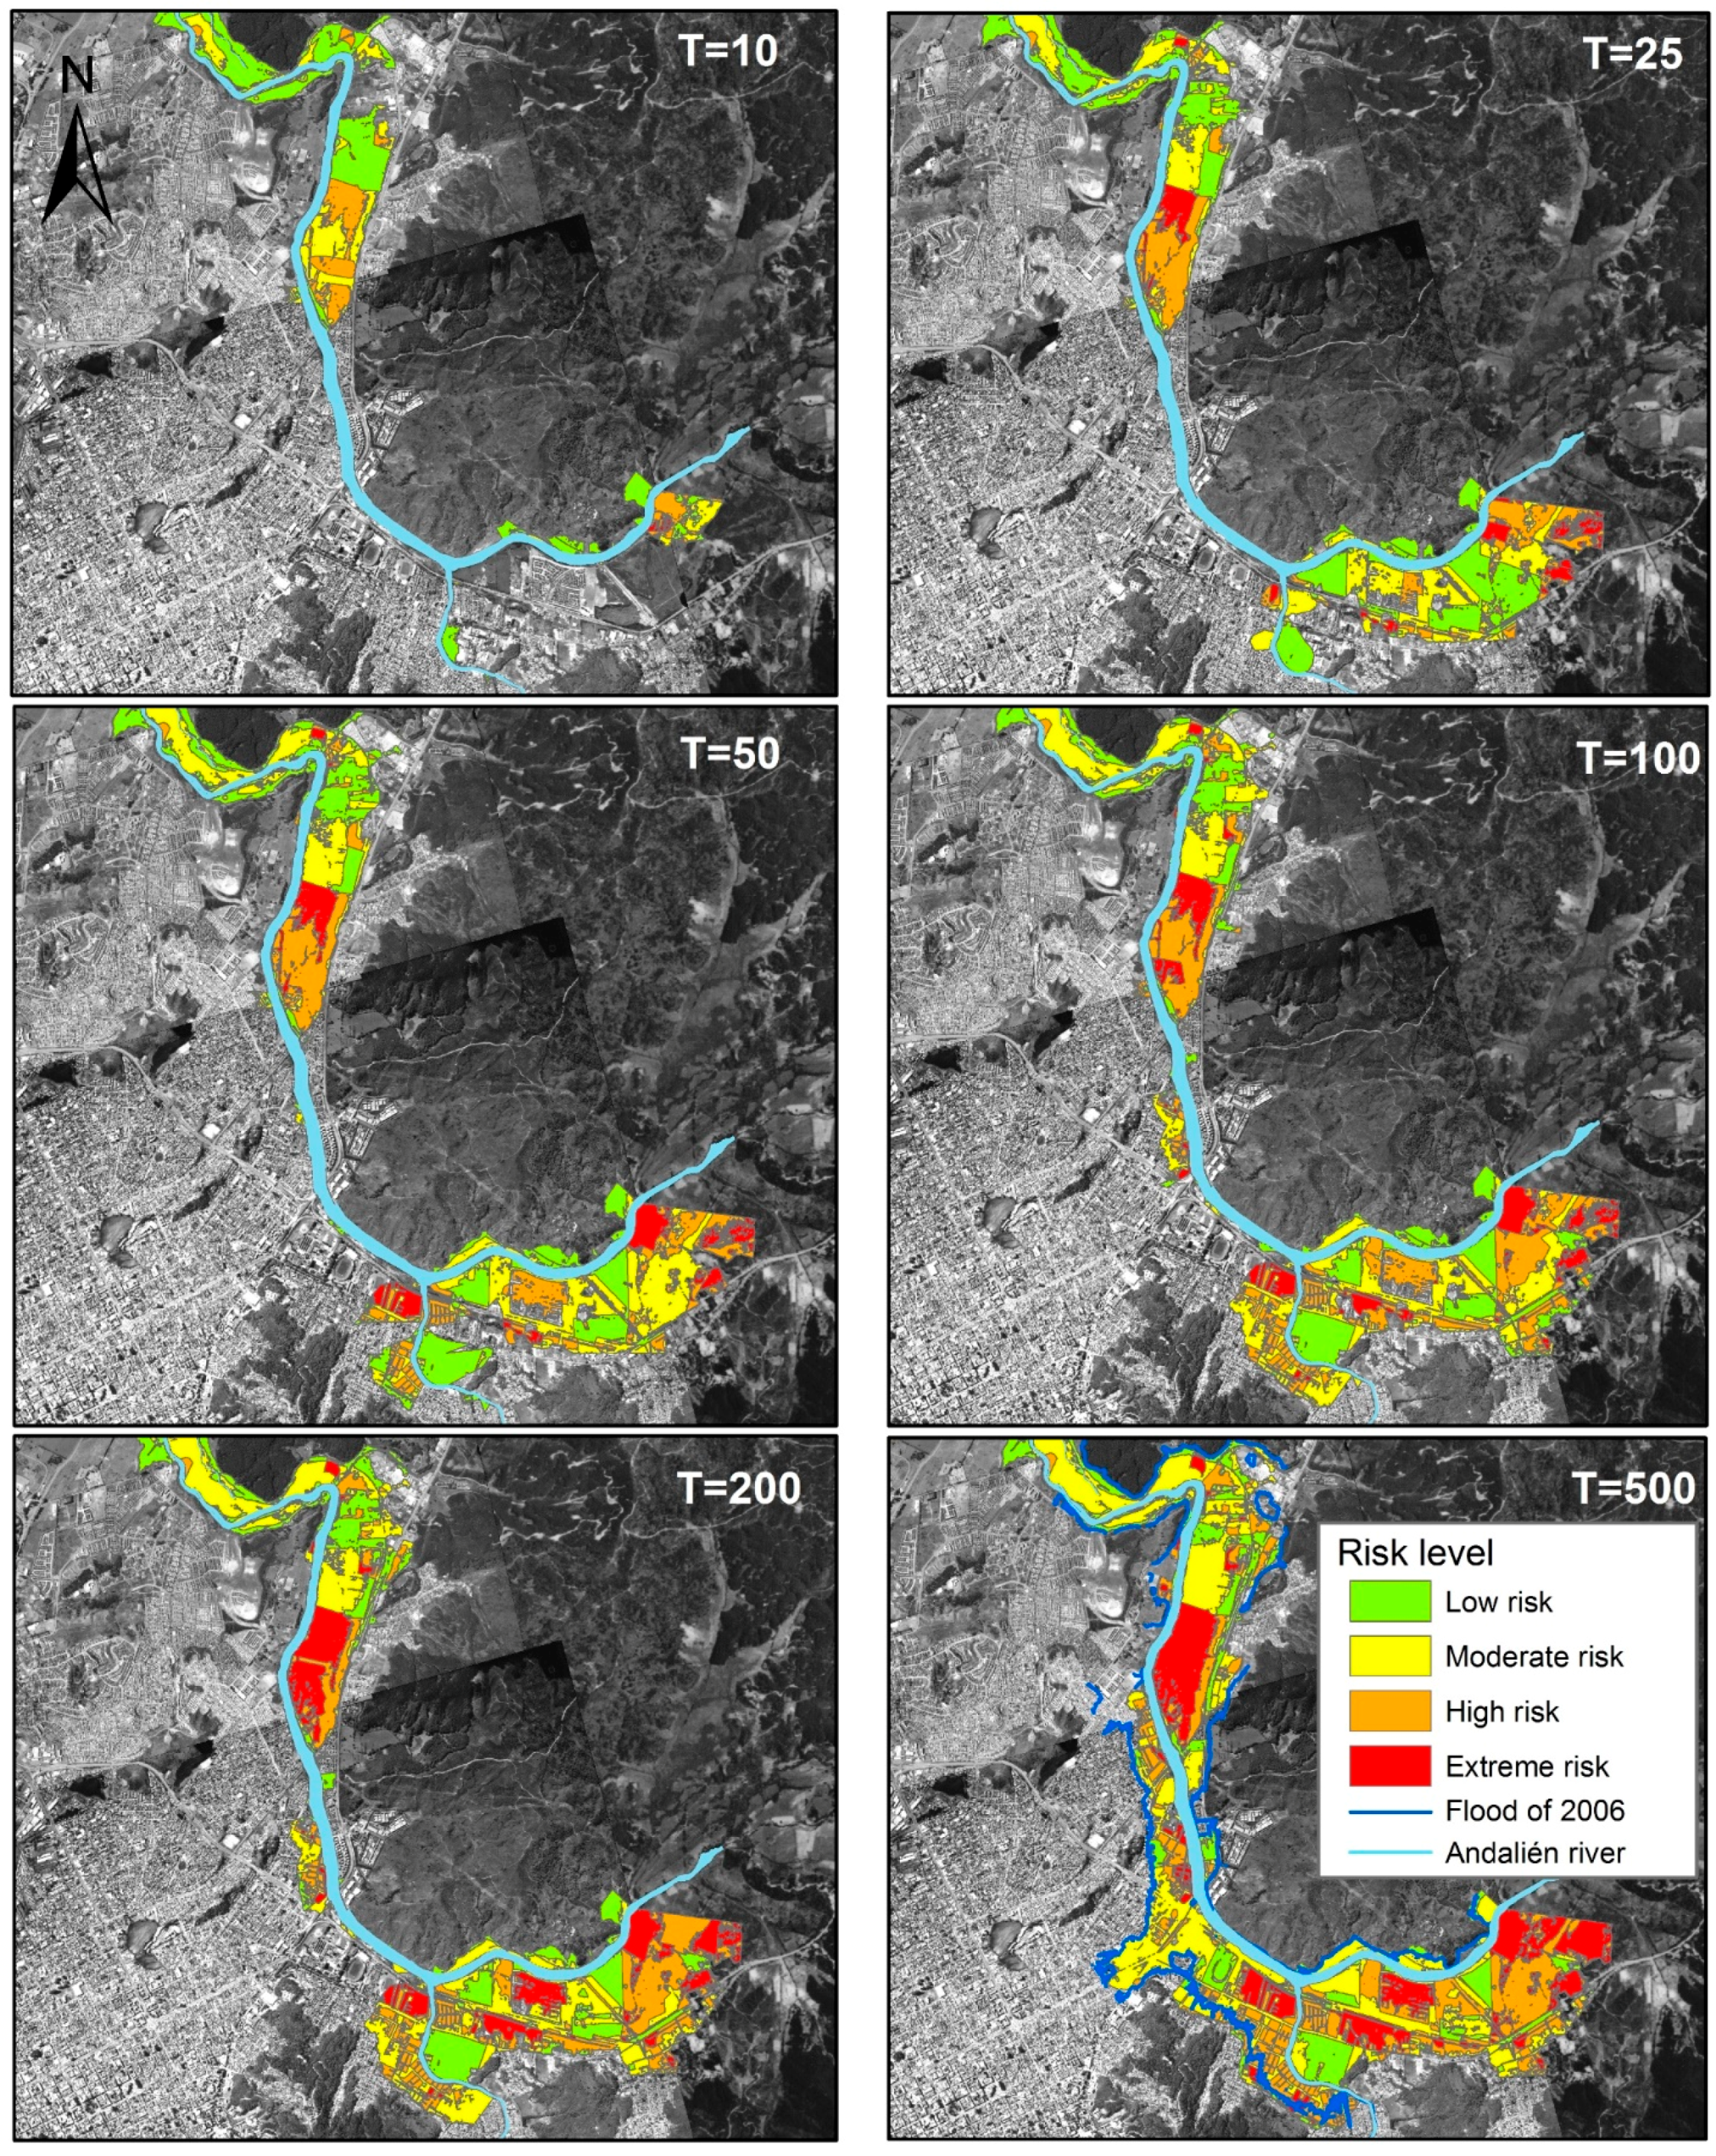
3.2. Analysis of River Disasters

In the lower reaches of the Andalien Basin, 21 flood events have occurred from 1960 to 2010. The magnitude of such events and the number of neighborhoods affected sharply increased during the period of 2000–2012. The hazard level analyzed by the period of return presented a low hazard at T = 2, T = 5, and T = 10 years, while for T = 200 and T = 500 the danger level increased considerably. Analysis performed showed that hazardous areas increased by 286% between the scenarios that correspond to an extreme period of return (T) between two and 500 years (Figure 6). By comparing Figure 3 and Figure 6, we can deduce that of the landforms, those mainly affected by the floods corresponded to the plain of Andalien River, the plain of Biobio River, salt marsh areas, dune zones, river vegetated islands, and estuary bars.
Flooded areas amounted to 695 ha at T = 2, and 863 ha at T = 10 (Figure 7); the maximum floodplain flow velocity and depth reached 0.65 m/s and 2.5 m, respectively. For T = 25, overflows spread to the upstream zone with the most urbanization and reached an affected area of 1083 ha. In these areas velocities of 0.35 m/s were reached at flow depths of approximately one meter. For T = 50 and T = 100 overflow zones of the channel were similar to those reported at T = 25, but with an extension of higher flooding (1143 ha and 1243 ha, respectively), velocity and maximum depths in areas with higher urbanization corresponded to 0.53 m/s and 1.5 m. For extreme events, T = 200 and T = 500, overflow areas significantly increased in built-up areas, reaching 1985 ha flooded at T = 500, with the maximum flow velocity and depth in floodplains reaching 0.55 m/s and approximately 2.1 m, respectively. The flooded area at high and extreme hazard levels increased significantly, comparing T = 2 and T = 500 at 373% and 1096%, respectively.
Changes were also seen in the relationship of the percentage of flooded areas according to land use, and the period of return (Figure 8). For T = 2, T = 5, and T=10 the percentage of flooded non-urbanized land represented approximately 97.3%, and built-up areas reached approximately 2.6% of the flooded area. At T = 25 and T = 50 non-urbanized areas flooded reached approximately 89%, and urban approximately 11%. In the extreme events of T = 100 to T = 500 early categories decreased to 80%, while the latter increased to approximately 20%. Furthermore, within the category of urbanized area, zones devoted specifically to residential, commercial, and industrial use were the most affected, having 15 ha flooded at T = 2, and up to 374 ha at T = 500. Meanwhile, areas for institutional services were relatively stable for the scenarios analyzed.
Regarding vulnerability analysis, were five categories of total vulnerability found in 3130 ha. 55% of the area showed very low vulnerability, which corresponded to areas without urban use, such as wetlands, vacant lots, and areas of low productivity (Figure 9). Areas of low vulnerability, including areas with sports facilities and venues, along with road networks was represented at 17%. The categories of moderate, high, and very high vulnerability accounted for 21%, 5%, and 2% of the area, respectively, and all were located in urbanized areas.
Risk level increased in direct proportion to the period of return (Figure 10). For T = 2, T = 5, and T = 10 it was estimated that 88% of the area was at a low level of risk, 8% was exposed to moderate risk, and 4% to high and extreme risk. At the intermediate levels of T = 25 and T = 50 the amount of area at low and moderate risk was 72% and 13%, respectively, while the high/extreme levels amounted to 15%. For extreme events between T = 100 and T = 500 risk levels were 52%, 28%, and 20% for categories low, moderate, and high/extreme, respectively.
The moderate, high, and extreme risk was concentrated in urban built-up areas for the different periods of return (Figure 11). Population at risk for a flood at T = 2 years was equivalent to 1903 people living in 901 homes, where 91 people were over 65 years, and 25 were disabled (Table 7). For the most extreme event evaluated, T = 500, more than 10,000 homes and approximately 40 thousand people could be flooded, of which 2469 would be 65 years or older, and 393 disabled.

4. Discussion

The built-up area of the CMA in the lower reaches of the Andalien Basin increased by 1457 ha in the last 68 years, an increase characteristic of coastal areas that have come to hold 50% of the world’s population [14,80]. Urban growth concentrated in 65% of the surface of accumulation reliefs, which are exposed to floods. Of these, 538 ha are located on the Andalien River floodplain. In fact, the accumulation reliefs recorded the highest hazard rates for flood risk in the city of Concepcion, due to their altitudes of <8 m, and slopes of less than 0.5° [43].
The occupation of the accumulation reliefs with higher risk of flooding in the Basin is associated with an increase in the exposure of infrastructures and people, in addition to the modifications in the river drainage network, which when decreasing their bankfull area, produce floods that are more frequent. This could be the direct explanation of the increase in neighborhoods affected by flooding events, which rose from an average of two per decade between 1960 and 1999, to 5.5 between 2000 and 2012 as reported in Rojas [79]. Our results are consistent with what is occurring globally, where urban flood damage is found to be increasingly intense, expensive, and unwieldy [81]. Worldwide, economic losses due to floods in the last ten years are ten times higher than those reported in 1960 [82]. Similar results were obtained in Europe, where the study of floods for the period of 1970–2005 showed 2000 and 2002 as recording the worst floods in 36 years, in relation to the damage produced [83].
However, the expansion of cities is part of development, and problems arise due to rapid urbanization without proper planning, which in turn increases vulnerability and exposure to risk due to the occupation of the floodplain [29,83,84,85]. In a study carried out in various districts of Latin American cities, it was deduced that in different cities, exposure to floods increased, and mostly in areas of low and mid-range [17,37]. This situation was repeated in our study area, showing an urban population that was vulnerable to flooding. In Noida, India, it was found that the urban development of 189 sectors during the last half of the twentieth century had increased small floods by 200%, signaling the growth of exposed areas and changes of flow rates as possible causes [15].
The hydraulic modeling carried out showed relative stability in relation to the small floods that occur at the period of return of two, five, and 10 years. Damage was concentrated in areas with low urbanization, corresponding to 100% of Reach-1 (mouth of the river to 6.2 km) and part of Reach-2. The concentration of damage in Reach-1 can be explained by the 50.3 ha loss of bankfull channel area in the period analyzed. For their part, the overflows in Reach-2 of the river may be related to the increased area of the bankfull channel by 20.2 ha, explained by flood management post-2006 which consisted in structural mitigation such as widening, channeling, and deepening the channel to generate new sections of the Andalien River and the Nonguen Stream [59].
Flood management through structural means post-flood 2006 allowed a decrease in the possibility of future flooding, which are now produced at a return period of 500 years, changing the frequency of downstream floods. This type of measure is a fundamental support for policies oriented at reducing risk in Chile, and have been applied in other zones of the CMA [43]. However, this does not mean the complete elimination of hazard in the area. As indicated by Gomes et al. [3]; Tingsanchali [4]; Liao et al. [7]; and Kumar [68], the sensation of security generated by these public works tends to attract more people to the river. However, the possibility of another major flood event outside the capacity of the design could destroy defenses, putting more people and property at risk than before.
Chilean urban planning permits urbanization in zones defined as at risk or of natural interest, such as wetlands, that are not total protected under current environment legislation. The latter implies that, if non-urbanized sites (wetlands, riverbeds) are designated for residential purposes, it is likely that the high level of investment for flood control will be insufficient. This, in turn, will generate new risk areas due to the expansion of cities, such as the case of the Mississippi River [86]. This dynamic was expressed in the analyzed period, where urbanization had taken place in a dispersed manner in areas that had ecosystem services to mitigate flooding [49]. The aggregate of these diverse mechanisms is an unsustainable housing model that has not considered natural spaces of the river during floods. In part, new development projects are taking place within the flood plain, which consist of single family homes valued at over $100,000 USD. These areas are potentially susceptible to flooding, with a return period of 100 years.
In this sense, areas with low topography from the river system have been converted into an important factor in higher flood risk, given that it eliminates the flood plains, as has happened in the Andalien River [87]. Our recommendation follows international experiences where the magnitude of impact can be reduced through flood management that involves structural and non-structural means [13,17,85,88]. Experience shows that a structural-only approach (barriers, canalizations) is insufficient. It has been shown that a non-structural approach can have high impact (river protection zones, wetlands, river restoration, flood and risk mapping). In the CMA, it is still possible to identify areas that can be used for this purpose such as extensive wetlands, which are at risk due to real-estate development. These considerations are a good tool for planners and those responsible for the formulation of future urban policy, while at the same time being able to determine the degree of impact of a flood is useful evidence for the development of these urban policies [13,22,89,90,91,92].

5. Conclusions

In the lower reaches of the Andalien River, increase of the built-up area by 1457 ha over the last 68 years has caused a modification of the drainage network, and a progressive increase in the risk of river flooding in geomorphological units susceptible to these processes. The city saw 65.3% growth in the accumulation relief area (quartz sand plain of Andalien River; sand dune plain and basaltic sand plain of Biobío River), mainly being flood-prone due to their low altitude at <8 m and slopes less than 0.5°. Furthermore, gradual growth of the city over time modified the drainage network. The Andalien River lost 50.3 ha from its bankfull channel in the lower reaches and increased 20.2 ha upstream, resulting in a net loss of −18.4% of its area.
Hazard analysis performed showed that areas increased by 286% between the scenarios corresponding to a period of return (T) between 2 and 500 years. Urban expansion that has been carried out is vulnerable to future flood events, for example, the area devoted to residential, commercial, and industrial use has increased its flood surface area by 15 ha at T = 2 to T = 374, and at T = 500 the number of people in the affected area increased by 37,380. These figures are expected to continue to rise due to building projects present in the sand floodplain of the Andalien River. For extreme events between T = 100 and T = 500, risk levels were 52%, 28%, and 20% for low, moderate, and high/extreme categories, respectively. For the most extreme event, evaluated at T = 500, more than 10,000 homes and approximately 40 thousand people could be affected by flood, of which 2469 people correspond to a population aged 65 years or older, and 393 would be disabled.
Flood management by the Chilean government since 2008 has reduced the risk of small flooding for events with a return period of two, five, and 10 years. However, for high periods of return, such as T = 500, the risk level remains high, in which case the flooded area would be similar to the extreme flooding event that occurred in 2006. For this reason, is necessary to rethink and improve urban planning and the response of Chilean cities in relation to flood hazards. While we recognize the importance of a reactive approach, there is an urgent need for proactive guidance to manage flood risk. In this sense, some useful measures include the preservation, maintenance and creation of green infrastructure within cities (mitigation parks and greenbelts). Additionally important is the active and integrated participation from societal actors and governmental institutions with the principles of sustainable urban development in harmony with the natural and built environment.

Acknowledgments

The Program FONDECYT No. 11150424, No. 1150459 & BECAS DOC-NACIONAL CONICYT (No. 21110383), Government of Chile funded this research. We appreciate the information provided by the Hydrographic and Oceanographic Service of the Chilean Navy (SHOA), and the Port Centre for Maritime Research CIMP of the Universidad Catolica de la Santisima Concepcion.

Author Contributions

Octavio Rojas had the original idea for this research and performed flood and risk modeling. María Mardones revised the writing of the manuscript. Carolina Rojas justified the arguments of urbanization and revised the writing of the manuscript. Carolina Martínez participated in data collection. Luis Flores was responsible for the preparation of topographical and bathymetric data. All authors have read and approved the final manuscript.

Conflicts of Interest

The authors declare no conflicts of interest.

References

  1. Lytle, D.A.; Poff, N.L. Adaptation to natural flow regimes. Trends Ecol. Evol. 2004, 19, 94–100. [Google Scholar] [CrossRef] [PubMed]
  2. Tockner, K.; Lorang, M.; Stanford, J.A. River flood plains are model ecosystems to test general hydrogeomorphic and ecological concepts. River Res. Appl. 2010, 86, 76–86. [Google Scholar] [CrossRef]
  3. Miguez, M.G.; Veról, A.P.; de Sousa, M.M.; Rezende, O.M. Urban Floods in Lowlands—Levee Systems, Unplanned Urban Growth and River Restoration Alternative: A Case Study in Brazil. Sustainability 2015, 7, 11068–11097. [Google Scholar] [CrossRef]
  4. Tingsanchali, T. Urban flood disaster management. Procedia Eng. 2012, 32, 25–37. [Google Scholar] [CrossRef]
  5. Walsh, R.; Davies, H.; Musa, S. Flood frequency and impacts at Khartoum since the early nineteenth century. Geogr. J. 1994, 160, 266–279. [Google Scholar] [CrossRef]
  6. Zevenbergen, C.; Veerbeek, W.; Gersonius, B.; van Herk, S. Challenges in urban flood management: Travelling across spatial and temporal scales. J. Flood Risk Manag. 2008, 1, 81–88. [Google Scholar] [CrossRef]
  7. Liao, K.; Le, T.A.; van Nguyen, K. Urban design principles for flood resilience: Learning from the ecological wisdom of living with floods in the Vietnamese Mekong Delta. Landsc. Urban Plan. 2016, 155, 69–78. [Google Scholar] [CrossRef]
  8. Adhikari, P.; Hong, Y.; Douglas, K.R.; Kirschbaum, D.B.; Gourley, J.; Adler, R.; Robert Brakenridge, G. A digitized global flood inventory (1998–2008): Compilation and preliminary results. Nat. Hazards 2010, 55, 405–422. [Google Scholar] [CrossRef]
  9. Güneralp, B.; Güneralp, I.; Liu, Y. Changing global patterns of urban exposure to flood and drought hazards. Glob. Environ. Chang. 2015, 31, 217–225. [Google Scholar] [CrossRef]
  10. Eissa, A.E.; Zaki, M.M. The impact of global climatic changes on the aquatic environment. Procedia Environ. Sci. 2011, 4, 251–259. [Google Scholar] [CrossRef]
  11. Broekx, S.; Smets, S.; Liekens, I.; Bulckaen, D.; de Nocker, L. Designing a long-term flood risk management plan for the Scheldt estuary using a risk-based approach. Nat. Hazards 2011, 57, 245–266. [Google Scholar] [CrossRef]
  12. Yin, J.; Ye, M.; Yin, Z.; Xu, S. A review of advances in urban flood risk analysis over China. Stoch. Environ. Res. Risk Assess. 2015, 29, 1063–1070. [Google Scholar] [CrossRef]
  13. Zope, P.E.; Eldho, T.I.; Jothiprakash, V. Impacts of urbanization on flooding of a coastal urban catchment: A case study of Mumbai City, India. Nat. Hazards 2014, 75, 887–908. [Google Scholar] [CrossRef]
  14. Garcia, E.; Loáiciga, H. Sea-level rise and flooding in coastal riverine flood plains. Hydrol. Sci. J. 2014, 37–41. [Google Scholar] [CrossRef]
  15. Singh, R.B.; Singh, S. Rapid urbanization and induced flood risk in Noida, India. Asian Geogr. 2011, 28, 147–169. [Google Scholar] [CrossRef]
  16. Miller, J.D.; Kim, H.; Kjeldsen, T.R.; Packman, J.; Grebby, S.; Dearden, R. Assessing the impact of urbanization on storm runoff in a peri-urban catchment using historical change in impervious cover. J. Hydrol. 2014, 515, 59–70. [Google Scholar] [CrossRef] [Green Version]
  17. Gomes, M.; Borba, F.; Canedo, L.; Vellozo, C. Planning and Design of Urban Flood Control Measures: Assessing Effects Combination. J. Urban Plan. Dev. 2009, 135, 100–109. [Google Scholar]
  18. Suriya, S.; Mudgal, B.V. Impact of urbanization on flooding: The Thirusoolam sub watershed—A case study. J. Hydrol. 2012, 412–413, 210–219. [Google Scholar] [CrossRef]
  19. Wheater, H.; Evans, E. Land use, water management and future flood risk. Land Use Policy 2009, 26 (Suppl. 1), S251–S264. [Google Scholar] [CrossRef]
  20. Beighley, R.E.; Melack, J.M.; Dunne, T. Impacts of California’s climatic regimens and coastal land use change on streamflow characteristics. J. Am. Water Resour. Assoc. 2003, 39, 1419–1433. [Google Scholar] [CrossRef]
  21. Baba, A. Impact of Urbanization on Channel Morphology: Some Comments. J. Environ. Sci. Toxicol. Food Technol. 2014, 8, 40–45. [Google Scholar]
  22. Chin, A. Urban transformation of river landscapes in a global context. Geomorphology 2006, 79, 460–487. [Google Scholar] [CrossRef]
  23. Nirupama, N.; Simonovic, S.P. Increase of Flood Risk due to Urbanisation: A Canadian Example. Nat. Hazards 2007, 40, 25–41. [Google Scholar] [CrossRef]
  24. Maaskant, B.; Jonkman, S.N.; Bouwer, L.M. Future risk of flooding: An analysis of changes in potential loss of life in South Holland (The Netherlands). Environ. Sci. Policy 2009, 12, 157–169. [Google Scholar] [CrossRef]
  25. Ntelekos, A.A.; Oppenheimer, M.; Smith, J.A.; Miller, A.J. Urbanization, climate change and flood policy in the United States. Clim. Chang. 2010, 103, 597–616. [Google Scholar] [CrossRef]
  26. Zhang, H.; Ma, W.; Wang, X. Rapid Urbanization and Implications for Flood Risk Management in Hinterland of the Pearl River Delta, China: The Foshan Study. Sensors 2008, 8, 2223–2239. [Google Scholar] [CrossRef] [PubMed]
  27. Morelli, S.; Segoni, S.; Manzo, G.; Ermini, L.; Catani, F. Urban planning, flood risk and public policy: The case of the Arno River, Firenze, Italy. Appl. Geogr. 2012, 34, 205–218. [Google Scholar] [CrossRef]
  28. Faccini, F.; Paliaga, G.; Piana, P.; Sacchini, A.; Watkins, C. Geomorphology The Bisagno stream catchment (Genoa, Italy) and its major floods: Geomorphic and land use variations in the last three centuries. Geomorphology 2016, 273, 14–27. [Google Scholar] [CrossRef]
  29. Sowmya, K.; John, C.M.; Shrivasthava, N.K. Urban flood vulnerability zoning of Cochin City, southwest coast of India, using remote sensing and GIS. Nat. Hazards 2014, 75, 1271–1286. [Google Scholar] [CrossRef]
  30. Serre, D.; Barroca, B.; Diab, Y. Urban flood mitigation: Sustainable options. WIT Trans. Ecol. Environ. 2010, 129, 299–309. [Google Scholar]
  31. Hansson, K.; Larsson, A.; Danielson, M.; Ekenberg, L. Coping with Complex Environmental and Societal Flood Risk Management Decisions: An Integrated Multi-criteria Framework. Sustainability 2011, 3, 1357–1380. [Google Scholar] [CrossRef]
  32. Su, W.; Ye, G.; Yao, S.; Yang, G. Urban Land Pattern Impacts on Floods in a New District of China. Sustainability 2014, 6, 6488–6508. [Google Scholar] [CrossRef]
  33. Gaume, E.; Bain, V.; Bernardara, P.; Newinger, O.; Barbuc, M.; Bateman, A.; Blaškovičová, L.; Blöschl, G.; Borga, M.; Dumitrescu, A.; et al. A compilation of data on European flash floods. J. Hydrol. 2009, 367, 70–78. [Google Scholar] [CrossRef]
  34. Arman, H.; Yuksel, I.; Saltabas, L.; Goktepe, F.; Sandalci, M. Overview of flooding damages and its destructions: A case study of Zonguldak-Bartin basin in Turkey. Nat. Sci. 2010, 2, 409–417. [Google Scholar] [CrossRef]
  35. Djordjević, S.; Butler, D.; Gourbesville, P.; Mark, O.; Pasche, E. New policies to deal with climate change and other drivers impacting on resilience to flooding in urban areas: The CORFU approach. Environ. Sci. Policy 2011, 14, 864–873. [Google Scholar] [CrossRef] [Green Version]
  36. Rahman, A.; Nawaz, A. Analysis of flood causes and associated socio-economic damages in the Hindukush region. Nat. Hazards 2011, 59, 1239–1260. [Google Scholar] [CrossRef]
  37. Romero-Lankao, P.; Hughes, S.; Qin, H.; Hardoy, J.; Rosas-Huerta, A.; Borquez, R.; Lampis, A. Scale, urban risk and adaptation capacity in neighborhoods of Latin American cities. Habitat Int. 2014, 42, 224–235. [Google Scholar] [CrossRef]
  38. Kundzewicz, Z.W.; Schellnhuber, H. Floods in the IPCC TAR perspective. Nat. Hazards 2004, 31, 111–128. [Google Scholar] [CrossRef]
  39. Rojas, O.; Mardones, M.; Arumí, J.; Aguayo, M. Una revisión de inundaciones fluviales en Chile, período 1574–2012: Causas, recurrencia y efectos geográficos. Rev. Geogr. Norte Gd. 2014, 57, 177–192. [Google Scholar] [CrossRef]
  40. Romero, H.; Vásquez, A. Evaluación ambiental del proceso de urbanización de las cuencas del piedemonte andino de Santiago de Chile. EURE 2005, 31, 97–118. [Google Scholar] [CrossRef]
  41. Müller, A. Flood risks in a dynamic urban agglomeration: A conceptual and methodological assessment framework. Nat. Hazards 2013, 65, 1931–1950. [Google Scholar] [CrossRef]
  42. Instituto Nacional de Estadistica (INE). Censo de Población y Vivienda; INE: Lisbon, Portugal, 2002. [Google Scholar]
  43. Mardones, M.; Vidal, C. La zonificación y evaluación de los riesgos naturales de tipo geomorfológico: Un instrumento para la planificación urbana en la ciudad de Concepción. EURE 2001, 27, 97–122. [Google Scholar] [CrossRef]
  44. Vidal, C.; Aravena, H.R. Efectos ambientales de la urbanización de las cuencas de los ríos Bíobío y Andalién sobre los riesgos de inundación y anegamiento de la ciudad de Concepción. In Concepción Metropolitano (AMC). Planes, Procesos y Proyectos; Pérez, L., Hidalgo, R., Eds.; Instituto de Geografía, Pontificia Universidad Católica de Chile: Santiago, Chile, 2010. [Google Scholar]
  45. Ministerio de Planificación y Cooperación Nacional (MIDEPLAN). Estrategia Para el Desarrollo Regional. La Región del Biobío al Encuentro del Siglo XXI; SERPLAC: Concepción, Chile, 1991. [Google Scholar]
  46. Mardones, M.; Hernanández, H.; Pacheco, A.; Millán, J. Geografía de la Región del Biobío. VIII Región, Colección de Geografía de Chile; Instituto Geográfico Militar: Santiago, Chile, 2001. [Google Scholar]
  47. Rojas, C.; Salado, M.; Pino, J.; Martori, J. Medidas para la valoración de la sostenibilidad de los territorios metropolitanos: Aplicación al área metropolitana de Concepción (Chile). Boletín Geógrafos Españoles (AGE) 2011, 55, 81–99. [Google Scholar]
  48. Pauchard, A.; Aguayo, M.; Peña, E.; Urrutia, R. Multiple effects of urbanization on the biodiversity of developing countries: The case of a fast-growing metropolitan area (Concepcion, Chile). Biol. Conserv. 2006, 127, 272–281. [Google Scholar] [CrossRef]
  49. Smith, P.; Romero, H. Efectos del crecimiento urbano del Área Metropolitana de Concepcion sobre los humedales de Rocuant-Andalien, Los Batros y Lenga. Rev. Geogr. Norte Gd. 2009, 43, 81–93. [Google Scholar]
  50. Rojas, Q.; Plata, W. Área Metropolitana de Concepción: Factores espaciales explicativos de su crecimiento urbano reciente (2001–2009) por medio de un Modelo de Regresión Logística Espacial. In Actas I Congreso Internacional de Ordenamiento Territorial y Tecnologías de la Información Geográfica; Pineda, M.C., Bosque, J., Eds.; Universidad de Alcalá: Tegucigalpa, Honduras, 2010. [Google Scholar]
  51. Salinas, E.; Pérez, L. Procesos urbanos recientes en el Área Metropolitana de Concepcion: Transformaciones morfológicas y tipologías de ocupación. Rev. Geogr. Norte Gd. 2011, 49, 79–97. [Google Scholar] [CrossRef]
  52. Rojas, C.; Pino, J.; Basnou, C.; Vivanco, M. Assessing land-use and -cover changes in relation to geographic factors and urban planning in the metropolitan area of Concepcion (Chile). Implications for biodiversity conservation. Appl. Geogr. 2013, 39, 93–103. [Google Scholar] [CrossRef]
  53. Rojas, O.; Mardones, M. Inundaciones Fluviales en una cuenca costera del centro sur de Chile (1960–2010). Tendencias, recurrencia y relación con el fenómeno ENSO. In XXXIV Congreso Nacional y XIX Internacional de Geografía; Universidad del Biobío: Concepción, Chile, 2013. [Google Scholar]
  54. Mardones, M.; Echeverría, F.; Jara, C. Una contribución al estudio de los desastres naturales en Chile Centro Sur: Efectos ambientales de las precipitaciones del 26 de junio del 2005 en el área Metropolitana de Concepcion. Investigaciones Geográficas Chile 2004, 38, 1–25. [Google Scholar] [CrossRef]
  55. Jaque, E. Análisis Integrado de los Sistemas Naturales del Río Andalien. Ph.D. Thesis, Centro EULA, Universidad de Concepcion, Concepcion, Chile, 1996. [Google Scholar]
  56. Hernández, T. Caracterización Hidrológica y Geomorfológica del río Andalien; Memoria para optar al Título de Ingeniero Civil; Universidad de Concepcion: Concepcion, Chile, 1999. [Google Scholar]
  57. Devynck, J. Contribución al Conocimiento de la Circulación Atmosférica en Chile y al Clima de la Región del Biobío; Universidad de Concepción: Concepcion, Chile, 1970. [Google Scholar]
  58. Arrau Ingeniería. Estudio de Factibilidad y Diseño Definitivo de las Obras de Regulación y Retención de Sedimentos en Río Andalién, Región del Bío–Bío; Dirección de Obras Hidráulicas Gobierno de Chile: Santiago, Chile, 2012. [Google Scholar]
  59. CONAMA (Comisión Nacional de Medio Ambiente). Diseño de Obras Fluviales Río Andalién, Esteros Nonguén y Palomares, VIII Región del Bío Bío OBRAS RIO ANDALIÉN; Resolución Exenta N° 267; CONAMA: Concepción, Chile, 2008. [Google Scholar]
  60. Araujo, R.; Silva, G.; Freitas, D.; Klein, A. Georreferenciamiento de fotografías aéreas e análise da variação da linha de costa. In Métodos en Teledetección Aplicada a la Prevención de Riesgos Naturales en el Litoral; Alcántara-Carrió, J., Correa, I., Isla, F., Alvarado, M., Klein, A., Cabrera, J., Barlow, R., Eds.; CYTED: Madrid, Spain, 2009; pp. 123–138. [Google Scholar]
  61. Ilabaca, P. Evolución de la costa de Concepción: El caso de las bahías de Concepción y San Vicente. Biol. Pesq. 1989, 18, 29–35. [Google Scholar]
  62. CIER-SERPLAC (Centro de Estudios Regionales-Secretarías Regionales de Planificación y Coordinación). Carta Geológica Concepción Metropolitano. Escala 1:50.000; CIER-SERPLAC: Concepción, Chile, 1977. [Google Scholar]
  63. Schumm, S. The Fluvial System; John Wiley & Sons: New York, NY, USA, 1977. [Google Scholar]
  64. Mann, H.B. Non-parametric tests against trend. Econometrica 1945, 13, 245–259. [Google Scholar] [CrossRef]
  65. Kendall, M.G. Rank Correlation Methods, 4th ed.; Charles Griffin: London, UK, 1975. [Google Scholar]
  66. Sen, P.K. Estimates of the regression coefficient based on Kendall’s tau. J. Am. Stat. Assoc. 1968, 63, 1379–1389. [Google Scholar] [CrossRef]
  67. Rojas, O.; Martínez, C. Riesgos naturales: Evolución y modelos conceptuales. Rev. Univ. Geogr. 2011, 20, 83–116. [Google Scholar]
  68. Kumar, R. Flood hazard assessment of 2014 floods in Sonawari sub-district of Bandipore district (Jammu & Kashmir): An application of geoinformatics. Remote Sens. Appl. Soc. Environ. 2016, 4, 188–203. [Google Scholar]
  69. Defra Environment Agency. Flood and Coastal Defence R&D Programme, Flood Risks to People Phase 2. Project Record; Environment Agency: London, UK, 2006.
  70. Brunner, G.W. HEC-RAS, River Analysis System Hydraulic Reference Manual; US Army Corps of Engineers Hydrologic Engineering Center: Davis, CA, USA, 2010. [Google Scholar]
  71. ESRI (Environmental Systems Research Institute). ArcGIS 9.3; ESRI: Redlands, CA, USA, 2009. [Google Scholar]
  72. Barnes, H. Roughness Characteristics of Natural Channels; USGS: Washington, DC, USA, 1967. [Google Scholar]
  73. Inostroza, A. Crecidas en el Andalien Bajo: Análisis Hidráulico de las Intervenciones en su Planicie de Inundación; Memoria para optar al titulo de Ingeniero Civil; Universidad de Concepcion: Concepcion, Chile, 2005. [Google Scholar]
  74. GESITRAN (Plataforma Tecnológica para la Gestión Integral del Sistema de Transporte de la Región del Biobío). Usos de suelo Comuna de Concepción Año 2014; Formato Digital SHP; Universidad de Concepción: Concepción, Chile, 2014. [Google Scholar]
  75. CONAF (Comisión Nacional Forestal). Usos de Suelo Región del Bío-Bío Año 2008 (Formato Digital SHP); CONAF: Santiago, Chile, 2008. [Google Scholar]
  76. Rojas, O. Evaluación del Riesgo de Inundación Fluvial en el Curso Inferior de la Cuenca del río Carampangue. Bachlor’s Tesis, Universidad de Concepcion, Concepcion, Chile, 2010. [Google Scholar]
  77. Tanavud, C.; Yongchalermchai, C.; Bennui, A.; Densreeserekul, O. Assessment of flood risk in Hat Yai municipality, Southern Thailand, using GIS. J. Nat. Disaster Sci. 2004, 26, 1–14. [Google Scholar] [CrossRef]
  78. Mardones, M. El Sitio Geomorfológico de las Ciudades de Concepción y Talcahuano; Instituto de Antropología, Historia y Geografía, Universidad de Concepción: Concepción, Chile, 1978. [Google Scholar]
  79. Rojas, O. Cambios Ambientales y Dinámica de Inundaciones Fluviales en una Cuenca Costera del Centro sur de Chile. Ph.D. Thesis, Centro EULA, Universidad de Concepción, Concepción, Chile, 2015. [Google Scholar]
  80. Bárcena, J.F.; García, A.; Gómez, A.G.; Álvarez, C.; Juanes, J.A.; Revilla, J.A. Estuarine, Coastal and Shelf Science Spatial and temporal flushing time approach in estuaries influenced by river and tide. An application in Suances Estuary (Northern Spain). Estuar. Coast. Shelf Sci. 2012, 112, 40–51. [Google Scholar] [CrossRef]
  81. Jha, A.; Lamond, J.; Bloch, R.; Bhattacharya, N.; Lopez, A.; Papachristodoulou, N.; Bird, A.; Proverbs, D.; Davies, J.; Barker, R. Five Feet High & Rising: Cities & Flooding in the 21st Century; Policy Research Working Paper 5648; The World Bank, East Asia & Pacific Region, Transport, Energy & Urban Sustainable Development Unit: Washington, DC, USA, 2011. [Google Scholar]
  82. Berz, G. Flood disasters: Lessons from the past—Worries for the future. Proc. Inst. Civ. Eng. Water Marit. Eng. 2000, 142, 3–8. [Google Scholar] [CrossRef]
  83. Barredo, J.I. Major flood disasters in Europe: 1950–2005. Nat. Hazards 2006, 42, 125–148. [Google Scholar] [CrossRef]
  84. Ghani, A.A.; Chang, C.K.; Leow, C.S.; Zakaria, N.A. Sungai Pahang digital flood mapping: 2007 flood. Int. J. River Basin Manag. 2012, 10, 139–148. [Google Scholar] [CrossRef]
  85. Wei, Y.D.; Ye, X. Urbanization, urban land expansion and environmental change in China. Stoch. Environ. Res. Risk Assess. 2014, 28, 757–765. [Google Scholar] [CrossRef]
  86. White, G.; Calef, W.; Hudson, J.; Mayer, H.; Sheaffer, J.; Volk, D. Changes in Urban Occupance of Flood Plains in the United States; University of Chigago: Chicago, IL, USA, 1958. [Google Scholar]
  87. Hattermann, F.F.; Kundzewicz, Z.W.; Huang, S.; Vetter, T.; Gerstengarbe, F.-W.; Werner, P. Climatological drivers of changes in flood hazard in Germany. Acta Geophys. 2013, 61, 463–477. [Google Scholar] [CrossRef]
  88. Aneas, S. Riesgos y Peligros: Una Visión Desde la Geografía. Available online: http://www.ub.edu/geocrit/sn-60.htm (accessed on 25 January 2017).
  89. Merz, B.; Hall, J.; Disse, M.; Schumann, A. Fluvial flood risk management in a changing world. Nat. Hazards Earth Syst. Sci. 2010, 10, 509–527. [Google Scholar] [CrossRef]
  90. Masood, M.; Takeuchi, K. Assessment of flood hazard, vulnerability and risk of mid-eastern Dhaka using DEM and 1D hydrodynamic model. Nat. Hazards 2012, 61, 757–770. [Google Scholar] [CrossRef]
  91. Kadam, P.; Sen, D. Flood inundation simulation in Ajoy River using MIKE-FLOOD. ISH J. Hydraul. Eng. 2012, 18, 129–141. [Google Scholar] [CrossRef]
  92. Morelli, S.; Battistini, A.; Catani, F. Rapid assessment of flood susceptibility in urbanized rivers using digital terrain data: Application to the Arno river case study (Firenze, northern Italy). Appl. Geogr. 2014, 54, 35–53. [Google Scholar] [CrossRef]
Figure 1. Area of study. (a,b) indicates the South American and regional context; (c) Situation of the basin with altitudes ranges with the blue quadrant showing the area of study presented in image (d); (d) Lower section of basin, dotted line indicates fluvial reach used to evaluate geomorphic changes in the channel. The red line indicates the boundary of basin. The dotted line indicates fluvial reach used to evaluate geomorphic changes in the channel.
Sustainability 09 00195 g001
Figure 2. Interview of Mrs. Adelina Varela (Sector General Bonilla).
Sustainability 09 00195 g002
Figure 3. Geomorphology of the site of the city of Concepción of the Andalien River basin, 1943.
Sustainability 09 00195 g003
Figure 4. Expansion of the city of Concepcion over the geomorphological units of the Andalien Basin 1943–2011.
Sustainability 09 00195 g004
Figure 5. Relationship between bankfull area, built-up area and neighborhoods affected by floods in the period 1943–2011. For each series, the percentages of change are expressed in function of the start of the registered period.
Sustainability 09 00195 g005
Figure 6. Flood hazard for different return period (T, in years) Andalien River Basin.
Sustainability 09 00195 g006
Figure 7. Area flooded (ha) according to hazard levels and period of return.
Sustainability 09 00195 g007
Figure 8. Flood area (%) by use of land according to periods of return.
Sustainability 09 00195 g008
Figure 9. Total vulnerability in the lower reaches of the Basin.
Sustainability 09 00195 g009
Figure 10. Area (ha) of risk by levels and period of return.
Sustainability 09 00195 g010
Figure 11. Risk of flood for different return periods. T = 500 maximum limit flood of 2006.
Sustainability 09 00195 g011
Table 1. Pixel Representativeness (PR) and root mean square error (RMSE).
YearScaleControl Points (GCPs)DPIPR (m)RMSE
194340,0001412000.851.57
195570,0002012001.482.26
196120,0001712000.421.50
197830,0001512000.641.60
199220,0001612000.422.16
199870,0001224000.740.24
201130,0002612000.641.31
Table 2. Vulnerable elements.
FactorThematic LayersWeight (%)Individual ClassesScore
ExposureNumber of habitants/block0.230–2210–2
222–5253–4
526–7185–6
719–9757–8
976–21849–10
ExposureNumber of households/block0.140–1190–2
118–2173–4
218–3145–6
315–4127–8
412–4899–10
VulnerabilityPopulation > than 65 years/block0.170–310–2
32–573–4
58–825–6
83–1077–8
108–1279–10
VulnerabilityDisabled population/block0.110–160–2
17–303–4
31–445–6
45–577–8
58–689–10
VulnerabilityPredominant construction material0.18Concrete, Steel2
Masonry4
Mixed6
Wood, Partitions8
Waste10
VulnerabilityPredominant use of land0.17Bodies of water0
Swamps and shrubs2
Agriculture4
Public service areas and facilities6
Institutional and governmental8
Residential, commercial, industrial10
Table 3. Risk matrix for river flooding.
VulnerabilityHazard
Low (1)Moderate (2)High (3)Extreme (4)
Very low (1)1234
Low (2)2468
Moderate (3)36912
High (4)481216
Extreme (5)5101520
Risk rank: Low (1–3), Moderate (4–6), High (8–10), Extreme (12–20).
Table 4. Variation in built-up area (ha) and the geomorphological units (1943–2011). Significant trends of change are indicated in bold.
Units19432011Variation (ha)R2Slopep-Value
Built-up areas4081865.81457.60.97022.5490.0001
Artificial fill soils74115.841.50.004−0.0930.8931
Salt marshes548576.628.30.8480.3340.0032
Estuary bar6583.718.50.5080.2600.0723
Marsh79.01.80.3660.0170.1503
Dunes117118.60.90.0240.0290.7425
Sandy Beach2828.3−0.20.139−0.0390.4095
Biobio Paleochannel2524.4−0.60.366−0.0060.1503
Lakes1312.4−0.80.360−0.0080.1544
Sand spit9.56.0−3.60.378−0.0900.1419
Vegetated island64.356.9−7.40.765−0.1540.0100
Inselberg34.24.1−30.10.828−0.5020.0044
Biobio River Sand Plain364.2309.9−54.40.802−0.9720.0064
Wave-cut Platform882.3686.0−196.30.867−2.8140.0023
Ridges of Water Erosion8528.78189.6−339.10.914−4.8900.0008
Sand Dune Plain547.7196.9−350.80.978−5.357<0.0001
Andalien River Sand Plain1696.61157.8−538.80.946−8.1740.0002
Table 5. Evolution of the bankfull area (ha) of the main water courses in the lower reaches of the Basin. Numbers in bold indicate the minimum and maximum figure for each section of the drainage network.
YearReach-1Reach-2Total Reach 1+2Reach-3Total Andalien River
1943106.957.3164.218.3182.5
1955112.153.2165.313.5178.8
1961101.541.3142.813.5156.3
197891.760.3152.010.9162.9
199299.759.8159.610.9170.4
199886.868.6155.415.6171.0
201156.677.5134.017.1151.1
Table 6. The Mann-Kendall Test for the evolution bankfull area and total length of the river drainage network.
Parameterp-ValueTrend Parameterp-ValueTrend
Total Length reach (1 + 2 + 3)*−0.134Bankfull area Reach-1*−6.324
Length Reach-1 *0.152Bankfull area Reach-2+3.864
Length Reach-2**−0.294Total bankfull Reach-3 0.000
Total Length Reach-3+−0.036Total bankfull area (1 + 2 + 3) −3.008
Statistical significance level: + p < 0.1; * p < 0.05; ** p < 0.01. Dates: ↓ indicates a decreasing tendency; ↑ indicates an increasing tendency.
Table 7. Population and households affected according to return period.
Return PeriodNumber of HabitantsNumber of HouseholdsPopulation >65 YearsDisabled Population
T219039019125
T53687141224049
T105505188331268
T2597222997442119
T5015,7804658838192
T10023,24063061343363
T20024,89871011425393
T50039,28310,5702469717

