The Safety of Transnational Imported Second-Hand Cars: A Case Study on Vehicle-to-Vehicle Crashes in Romania


1
College of Political, Administrative and Comunication Sciences, Babeş-Bolyai University of Cluj-Napoca, Minerilor Street, 85, 400409 Cluj-Napoca, Romania
2
Bielefeld Graduate School in History and Sociology, Bielefeld University, Universitätsstraße 25, 33615 Bielefeld, Germany
3
Faculty of Geography, Babeş-Bolyai University of Cluj-Napoca, Clinicilor Street, 5-7, 400006 Cluj-Napoca, Romania
4
Regional Economics Department, University of Miskolc, 3515 Miskolc-Egyetemvaros, Hungary
*
Author to whom correspondence should be addressed.
†
All authors contributed equally to the research presented in this paper and to the preparation of the final manuscript.
Sustainability 2017, 9(12), 2380; https://doi.org/10.3390/su9122380
Submission received: 19 November 2017
/
Revised: 8 December 2017
/
Accepted: 13 December 2017
/
Published: 20 December 2017
Abstract
:Certain features of imported second-hand cars (e.g., age, degree of wear and tear, technical design) can increase their likelihood for traffic crashes. Three official datasets which cover an eight year period (2008–2015) are used to test the connection between importation of second-hand cars and different types of traffic crashes. The traffic crashes database was provided by the Traffic Department of the General Inspectorate of Romanian Police (GIRPTD). The car registration database was provided by Driving-License and Vehicles-Registration Direction (DLVRD). Right-hand driving (RHD) cars database was provided by the Romanian Automotive Registry (RAR). A spatio-temporal visualization of data was performed using Geographic Information System (GIS) while for the statistical analysis we use regression models and Pearson-Correlation-coefficient. The analysis suggests that a significant part of the variation in the volume of traffic accidents can be explained by the volume of imported second-hand cars at the county level. Moreover, an even stronger direct relation exists between the number of imported second-hand cars and Severe Traffic Accidents but also in the case of RHD imported second-hand cars. The overall impact of imported second-hand cars on the traffic safety in Romania is significant but small in comparison to other types of car registration. Study results belong to the category of empirical evidence production which can improve the quality of existing traffic regulations focused both on organizing and ensuring traffic safety, and on the policy of sustainable transport infrastructure development.
1. Introduction
The mobility regime in Romania has suffered important changes in the aftermath of the communist regime collapse, moving towards increasing spatial mobility and decreasing level of traffic safety [1]. A number of well researched factors have contributed to this situation—e.g., the growth of the motorization’s rate or the transport infrastructure’s slow modernization [2]—but also, as we argue in this article, an ongoing and less researched phenomenon, the importation of second-hand vehicles.
The existing research provides detailed accounts of why imported second-hand cars are comparatively predisposed to road crashes. A first possible explanation is that price is a central element in the trade with imported second-hand cars [3,4] and that the major options to keep the prices low are either to import cars with a high degree of wear and tear [4,5] or to ship in older cars [6,7]. Along these lines, several studies argue that passenger(s) of the older cars tend to be in higher risk of injuries [8] compared to the passengers in the newer vehicles in case of collusion [9,10,11] or that various attributes of the vehicles involved in traffic crashes related to the wear level (e.g., higher mileage, undisclosed crash damages) influences to a large extent the likelihood and severity of a traffic crash [11,12,13,14,15].
The second explanation is related to the informal character of the trade with used vehicles where traders can import second-hand cars with various mechanical defects or flaws [4,6]. In this vein, poor mechanical condition is considered a leading cause for traffic crashes in several studies [10,14,16] where, for instance, it is argued that vehicles 15 years and older are 2.5 more likely to be involved in traffic crashes due to mechanical problems.
A third explanation is that many imported second-hand cars are designed to be used in different areas/purposes than those they tend to be used. The scholarship on this topic points especially towards the case of the Right-Hand-Drive (RHD) vehicles which are imported and used in countries with Left-Hand-Drive (LHD) systems or vice-versa [6]. In a study on car importation from Japan into British Columbia, Canada, Cooper [17] shows that when driving within an opposite-side control environment, ergonomic and visibility problems are expected to occur which may lead to higher probability (over 40%) of crash involvement. In similar lines, Bari [18] shows that in the case of LHD trucks coming from EU operating in the UK (RHD system), the relative risk for personal injury was higher by 61% compared to similar vehicles operating in the UK on RHD system.
In summary, while the existing research provides detailed accounts of how and why imported second-hand cars are comparatively predisposed to road crashes, it focuses on specific regions or countries from Africa or America which have a long tradition of importing second-hand cars and ignores other areas where the phenomenon is newer but it has at least similar momentum and significance.
2. Materials and Methods
2.1. The Study Area and Database
According to the latest available statistics, Romania has a population of about 19.9 million inhabitants [19]. Administratively speaking, the country is divided into 41 counties (NUTS-3 units) plus the municipality of Bucharest (The names and abbreviations of the counties in Romania are: AB—Alba; AG—Argeș; AR—Arad; B—București; BC—Bacău; BH—Bihor; BN—Bistrița-Năsăud; BR—Brăila; BT—Botoșani; BV—Brașov; BZ—Buzău; CJ—Cluj; CL—Călărași; CS—Caraș-Severin; CT—Constanța; CV—Covasna; DB—Dâmbovița; DJ—Dolj; GJ—Gorj; GL—Galați; GR—Giurgiu; HD—Hunedoara; HR—Harghita; IF—Ilfov; IL—Ialomița; IS—Iași; MH—Mehedinți; MM—Maramureș; MS—Mureș; NT—Neamț; OT—Olt; PH—Prahova; SB—Sibiu; SJ—Sălaj; SM—Satu Mare; SV—Suceava; TL—Tulcea; TM—Timiș; TR—Teleorman; VL—Vâlcea; VN—Vrancea; VS—Vaslui). Due to this institutional design, the NUTS-3 level is used to collect data by public institutions, including the three databases used for this research which are detailed below.
2.1.1. Crash Database
The crash database was provided by the General Inspectorate of Romanian Police, Traffic Department (GIRPTD). It includes detailed information about every single crash event, such as date and time, GPS coordinates, number and type of casualties (minor, sever or death) and other details for the period 2008–2015 (At the moment when this research was carried out, the data were available until 2015 in the case of two of the three databases). The information of every event is updated for 90 days, depending on how the investigation progresses and on how the condition of victims evolves. Not all traffic crashes are recorded in this database, but only those of substantial gravity, which require the response of a traffic police squad (for more details see [1,20]). In studies with similar research questions it was argued that at least a 3 year period of crash records is needed to obtain reliable results [21,22,23]. Additionally, to increase the accuracy of this study, the authors have used only vehicle-to-vehicle crashes in order to avoid confounding effects associated with the other types of crashes [24].
2.1.2. Registered Vehicles Database
This database was provided by the Driving License and Vehicles Registration Direction (DLVRD) and it includes the registered vehicles in Romania in the period 2008–2015. There are three types of registered vehicles which are included in this database: domestic second-hand vehicles (cars previously sold as new or used on the Romanian market which have been re-registered); new vehicles (cars that were manufactured outside or in Romania and were sold and registered for the first time in Romania); and imported second-hand vehicles (cars that have been firstly registered outside Romania and then have been imported as used items and registered in Romania). The vehicles included in this database refers only to the M1 and N1 vehicle categories [25].
2.1.3. RHD Vehicles Database
The database with the registered vehicles provided by DLVRD does not provide information on the type of driving side for the imported cars but only if the registered vehicle is new or second-hand and on the source of the second-hand cars (imported or domestic). The Romanian Automotive Register (RAR) has provided a database which contains the number of RHD vehicles registered in Romania in the period 2008–2015 out of which we selected only the M1 and N1 types of vehicles.
2.2. Methods
2.2.1. Statistical Approach
In order to establish the dependence relation between traffic crashes and importation of second-hand cars, the authors have used a simple linear regression method and the Pearson correlation coefficient. The first step in calculating the regression is the distribution of the two analyzed variables in a XOY coordinate system which gives it the following form (1):
where X is the cause (in our case importation of second-hand cars) and Y the effect (traffic crashes). The simple linear regression is one of the most frequently used methods in establishing the correlation between traffic crashes and various possible causing variables, such as: the volume of traffic flow [2]; light conditions [21]; season of the year [20]; spatiotemporal parameters [26].
Y = aX + B,
As a way to establish the intensity of the linear dependence between the two analyzed variables (in our case traffic crashes and importation of second-hand cars), Pearson correlation analysis was used [27,28] (2):
where, r is Pearson correlation coefficient, and represent the average of x and y, Sx and Sy represent the standard deviation of x and y calculated by the Formulas (3) and (4) [29]:
2.2.2. GIS Approach
During the past few years, GIS has been often used for understanding, analyzing and preventing the traffic crash phenomenon [21,22,30,31,32,33]. In this research the authors used GIS for the spatial and temporal representation of vehicle-to-vehicle crashes [34] and for the spatial and temporal distribution of second-hand car importation in Romania for an 8-year period. Thus, the two phenomena were reported to 1000 inhabitants and depicted in a series of maps realized at NUTS-3 level. This was developed by using ArcMap software provided by the ArcGIS 10.1 platform [1,2]. A tool for classification and clustering of quantitative data was used and the authors decided to use the “natural breaks” data classification method. According to the ArcGIS platform “tural breaks classes are based on natural groupings inherent in the data and class breaks are identified that best group similar values and that maximize the differences between classes. The features are divided into classes whose boundaries are set where there are relatively big differences in the data values” [35].
In addition to the statistical and GIS based approaches described above, we have used and re-interpreted in the context of our paper some results from the existing, mostly qualitative research on imported second-hand cars in order to fill the informational gap existing between the interpretational limits imposed by quantitative data and the need to explains facts which need extensive qualitative field research.
3. Results and Discussion
3.1. Importation of Vehicles in Romania 2008–2015
Between 2008 and 2015, 853,249 new cars were registered in Romania, 1,690,358 second-hand cars were imported into the country and registered, and 2,487,190 were domestic second-hand cars that were re-registered (Figure 1). The data show clearly that imported used cars were the main input into the national fleet during the analyzed period with almost twice the amount of second-hand cars than new ones registered in the eight year period. There is a longstanding debate of what determines importation of second-hand cars rather than buying new ones or from the domestic second-hand market. The most common invoked reasons are the followings: the brand of the cars and the social images/status it implies; the selling price in the destination country; higher gains for importers; oversupply in the origin countries; liberalization of car markets; decline in demand for new cars; exiting trade routes that facilitate their importation [3,6,36,37,38,39,40,41]. In the current case, the evidence suggests a combination of factors that occurred in the last two decades in Romania and which will be further detailed below: international migration and liberalization of car market. However, the situation with the registration of cars evolved in the examined period differently for the three groups of cars included in the analysis.
The number of brand new cars coming from domestic or external manufactories and registered for the first time in Romania decreased from more than 280,000 in 2008 to 57,000 in 2013, with a small increase in 2014 and up to about 81,000 in 2015. The situation with the second-hand vehicles imported from abroad and registered for the first time in Romania is slightly different: the maximum was reached in 2008 with around 300,000 imported second-hand automobiles, then the number decreased to 94,000 in 2011, and a strong recovery happened again up to around 250,000 in 2015. The strong decrease of imported second-hand cars in the period 2010–2011 is related to a number of legislative changes which affected the costs of registration for second-hand imported cars while the drop with new cars registration is explained by the economic crisis [40,42,43].
In addition to the yearly evolution explained above, there is a strong variation in the number of registered cars among the counties in Romania. For instance, all 16 counties in Transylvania (Transylvania is a historical-geographical region extending over the North-Western, Western, and Central part of Romania) import more second-hand cars/1000 inhabitants compared to any other region within the country (Figure 2A). A possible explanation can be linked to the specificity of the international migration flows in this region, strongly oriented to countries such as Germany, Austria, France, and Benelux [44,45] from where most second-hand vehicles are imported as well (Other hypotheses often mentioned in the literature were taken into account (such as geographical distance from the Westerm border, level of economic development, mobility levels, type of the industries, urbanization level, population age structure, etc.) but none of them could be confirmed based on the evidences available within this study). We assume that the social networks established in the last three decades through the international migration are playing an important role in the uneven spatial distribution of imported second-hand cars as revealed in Figure 2A. This finding is in line with previous research that finds a link between the migration flows and importation of second-hand cars at the country level [41,46,47,48]. However, more research is needed to explore within country differentiation. The examination of Figure 2A reveals other interesting feature of the distribution of imported cars in relation to distance: counties situated relatively closer to the Western borders and to the main second-car markets of Western Europe have higher numbers of imported second-hand cars than counties situated in the eastern and southern parts of Romania.
The situation is different in the case of the new cars which tend to be registered more in the Bucharest-Ilfov region and in the economically developed counties, such as Cluj (CJ), Timiș (TM), Constanta (CT), Brașov (BV), Sibiu (SB), Prahova (PH), Argeș (AG) (Figure 2B, see Figure 3B as well). The case of domestic second-hand cars is without a clear spatial distribution pattern, with more registrations in Bucharest (B) and Ilfov (IF) county followed by a number of economically developed counties—Cluj (CJ), Timiș (TM), Brașov (BV), Argeș (AG) but also in some of their neighboring counties (Figure 2C).
Figure 2D presents the spatial distribution of the total number of cars in Romania, with a clear spatial differentiation between the western and eastern part of the country, reflecting cultural and economic differences, with the notable exception of the capital region Bucharest (B), and of two counties: Constanța (CT) and Galați (GL). Indeed, the significant regional differences could be explained by cultural differences as well, in addition to the economic, distance and migration-related factors, which need further exploration and research. On the basis of existing data and data visualization, we can observe regional patterns in the preferences for imported second-hand cars and domestic second-hand cars, as suggested in Figure 2A, and Figure 2C: in 16 counties the imported second-hand cars are the main source of car acquisition, among them the capital Bucharest (71%), 10 Transylvanian counties with easier access to the Western European market and strong migration background, Constanța (CT) and Galați (GL) counties favored as well by geographical locations (access at harbors), while for Suceava (SV) and Botoșani (BT) counties we cannot find reasonable explanations.
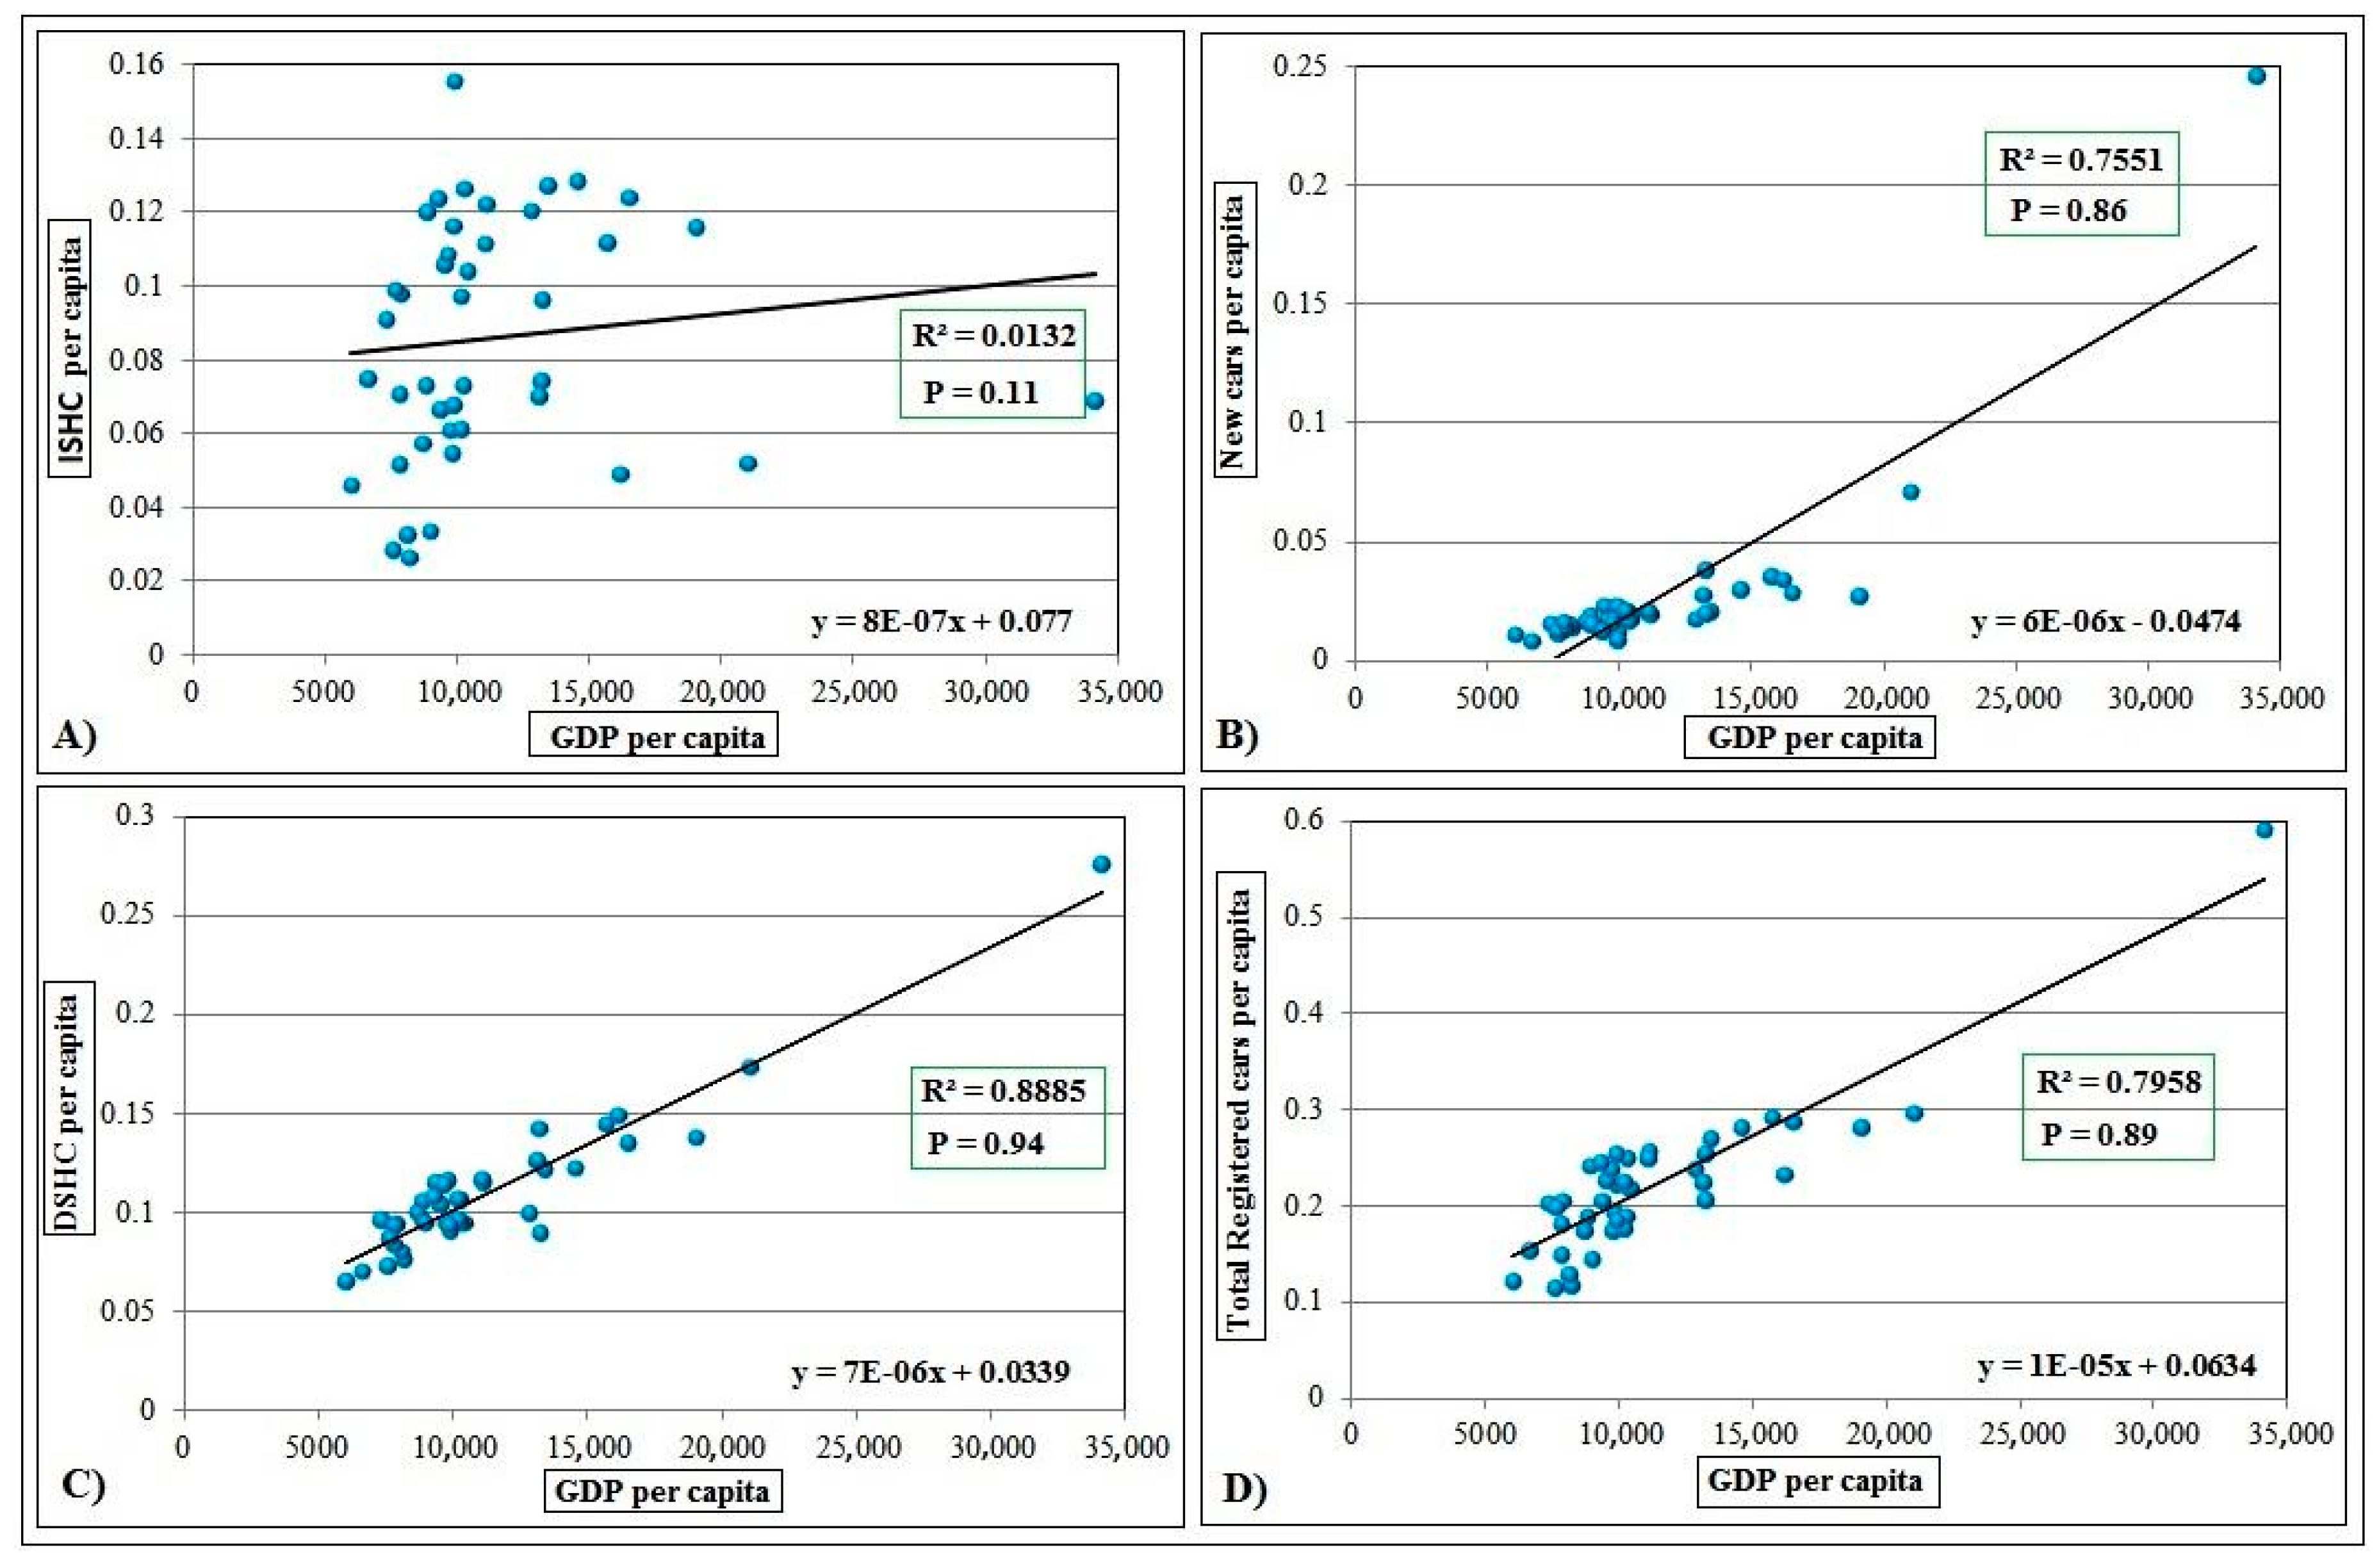
However, in the last two cases, as suggested, the income inequalities between counties are one of the key factors explaining the significant spatial differences in the distribution of new cars and domestic second-hand cars. Figure 3 brings some facts in support of this argument: for new cars and domestic second-hand cars, there is a significant and strong correlation with the income measured by GDP per capita, while in the case of imported second-hand cars the correlation is weak and has a low level of probability, which means that non-economic factors like those described above could explain the spatial differentiation of this category of cars.
3.2. Car Crashes in Romania 2008–2015
Romania records a dramatic number of traffic crashes, being placed among the countries with the highest rate of road fatalities across the European Union [49]. According to the database offered by GIRPRD, no less than 205,127 cars were involved in 133,351 vehicle-to-vehicle crashes over the last eight years (2008–2015), resulting in 202,396 casualties of which 146,109 slightly injured, 39,599 seriously injured, and 11,072 deaths (Table 1). Considering previous research on traffic crashes and prior research on the impact of technical and design characteristics of vehicles on the severity of car crashes [7,11,17,50], in this research we categorized the crashes in three types: minor traffic crashes, severe traffic crashes, and fatal traffic crashes. The first category contains only crashes with slight injures for the passenger and/or small damages for the vehicle, the second one includes crashes with serious injures among the passengers and/or significant damages for the vehicle, and the last one includes crashes with deaths.
Due to the development of traffic safety policies implemented at EU and national level, but also due to the development of emergency medicine, during recent years the rate of road fatalities at the EU level but also in Romania is decreasing [1,2,49]. However, after seven years of constant decreasing, during 2015 Romania had a slight increase of this indicator moving from the second to the first at the EU level in terms of the number of deaths per 1 million inhabitants [49]. This situation corresponds with the increase of the number of registered cars in all three categories (Figure 1)—new cars, imported second-hand cars (ISHC) and domestic second-hand cars (DSHC)—which led to an increased traffic and spatial mobility, and, as a consequence, to increased road fatalities.
The number and severity level of the car accidents is unevenly distributed among the Romanian counties. For instance, the number of total traffic accidents (Figure 4A) is higher in the capital region Bucharest (B) and Ilfov (IF) and in three other counties—Constanța (CT), Hunedoara (HD) and Mehedinți (MH). At the same time, the minor traffic accidents are above average in Bucharest (B), Ilfov (IF) and Constanța (CT) (Figure 4B), all counties being highly urbanized agglomerations, where minor crashes are more representative than other in jury categories. Severe traffic and fatal accidents (Figure 4C,D) tend to be randomly distributed over space. On the basis of existing data and information, we assume that the random distribution in the last two cases might be explained by the action of local specific factors, like driving behavior, which cannot be addressed based on the data available in this research and needs further research.
3.3. Regression and Pearson Correlation Analysis of the Relation between Importation of Second-Hand Cars and Traffic Safety
In order to observe the dependence relation between traffic crashes and different categories of cars (new cars, domestic second-hand cars, imported second-hand), we used a simple linear regression and the Pearson correlation analyses (see Figure 5). The results show a strong direct linear relation between the two variables for each car registration category. Therefore, the growth (see Figure 1) in registration of new cars, domestic second-hand cars and imported second-hand cars in any given county causes an increase in the volume of crashes. The correlation is significantly higher in the case of new cars and domestic second-hand cars than in the case of imported second-hand cars.
Figure 6 reveals interesting differences in the correlation between the number of imported second-hand cars and the type of crashes: highest correlations appear in the case of Severe Traffic Crashes (Figure 6C) and in the case of Total Traffic Crashes (Figure 6A), while lower ones resulted in the case of Minor Traffic Crashes (Figure 6B) and Fatal Traffic Crashes (Figure 6D). Considering these results, we can state that the imported second-hand cars have a higher impact in the case of Severe Traffic Crashes and Total Traffic Crashes comparing to the Fatal and Minor Traffic Crashes.
3.4. Right-Hand Driving Cars Involved in Traffic Accidents
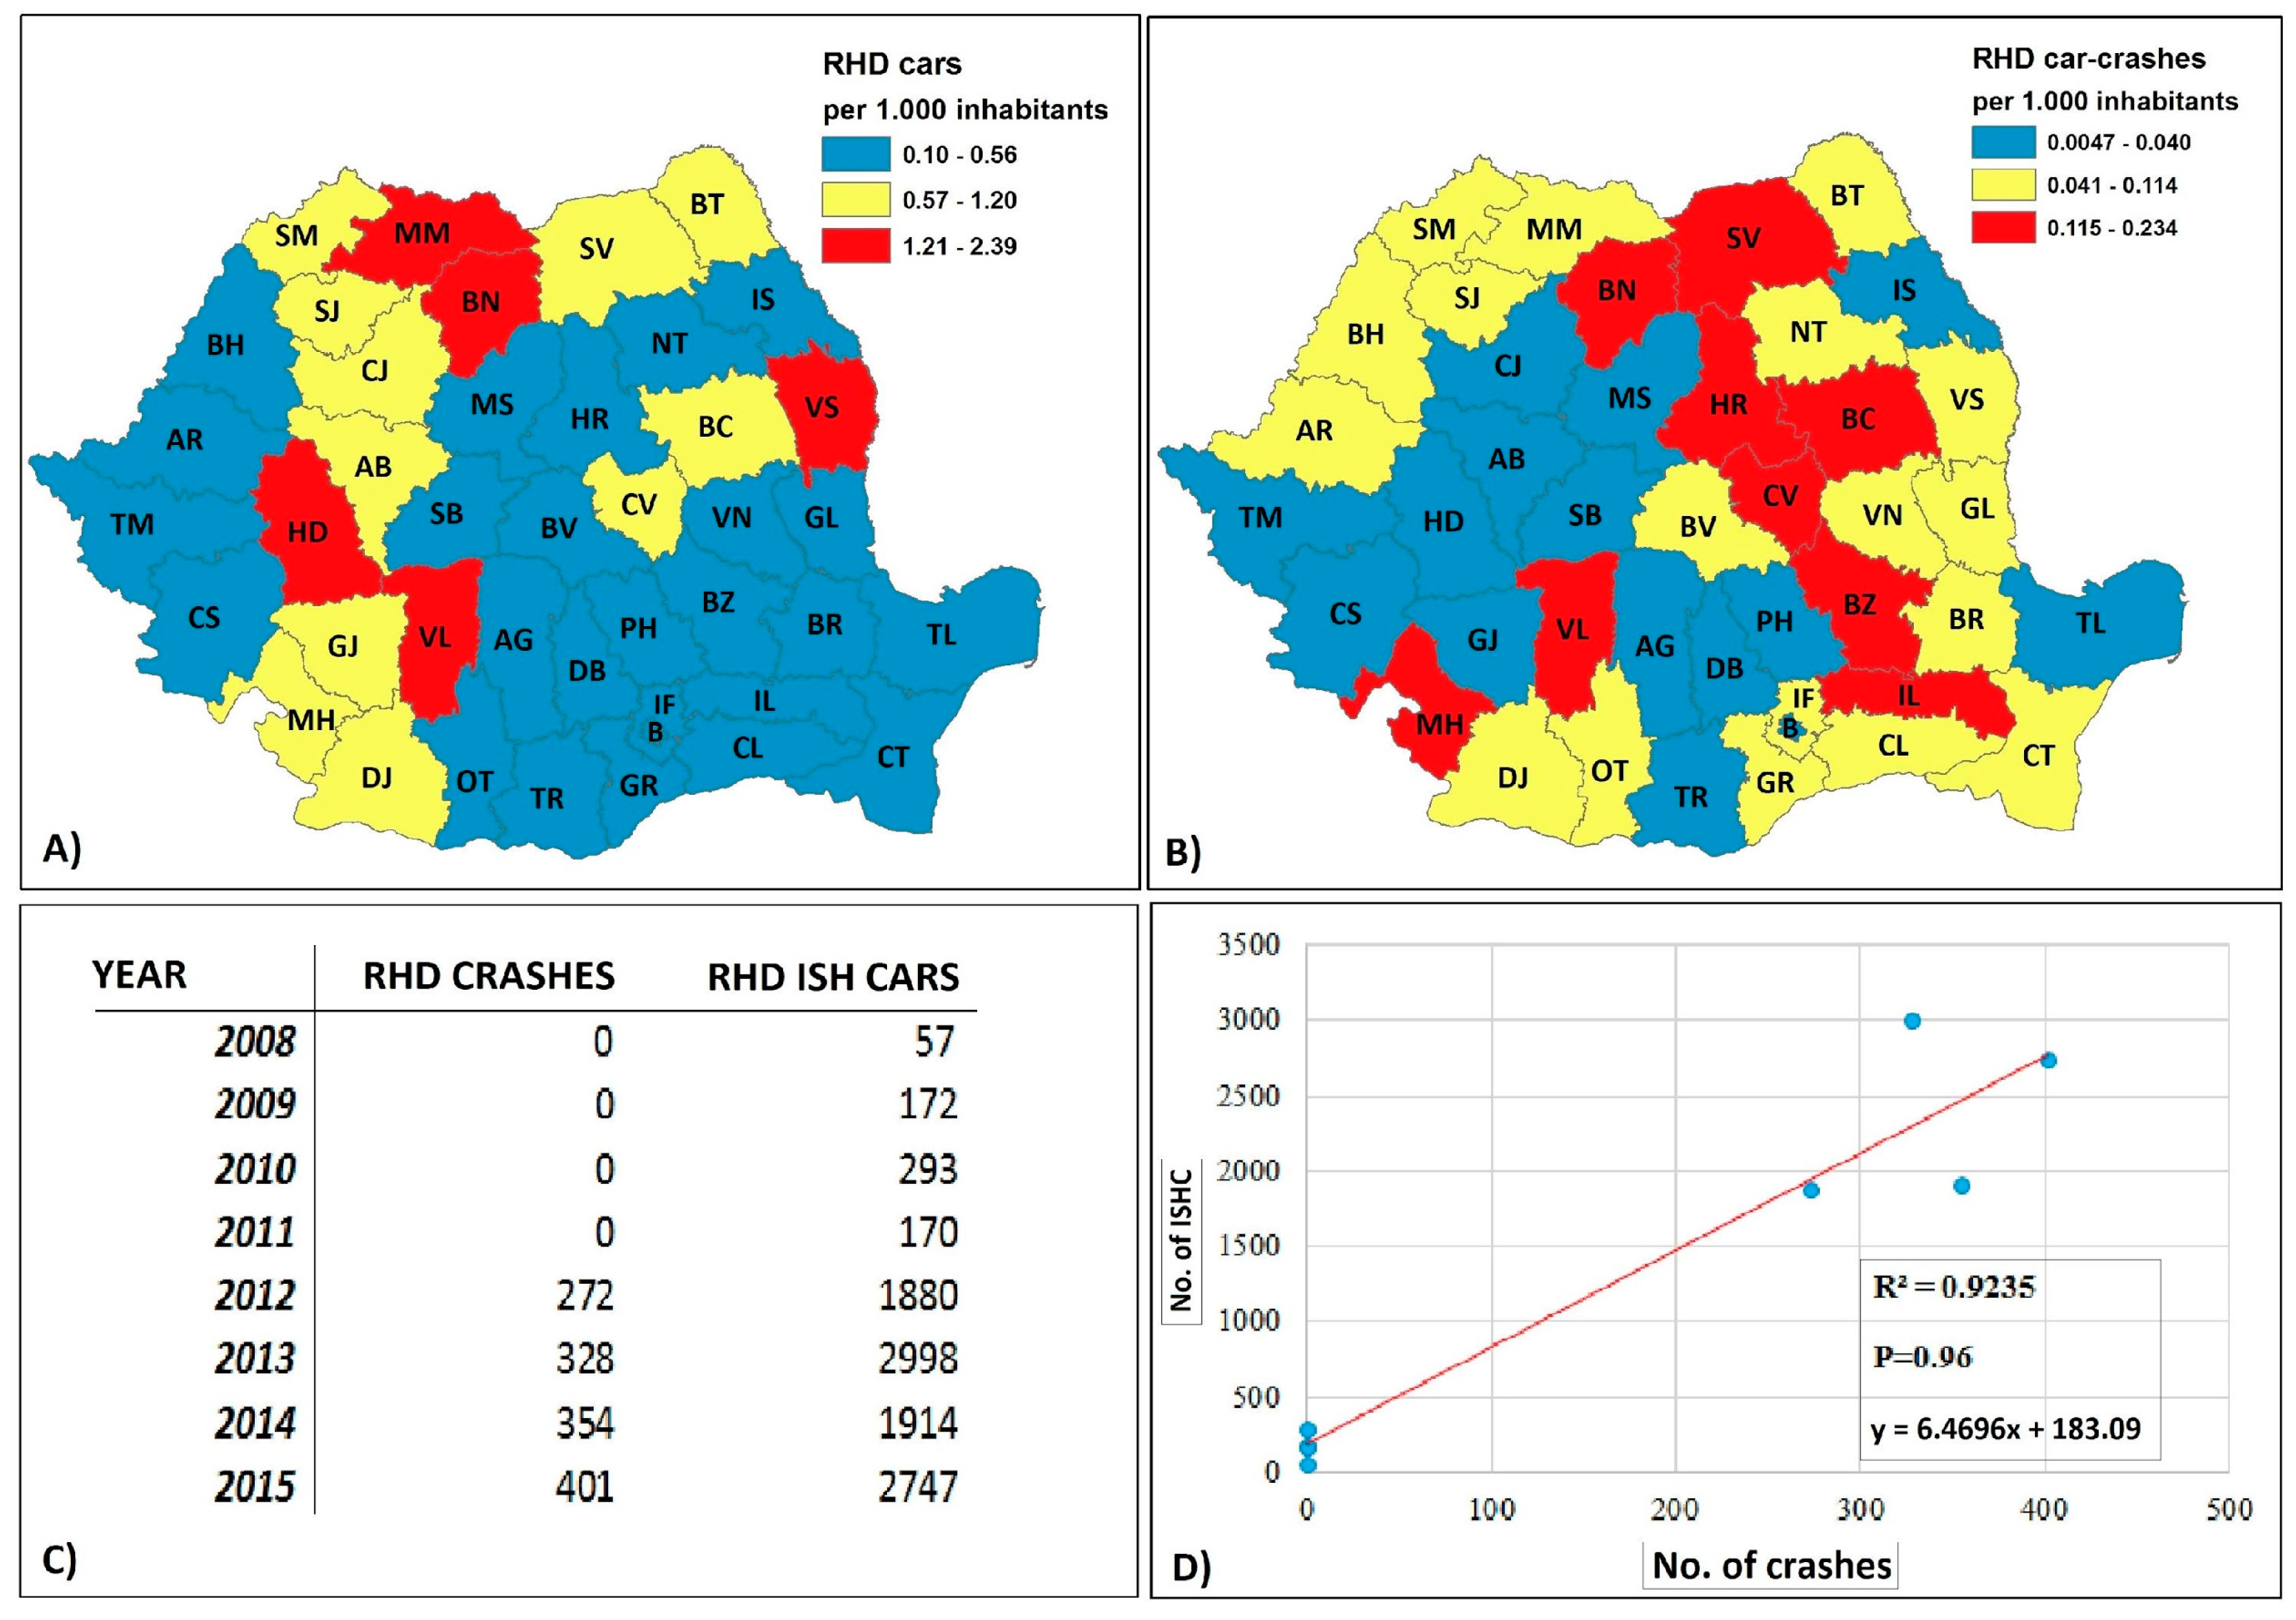
Between 2008 and 2015, the number of right-hand driving (RHD) cars involved in traffic accidents was relatively low compared to the total number of accidents (see Table 1 and Figure 7C). For instance, no RHD cars were reported as involved in car crashes in Romania between 2008 and 2011. However, starting with 2011, an increasing number of RHD cars were recorded in the police database to be involved in traffic crashes. More RHD cars are imported in five counties (Figure 7A), while more accidents involving RHD cars were reported in some counties clustered in the central-eastern part of Romania (Figure 7B). The value of R2 (0.92) and P (0.96) in the case of Pearson Correlation indicates a very strong positive relationship between the annual number of imported RHD cars in Romania and the number of accidents in which RHD vehicles were involved (see Figure 7D). This sudden appearance of RHD cars in Romania and their increasing participation in traffic crashes can be explained through the EU accession of Romania in 2007, when RHD second-hand cars were allowed to be imported into Romania but also by the fact that starting with 2010–2011, there was a massive (re)migration of the Romanian workforce to the UK [51,52,53,54] which probably also entailed the import of RHD cars.
4. Conclusions
The key findings of this paper are the following. First, the importation of second-hand cars in Romania was an en mass phenomenon in the last eight years while previous research and evidence suggests that this situation happened before 2008 as well [5,40,55,56]. With more than 1.69 million cars registered in a relatively small span of time, imported second-hand cars were by far the most important flow of cars into the national vehicle fleet, counting twice the amount of vehicles compared to the new cars acquisitioned. With one of the lowest ratios of vehicles in use/capita [57], the importation of second-hand vehicles in Romania is expected to continue at similar rates and to remain the main input into the national vehicle fleet. However, the available data for this research suggests that the importation of second-hand cars became such a dynamic phenomenon in connection to the international migration flows from various regions; further research on why and how this phenomenon has appeared and developed is needed.
Second, looking at the yearly distribution of vehicle-to-vehicle crashes, an improvement can be observed in the last years in terms of both number of deaths/1 million inhabitants and the relative number of crashes. A decrease can be observed as well if we look at the three types of car crashes used in the research—minor, severe, and fatal. The trend seems to be foreseeable considering the constant improvements of the emergency medicine Romania has undertaken but also improvements in the road infrastructure. In this light, further improvements are expected to be seen in the coming period as well. However, in the last two years of the analyzed period, a change of trend can be observed with more vehicle-to-vehicle crashes and casualties. The available data for this research does not allow us to explain why and how the deteriorating happened but its straight connection with the overall increase of vehicle registrations can be noted.
Third, this research probably offers for the first time in the European Union context and in the specific case of Romania a description of the role imported second-hand cars play in the evolution of car crashes and, generally, in the evolution of road safety. By using simple linear regression method and Pearson analysis resulted that a significant part of the variation in the volume of traffic accidents can be explained by the volume of imported second-hand cars at the county level. This finding has implications for road safety considering the amounts of second-hand vehicles imported in Romania and that similar importation levels are expected to continue. However, the effect of imported second-hand cars on the traffic safety regime in Romania seems to be less important compared to domestic second-hand cars.
Fourth, a stronger direct relation exists between the number of imported second-hand cars and Severe Traffic Accidents as the higher values for R2 and P show. Departing from these findings it can be argued that importation of second-hand vehicles has a stronger impact on this specific type of accident for which higher material damages and severe injuries are representative. This finding is in line with results in other studies which argue that the kind of technical problems these type of cars usually have may lead to poorer safety performances [7,17]. Additionally, these conclusions can have broader implications as the phenomenon of importing second-hand used cars is widespread among the CEE countries and beyond areas which also exhibit high levels of traffic accidents [3,4,5,40,49,56]. However, the available databases in this study do not contain information on what types of second-hand cars are imported and their characteristics (such as engine capacity and power) or the main reasons for the traffic crashes (such as alcohol and drug consumption, road deficiencies, etc.) and further research on these factors should be undertaken.
Fifth, to the best of our knowledge the present research considers for the first time the subgroup of Right-Hand driving cars registered and used in a Left-Hand driving environment role on traffic safety in the in the European Union context and in the specific case of Romania. The values of both Regression and Pearson Correlation indicates a strong positive relationship between the annual number of imported RHD vehicles and vehicle-to-vehicle crashes where RHD cars were involved. The available data do not allow us to explore what type of accidents this kind of cars are more likely to be involved in or the culpability rate, so further research regarding these questions is required.
This study produced results from the category of empirical evidence production, thus filling in a blank left both by the applicative research and by the institutions in charge of traffic safety. Starting from these results, it is possible to go further with proposals of improving the legal support that refers to the import of second-hand cars, imposing more rigorous conditions for the periodical technical inspection of second-hand cars. Moreover, it can lead to a common database, at the international level (or at least at EU level), which can register the technical history of cars from each country, so that the buyer of a second-hand car can access this data before purchase.
Acknowledgments
Parts of this work was supported by the project “Recasting Migrants’ Voices. Local perspectives on Migration, Development and Social Change in Romania” (PN-II-ID-PCE-2011-3-0602) by the project “Religious Organizations and the Social Capital of Youth in Postcommunist Countries” (PN-II-RU-TE-2014-4-0032), and by the project “A youth-centered analysis of the changes in the nature and meaning of work” (PNII-RU-TE-2014-4-0011). We are especially grateful to Karolina Barglowski, Başak Bilecen, Simone Castellani, Thomas Faist, Tobias Gehring, Yaatsil Guevara Gonazales, Natalya Kashkovskaya, Cleovi Mosuela, Susanne Schultz, Joanna Sienkiewicz, Yasemin Soysal, Inka Stock, Christian Ulbricht, and to our anonymous reviewers for their useful comments, discussions, and feedback on earlier versions of this article.
Author Contributions
All authors contributed equally to the research presented in this paper and to the preparation of the final manuscript.
Conflicts of Interest
The authors declare no conflict of interest.
References
- Ciobanu, S.M.; Benedek, J. Spatial characteristics and public health consequences of road traffic injuries in Romania. Environ. Eng. Manag. J. 2015, 14, 2689–2702. [Google Scholar]
- Benedek, J.; Ciobanu, S.M.; Man, T.C. Hotspots and social background of urban traffic crashes: A case study in Cluj-Napoca (Romania). Accid. Anal. Prev. 2016, 87, 117–126. [Google Scholar] [CrossRef] [PubMed]
- Chu, T.; Delgado, A. Used Vehicle Imports Impact on New Vehicle Sales: The Mexican Case. Anál. Econ. 2009, 24, 347–364. [Google Scholar]
- European Commission. Consumer Market Study on the Functioning of the Market for Second-Hand Cars from a Consumer Perspective; European Commission: Brussels, Belgium, 2014; ISBN 978-92-79-45692-3. [Google Scholar]
- Cosciug, A. Transnational Motorways. The secondhand car trade in a country of emigration. Anthropol. News 2017, 58, e338–e342. [Google Scholar] [CrossRef]
- Dobler, G. From Scotch Whisky to Chinese Sneakers: International Commodity Flows and New Trade Networks in Oshikango, Namibia. Africa 2008, 78, 410–432. [Google Scholar] [CrossRef]
- Obeng-Odoom, F. Drive left, look right: The political economy of urban transport in Ghana. Int. J. Urban Sustain. Dev. 2010, 1, 33–48. [Google Scholar] [CrossRef]
- Cooper, P.J.; Meckle, W.; Osborn, J. Estimating the effect of the vehicle model year on crash and injury involvement. J. Autom. Eng. 2010, 224, 1527–1539. [Google Scholar] [CrossRef]
- Broughton, J. Car driver casualty rates in Great Britain by type of car. Accid. Anal. Prev. 2008, 40, 1543–1552. [Google Scholar] [CrossRef] [PubMed]
- Cuerden, R.; Edwards, M.J.; Pittman, M.B. Effect of Vehicle Defects in Road Accidents. Available online: https://www.ewu.edu/Documents/CBPA/NWTTAP/Newsletter/Publications/PPR565.pdf (accessed on 18 November 2017).
- Torrão, G.A.; Coelho, M.C.; Rouphail, N.M. Effect of vehicle characteristics on crash severity: Portuguese experience. Inj. Prev. 2012, 18, 310–316. [Google Scholar] [CrossRef]
- Bédard, M.; Guyatt, G.H.; Stones, M.J.; Hirdes, J.P. The independent contribution of driver, crash, and vehicle characteristics to driver fatalities. Accid. Anal. Prev. 2002, 34, 717–727. [Google Scholar] [CrossRef]
- Farmer, C.M.; Lund, A.K. Trends over time in the risk of driver death: What if vehicle designs had not improved? Traffic Inj. Prev. 2006, 7, 335–342. [Google Scholar] [CrossRef] [PubMed]
- Lécuyer, J.F.; Chouinard, A.; Transport Canada. Study on the Effect of Vehicle Age and the Importation of Vehicles 15 Years and Older on the Number of Fatalities, Serious Injuries and Collisions in Canada. In Proceedings of the Canadian Multidisciplinary Road Safety Conference XVI, Winnipeg, MB, Canada, 11–14 June 2006. [Google Scholar]
- Vrkljan, B.H.; Anaby, D. What vehicle features are considered important when buying an automobile? An examination of driver preferences by age and gender. J. Saf. Res. 2011, 42, 61–65. [Google Scholar] [CrossRef] [PubMed]
- Akloweg, Y.; Hayshi, Y.; Kato, H. The effect of used cars on African road traffic accidents: A case study of Addis Ababa, Ethiopia. Int. J. Urban Sci. 2011, 15, 61–69. [Google Scholar] [CrossRef]
- Cooper, P.J.; Meckle, W.; Nasvadi, G. The safety of vehicles imported from right-hand-drive vehicle configuration countries when operated in a left-hand-drive vehicle environment. Accid. Anal. Prev. 2009, 41, 108–114. [Google Scholar] [CrossRef] [PubMed]
- Bari, M.M. The study of the possibility of switching driving side in Rwanda. Eur. Transp. Res. Rev. 2014, 6, 439–453. [Google Scholar] [CrossRef]
- National Institute of Statistics, Romania—INS 2015. Available online: www.insse.ro (accessed on 18 November 2017).
- Ivan, K.; Haidu, I.; Benedek, J.; Ciobanu, S.M. Identification of traffic accident risk-prone areas under low-light conditions. Nat. Hazards Earth Syst. Sci. 2015, 15, 2059–2068. [Google Scholar] [CrossRef]
- Alian, S.; Baker, R.G.V.; Wood, S. Rural casualty crashes on the Kings Highway: A new approach for road safety studies. Accid. Anal. Prev. 2016, 95, 8–19. [Google Scholar] [CrossRef] [PubMed]
- Dai, D. Identifying clusters and risk factors of injuries in pedestrian-vehicle crashes in a GIS environment. J. Transp. Geogr. 2012, 24, 206–214. [Google Scholar] [CrossRef]
- Steenberghen, T.; Aerts, K.; Thomas, I. Spatial clustering of events on a network. J. Transp. Geogr. 2010, 18, 411–418. [Google Scholar] [CrossRef]
- Stutts, J.C.; Hunter, W.W. Motor vehicle and roadway factors in pedestrian and bicyclist injuries: An examination based on emergency department data. Accid. Anal. Prev. 1999, 31, 505–514. [Google Scholar] [CrossRef]
- Economic and Social Council, United Nations. Consolidated Resolution on the Construction of Vehicles (R.E.3). Available online: http://www.unece.org/fileadmin/DAM/trans/doc/2014/wp29/ECE-TRANS-WP29-2014-052e.pdf (accessed on 18 November 2017).
- Truong, L.T.; Kieu, L.M.; Vu, T.A. Spatiotemporal and random parameter panel data models of traffic crash fatalities in Vietnam. Accid. Anal. Prev. 2016, 94, 153–161. [Google Scholar] [CrossRef] [PubMed]
- Freund, R.; Wilson, W. Regression Analysis: Statistical Modeling of a Response Variable; Academic Press: San Diego, CA, USA, 1998; ISBN 0122674758. [Google Scholar]
- Mohamed Salleh, F.H.; Arif, S.M.; Zainudin, S.; Firdaus-Raih, M. Reconstructing gene regulatory networks from knock-out data using Gaussian Noise Model and Pearson Correlation Coefficient. Comput. Biol. Chem. 2015, 59, 3–14. [Google Scholar] [CrossRef] [PubMed]
- Lee, J.; Wong, D.W.S. Statistical Analysis with ArcView GIS; John Wiley and Sons: New York, NY, USA, 2001; ISBN 0-471-34874-0. [Google Scholar]
- Durduran, S.S. A decision making system to automatic recognize of traffic accidents on the basis of a GIS platform. Expert Syst. Appl. 2010, 37, 7729–7736. [Google Scholar] [CrossRef]
- Gundogdu, I.B. Applying linear analysis methods to GIS-supported procedures for preventing traffic accidents: Case study of Konya. Saf. Sci. 2010, 48, 763–769. [Google Scholar] [CrossRef]
- Li, Y.; Kim, A.M.; El-Basyouny, K.; Li, R. Using GIS to interpret automated speed enforcement guidelines and guide deployment decisions in mobile photo enforcement programs. Transp. Res. Part A Policy Pract. 2016, 86, 141–158. [Google Scholar] [CrossRef]
- Rodrigues, D.S.; Ribeiro, P.J.G.; da Silva Nogueira, I.C. Safety classification using GIS in decision-making process to define priority road interventions. J. Transp. Geogr. 2015, 43, 101–110. [Google Scholar] [CrossRef]
- Carter, J.; Piza, E. Spatiotemporal convergence of crime and vehicle crash hotspots: Additional consideration for policing places. Crime Delinq. 2017, 1–25. [Google Scholar] [CrossRef]
- Smith, M.; Goodchild, M.; Longley, P. Geospatial Analysis—A Comprehensive Guide to Principles, Techniques and Software Tools, 5th ed.; Troubador Publishing Ltd.: Kibworth Beauchamp, UK, 2015. [Google Scholar]
- Brooks, A. Networks of power and corruption: The trade of Japanese used cars to Mozambique. Geogr. J. 2012, 178, 80–92. [Google Scholar] [CrossRef]
- Brooks, A. Stretching global production networks: The international second-hand clothing trade. Geoforum 2013, 44, 10–22. [Google Scholar] [CrossRef]
- Clerides, S. Gains from trade in used goods: Evidence from automobiles. J. Int. Econ. 2008, 76, 322–336. [Google Scholar] [CrossRef]
- Nieuwenhuis, P.; Beresford, A.; Choi, K.Y. Shipping air ? Tracking and forecasting the global shipments of of new and used cars. J. Marit. Res. 2007, 4, 17–36. [Google Scholar]
- Root, E. The Impact of Used Car Imports on the Industry and Markets in Eastern Europe. In Proceedings of the Global Automotive Conference, Florence, Italy, 11 May 2006. [Google Scholar]
- Rosenfeld, M. Mobility and social capital among Lebanese and Beninese entrepreneurs engaged in transnational trade. Int. Rev. Sociol. 2012, 22, 211–228. [Google Scholar] [CrossRef]
- Judgment of the Court (Grand Chamber). Available online: http://curia.europa.eu/juris/document/document.jsf?text=&docid=163660&pageIndex=0&doclang=RO&mode=req&dir=&occ=first&part=1&cid=264553 (accessed on 18 November 2017).
- Marinescu, N.; Istrate, I. Car Taxation in the European Union: The Case of Romania. Int. J. Arts Sci. 2009, 3, 83–94. [Google Scholar]
- Sandu, D. Modernising Romanian society through temporary work abroad. In A Continent Moving West?: EU Enlargement and Labour Migration from Central and Eastern Europe; Black, R., Engbersen, G., Marek Okólski, C.P., Eds.; Amsterdam University Press: Amsterdam, The Netherlands, 2010; pp. 249–271. ISBN 978-90-8964-156-4. [Google Scholar]
- Anghel, R.G.; Botezat, A.; Coșciug, A.; Manafi, I.; Roman, M. International Migration, Return Migration, and Their Effects: A Comprehensive Review on the Romanian Case. IZA DP 2016, 1–49. Available online: https://ssrn.com/abstract=2895293 (accessed on 18 November 2017).
- Beuving, J. American cars in Cotonou: Culture in African entrepreneurship and the making of a globalising trade. J. Modern Afr. Stud. 2015, 53, 317–338. [Google Scholar] [CrossRef]
- Chalfin, B. Cars, the customs service, and sumptuary rule in neoliberal Ghana. Comp. Stud. Soc. Hist. 2008, 50, 424–453. [Google Scholar] [CrossRef]
- Smith, L. Tied to migrants. In Transnational Influences on the Economy of Accra, Ghana; African Studies Centre: Leiden, The Netherlands, 2007; pp. 1–256. ISBN 978-90-5448-074-7. [Google Scholar]
- European Commission. Trends, statistics and main challenges. In Road Safety in the European Union; European Commission: Brussels, Belgium, 2015; pp. 5–23. ISBN 978-92-79-45654-1. [Google Scholar]
- Bambach, M.R.; Mitchell, R.J. Estimating the human recovery costs of seriously injured road crash casualties. Accid. Anal. Prev. 2015, 85, 177–185. [Google Scholar] [CrossRef] [PubMed]
- Balch, A.; Balabanova, E. Ethics, Politics and Migration: Public Debates on the Free Movement of Romanians and Bulgarians in the UK, 2006–2013. Politics 2014, 36, 19–35. [Google Scholar] [CrossRef]
- Fox, J.E.; Morosanu, L.; Szilassy, E. The racialization of the new European migration to the UK. Sociology 2012, 46, 680–695. [Google Scholar] [CrossRef]
- Moroşanu, L. Professional Bridges: Migrants Ties with Natives and Occupational Advancement. Sociology 2016, 50, 349–365. [Google Scholar] [CrossRef]
- Rolfe, H.; Fic, T.; Lalani, M.; Roman, M.; Prohaska, M. Potential impacts on the UK of future migration from Bulgaria and Romania. Natl. Inst. Econ. Rev. 2013, 224, 1–4. [Google Scholar] [CrossRef]
- Cosciug, A. The role of social capital in the development of trade with second-hand cars in Central and Eastern Europe, The case of Romania and Moldova. Moldosc. Probl. Anal. Polit. 2016, 1, 102–120. [Google Scholar]
- Mehlhart, G.; Merz, C.; Akkermans, L.; Jordal-Jørgensen, J. European Second Hand Car Market Analysis; Final Report; Öko-Institut e.V.: Breisgau, Germany, 2011; pp. 4–163. [Google Scholar]
- Centre for Automotive Management. The Used Car Market Report 2012; BCA: Bergisch Gladbach, Germany, 2012; pp. 3–96. [Google Scholar]
Figure 1.
Yearly distribution of car registration by type (2008–2015).
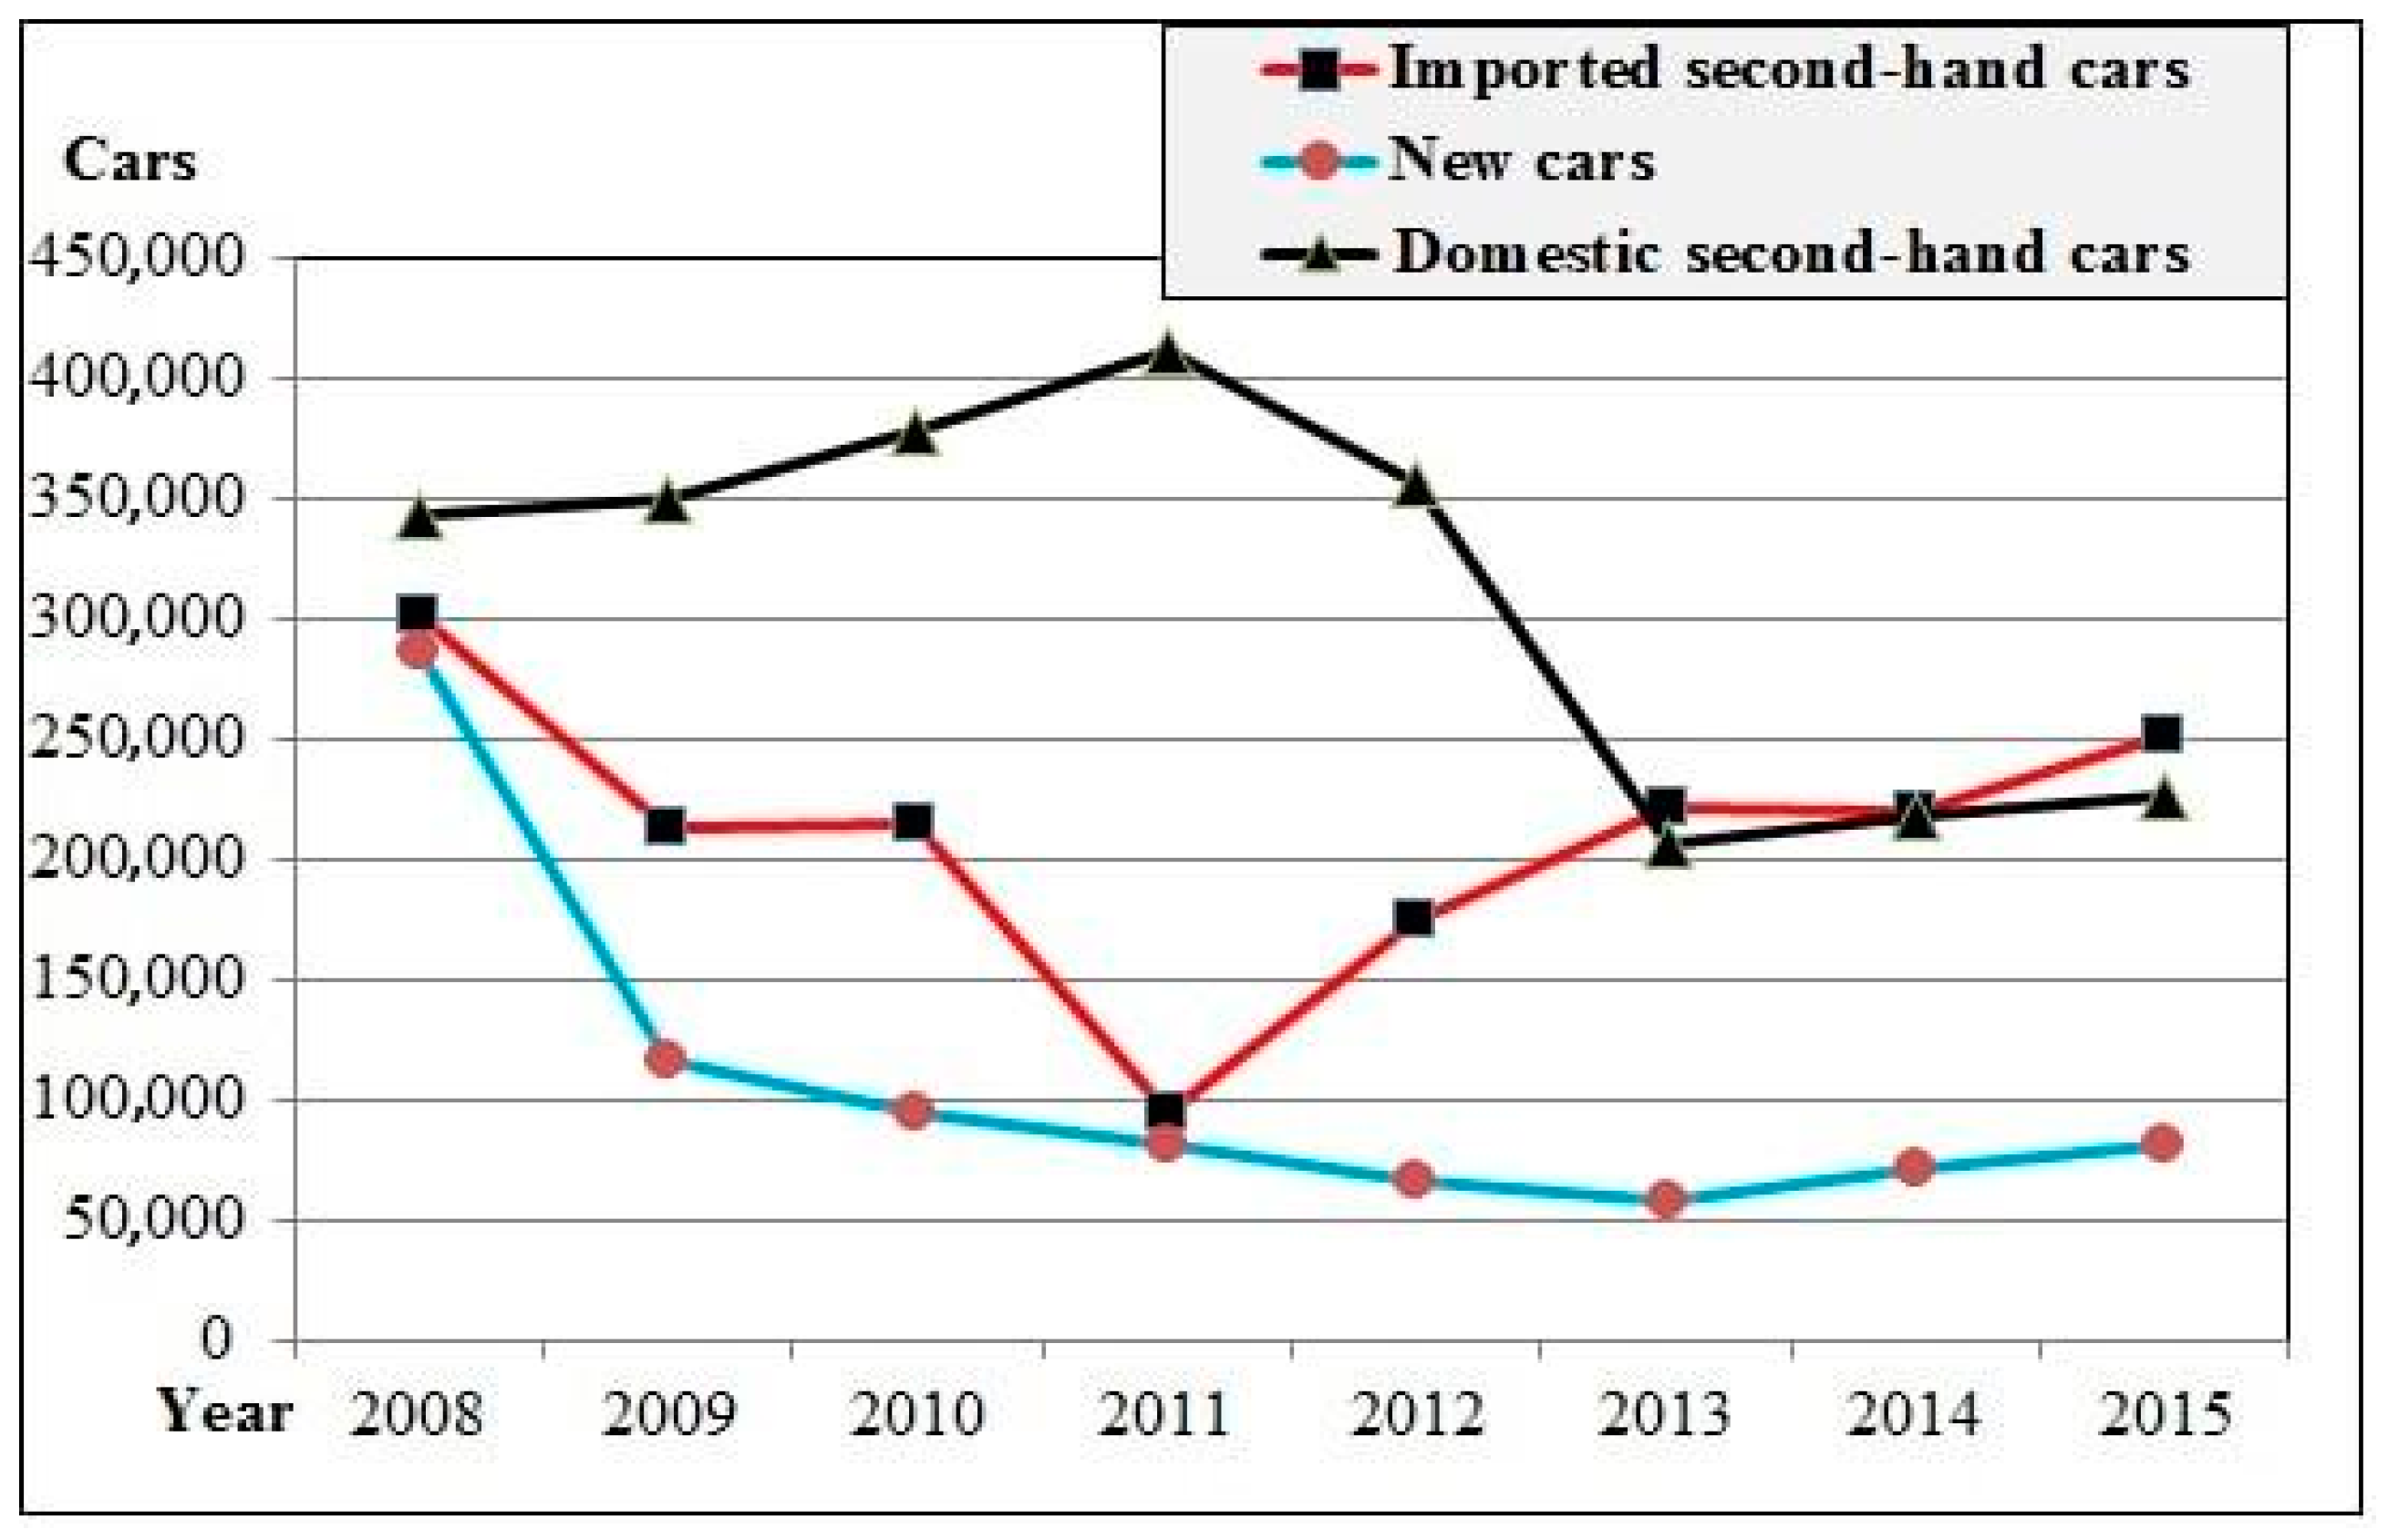
Figure 2.
County distribution of car registration by type (2008–2015): (A) Imported Second-Hand Cars (ISHC); (B) New Cars; (C) Domestic Second-Hand Cars (DSHC); (D) Total Registrations.
Figure 2.
County distribution of car registration by type (2008–2015): (A) Imported Second-Hand Cars (ISHC); (B) New Cars; (C) Domestic Second-Hand Cars (DSHC); (D) Total Registrations.
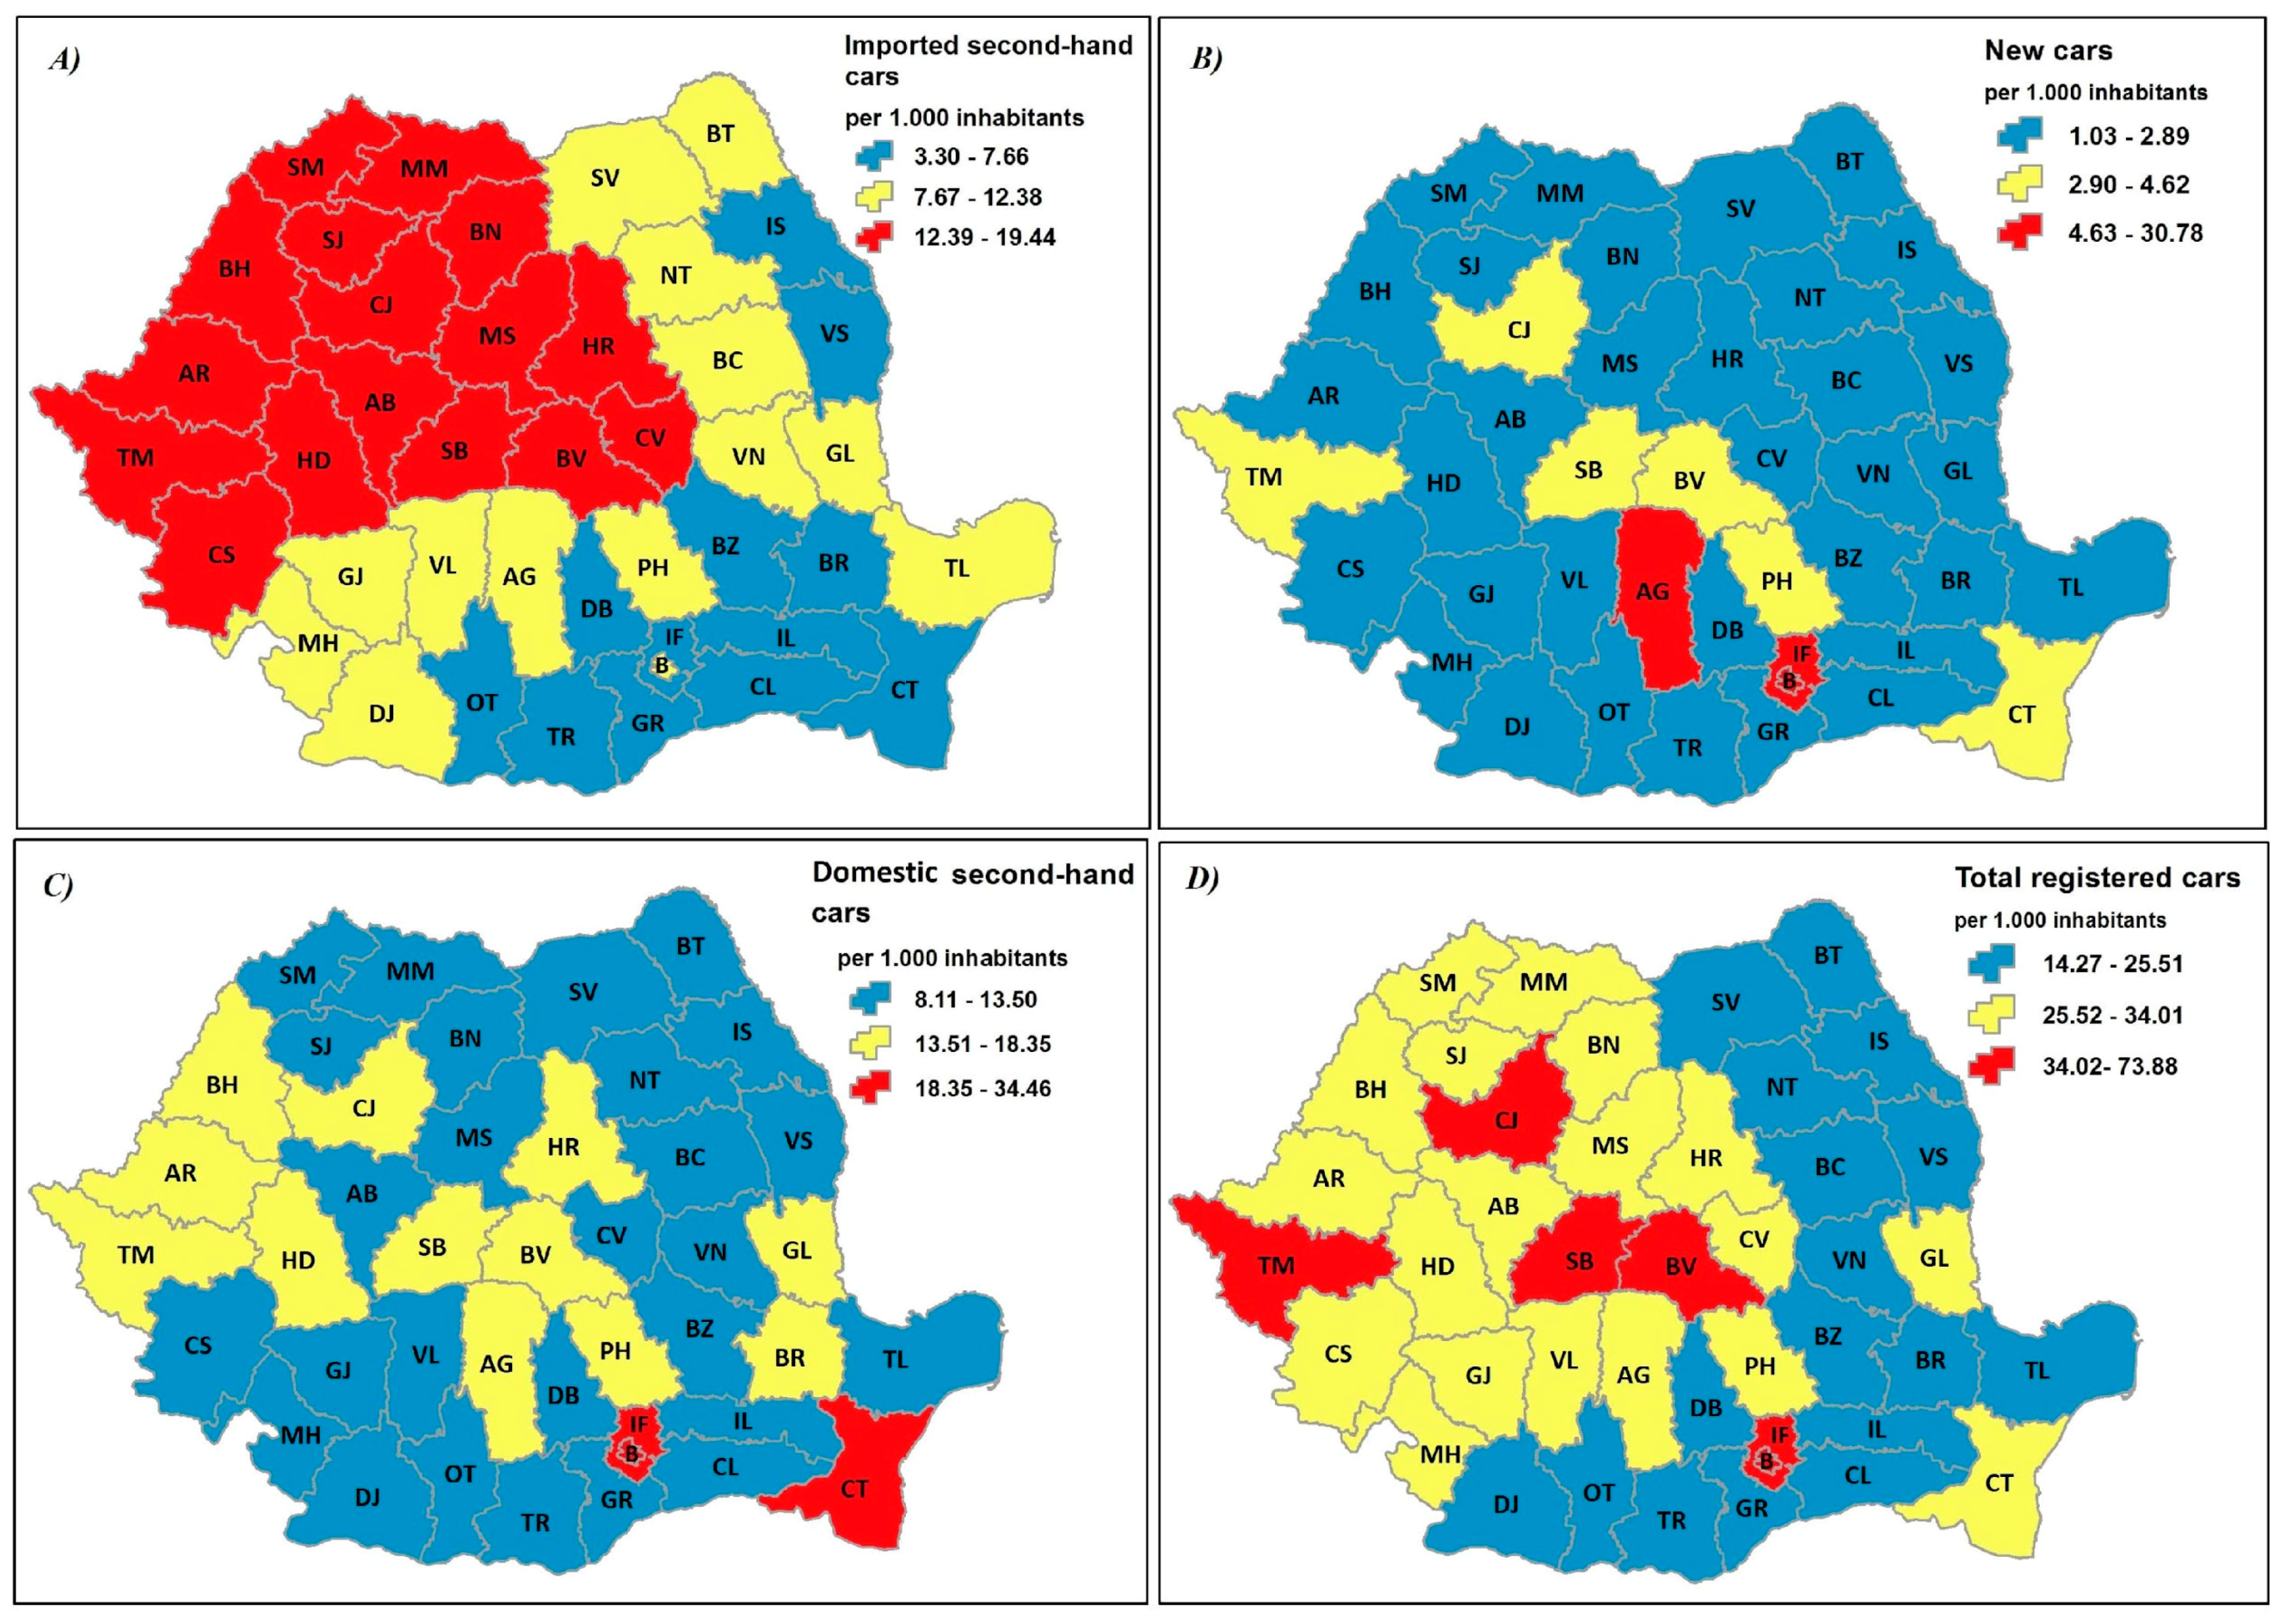
Figure 3.
The relation between GDP (The average of the eight years GDP was used) per capita and the number of different categories of vehicles: (A) Imported Second-Hand Cars; (B) New cars; (C) Domestic Second-Hand Cars; (D) Total Registrations.
Figure 3.
The relation between GDP (The average of the eight years GDP was used) per capita and the number of different categories of vehicles: (A) Imported Second-Hand Cars; (B) New cars; (C) Domestic Second-Hand Cars; (D) Total Registrations.

Figure 4.
County distribution of traffic crashes by category (2008–2015): (A) total number of traffic crashes (B) minor traffic crashes (C) severe traffic crashes (D) fatal traffic crashes.
Figure 4.
County distribution of traffic crashes by category (2008–2015): (A) total number of traffic crashes (B) minor traffic crashes (C) severe traffic crashes (D) fatal traffic crashes.

Figure 5.
The regression line and Pearson correlation coefficient between traffic crashes and (A) New cars; (B) Domestic second-hand cars (DSHC); (C) Imported second-hand cars (ISHC); (D) Total registered cars.
Figure 5.
The regression line and Pearson correlation coefficient between traffic crashes and (A) New cars; (B) Domestic second-hand cars (DSHC); (C) Imported second-hand cars (ISHC); (D) Total registered cars.
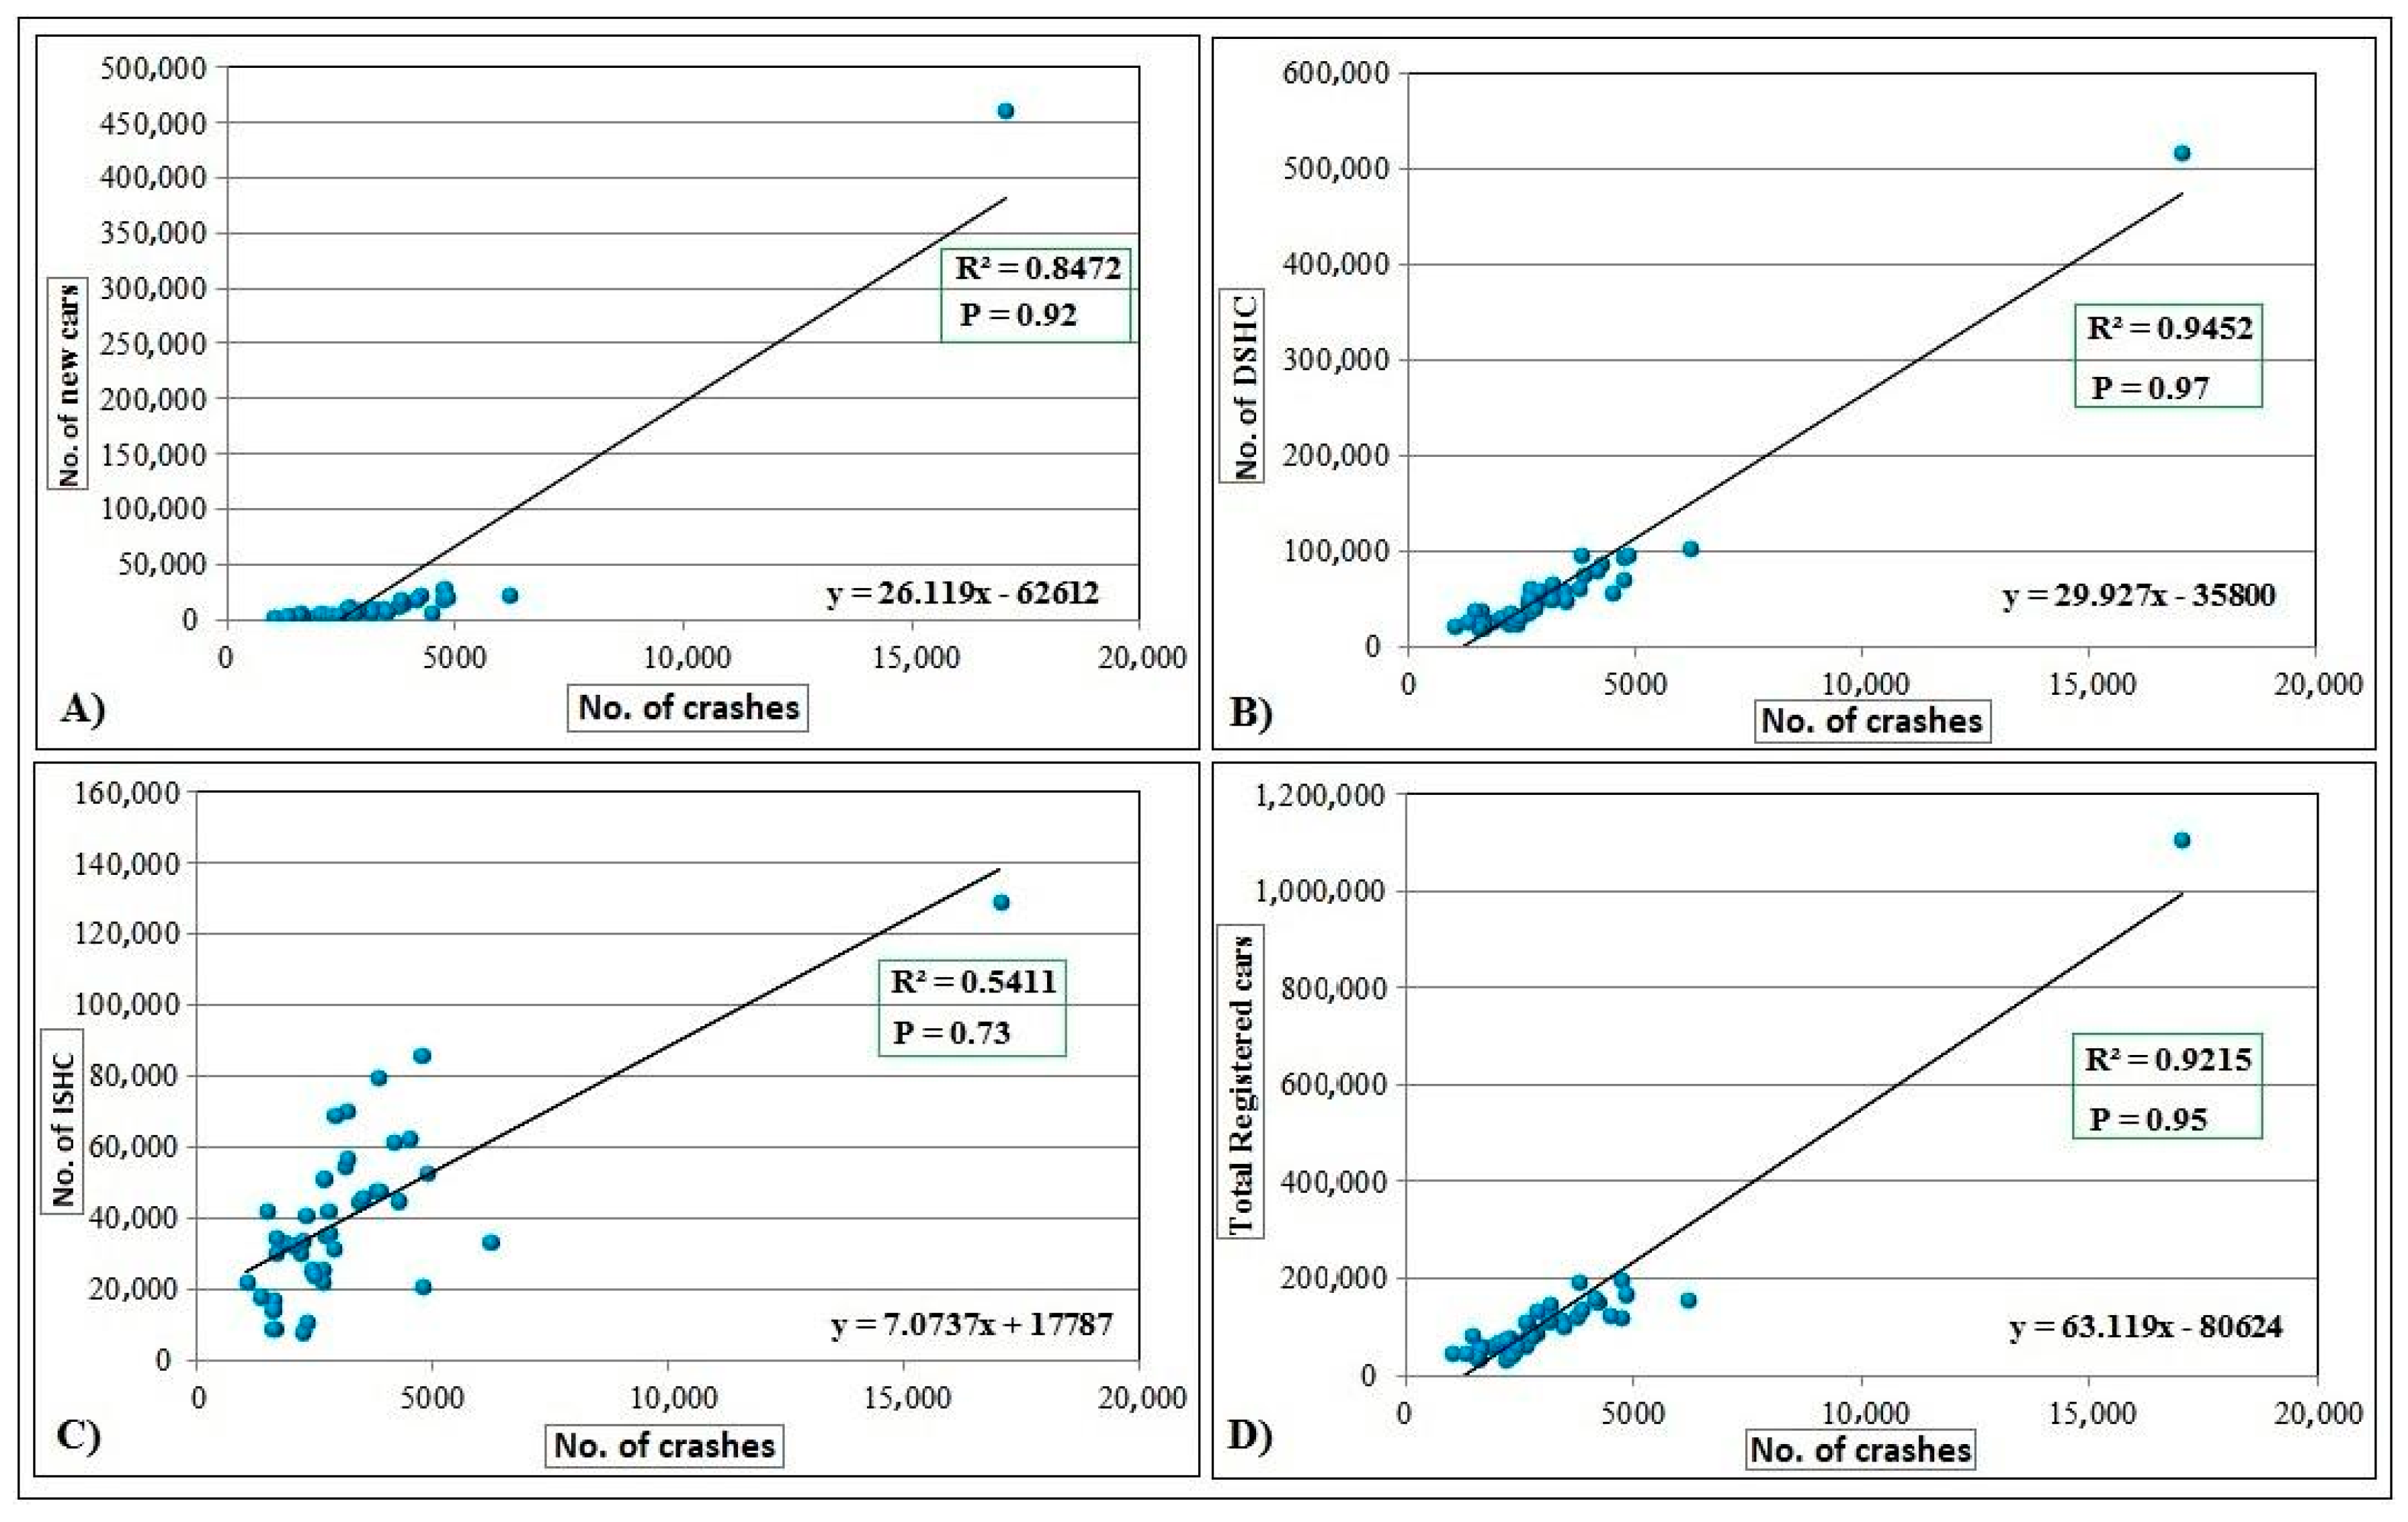
Figure 6.
The regression line and Pearson correlation coefficient between Imported second-hand cars (ISHC) and (A) Total Traffic Crashes; (B) Minor Traffic Crashes; (C) Severe Traffic Crashes; (D) Fatal Traffic Crashes.
Figure 6.
The regression line and Pearson correlation coefficient between Imported second-hand cars (ISHC) and (A) Total Traffic Crashes; (B) Minor Traffic Crashes; (C) Severe Traffic Crashes; (D) Fatal Traffic Crashes.
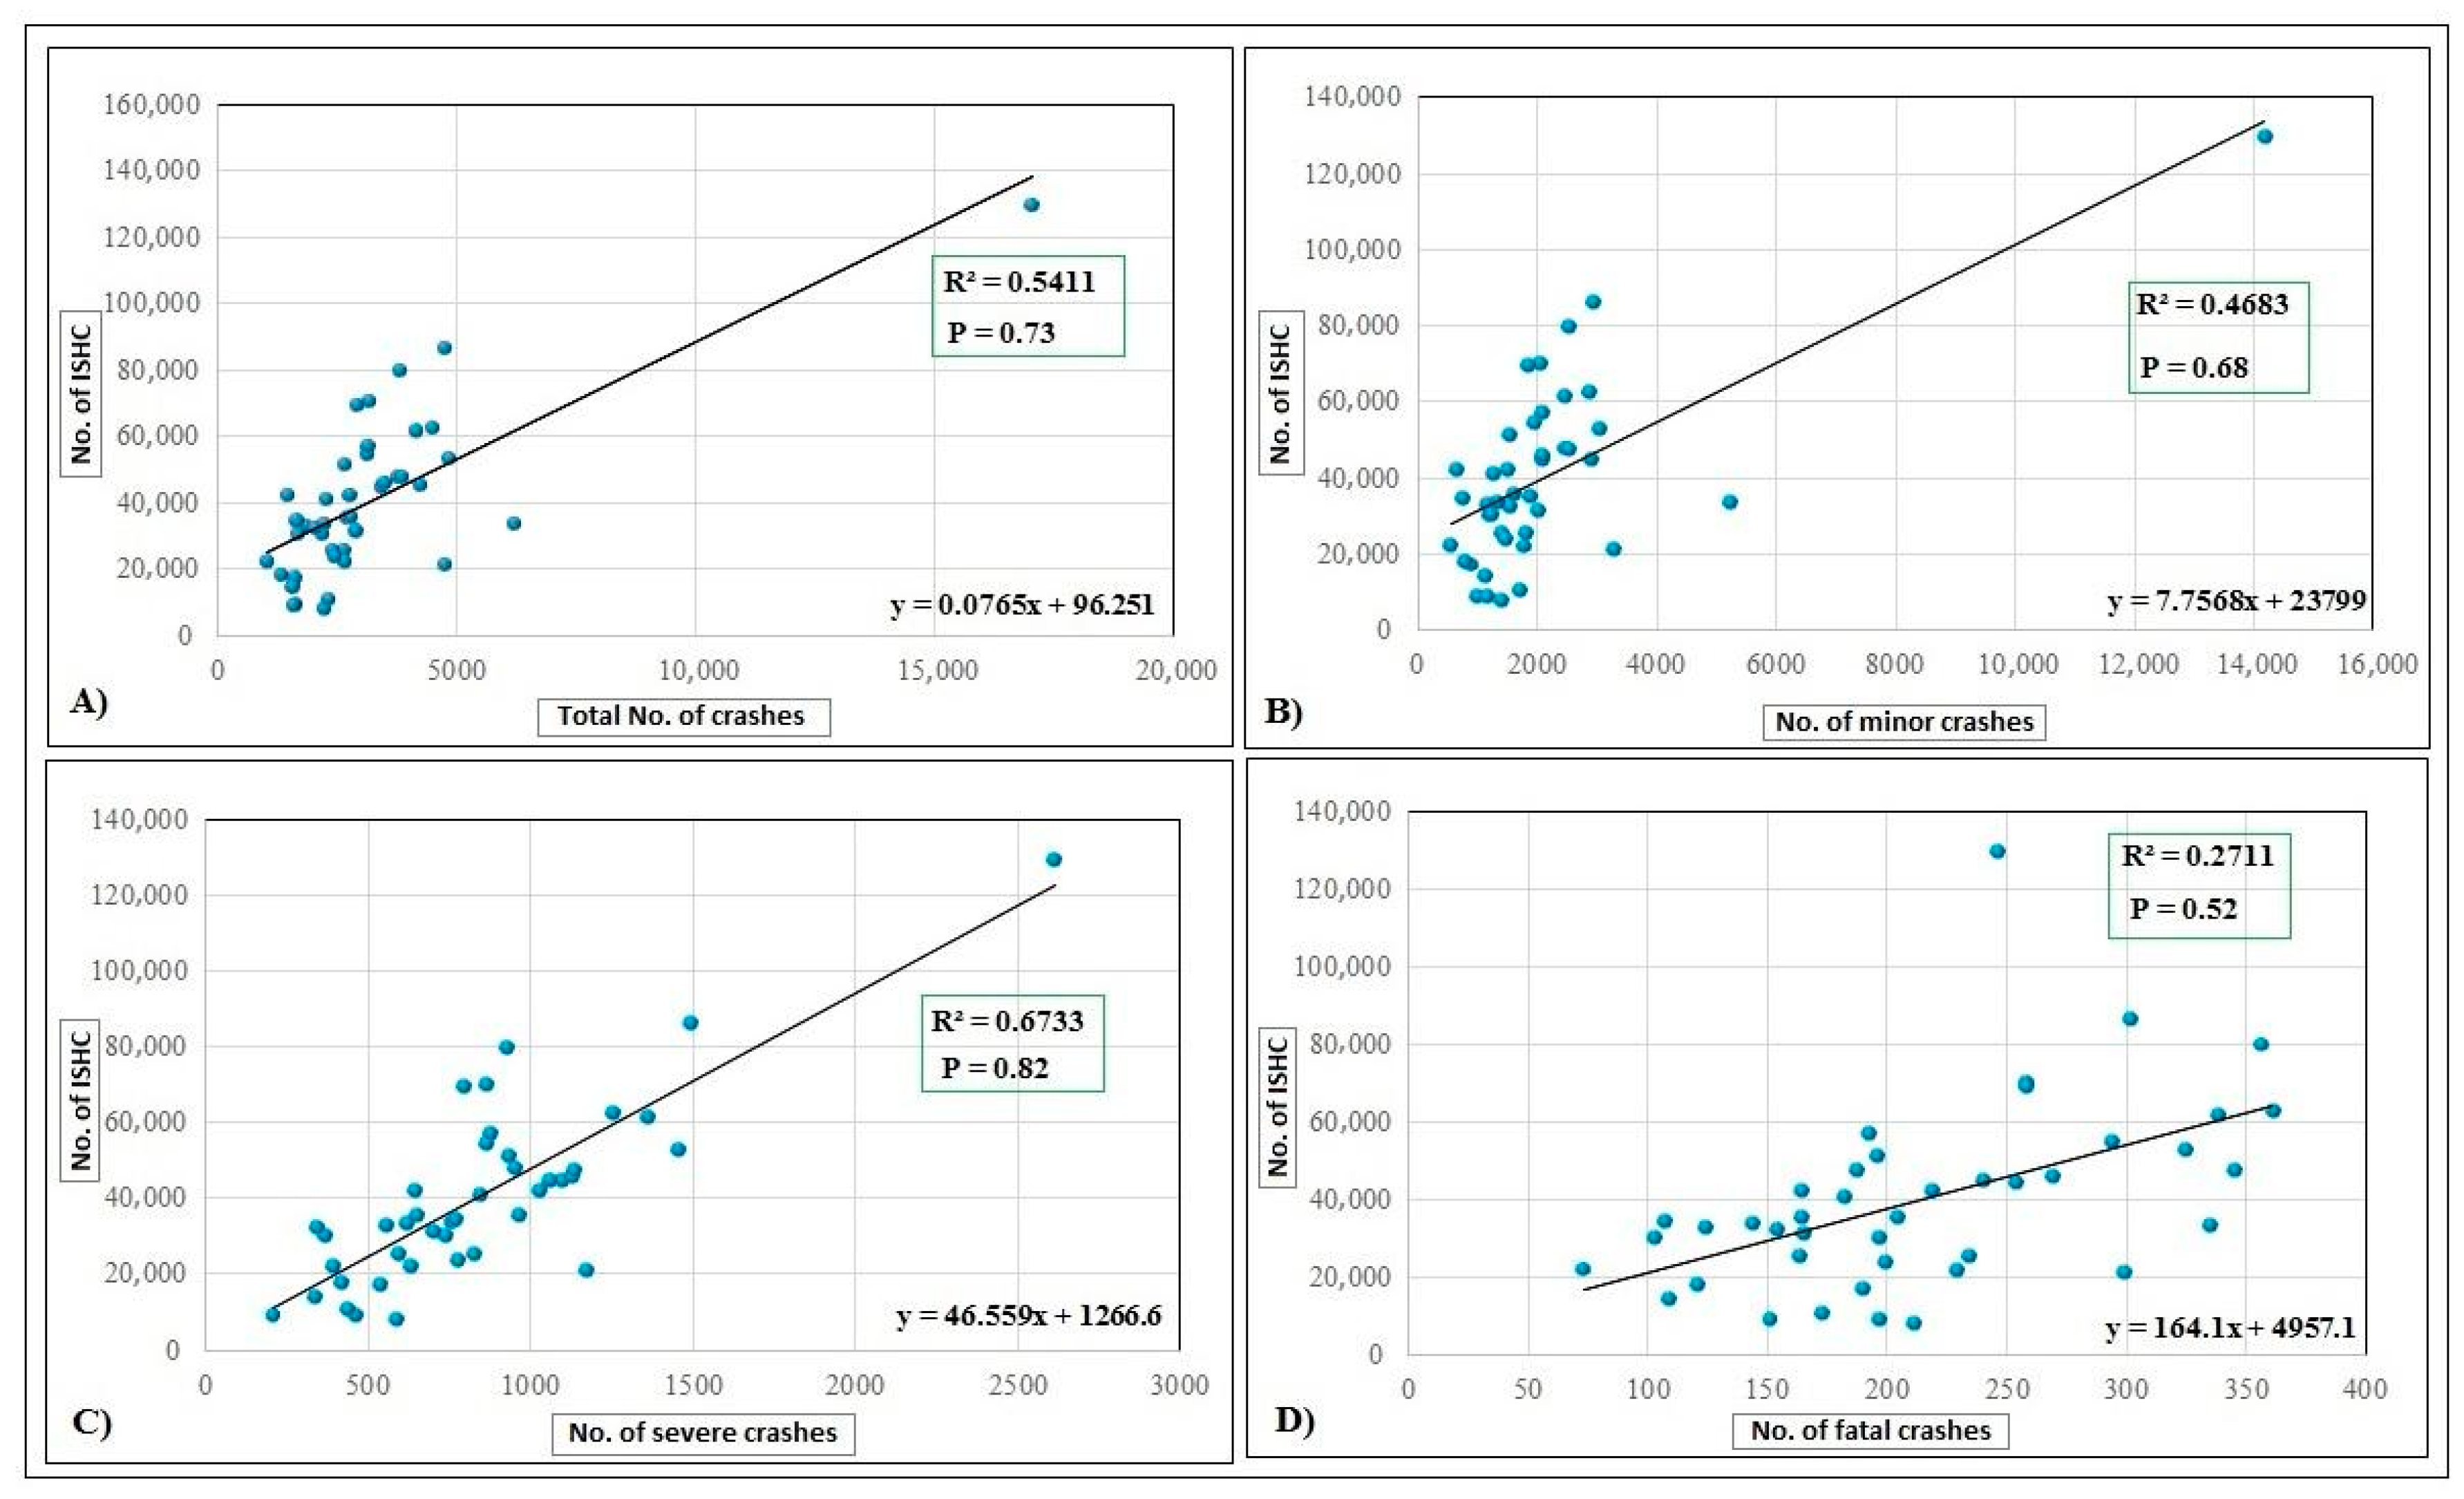
Figure 7.
Right hand driving (RHD) imported second-hand cars and traffic crashes analysis (2008–2015): (A) Distribution of RHD imported cars at the county level; (B) Distribution of RHD imported second-hand cars (ISHC) involved in traffic crashes at the county level; (C) RHD traffic crashes involving RHD and RHD imported second-hand cars (ISHC) for the period 2008–2015; (D) The regression line and Pearson correlation coefficient between traffic crashes involving RHD cars and volume of RHD imported second-hand cars (ISHC).


Table 1.
Number of crashes, number of vehicles, type of casualties and fatality rate (2008–2015).
| Year | Crashes | Vehicles | Minor | Severe | Fatal | Total Casualties | Fatalities Per 1 mil. Inhabitants |
|---|---|---|---|---|---|---|---|
| 2008 | 18,847 | 31,551 | 20,117 | 6240 | 2028 | 28,385 | 98 |
| 2009 | 18,001 | 30,403 | 19,235 | 6011 | 1791 | 27,037 | 88 |
| 2010 | 16,097 | 27,518 | 17,269 | 5592 | 1472 | 24,333 | 73 |
| 2011 | 16,483 | 28,174 | 17,802 | 5665 | 1225 | 24,692 | 61 |
| 2012 | 16,482 | 28,166 | 18,282 | 5691 | 1234 | 25,207 | 60 |
| 2013 | 14,987 | 26,011 | 16,637 | 5206 | 1078 | 22,921 | 54 |
| 2014 | 15,065 | 26,390 | 17,118 | 5093 | 1085 | 23,296 | 54 |
| 2015 | 17,389 | 30,665 | 19,649 | 5717 | 1159 | 26,525 | 58 |
| Total | 133,351 | 205,127 | 146,109 | 39,599 | 11,072 | 202,396 | 69 * |
* The average of fatalities per 1 mil. Inhabitants.
© 2017 by the authors. Licensee MDPI, Basel, Switzerland. This article is an open access article distributed under the terms and conditions of the Creative Commons Attribution (CC BY) license (http://creativecommons.org/licenses/by/4.0/).
Share and Cite
MDPI and ACS Style
Coșciug, A.; Ciobanu, S.M.; Benedek, J. The Safety of Transnational Imported Second-Hand Cars: A Case Study on Vehicle-to-Vehicle Crashes in Romania. Sustainability 2017, 9, 2380. https://doi.org/10.3390/su9122380
AMA Style
Coșciug A, Ciobanu SM, Benedek J. The Safety of Transnational Imported Second-Hand Cars: A Case Study on Vehicle-to-Vehicle Crashes in Romania. Sustainability. 2017; 9(12):2380. https://doi.org/10.3390/su9122380
Chicago/Turabian StyleCoșciug, Anatolie, Silviu Marian Ciobanu, and József Benedek. 2017. "The Safety of Transnational Imported Second-Hand Cars: A Case Study on Vehicle-to-Vehicle Crashes in Romania" Sustainability 9, no. 12: 2380. https://doi.org/10.3390/su9122380
Note that from the first issue of 2016, this journal uses article numbers instead of page numbers. See further details here.