Monitoring the Different Types of Urban Construction Land Expansion (UCLE) in China’s Port City: A Case Study of Ningbo’s Central City


Abstract
:1. Introduction
2. Materials and Methods
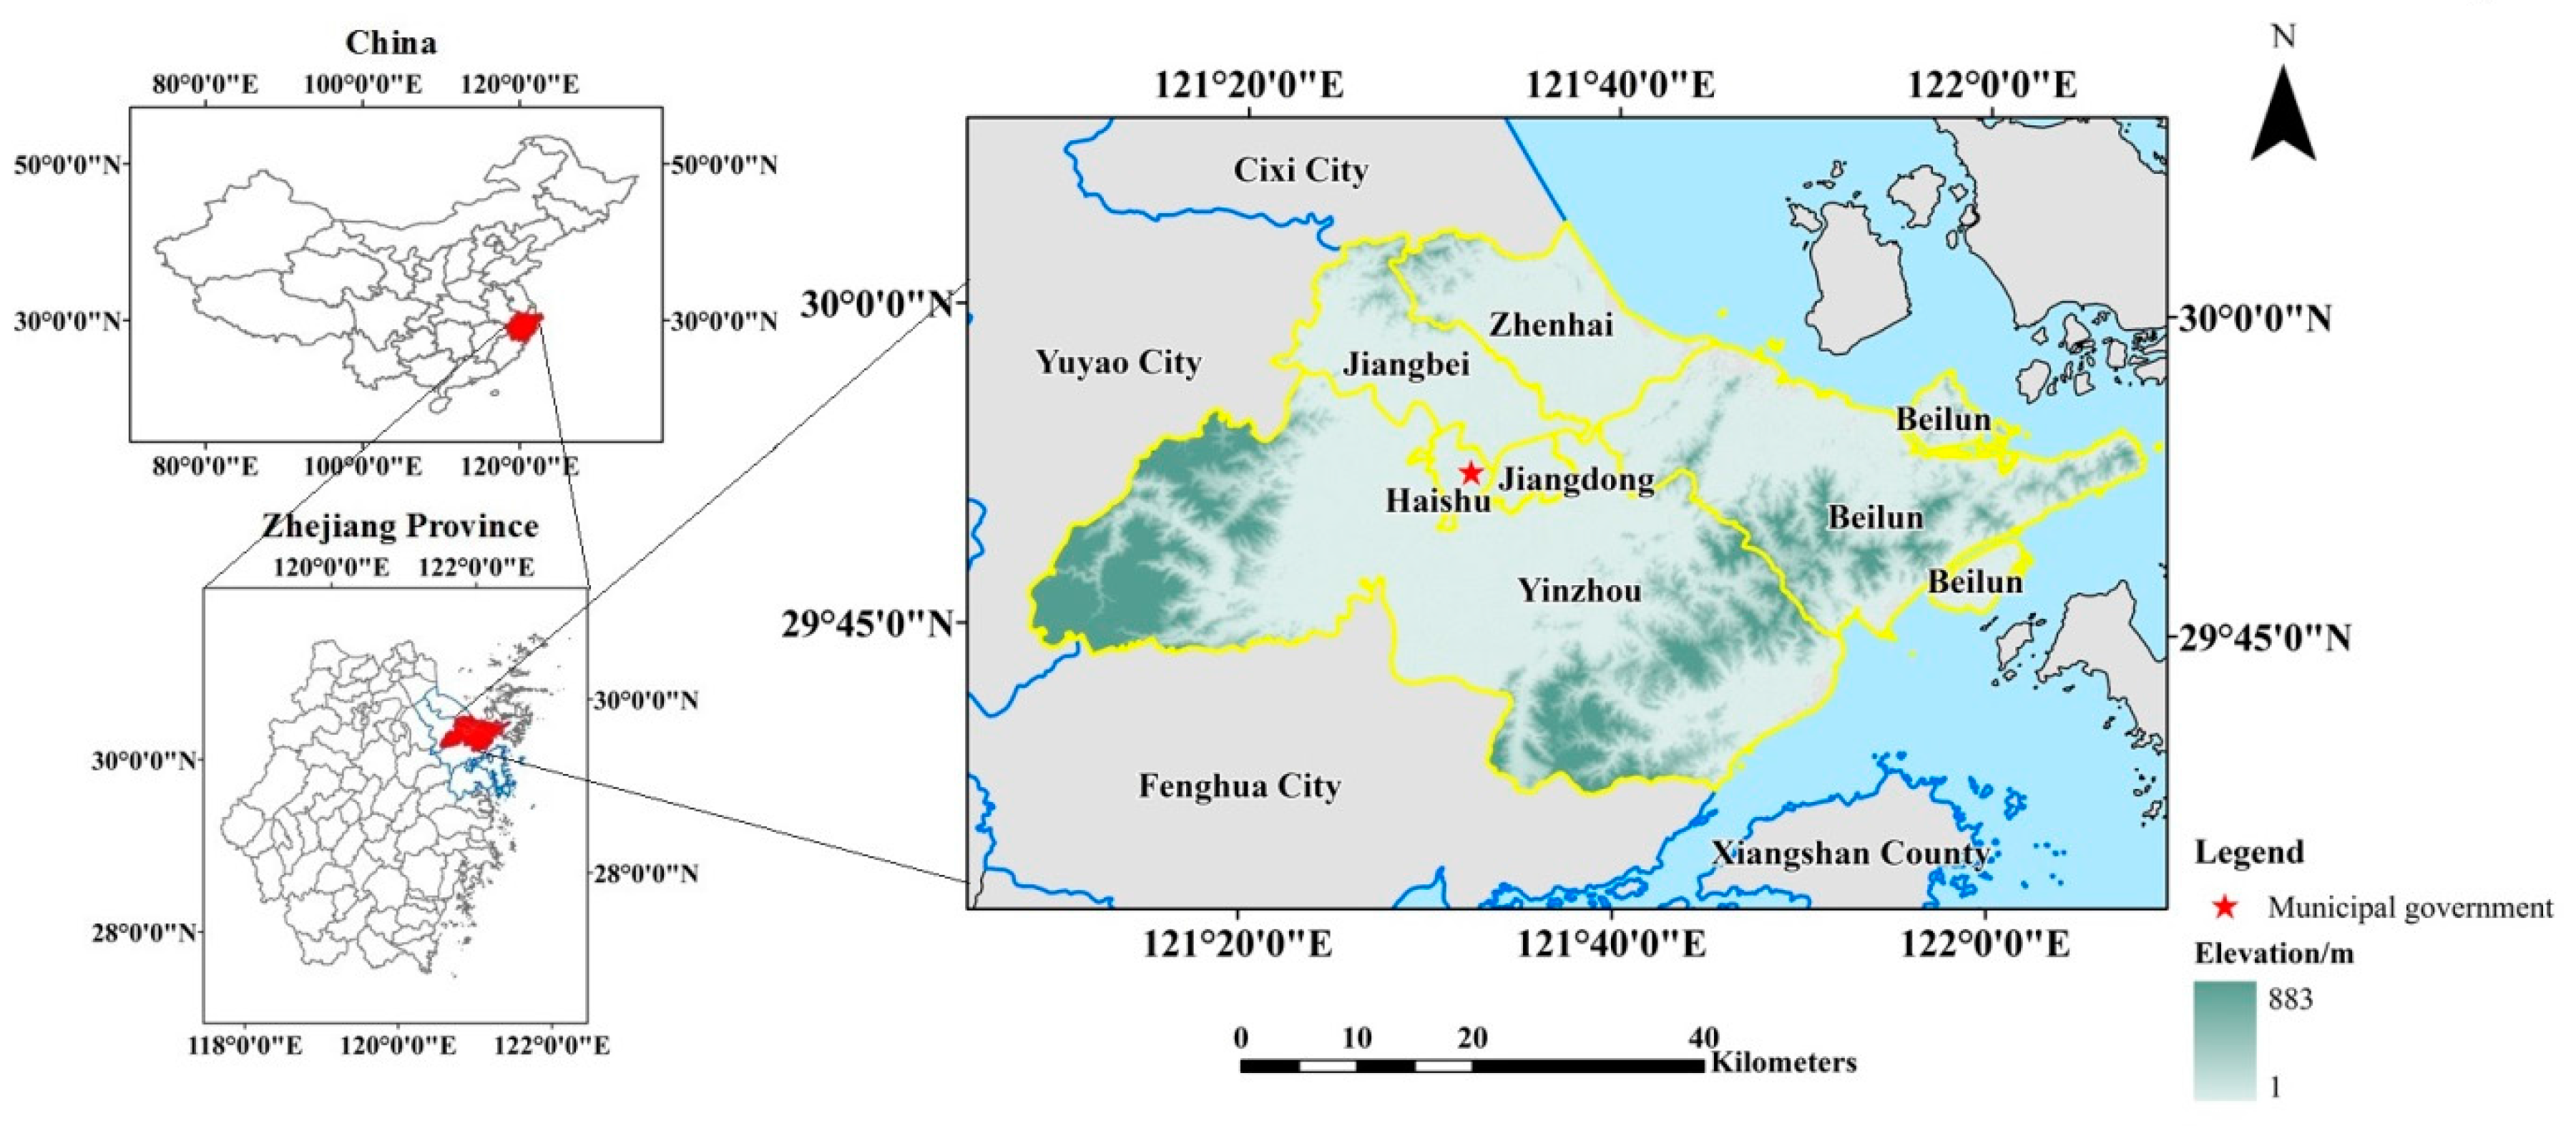
2.1. Study Area
2.2. Data Preparation
2.3. Methods
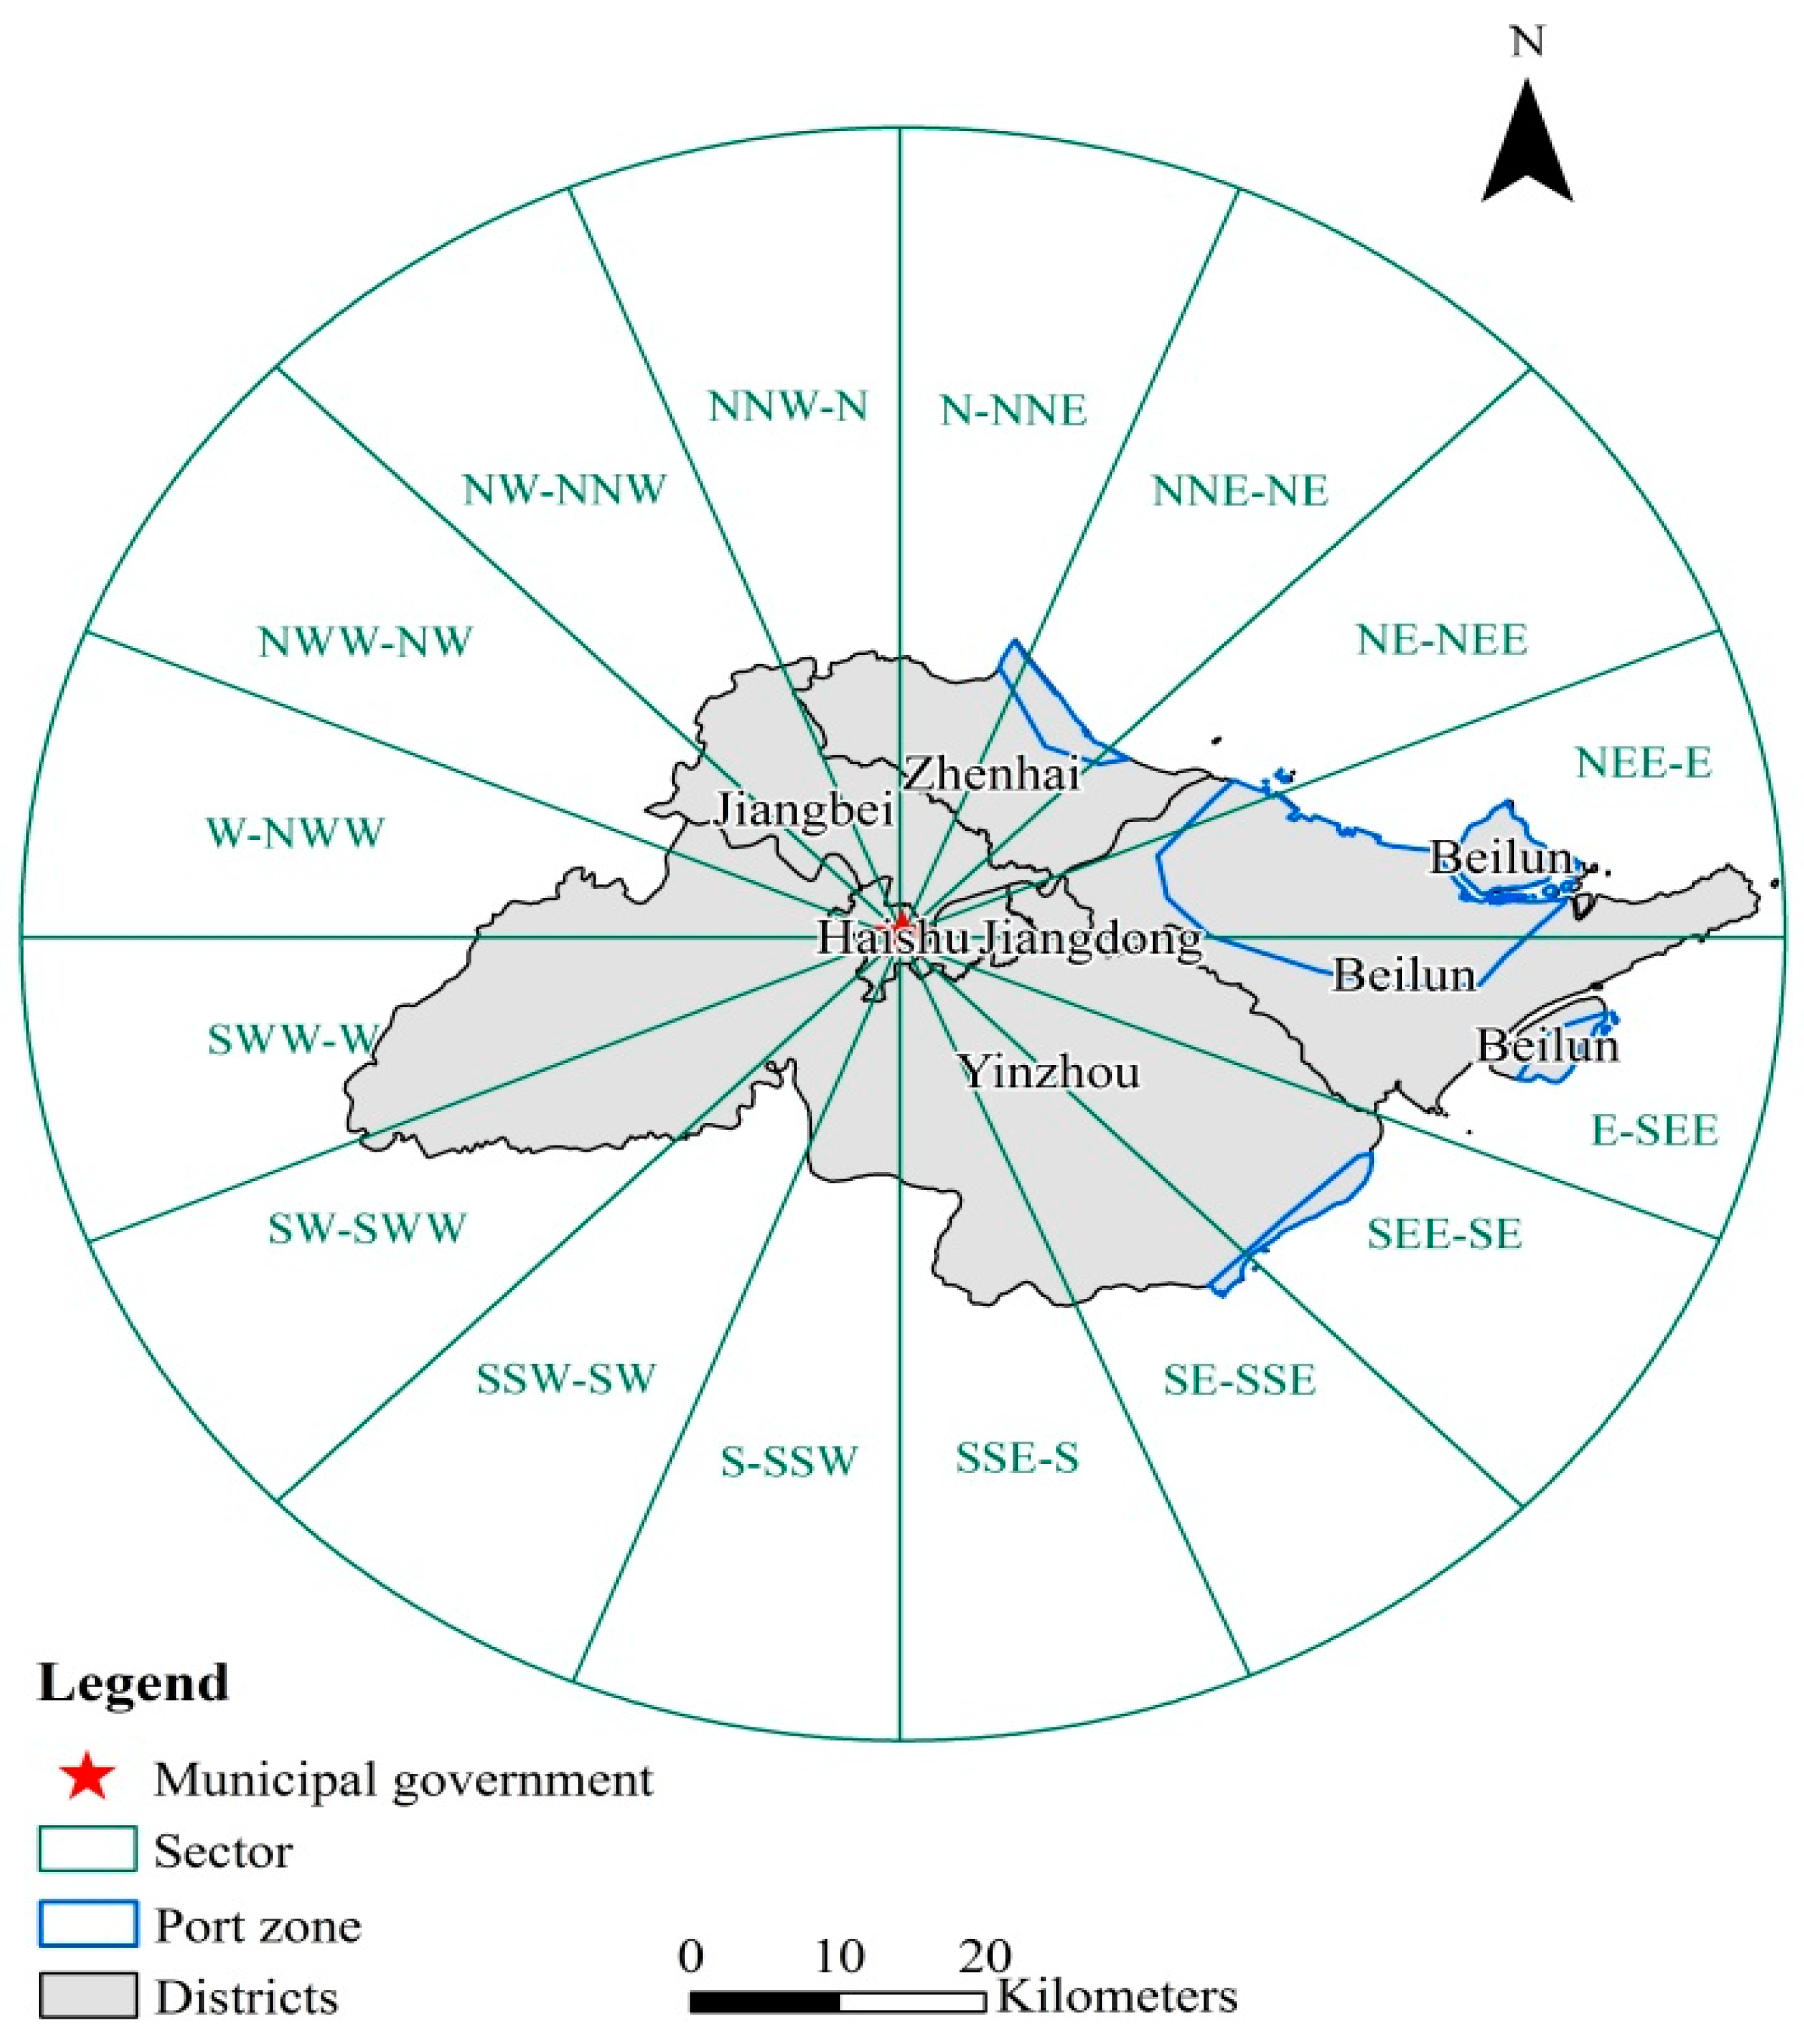
2.3.1. Equality Fan Analysis
2.3.2. Kernel Density Analysis
3. Results
3.1. Spatial–Temporal Characteristics of UCLE
3.1.1. The Whole Central City
3.1.2. The Port Zones
3.2. Spatial Differentiation of UCLE
3.3. Evolution Pattern of UCLE
4. Discussion
4.1. Spatial and Temporal Variation of UCLE
4.1.1. Temporal Variation
4.1.2. Spatial Variation
4.2. Spatial Evolution Pattern of UCLE
4.3. Sustainable Development in a Port City
4.3.1. Sustainable UCLE
4.3.2. Sustainable Development of the Social Economy
5. Conclusions
- (1)
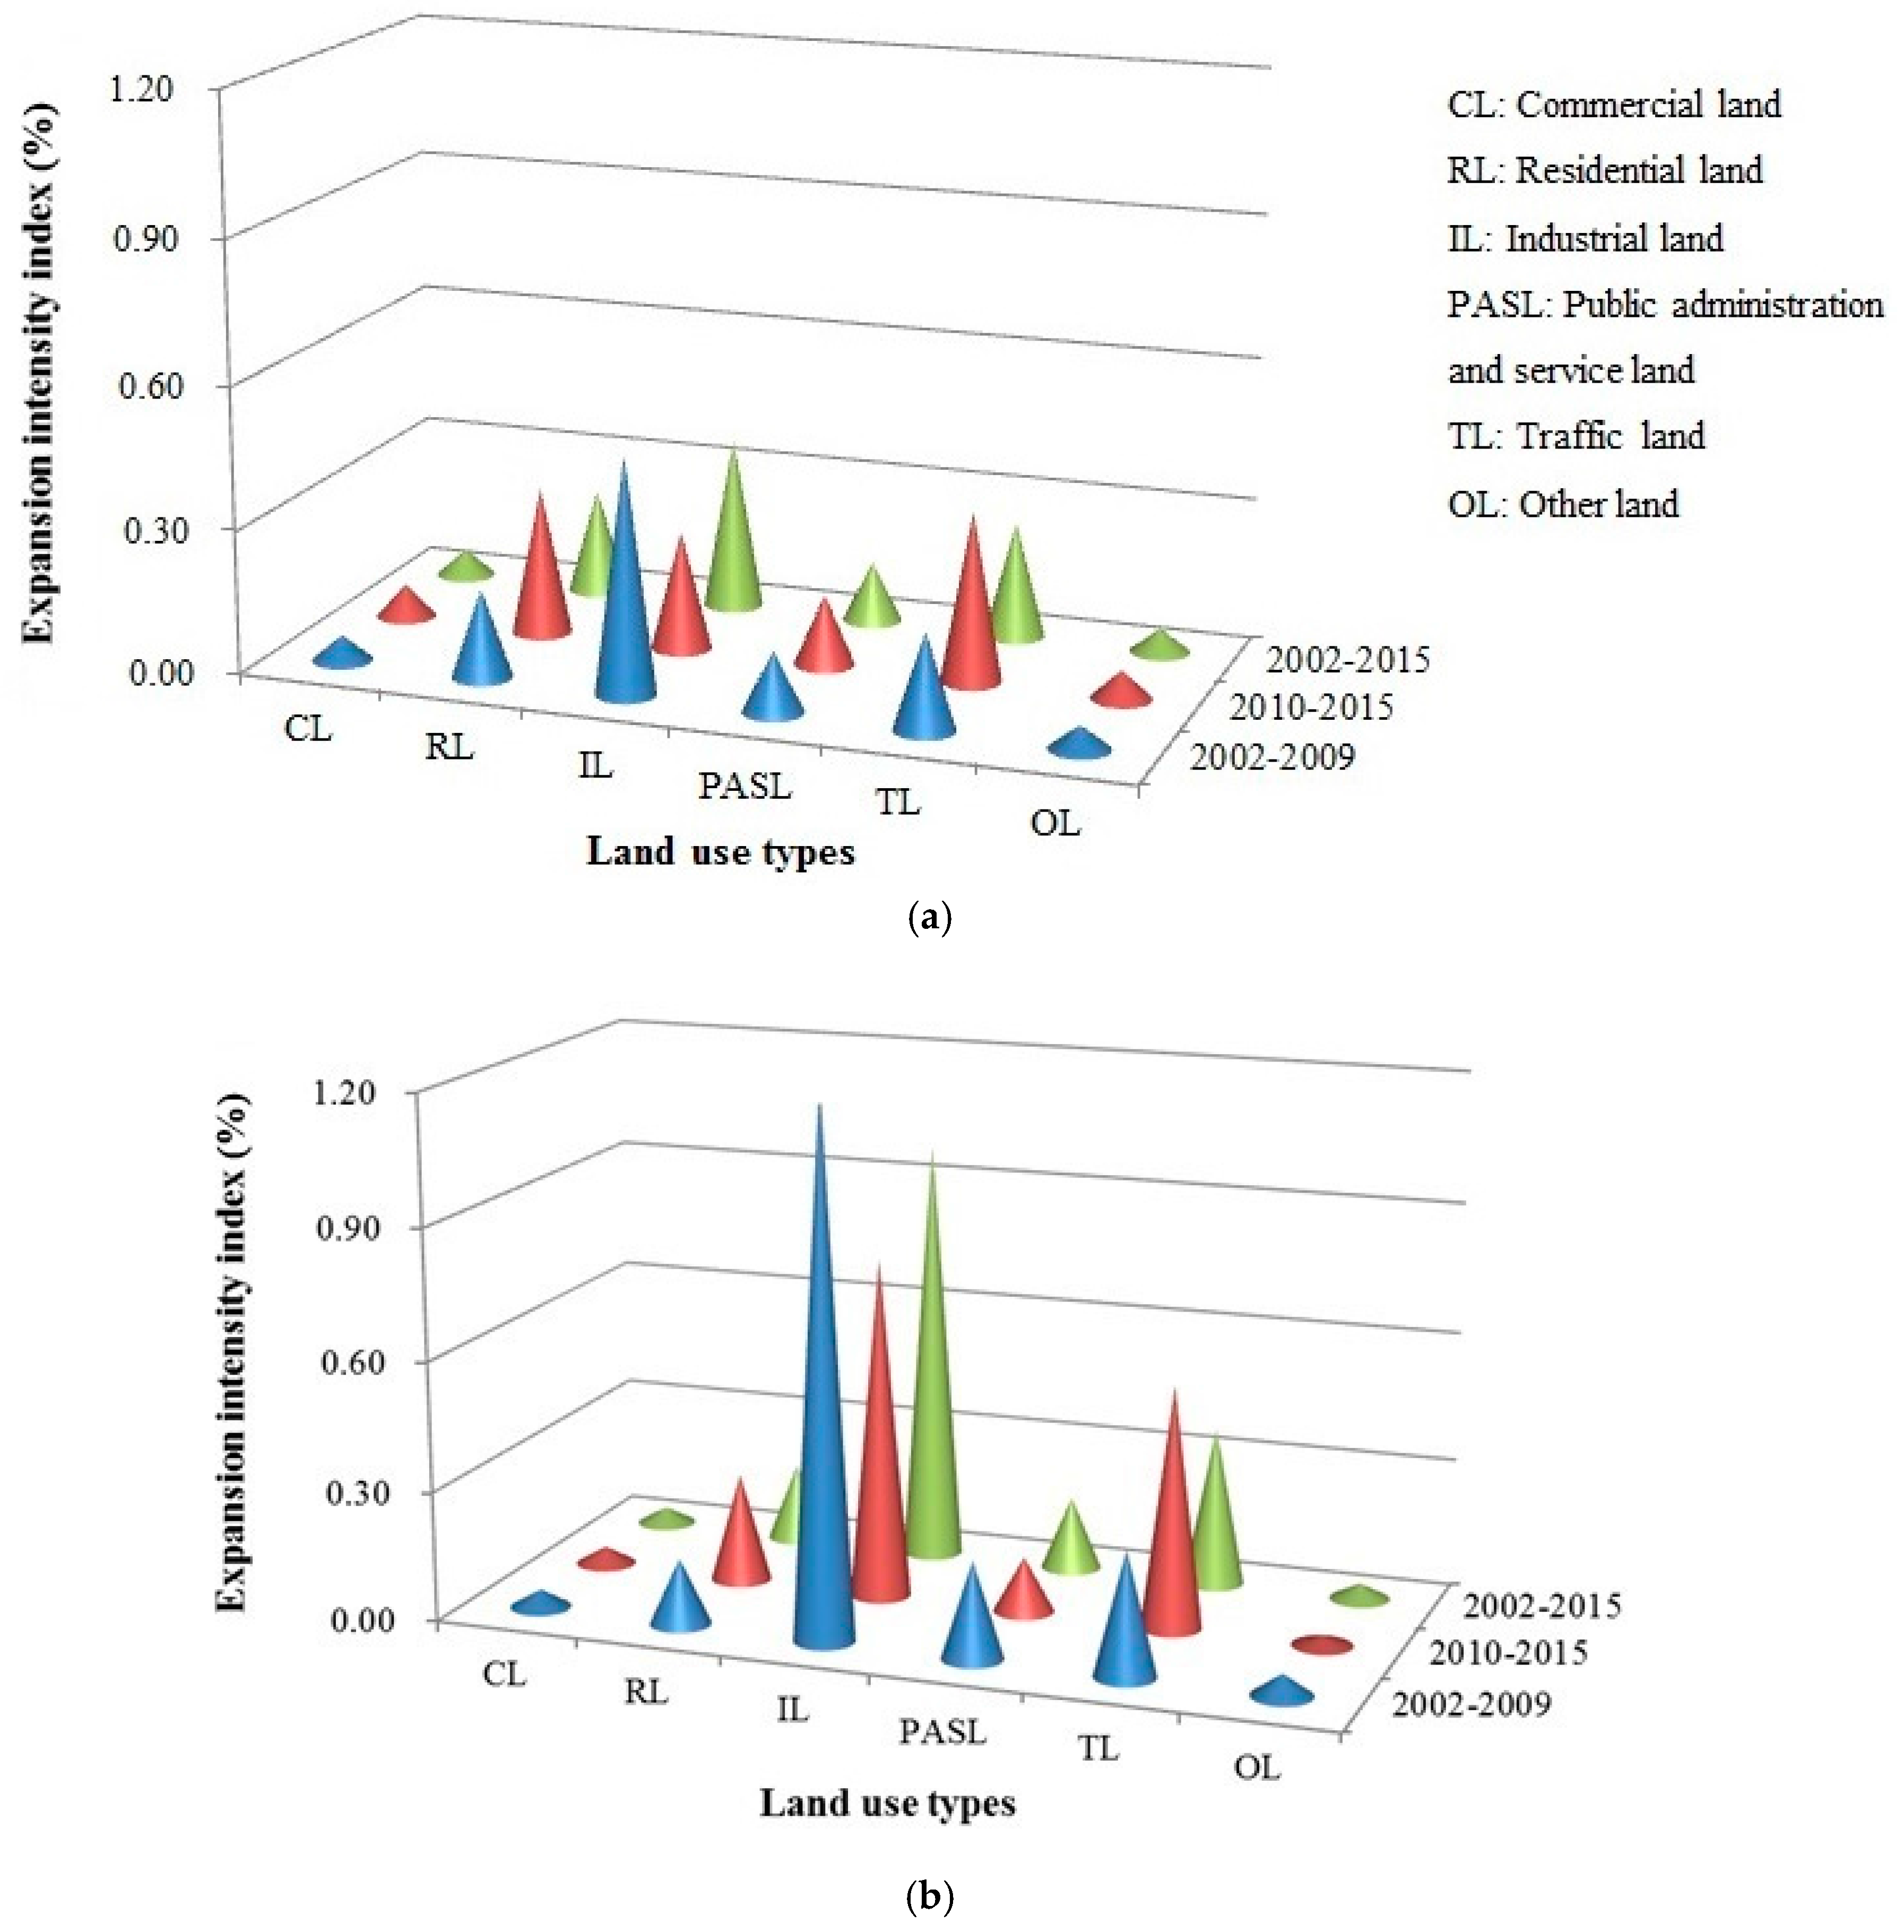
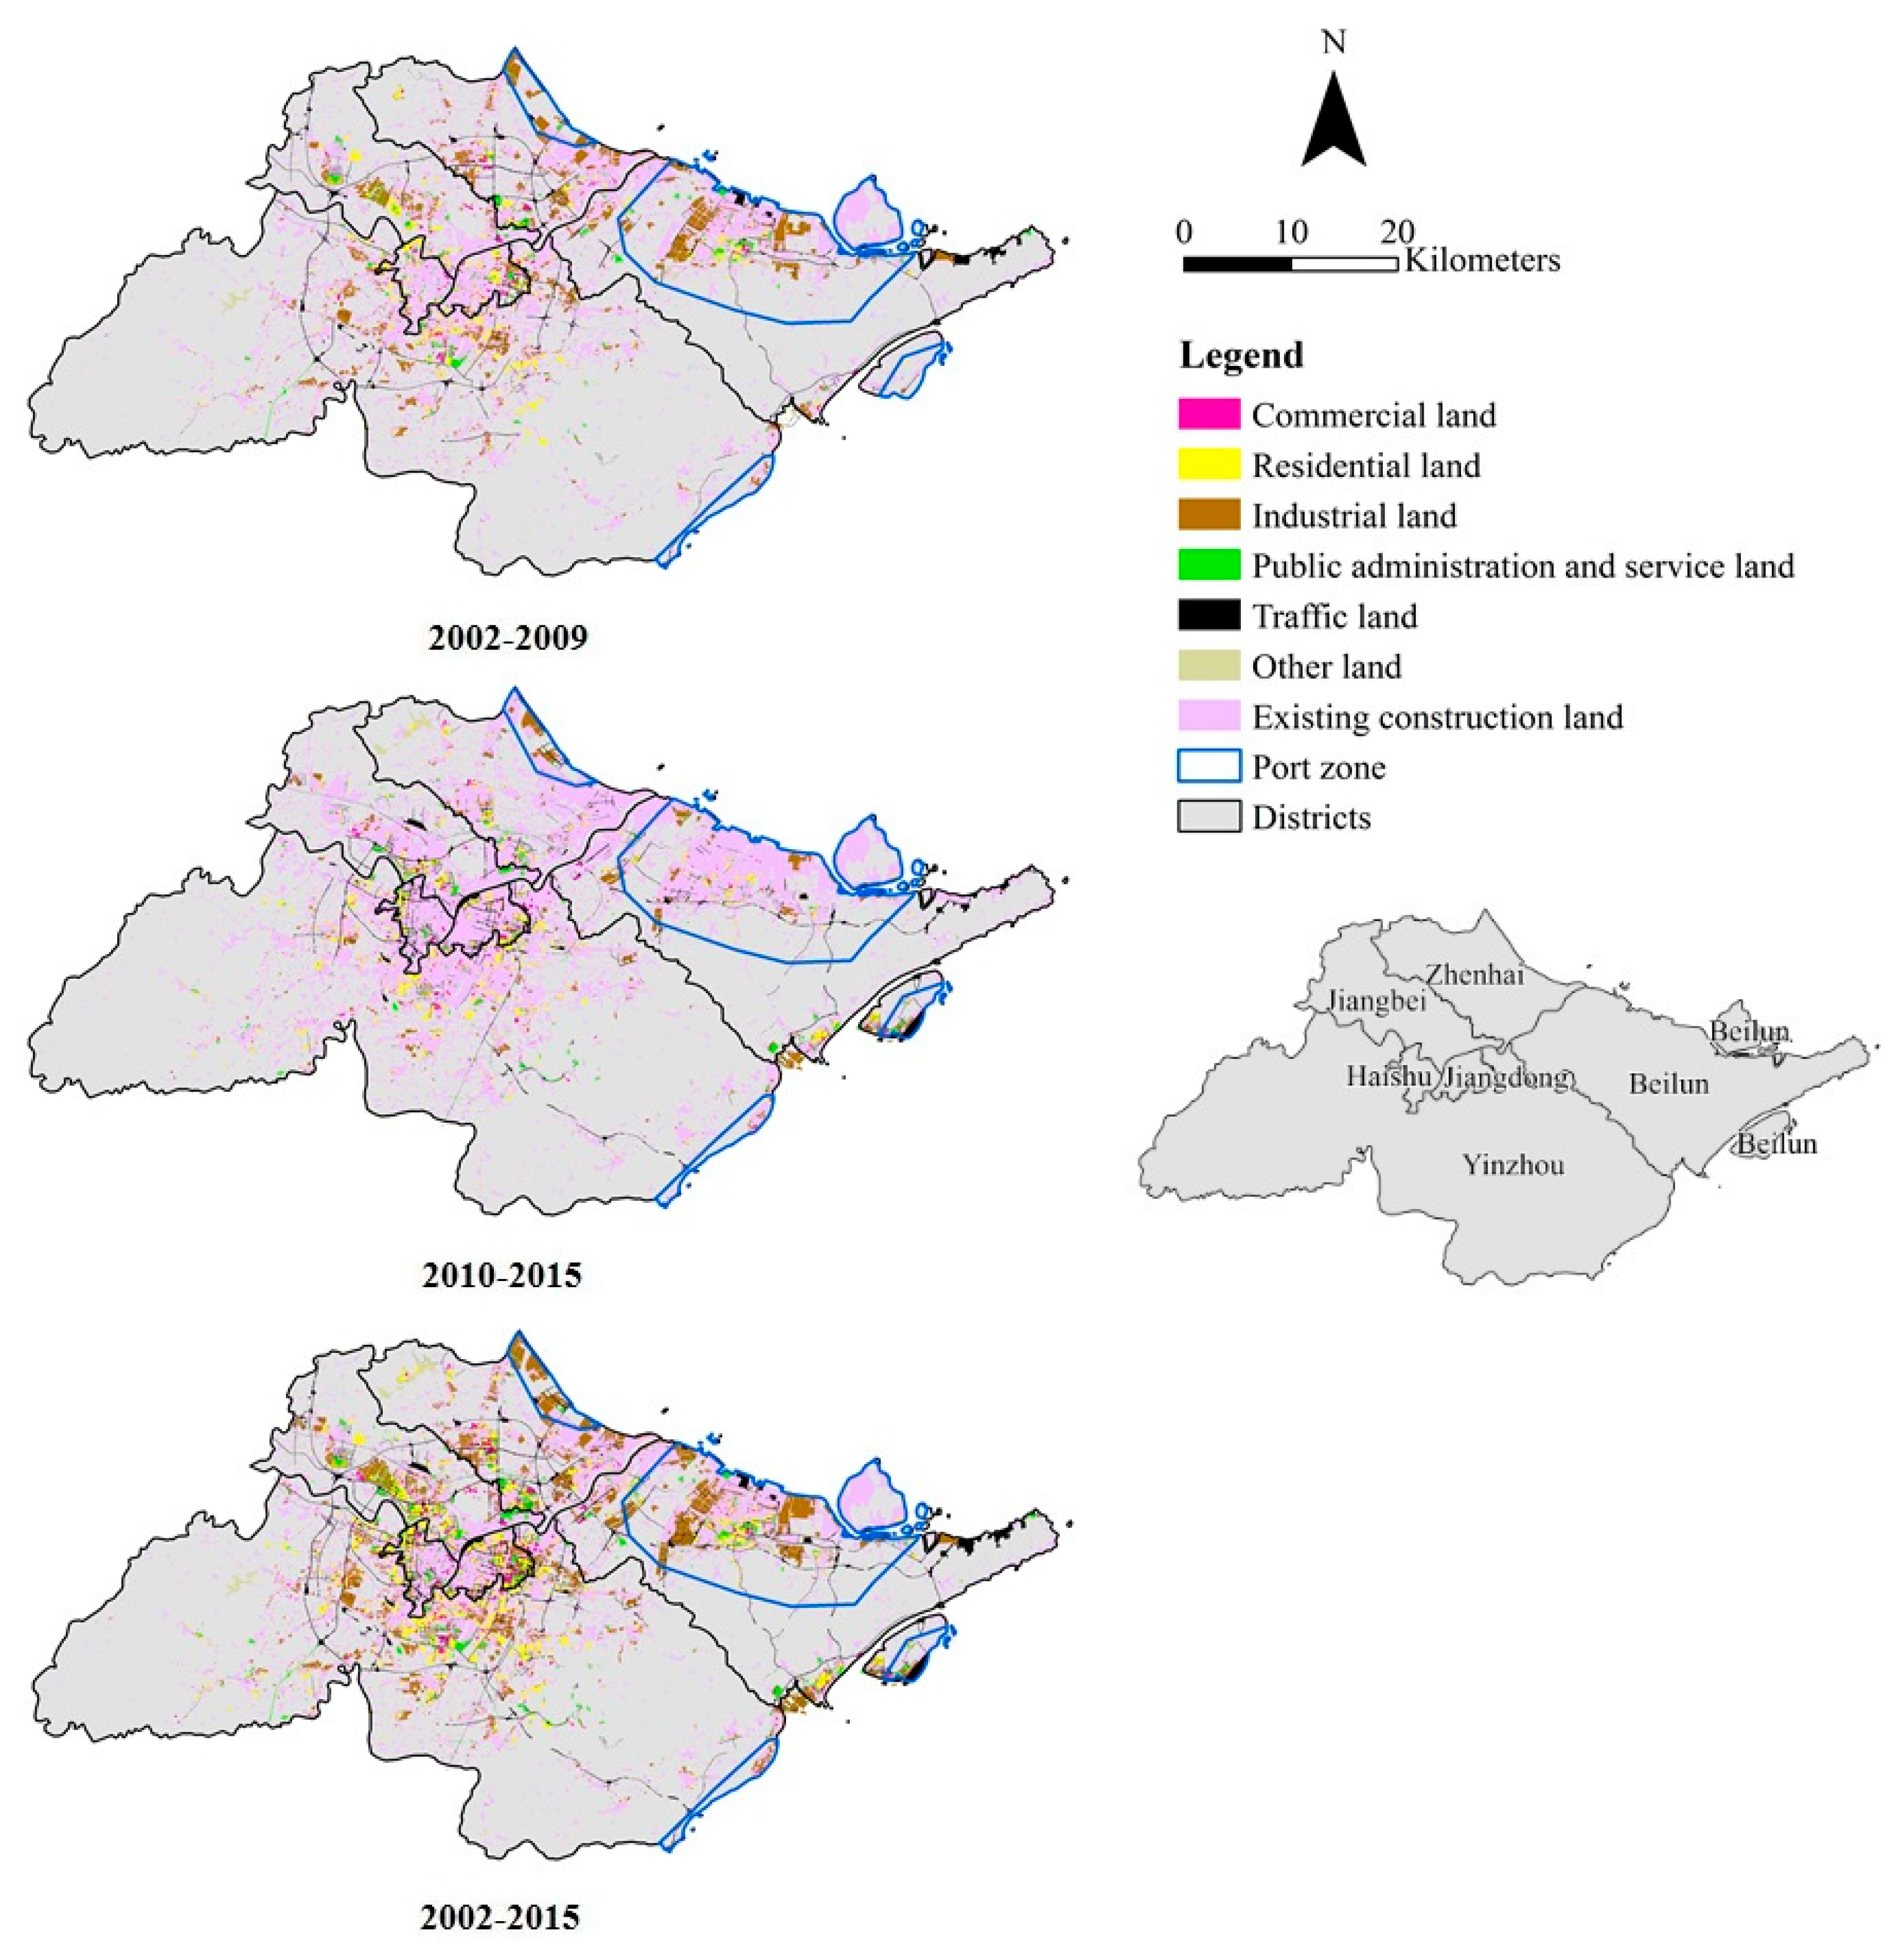
- The overall UCLE in Ningbo’s central city from 2002 to 2015 was huge and maintained a fast growth trend. The rank of the expansion size and intensity of construction land was: industrial land > traffic land > residential land > public land > commercial land. These UCLE were mainly adjacent to the existing construction land and presented a pattern of outward expansion from the urban center.
- (2)
- The UCLE in the port zones was prominent and the expansion intensity was higher than that of the whole central city, especially industrial land. UCLE was adjacent to the existing construction land in the port zones of the Beilun District, while the expansion of new and isolated construction lands occurred in the port zones of the Zhenhai District.
- (3)
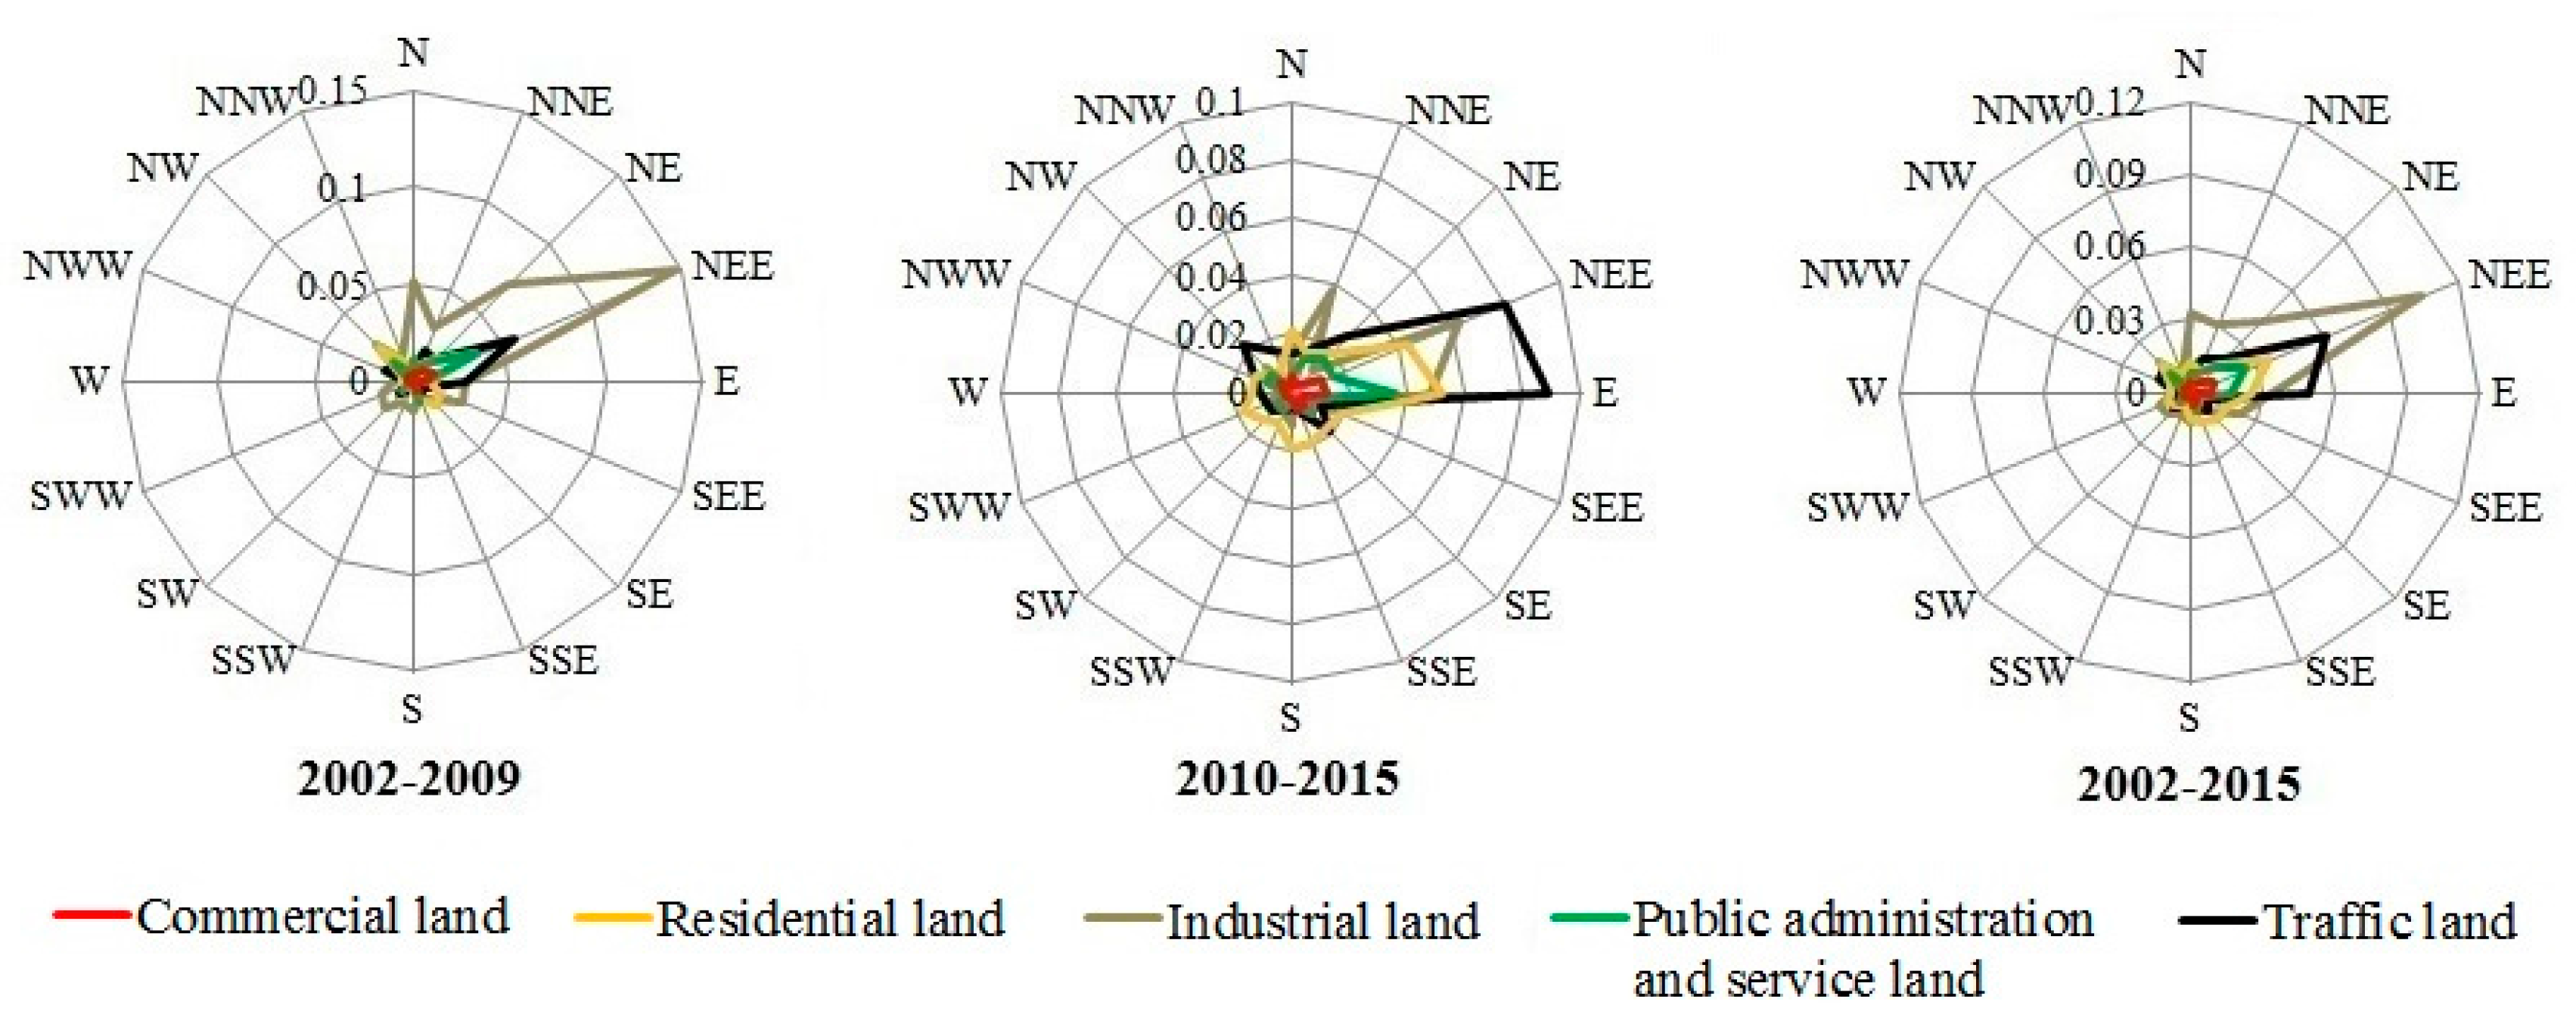
- The dominant extension wings of all five types of construction lands were NEE-E-SEE and N-NNE-NE, which covered most of the port zones in the Zhenhai and Beilun Districts. It indicated that the actual urban sprawl in Ningbo was biased toward the port zones.
- (4)
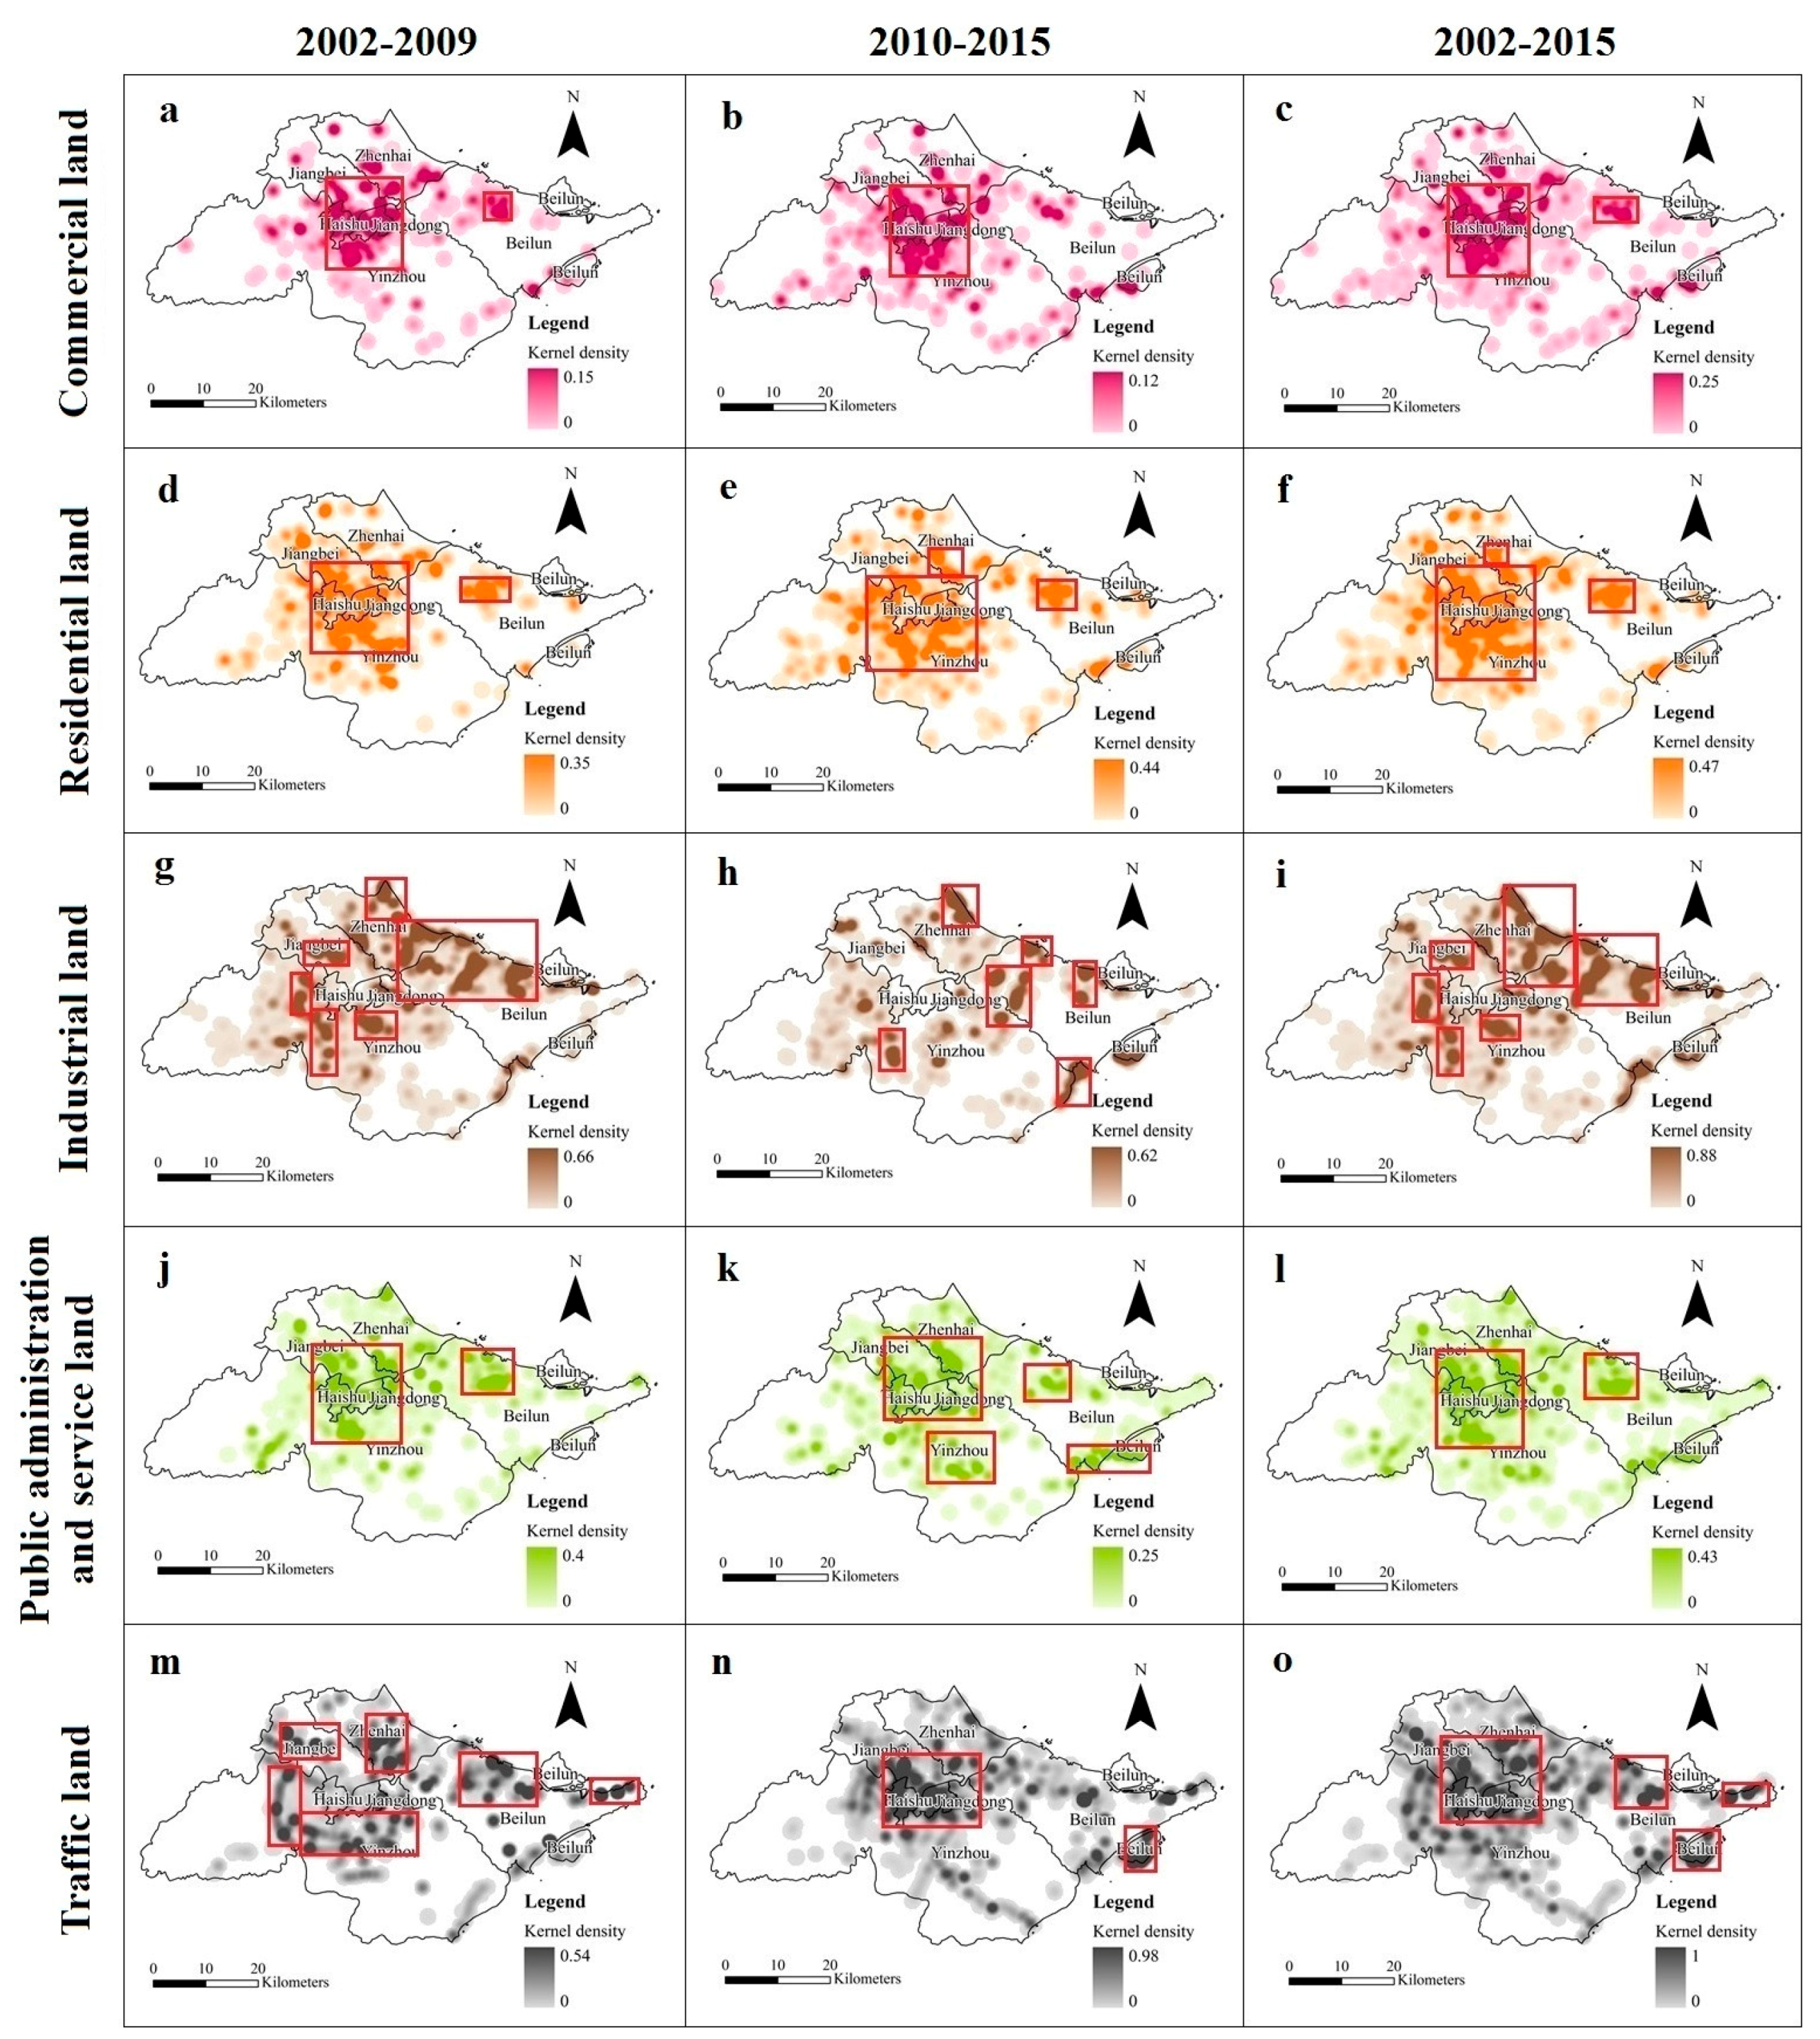
- Commercial and residential land expansions showed a circle-shaped gradient pattern from the traditional urban center to surrounding areas. Industrial land sprawled outside the traditional urban center and in the port zones, which showed a leapfrog pattern. Public and traffic lands expansions illustrated bi-centric pattern, which meant that these two types of UCLE mainly agglomerated around the traditional urban center and in the port zones.
- (5)
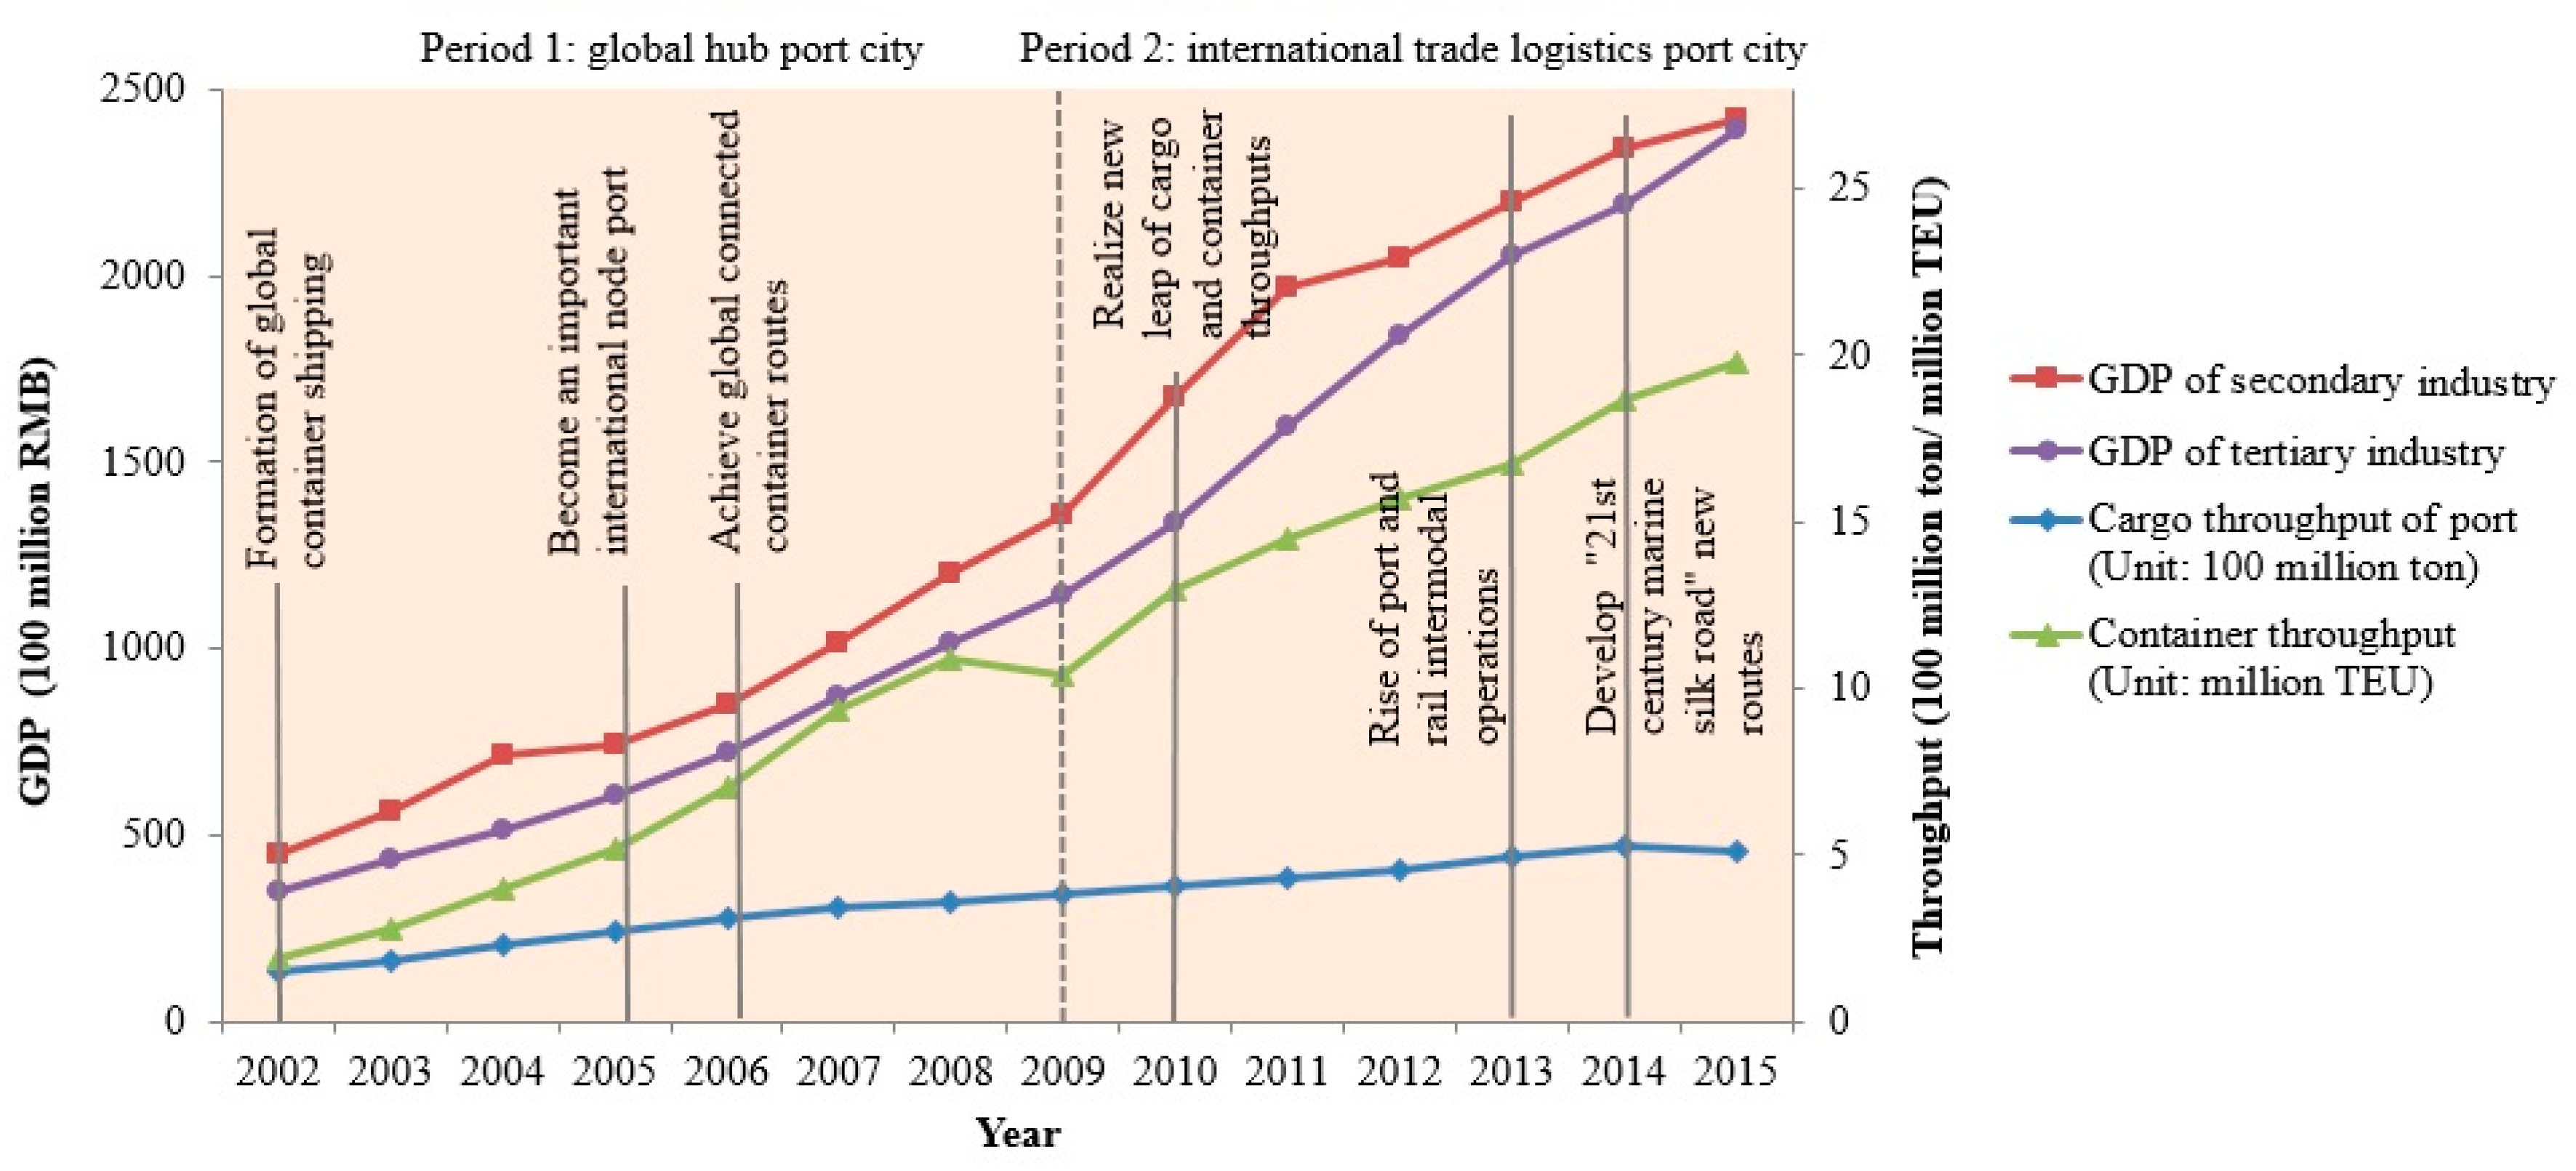
- The internal structure of UCLE in Ningbo was unreasonable. Industrial land expansion should be controlled while residential and public lands should be increased to achieve sustainable UCLE. Additionally, the present industry structure, which was dominated by industry should be transformed to a more balanced structure to promote sustainable development of social economy.
Acknowledgments
Author Contributions
Conflicts of Interest
Appendix A

| Urban Construction Land | Fan Section | Area (ha) | Expansion Intensity Index (%) | ||||
|---|---|---|---|---|---|---|---|
| 2002–2009 | 2010–2015 | 2002–2015 | 2002–2009 | 2010–2015 | 2002–2015 | ||
| Commercial land | N-NNE | 47.83 | 65.67 | 113.50 | 0.0029 | 0.0055 | 0.0036 |
| NNE-NE | 56.32 | 33.74 | 90.06 | 0.0034 | 0.0028 | 0.0029 | |
| NE-NEE | 123.85 | 36.59 | 160.44 | 0.0074 | 0.0031 | 0.0051 | |
| NEE-E | 195.03 | 136.96 | 331.99 | 0.0116 | 0.0114 | 0.0107 | |
| E-SEE | 117.61 | 142.64 | 260.25 | 0.0070 | 0.0119 | 0.0084 | |
| SEE-SE | 24.73 | 48.54 | 73.27 | 0.0015 | 0.0040 | 0.0024 | |
| SE-SSE | 34.74 | 80.42 | 115.16 | 0.0021 | 0.0067 | 0.0037 | |
| SSE-S | 99.51 | 77.76 | 177.27 | 0.0059 | 0.0065 | 0.0057 | |
| S-SSW | 13.3 | 23.84 | 37.14 | 0.0008 | 0.0020 | 0.0012 | |
| SSW-SW | 6.56 | 20.24 | 26.80 | 0.0004 | 0.0017 | 0.0009 | |
| SW-SWW | 27.6 | 29.9 | 57.50 | 0.0016 | 0.0025 | 0.0018 | |
| SWW-W | 35.23 | 17.22 | 52.45 | 0.0021 | 0.0014 | 0.0017 | |
| W-NWW | 7.08 | 13.96 | 21.04 | 0.0004 | 0.0012 | 0.0007 | |
| NWW-NW | 27.77 | 26.01 | 53.78 | 0.0017 | 0.0022 | 0.0017 | |
| NW-NNW | 38.24 | 51.68 | 89.92 | 0.0023 | 0.0043 | 0.0029 | |
| NNW-N | 34.58 | 16.78 | 51.36 | 0.0021 | 0.0014 | 0.0016 | |
| Residential land | N-NNE | 139.3 | 253.19 | 392.49 | 0.0083 | 0.0211 | 0.0126 |
| NNE-NE | 145.05 | 171.93 | 316.98 | 0.0086 | 0.0143 | 0.0102 | |
| NE-NEE | 254.27 | 219.49 | 473.76 | 0.0152 | 0.0183 | 0.0152 | |
| NEE-E | 591.21 | 521.48 | 1112.69 | 0.0352 | 0.0435 | 0.0357 | |
| E-SEE | 158.97 | 619.15 | 778.12 | 0.0095 | 0.0517 | 0.0250 | |
| SEE-SE | 268.17 | 224.86 | 493.03 | 0.0160 | 0.0188 | 0.0158 | |
| SE-SSE | 301.74 | 214.4 | 516.14 | 0.0180 | 0.0179 | 0.0166 | |
| SSE-S | 185.54 | 222.88 | 408.42 | 0.0111 | 0.0186 | 0.0131 | |
| S-SSW | 120.25 | 231.4 | 351.65 | 0.0072 | 0.0193 | 0.0113 | |
| SSW-SW | 35.05 | 128.77 | 163.82 | 0.0021 | 0.0107 | 0.0053 | |
| SW-SWW | 85.18 | 161.58 | 246.76 | 0.0051 | 0.0135 | 0.0079 | |
| SWW-W | 80.09 | 210.41 | 290.50 | 0.0048 | 0.0176 | 0.0093 | |
| W-NWW | 81.24 | 157.73 | 238.97 | 0.0048 | 0.0132 | 0.0077 | |
| NWW-NW | 106.63 | 164.72 | 271.35 | 0.0064 | 0.0137 | 0.0087 | |
| NW-NNW | 389.63 | 115.7 | 505.33 | 0.0232 | 0.0097 | 0.0162 | |
| NNW-N | 172.62 | 94.72 | 267.34 | 0.0103 | 0.0079 | 0.0086 | |
| Industrial land | N-NNE | 856.85 | 164.75 | 1021.60 | 0.0511 | 0.0137 | 0.0328 |
| NNE-NE | 496.1 | 452.93 | 949.03 | 0.0296 | 0.0378 | 0.0305 | |
| NE-NEE | 1174.32 | 123.01 | 1297.33 | 0.0700 | 0.0103 | 0.0416 | |
| NEE-E | 2474.81 | 749.95 | 3224.76 | 0.1475 | 0.0626 | 0.1035 | |
| E-SEE | 470.08 | 575.08 | 1045.16 | 0.0280 | 0.0480 | 0.0335 | |
| SEE-SE | 483.27 | 212.9 | 696.17 | 0.0288 | 0.0178 | 0.0223 | |
| SE-SSE | 239.48 | 83.74 | 323.22 | 0.0143 | 0.0070 | 0.0104 | |
| SSE-S | 136.89 | 14.71 | 151.60 | 0.0082 | 0.0012 | 0.0049 | |
| S-SSW | 257.01 | 135.35 | 392.36 | 0.0153 | 0.0113 | 0.0126 | |
| SSW-SW | 211.05 | 80.75 | 291.80 | 0.0126 | 0.0067 | 0.0094 | |
| SW-SWW | 336.34 | 54.43 | 390.77 | 0.0200 | 0.0045 | 0.0125 | |
| SWW-W | 296.53 | 108.3 | 404.83 | 0.0177 | 0.0090 | 0.0130 | |
| W-NWW | 154.81 | 30.6 | 185.41 | 0.0092 | 0.0026 | 0.0059 | |
| NWW-NW | 107.39 | 36.86 | 144.25 | 0.0064 | 0.0031 | 0.0046 | |
| NW-NNW | 432.91 | 141.82 | 574.73 | 0.0258 | 0.0118 | 0.0184 | |
| NNW-N | 196.84 | 14.99 | 211.83 | 0.0117 | 0.0013 | 0.0068 | |
| Public administration and service land | N-NNE | 190.26 | 59.64 | 249.90 | 0.0113 | 0.0050 | 0.0080 |
| NNE-NE | 122.66 | 152.73 | 275.39 | 0.0073 | 0.0127 | 0.0088 | |
| NE-NEE | 242.46 | 188.61 | 431.07 | 0.0144 | 0.0157 | 0.0138 | |
| NEE-E | 601.75 | 184.23 | 785.98 | 0.0359 | 0.0154 | 0.0252 | |
| E-SEE | 106.72 | 432.42 | 539.14 | 0.0064 | 0.0361 | 0.0173 | |
| SEE-SE | 42.83 | 80.9 | 123.73 | 0.0026 | 0.0067 | 0.0040 | |
| SE-SSE | 64.27 | 132.74 | 197.01 | 0.0038 | 0.0111 | 0.0063 | |
| SSE-S | 190.06 | 61.16 | 251.22 | 0.0113 | 0.0051 | 0.0081 | |
| S-SSW | 58.01 | 33.99 | 92.00 | 0.0035 | 0.0028 | 0.0030 | |
| SSW-SW | 14.64 | 81.95 | 96.59 | 0.0009 | 0.0068 | 0.0031 | |
| SW-SWW | 115.29 | 73.27 | 188.56 | 0.0069 | 0.0061 | 0.0061 | |
| SWW-W | 21.76 | 28.78 | 50.54 | 0.0013 | 0.0024 | 0.0016 | |
| W-NWW | 30.79 | 22.12 | 52.91 | 0.0018 | 0.0018 | 0.0017 | |
| NWW-NW | 28.92 | 103.39 | 132.31 | 0.0017 | 0.0086 | 0.0042 | |
| NW-NNW | 216.95 | 112.45 | 329.40 | 0.0129 | 0.0094 | 0.0106 | |
| NNW-N | 58.22 | 21.37 | 79.59 | 0.0035 | 0.0018 | 0.0026 | |
| Traffic land | N-NNE | 122.64 | 159.21 | 281.85 | 0.0073 | 0.0133 | 0.0090 |
| NNE-NE | 271.17 | 183.11 | 454.28 | 0.0162 | 0.0153 | 0.0146 | |
| NE-NEE | 267.48 | 332.74 | 600.22 | 0.0159 | 0.0278 | 0.0193 | |
| NEE-E | 945.31 | 958.06 | 1903.37 | 0.0563 | 0.0799 | 0.0611 | |
| E-SEE | 462.26 | 1056.63 | 1518.89 | 0.0275 | 0.0882 | 0.0487 | |
| SEE-SE | 133.32 | 138.01 | 271.33 | 0.0079 | 0.0115 | 0.0087 | |
| SE-SSE | 113.97 | 222.49 | 336.46 | 0.0068 | 0.0186 | 0.0108 | |
| SSE-S | 143.19 | 77.66 | 220.85 | 0.0085 | 0.0065 | 0.0071 | |
| S-SSW | 48.27 | 64.90 | 113.17 | 0.0029 | 0.0054 | 0.0036 | |
| SSW-SW | 90.24 | 84.21 | 174.45 | 0.0054 | 0.0070 | 0.0056 | |
| SW-SWW | 157.17 | 110.81 | 267.98 | 0.0094 | 0.0092 | 0.0086 | |
| SWW-W | 67.87 | 107.41 | 175.28 | 0.0040 | 0.0090 | 0.0056 | |
| W-NWW | 43.27 | 121.78 | 165.05 | 0.0026 | 0.0102 | 0.0053 | |
| NWW-NW | 251.89 | 166.25 | 418.14 | 0.0150 | 0.0139 | 0.0134 | |
| NW-NNW | 189.10 | 273.19 | 462.29 | 0.0113 | 0.0228 | 0.0148 | |
| NNW-N | 83.80 | 192.25 | 276.05 | 0.0050 | 0.0160 | 0.0089 | |
| Urban Construction Land | Spatial Extension Type | Orientation | Dominant Extension Wing | ||||
|---|---|---|---|---|---|---|---|
| 2002–2009 | 2010–2015 | 2002–2015 | 2002–2009 | 2010–2015 | 2002–2015 | ||
| Commercial land | High-speed extension | NEE-E | NEE-E-SEE | NEE-E-SEE | |||
| Fast-speed extension | |||||||
| Medium-speed extension | |||||||
| Slow extension | NEE-E | NEE-E, E-SEE | NEE-E | ||||
| Basic stability | Others | Others | Others | ||||
| Residential land | High-speed extension | NE-NEE-E, NW-NNW-N, SEE-SE-SSE-S | NEE-E-SEE, N-NNE | NEE-E-SEE | |||
| Fast-speed extension | NEE-E, E-SEE | ||||||
| Medium-speed extension | NEE-E, NW-NNW | N-NNE | NEE-E, E-SEE | ||||
| Slow extension | NE-NEE, SEE-SE, SE-SSE, SSE-S, NNW-N | NNE-NE, NE-NEE, SEE-SE, SE-SSE, SSE-S, S-SSW, SSW-SW, SW-SWW, SWW-W, W-NWW, NWW-NW | N-NNE, NNE-NE, NE-NEE, SEE-SE, SE-SSE, SSE-S, S-SSW, NW-NNW | ||||
| Basic stability | N-NNE, NNE-NE, E-SEE, S-SSW, SSW-SW, SW-SWW, SWW-W, W-NWW, NWW-NW | NW-NNW, NNW-N | SSW-SW, SW-SWW, SWW-W, W-NWW, NWW-NW, NNW-N | ||||
| Industrial land | High-speed extension | NEE-E | NEE-E | N-NNE, NE-NEE-E | NNE-NE, NEE-E-SEE | N-NNE-NE-NEE-E-SEE | |
| Fast-speed extension | N-NNE, NE-NEE | NEE-E, E-SEE | NE-NEE | ||||
| Medium-speed extension | NNE-NE, E-SEE, SEE-SE, NW-NNW | NNE-NE | N-NNE, NNE-NE, E-SEE, SEE-SE | ||||
| Slow extension | SE-SSE, S-SSW, SSW-SW, SW-SWW, SWW-W, NNW-N | N-NNE, NE-NEE, SEE-SE, S-SSW, NW-NNW | SE-SSE, S-SSW, SW-SWW, SWW-W, NW-NNW | ||||
| Basic stability | SSE-S, W-NWW, NWW-NW | SE-SSE, SSE-S, SSW-SW, SW-SWW, SWW-W, W-NWW, NWW-NW, NNW-N | SSE-S, SSW-SW, W-NWW, NWW-NW, NNW-N | ||||
| Public administration and service land | High-speed extension | NEE-E | NNE-NE-NEE-E-SEE | NE-NEE-E-SEE | |||
| Fast-speed extension | |||||||
| Medium-speed extension | NEE-E | E-SEE | NEE-E | ||||
| Slow extension | N-NNE, NE-NEE, SSE-S, NW-NNW | NNE-NE, NE-NEE, NEE-E, SE-SSE | NE-NEE, E-SEE, NW-NNW | ||||
| Basic stability | NNE-NE, E-SEE, SEE-SE, SE-SSE, S-SSW, SSW-SW, SW-SWW, SWW-W, W-NWW, NWW-NW, NNW-N | N-NNE, SEE-SE, SSE-S, S-SSW, SSW-SW, SW-SWW, SWW-W, W-NWW, NWW-NW, NW-NNW, NNW-N | N-NNE, NNE-NE, SEE-SE, SE-SSE, SSE-S, S-SSW, SSW-SW, SW-SWW, SWW-W, W-NWW, NWW-NW, NNW-N | ||||
| Traffic land | High-speed extension | E-SEE | NEE-E-SEE | NE-NEE-E-SEE, NW-NNW | NEE-E-SEE | ||
| Fast-speed extension | NEE-E | NEE-E | NEE-E, E-SEE | ||||
| Medium-speed extension | E-SEE | NE-NEE, NW-NNW | |||||
| Slow extension | NNE-NE, NE-NEE, NWW-NW, NW-NNW | N-NNE, NNE-NE, SEE-SE, SE-SSE, W-NWW, NWW-NW, NNW-N | NNE-NE, NE-NEE, SE-SSE, NWW-NW, NW-NNW | ||||
| Basic stability | N-NNE, SEE-SE, SE-SSE, SSE-S, S-SSW, SSW-SW, SW-SWW, SWW-W, W-NNW, NNW-N | SSE-S, S-SSW, SSW-SW, SW-SWW, SWW-W | N-NNE, SEE-SE, SSE-S, S-SSW, SSW-SW, SW-SWW, SWW-W, W-NWW, NWW-N | ||||
References
- Zhang, J.X. History of Urban Planning in Western Cities; Southeast University Press: Nanjing, China, 2005. (In Chinese) [Google Scholar]
- Lichtenberg, E.; Ding, C. Local officials as land developers: Urban spatial expansion in China. J. Urban Econ. 2009, 66, 57–64. [Google Scholar] [CrossRef]
- Angel, S.; Parent, J.; Civco, D.L.; Blei, A.; Potere, D. The dimensions of global urban expansion: Estimates and projections for all countries, 2000–2050. Prog. Plan. 2011, 75, 53–107. [Google Scholar] [CrossRef]
- Jiang, G.; Ma, W.; Qu, Y.; Zhang, R.; Zhou, D. How does sprawl differ across urban built-up land types in china? A spatial-temporal analysis of the Beijing metropolitan area using granted land parcel data. Cities 2016, 58, 1–9. [Google Scholar] [CrossRef]
- Hassan, A.M.; Lee, H. Toward the sustainable development of urban areas: An overview of global trends in trials and policies. Land Use Policy 2015, 48, 199–212. [Google Scholar] [CrossRef]
- Bhatta, B.; Saraswati, S.; Bandyopadhyay, D. Urban sprawl measurement from remote sensing data. Appl. Geogr. 2010, 30, 731–740. [Google Scholar] [CrossRef]
- Hamidi, S.; Ewing, R. A longitudinal study of changes in urban sprawl between 2000 and 2010 in the United States. Landsc. Urban Plan. 2014, 128, 72–82. [Google Scholar] [CrossRef]
- Altieri, L.; Cocchi, D.; Pezzi, G.; Scott, E.M.; Ventrucci, M. Urban sprawl scatterplots for urban morphological zones data. Ecol. Indic. 2014, 36, 315–323. [Google Scholar] [CrossRef]
- Vaz, E.D.N.; Nijkamp, P.; Painho, M.; Caetano, M. A multi-scenario forecast of urban change: A study on urban growth in the Algarve. Landsc. Urban Plan. 2012, 104, 201–211. [Google Scholar] [CrossRef]
- Dorning, M.A.; Koch, J.; Shoemaker, D.A.; Meentemeyer, R.K. Simulating urbanization scenarios reveals tradeoffs between conservation planning strategies. Landsc. Urban Plan. 2015, 136, 28–39. [Google Scholar] [CrossRef]
- Alnsour, J.A. Managing urban growth in the city of Amman, Jordan. Cities 2016, 50, 93–99. [Google Scholar] [CrossRef]
- Gilli, F. Sprawl or reagglomeration? The dynamics of employment deconcentration and industrial transformation in Greater Paris. Urban Stud. 2009, 46, 1385–1420. [Google Scholar] [CrossRef]
- Mo, L. Research of the Relationship between Industrial Structure and Spatial Layout Based on GIS. In Proceedings of the 2015 International Conference on Intelligent Transportation, Big Data and Smart City (ICITBS), Halong Bay, Vietnam, 19–20 December 2015; pp. 617–621. [Google Scholar]
- Deal, B.; Schunk, D. Spatial dynamic modelling and urban land-use transformation: A simulation approach to assessing the costs of urban sprawl. Ecol. Econ. 2004, 51, 79–95. [Google Scholar] [CrossRef]
- Kang, S.; Post, W.; Wang, D.; Nichols, J.; Bandaru, V.; West, T. Hierarchical marginal land assessment for land use planning. Land Use Policy 2013, 30, 106–113. [Google Scholar] [CrossRef]
- Disperati, L.; Virdis, S.G. Assessment of land-use and land-cover changes from 1965 to 2014 in Tam Giang-Cau Hai Lagoon, Central Vietnam. Appl. Geogr. 2015, 58, 48–64. [Google Scholar] [CrossRef]
- Bae, J.; Ryu, Y. Land-use and land cover changes explain spatial and temporal variations of the soil organic carbon stocks in a constructed urban park. Landsc. Urban Plan. 2015, 136, 57–67. [Google Scholar] [CrossRef]
- Yigitcanlar, T.; Sipe, N.; Evans, R.; Pitot, M. A GIS-based land use and public transport accessibility indexing model. Aust. Plan. 2007, 44, 30–37. [Google Scholar] [CrossRef] [Green Version]
- Grigonis, V. Feasibility study on traffic restriction strategies in the old town of Vilnius City. Philobiblon Transylvanian. J. Multidiscip. Res. 2008, 22, 647–648. [Google Scholar]
- Lu, D.; Yao, S.; Li, G.; Liu, H.; Gao, X. Comprehensive analysis of the urbanization process based on Chinese conditions. Econ. Geogr. 2007, 6, 883–887. [Google Scholar]
- Wang, Y.; Min, Z. Urban spill over vs. local urban sprawl: Entangling land-use regulations in the urban growth of China’s megacities. Land Use Policy 2009, 26, 1031–1045. [Google Scholar]
- Ding, C.; Zhao, X. Land market, land development and urban spatial structure in Beijing. Land Use Policy 2014, 40, 83–90. [Google Scholar] [CrossRef]
- Zhou, D.; Xu, J.; Wang, L.; Lin, Z. Assessing urbanization quality using structure and function analyses: A case study of the urban agglomeration around Hangzhou Bay (UAHB), China. Habitat Int. 2015, 49, 165–176. [Google Scholar] [CrossRef]
- Zhou, G.; Li, C.; Li, M.; Zhang, J.; Liu, Y. Agglomeration and diffusion of urban functions: An approach based on urban land use conversion. Habitat Int. 2016, 56, 20–30. [Google Scholar] [CrossRef]
- Tian, L.; Ge, B.; Li, Y. Impacts of state-led and bottom-up urbanization on land use change in the peri-urban areas of Shanghai: Planned growth or uncontrolled sprawl? Cities 2016, 60, 476–486. [Google Scholar] [CrossRef]
- Jiang, G.; Ma, W.; Wang, D.; Zhou, D.; Zhang, R.; Zhou, T. Identifying the internal structure evolution of urban built-up land sprawl (UBLS) from a composite structure perspective: A case study of the Beijing metropolitan area, China. Land Use Policy 2017, 62, 258–267. [Google Scholar]
- Lv, X.; Huang, X. Research progress and prospect of construction-land expansion. Geogr. Geo-Inf. Sci. 2013, 6, 51–58. [Google Scholar]
- Bao, L.; Wang, J. Driving forces of urban construction-land expansion in the mainland of China. China Land Sci. 2009, 8, 68–72. [Google Scholar]
- Jaeger, J.A.G.; Bertiller, R.; Schwick, C.; Cavens, D.; Kienast, F. Urban permeation of landscapes and sprawl per capita: New measures of urban sprawl. Ecol. Indic. 2010, 10, 427–441. [Google Scholar] [CrossRef]
- Wu, W.; Zhang, W.; Liu, Z. Tempo-spatial analysis of the residential land spatial pattern in Beijing. Geogr. Res. 2010, 29, 683–692. [Google Scholar]
- Yu, W.; Song, J.; Hu, Z. Tempo-spatial patterns and influence of leased commercial land lots in Beijing. Econ. Geogr. 2012, 1, 109–113. [Google Scholar]
- Yu, J.; Zhang, W.; Dong, G. Spatial heterogeneity in the attributes prices of residential land in Beijing. Geogr. Res. 2013, 3, 1113–1120. [Google Scholar]
- Kuang, W.; Liu, J.; Dong, J.; Chi, W.; Zhang, C. The rapid and massive urban and industrial land expansions in China between 1990 and 2010: A CLUD-based analysis of their trajectories, patterns, and drivers. Landsc. Urban Plan. 2016, 145, 21–33. [Google Scholar] [CrossRef]
- Du, J.; Thill, J.C.; Peiser, R.B.; Feng, C. Urban land market and land-use changes in post-reform China: A case study of Beijing. Landsc. Urban Plan. 2014, 124, 118–128. [Google Scholar] [CrossRef]
- Huang, Z.; Wei, Y.D.; He, C.; Li, H. Urban land expansion under economic transition in China: A multi-level modeling analysis. Habitat Int. 2015, 47, 69–82. [Google Scholar] [CrossRef]
- Zhang, X.J. Study on the Formation and Evolution of Spatial Structure of Coastal Port City in Liaoning Province. Ph.D. Thesis, Liaoning Normal University, Dalian, China, 2002. (In Chinese). [Google Scholar]
- Ningbo Urban-Rural Planning Research Center. The General Report of Ningbo City Development Strategy to 2030. In The Compilation of Reports of Ningbo Urban-Rural Planning Research Center; Zheng, S.X., Ed.; Ningbo Urban-Rural Planning Research Center: Ningbo, China, 2011; pp. 1–76. (In Chinese) [Google Scholar]
- Hangzhou Government Network. Statistical Bulletins of Hangzhou’s National Economy and Social Development, 2015. Available online: http://www.hangzhou.gov.cn/art/2017/3/10/art_812262_5885634.html (accessed on 7 November 2017). (In Chinese)
- Ningbo Municipal Statistics Bureau. Statistical Bulletins of Ningbo’s National Economy and Social Development, 2015. Available online: http://tjj.ningbo.gov.cn/read/20160201/29009.aspx (accessed on 18 October 2017). (In Chinese)
- Tang, Y.T.; Chan, F.K.S.; Griffiths, J. City profile: Ningbo. Cities 2015, 42, 97–108. [Google Scholar] [CrossRef]
- Ningbo Government Website. Ningbo City’s “New Blueprint” Will Be Vividly Portrayed Soon. Available online: http://gtog.ningbo.gov.cn/art/2017/6/5/art_58_810758.html (accessed on 29 August 2017). (In Chinese)
- Ningbo Municipal Statistics Bureau. Ningbo Statistical Yearbooks, 2003–2016; China Statistics Press: Beijing, China, 2003–2016.
- Ningbo Municipal Statistics Bureau. Statistical Bulletins of Ningbo’s National Economy and Social Development, 2002–2015. Available online: http://tjj.ningbo.gov.cn/read/board.aspx?id=202&p=2 (accessed on 18 October 2017). (In Chinese)
- Shang, Z.Y. The Multi-Scale Study of Urban Spatial Morphological Evolution. Ph.D. Thesis, Nanjing Normal University, Nanjing, China, 2011. (In Chinese). [Google Scholar]
- Lu, C.Y. The Study of the Relationship between the Evolutions of Urban Land Structure and Industrial Structure. Ph.D. Thesis, Southwest University, Chongqing, China, 2011. (In Chinese). [Google Scholar]
- Hu, H.W.; Wei, B.S.; Shen, X.H.; Li, J.X. Spatiotemporal characteristics of urban land expansion in central area of Shanghai, China. Chin. J. Appl. Ecol. 2013, 24, 3439–3445. [Google Scholar]
- Alsharif, A.A.A.; Pradhan, B.; Helmi, Z.M.S.; Mansor, S. Quantitative analysis of urban sprawl in Tripoli using Pearson’s Chi-Square statistics and urban expansion intensity index. In IOP Conference Series: Earth and Environmental Science; IOP Publishing: Bristol, UK, 2014; Volume 20, p. 012006. [Google Scholar]
- Wang, H.; Xia, C.; Zhang, A.; Liu, Y.; Sanwei, H.E. Space syntax expand intensity index and its applications to quantitative analysis of urban expansion. Acta Geogr. Sin. 2016, 71, 1302–1314. [Google Scholar]
- Anderson, T. Kernel density estimation and K-means clustering to profile road accident hotspots. Accid. Anal. Prev. 2009, 41, 359–364. [Google Scholar] [CrossRef] [PubMed]
- Fotheringham, A.S.; Brunsdon, C.; Charlton, M. Quantitative Geography: Perspectives on Spatial Data Analysis; Isaaks, E., Mohan Srivastava, R., Eds.; Sage Publications: Thousand Oaks, CA, USA, 2000; Volume 50, pp. 143–163. [Google Scholar]
- Kang, H.; Liu, S. The impact of the 2008 financial crisis on housing prices in China and Taiwan: A quantile regression analysis. Econ. Model. 2014, 42, 356–362. [Google Scholar] [CrossRef]
- Fang, M. The Influence of Urban Land Structure on Economic Competitiveness and Empirical Research. Ph.D. Dissertation, Zhejiang University, Hangzhou, China, 2015. (In Chinese). [Google Scholar]


| The Type of Construction Land | Description | Corresponding Industry Type | Expansion Area in 2002–2015 (ha) | The Proportion of Total Expansion Area (%) |
|---|---|---|---|---|
| Commercial land | Land used for trade, tourism, entertainment and other services | Tertiary industry: wholesale and retail, accommodation and catering, financial industry, commercial service industry, culture, sports and entertainment | 1711.93 | 5.21 |
| Residential land | Land used for commercial housings and rural residential lands | Secondary industry: construction industry; Tertiary industry: real estate | 6827.35 | 20.76 |
| Industrial land | Land used for factories, storage and logistics | Secondary industry: manufacturing industry, production and supply of electricity, gas and water; Tertiary industry: storage and logistics | 11,304.85 | 34.37 |
| Public administration and service land | Land used for government agency, charity, science and education, public facilities, parks and green spaces | Tertiary industry: public facilities management, education, health, social security and social welfare, public management and social organization | 3875.34 | 11.78 |
| Traffic land | Land used for highways, railways, ports and piers, streets and alleys | Tertiary industry: transportation industry | 7639.66 | 23.23 |
| Other land | Land used for water conservancy facilities, special use areas (e.g., religious lands and burial lands) | Tertiary industry: water conservancy and other services | 1528.16 | 4.65 |
| The Type of Urban Construction Land | Area (ha) | Expansion Intensity Index (%) | ||||
|---|---|---|---|---|---|---|
| 2002–2009 | 2010–2015 | 2002–2015 | 2002–2009 | 2010–2015 | 2002–2015 | |
| Commercial land | 889.98 | 821.95 | 1711.93 | 0.0530 | 0.0686 | 0.0549 |
| Residential land | 3114.94 | 3712.41 | 6827.35 | 0.1856 | 0.3097 | 0.2191 |
| Industrial land | 8324.68 | 2980.17 | 11,304.85 | 0.4961 | 0.2486 | 0.3627 |
| Public administration and service land | 2105.59 | 1769.75 | 3875.34 | 0.1255 | 0.1476 | 0.1243 |
| Traffic land | 3390.95 | 4248.71 | 7639.66 | 0.2021 | 0.3545 | 0.2451 |
| Other land | 813.52 | 714.64 | 1528.16 | 0.0485 | 0.0596 | 0.0490 |
| Sum | 18,639.66 | 14,247.63 | 32,887.29 | 1.1107 | 1.1886 | 1.0553 |
| The Type of Urban Construction Land | Area (ha) | Expansion Intensity Index (%) | ||||
|---|---|---|---|---|---|---|
| 2002–2009 | 2010–2015 | 2002–2015 | 2002–2009 | 2010–2015 | 2002–2015 | |
| Commercial land | 91.43 | 62.62 | 154.05 | 0.0412 | 0.0395 | 0.0374 |
| Residential land | 338.57 | 398.07 | 736.64 | 0.1526 | 0.2511 | 0.1787 |
| Industrial land | 2785.33 | 1248.09 | 4033.42 | 1.2552 | 0.7874 | 0.9787 |
| Public administration and service land | 494.25 | 201.51 | 695.76 | 0.2227 | 0.1271 | 0.1688 |
| Traffic land | 632.92 | 887.08 | 1520 | 0.2852 | 0.5597 | 0.3688 |
| Other land | 110.61 | 36.06 | 146.67 | 0.0498 | 0.0227 | 0.0356 |
| Sum | 4453.11 | 2833.43 | 7286.54 | 2.0067 | 1.7876 | 1.7681 |
© 2017 by the authors. Licensee MDPI, Basel, Switzerland. This article is an open access article distributed under the terms and conditions of the Creative Commons Attribution (CC BY) license (http://creativecommons.org/licenses/by/4.0/).
Share and Cite
Zheng, Q.; Wang, K.; Huang, L.; Zheng, Q.; Abubakar, G.A. Monitoring the Different Types of Urban Construction Land Expansion (UCLE) in China’s Port City: A Case Study of Ningbo’s Central City. Sustainability 2017, 9, 2374. https://doi.org/10.3390/su9122374
Zheng Q, Wang K, Huang L, Zheng Q, Abubakar GA. Monitoring the Different Types of Urban Construction Land Expansion (UCLE) in China’s Port City: A Case Study of Ningbo’s Central City. Sustainability. 2017; 9(12):2374. https://doi.org/10.3390/su9122374
Chicago/Turabian StyleZheng, Qing, Ke Wang, Lingyan Huang, Qiming Zheng, and Ghali Abdullahi Abubakar. 2017. "Monitoring the Different Types of Urban Construction Land Expansion (UCLE) in China’s Port City: A Case Study of Ningbo’s Central City" Sustainability 9, no. 12: 2374. https://doi.org/10.3390/su9122374