Improved Precision and Efficiency of a Modified ORG0020 Dynamic Respiration Test Setup for Compost Stability Assessment


1
School of Energy, Geoscience, Infrastructure and Society, Heriot-Watt University, Edinburgh EH14 4AS, Scotland, UK
2
School of Environment, Earth and Ecosystem Sciences, The Open University, Walton Hall, Milton Keynes MK7 6AA, UK
*
Author to whom correspondence should be addressed.
Sustainability 2017, 9(12), 2358; https://doi.org/10.3390/su9122358
Submission received: 21 November 2017
/
Revised: 13 December 2017
/
Accepted: 14 December 2017
/
Published: 18 December 2017
(This article belongs to the Collection Organic Waste Management)
Abstract
:The ORG0020 dynamic respiration test is effective at distinguishing source segregated organic waste derived composts across a wide range of stabilities when compared to other standard tests; however, using the original diaphragm pump and manifold setup, the test is affected by variability in flow rate with time and across sample replicate vessels. Here, we demonstrate the use of a multichannel peristaltic pump to deliver a more consistent air flow to individual vessels. Using finished and unfinished industry compost samples from different sites with varying stabilities, we provide evidence of greater precision of the modified setup compared to the original. Furthermore, the reduced need for air flow adjustment resulted in improved running cost efficiency with less labour demand. Analysis of compost sample oxygen demand supports the current test air flow rate of 25–75 mL min−1, although the improved air flow control will enable future narrowing of the acceptable range for better inter-laboratory performance.
1. Introduction
Composting is the process of recycling solid waste (e.g., food, green or animal wastes) into the fertilizer [1]. Compost stability is an important quality criterion in many recognised compost assurance schemes [2] with unstable composts of concern for reasons previously reported, such as generation of nuisance odours, attraction of disease carrying vectors, and self-heating potentially leading to fires [3,4]. In the UK, there is currently increasing interest in differentiating stability limits for key end markets (e.g., agriculture and horticulture) [5]. Regardless of the limits used, it is paramount that stability tests are reliable with good accuracy and precision.
Assessment of a compost samples’ stability is made by either consumption of O2 or production of CO2 or heat, resulting from microbial degradation of readily available substrates. Most commonly, CO2 production can be measured in a variety of ways including infrared gas analysers (IRGA), gas chromatography, as well as alkali trapping with manual acid titration or automated conductance [2,6]. Alkali trapping, with manual acid titration in particular, remains popular due to low capital equipment and consumable running costs [7].
The UK ORG0020 test is used to assess compost stability as part of the compost certification scheme and adherence to BSI PAS100:2011 [8]. A dynamic respiration method, this test relies on a continuous supply of CO2 free air (maintained within a flow rate range of 25–75 mL min−1) over compost samples and capturing the CO2 generated downstream in alkali (NaOH) traps [9]. The ORG0020 test has recently been demonstrated in a comparative study to be more effective at determining the stability of in-vessel composts than the European Commission (EC) Joint Research Centre (JRC) preferred Dewar self-heating [2]. The Dewar self-heating test and a second (‘in-house’) static respiration test under-reported active compost samples with pH ~5. As well as being static in nature, both of these tests had pre-incubation periods of just one day compared to the dynamic ORG0020 test, which uses a 72 h equilibration period.
A single aquarium diaphragm pump (in combination with a manifold for distribution) is proposed in the ORG0020 protocol to provide CO2 free air to the sample and control vessels; however, maintaining flow within the required range to typically 10 vessels in a single setup is difficult and requires (as a minimum) daily adjustment. If air flow falls outside of the required range, it may impact test accuracy and precision. Certainly, others have shown at laboratory scale that composting processes are affected with air flows equivalent to less than 10 mL min−1 100 g−1 FW [10,11]. As for higher air flow rates, Lu et al. [12] showed, at an equivalent flow rate of 178 mL min−1 100 g−1 FW, reduced temperature and excessive sample drying in a lab-scale reactor. Some researchers have controlled flow to give predetermined oxygen levels in exhaust air. Various target oxygen levels have been used including 8% [13] and 14% [14]. Beck-Friis et al. [15] reported an exhaust oxygen content of 16% gave reliable aerobic conditions, whereas 1% and 2.5% oxygen in the exhaust were associated with acidification, anaerobic conditions, and a prolonged mesophilic phase. Ahn et al. [16] found decreased sample degradation at 10% oxygen in the exhaust compared with 15% oxygen, while Suler and Finstein [17] reported only slightly lower CO2 emissions at 10% than at 18% oxygen in the exhaust gas.
Most multichannel dynamic automated respirators do not suffer from the same variable air flow issue as observed with the ORG0020 test, as these ‘systems’ monitor intermittently from sample vessels and have built in flow regulators [6,18]. More recently, systems have been developed that continuously adjust air flow rate in response to sample oxygen demand in order to determine maximum respiration activity [19]. Systems such as these though are expensive and more commonly found in research than commercial environmental testing laboratories. In searching for a cost effective solution, a multichannel peristaltic pump, commonly used for pumping water or aqueous based liquids, was considered as a possible viable option, the advantage being that dedicated pump channels provide air to individual vessels rather than distribute a single air supply to multiple vessels by way of a manifold.
The aim of this work was therefore to determine whether the multichannel peristaltic pump approach could achieve more stable air flow rates across vessels, resulting in lower sample replicate variability (i.e., greater precision). Given the potential impact of this work on commercial laboratories, an assessment was made of the running cost of the multichannel peristaltic pump setup versus the original diaphragm pump setup on a consumables, equipment and staff time basis. Finally, we sought to analyse the oxygen demand of recently studied active samples [2] to confirm whether the air flow range for the test remained acceptable.
2. Materials and Methods
2.1. Compost Samples and Characterisation
Finished and unfinished compost samples were collected from three PAS100 certified sites during this work (Table 1) to give samples with a range of stabilities. Collected bulk samples were screened (as necessary) to ≤20 mm and stored at 4 °C prior to characterisation and stability testing.
Characterisation of compost samples was limited to dry matter (DM) as per BS EN 13040:2007, electrical conductivity (EC) as per BS EN 13038:2000, pH as per BS EN 13652:2001 and organic matter (OM) as per BS EN 13039:2000. Characterisation of samples A, B, D, G and I can be found in a previously reported publication [2].
2.2. ORG0020 Setups
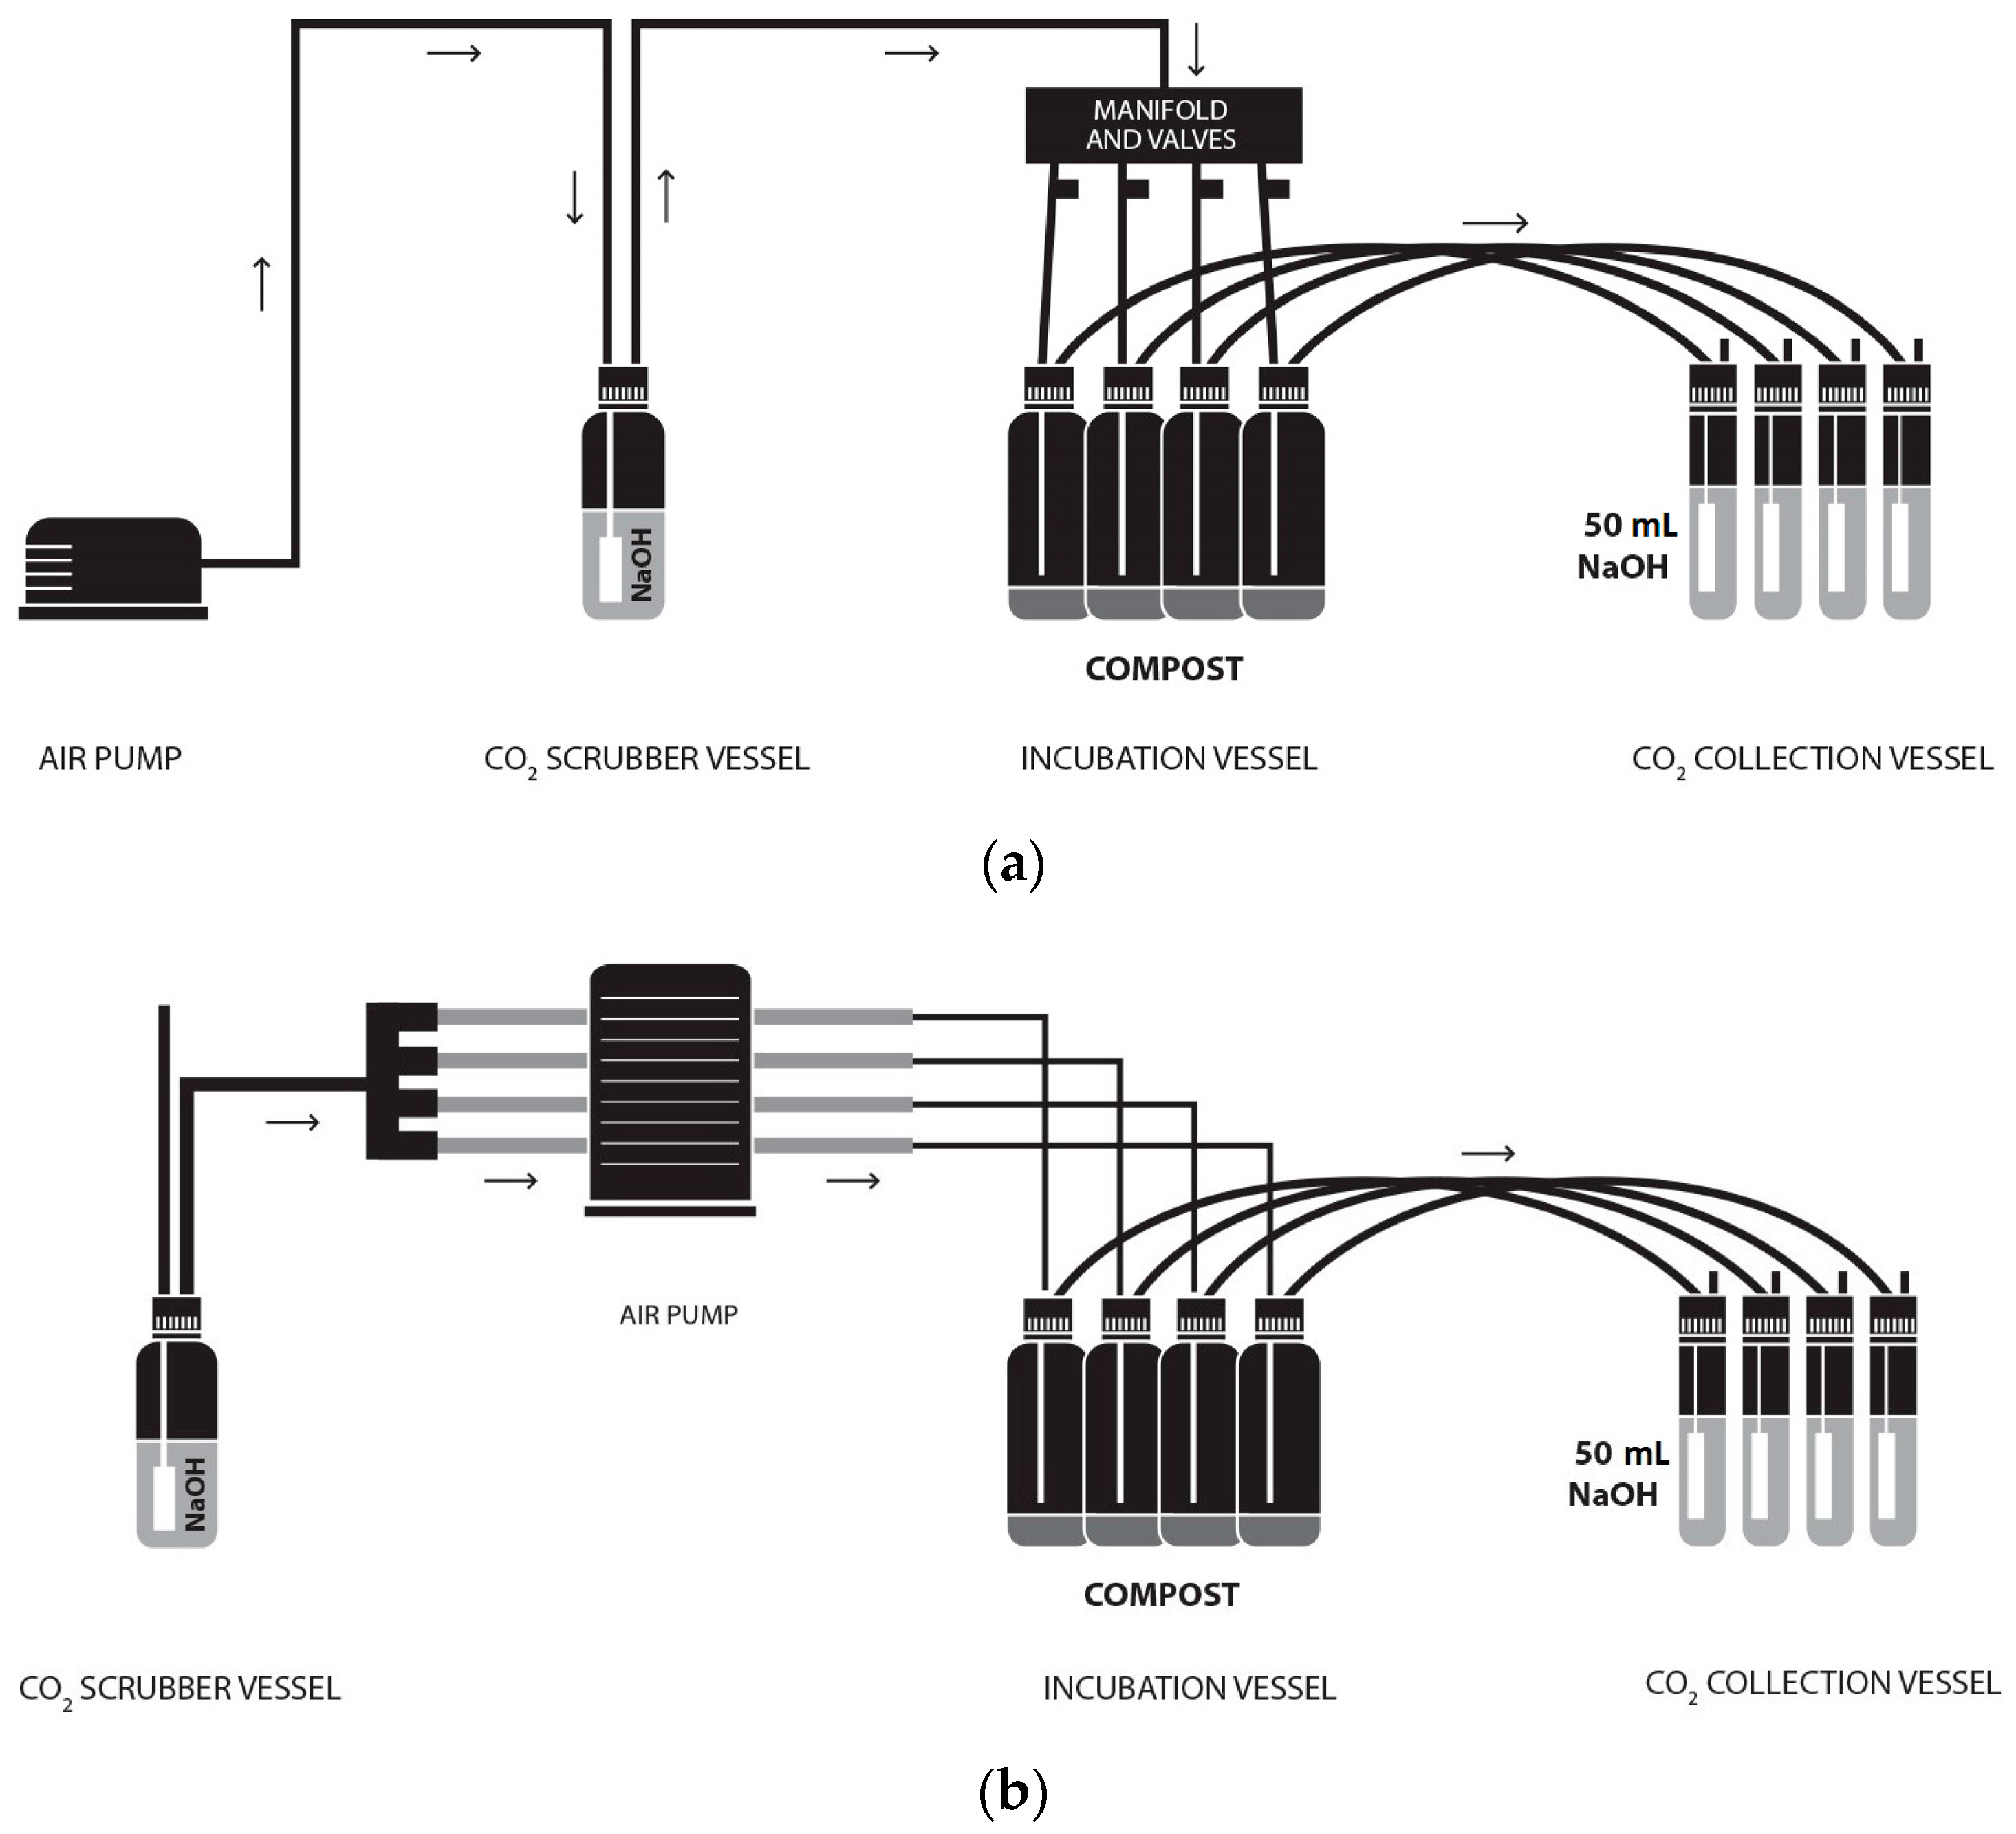
The ORG0020 setup was established as previously described [9] and illustrated (Figure 1a). The modified ORG0020 setup was established as shown (Figure 1b), which, in essence, deviates from the original setup by the use of a multichannel peristaltic pump (and associated tubing) rather than a diaphragm pump.
Two peristaltic pumps (Watson Marlow, Plymouth, Cornwall, UK)—502S with max 100 rpm and 520 with max 220 rpm—were trialled in this work for the modified setup with the 520 pump used for running cost analysis only. A 505CA multichannel cassette head was switched between the two pumps as and when required. Marprene® tubing (2.79 mm bore) was used in the cassette head and, aside from different tubing connectors/manifolds, the original and modified setups were considered identical. Air flow rate was measured in turn at CO2 collection vessel outlets using a digital 7000 GC flowmeter (Ellutia UK, Ely, UK) before (A) and after (B) changing CO2 traps and adjusted as necessary within a flow range of 45–50 mL min−1 (unless otherwise stated).
2.3. Original and Modified ORG0020 Comparative Experiments
The original and modified setups were established with either four or six vessels each, enabling a single compost sample to be analysed with three replicates (as used in the test routinely) or five replicates alongside a control vessel containing no compost. Single outlier results were removed from both original and modified results where five replicates were used.
The ORG0020 protocol specifies a three-day equilibration period with aeration applied to samples but without CO2 determination. Tests are routinely set up on a Friday with no measurements taken on days 1 and 2. Experiments 1 and 2 were run to assess air flow during the equilibration period with air flow measurements taken on days 0 and 3 to 4. Experiments 4–10 were run following the standard test method, with air flow measurements taken on days 0, 3, 4, 5, 6 and 7 and CO2 collection vessels measured on days 4, 5, 6, and 7.
The exception to this was experiment 3 where only the original setup was run with seven vessels, enabling a single compost samples to be analysed with six replicates alongside the control vessel. On day 2, the flow was intentionally lowered to <10 mL min−1 in three of the six vessels containing sample to further demonstrate the impact on CO2 determination on the first CO2 measurement (day 4). The other three vessels with compost were adjusted on day 2 within the 45–50 mL min−1 as necessary.
2.4. Oxygen (Air Flow) Requirement of Active Industry Compost Samples
In order to assess the oxygen (air flow) requirement of industry compost samples, data generated as part of a previous project [2] was analysed. Specifically, in this previous study, ORG0020 tests run by commercial laboratories were compared with a DR4 respirometry test adapted to use fresh samples. Flow rates, CO2 and O2 were monitored every two hours using online analysers. Although the DR4 test uses an inoculum of composted green waste [20], additional tests without inoculum were undertaken on five samples for direct comparison with the ORG0020 tests (results not previously reported). The flow rate, measured on the inlet, was equivalent to 100–150 mL min−1 100 g−1 fresh weight (FW). The oxygen exchange rate (VO2) in L h−1, corrected for CO2 production, was calculated over seven days of each test as:
where Xi is proportion of Oxygen in inlet gas (0.2095), Xo is the measured proportion of Oxygen in outlet gas, Ci is the proportion of CO2 in inlet gas (0.0004), Co is the proportion of CO2 in outlet gas, and Fi is measured inlet flow rate in L h−1 (dry gas).
VO2 = Fi × (Xi × (1 − Co) − Xo × (1 − Ci))/(1 − Co − Xo),
The oxygen demand (OD) was defined as oxygen consumption per fresh weight of sample in kg (W):
OD = VO2/W.
The equivalent inlet air flow rates F15, F10 (in mL min−1) required to maintain 15%, 10% oxygen content in the outlet gas throughout the respirometer tests were calculated, i.e., for 100 g fresh weight of sample. The mean and maximum rates required for each sample were identified:
F15 = OD × W/((0.2095 − 0.15) × 60); F10 = OD × W/((0.2095 − 0.10) × 60).
This data analysis was performed in an R statistical environment.
3. Results
3.1. Compost Sample Stability
Three compost samples were collected from a UK PAS100 in-vessel and ex situ certified composting facilities (Table 1).
3.2. Flow Rate Consistency
During compost stability assessment, flow rate through individual vessels was recorded at the start (day 0) and end (day 3) of the equilibration period; before (A) and after (B) changing over water (day 3) or NaOH traps (days 4, 5 and 6); and before (A) test termination on day 7 (depending on test duration). Results show for equilibration only experiments (Figure 2) and full-length experiments (Figure 3) that the peristaltic pump setup was more consistent at maintaining air flow to all vessels within the required 25–75 mL min−1.
In fact, flow was maintained in this range in the modified setup for all experiments except for one (experiment 7) where a reading of 24 mL min−1 was recorded in one vessel on day 4. By comparison, the original test setup using an aquarium (diaphragm) pump and manifold failed to maintain flow to all vessels within the required range in all but one experiment (no. 7). Typically, air flow rate fell out of the required range at least once for one or more vessels per experiment. Where this occurred during the sample equilibration period (0–3 days), the length of time may be anything up to 72 h (unmonitored over the weekend). Air flow rates falling out of range between days 4–7 may be up to 24 h in duration assuming once daily checking.
A mixture of both low and high air flow rate failures was observed; however, low air flow rate failures appeared to be more common. Specifically, in six out of seven experiments shown, air flow was recorded below 10 mL min−1 at least once. As for high air flow rate failures, measurements above 75 mL min−1 were recorded in four out of seven experiments shown.
3.3. Equilibration Period Air Flow Variability on Measured CO2
Air flow rates fell outside of the required range for the original setup in both short-term experiments (nos. 1 and 2) looking at the test equilibration period only (Figure 2), the result of which had a clear effect on the reported precision of compost stability by the original setup (Table 2) for experiment 1 and a lesser effect in experiment 2.
To provide further evidence of the impact of air flow falling out of range during the equilibration period, an additional experiment (no. 3) was considered—specifically, the air flow was adjusted to <10 mL min−1 on day 2 in three vessels and returned to within range (45–50 mL min−1) after changing water in the collection vessel to NaOH. The other three vessels were maintained within 45–50 mL min−1 range. The results show (Table 2) that the vessels that were subjected to the reduced air flow reported higher CO2 on the first measurement (day 4).
3.4. Overall Test Result Precision
Given the greater variability in air flow rate in the standard setup, comparison of test setup precision was assessed using three different composts of varying stability (Table 3). Initial experiments (4, 6 and 7) were carried out using triplicate sample vessels. However, this was increased to quintuplicate for experiments 9 and 10 to minimise the potential impact of heterogeneity of more active samples, with a single outlier measure removed from each setup equally for these experiments. With this approach, the results show that the modified setup derived stability value was consistently more precise than that generated with the original setup.
3.5. Running Cost Comparison
A running cost comparison of original and modified setups is shown (Table 4). Specifically, labour time in air flow monitoring/adjustment, electricity demand of the pumps and the specific Marprene® tubing used in the modified setup.
The result shows that the additional electricity and tubing costs of the modified setup are easily offset by the reduced labour, making it comparatively more cost effective. Further analysis with the UK national over 25’s and 18–20 minimum wage rates of £7.50 and £5.60 still show the modified setup being more cost effective using the 520 series pump
3.6. Air (Oxygen) Demand of Industry Compost Samples
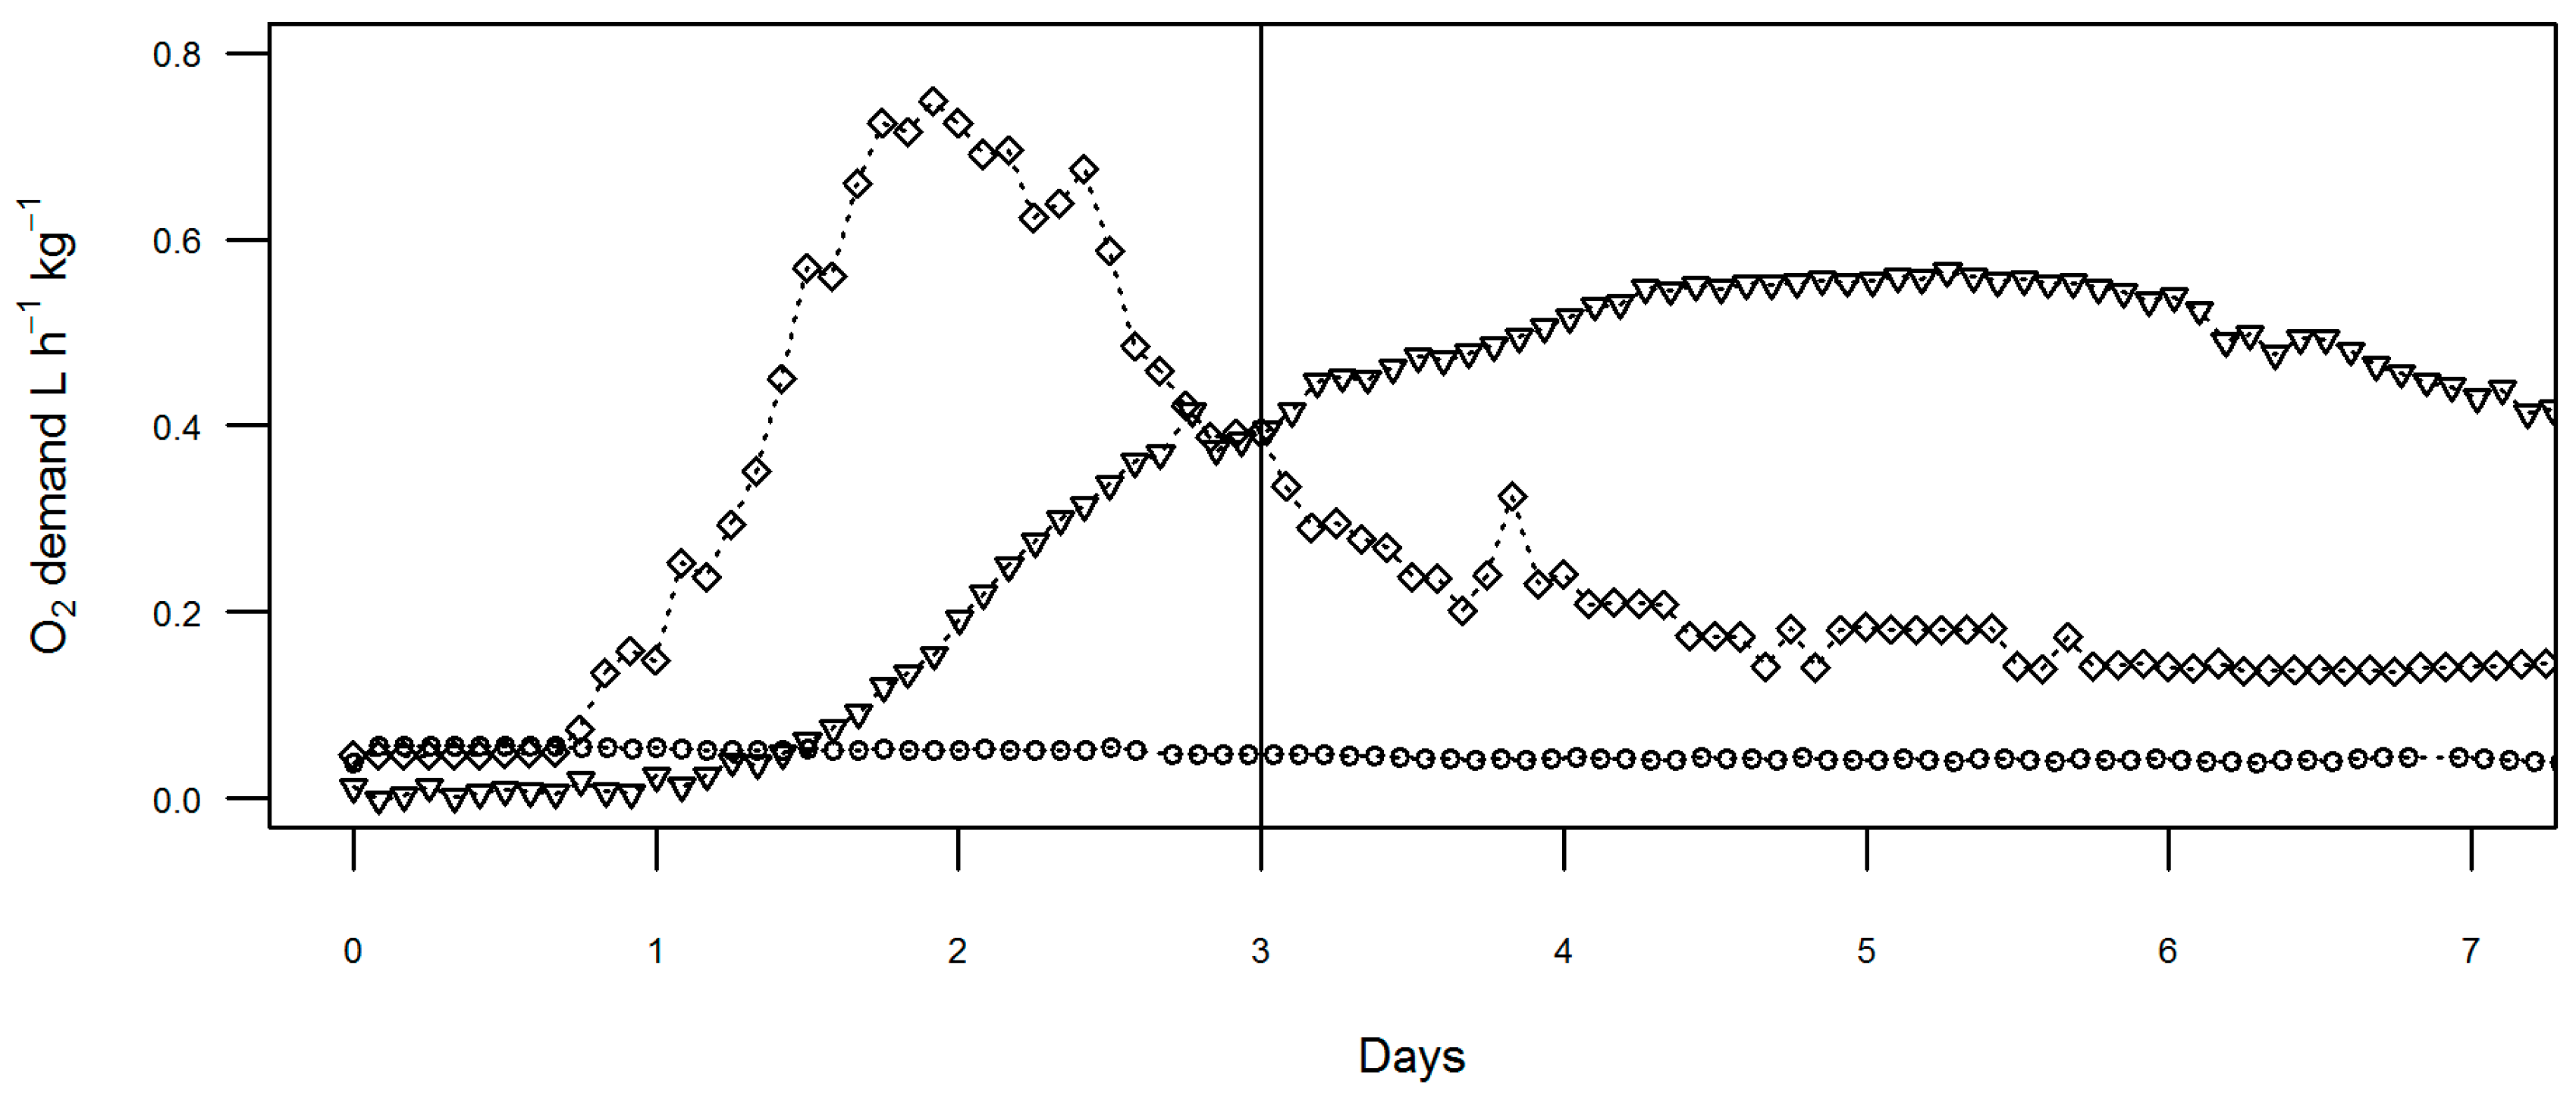
Analysis of the oxygen demand of industry compost samples was carried out using data collected as part of previously published work but until now unreported [2]. This provided detailed time series of oxygen consumption over the full three days of pre-incubation time and four days of active testing. Throughout all these tests, oxygen content in the exhaust gas remained above 16% (lowest c.18.5%). This is assumed to be fully aerobic and so non-limiting to decomposition during the test [15,16]. The variation of oxygen demand over the full seven days is shown in Figure 4 for selected samples.
Three of the samples tested (sites A, B, and D) were found to pass the PAS100 stability limit of 16 mg CO2 g−1 VS d−1 and these showed low oxygen demand throughout the seven days. Two samples were above the stability limit and oxygen demand for these samples peaked around day 2 (in the equilibration period) and day 5 (during the test period) for site I and G, respectively.
In the range where air flow is sufficient to satisfy the maximum oxygen demand, it is expected that the only effect of changing flow rate is changing the dilution of the exhaust gas with fresh air. Using this assumption, the equivalent flow rates required to maintain oxygen content of the outlet gas at 15% and 10% throughout the ORG0020 test were calculated. These levels are chosen to represent fully aerobic, and possibly borderline aerobic, conditions, following Ahn et al. [16]. The peak and mean oxygen demand, and equivalent flow rates, are shown in Table 5. The flow rate required to maintain 15% oxygen in the outlet at maximum oxygen demand was approximately 23 mL min−1 100 g−1, and for 10% oxygen, 13 mL min−1 100 g−1.
4. Discussion
4.1. Test Precision
The results presented here for a series of experiments provide strong evidence of improved test precision using the modified setup with potential additional benefits in terms of reduced running cost (as discussed below).
When the ORG0020 test was originally developed, test precision was assigned by pooling standard deviation results derived from four compost samples with varying stabilities [9]. Furthermore, the four compost samples were tested with 10 replicates per run. The reported precision was 0.906 mg CO2 g−1 OM d−1 with experiments run at 25 °C. Although the use of 10 replicates is useful for validation purposes of a setup, it does not give a true assessment of operating test precision with sample triplicates. Furthermore, the ‘pooled’ standard deviation was derived from experiments conducted at 25 °C rather than the now standard test temperature of 30 °C.
Therefore, our data are unique in presenting precision of the test at the appropriate temperature and with the correct number of test replicates. The data help show that the standard deviation value reported by Llewelyn [9] is conservative for stable compost samples; however, more active samples may fail this. In fact, two more active (>8 mg CO2 g−1 OM d−1) samples tested by Llewelyn [9] have contrasting precision values, perhaps reflecting differences in sample heterogeneity. An important aspect to take forward from this work is the requirement for laboratories to record daily air flow monitoring as part of the test quality assurance. This will enable the cause of imprecise results to be determined and specifically, whether imprecision is due to inherent sample heterogeneity or improper test operation.
4.2. Test Accuracy
Although the primary aim of this work was to look at improving test precision, the results also provided an indication of improved accuracy with the modified setup. For example, in experiment 3, replicate vessels with reduced air flow during the equilibration period caused build-up of CO2, which was subsequently released into the fresh NaOH trap after air flow adjustment on day 3. This produced higher reported CO2 on day 4 and an artificially higher value for ORG0020 compost stability. The effect of such events is likely to be most pronounced for more active samples. A thorough evaluation of the impact on accuracy was beyond the scope of this project.
4.3. Running Cost Efficiency
In carrying out a running cost comparison of the original and modified setups, assumptions were made around the cost of labour and, in the case of the modified setup only, the lifespan of the Marprene® tubing. In terms of labour, the hourly wage was based on recommendation of the National Careers Service; however, even using national minimum labour rates, the modified setup appeared cost effective. For the Marprene® tubing, we based the lifespan as a conservative four weeks; in practice, we were able to use Marprene® tubing for longer than this.
Although the peristaltic pump used was more costly than the diaphragm pump, it was not possible to evaluate a wider range of peristaltic pumps in this study. Furthermore, we were unable to determine the lifespan of these pumps to include the costs of the pumps in our calculations. Other pumps or devices that deliver consistent air flow to individual vessels may be suitable. The work serves to demonstrate the potential to achieve more consistent air flow with efficiencies rather than dictate a specific pump option.
4.4. Compost Oxygen Demand and Accuracy of Stability Determination
Although a reasonable body of literature exists reporting the impact of low or high air flows on composting processes [10,11], the direct assessment on the ORG0020 test has not been reported [9].
Test conditions need to be robust across a wide range of samples. Therefore, we sought to determine a suitable range of flow based on the oxygen demand of industry compost samples previously tested. Of the original ten samples reported by Aspray et al. [2], five were subjected to detailed respirometry without inoculum, including two of the most active samples, both over double the PAS100 threshold by ORG0020. An unmet oxygen demand may cause a slower response and false low stability values, or may delay the peak oxygen demand from the equilibration period to the test period, giving a false high reading. Other researchers have reported aerobic conditions with oxygen content in the outlet gas above 16% [15], 15% [16] and 10% [17], though 10% has also been associated with poorer degradation [17].
A period of sub-optimal aeration may compromise results and this is most likely for the most active samples and during the period of highest oxygen demand. However, the level of sample activity and duration of oxygen deficit at which results will be affected is not known.
The peak oxygen demand occurred at two days after a one-day lag period for the site I sample, during the pre-incubation period. The ORG0020 test is expected to avoid the transient peaks during the pre-incubation period and this may not have been fully successful in this case. The site G sample shows a more extreme lag and a broad peak in oxygen demand over days 3 to 7. This sample was noted to be strongly acidified and odorous [2]. It is possible that both these samples were acidified due to poor composting at the source site. Ideally, the test should be able to overcome or identify pre-existing acidification from a poorly composted sample. In these cases, a lower flow rate that does not meet the oxygen demand required may not overcome the poor quality of these samples.
Other tests that have been used for compost stability testing focus on the transient period of high activity; for instance, the DRI test uses the most active 24 h [14], and the DR4 test uses the first four days with no equilibration period [21]. In these cases, the specific test conditions including flow rate could easily affect the time of the initial peak and its height, and both would give relatively low readings for the Site I sample. It was noted that the DR4 tests undertaken including inoculum in general gave earlier and sharper peaks in CO2 production and O2 consumption (data not shown).
The inlet flow rate required to maintain 15% oxygen content in the outlet gas of the most active sample was approximately 23 mL min−1 100 g−1, and to maintain 10%, 13 mL min−1 100 g−1. The reported ORG0020 stability of this sample from two different laboratories was 29.7, 37.8 mg CO2 g−1 OM d−1 [2]. As these samples are above the stability threshold of 16 mg CO2 g−1 OM d−1, this provides support for the current lower limit air flow of 25 mL min−1. Equally higher flow rates would be acceptable, and it is unlikely that this type of test would use a flow rate as high as 178 mL min−1 100 g−1 FW as used by Lu et al. [12], which inhibited the microbial respiration response.
5. Conclusions
Conclusions of this work are the following:
- (1).
- Low flow (<10 mL min−1) during the three-day equilibration period causes the build-up of CO2 in sample vessels, which can lead to higher reported CO2 or increased replicate variability (depending on the number of non-conforming vessels) on measurement day 4.
- (2).
- Using three- and five-sample replicate experiments, we provide a robust dataset supporting improved precision of the modified setup.
- (3).
- Tests conducted at 30 °C indicate that the reported 0.906 mg CO2 g−1 OM d−1 ‘pooled’ standard deviation is a useful baseline for validating setups with stable samples but is not upheld with more active and inherently heterogeneous samples.
- (4).
- With reduced labour time for air flow adjustment and monitoring, the modified setup has potential for lower running costs.
- (5).
- Respirometer tests indicate that a consistent flow rate of 25 mL min−1 or above is expected to provide sufficient flow in this test for a 100 g FW sample.
Acknowledgments
Thomas J. Aspray acknowledges Watson Marlow for kindly providing Marprene tubing and the loan of the 520 pump. Thomas J. Aspray acknowledges the compost site staff and operators for allowing access and giving up time to support the sampling. Graham Howell acknowledges Chris Bennett for coding in an R statistical environment.
Author Contributions
All authors contributed to the experimental work and data analysis, Thomas J. Aspray and Graham Howell wrote the paper.
Conflicts of Interest
The authors declare no conflict of interest.
References
- Hanifzadeh, M.; Nabati, Z.; Longka, P.; Malakul, P.; Apul, D.; Kim, D.S. Life cycle assessment of superheated steam drying technology as a novel cow manure management method. J. Environ. Manag. 2017, 119, 83–90. [Google Scholar] [CrossRef] [PubMed]
- Aspray, T.J.; Dimambro, M.E.; Wallace, P.; Howell, G.; Frederickson, J. Static, dynamic and inoculum augmented respiration based test assessment for determining in-vessel compost stability. Waste Manag. 2015, 42, 3–9. [Google Scholar] [CrossRef] [PubMed]
- Barrena, R.; Font, X.; Gabarrell, X.; Sánchez, A. Home composting versus industrial composting: Influence of composting system on compost quality with focus on compost stability. Waste Manag. 2014, 34, 1109–1116. [Google Scholar] [CrossRef] [PubMed]
- Brinton, W.F. Compost Quality Standards and Guidelines. Woods End Research Laboratory, Prepared for New York State Association of Recyclers. 2000. Available online: http://compost.css.cornell.edu/Brinton.pdf (accessed on 20 November 2017).
- Waste & Resources Action Programme. Compost Stability: Impact and Assessment. 2015. Available online: http://www.wrap.org.uk/sites/files/wrap/Compost%20stability%20-%20Impact%20and%20assessment.pdf (accessed on 20 November 2017).
- Aspray, T.J.; Carvalho, D.J.C.; Philp, J.C. Application of soil slurry respirometry to optimise and subsequently monitor ex situ bioremediation of hydrocarbon-contaminated soils. Int. Biodeterior. Biodegrad. 2007, 60, 279–284. [Google Scholar] [CrossRef]
- Wichuk, K.M.; McCartney, D. Compost stability and maturity evaluation—A literature review. Can. J. Civ. Eng. 2010, 37, 1505–1523. [Google Scholar] [CrossRef]
- BSI PAS100—Publicly Available Specification for Composted Materials; British Standards Institution: London, UK, 2011; ISBN 978-0-58-065307-0.
- Llewelyn, R.H. Development of Standard Laboratory Based Test to Measure Compost Stability—Annex A; Project Code ORG0020; Waste & Resources Action Programme: Banbury, UK, 2005; Available online: http://www.wrap.org.uk/sites/files/wrap/DevLabTestCompostStability.pdf (accessed on 20 November 2017).
- Shen, Y.; Ren, L.; Li, G.; Chen, T.; Guo, R. Influence of aeration on CH4, N2O and NH3 emissions during aerobic composting of a chicken manure and high C/N waste mixture. Waste Manag. 2011, 31, 33–38. [Google Scholar] [CrossRef] [PubMed]
- Smet, E. The emission of volatile compounds during the aerobic and the combined anaerobic/aerobic composting of biowaste. Atmos. Environ. 1999, 33, 1295–1303. [Google Scholar] [CrossRef]
- Lu, S.G.; Imai, T.; Li, H.F.; Ukita, M.; Sekine, M.; Higuchi, T. Effect of Enforced Aeration on In-Vessel Food Waste Composting. Environ. Technol. 2001, 22, 1177–1182. [Google Scholar] [CrossRef] [PubMed]
- ASTM. D5975-96, Standard Test Method for Determining the Stability of Compost by Measuring Oxygen Consumption; ASTM: Conshohocken, PA, USA, 1996. [Google Scholar]
- Scaglia, B.; Acutis, M.; Adani, F. Precision determination for the dynamic respirometric index (DRI) method used for biological stability evaluation on municipal solid waste and derived products. Waste Manag. 2011, 31, 2–9. [Google Scholar] [CrossRef] [PubMed]
- Beck-Friis, B.; Smars, S.; Jonsson, H.; Eklind, Y.; Kirchmann, H. Composting of source-separated household organics at different oxygen levels: Gaining an understanding of the emission dynamics. Compost Sci. Util. 2003, 11, 41–50. [Google Scholar] [CrossRef]
- Ahn, H.K.; Richard, T.L.; Choi, H.L. Mass and thermal balance during composting of a poultry manure—Wood shavings mixture at different aeration rates. Process Biochem. 2007, 42, 215–223. [Google Scholar] [CrossRef]
- Suler, D.J.; Finstein, M.S. Effect of temperature, aeration, and moisture on CO2 formation in bench-scale, continuously thermophilic composting of solid waste. Appl. Environ. Microbiol. 1977, 33, 345–350. [Google Scholar] [PubMed]
- Pietravalle, S.; Aspray, T.J. CO2 and O2 respiration kinetics in hydrocarbon contaminated soils amended with organic carbon sources used to determine catabolic diversity. Environ. Pollut. 2013, 176, 42–47. [Google Scholar] [CrossRef] [PubMed]
- Almeira, N.; Komilis, D.; Barrena, R.; Gea, T.; Sanchez, A. The importance of aeration mode and flowrate in the determination of the biological activity and stability of organic wastes by respiration indices. Bioresour. Technol. 2015, 196, 256–262. [Google Scholar] [CrossRef] [PubMed]
- Godley, A.; Lewin, K.; Frederickson, J.; Smith, R.; Blakey, N. Application of DR4 and BM100 biodegradability tests to treated and untreated organic wastes. In Proceedings of the Eleventh International Waste Management and Landfill Symposium, Cagliari, Italy, 1–5 October 2007. [Google Scholar]
- Turrell, J.; Godley, A.R.; Agbasiere, N.; Lewin, K. Guidance on Monitoring of MBT and Other Treatment Processes for the Landfill Allowances Schemes (LATS and LAS) for England and Wales; Environment Agency: Bristol, UK, 2009; ISBN 978-1-84-911132-4.
Figure 1.
Schematic of the two ORG0020 setups; (a) original setup with diaphragm pump pushing air through CO2 scrubber and manifold delivering CO2 free air to vessels; (b) modified setup with multichannel pump pulling CO2 free air from a scrubber directly for individual vessels.
Figure 1.
Schematic of the two ORG0020 setups; (a) original setup with diaphragm pump pushing air through CO2 scrubber and manifold delivering CO2 free air to vessels; (b) modified setup with multichannel pump pulling CO2 free air from a scrubber directly for individual vessels.

Figure 2.
Air flow measurements from CO2 collection vessel outlets in original (dashed line, open triangle data points) and modified (solid line, filled square data points) setups for (a) experiment 1 and (b) experiment 2. Four replicates of each treatment are shown.
Figure 2.
Air flow measurements from CO2 collection vessel outlets in original (dashed line, open triangle data points) and modified (solid line, filled square data points) setups for (a) experiment 1 and (b) experiment 2. Four replicates of each treatment are shown.
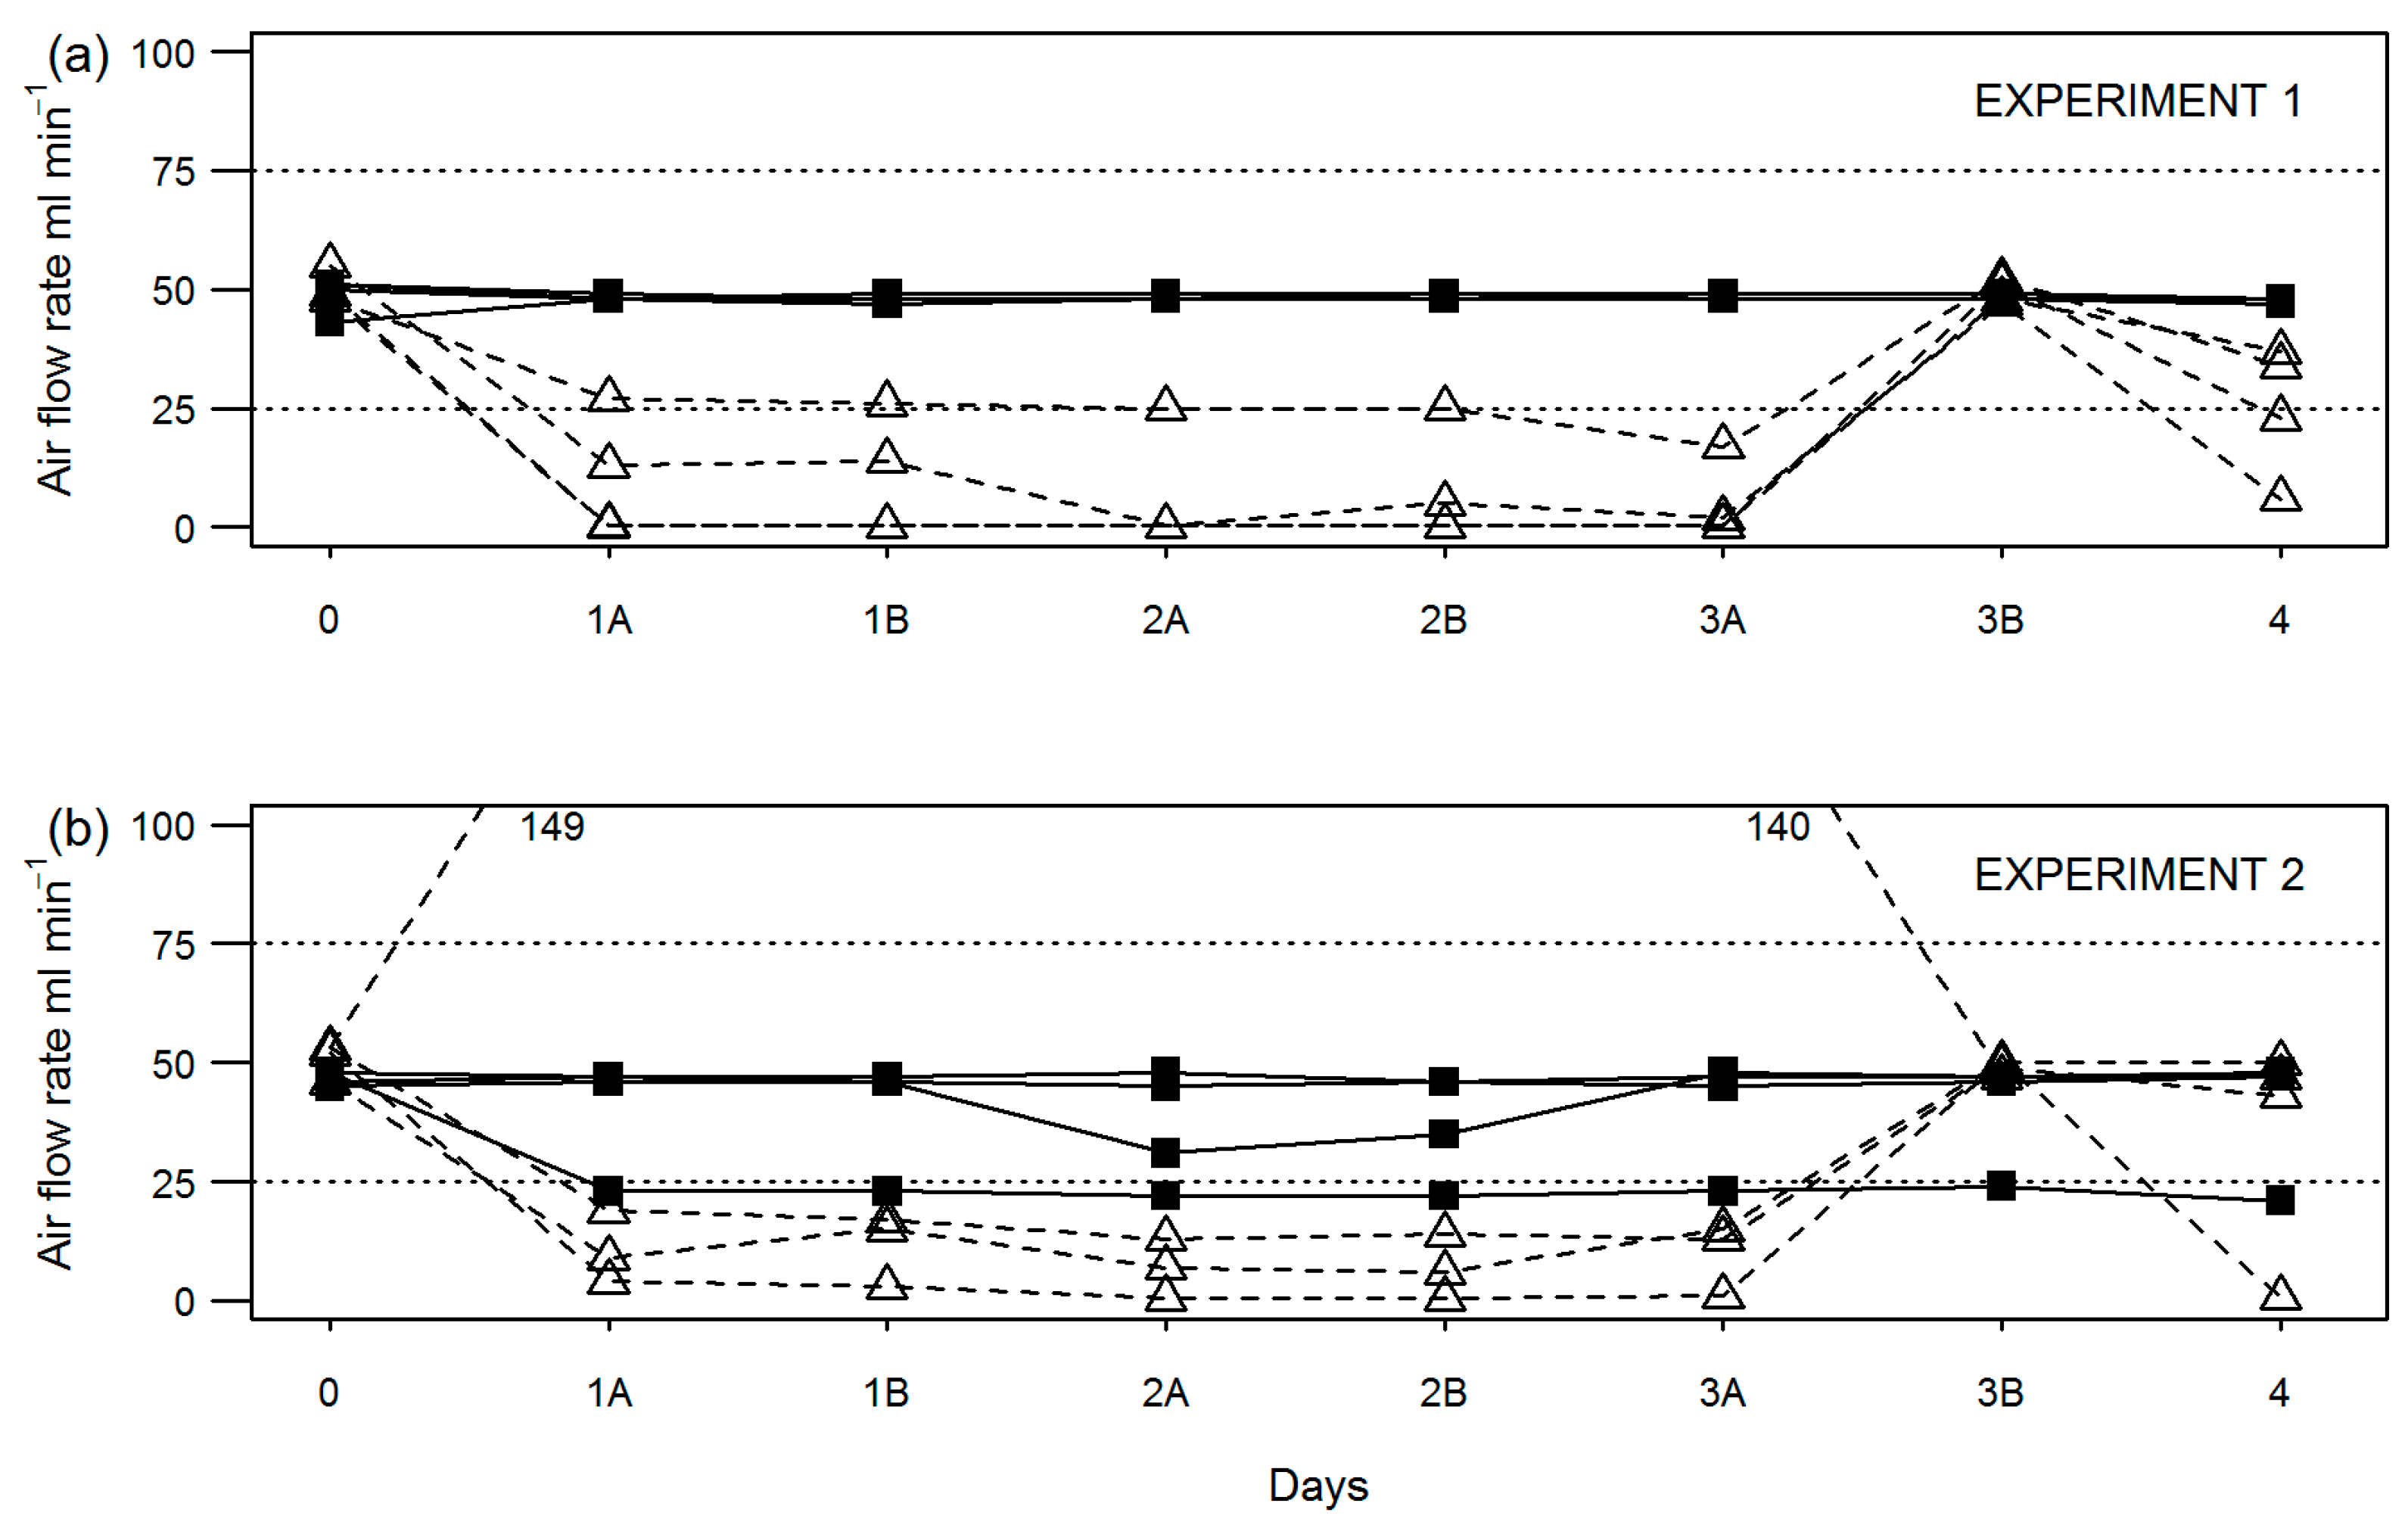
Figure 3.
Air flow measurements from CO2 collection vessel outlets in original (dashed line, open triangle data points) and modified (solid line, filled square data points) setups for experiments 4, 6, 7, 9 and 10. Replicate samples of each treatment are shown.
Figure 3.
Air flow measurements from CO2 collection vessel outlets in original (dashed line, open triangle data points) and modified (solid line, filled square data points) setups for experiments 4, 6, 7, 9 and 10. Replicate samples of each treatment are shown.
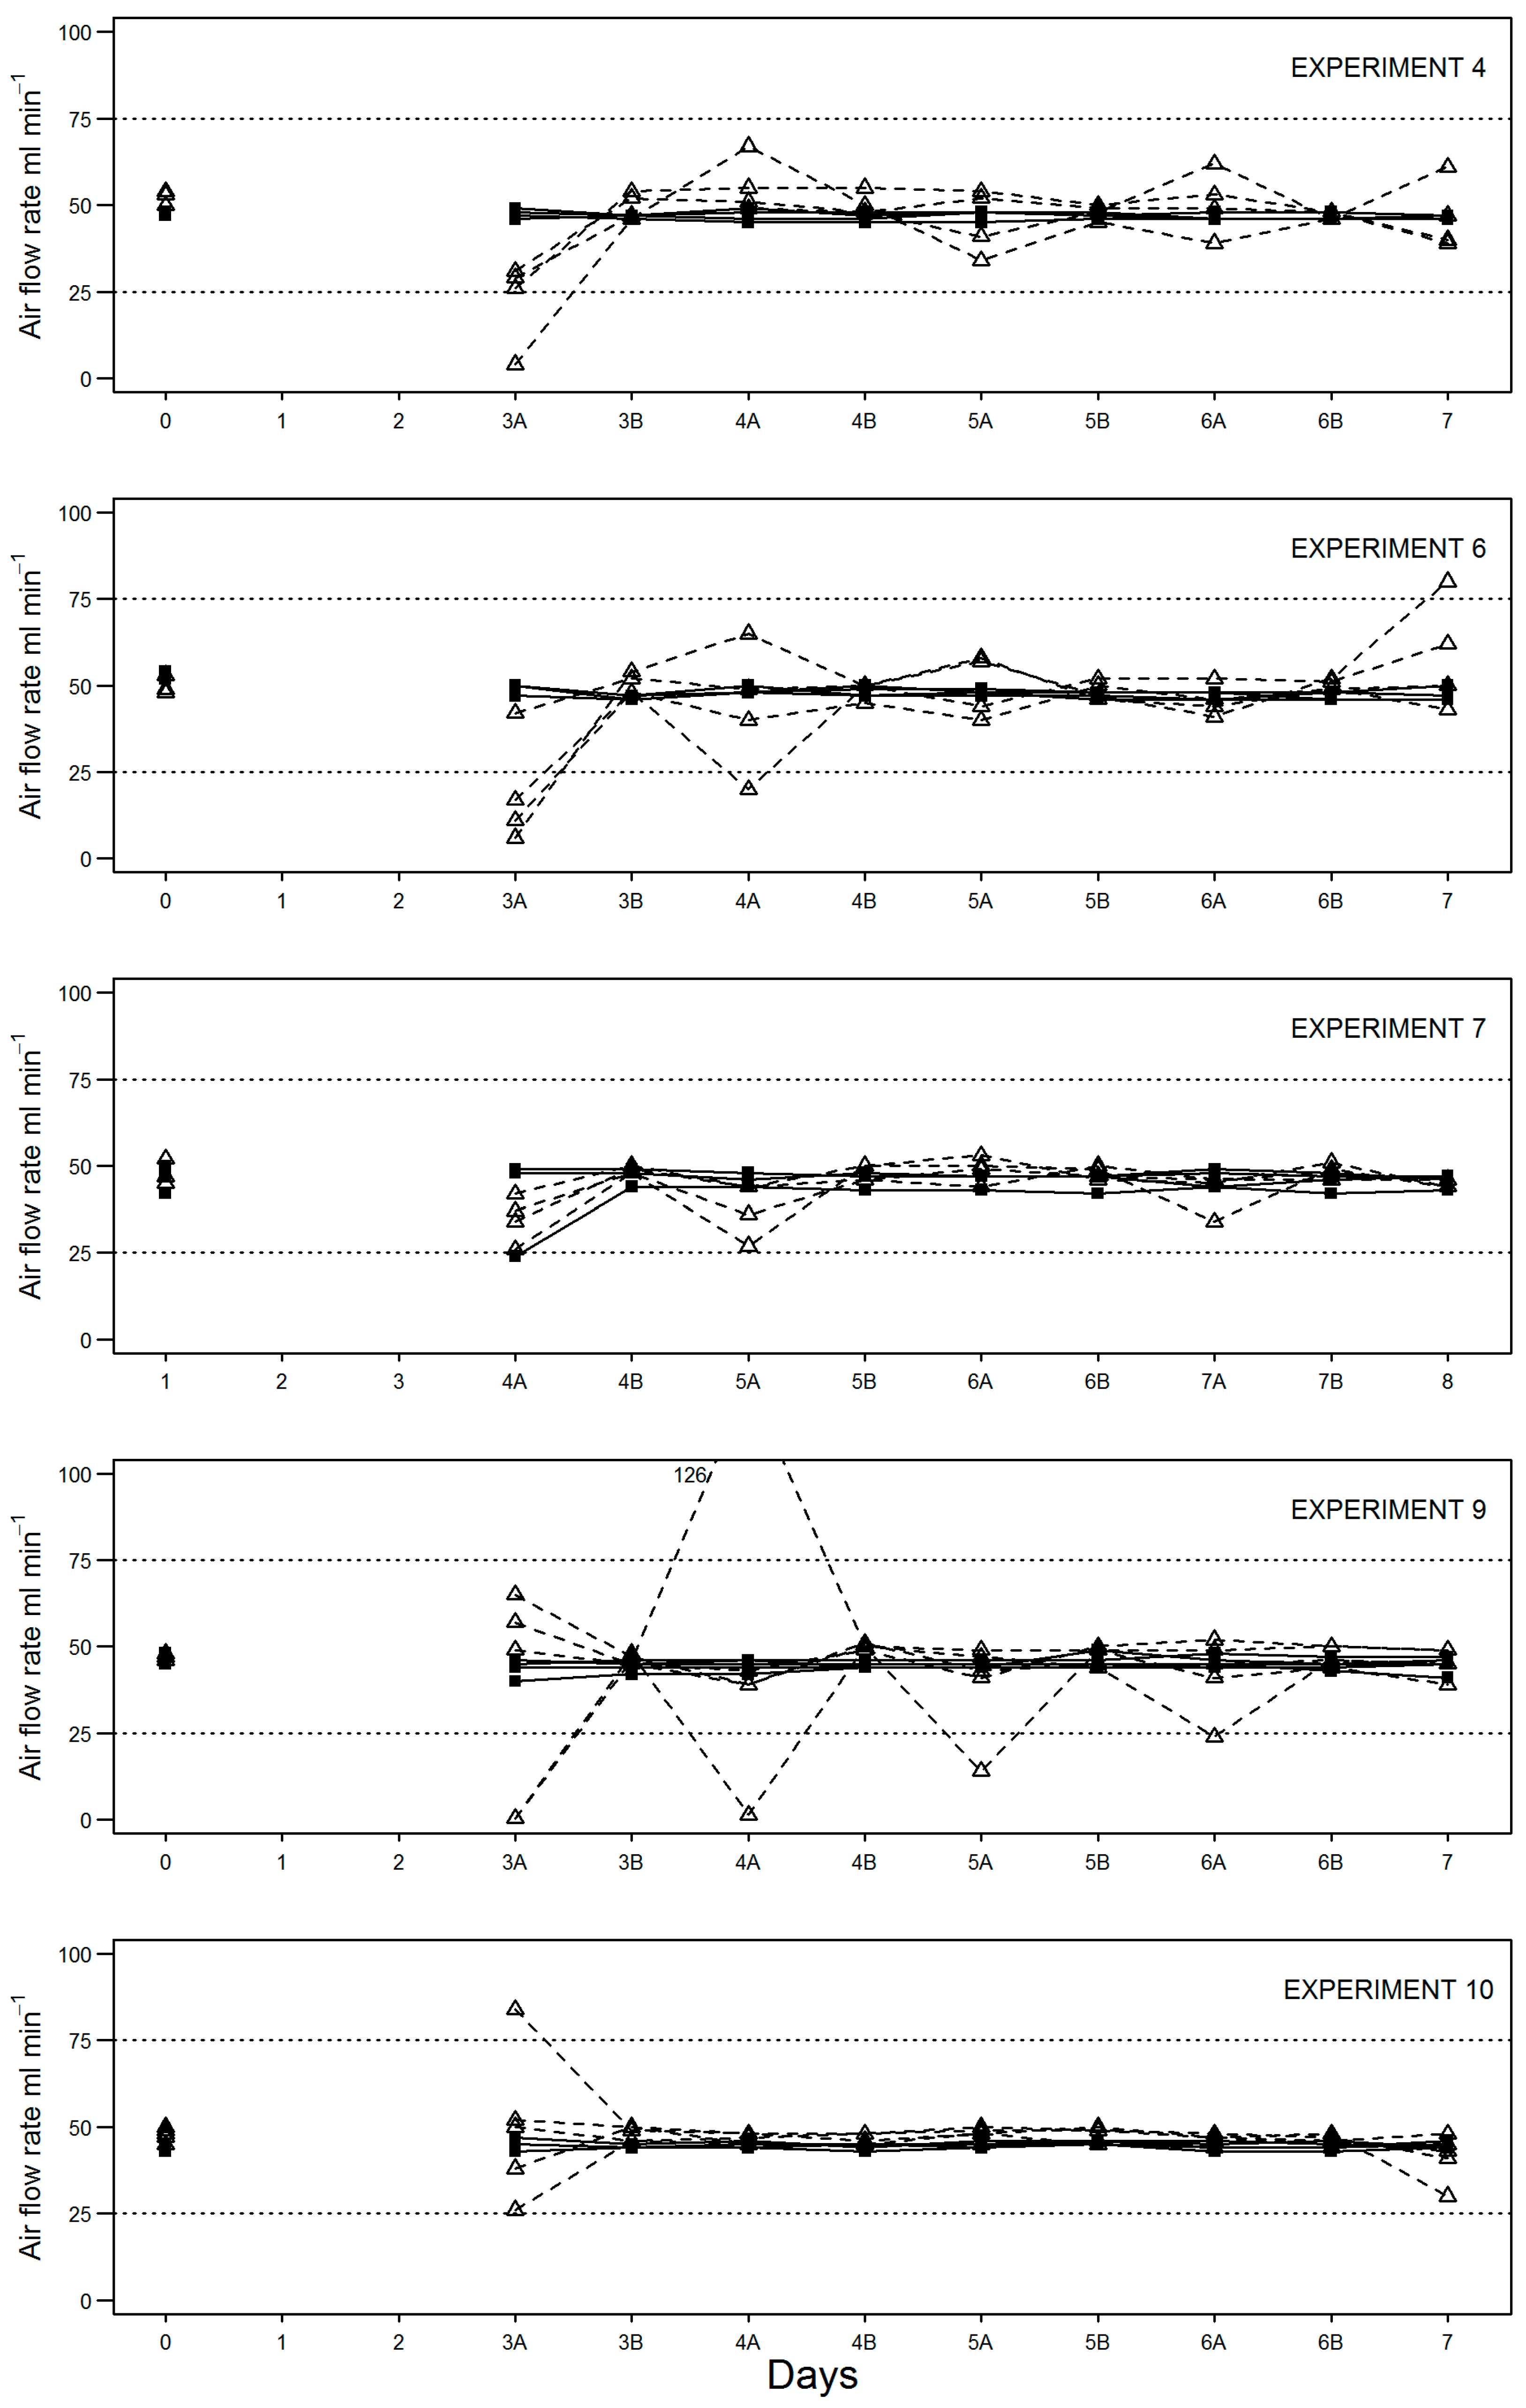
Figure 4.
Oxygen demand of industry compost samples using modified DR4 respirometry, calculated as L h−1 kg−1. The vertical line separates the pre-incubation period (days 0 to 3) from the period recorded ORG0020 (days 3 to 7). Site D is indicated by open circle data points, site I by open diamond data points, and site G by open triangle data points.

Table 1.
Characterisation of tested compost samples.
| Sample ID | Sample Status | Process Type | Feedstock | pH | EC (mS cm−1 @ 25 °C) | DM (%) | OM (%) |
|---|---|---|---|---|---|---|---|
| GF | Finished product | Ex situ | Green waste | 7.41 | 0.92 | 43.89 | 43.59 |
| GU | Post sanitized | Ex situ | Green waste | 8.10 | 0.81 | 34.93 | 43.67 |
| FF | Finished product | In-vessel | Green + food waste | n/d | n/d | 54.63 | 36.04 |
n/d—not determined.
Table 2.
Compost stability mean and standard deviation (in parentheses) after equilibration period using the original and modified ORG0020 setups (experiments 1 and 2) or original setup only (experiment 3).
Table 2.
Compost stability mean and standard deviation (in parentheses) after equilibration period using the original and modified ORG0020 setups (experiments 1 and 2) or original setup only (experiment 3).
| Experiment Number | 1 | 2 | 3 | |
|---|---|---|---|---|
| Compost Sample | GF | GF | GU | |
| Day 4 (mg CO2 g−1 OM) | Original | 8.31 (4.73) | 1.97 (0.54) | 8.99 (0.43) |
| Original (lowered flow *) | n/a | n/a | 10.91 (0.25) | |
| Modified | 2.74 (0.22) | 2.16 (0.30) | n/a | |
* Air flow manipulated to <10 mL min−1 from day 2 to 3.
Table 3.
Stability of three compost samples assessed using the original and modified ORG0020 setups with air flow rate set between 45–50 mL min−1. Values represent mean and standard deviation (in parentheses).
Table 3.
Stability of three compost samples assessed using the original and modified ORG0020 setups with air flow rate set between 45–50 mL min−1. Values represent mean and standard deviation (in parentheses).
| Experiment Number | 4 | 6 | 7 | 9 | 10 | |
|---|---|---|---|---|---|---|
| Compost Sample | GF | FF | GU | GU | GU | |
| Day 4 (mg CO2 g−1 OM) | Original | 2.96 (0.31) | 1.04 (0.07) | 8.49 (0.63) | 12.35 (5.72) | 7.03 (0.94) |
| Modified | 2.41 (0.60) | 0.78 (0.004) | 8.45 (0.51) | 7.87 (0.30) | 5.67 (0.36) | |
| Day 5 (mg CO2 g−1 OM) | Original | 2.76 (0.19) | 0.75 (0.07) | 8.05 (0.09) | 7.65 (1.54) | 6.33 (0.62) |
| Modified | 2.50 (0.13) | 0.30 (0.06) | 9.03 (0.65) | 7.40 (0.36) | 4.48 (0.36) | |
| Day 6 (mg CO2 g−1 OM) | Original | 2.10 (0.18) | 0.60 (0.13) | 8.44 (0.65) | 6.15 (1.12) | 5.91 (0.69) |
| Modified | 2.25 (0.17) | 0.41 (0.06) | 8.69 (0.98) | 7.00 (0.20) | 4.93 (0.39) | |
| Day 7 (mg CO2 g−1 OM) | Original | 2.67 (0.30) | 0.52 (0.07) | 7.56 (1.10) | 6.19 (0.96) | 5.39 (1.00) |
| Modified | 2.48 (0.37) | 0.45 (0.23) | 8.30 (0.55) | 6.63 (0.24) | 5.17 (0.46) | |
| Days 4–7 average stability (mg CO2 g−1 OM d−1) | Original | 2.70 (0.22) | 0.73 (0.08) | 8.14 (0.56) | 8.09 (1.78) | 6.16 (0.79) |
| Modified | 2.41 (0.12) | 0.48 (0.04) | 8.62 (0.67) | 5.78 (0.18) | 5.34 (0.38) | |
Values in parentheses indicated standard deviation of triplicate (experiments 4, 6, 7) and quadruplicate (experiments 9 and 10) vessels.
Table 4.
Running cost differences between original and modified setups using two pump types set to 45–50 mL min−1 per vessel. Note that this is not a total running cost as it assumes other consumables (such as NaOH and HCl) and other labour time are identical between setups.
Table 4.
Running cost differences between original and modified setups using two pump types set to 45–50 mL min−1 per vessel. Note that this is not a total running cost as it assumes other consumables (such as NaOH and HCl) and other labour time are identical between setups.
| Pump Type/Model/Max rpm | Pump Head rpm | Pump Head Channels per Vessel | Cost for One Replicated Sample Run | |||
|---|---|---|---|---|---|---|
| Marprene® Tubing a | Electricity b | Labour c | Line Total | |||
| Diaphragm | n/a | n/a | n/a | £0.22 | £5.83 | £6.06 |
| Peristaltic/502 series/100 rpm | 99 | 2 | £2.92 | £0.40 | £1.83 | £5.16 |
| Peristaltic 520 series/220 rpm | 170 # | 1 | £1.46 | £0.51 | £1.83 | £3.81 |
n/a—not applicable; rpm—revolutions per minute; # max of 505CA pump head; a based on tubing lifespan of 4 weeks; b £0.15 per kilowatt hour; c £10 per hour (air flow monitoring and adjustment only).
Table 5.
Oxygen demand and equivalent flow for 15%, 10% O2 concentration in outlet for previously analysed samples [1].
Table 5.
Oxygen demand and equivalent flow for 15%, 10% O2 concentration in outlet for previously analysed samples [1].
| Site Samples # | O2 Demand (Peak) L h−1 kg−1 | O2 Demand (Mean) L h−1 kg−1 | Equation Flow for 15% O2 mL min−1 | Equation Flow for 10% O2 mL min−1 |
|---|---|---|---|---|
| I | 0.82 | 0.21 | 23.1 | 12.5 |
| G | 0.64 | 0.35 | 18.0 | 9.8 |
| A | 0.13 | 0.04 | 3.6 | 1.9 |
| B | 0.07 | 0.05 | 2.1 | 1.1 |
| D | 0.06 | 0.05 | 1.6 | 0.9 |
# Refer to Aspray et al. [2] for further site information and sample characterization.
© 2017 by the authors. Licensee MDPI, Basel, Switzerland. This article is an open access article distributed under the terms and conditions of the Creative Commons Attribution (CC BY) license (http://creativecommons.org/licenses/by/4.0/).
Share and Cite
MDPI and ACS Style
Guillen Ferrari, D.; Howell, G.; Aspray, T.J. Improved Precision and Efficiency of a Modified ORG0020 Dynamic Respiration Test Setup for Compost Stability Assessment. Sustainability 2017, 9, 2358. https://doi.org/10.3390/su9122358
AMA Style
Guillen Ferrari D, Howell G, Aspray TJ. Improved Precision and Efficiency of a Modified ORG0020 Dynamic Respiration Test Setup for Compost Stability Assessment. Sustainability. 2017; 9(12):2358. https://doi.org/10.3390/su9122358
Chicago/Turabian StyleGuillen Ferrari, Diana, Graham Howell, and Thomas J. Aspray. 2017. "Improved Precision and Efficiency of a Modified ORG0020 Dynamic Respiration Test Setup for Compost Stability Assessment" Sustainability 9, no. 12: 2358. https://doi.org/10.3390/su9122358
Note that from the first issue of 2016, this journal uses article numbers instead of page numbers. See further details here.