Sustainable Seafood Consumption in Action: Relevant Behaviors and their Predictors


1
Department of Psychology, Norwegian University of Science and Technology, 7049 Trondheim, Norway
2
Department of Management, Aarhus University, Fuglesangs Allé 4, 8210 Aarhus V, Denmark
*
Author to whom correspondence should be addressed.
Sustainability 2017, 9(12), 2313; https://doi.org/10.3390/su9122313
Submission received: 2 November 2017
/
Revised: 26 November 2017
/
Accepted: 6 December 2017
/
Published: 12 December 2017
(This article belongs to the Special Issue Sustainable Food Innovation)
Abstract
:Within the discussion around sustainable diets, seafood consumption is still a relatively neglected field. This article discusses relevant behaviours consumers can perform to consume seafood sustainably. The predictive power of intention, descriptive social norms, trust, awareness and pro-environmental attitudes are theoretically discussed and statistically tested across two studies in regards to (a) using sustainable seafood labels, and (b) using sustainable seafood guides. Data analysis (N1 = 309, N2 = 881 Norwegian adults) shows that intentions, social norms and trust predict seafood label use across studies. The variables predicting seafood guide use are less stable which might be due to this behaviour being performed by a very small fraction of consumers only. Causal relationships have been identified in study 2 by applying cross-lagged panel analyses between intentions, trust and social norms and seafood label use. Further causal relationships were found between intentions, trust and awareness and seafood guide use. A bidirectional relationship was confirmed between descriptive social norms and seafood guide use. Potential strategies to promote seafood label- and seafood guide use, are discussed based on these results.
1. Introduction
Extensive fishing and fish farming for human consumption is a major threat to marine biodiversity [1,2,3,4]. Many commercial fish stocks are exploited to a level where the existence of the corresponding fisheries is threatened [4,5]. Given that fishing and fish farming continues the current course, this could cause a critical gap in worldwide food provision, especially in developing countries [4,6,7]. Significant changes in seafood production and consumption, especially in industrialised countries, are needed if fish shall be part of human diets in the future [8,9].
It has been convincingly argued that consumer behaviour can be an effective bottom-up lever for sustainable (marine-) resource use [10,11,12,13,14,15,16,17]. Consumer demand for sustainable seafood motivated an increasing number of wholesalers and brands to collaborate with certification programs. Examples are the wholesaler EDEKA chain in Germany, Walmart in the US [18], IKEA and McDonalds worldwide, the Swedish brand Findus [19] or the UK based brand Iglu [20] who decided to exclusively sell MSC-certified seafood.
Therefore, we here explore potential drivers for sustainable seafood consumption among Norwegian seafood consumers, as a point of departure for creating effective interventions to release this potential.
Norway is an ideal country to study sustainable seafood consumption. Seafood is among the strongest drivers of the Norwegian economy and also a core component of the Norwegian food culture. Norway ranges among the three most seafood consuming countries in Europe with 52.1 kg per capita per year, more than twice the European average of 21.9 kg [8]. Seafood is Norway’s second largest export sector after oil and gas, and Norway is the second biggest seafood export nation in the world, after China [21].
1.1. The Concept of Sustainable Seafood Consumption
To consume seafood sustainably, consumers need to (a) understand what this means and (b) prioritise sustainability over conflicting factors (e.g., price, the taste for a certain seafood species) in the purchase situation.
Sustainable seafood consumption can be described as “the consumption of sustainable amounts of seafood which was caught or farmed in ways that neither harm the population status of the target species, nor any other part of the ecosystem” [22]. For lay people, implementing this praxis into actual behavior is challenging. Aspects such as stock status, catch method, discard, transportation, packaging and many more need to be considered to judge whether a seafood product is sustainable according to this definition. Most of these factors are usually not available at the point of purchase, or specific and rare expertise is needed for properly evaluating the product on all of these dimensions.
Further, during the product selection processes, consumers are influenced by a wide range of factors, including advertising, price, taste, and species preferences of oneself and one’s family, in addition to sustainability aspects [23,24]. These additional criteria may conflict with sustainability criteria. Hence, in choice situations, consumers often need to make trade-offs between sustainability goals and other goals.
In the present study, we investigate which factors predict sustainable seafood consumption among Norwegian consumers and how they can be further encouraged to choose sustainable seafood. More specifically, we describe actions that consumers can choose to make their seafood consumption more sustainable, identify significant predictors of these actions, integrate them into a model of sustainable seafood consumption, and discuss implications for practitioners. Because it is essential for intervention planning, we also assess the direction of causality between sustainable seafood consumption and its predictors.
With the double aim of (a) meeting as many criteria of sustainable seafood consumption as possible and (b) ease of implementation, some solutions have been proposed:
- Reduce overall seafood consumption [25]. However, the environmental gain from doing so depends on the substitutes chosen for seafood. The majority of all protein consumed worldwide stems from animal sources [26] (p. 87) and the reduction of one source of animal protein, such as seafood, might lead to the increase of another source of protein, such as meat or dairy. Eventually, this could cause the environmental gain regarding CO2 emissions, land- and water-use to be negative [27,28]. Therefore, calling on consumers to drastically reduce their seafood consumption, without securing more sustainable substitutes, would neglect the bigger picture.
- Sustainability labeling, providing relevant information at the point of purchase [29,30]. Third-party sustainable seafood labels are symbols printed on the package of products that are certified sustainable. Third-party labeling and certification are awarded by independent organisations such as the Marine Stewardship Council (MSC) or Friends of the Sea (FOS) to fisheries and fish farms fulfilling their criteria.
- Seafood guides, listing sustainable and unsustainable seafood alternatives for the consumer [31,32]. Institutions such as the World Wildlife Fund (WWF) and Greenpeace offer brochures and mobile apps to support sustainable seafood consumption, usually applying traffic light systems for easy handling.
In this article, we focus specifically on using seafood labels and seafood guides as our target behaviors. We see these as the most feasible compromises between meeting the criteria for sustainable seafood and realistic purchase situations. As labeling is applied in many areas of food consumption, many consumers are familiar with this phenomenon [30]. In contrast, sustainable seafood guide use is so far a marginal phenomenon that not many consumers are aware of and that is not commonly applied in other areas of consumption [33].
1.2. Motivational Variables
Conscious, voluntary pro-environmental behavior requires motivation [40], which is transformed into a concrete behavioral intention [41]. Intentions have been found to be a direct predictor of behaviors such as buying sustainable products [42,43,44] or the consumption of seafood [45,46,47]. Intending to consume seafood sustainably is likely to increase the chances of this behavior to be performed.
Behavior can be rooted in both personal and social motivation, often referred to as attitudes and perceived or subjective social norms [48]. Research has found that the stronger the person’s pro-environmental attitude, the higher the likelihood that they perform more and more difficult pro-environmental behaviors [49]. The intention to include sustainable seafood into the behavioral repertoire is assumed to increase with pro-environmental attitudes. People with strong pro-environmental attitudes overcome barriers for pro-environmental actions easier in comparison to people with weak pro-environmental attitudes and thereby perform more and more difficult pro-environmental behaviors [50,51,52]. In Norway, sustainable seafood consumption is neither very easy (such as switching off lights) nor very difficult (such as installing solar panels), and such medium-difficult behaviors are particularly prone to be influenced by a person’s attitude [49,53,54].
Social normative perceptions have also been found to contribute to the prediction of pro-environmental intentions and behavior [55,56]. Taking the descriptive power of social norms as an example, observing the food consumption of people influences intentions and behaviour of the observer [57,58,59,60]. Adoption of a new sustainable seafood label depends on other consumers’ behavior as well [30]. Since both label and guide use are not easy to observe and at least guide use is not very common yet, negative effects of descriptive social norms on the use of seafood labels or seafood guides cannot be ruled out [60]. Hence, the effect of descriptive social norms can go in both directions: it can motivate consumers to use seafood labels or seafood guides, or it can demotivate them because they feel that this behavior is not performed by anyone else. It is also unclear if the effects of descriptive social norms on behavior are direct or mediated by intentions, as both cases were observed in previous studies [55,56,57,58,59].
Norwegian consumers’ high trust in Norwegian food products might reduce their trust in certificates of foreign origin, such as sustainable labeling on seafood [61]. Consumer trust is crucial if they are to rely on this kind of information [44,62,63,64,65,66,67]. Hence, the widespread consumer scepticism towards sustainability claims is a problem for the general adoption and diffusion of sustainability labels [35,68,69]. We, therefore, assume that trust is critical for making conscious, sustainable seafood choices.
In sum, prior research suggests that the use of seafood labels and seafood guides depend on the consumer’s intentions, pro-environmental attitudes, social norms, and trust. Because they are similar and expressions of the same motivational goal, we assume that the use of sustainable seafood labels and guides co-vary. For the same reasons, we expect that both the use of seafood labels and seafood guides depend on the same set of variables. However, we expect that the strengths of relationships differ, among other things due to the difference in how common these two behaviors are. We further expect that intentions to consume sustainable seafood are an immediate antecedent of both of these behaviours. We expect the behavioral impact of general pro-environmental attitudes to be mediated via intentions. The impact of social norms and trust on both expressions of sustainable seafood consumption might be mediated via intentions, but when specified to the specific behaviors in question, direct behavioral impacts cannot be ruled out either. The proposed model structure can be examined in Figure 1.
1.3. Demographics
Past research has found that women engage more than men in the consumption of both organic food and seafood [47]. Since women are more often than men in charge of grocery shopping in households, consumption of these commodities may vary less between genders than choice, though. Age, income and education have often been found to be related to sustainable consumption, but not in uniform patterns [52,70,71,72]. Age and education also seem to be related to the amount and the type of seafood purchased, with older and more educated people consuming more seafood [47,73,74]. Income is a significant predictor of the purchase of organic food [71,75], but does not seem to be related to seafood consumption [76,77]. Because of the inconsistent pattern of relationships between demographic variables and sustainable consumption or seafood consumption, there is no solid basis for formulating hypotheses about demographic variations in sustainable seafood consumption. Instead, we will explore these relationships empirically first, and subsequently, control for demographic variables that significantly contribute to the total variance explained in our model.
2. Study 1
2.1. Sample and Materials
Study 1 was conducted to explore the empirical applicability of our model, which was based on theory and past research. We collected a sample for study 1 consisting of 309 Norwegian consumers who received invitation letters to participate in a web survey in summer 2015 (total invitations N = 3000, response rate = 10%). Before the data collection, the online questionnaire was pre-tested by a sample of students in summer 2015 (N = 72), which led to minor revisions to increase intelligibility and reliability. Names and addresses were obtained from the Norwegian population registry. Recipients of the invitation letter were informed that everyone completing this survey would participate in a lottery to win an Apple iPad. The sample was decently representative of the Norwegian population in regards to gender, age and income [78]. In our sample, the older age groups were represented slightly more than in the general Norwegian population, and the income level was slightly lower. Around double as many people had a university education compared to the general population (62.30% vs. 32.90% [79]). This, in addition to the low response rate, means that the sample cannot be considered fully representative, which needs to be kept in mind when interpreting the results. Table 1 shows the demographic profile of Sample 1 in the first two columns and the population averages for comparison in the last column [78].
2.2. Measures
General questions on food and seafood consumption were asked first, before questions about the knowledge and use of sustainable seafood labels and guides. Then a block of motivational variables (intentions, attitudes, social norms and trust) followed. Demographics were reported last. Sustainable seafood label- and guide use were assessed with one item each (“Do you use sustainable seafood labels as a reference when you buy seafood?”; “Do you use a sustainable seafood guide as a reference when you buy seafood?”) Answers were recorded on a 7-point scale ranging from 1 = Never to 7 = Always. Before asking these questions, the concepts of seafood labels and guides were briefly explained.
Intentions and social norms were measured using several statements on a 7-point Likert Scale. These statements were formulated according to general recommendations [80,81], and adapted to sustainable seafood consumption. The items measuring intentions were, “I want to make an effort to make my seafood consumption more sustainable in the near future”, “I have the intention to use a seafood guide/seafood labels to choose sustainable seafood in the near future”, “I wish to consume sustainable seafood in the near future” and “I will make an effort to use a sustainable seafood guide/seafood labels in the near future.” The reliability of this construct is excellent (Cronbach’s alpha = 0.90).
The items measuring social norms were, “My family and friends consider sustainability aspects when they buy seafood”, “My family and friends started buying sustainable seafood”, and “Most people in my surroundings consider sustainability aspect when they buy seafood”. Also for this construct, the reliability is excellent (Cronbach’s alpha = 0.87).
General pro-environmental attitudes were measured by a six-item short form of the New Environmental Paradigm (NEP) scale [82], again a 7-point Likert Scale (Cronbach’s alpha = 0.74). A representative item of the attitude scale is “The balance of nature is very delicate and easily upset”.
Trust in sustainable seafood information was measured by one item each for labels and guides: “How much do you trust information provided by seafood labels/seafood guides?” Options ranged from “very much” to “not at all”.
2.3. Results
2.3.1. Self-Reported Consumption
Across our sample, seafood was consumed as a main meal about three times per week on average (M = 3.11; SD = 1.07 Min = 1; Max = 6). Meat was consumed most often as a main meal, on average four times per week (M = 4.25; SD = 1.34; Min = 1; Max = 6), while vegetarian meals were consumed just once or twice as a main (M = 1.81; SD = 1.14; Min = 1; Max = 6). The seafood our participants consumed the most was salmon, cod, mackerel and shrimps/scampi. Herring and mussels were consumed the least among the listed species.
17.79% of the participants reported to look for sustainable seafood labels at least sometimes, and 6.65% reported to use sustainable seafood guides at least sometimes when purchasing seafood. With 93.35% of participants never or almost never using seafood guides, we assume a “floor effect” resulting in a reduced variance. This floor effect needs to be considered for our further analyses and the interpretation of our results.
2.3.2. Model of Sustainable Seafood Consumption
We tested the proposed relationships between predictor variables and target behaviors using Stata MP 14 [83]. A structural equation model (SEM) was specified according to our theoretical assumptions as displayed in Figure 1. Santora-Bentler correction was used due to the non-normal distribution of the dependent variables. The covariance-correlation matrix is reported in Table 2.
In Figure 1, the standardized regressions weights of the structural model are reported as well model fit indices. The fit indices indicate that the proposed model gives an acceptable representation of the data. Label use is significantly predicted by social norms, trust and intentions, but only indirectly by attitudes. Guide use is only predicted directly by intentions and indirectly by social norms, trust and attitudes. The model predicts label use better (R2 = 0.40) than guide use (R2 = 0.12), presumably because so few people use guides.
To evaluate the contribution of demographic variables (gender, age, income and education) we also ran a model including demographics. (The results of this model estimation are not shown due to space concerns, but they can be acquired from the first author.) None of the paths between demographics and behavior (label use and guide use) is significant when controlling for the psychological constructs in the model. Hence, to keep the model simple, we left demographics out.
2.4. Discussion
Seafood label and guide use are significantly predicted by intentions for sustainable seafood consumption, which suggests that the use of labels and guides is indeed part of a conscious plan to consume more sustainable seafood. However, the fact that trust in the information source and social norms predict additional variance in label use, after controlling for intentions suggests either that some consumers use labels and or guides without having explicitly planned to do so or that a lack of trust acts as a barrier for label use by inhibiting positive intentions. Seafood guide use is only predicted directly by intentions, but indirectly, social norms, trust and attitudes might play a role as well. The social norms-behavior relationship is stronger for the use of seafood labels than guides, which may reflect that the labels are visible in the buying situation whereas the guides are not. Also, seafood guide use is less common, leaving less room for social influence. The finding that trust seems to play less of a role for the use of seafood guides than labels could be due to the small fraction of our participants using guides, which leaves little variance in this variable to explain. So little people using seafood guides points towards a lack of awareness we suggest the assessment of knowledge of seafood guides in future studies.
3. Study 2
3.1. Introduction
In our second study, we aim to cross-validate the model structure on a larger sample and, above that, assess assumed causal relationships. In addition to the variables included in the model in Figure 1, we include a measure of awareness about sustainable seafood guides because the results from Study 1 indicate very little knowledge about them. Hence, we suggest that measuring awareness about seafood guides will help us understand this behavior better.
3.2. Sample and Materials
We recruited the participants for study 2 from a Norwegian survey panel in autumn 2015. 3187 panel members were contacted and asked to fill out an online survey twice with a gap of four weeks. 881 filled out the questionnaire at time 1 (response rate = 27.64%) and 449 at time 2 (51.02% of the participants in time 1 and 14.09% of the total sample). Participating panel members were rewarded with incentive points to their panel account. The demographic profile was comparable to the sample in Study 1 (see Table 1). However, participants in Study 2 were slightly older and their level of income slightly lower than in Study 1. The pattern of seafood consumption was also very similar to sample 1, with fish as a main meal three times per week on average (M = 3.12; SD = 1.17 Min = 1; Max = 6), meat four times (M = 4.09; SD = 1.33; Min = 1; Max = 6) and vegetarian meals less than two per week (M = 1.83; SD = 1.25; Min = 1; Max = 6).
The questionnaire was identical to the one in Study 1. For our analysis, we assessed two additional questions to investigate the level of awareness of seafood guides (“I know how to get a seafood guide”, “I know how to use a seafood guide”). Responses were measured on a 7-point Likert scale. The two-item construct has an acceptable reliability (Cronbach’s alpha = 0.79).
3.3. Model Validation
In study 2, 17.32% of the participants reported looking for sustainable seafood labels at least sometimes when purchasing seafood and 7.04% reported to use sustainable seafood guides at least sometimes. This is again very similar to the pattern found in Study 1. A slight increase in these behaviors (20.57% seafood label use, 12.09% seafood guide use) was reported four weeks later. It cannot be ruled out that this slight increase between rounds is caused by retest bias [84]. Attrition bias was tested for and rejected. 16.29% of the participants indicated to know how to get a seafood guide, and 18.12% knew how to use it (in both cases taking participants who reported to at least “somewhat agree”).
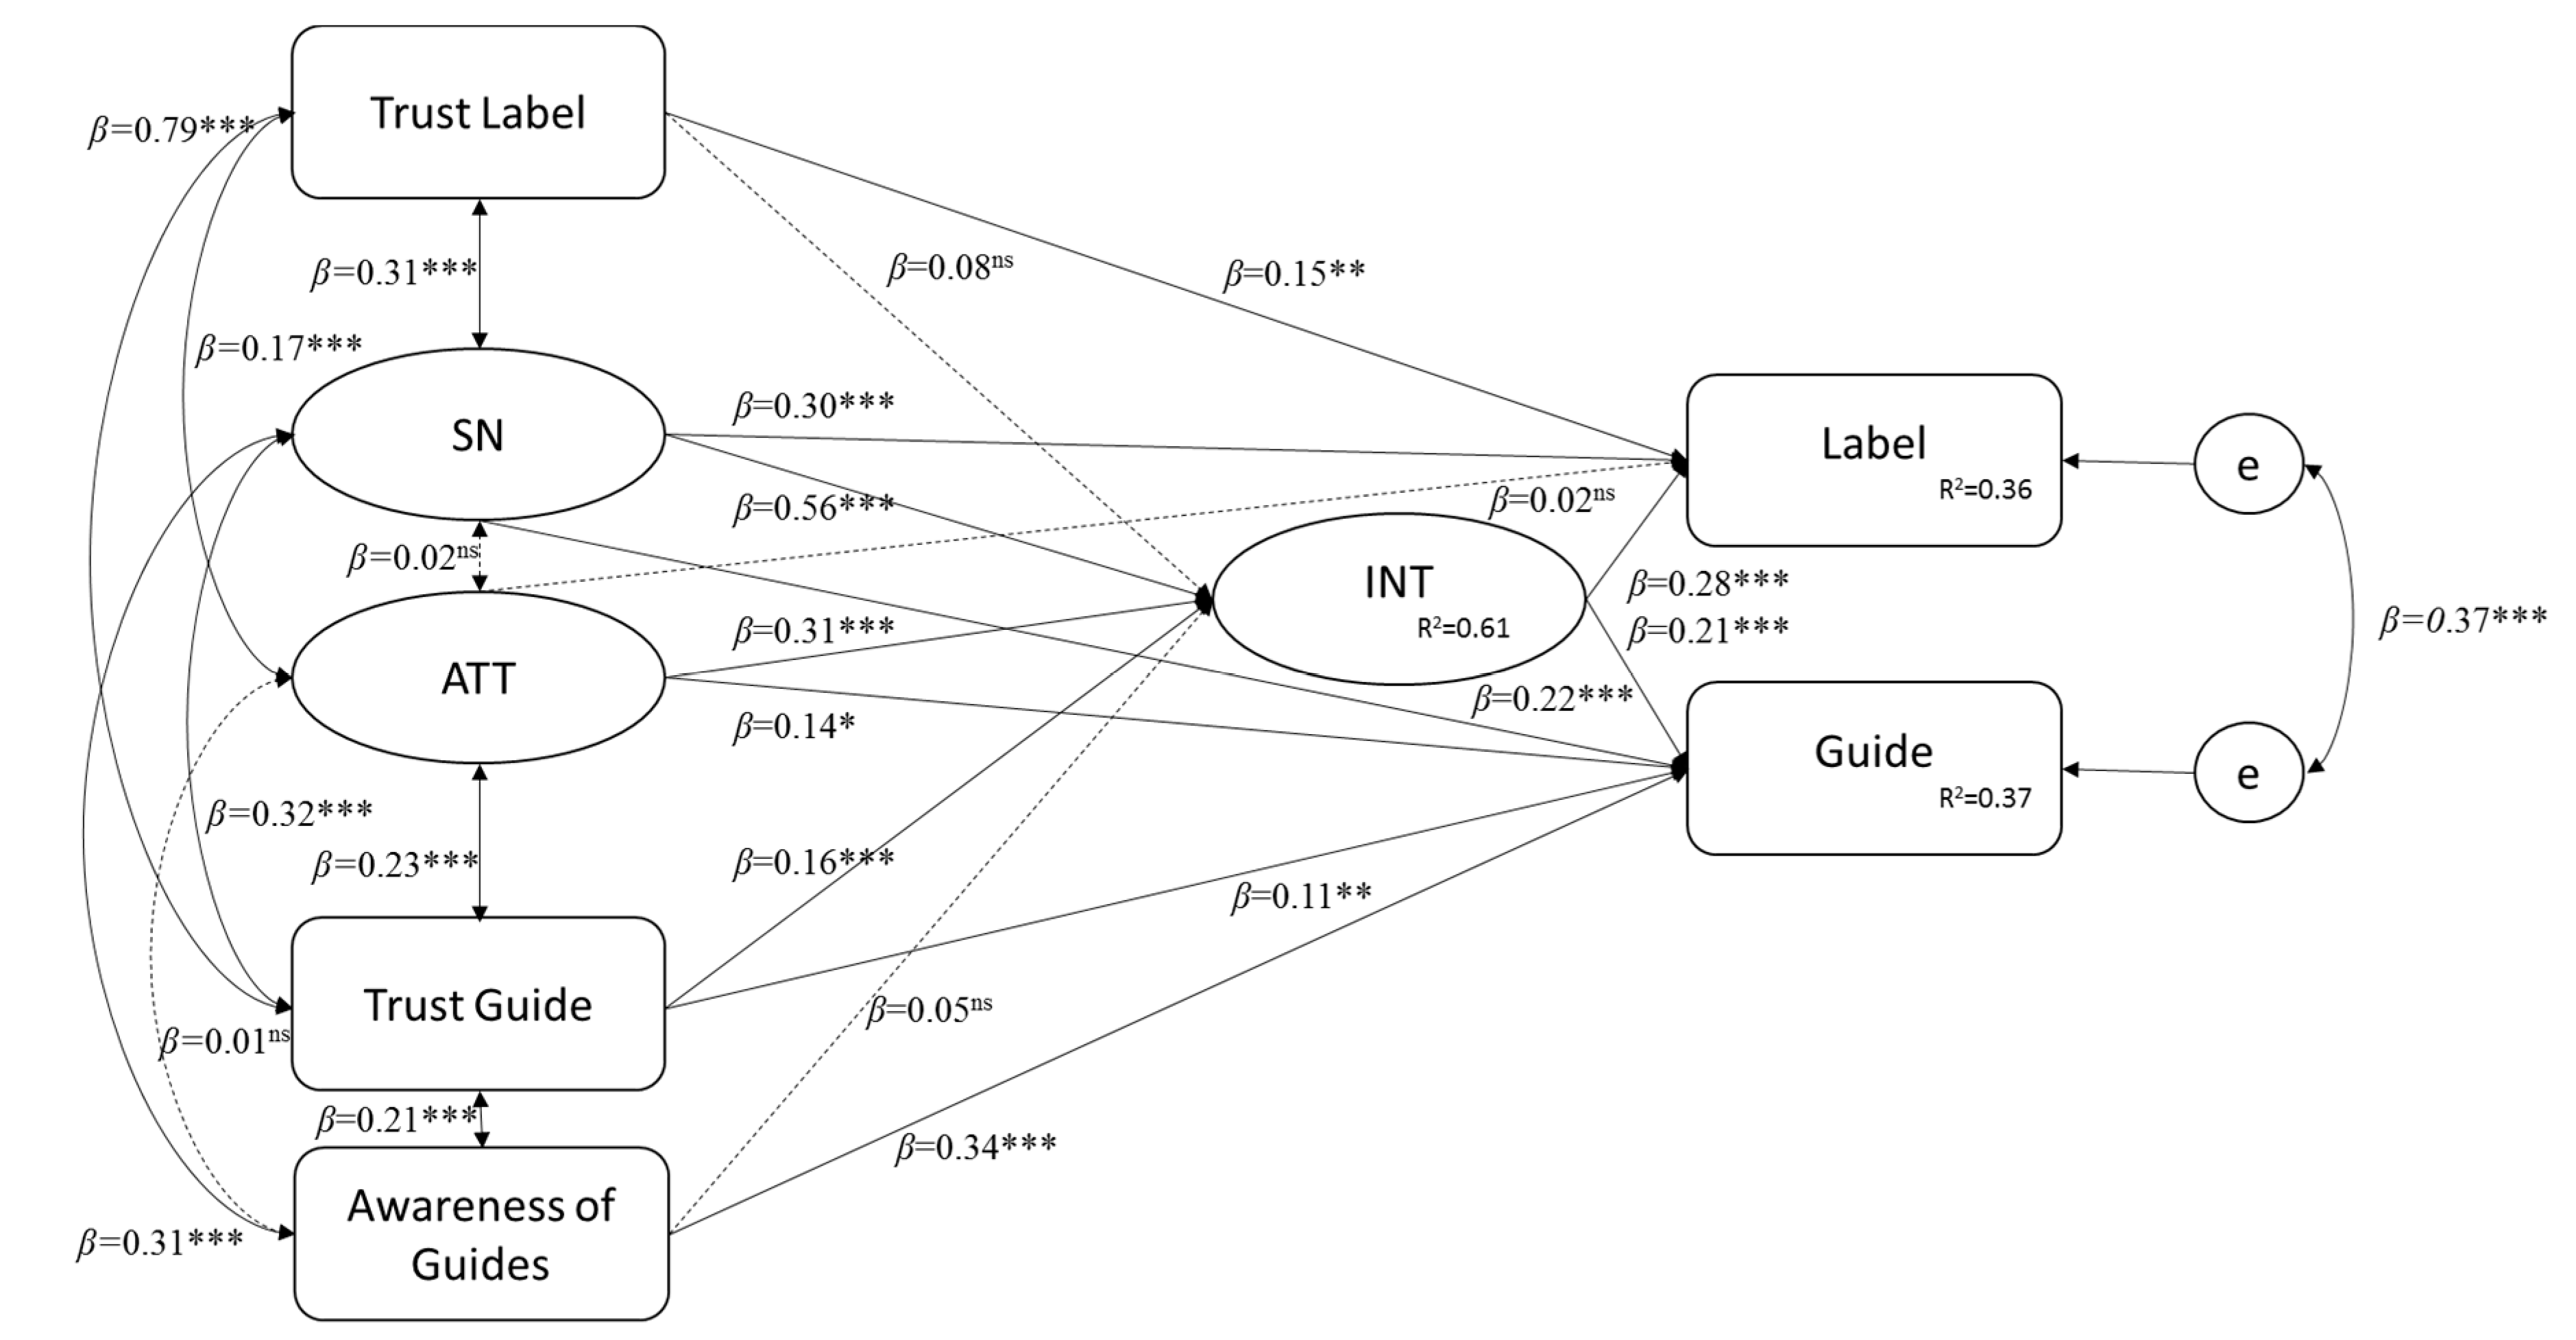
We tested the relationships between predictor variables and target behaviors again using Stata MP 14 [83] and correcting for non-normality with Santora-Bentler. The same model was specified as in Study 1 (Figure 2), adding awareness about seafood guides as an additional predictor of seafood guide use. In Figure 2, the standardised regressions weights of the structural model for both time points (time 2 in brackets) are reported, together with explained variance and model fit indices. The covariance-correlation matrix for our second study, time 1 is reported in Table 3.
The fit indices confirm satisfactory model fit (see Figure 2). Both, seafood label use and seafood guide use are significantly and positively related to intentions, social norms and trust. Seafood guide use is further predicted by knowledge about seafood guides. Attitudes are mediated via intentions in both cases. However, they also show a weak direct relationship to seafood guide use. Social norms and intentions are the strongest predictors of both behaviors.
To control that the meaning of constructs had not changed between the two measurement points, measurement invariance was tested and confirmed. The multi-group analysis revealed that the item weights in the measurement model could be fixed to be equal without a significant loss of fit, which shows that the model possesses metric measurement invariance across the two rounds. Further, the path coefficients of the structural model can also be fixed to be equal without loss of fit, which shows that the estimated relationships are stable over time.
3.4. Cross-Lagged Panel Analyses
To identify causal relationships between predictor and outcome, we performed ten cross-lagged panel analyses (CLPA). Figure 3, Figure 4, Figure 5, Figure 6 and Figure 7 display the models that were used to test the direction of the causality between social norms, trust, intentions and awareness about seafood guides as independent variables and label use and guide use as dependent variables.
The first CLPA was calculated between intentions and label use/guide use (Figure 3). Notice first the relatively high auto-regressive effects (of a variable on itself, measured with a time lag), which show (a) that the included psychological constructs are quite stable, but (b) behavior less so. The latter is partly due to behaviour being measured with just a single item. Regarding the cross-lagged effects, we found the same pattern of the two behaviours: a significant, positive cross-lagged effect of intentions in time 1 on label use/guide use in time 2, and no significant effect of label/guide use in time 1 on intentions in time 2. This pattern is consistent with the assumed causal relationship between intentions and label use/guide use.
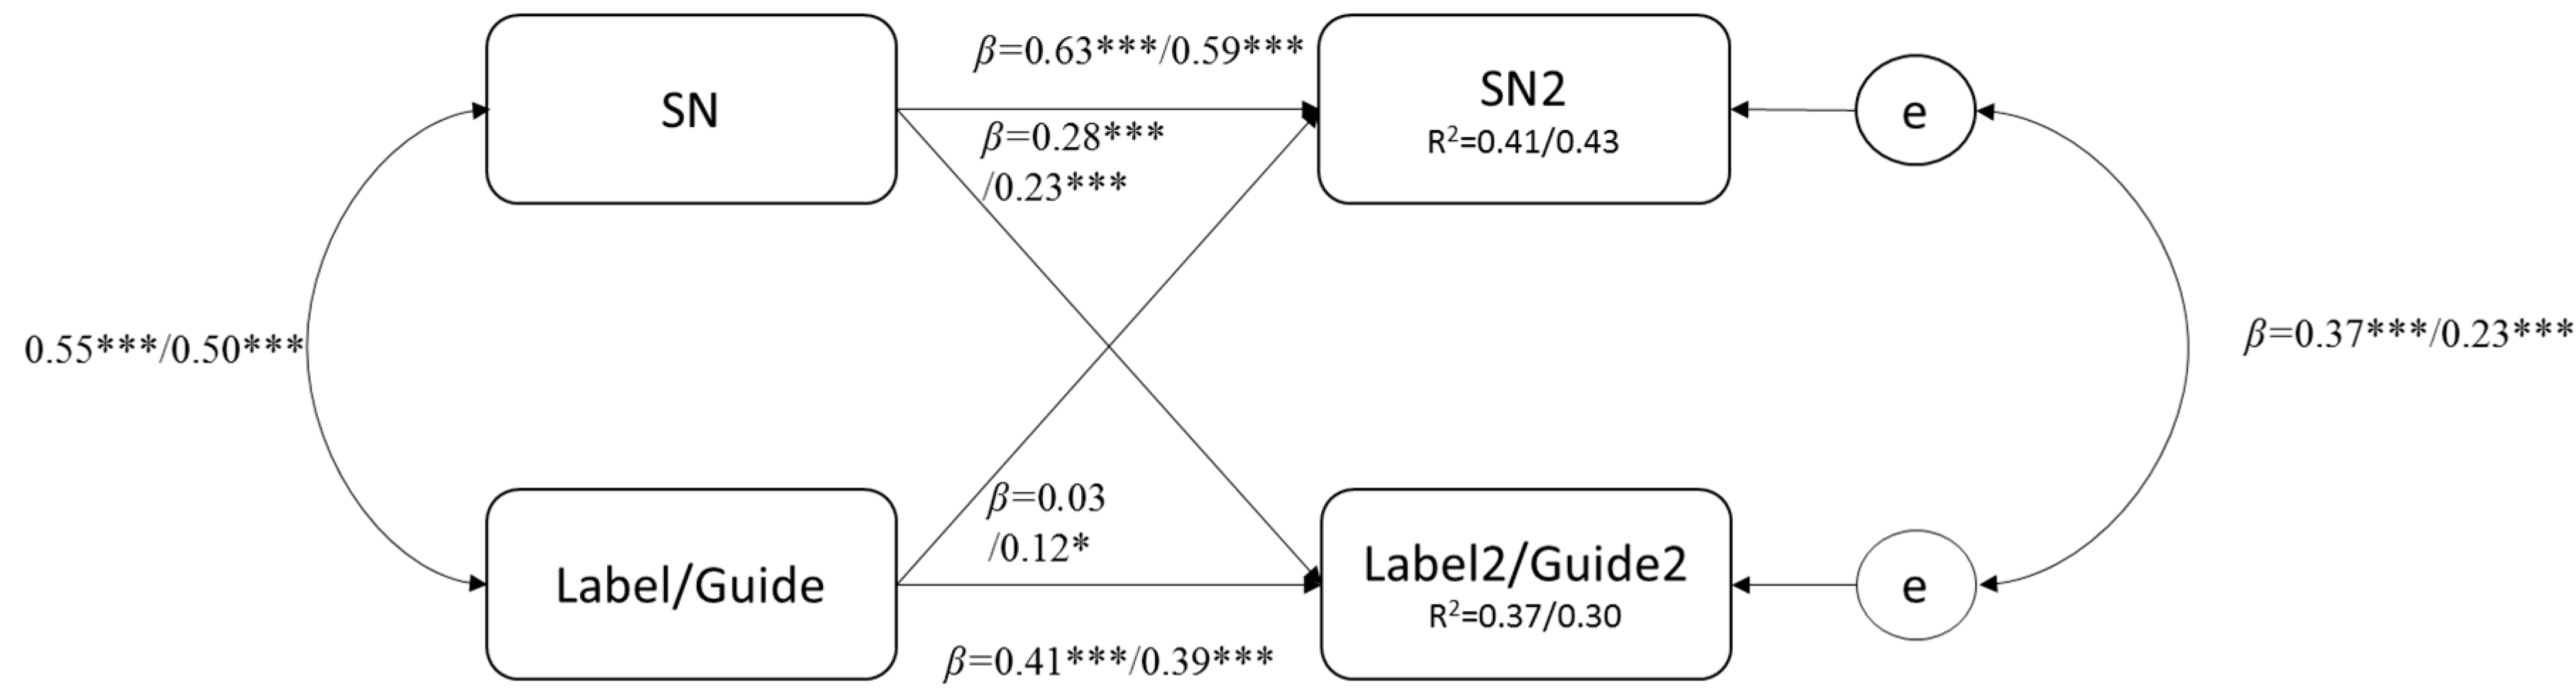
The CLPA of social norms and label use/guide use (Figure 4) revealed that social norms at time 1 are significantly and positively related to label use at time 2, while label use at time 1 is not significantly related to social norms at time 2. Again, this is consistent with the assumed causal relationship between social norms and label use. However, we found a bidirectional relationship between social norms and guide use, both cross-lagged effects being statistically significant.
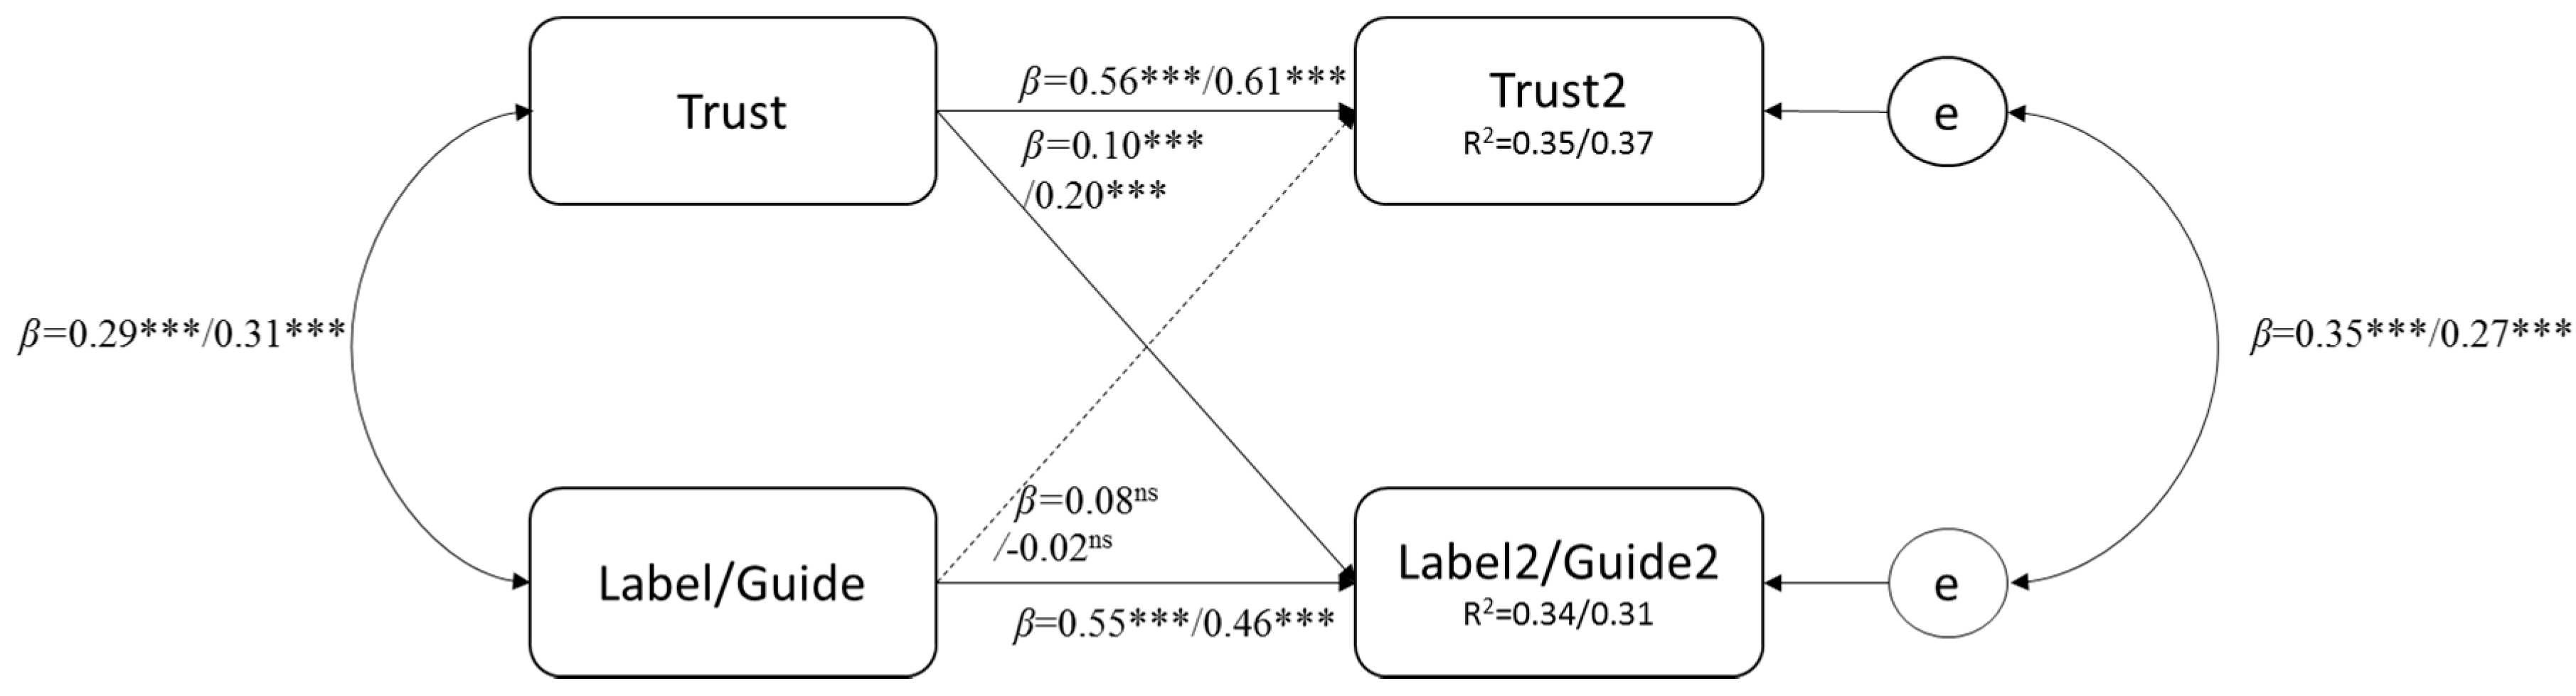
Figure 5 displays the CLPA between trust and label use, respectively guide use (value to the right of the backslash). Similar to the pattern found between intentions and label use/guide use, there is the significant path from trust at time 1 to label use/guide use at time 2. No significant path was found from label or guide use at time 1 to trust at time 1. This is consistent with the assumed causal relationship between trust in seafood labels and seafood label and guide use.
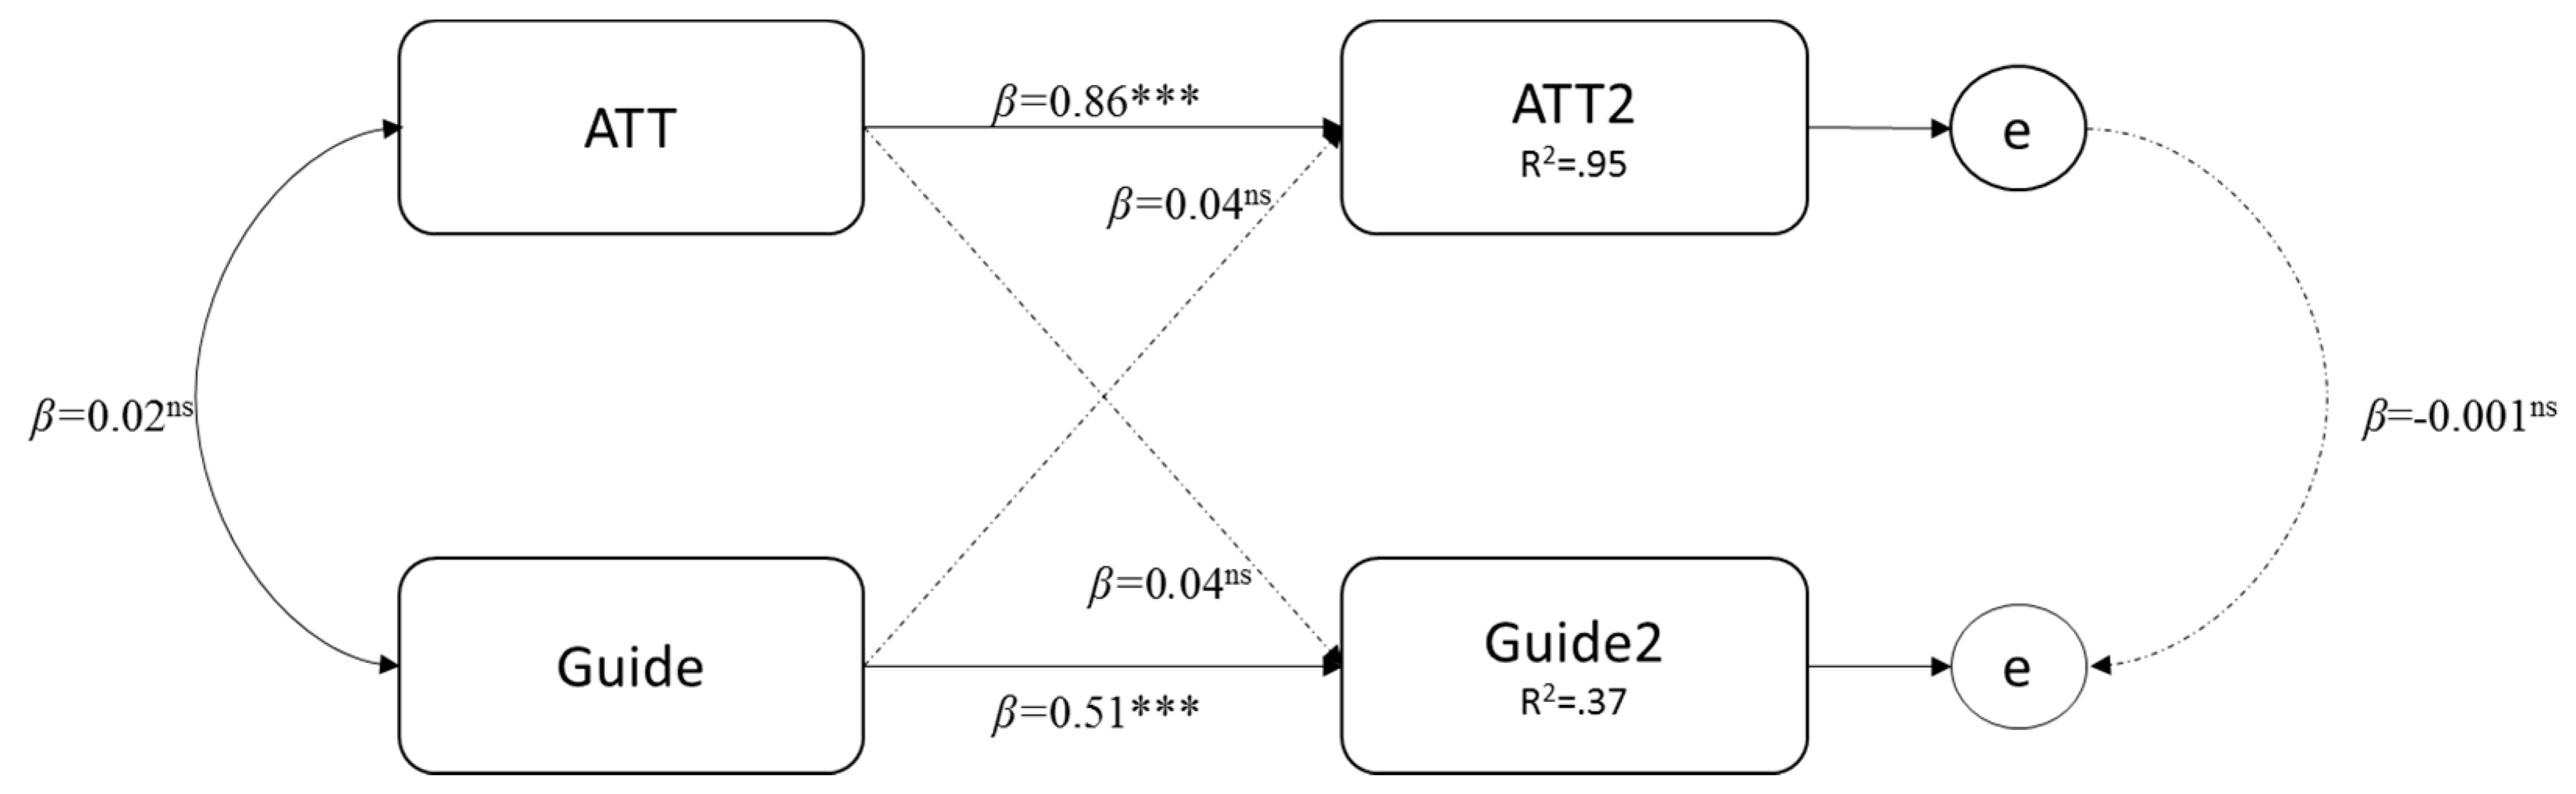
Figure 6 illustrates the CLPA between attitudes and guide use. A direct relationship between attitudes and label use was not assessed because none was found neither in Study 1 nor study 2. None of the cross-lagged paths reaches a significant level, which strongly supports a mediation of intentions between attitudes and behavior. Consequently, no causal relationship can be assumed between attitudes and guide use.
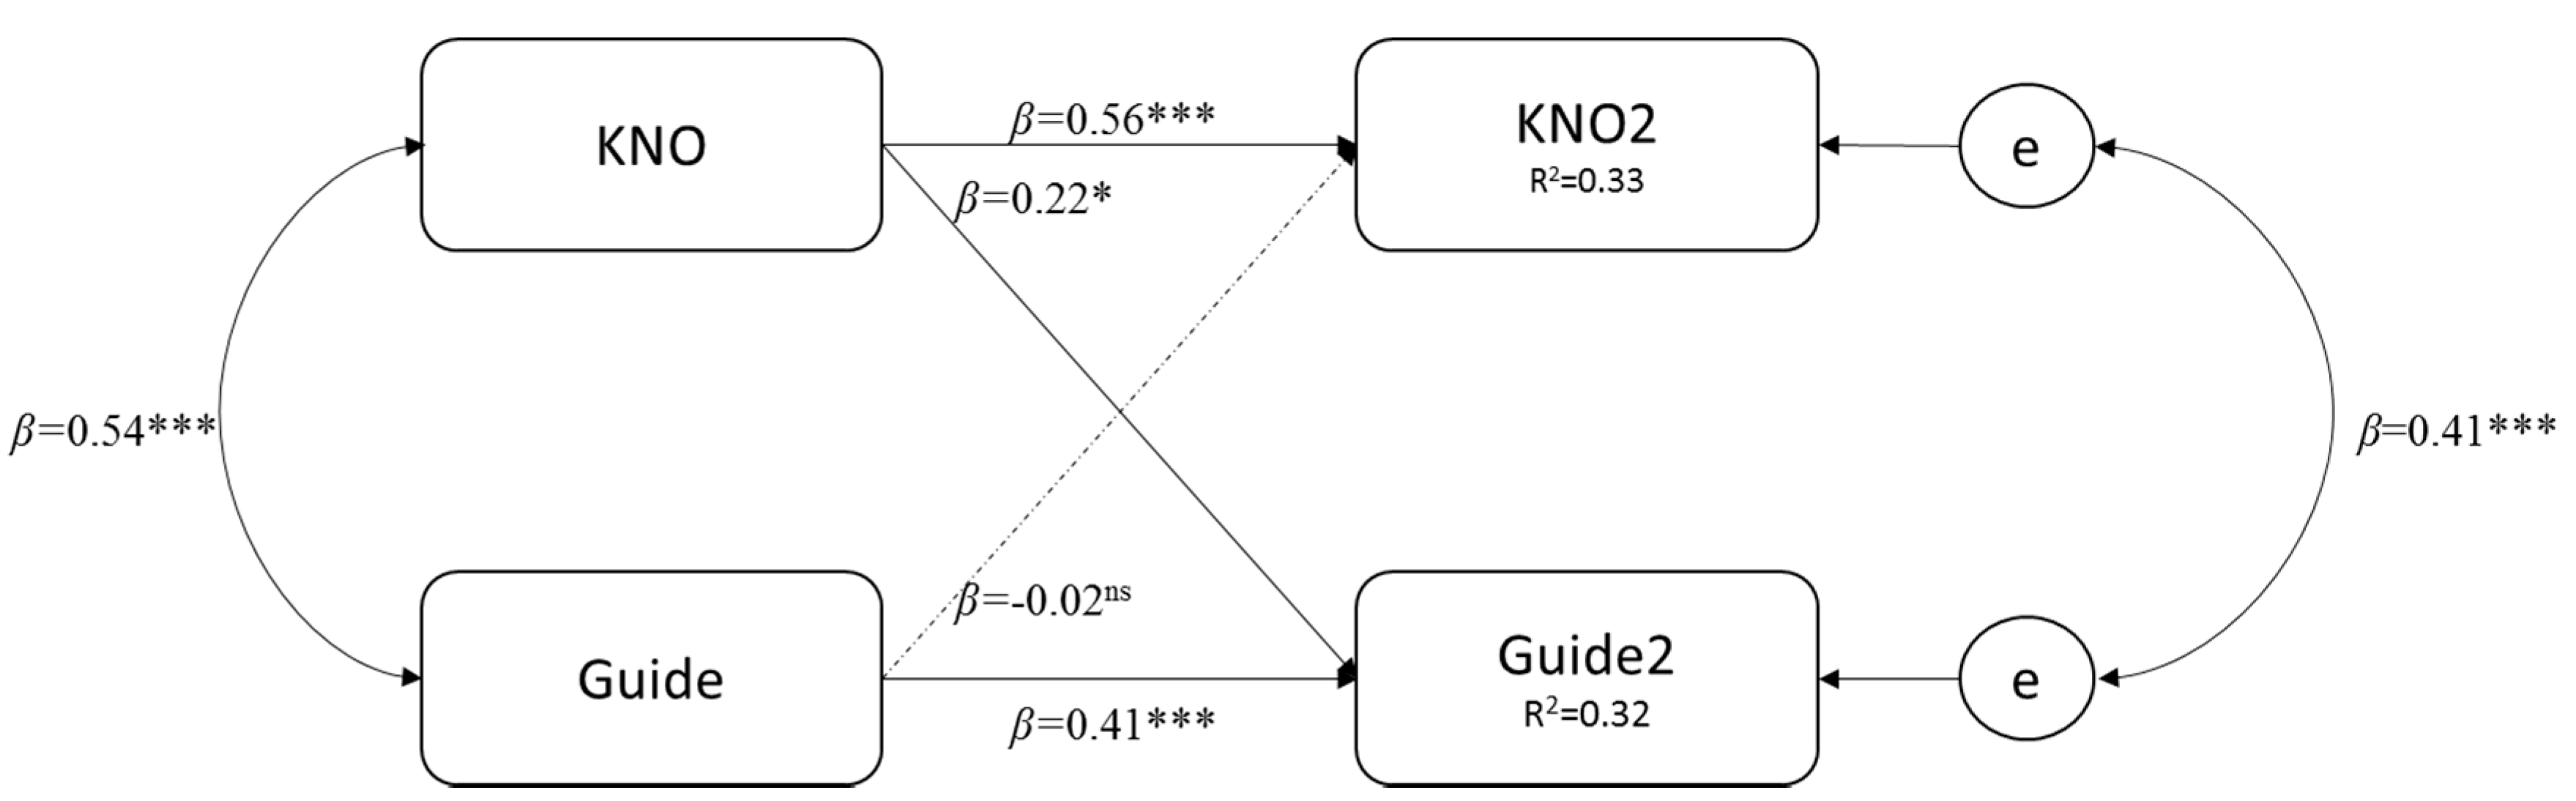
The last CLPA analysis was run between guide awareness and guide use behavior (Figure 7). Again, a significant path was found between awareness of seafood guides at time 1 and seafood guide use at time 2 combined with a non-significant path between guide use at time 1 and awareness of seafood guides at time 2. This is consistent with the assumed causal relationship between awareness of seafood guides and seafood guide use.
3.5. Discussion
Study 2 validated the model structure from Study 1, extended with one new variable. This gives us increased confidence that the identified variables are relevant for predicting the use of seafood labels and guides. A substantial part of the influence of psychological variables is mediated through intentions, but there are also strong direct effects on behaviour of perceived social norms as well as trust in and awareness of labels and guides.
The CLPA revealed further evidence to support the assumptions of causal relationships between predictors and the use of sustainable seafood labels and guides. Stronger intentions to consume seafood sustainably lead to more consistent use of seafood labels and guides. Perceiving seafood labels use as common and therefore socially approved behavior increases the use of seafood labels as well. Trust in labels and guides is also an important prerequisite for their use. The bidirectional relationship between social norms and seafood guide use might reflect that not only does perceiving seafood guide use as being common increase the use of seafood guides. In addition might consumers who start using a seafood guide get the impression of others doing the same as well, and thereby they create a new social norm. Attitudes are consistently mediated across intentions, which confirms them being a more general construct while intentions are more specific and therefore closer to behavior. Finally, being aware of seafood guides predicts using seafood guides as well.
To summarize, the use of seafood labels and guides is mostly predicted by the same antecedents. However, seafood label use is a better-established behavior and therefore more deliberately guided by people’s intentions to consume sustainable seafood, although there is an additional direct effect of perceived social norms and trust in the labeling scheme. For the more uncommon behavior of using seafood guides, the direct effect of these latter variables is stronger relative to intentions as only a small percentage of people are aware of using guides as an option for sustainable seafood consumption. Hence, to increase the use of seafood guides, it is necessary to inform people about their existence and credibility, supplemented by normative information about other people using them.
4. Limitations
The use of self-reported rather than observed behavior data is an important limitation of this study. Self-reported behavior is a fallible measure of actual behaviour and therefore needs to be interpreted with caution [85,86]. For example, it is possible that consumers might want to eat more seafood to follow common health claims and therefore over-report the amount of seafood eaten per week. Social desirability bias regarding pro-environmental behavior might also lead to an over-reporting of sustainable seafood consumption behavior [87,88,89]. Hence, experimental replications with actual behaviour as the dependent variable would be a valuable extension of the present research.
A second limitation is the generalizability of results, given that both studies focus exclusively on Norwegian consumers. Similar studies should be conducted in countries with different seafood consumption profile to elaborate further on country-specific and common predictors of sustainable seafood consumption.
5. Implications for Practice
The findings of this study suggest communication linking consumer intentions to buy sustainable seafood with available credible seafood labels and guides. From previous research, it is well documented that intentions are more likely to be performed the more specific they are [90,91,92,93]. For example, instead of the somewhat abstract intention to “consume seafood more responsibly”, a consumer might form the intention to “choose MSC-labeled products tomorrow when I purchase groceries”. Creating such “implementation intentions” can be especially useful when they are formed at moments when the consumer is susceptible to them and can directly implement them, for example in-store.
Trust is another key prerequisite for label and guide use. Also, Sirieix, Delanchy [94] found that familiarity and trust are the most important predictors for the uptake of food labels. Trust lies at the heart of customer-product relationships [95]. A lack of trust caused by scandals or non-transparent marketing may lead to the rejection of sustainability claims [96]. Part of the reason why seafood label use is so low in Norway might, therefore, be that the most important labels and guides, such as the MSC label, are strongly associated with “something foreign”, which reduces their trustworthiness in the eyes of Norwegian consumers [97]. Building consumer trust is a two-way process between customer and vendor. Its success depends on the consumers’ perceptions regarding the competence, benevolence and integrity of the providing party [98]. In the case of sustainable seafood labels, executing and promoting a clear and transparent certification process and rejecting any venal involvement is the essence of building consumer trust. To avoid undermining consumer trust, it is necessary to provide a fully transparent clarification of mislabeling issues. Also, companies that already enjoy a high level of trust in Norway might function as a door-opener for sustainability certifications.
The perception that similar others choose labeled products and it is socially appreciated to do so increases the consumption of labelled products, according to this study. However, it cannot be ruled out that reporting one’s guide use at time 1 created the impression of a more widespread social norm for guide use at time 2, i.e., a retest effect. In the current situation in Norway, communicating the extent of label use by Norwegian consumers would be counter-productive as label use is not very widespread yet [60]. Still, it is possible to use a social norm approach to promote sustainable seafood consumption, but it needs to be planned carefully, focusing, for example, on the growth rate of seafood label use instead of the total percentage of users [99]. This might attach an innovative touch to seafood labels. Another possibility is to communicate seafood label and guide use by respected community members, known as role models [100].
Campaigns focusing on seafood guide use should take into account that this behavior is currently impeded by consumers’ lack of knowledge about this option. Here, raising awareness around seafood guides, ways to receive them and how to use them should be central here. Providing consumers with mobile apps with seafood guides that are easy to use may also increase usage. At the same time, using seafood guides might create a normative framework around using them. As already indicated, organisations providing seafood guides have to work with full transparency regarding the classification process to be trustworthy. However, being a more detailed option that requires more effort and motivation means that seafood guides might only ever be used by the most interested and motivated consumers.
Consumers with more positive pro-environmental attitudes seem to be more susceptible to develop intentions to consume sustainable seafood. Therefore, people scoring high on pro-environmental attitudes are easier to target with interventions for seafood guide use and seafood label use and can help create a social norm around these two behaviors.
6. Conclusions
Seafood is a substantial component of the Norwegian diet with room for improvement when it comes to sustainability, as reflected in a low prevalence of sustainable seafood consumption practices (using seafood labels and guides) in both our samples. This study is based on the proposition that targeting consumer behavior is an important component in approaches to sustaining marine resources. By strengthening the demand for sustainable seafood, industries are encouraged to supply more sustainable seafood products [17]. The objective was to investigate the motivation behind two selected ways of acquiring sustainable seafood: the use of sustainable seafood labels and the use of sustainable seafood guides. The study confirms that both behaviors reflect intentions to consume seafood sustainably, but are also influenced by social norms (i.e., how common it is perceived to be) and (lack of) trust in labels and guides. Also, the use of the less well-known seafood guides is also impeded by lack of sufficient knowledge. Pro-environmental attitudes work as an indirect predictor mediated via intentions. Campaigns targeting to promote sustainable seafood consumption should take these findings into account and might have bigger success by targeting environmentally conscious consumers.
A remaining question is how the identified predictors can be employed in the design of actual interventions in the field. To establish a stronger culture around the sustainable handling of seafood in Norway would be an important step towards a responsible use of marine food resources in its own right. Also, Norway could potentially be a role model for the rest of the world. In the ideal case, using sustainable seafood labels or guides would be included in the process of seafood purchase as a matter of course.
Acknowledgments
This research was funded by a stipend granted to the first author from the Norwegian University of Science and Technology. This stipend covers publication fees. We thank the dedicated team from the consumer panel Cint.com for helping us with our data collection.
Author Contributions
The third author’s role was the overall supervision of the project. The second author provided extensive consultancy and support in setting up the data analysis and writing the paper. The first author conceived and designed the experiments, supervised and conducted the data collection, analysed the data and wrote the article.
Conflicts of Interest
The authors declare no conflict of interest.
References
- Costello, M.J.; Coll, M.; Danovaro, R.; Halpin, P.; Ojaveer, H.; Miloslavich, P. A census of marine biodiversity knowledge, resources, and future challenges. PLoS ONE 2010, 5, e12110. [Google Scholar] [CrossRef] [PubMed] [Green Version]
- Dulvy, N.K.; Fowler, S.L.; Musick, J.A.; Cavanagh, R.D.; Kyne, P.M.; Harrison, L.R.; Carlson, J.K.; Davidson, L.N.; Fordham, S.V.; Francis, M.P. Extinction risk and conservation of the world’s sharks and rays. eLife 2014, 3, e00590. [Google Scholar] [CrossRef] [PubMed]
- Woods, J.S.; Veltman, K.; Huijbregts, M.A.; Verones, F.; Hertwich, E.G. Towards a meaningful assessment of marine ecological impacts in life cycle assessment (LCA). Environ. Int. 2016, 89, 48–61. [Google Scholar] [CrossRef] [PubMed] [Green Version]
- Worm, B.; Barbier, E.B.; Beaumont, N.; Duffy, J.E.; Folke, C.; Halpern, B.S.; Jackson, J.B.C.; Lotze, H.K.; Micheli, F.; Palumbi, S.R.; et al. Impacts of biodiversity loss on ocean ecosystem services. Science 2006, 314, 787–790. [Google Scholar] [CrossRef] [PubMed]
- Worm, B.; Hilborn, R.; Baum, J.K.; Branch, T.A.; Collie, J.S.; Costello, C.; Fogarty, M.J.; Fulton, E.A.; Hutchings, J.A.; Jennings, S. Rebuilding global fisheries. Science 2009, 325, 578–585. [Google Scholar] [CrossRef] [PubMed]
- Myers, R.A.; Worm, B. Rapid worldwide depletion of predatory fish communities. Nature 2003, 423, 280–283. [Google Scholar] [CrossRef] [PubMed]
- Pitcher, T.J.; Cheung, W.W.L. Fisheries: Hope or despair? Mar. Pollut. Bull. 2013, 74, 506–516. [Google Scholar] [CrossRef] [PubMed]
- Food and Agriculture Organisation. The State of the Wolds Fisheries and Aquaculture. Opportunities and Challenges; Fisheries and Aquaculture Department, Ed.; Food and Agriculture Organisation of the United Nations: Rome, Italy, 2014; p. 223. [Google Scholar]
- HLPE. Sustainable Fisheries and Aquaculture for Food Security and Nutrition; High Level Panel of Experts on Food Security and Nutrition: Rome, Italy, 2014; p. 119. [Google Scholar]
- Belz, F.-M. Nachhaltigkeits-Marketing: Konzeptionelle Grundlagen und empirische Ergebnisse. In Nachhaltigkeits-Marketing in Theorie und Praxis; Deutscher Universitätsverlag: Wiesbaden, Germany, 2005; pp. 19–39. [Google Scholar]
- Hahn, T.; Scheermesser, M. Approaches to corporate sustainability among German companies. Corp. Soc. Responsib. Environ. Manag. 2006, 13, 150–165. [Google Scholar] [CrossRef]
- Buil-Carrasco, I.; Fraj-Andrés, E.; Matute-Vallejo, J. Corporate environmentalism strategy in the Spanish consumer product sector: A typology of firms. Bus. Strateg. Environ. 2008, 17, 350–368. [Google Scholar] [CrossRef]
- Belz, F.-M.; Schmidt-Riediger, B. Marketing strategies in the age of sustainable development: Evidence from the food industry. Bus. Strateg. Environ. 2010, 19, 401–416. [Google Scholar] [CrossRef]
- Hallstein, E.; Villas-Boas, S.B. Can household consumers save the wild fish? Lessons from a sustainable seafood advisory. J. Environ. Econ. Manag. 2013, 66, 52–71. [Google Scholar] [CrossRef]
- Vázquez-Rowe, I.; Villanueva-Rey, P.; Moreira, M.T.; Feijoo, G. The role of consumer purchase and post-purchase decision-making in sustainable seafood consumption. A Spanish case study using carbon footprinting. Food Policy 2013, 41, 94–102. [Google Scholar] [CrossRef]
- Dietz, T.; Gardner, G.T.; Gilligan, J.; Stern, P.C.; Vandenbergh, M.P. Household actions can provide a behavioral wedge to rapidly reduce US carbon emissions. Proc. Natl. Acad. Sci. USA 2009, 106, 18452–18456. [Google Scholar] [CrossRef] [PubMed]
- Marine Stewardship Council. Marine Stewardship Council: Global Impacts Report 2017; MSC: London, UK, 2017; p. 44. [Google Scholar]
- Packard, J. Turning the Tide. In The State of Seafood; Monterey Bay Aquarium, Ed.; Monterey Bay Aquarium: Monterey, CA, USA, 2011. [Google Scholar]
- Marine Stewardship Council. The MSC at 20. Wild. Certified; Sustainable, Annual Report 2016–2017; MSC: London, UK, 2017. [Google Scholar]
- Marine Stewardship Council. Sustainable Seafood: The First 20 Years; MSC: London, UK, 2017. [Google Scholar]
- Food and Agriculture Organisation. The state of the world fisheries and aquaculture 2016. In Contributing to Food Security and Nutrition for All; FAO: Rome, Italy, 2016; p. 200. [Google Scholar]
- Richter, I.; Klöckner, C.A. The psychology of sustainable seafood consumption: A comprehensive approach. Foods 2017, 6, 86. [Google Scholar] [CrossRef] [PubMed]
- Rook, D.W.; Fisher, R.J. Normative influences on impulsive buying behavior. J. Consum. Res. 1995, 22, 305–313. [Google Scholar] [CrossRef]
- Amos, C.; Holmes, G.R.; Keneson, W.C. A meta-analysis of consumer impulse buying. J. Retail. Consum. Serv. 2014, 21, 86–97. [Google Scholar] [CrossRef]
- Earle, S. Protect the Ocean, Protect Ourselves, in Coastal Change, Ocean Conservation and Resilient Communities; Springer: Brooklyn, NY, USA, 2016; pp. 155–161. [Google Scholar]
- FAOSTAT. Compare Data. 2016. Available online: http://faostat3.fao.org/compare/E (accessed on 11 January 2016).
- Nijdam, D.; Rood, T.; Westhoek, H. The price of protein: Review of land use and carbon footprints from life cycle assessments of animal food products and their substitutes. Food Policy 2012, 37, 760–770. [Google Scholar] [CrossRef]
- Stucki, M.; Jungbluth, N.; Buchspies, B. Fish or Meat? Is this a relevant question from an environmental point of view? In Proceedings of the 8th International Conference on LCA in the Agri-Food Sector, ESU-Services, Fair Consuting in Sustainability, Sain-Malo, France, 1–4 October 2012. [Google Scholar]
- Kelleher, K.; Weber, M. Towards Sustainable Management of World Fisheries and Aquaculture; Global Issues for Global Citizens’, World Bank Report, 29090-GLB. 2006. Available online: http://siteresources.worldbank.org/EXTABOUTUS/Resources/ch15.pdf (accessed on 12 December 2017).
- Thøgersen, J.; Haugaard; Olesen, A. Consumer responses to ecolabels. Eur. J. Market. 2010, 44, 1787–1810. [Google Scholar]
- Jacquet, J.; Hocevar, J.; Lai, S.; Majluf, P.; Pelletier, N.; Pitcher, T.; Sala, E.; Sumaila, R.; Pauly, D. Conserving wild fish in a sea of market-based efforts. Oryx 2010, 44, 45–56. [Google Scholar] [CrossRef]
- Roheim, C.A.; Sutinen, J.G. Trade and Marketplace Measures to Promote Sustainable Fishing Practices; International Centre for Trade and Sustainable Development, University of Rhode Island: Kingston, CA, USA, 2006. [Google Scholar]
- Feucht, Y.; Zander, K. What do German consumers think about labelling, seafood guides and other information about (sustainable) seafood? In Proceedings of the XXIII Conference of the European Association of Fisheries Economists, Dublin, Ireland, 25–27 April 2017. [Google Scholar]
- Thøgersen, J. Country differences in sustainable consumption: The case of organic food. J. Macromarket. 2010, 30, 171–185. [Google Scholar] [CrossRef]
- Aarset, B.; Beckmann, S.; Bigne, E.; Beveridge, M.; Bjorndal, T.; Bunting, J.; McDonagh, P.; Mariojouls, C.; Muir, J.; Prothero, A. The European consumers’ understanding and perceptions of the “organic” food regime: The case of aquaculture. Br. Food J. 2004, 106, 93–105. [Google Scholar] [CrossRef]
- Storstad, O.; Bjørkhaug, H. Foundations of production and consumption of organic food in Norway: Common attitudes among farmers and consumers? Agric. Hum. Values 2003, 20, 151–163. [Google Scholar] [CrossRef]
- Berg, L.; Kjaernes, U.; Ganskau, E.; Minina, V.; Voltchkova, L.; Halkier, B.; Holm, L. Trust in food safety in Russia, Denmark and Norway. Eur. Soc. 2005, 7, 103–129. [Google Scholar] [CrossRef]
- Lavik, R.; Borgeraas, E. Forbrukstrender 2015; SIFO, Ed.; Statens Institutt for Forbruksforskning; Høgskolen i Oslo og Akershus: Oslo, Norway, 2015. [Google Scholar]
- Nygård, B.; Storstad, O. De-globalization of Food Markets? Consumer Perceptions of Safe Food: The Case of Norway. Sociol. Rural. 1998, 38, 35–53. [Google Scholar] [CrossRef]
- Ölander, F.; Thøgersen, J. Understanding of consumer behaviour as a prerequisite for environmental protection. J. Consum. Policy 1995, 18, 345–385. [Google Scholar] [CrossRef]
- Fishbein, M.; Ajzen, I. Predicting and Changing Behavior: The Reasoned Action Approach; Taylor & Francis: New York, NY, USA, 2011. [Google Scholar]
- Schwepker, C.H., Jr.; Cornwell, T.B. An examination of ecologically concerned consumers and their intention to purchase ecologically packaged products. J. Public Policy Mark. 1991, 10, 77–101. [Google Scholar]
- Arvola, A.; Vassallo, M.; Dean, M.; Lampila, P.; Saba, A.; Lähteenmäki, L.; Shepherd, R. Predicting intentions to purchase organic food: The role of affective and moral attitudes in the Theory of Planned Behaviour. Appetite 2008, 50, 443–454. [Google Scholar] [CrossRef] [PubMed]
- Samant, S.S.; Crandall, P.G.; Seo, H.-S. The effect of varying educational intervention on consumers’ understanding and attitude toward sustainability and process-related labels found on chicken meat products. Food Qual. Preference 2016, 48, 146–155. [Google Scholar] [CrossRef]
- Olsen, S.O. Antecedents of seafood consumption behavior. J. Aquat. Food Prod. Technol. 2004, 13, 79–91. [Google Scholar] [CrossRef]
- Olsen, S.O.; Heide, M.; Dopico, D.C.; Toften, K. Explaining intention to consume a new fish product: A cross-generational and cross-cultural comparison. Food Qual. Preference 2008, 19, 618–627. [Google Scholar] [CrossRef]
- Verbeke, W.; Vackier, I. Individual determinants of fish consumption: Application of the theory of planned behaviour. Appetite 2005, 44, 67–82. [Google Scholar] [CrossRef] [PubMed]
- Fishbein, M.; Ajzen, I. Belief, Attitude, Intention, and Behavior: An Introduction to Theory and Research; Addison-Wesley: Reading, MA, USA, 1975; pp. 842–844. [Google Scholar]
- Kaiser, F.G.; Schultz, P.W. The attitude–behavior relationship: A test of three models of the moderating role of behavioral difficulty. J. Appl. Soc. Psychol. 2009, 39, 186–207. [Google Scholar] [CrossRef]
- Kaiser, F.G. A general measure of ecological behavior. J. Appl. Soc. Psychol. 1998, 28, 395–422. [Google Scholar] [CrossRef]
- Dunlap, R.E.; Van Liere, K.D. The new environmental paradigm. J. Environ. Educ. 1978, 9, 10–19. [Google Scholar] [CrossRef]
- Verain, M.C.; Bartels, J.; Dagevos, H.; Sijtsema, S.J.; Onwezen, M.C.; Antonides, G. Segments of sustainable food consumers: A literature review. Int. J. Consum. Stud. 2012, 36, 123–132. [Google Scholar] [CrossRef]
- Kaiser, F.G.; Keller, C. Disclosing situational constraints to ecological behavior: A confirmatory application of the mixed Rasch model. Eur. J. Psychol. Assess. 2001, 17, 212. [Google Scholar] [CrossRef]
- Kaiser, F.G.; Wölfing, S.; Fuhrer, U. Environmental attitude and ecological behavior. J. Environ. Psychol. 1999, 19, 1–19. [Google Scholar] [CrossRef]
- Cialdini, R.B. Crafting normative messages to protect the environment. Curr. Dir. Psychol. Sci. 2003, 12, 105–109. [Google Scholar] [CrossRef]
- Thøgersen, J. Social norms and cooperation in real-life social dilemmas. J. Econ. Psychol. 2008, 29, 458–472. [Google Scholar] [CrossRef]
- Burger, J.M.; Bell, H.; Harvey, K.; Johnson, J.; Stewart, C.; Dorian, K.; Swedroe, M. Nutritious or delicious? The effect of descriptive norm information on food choice. J. Soc. Clin. Psychol. 2010, 29, 228–242. [Google Scholar] [CrossRef]
- Mollen, S.; Rimal, R.N.; Ruiter, R.A.; Kok, G. Healthy and unhealthy social norms and food selection. Findings from a field-experiment. Appetite 2013, 65, 83–89. [Google Scholar] [CrossRef] [PubMed]
- Robinson, E.; Thomas, J.; Aveyard, P.; Higgs, S. What everyone else is eating: A systematic review and meta-analysis of the effect of informational eating norms on eating behavior. J. Acad. Nutr. Diet. 2014, 114, 414–429. [Google Scholar] [CrossRef] [PubMed]
- Schultz, P.W.; Nolan, J.M.; Cialdini, R.B.; Goldstein, N.J.; Griskevicius, V. The constructive, destructive, and reconstructive power of social norms. Psychol. Sci. 2007, 18, 429–434. [Google Scholar] [CrossRef] [PubMed]
- Schjøll, A. Country-of-origin preferences for organic food. Org. Agric. 2016, 1–13. [Google Scholar] [CrossRef]
- Janssen, M.; Hamm, U. Product labelling in the market for organic food: Consumer preferences and willingness-to-pay for different organic certification logos. Food Qual. Preference 2012, 25, 9–22. [Google Scholar] [CrossRef]
- Noblet, C.L.; Teisl, M.F. Eco-Labelling as Sustainable Consumption Policy. In Handbook of Research on Sustainable Consumption; Edward Elgar Publishing: Cheltenham, UK, 2015; p. 300. [Google Scholar]
- Nuttavuthisit, K.; Thøgersen, J. The importance of consumer trust for the emergence of a market for green products: The case of organic food. J. Bus. Ethics 2015, 140, 1–15. [Google Scholar] [CrossRef]
- Thøgersen, J. Promoting “green” consumer behavior with eco-labels. In New Tools for Environemntal Protection: Education, Information, and Voluntary Measures; Dietz, T., Stern, P.C., Eds.; National Academy Press: Washington, DC, USA, 2002; pp. 83–104. [Google Scholar]
- Vermeir, I.; Verbeke, W. Sustainable food consumption: Exploring the consumer “Attitude-Behavioral Intention” Gap. J. Agric.Environ. Ethics 2006, 19, 169–194. [Google Scholar] [CrossRef]
- Vittersø, G.; Tangeland, T. The role of consumers in transitions towards sustainable food consumption. The case of organic food in Norway. J. Clean. Prod. 2015, 92, 91–99. [Google Scholar] [CrossRef]
- Bech-Larsen, T.; Grunert, K.G. Konsumentscheidungen bei Vertrauenseigenschaften. Mark. ZFP 2001, 23, 188–198. [Google Scholar] [CrossRef]
- D’Souza, C.; Taghian, M.; Lamb, P.; Peretiatko, R. Green decisions: Demographics and consumer understanding of environmental labels. Int. J. Consum. Stud. 2007, 31, 371–376. [Google Scholar] [CrossRef]
- Vanhonacker, F.; Van Loo, E.J.; Gellynck, X.; Verbeke, W. Flemish consumer attitudes towards more sustainable food choices. Appetite 2013, 62, 7–16. [Google Scholar] [CrossRef] [PubMed]
- Hughner, R.S.; McDonagh, P.; Prothero, A.; Shultz, C.J.; Stanton, J. Who are organic food consumers? A compilation and review of why people purchase organic food. J. Consum. Behav. 2007, 6, 94–110. [Google Scholar] [CrossRef]
- Diamantopoulos, A.; Schlegelmilch, B.B.; Sinkovics, R.R.; Bohlen, G.M. Can socio-demographics still play a role in profiling green consumers? A review of the evidence and an empirical investigation. J. Busin. Res. 2003, 56, 465–480. [Google Scholar] [CrossRef]
- D’Souza, C.; Taghian, M.; Lamb, P. An empirical study on the influence of environmental labels on consumers. Corp. Commun. Int. J. 2006, 11, 162–173. [Google Scholar] [CrossRef]
- Pérez-Ramírez, M.; Almendarez-Hernández, M.A.; Avilés-Polanco, G.; Beltrán-Morales, L.F. Consumer Acceptance of Eco-Labeled Fish: A Mexican Case Study. Sustainability 2015, 7, 4625–4642. [Google Scholar] [CrossRef]
- Mader, B. Is Going Green Too Expensive for Most People. Available online: http://www.contractormag.com/columns/editorial/going_green_expensive (accessed on 9 January 2017).
- Olesen, I.; Alfnes, F.; Røra, M.B.; Kolstad, K. Eliciting consumers’ willingness to pay for organic and welfare-labelled salmon in a non-hypothetical choice experiment. Livest. Sci. 2010, 127, 218–226. [Google Scholar] [CrossRef]
- Mauracher, C.; Tempesta, T.; Vecchiato, D. Consumer preferences regarding the introduction of new organic products. The case of the Mediterranean sea bass (Dicentrarchus labrax) in Italy. Appetite 2013, 63, 84–91. [Google Scholar] [CrossRef] [PubMed]
- Statistisk Sentralbyrå Norge. Nøkkeltall for Befolkning. Available online: https://www.ssb.no/befolkning/nokkeltall/befolkning (accessed on 30 June 2017).
- Statistisk sentralbyrå Norge. Befolkningens Utdanningsnivå. Available online: https://www.ssb.no/utniv (accessed on 15 July 2017).
- Ajzen, I. The theory of planned behavior. Organ. Behav. Hum. Deci. Process. 1991, 50, 179–211. [Google Scholar] [CrossRef]
- Klöckner, C.A.; Blöbaum, A. A comprehensive action determination model: Toward a broader understanding of ecological behaviour using the example of travel mode choice. J. Environ. Psychol. 2010, 30, 574–586. [Google Scholar] [CrossRef] [Green Version]
- Dunlap, R.E.; Van Liere, K.; Mertig, A.; Jones, R.E. Measuring endorsement of the New Ecological Paradigm: A revised NEP Scale. In The Earthscan Reader in Environmental Values; Earthscan: London, UK, 2005. [Google Scholar]
- StataCorp. Stata Statistical Software: Release 14; StataCorp LP, Ed.; StataCorp: College Station, TX, USA, 2015. [Google Scholar]
- Windle, C. Test-Retest Effect on personality questionnaires. Educ. Psychol. Meas. 1954, 14, 617–633. [Google Scholar] [CrossRef]
- Adams, A.S.; Soumerai, S.B.; Lomas, J.; Ross-Degnan, D. Evidence of self-report bias in assessing adherence to guidelines. Int. J. Qual. Health Care 1999, 11, 187–192. [Google Scholar] [CrossRef] [PubMed]
- Del Boca, F.K.; Darkes, J. The validity of self-reports of alcohol consumption: State of the science and challenges for research. Addiction 2003, 98, 1–12. [Google Scholar] [CrossRef] [PubMed]
- Kormos, C.; Gifford, R. The validity of self-report measures of proenvironmental behavior: A meta-analytic review. J. Environ. Psychol. 2014, 40, 359–371. [Google Scholar] [CrossRef]
- Milfont, T.L. The effects of social desirability on self-reported environmental attitudes and ecological behaviour. Environmentalist 2009, 29, 263–269. [Google Scholar] [CrossRef]
- Sörqvist, P.; Haga, A.; Langeborg, L.; Holmgren, M.; Wallinder, M.; Nöstl, A.; Seager, P.B.; Marsh, J.E. The green halo: Mechanisms and limits of the eco-label effect. Food Qual. Preference 2015, 43, 1–9. [Google Scholar] [CrossRef]
- Adriaanse, M.A.; Gollwitzer, P.M.; De Ridder, D.T.; De Wit, J.B.; Kroese, F.M. Breaking habits with implementation intentions: A test of underlying processes. Personal. Soc. Psychol. Bull. 2011, 37, 502–513. [Google Scholar] [CrossRef] [PubMed]
- Gollwitzer, P.M. Implementation intentions: Strong effects of simple plans. Am. Psychol. 1999, 54, 493. [Google Scholar] [CrossRef]
- Gollwitzer, P.M.; Brandstätter, V. Implementation intentions and effective goal pursuit. J. Personal. Soc. Psychol. 1997, 73, 186. [Google Scholar] [CrossRef]
- Verplanken, B.; Faes, S. Good intentions, bad habits, and effects of forming implementation intentions on healthy eating. Eur. J. Soc. Psychol. 1999, 29, 591–604. [Google Scholar] [CrossRef]
- Sirieix, L.; Delanchy, M.; Remaud, H.; Zepeda, L.; Gurviez, P. Consumers’ perceptions of individual and combined sustainable food labels: A UK pilot investigation. Int. J. Consum. Stud. 2013, 37, 143–151. [Google Scholar] [CrossRef]
- Urban, G.L.; Sultan, F.; Qualls, W.J. Placing trust at the center of your Internet strategy. MIT Sloan Manag. Rev. 2000, 42, 39. [Google Scholar]
- Jacquet, J.; Pauly, D. Trade secrets: Renaming and mislabeling of seafood. Mar. Policy 2008, 32, 309–318. [Google Scholar] [CrossRef]
- Heidenstrøm, N.; Jacobsen, E.; Borgen, S.O. Seleksjon og Ignorering: Forbrukerstrategier for å Manøvrere i Merkemangfoldet; Contract Research Report; SIFO, Ed.; Statens Institutt for Forbruksforskning: Oslo, Norway, 2011. [Google Scholar]
- Rousseau, D.M.; Sitkin, S.B.; Burt, R.S.; Camerer, C. Not so different after all: A cross-discipline view of trust. Acad. Manag. Rev. 1998, 23, 393–404. [Google Scholar] [CrossRef]
- Cialdini, R.B.; Demaine, L.J.; Sagarin, B.J.; Barrett, D.W.; Rhoads, K.; Winter, P.L. Managing social norms for persuasive impact. Soc. Influ. 2006, 1, 3–15. [Google Scholar] [CrossRef]
- Valente, T.W.; Pumpuang, P. Identifying opinion leaders to promote behavior change. Health Educ. Behav. 2007, 34, 881–896. [Google Scholar] [CrossRef] [PubMed]
Figure 1.
Structural model of sustainable seafood consumption including estimated standardized regression weights and correlations. For simplicity, the measurement model is not shown, but it can be acquired from the first author. Model fit indices using the Santora-Bentler correction for non-normal distributions: Chisquare = 136.949, df = 101, p = 0.01. CFI = 0.98, TLI = 0.97, RMSEA = 0.47, SRMR = 0.04. Note: ns = p > 0.05, * = p < 0.05, ** = p < 0.01, *** = p < 0.001.
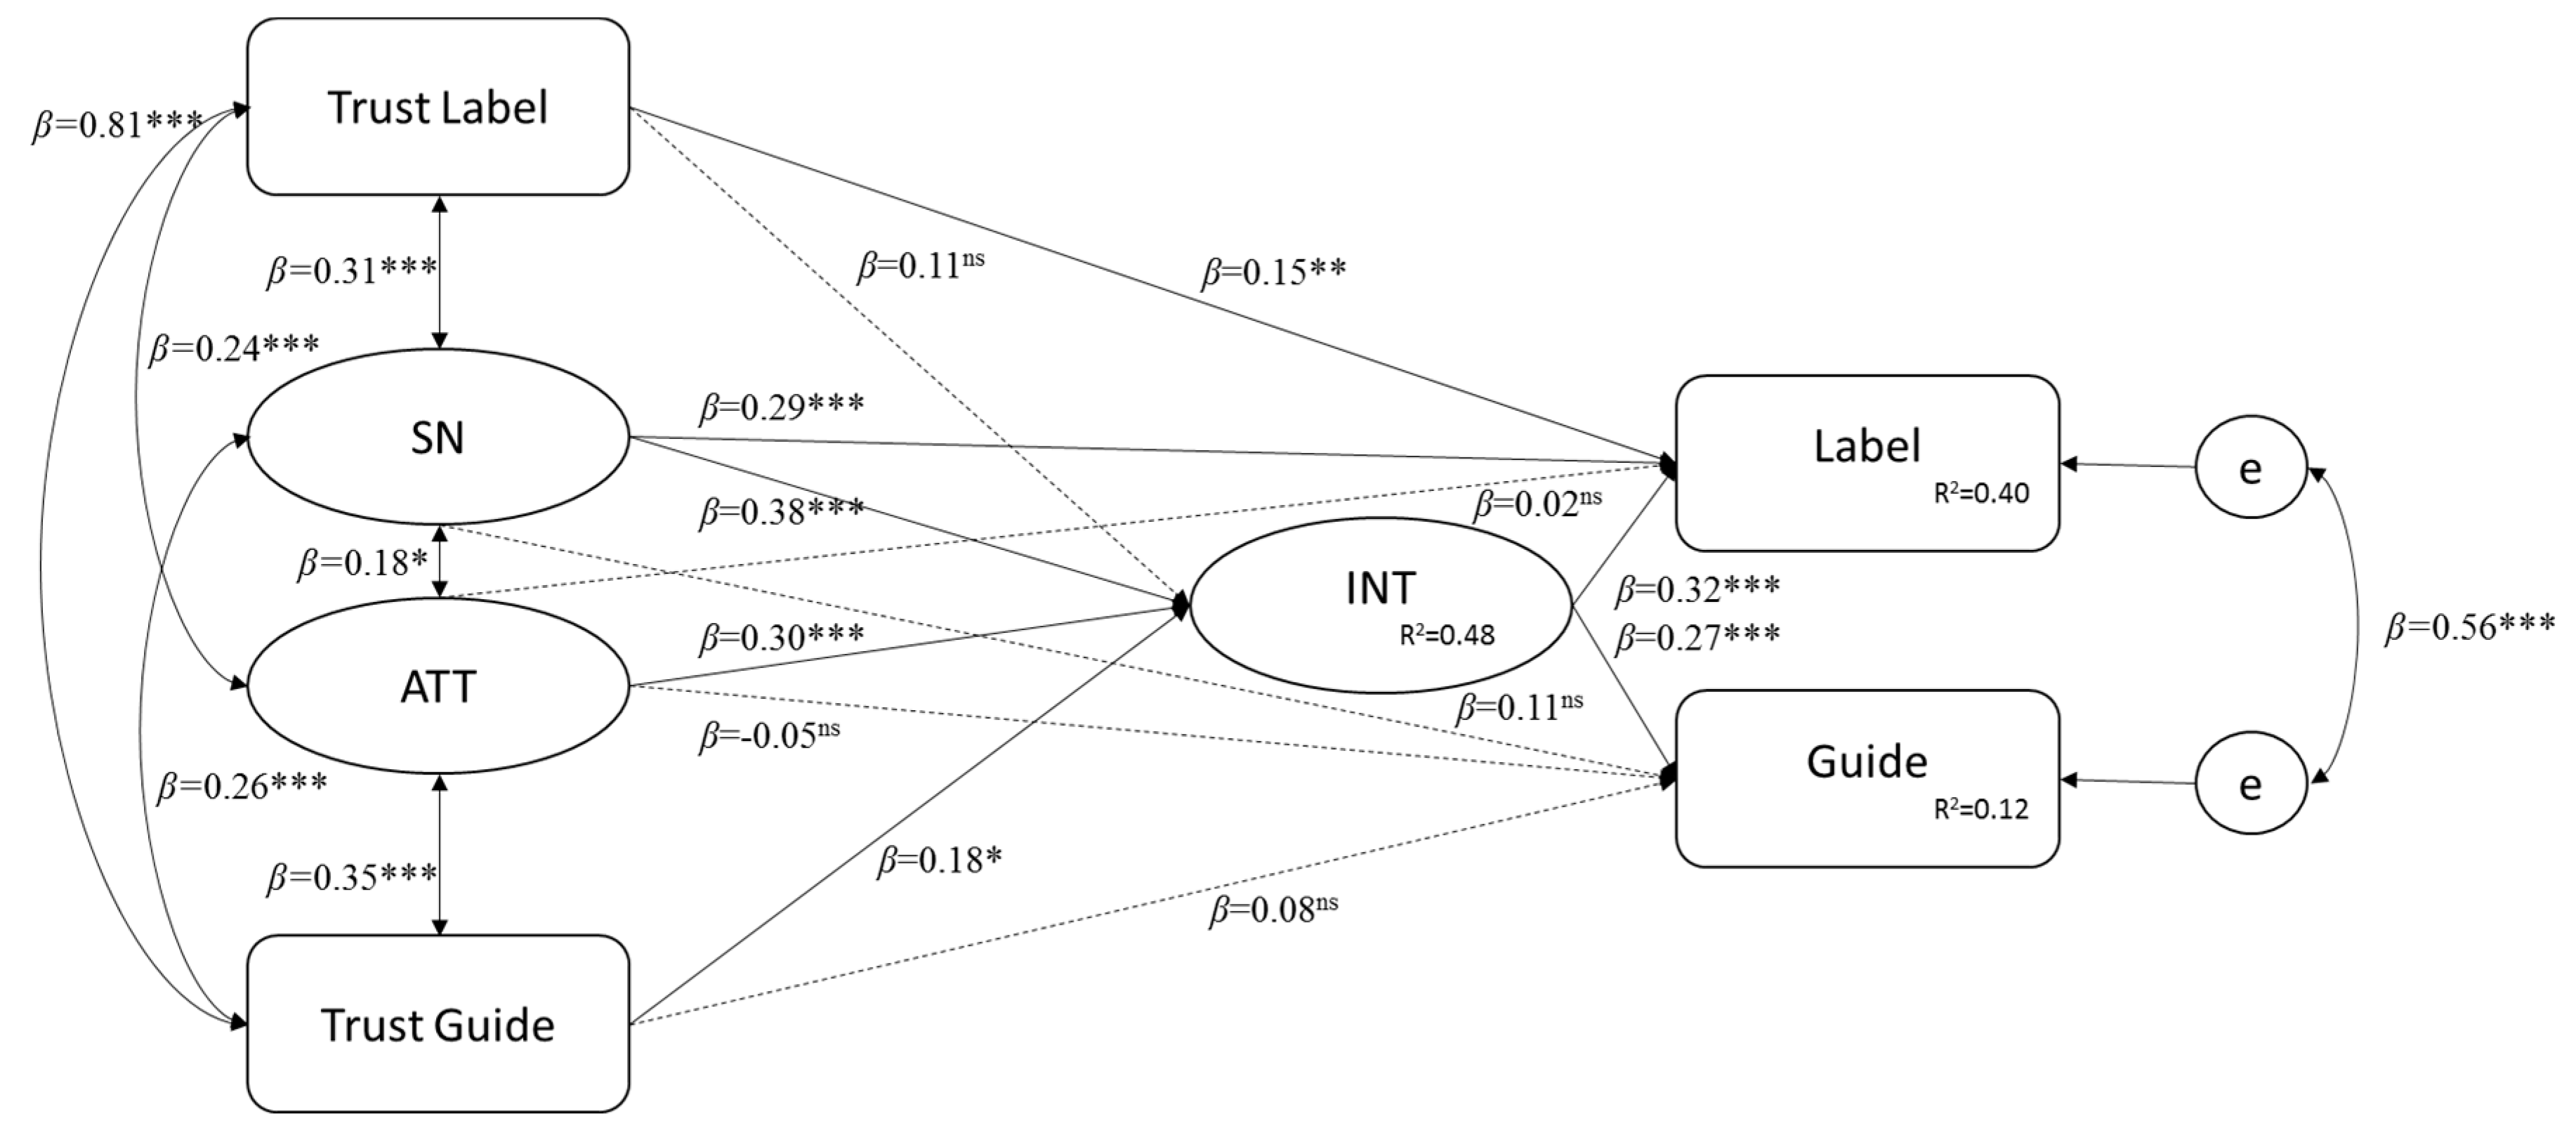
Figure 2.
Structural model of sustainable seafood consumption including estimated standardized regression weights and correlations. For simplicity, the measurement model is not shown, but it can be acquired from the first author. Model fit indices using the Santora-Bentler correction for non-normal distributions: Chisquare = 299.269, df = 126, p < 0.001. CFI = 0.96, TLI = 0.96, RMSEA = 0.04, SRMR = 0.08 Note: ns = p > 0.05, * = p < 0.05, ** = p < 0.01, *** = p < 0.001.

Figure 3.
Cross Lagged Panel Analysis between intentions and label use (left side of the backslash) respective guide use (right side of the backslash). Model fit indices: Chisquare = 115.276/108.729, df = 30/30, p < 0.001. CFI = 0.97/0.97, TLI = 0.97/0.97, RMSEA = 0.08/0.08, SRMR = 0.03/0.03. Note: ns = p > 0.05, * = p < 0.05, ** = p < 0.01, *** = p < 0.001.
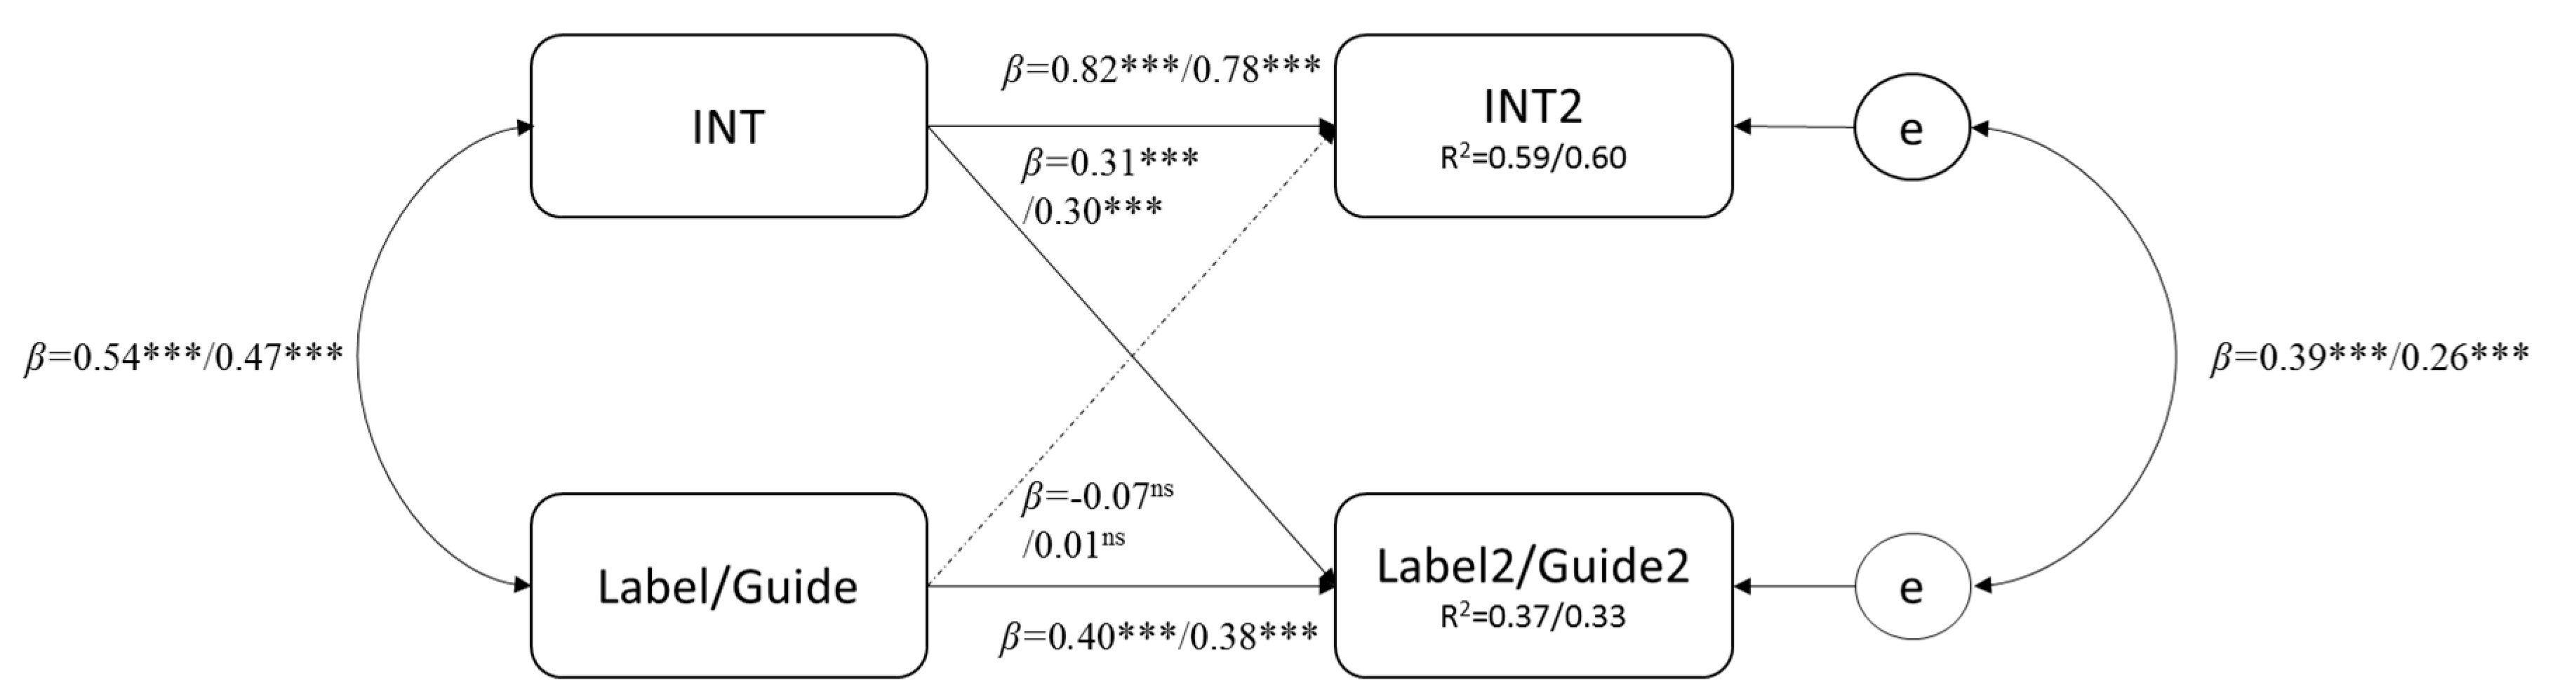
Figure 4.
Cross Lagged Panel Analysis between social norms and label use respective guide use (values on the right side of the backslash). Model fit indices: Chisquare = 18.591/12.378, df = 16/16, p = 0.29/0.72. CFI = 0.99/1.00, TLI = 0.99/1.00, RMSEA = 0.02/0.00, SRMR = 0.02/0.01. Note: ns = p > 0.05, * = p < 0.05, ** = p < 0.01, *** = p < 0.001.

Figure 5.
Cross-Lagged Panel Analysis between trust and label use respective guide use (values on the right side of the backslash). No degrees of freedom leads to perfect model fit. Note: ns = p > 0.05, * = p < 0.05, ** = p < 0.01, *** = p < 0.001.
Figure 5.
Cross-Lagged Panel Analysis between trust and label use respective guide use (values on the right side of the backslash). No degrees of freedom leads to perfect model fit. Note: ns = p > 0.05, * = p < 0.05, ** = p < 0.01, *** = p < 0.001.

Figure 6.
Cross Lagged Panel Analysis between attitudes and guide use. Model fit indices: Chisquare = 644.895, df = 70, p = 0.34. CFI = 0.76, TLI = 69, RMSEA = 0.15, SRMR = 0.15. Note: ns = p > 0.05, * = p < 0.05, ** = p < 0.01, *** = p < 0.001.
Figure 6.
Cross Lagged Panel Analysis between attitudes and guide use. Model fit indices: Chisquare = 644.895, df = 70, p = 0.34. CFI = 0.76, TLI = 69, RMSEA = 0.15, SRMR = 0.15. Note: ns = p > 0.05, * = p < 0.05, ** = p < 0.01, *** = p < 0.001.

Figure 7.
Cross Lagged Panel Analysis between awareness of guide use and guide use. Model fit indices: Chisquare = 5.67, df = 5, p = 0.34. CFI = 0.99, TLI = 0.99, RMSEA = 0.01, SRMR = 0.01. Note: ns = p > 0.05, * = p < 0.05, ** = p < 0.01, *** = p < 0.001.
Figure 7.
Cross Lagged Panel Analysis between awareness of guide use and guide use. Model fit indices: Chisquare = 5.67, df = 5, p = 0.34. CFI = 0.99, TLI = 0.99, RMSEA = 0.01, SRMR = 0.01. Note: ns = p > 0.05, * = p < 0.05, ** = p < 0.01, *** = p < 0.001.


Table 1.
Descriptive background characteristics of both samples.
| Freq. Sample 1 | % Sample 1 | Freq. Sample 2 | % Sample 2 | Freq. Sample 2, t2 | % Sample 2, t2 | Popul. Average | |
|---|---|---|---|---|---|---|---|
| Gender | |||||||
| Male | 137 | 51.21 | 351 | 50.12 | 199 | 46.71 | 50.4 |
| Female | 131 | 48.88 | 348 | 49.79 | 227 | 53.29 | 49.6 |
| Born | |||||||
| 1984– | 59 | 22.10 | 169 | 24.07 | 19 | 5.07 | 24 |
| 1974– | 51 | 19.10 | 147 | 20.94 | 62 | 16.53 | 33 |
| 1964– | 59 | 22.10 | 125 | 17.81 | 70 | 18.67 | 27 |
| 1954– | 63 | 23.60 | 115 | 16.38 | 93 | 24.80 | 10 |
| 1935– | 35 | 13.11 | 147 | 20.80 | 131 | 34.93 | 6 |
| Educational Level | |||||||
| Primary or secondary school | 11 | 4.12 | 40 | 5.68 | 26 | 6.05 | 26.9 |
| High school | 87 | 32.58 | 245 | 34.80 | 144 | 33.49 | 40.9 |
| University education, lower | 110 | 41.20 | 274 | 38.92 | 161 | 37.44 | 23.7 |
| University education, higher | 59 | 22.10 | 145 | 20.60 | 99 | 23.02 | 9.5 |
| Household income | M = 501,800 | ||||||
| Up to 100,000 | 12 | 4.55 | 31 | 4.51 | 13 | 3.07 | |
| 100,001–300,000 | 31 | 11.74 | 74 | 10.77 | 46 | 10.87 | |
| 301,000–500,000 | 34 | 12.88 | 155 | 22.56 | 105 | 24.82 | |
| 500,001–700,000 | 43 | 16.29 | 136 | 19.80 | 89 | 21.04 | |
| 700,001–900,000 | 54 | 20.45 | 109 | 15.87 | 66 | 15.06 | |
| 900,001 or more | 90 | 34.09 | 182 | 26.49 | 104 | 24.59 |
Table 2.
Correlations (above diagonal) and covariances (below diagonal) between all items.
| Int1 | Int2 | Int3 | Int4 | Sn1 | Sn2 | Sn3 | Nep1 | Nep2 | Nep3 | Nep4 | Nep5 | Nep6 | Trust L | Trust G | Use L | Use G | |
|---|---|---|---|---|---|---|---|---|---|---|---|---|---|---|---|---|---|
| Int1 | 2.61 | 0.66 | 0.60 | 0.61 | 0.42 | 0.42 | 0.35 | 0.25 | 0.29 | −0.26 | −0.10 | 0.16 | −0.24 | 0.38 | 0.37 | 0.20 | 0.38 |
| Int2 | 1.86 | 3.04 | 0.66 | 0.74 | 0.46 | 0.46 | 0.43 | 0.23 | 0.27 | −0.26 | −0.07 | 0.06 | −0.22 | 0.37 | 0.39 | 0.31 | 0.55 |
| Int3 | 1.61 | 1.93 | 2.82 | 0.81 | 0.28 | 0.32 | 0.25 | 0.27 | 0.26 | 0.31 | −0.13 | 0.16 | −0.21 | 0.39 | 0.40 | 0.26 | 0.39 |
| Int4 | 1.56 | 2.03 | 2.14 | 2.50 | 0.33 | 0.41 | 0.33 | 0.32 | 0.31 | −0.29 | −0.13 | 0.11 | −0.25 | 0.39 | 0.43 | 0.26 | 0.44 |
| Sn1 | 0.96 | 1.13 | 0.67 | 0.75 | 1.99 | 0.71 | 0.67 | 0.12 | 0.12 | −0.15 | −0.01 | 0.02 | −0.08 | 0.23 | 0.17 | 0.26 | 0.4 |
| Sn2 | 0.97 | 1.14 | 0.76 | 0.91 | 1.42 | 1.99 | 0.70 | 0.16 | 0.22 | −0.13 | 0.03 | 0.05 | −0.05 | 0.29 | 0.24 | 0.17 | 0.42 |
| Sn3 | 0.83 | 1.07 | 0.59 | 0.74 | 1.35 | 1.39 | 2.03 | 0.14 | 0.09 | −0.20 | 0.01 | 0.01 | −0.02 | 0.21 | 0.22 | 0.17 | 0.44 |
| Nep1 | 0.61 | 0.60 | 0.67 | 0.77 | 0.25 | 0.34 | 0.31 | 2.23 | 0.46 | −0.38 | −0.33 | 0.30 | −0.32 | 0.09 | 0.18 | 0.02 | 0.20 |
| Nep2 | 0.78 | 0.77 | 0.74 | 0.84 | 0.30 | 0.52 | 0.21 | 1.15 | 2.80 | −0.27 | −0.17 | 0.28 | −0.35 | 0.21 | 0.27 | 0.14 | 0.22 |
| Nep3 | −0.65 | −0.69 | −0.80 | −0.71 | −0.31 | −0.27 | −0.43 | −0.88 | −0.70 | 2.36 | 0.35 | −0.15 | 0.32 | −0.12 | −0.15 | −0.17 | −0.17 |
| Nep4 | −0.28 | −0.22 | −0.38 | −0.35 | −0.01 | 0.08 | 0.01 | −0.83 | −0.47 | 0.90 | 2.84 | −0.13 | 0.60 | −0.07 | −0.12 | 0.07 | −0.02 |
| Nep5 | 0.42 | 0.18 | 0.43 | 0.28 | 0.05 | 0.12 | 0.03 | 0.71 | 0.76 | −0.36 | −0.37 | 2.57 | −0.12 | 0.16 | 0.24 | 0.02 | 0.01 |
| Nep6 | −0.68 | −0.67 | −0.63 | −0.69 | −0.21 | −0.12 | −0.06 | −0.86 | −1.03 | −0.86 | 1.81 | −0.35 | 3.15 | −0.20 | −0.27 | −0.11 | −0.18 |
| Trust L | 0.84 | 0.89 | 0.92 | 0.86 | 0.45 | 0.58 | 0.42 | 0.19 | 0.49 | 0.25 | −0.16 | 0.35 | −0.49 | 1.91 | 0.81 | 0.23 | 0.40 |
| Trust G | 0.80 | 0.92 | 0.90 | 0.91 | 0.33 | 0.46 | 0.43 | 0.36 | 0.60 | −0.31 | −0.27 | 0.52 | −0.64 | 1.50 | 1.81 | 0.23 | 0.39 |
| Use L | 0.43 | 0.72 | 0.59 | 0.54 | 0.49 | 0.33 | 0.32 | 0.05 | 0.30 | −0.35 | 0.15 | 0.06 | −0.26 | 0.44 | 0.42 | 1.77 | 0.61 |
| Use G | 1.12 | 1.73 | 1.19 | 1.26 | 1.21 | 1.08 | 1.14 | 0.53 | 0.67 | −0.49 | −0.08 | 0.03 | −0.58 | 1.01 | 0.96 | 1.48 | 3.30 |
Table 3.
Correlations (above diagonal) and covariances (below diagonal) between all items for study 2.
Table 3.
Correlations (above diagonal) and covariances (below diagonal) between all items for study 2.
| Int1 | Int2 | Int3 | Int4 | Sn1 | Sn2 | Sn3 | Nep1 | Nep2 | Nep3 | Nep4 | Nep5 | Nep6 | TrustL | TrustG | UseL | UseG | Awa1 | Awa2 | |
|---|---|---|---|---|---|---|---|---|---|---|---|---|---|---|---|---|---|---|---|
| Int1 | 2.63 | 0.70 | 0.68 | 0.68 | 0.48 | 0.51 | 0.42 | 0.31 | 0.27 | 0.13 | 0.11 | 0.35 | 0.12 | 0.38 | 0.43 | 0.31 | 0.43 | −0.16 | −0.20 |
| Int2 | 1.96 | 2.97 | 0.73 | 0.72 | 0.52 | 0.51 | 0.51 | 0.21 | 0.25 | 0.04 | 0.06 | 0.30 | 0.07 | 0.37 | 0.40 | 0.39 | 0.49 | −0.20 | −0.23 |
| Int3 | 1.79 | 2.06 | 2.67 | 2.67 | 2.28 | 0.86 | 0.42 | 0.38 | 0.37 | 0.29 | 0.27 | 0.13 | 0.12 | 0.35 | 0.16 | 0.39 | 0.43 | 0.32 | 0.41 |
| Int4 | 1.78 | 2.02 | 2.28 | 2.62 | 2.31 | 0.44 | 0.41 | 0.42 | 0.27 | 0.26 | 0.16 | 0.13 | 0.31 | 0.16 | 0.38 | 0.42 | 0.32 | 0.44 | −0.13 |
| Sn1 | 1.17 | 1.35 | 1.02 | 1.06 | 2.25 | 2.25 | 0.73 | 0.72 | 0.13 | 0.18 | −0.03 | −0.05 | 0.14 | −0.05 | 0.30 | 0.29 | 0.39 | 0.44 | −0.19 |
| Sn2 | 1.23 | 1.30 | 0.92 | 0.98 | 1.63 | 2.21 | 2.21 | 0.66 | 0.12 | 0.10 | −0.03 | −0.06 | 0.16 | −0.05 | 0.25 | 0.25 | 0.36 | 0.43 | −0.21 |
| Sn3 | 1.01 | 1.30 | 0.91 | 1.01 | 1.59 | 1.46 | 2.20 | 0.08 | 0.14 | −0.04 | −0.06 | 0.11 | −0.04 | 0.22 | 0.25 | 0.39 | 0.46 | −0.18 | −0.21 |
| Nep1 | 0.72 | 0.53 | 0.68 | 0.63 | 0.28 | 0.27 | 0.18 | 2.12 | 0.55 | 0.25 | 0.24 | 0.49 | 0.26 | 0.20 | 0.22 | 0.03 | 0.17 | −0.03 | −0.02 |
| Nep2 | 0.70 | 0.68 | 0.69 | 0.66 | 0.42 | 0.24 | 0.33 | 1.27 | 2.47 | 0.13 | 0.14 | 0.49 | 0.19 | 0.20 | 0.17 | 0.08 | 0.19 | −0.06 | −0.08 |
| Nep3 | 0.30 | 0.12 | 0.36 | 0.41 | −0.06 | −0.08 | −0.10 | 0.59 | 0.34 | 2.66 | 0.47 | 0.26 | 0.50 | 0.08 | 0.13 | −0.09 | 0.01 | 0.07 | 0.01 |
| Nep4 | 0.31 | 0.18 | 0.35 | 0.3 | −0.13 | −0.17 | −0.16 | 0.61 | 0.39 | 1.38 | 3.16 | 0.20 | 0.68 | 0.09 | 0.14 | −0.07 | −0.01 | 0.03 | 0.01 |
| Nep5 | 0.91 | 0.85 | 0.94 | 0.82 | 0.34 | 0.39 | 0.27 | 1.17 | 1.25 | 0.69 | 0.58 | 2.64 | 0.22 | 0.25 | 0.27 | 0.09 | 0.24 | −0.08 | −0.11 |
| Nep6 | 0.38 | 0.23 | 0.49 | 0.49 | −0.13 | −0.14 | −0.12 | 0.70 | 0.55 | 1.51 | 2.26 | 0.68 | 3.48 | 0.07 | 0.13 | −0.05 | 0.00 | 0.00 | −0.02 |
| TrustL | 0.88 | 0.92 | 0.92 | 0.90 | 0.65 | 0.54 | 0.47 | 0.41 | 0.45 | 0.20 | 0.24 | 0.58 | 0.20 | 2.09 | 0.79 | 0.24 | 0.33 | −0.14 | −0.14 |
| TrustG | 1.00 | 0.99 | 1.01 | 0.99 | 0.64 | 0.54 | 0.53 | 0.46 | 0.39 | 0.31 | 0.36 | 0.64 | 0.34 | 1.64 | 2.09 | 0.28 | 0.31 | −0.16 | −0.19 |
| UseL | 0.76 | 1.00 | 0.78 | 0.78 | 0.88 | 0.82 | 0.88 | 0.06 | 0.18 | −0.23 | −0.19 | 0.23 | −0.14 | 0.53 | 0.60 | 2.26 | 0.57 | −0.47 | −0.39 |
| UseG | 1.23 | 1.47 | 1.17 | 1.24 | 1.16 | 1.13 | 1.15 | 0.43 | 0.51 | 0.03 | −0.02 | 0.68 | −0.01 | 0.83 | 0.78 | 1.50 | 3.05 | −0.35 | −0.34 |
| Awa1 | −0.09 | −0.13 | −0.09 | −0.08 | −0.10 | −0.12 | −0.10 | −0.02 | −0.03 | 0.04 | 0.02 | −0.05 | 0.01 | −0.07 | −0.08 | −0.26 | −0.23 | 0.14 | 0.65 |
| Awa2 | −0.12 | −0.15 | −0.09 | −0.13 | −0.13 | −0.14 | −0.12 | −0.01 | −0.05 | 0.01 | 0.01 | −0.07 | −0.01 | −0.08 | −0.10 | −0.22 | −0.23 | 0.09 | 0.15 |
© 2017 by the authors. Licensee MDPI, Basel, Switzerland. This article is an open access article distributed under the terms and conditions of the Creative Commons Attribution (CC BY) license (http://creativecommons.org/licenses/by/4.0/).
Share and Cite
MDPI and ACS Style
Richter, I.; Thøgersen, J.; Klöckner, C.A. Sustainable Seafood Consumption in Action: Relevant Behaviors and their Predictors. Sustainability 2017, 9, 2313. https://doi.org/10.3390/su9122313
AMA Style
Richter I, Thøgersen J, Klöckner CA. Sustainable Seafood Consumption in Action: Relevant Behaviors and their Predictors. Sustainability. 2017; 9(12):2313. https://doi.org/10.3390/su9122313
Chicago/Turabian StyleRichter, Isabel, John Thøgersen, and Christian A. Klöckner. 2017. "Sustainable Seafood Consumption in Action: Relevant Behaviors and their Predictors" Sustainability 9, no. 12: 2313. https://doi.org/10.3390/su9122313
Note that from the first issue of 2016, this journal uses article numbers instead of page numbers. See further details here.