Performance Evaluation of Research and Business Development: A Case Study of Korean Public Organizations


1
Division of Cosmetic Science and Technology, Daegu Haany University, Gyeongsan, Gyeongsangbuk-do 38610, Korea
2
Defense Agency for Technology and Quality, Jinju, Gyeongsangnam-do 52851, Korea
3
Department of Industrial and Management Engineering, Inje University, Gimhae, Gyeongsangnam-do 50834, Korea
*
Author to whom correspondence should be addressed.
Sustainability 2017, 9(12), 2297; https://doi.org/10.3390/su9122297
Submission received: 17 October 2017
/
Revised: 26 November 2017
/
Accepted: 8 December 2017
/
Published: 11 December 2017
Abstract
:This study presents data envelopment analysis (DEA)-based systematic and simultaneous performance measures for research and business development (R&BD) and internal processes. In particular, we focus on the relationship between the research and development (R&D) process and business development (BD) process in evaluating R&BD overall performance, and provide effective guidelines for relatively underperforming decision-making units to help them establish an optimal strategy to increase their performance. To that end, we develop a two-stage network DEA model based on performance measures by defining variables and transforming R&D and BD performances into a serial network structure. In addition, based on the proposed method, we present a practical application of R&BD performance measurement for Korean public organizations, specifically public research institutes and universities.
1. Introduction
Technological innovation is an essential element for evaluating an organization’s national and business superiority in modern society, in which new products and services are widely developed through technological innovation activities such as development and the procurement of new technologies (Mojaveri et al. [1] and Roxas et al. [2]). In this environment, domestic and overseas research and development (R&D) investments have been gradually increasing to pursue more reading technological innovations. Companies’ R&D strategies maximize the return on investment in R&D by managing individual projects as a portfolio. However, due to the rapid development of technology and customer needs, product requirements are becoming more advanced, and product life is rapidly decreasing. As a result, research and business development (R&BD) has emerged for overcoming the current status of R&D. R&BD is a system that examines the feasibility of a project from the initial stage of R&D and sets up and adjusts the research direction for each stage until a product can finally be commercialized. Before the introduction of the R&BD concept, there were the concepts of the early market and the mass market. Early adapters who emphasized innovation led the early market, and businesses developed advanced technologies and products based on the customer’s perspective. On the other hand, general customers who valued practicality led the mass market. Before entering a market, companies first look at whether there is an unfulfilled demand. In the research market, for example, even the countless existing technologies cannot help companies fulfill the demand. Therefore, it is necessary to establish an R&BD strategy that reflects customer-oriented needs from a company’s technology center.
The development of R&D performance evaluation is one of many important areas for effective and efficient R&D investments, and a variety of performance evaluation indexes and techniques have been developed and utilized (Kerssens-van Drongelen et al. [3]). Researchers have widely studied R&D performance evaluation based on multiple R&D inputs and outputs, and to this end, widely utilized Charnes et al.’s concept of data envelopment analysis (DEA) [4]. DEA is a linear programming methodology that evaluates the relative performances of decision-making units (DMUs) using a set of inputs to produce a set of outputs. With DEA, each DMU is evaluated by comparing its performance with those of other DMUs in its peer group. Several DEA-based R&D performance evaluations have been studied. Anderson et al. [5] proposed a DEA-based relative performance assessment model and benchmarking methodology for UK university technology transfer offices. Wang and Huang [6] used the production framework associated with DEA to measure the relative efficiency of R&D, with R&D capital stocks and manpower as input variables, and patents and publications as output variables. Sharma and Thomas [7] provided a DEA-based relative R&D performance model using input variables such as domestic expenditure and the number of researchers, and output variables such as patents granted to residents. In their study, Japan, Korea, and China were selected as the most efficient countries under the constant return to scale (CRS) model, and Japan, Korea, China, India, Slovenia, and Hungary were selected as the most efficient countries under the variable return to scale (VRS) model. Hsu and Hsueh [8] provided a three-stage DEA model that measures R&D productivity at the national level to provide R&D policy implications that reflect the operational level of DMUs. In order to measure R&D productivity for the R&D policies of Asian countries, the research categorized the 27 countries into four groups: inventors, merchandisers, academicians, and duds, and identified the characteristics with respect to R&D performance. Lee et al. [9] measured and compared the performances of national R&D programs utilizing a network DEA model. They provided policy implications for national R&D programs by removing the bias caused by organization scale to identify the strengths and weaknesses of each organization. For discrimination, the centrality value for each frontier organization provided the base. Kim [10] analyzed the productivity of universities in technology transfer using multiple input–output combinations and DEA, and found that the universities’ technology transfer rate was relatively efficient in terms of input-to-output quantities. The data indicated that an increasing number of commercial outputs had made a positive shift in their productivity, and therefore, universities may stimulate commercial activities.
However, the above-mentioned studies on DEA-based R&D and R&BD performance evaluation have a limitation in that they did not consider the economic value that the technology transfer created and business development (BD) (which refers to commercialization), which is the ultimate goal of R&D. Rather, the studies focused primarily on visible outputs such as patents and papers in evaluating R&D performance (Jeon and Lee [11]). Sexton et al. [12] mentioned that the entire period’s evaluation, from the R&D to the BD phase, is very much required for R&D performance evaluation, and Bozeman et al. [13] emphasized that R&D performance measurement may be extended to include technology transfer and BD owing to their significance and the demand for them. In particular, Min [14] mentioned that the stabilization of a BD system is quite important due to limited R&D resources, and therefore, BD performance evaluation, including R&D results, is essential when considering the overall R&D process from research to commercialization. Commercialization in R&D is defined as the activities that develop and procure new technologies and launch a new business to make products and/or charge engineering fees; this entire process is the so-called R&BD.
Kim and Lim [15] defined R&BD as a process that monitors the diffusion speed of research results, determines whether additional R&D is required, and are the R&D and BD-related activities that focus on business improvement. To evaluate R&BD, the indexes must include the general indexes of R&D such as papers and patents, as well as the evaluation indexes, according to the BD point of view. Of course, the literature on the technology transfer and the performance evaluation of BD has attempted to analyze efficiency according to economic performance from the R&BD point of view, which includes technical fees and new business launches. Jeon and Lee [11] proposed a DEA-based three-stage model of R&BD performance that captures commercialization outcomes and conventional R&D performance and covers the following three stages: the efficiency stage, the effectiveness stage, and the productivity stage. Although Jeon and Lee [11] attempted to analyze R&BD performance through considering technological transfers and commercialization, they did not use a systematic approach that considered technological transfers and commercialization simultaneously when evaluating R&BD performance; instead, they simply considered them individually.
As Kim and Lim [15] mentioned, R&BD generally consists of two internal processes (i.e., a R&D process as technology securement, and a BD process as commercialization), and thus, a systematic approach that considers the relationship between the internal processes simultaneously can facilitate a more practical R&BD performance evaluation. To address this issue, this study provides DEA-based systematic and simultaneous performance measures for R&BD and internal processes. In particular, it considers the relationship between the R&D and BD processes in evaluating overall R&BD performance, and provides effective performance improvement guidelines for relatively underperforming DMUs to help them establish an optimal strategy in order to increase their performance. Additionally, it shows how efficiently R&D inputs contribute to R&BD performance in terms of the R&D process, and how efficiently R&D outputs contribute to R&BD performance in terms of the BD process. To this end, this study develops a two-stage network DEA-based performance measure by defining variables and transforming R&D and BD performance into a serial network structure. Note that the aim of this research is to suggest the application of the network DEA model for simultaneous performance measures for R&BD and internal processes, rather than study DEA methodology. Using data from Korean public organizations, specifically public research institutes and universities, we show how to measure R&BD performance in a way that considers the relationship between the R&D and BD processes simultaneously. Although Jeon and Lee [11] dealt with DEA-based R&BD performance evaluation, they did not address the relationship between R&D and BD performance. Especially, although Guan and Chen [16] provided a model that considered both R&D and commercialization processes simultaneously when evaluating China’s high-tech innovations, they did not measure the contributions of R&D inputs and outputs in terms of the R&D and BD processes, respectively, and did not provide effective performance improvement guidelines for relatively underperforming DMUs to help them establish an optimal strategy to increase their performance. The rest of this paper is organized as follows. Section 2 presents the R&BD performance measurement model, which has input, output, and intermediate variables based on the two-stage network DEA. Section 3 shows a practical application of the R&BD performance measurement for Korean public organizations, specifically public research institutes and universities, using the proposed method. Section 4 summarizes our work.
2. R&BD Performance Measurement Model
2.1. Two-Stage Structure of R&BD Performance Measure
As Guan and Wang [17], Hsu and Hseuh [8], and Liu and Lu [18] noted, R&D performance evaluation focuses on how efficiently R&D inputs (researchers, budget, etc.) are allocated to secure R&D outputs (patents, papers, etc.). In addition, as Jeon and Lee [11] noted, R&BD focuses on how well the R&D outputs are commercialized, such as for profit or royalty generation (hereafter referred to as BD outcome). Accordingly, there are correlations among the R&D inputs, R&D outputs, and BD outcomes. Moreover, from the performance evaluation perspective, fewer R&D inputs and higher R&D outputs are the preferred means of improving R&D performance, while fewer R&D outputs and higher BD outcomes are the preferred means of improving BD performance. In this respect, although allocating more R&D inputs can result in more R&D outputs, it will worsen R&D performance. Further, more R&D outputs can result in higher BD outcomes, but will worsen BD performance.
This study constructed an R&BD diagram, as shown in Figure 1, as a conceptual framework for interpreting the R&BD performance evaluation. As Figure 1 describes, R&BD focuses on the upstream technology securement and downstream commercialization sub-processes from the performance perspective. Specifically, the upstream technology securement sub-process from the R&D inputs to the R&D outputs (i.e., intermediate outputs in terms of the whole R&BD process) is the first stage (stage one). The stage one operation is related to such activities as researching, developing, learning by doing, or importing, and it is linked with the second stage (stage two), that is, the downstream commercialization sub-process from the R&D outputs to the BD outcomes. The stage two operation supports such economic activities as marketing and manufacturing. Note that the two sub-processes are related, rather than independent, since they are connected by the R&D outputs. This means that the intermediate R&D outputs have a double identity in their role in R&BD as the outputs in the first sub-process and the inputs in the second sub-process (Guan and Chen [19]). In this sense, the integrated conceptual framework not only leads us to assign primary importance to the upstream indigenous R&D performance, but also reminds us to attach particular importance to the downstream commercialization performance in the economic sense.
Based on Figure 1, we argue that R&BD performance aims to increase R&D outputs at lower R&D inputs, and at the same time, increase BD outcomes for the given R&D outputs. Thus, in terms of performance, the performance in stage one is evaluated by how efficiently the researchers or budgets are utilized to secure new technologies such as papers and patents, and the performance in stage two is evaluated by how well the new technologies from the technology securement are commercialized. In other words, stage one deals with the performance issue of R&D inputs and intermediate R&D outputs for the securement of technology, and stage two deals with the performance issue of intermediate R&D outputs and BD outcomes for commercialization.
R&BD concentrates on the transformation performance from the R&D inputs directly to the BD outcomes. Note that technology securement is only an upstream sub-process, so a better performance in technology securement alone cannot guarantee a better performance in R&BD. The R&BD performance can improve only when both sub-processes work well. Thus, a performance measure model must simultaneously describe the inclusive relationship between the R&BD process and the two sub-processes, as well as the relationship between the two sub-processes.
The term performance is used in a variety of ways. In order to evaluate the R&BD performance, this study utilized DEA, which was initially developed by Charnes, Cooper, and Rhodes [4]. DEA and the stochastic frontier are two popular approaches to the evaluation of technical efficiency. DEA is a linear programming methodology that evaluates the relative efficiencies of DMUs using a set of inputs to produce a set of outputs. The technique envelopes observed production possibilities to obtain an empirical frontier, and measures efficiency as the distance to the frontier. The primary advantage of this approach is its non-parametric nature; therefore, it is not necessary to have strict normality assumptions about the data and errors when trying parametric analysis. DEA can handle multiple inputs and outputs, and does not need to predefine the functional relationship between inputs and outputs. Nevertheless, econometricians have argued that the approach produces biased estimates in the presence of measurement error and other statistical noise [20]. The principal reasons for skepticism regarding the traditional standard DEA on the part of economists are follows. Traditional standard DEA is a non-parametric method; no production, cost, or profit function is estimated from the data. This precludes evaluating marginal products, partial elasticities, marginal costs, or elasticities of substitution from a fitted model. Consequentially, one cannot derive the usual conclusions about the technology, which are possible from a parametric functional form. Most importantly, being non-statistical in nature, the linear programing (LP) solution of a DEA problem produces no standard errors and leaves no room for hypothesis testing. In traditional standard DEA, any deviation from the frontier is treated as inefficiency, and there is no provision for random shocks. By contrast, the far more popular stochastic frontier model explicitly allows the frontier to move up or down because of random shocks. Additionally, a parametric frontier yields elasticities and other measures of the technology that are useful for marginal analysis. As mentioned in Ray [21], the lack of standard errors for the DEA efficiency measures stems from the stochastic properties of inefficiency-constrained estimators not being well established in the econometric literature. However, there are several research studies underway to address the weakness of the DEA model. Banker [22] conceptualized a convex and monotonic non-parametric frontier with a one-sided disturbance term, and showed that the DEA estimator converges in distribution with the maximum likelihood estimators. Simar [23] and Simar and Wilson [24,25] combined bootstrapping with DEA to generate empirical distributions of the efficiency measures of individual firms. This has generated a lot of interest in the profession, and one may expect the DEA model to incorporate the bootstrapping option in the near future. Simar and Wilson [26] described a data-generating process (DGP) that is logically consistent with the regression of non-parametric DEA efficiency estimates on some covariates in a second stage. They then proposed single and double bootstrap procedures; both permit valid inference, and the double bootstrap procedure improves statistical efficiency in the second-stage regression. The use of traditional standard DEA in evaluating a more realistic and accurate efficiency may be controversial among researchers of parametric and non-parametric methods due to the characteristics of DEA. Nevertheless, due to its advantages, DEA has been theoretically extended and very widely applied in various fields, including: education (Ahn [27]; Beasley [28]), aviation (Schefezyk [29]), health care (Pina and Torres [30]), inventory and manufacturing (Park et al. [31]; Park et al. [32]; Park et al. [33]), etc. In addition, as mentioned earlier, there are quite a number of studies that utilize the DEA model in evaluating R&D and R&BD performance. For more details on the DEA model, refer to Charnes et al. [4].
However, the traditional standard DEA model treats DMUs as a black box, and cannot incorporate multiple sub-processes into an integrated measurement framework. The divisional and independent measurement of process performance using traditional standard DEA destroys the integrity and linkage between sub-process performances. Thus, this study utilized the network DEA, which takes intermediate factors into account when evaluating performance. The network DEA model is an extension of the traditional standard DEA model in which each DMU is comprised of two or many sub-DMUs (or internal processes) connected in parallel, as shown in Figure 1. The objective of the network DEA model is to evaluate the relative performance of each DMU and each of its sub-DMUs. In particular, this study applied the two-stage relational network DEA model introduced by Kao and Hwang [34] to evaluate R&BD performance. The main reason for applying the two-stage relational network DEA model is that this model can help measure the technical performance of the R&BD and the two sub-processes in an integrated analytical framework, in the sense that the overall and sub-process performances are estimated simultaneously. In Figure 1, the R&D input and BD outcome are regarded as the input and output, respectively, and the R&D output is treated as an intermediate factor. For the performance evaluation, we assumed that all of the R&D inputs are positively related to R&D output production, and that all of the R&D outputs are positively related to the BD outcome generation. We show that the R&DB performance of DMU k, which has m R&D inputs, xi (i = 1, 2, …, m), t R&D outputs, lq (q = 1, 2, …, t), and s BD outcomes, yr (r = 1, 2, …, s), is measured based on how efficiently the R&D inputs are used to produce the BD outcomes, and, at the same time, how efficiently the R&D inputs are used to provide a high quality and quantity of R&D outputs, and how efficiently the R&D outputs contribute to the commercialization. Here, ur is the weight given to the r-th BD outcomes, vi is the weight given to the i-th R&D input, wq is the weight given to the q-th R&D outputs, and n is the number of DMUs.
Based on the two-stage relational network DEA model, the R&BD performance evaluation is calculated as
where Sj*, Sj(C1)*, and Sj(C2)* are the slack variables associated with second, third and fourth constraints, respectively. Model (1) is based on the input-oriented CCR (Charnes, Cooper and Rhodes) model in DEA. As in Kao and Hwang’s [34] two-stage relational network DEA model, the same weights were assigned to the R&D output variables, lq. Second constraint represents the R&BD performance of the j-th DMU. Third and fourth constraints represent the R&BD performance in the technology securement and commercialization stages, respectively. As in the two-stage relational network DEA model, we can validate the performance decomposition principle, according to which the multiplication of third and fourth constraints is equal to second constraint, that is, sk* = sk(C1)* + sk(C2)*. Note that we utilized this performance decomposition principle to analyze the influences of technology securement and commercialization on R&DB performance. Let vi*, ur*, and wq* be the optimal weights assessed by Model (1). The performance of the k-th DMU in the R&DB, technology securement stage, and commercialization stage can be revised as Models (2)–(4), respectively.
If the performance score of Ek(C1)* is 1, the DMU is considered to have achieved a best-practice status in the technology securement stage. If the performance score of Ek(C2*) is 1, the DMU is said to have obtained a best-practice status in the commercialization stage. By contrast, and indicate underperformance in the technology securement and commercialization stages, respectively. Based on the performance decomposition principle in the two-stage relational network DEA model, we obtained two equations, Ek* = Ek(C1) × Ek(C2) and sk*= sk(C1)* + sk(C2)*, respectively. Ek = Ek(C1) × Ek(C2) signifies that the multiplication of Models (3) and (4) equals Model (2), and sk* = sk(C1)* + sk(C2)* signifies that the sum of third and fourth constraints equals second constraint. From Models (2)–(4), we substituted , , and for sk*, sk(C1)*, and sk(C2)*, respectively. Since sk* = sk(C1)* + sk(C2)*, it can be said that the underperformance of the k-th DMU can be distributed to the technology securement and commercialization stages in (sk(C1)*/sk*) and (sk(C2)*/sk*) proportions, respectively. If (sk(C1)*/sk*) and (sk(C2)*/sk*) are assumed to be IA(C1) and IA(C2), respectively, IA(C1) and IA(C2) can be obtained as
The performance proportions signify relative values, which can be utilized as the evaluation ratings for the underperformance of R&D inputs in technology securement and the underperformance of R&D outputs in commercialization. For example, using the proportion (1 − IA(C1)), we can determine how well the R&D inputs contribute to R&DB performance in terms of technology securement, and likewise, using the relative proportion (1 − IA(C2)), we can determine how well the R&D outputs contribute to R&BD performance in terms of commercialization. A proportion that is close to 1 indicates a significant contribution to R&BD performance. In other words, since R&BD performance is calculated as the product of performances in the technology securement and commercialization stages, it is more effective to improve the R&BD performance by focusing on improving the process that has a lower contribution.
2.2. R&BD Performance Improvement
Since the approach of this study is based on DEA, we can provide information on whether the underperforming DMUs improve their performance in each stage. For a simple illustration of this approach, we calculated the R&BD performance and performance improvement using the sample data shown in Table 1. The sample data consist of data for seven DMUs, and each DMU consumes two R&D inputs and yields one R&D output and one BD outcome. The R&BD performance results, which include the R&BD performance by the proposed method, and include Ej(C1), Ej(C2), IA(C1), and IA(C2), are summarized starting from the sixth column in Table 1. We find that the R&BD performance is calculated by the multiplication of the technology securement stage (Ej(C1)) and commercialization stage (Ej(C2)). Only two DMUs, A and B, are best-practice DMUs in the technology securement stage, and two others, A and C, are best-practice DMUs in the commercialization stage. We see that DMU A, which has a relatively high performance in both stages, also achieved the highest R&BD performance. Although DMUs B and C are best-practice DMUs in the technology securement and commercialization stages, respectively, they cannot be best-practice DMUs in R&BD performance, because they have a relatively low performance in the commercialization and technology securement stages, respectively.
For example, DMU C has a relatively lower performance in the technology securement stage. However, it can achieve best-practice status by either (a) increasing its R&D output; or (b) decreasing its R&D inputs. If DMU C chooses to improve its performance by (a), it might no longer be a best-practice DMU in the commercialization stage because the R&D output, which is the input of the commercialization stage, has increased. Note that the R&D inputs and BD outcome are linked by the R&D output. Thus, in order to improve the performance in both stages, we focused on reducing the R&D inputs and increasing the BD outcome while maintaining the R&D output. In other words, we can calculate how much R&D inputs and BD outcome need to improve by using the R&D output given by Model (7), which is the envelopment-type version of Model (1). is obtained by , where is the q-th optimal weights for the BD outcome calculated in Model (1), is the efficiency score, and , , and are the dual variables.
Through Model (7), we can obtain guidelines on how much R&D inputs have to decrease or BD outcomes have to increase in order to improve the performances of underperforming DMUs, specifically in the setting = , = , where and indicate the negative and positive amounts of inputs and outputs, respectively, that need to be improved. If the inefficient DMU G reduces each of its R&D inputs (X1 and X2) by 40, and increases its BD outcome (Q2) by 20, it can achieve best-practice status in R&BD performance with a score of 1. As we mentioned in Section 2.1, (1 − IA(C1)) and (1 − IA(C2)) are relative values that contribute to the R&BD performance, and it is more effective to improve the R&BD performance by preferentially improving the performance of the process with the smaller value. Consider DMU G, where (1 − IA(C1)) is relatively smaller than (1 − IA(C2)) in Table 1. Table 2 shows the sensitivity analysis for DMU G to improve its performance with a BD outcome that is fixed and an R&D input that decreases by 10, or an R&D input that is fixed and a BD outcome that increases by 10. We found no performance improvement from the point where R&D inputs decrease by 40 from the existing value, and the BD outcomes increase by 20 from the existing value. This result is the same as the above-mentioned result that DMU G reduces R&D inputs by 40 and increases BD outcomes by 20 to achieve best-practice status in R&BD performance. In addition, we saw that the R&BD performance improvement is greater when R&D inputs improve more than the BD outcomes, which suggests that it is more effective to improve R&BD performance by preferentially improving R&D input performance.
3. Empirical Study
3.1. Objective and Variables
For the case study, we applied our proposed method to 49 research organizations, specifically public research institutes and universities in the Republic of Korea (we used the public technology transfer and commercialization data collected by the Ministry of Trade, Industry and Energy in 2013 as inputs, intermediates, and outputs). In the case study, we considered 34 universities and 15 research institutes. Of the 34 universities included in the case study, 13 were national universities and 21 were private universities. Of the 15 research institutes, 10 were managed by the Ministry of Science, ICT, and Future Planning, three were managed by the Ministry of Trade, Industry, and Energy, and two were managed by the Ministry of Oceans and Fisheries. Each research institute was regarded as a DMU. Generally, researchers and research expenses are invested for R&D, and technologies are secured in the form of patents and papers; the secured technologies create economic values, such as royalty income, technology transfer—which is called transfer of technology (TOT)—and commercialization. Referring to the studies of Bonaccorsi et al. [35], Meng et al. [36] and Liu and Lu [18], we selected the number of researchers and R&D costs as R&BD inputs, the number of secured technologies as intermediates, and the number of technology transfers, royalties, and foundations as R&BD outputs. The data reflect the following selected performance measures.
- Inputs:
- (a)
- Number of Researchers (NR): Total number of researchers involved in R&D
- (b)
- R&D Costs (RC): Total cost of R&D, including labor costs, material purchases, and activity costs (₩)
- Outputs:
- (a)
- Number of Technology Transfers (NTT): Total number of technology transfers or contracts for the transfer of secured technology
- (b)
- Royalties (RT): Total amount of royalty income
- (c)
- Number of Foundations (NF): Total number of start-ups
- Intermediate:
- (a)
- Number of Secured Technologies (NST): Total number of secured technologies such as patents, utility models, and papers
Since DEA analysis is a relative evaluation among DMUs, a sufficient number of DMUs compared to the number of input and output factors have to be considered for a more accurate evaluation. In the study of Bonaccorsi et al. [35], the minimum number of DMUs recommended for reasonable efficiency evaluation are n ≥ m × s, and n ≥ max{3 × (m + s), m × s}, where n is the minimum number of DMUs required, m is the number of input factors, and s is the number of output factors. This research takes into account two inputs, three outputs, and one intermediate. Thus, more than 15 DMUs should be considered to meet the recommended number of DMUs. The number of DMUs for accurate evaluation is satisfied with 49 DMUs.
The input, intermediate, and output data are presented in Table A1, and their descriptive statistics are listed in Table A2 of Appendix A.
3.2. Analysis Result
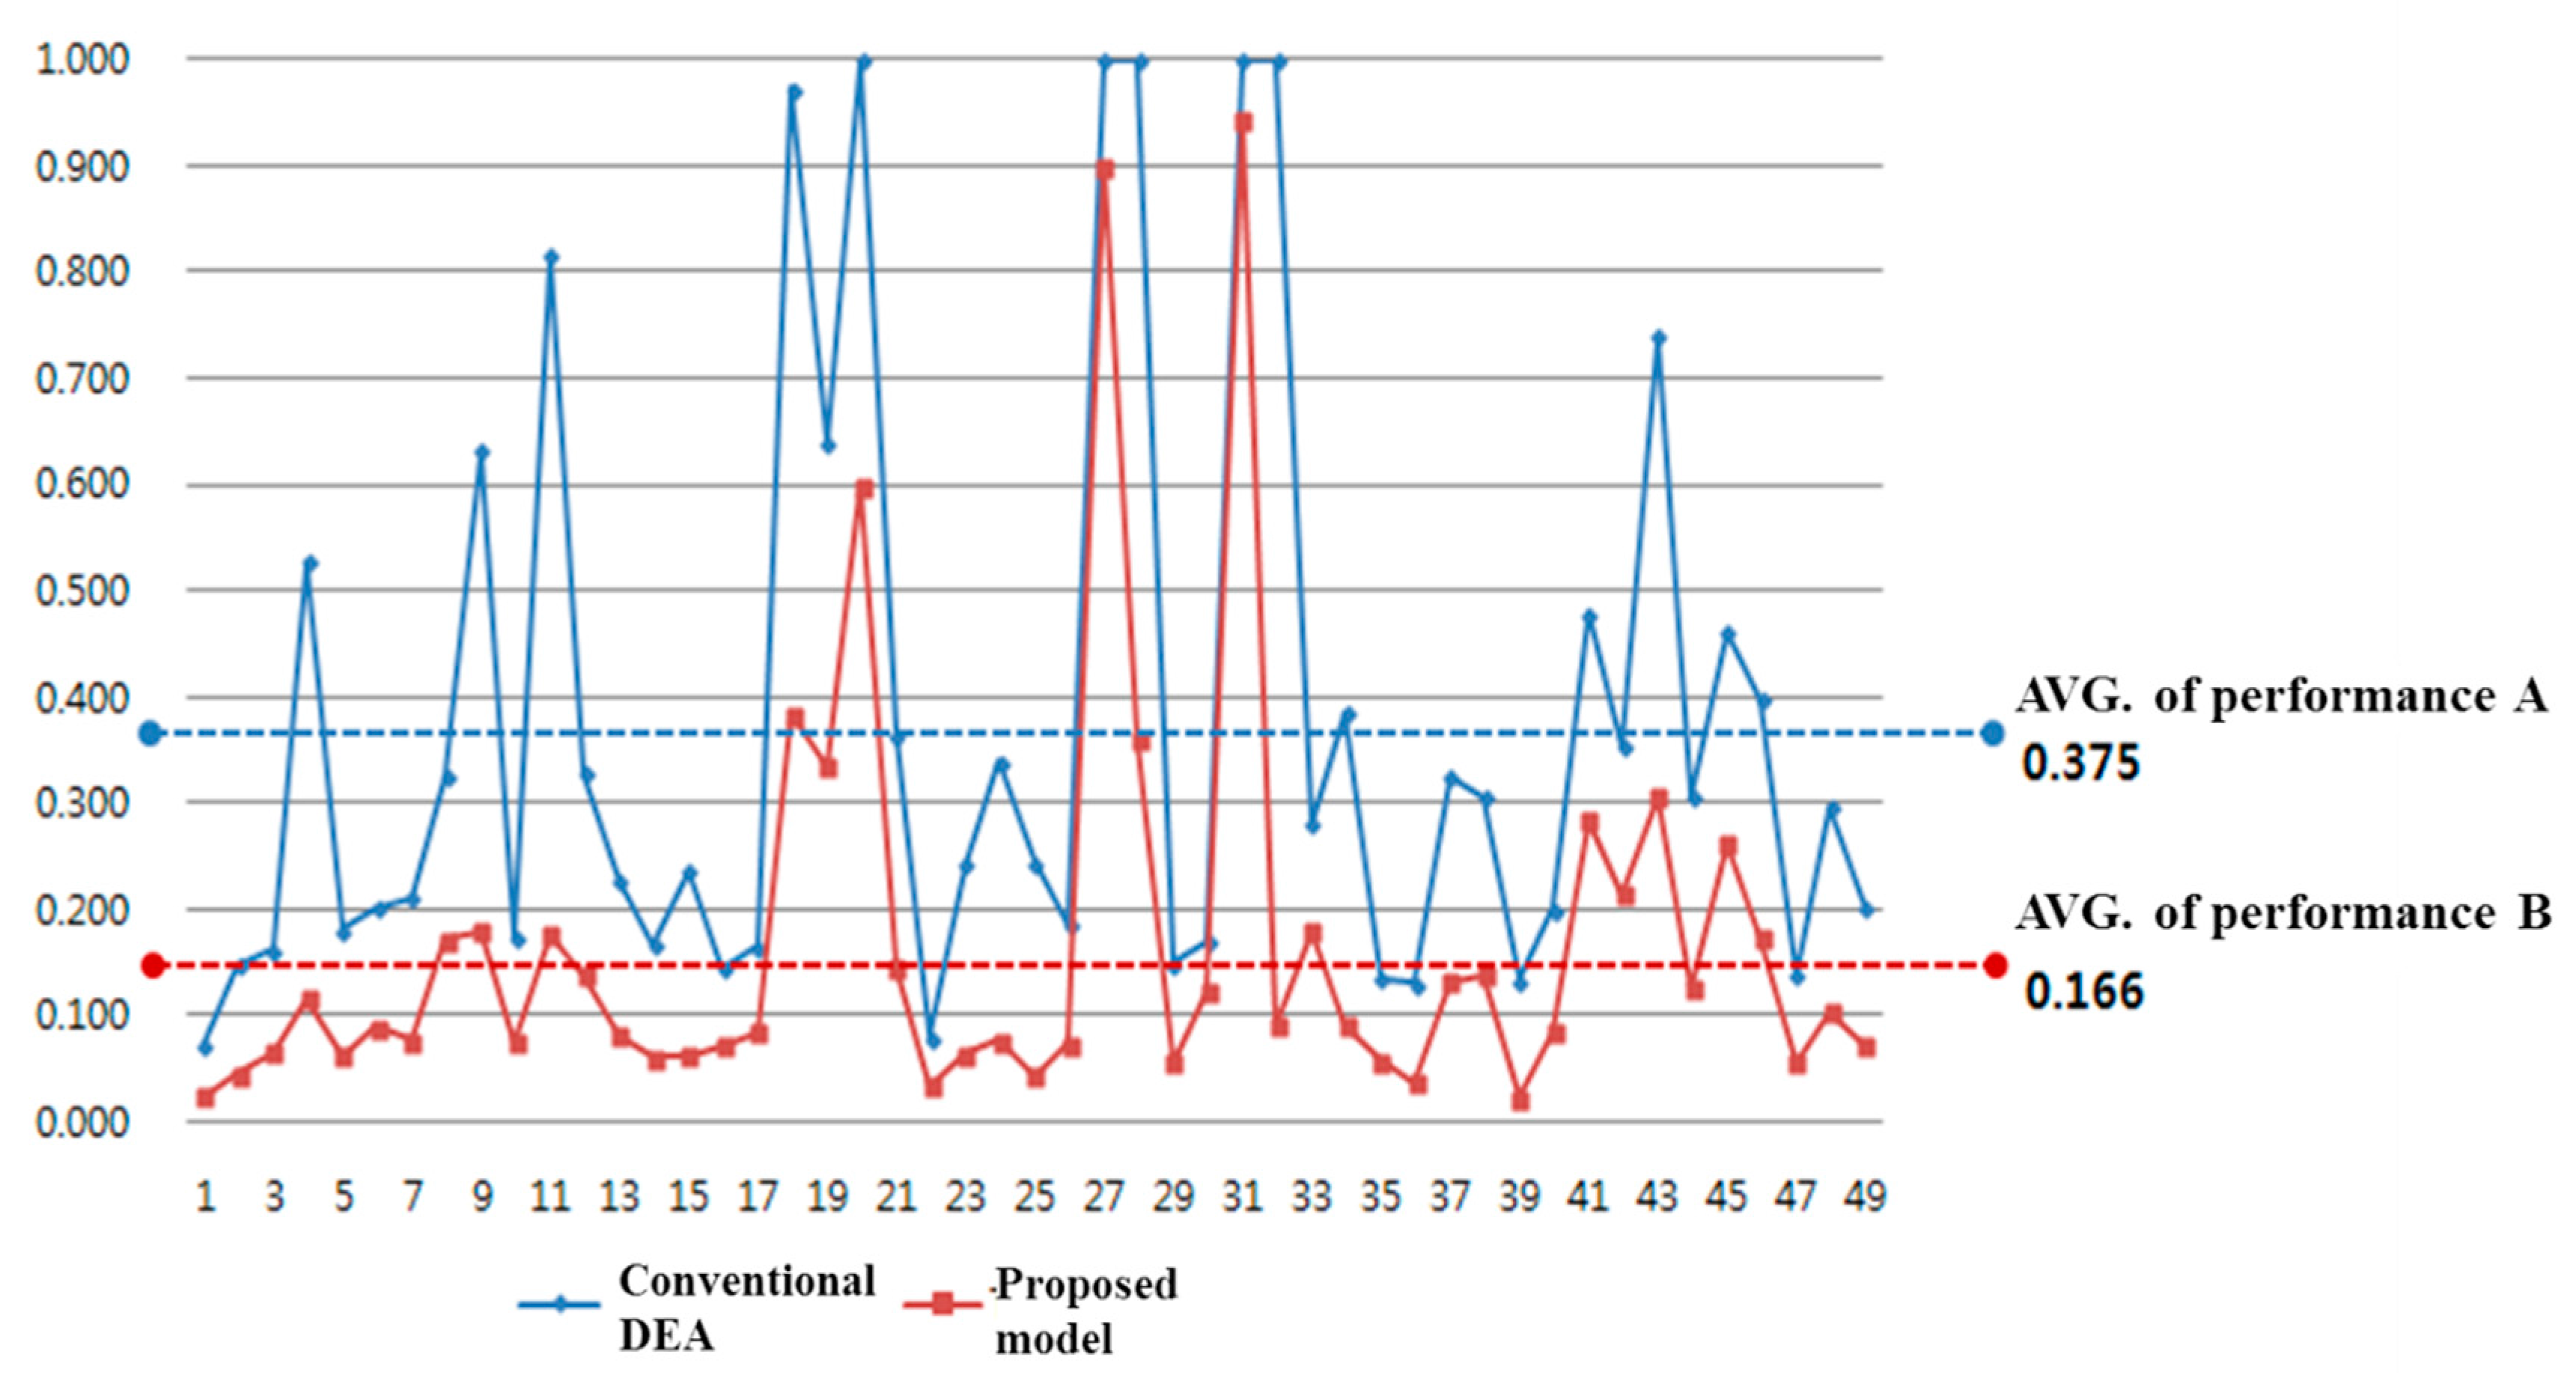
We first compared the R&BD performance scores from the conventional DEA model and the proposed model, and the performance results are shown in Table 3. Performances A and B signify the performance scores from the conventional DEA model—in which NR and RC were used as inputs and NTT, RT, and NF were used as outputs without intermediates—and the proposed model, respectively. To calculate Performance A, NR and RC were used as inputs, whereas NTT, RT, and NF were used as outputs. In Performance A, DMUs 20, 27, 28, 31, and 32 were identified as the relatively most overperforming research organizations (performance score is 1), and the remaining 44 DMUs were identified as relatively underperforming. On the other hand, in Performance B, there were no best-practice DMUs (for which the performance score is 1), but DMUs 27 and 31 had relatively higher performance scores, and they could be classified as a relatively overperforming group (scores for Performance B were over 0.900). In particular, DMUs 31 and 32 could be classified as best-practice DMUs in Performance A. However, although DMU 31 also had a relatively higher R&BD performance for Performance B, with a score of 0.945, DMU 32 had a relatively lower R&BD performance for Performance B, with a score of 0.091 due to inefficient internal processes.
Figure 2 shows the difference between performances A and B. Although performances A and B had similar performance patterns, the scores for Performance B were generally lower than those for Performance A (the average scores for performances A and B were 0.375 and 0.166, respectively). In addition, five DMUs were considered to have achieved a best-practice status, which has the performance score of 1, in Performance A, but no DMUs were classified as best-practice in Performance B. The reason for the results shown in Figure 2 is that the proposed model measures performance more strictly than the conventional DEA model, through simultaneously considering both the technology securement and commercialization stages. More specifically, Performance B is obtained by multiplying the performance of the technology securement stage by the performance of the commercialization stage. Performance B can be 1 only if both of the performance scores of the technology stage and the commercialization stage are 1. Although performances A and B had similar performance patterns, several DMUs had significant changes in performance scores. For example, although DMUs 28 and 32 were regarded as best-practice DMUs in Performance A, with performance scores of 1, they had relatively low scores for Performance B, of 0.360 and 0.091, respectively.
Table 4 shows the performances scores from the technology securement and commercialization stages and their contributions to the R&BD performance. For example, with regard to DMU 4, which had a relatively lower R&BD performance (with a score of 0.115), Ej(C1) is greater than Ej(C2), and consequently, we can say that performance improvement in technology securement is important, but the strategy for performance improvement in the commercialization stage needs to be prioritized as well. We then looked at the R&BD performance scores of DMUs 31 and 32 again. DMU 31 had a relatively higher R&BD performance score with 0.945, and DMU 32 had a relatively lower R&BD performance score with 0.091; nonetheless, both DMUs 31 and 32 were classified as best-practice DMUs in Performance A, as shown in Table 3. The reason for this difference in their R&BD performances is that DMU 31 had relatively higher performance scores in both the technology securement and commercialization stages, but DMU 32 had relatively lower performance scores in the technology securement stage, with 0.091, even though it had the highest performance score in the commercialization stage, with 1. That is, DMU 32 had a low R&BD performance due to a relatively lower performance in the technology securement stage. For DMU 32 to improve its R&BD performance, it should focus on developing an effective strategy to increase R&D performance. The average performance scores of the technology securement and commercialization stages were 0.385 and 0.391, respectively. From the performance proportions (1 − IA(C1) and 1 − IA(C2)) in Table 4, we found that the average performance in the commercialization stage contributed to the R&BD performance slightly more than the average performance in the technology securement stage.
Figure 3 shows the DMUs located on a two-dimensional plane with two axes according to their technology securement and commercialization performances. DMUs were classified as high and low based on the average performances in the technology securement and commercialization stages (the average performance scores of the technology securement and commercialization stages for x axis and y axis were 0.385 and 0.391, respectively). The A area is a set of DMUs with relatively high performances in the commercialization and relatively low performances in technology securement. The B area is a set of DMUs with high performances in both technology securement and commercialization. The C area is a set of DMUs with low performances in both technology securement and commercialization. The D area is a set of DMUs with relatively high performances in technology securement and relatively low performances in commercialization. Only eight DMUs (16.3% of the total DMUs) had performance scores greater than the average in both the technology securement and commercialization stages, and 25 DMUs (51% of the total DMUs) had performance scores less than the average in both the technology securement and commercialization stages. In other words, more than 50% of the DMUs fall into the underperforming group, which has relatively low performances in both technology securement and commercialization. If DMUs in the A area try to improve their technology securement performances first, their R&DB performance can improve effectively. In contrast, the DMUs in the D area can improve their R&DB performance effectively by focusing on improving their commercialization performance.
Underperforming DMUs are able to improve their performance in each stage. Through Model (7), we can obtain guidelines on how much inputs have to decrease or outputs have to increase in order to improve the performance of underperforming DMUs. Table 5 provides guidelines for the 10 relatively most underperforming DMUs. As indicated in the table, if DMU 39 reduces its inputs (NR and RC) by two and 10, respectively, and increases its outputs (NTT and RT) by two and 273, respectively, it will achieve best-practice status in its R&BD performance.
4. Conclusions
R&BD generally consists of two internal processes, that is, the R&D process as technology securement and the BD process as commercialization. For a practical R&BD performance evaluation, a systematic approach that considers the relationship between the R&D and BD processes in evaluating R&BD performance is crucial. To this end, in this study, we proposed a two-stage network DEA-based systematic and simultaneous performance evaluation for R&BD that considered the relationship between its internal processes, such as R&D and BD processes, and provided effective performance improvement guidelines for relatively underperforming DMUs to help them establish an optimal strategy to increase their performance. We selected the number of researchers and R&D costs as R&BD inputs, the number of technology transfers, royalties, and foundations as R&BD outputs, and the number of secured technologies as intermediates (outputs of the R&D process and inputs of the BD process). We then compared the R&BD performance scores from the conventional DEA model and the proposed model, and showed that although both performance scores have similar patterns, the performance scores from the proposed model were generally lower than those from the conventional DEA model, as the proposed model measures performance more strictly than the conventional DEA model by simultaneously considering the technology securement and commercialization stages. In addition, we showed that the average performance in the commercialization stage of the BD process contributes to the overall R&BD performance slightly more than the average performance in the technology securement stage of the R&D process, and we provided effective performance improvement guidelines for underperforming DMUs. Consequently, we showed that the proposed method can be used as the basic approach for establishing public strategies for fostering R&BD.
Despite its valuable contributions, this study also has several limitations, which can be addressed in future research. First, we analyzed public research institutes and universities through an integrated evaluation of R&BD performance; however, this study lacks a specific and strategic plan for achieving improved performances. This study focused on the applicability of the two-stage network DEA, and we hope to present specific benchmark objectives in future research. Second, we did not perform a comparative analysis of performance differences among the groups based on the characteristics of the individual public research institutions and universities. Finally, we were unable to take into account the probabilistic volatility of the resource data or analyze the factors affecting R&BD performance for more robust performance evaluation and benchmarking; future research can address this issue by securing additional data.
Author Contributions
All of the authors discussed and proposed the statistical method, and designed the test plan. Jaehun Park and Joonyoung Kim accomplished the computation and wrote the paper; Si-Il Sung established the mathematical model and performed the validation of the analysis.
Conflicts of Interest
The authors declare no conflict of interest.
Abbreviations
The following abbreviations are used in this manuscript:
| DEA | Data Envelopment Analysis |
| R&D | Research and Development |
| BD | Business Development |
| R&BD | Research and Business Development |
Appendix A

Table A1.
The input, intermediate, and output data for 49 research organizations. NR: Number of researchers; RC: R&D costs; NST: Number of secured technologies; NTT: Number of technology transfers; RT: Royalties; NF: Number of foundations.
Table A1.
The input, intermediate, and output data for 49 research organizations. NR: Number of researchers; RC: R&D costs; NST: Number of secured technologies; NTT: Number of technology transfers; RT: Royalties; NF: Number of foundations.
| DMUs | Inputs | Intermediate | Outputs | |||
|---|---|---|---|---|---|---|
| NR | RC | NST | NTT | RT | NF | |
| 1 | 853 | 57,458 | 329 | 16 | 142 | 2 |
| 2 | 1445 | 58,178 | 497 | 28 | 565 | 1 |
| 3 | 850 | 49,844 | 283 | 40 | 129 | 1 |
| 4 | 1169 | 71,337 | 652 | 81 | 2553 | 10 |
| 5 | 3615 | 268,472 | 2762 | 184 | 3055 | 2 |
| 6 | 234 | 8875 | 58 | 10 | 23 | 1 |
| 7 | 2949 | 120,537 | 611 | 109 | 1022 | 20 |
| 8 | 532 | 156,407 | 698 | 117 | 3266 | 1 |
| 9 | 376 | 88,064 | 172 | 62 | 3941 | 1 |
| 10 | 450 | 43,453 | 130 | 34 | 280 | 1 |
| 11 | 64 | 1931 | 20 | 1 | 104 | 1 |
| 12 | 1645 | 87,393 | 694 | 145 | 1096 | 8 |
| 13 | 547 | 123,945 | 286 | 46 | 1968 | 1 |
| 14 | 2742 | 175,195 | 726 | 119 | 1699 | 2 |
| 15 | 704 | 19,359 | 171 | 15 | 68 | 6 |
| 16 | 2232 | 58,658 | 356 | 52 | 361 | 1 |
| 17 | 3454 | 72,719 | 478 | 76 | 620 | 1 |
| 18 | 123 | 10,260 | 227 | 46 | 390 | 1 |
| 19 | 639 | 106,092 | 1410 | 235 | 4022 | 1 |
| 20 | 2256 | 541,183 | 4984 | 1654 | 36,364 | 5 |
| 21 | 1528 | 65,694 | 487 | 109 | 1421 | 4 |
| 22 | 1331 | 131,787 | 438 | 46 | 433 | 1 |
| 23 | 1180 | 143,141 | 778 | 76 | 1179 | 10 |
| 24 | 853 | 67,543 | 513 | 54 | 1162 | 9 |
| 25 | 4713 | 467,657 | 1675 | 187 | 3911 | 42 |
| 26 | 7566 | 128,581 | 736 | 116 | 1452 | 2 |
| 27 | 89 | 558 | 16 | 8 | 15 | 3 |
| 28 | 276 | 102,329 | 409 | 102 | 7264 | 2 |
| 29 | 613 | 283,471 | 481 | 54 | 1417 | 2 |
| 30 | 674 | 6795 | 48 | 12 | 5 | 1 |
| 31 | 417 | 179,700 | 1450 | 716 | 7100 | 1 |
| 32 | 91 | 14,053 | 18 | 10 | 28 | 5 |
| 33 | 563 | 116,099 | 909 | 125 | 1,546 | 1 |
| 34 | 4467 | 182,476 | 861 | 168 | 4787 | 4 |
| 35 | 3718 | 104,900 | 664 | 71 | 843 | 5 |
| 36 | 444 | 31,605 | 298 | 14 | 10 | 2 |
| 37 | 544 | 50,921 | 392 | 75 | 289 | 2 |
| 38 | 233 | 8364 | 70 | 14 | 109 | 2 |
| 39 | 730 | 62,623 | 310 | 16 | 99 | 4 |
| 40 | 2662 | 114,102 | 845 | 113 | 1106 | 2 |
| 41 | 241 | 43,285 | 236 | 87 | 210 | 2 |
| 42 | 219 | 37,697 | 160 | 56 | 495 | 1 |
| 43 | 311 | 15,465 | 166 | 59 | 44 | 1 |
| 44 | 294 | 15,742 | 111 | 23 | 218 | 2 |
| 45 | 259 | 42,877 | 302 | 78 | 922 | 2 |
| 46 | 491 | 246,054 | 896 | 125 | 4788 | 1 |
| 47 | 705 | 211,998 | 518 | 45 | 1988 | 1 |
| 48 | 1698 | 179,774 | 931 | 160 | 3563 | 4 |
| 49 | 3538 | 237,000 | 1050 | 190 | 2898 | 2 |
Table A2.
The descriptive statistics of input, intermediate and output data for 49 research organizations.
Table A2.
The descriptive statistics of input, intermediate and output data for 49 research organizations.
| Resource | Max. | Min. | Ave. | Std. Dev. | |
|---|---|---|---|---|---|
| Inputs | NR | 7566 | 64 | 1374 | 1539.93 |
| RC | 541,183 | 558 | 110,442 | 110,654.27 | |
| Intermediate | NST | 4984 | 16 | 639 | 806.40 |
| Outputs | NTT | 1654 | 0 | 122 | 247.86 |
| RT | 36,364 | 5 | 2265 | 5290.35 | |
| NF | 42 | 1 | 4 | 6.54 | |
References
- Mojaveri, H.S.; Nosratabadi, H.E.; Farzad, H. A new model for overcoming technology transfer barriers in iranian health system. Int. J. Trade Econ. Financ. 2011, 2, 280–284. [Google Scholar] [CrossRef]
- Roxas, S.A.; Piroli, G.; Sorrentino, M. Efficiency & evaluation analysis of a network of technology transfer brokers. Technol. Anal. Strateg. Manag. 2011, 23, 7–24. [Google Scholar]
- Kerssens-van Drongelen, I.; Nixon, B.; Pearson, A. Performance measurement in industrial R&D. Int. J. Manag. Rev. 2000, 2, 111–143. [Google Scholar]
- Charnes, A.; Cooper, W.; Rhodes, E. Measuring the efficiency of decision making units. Eur. J. Oper. Res. 1978, 2, 429–444. [Google Scholar] [CrossRef]
- Anderson, T.R.; Daim, T.U.; Lavoie, F.F. Measuring the efficiency of university technology transfer. Technovation 2007, 27, 306–318. [Google Scholar] [CrossRef]
- Wang, E.C.; Huang, W. Relative efficiency of R&D activities: A cross-country study accounting for environmental factors in the dea approach. Res. Policy 2007, 36, 260–273. [Google Scholar]
- Sharma, S.; Thomas, V. Inter-country R&D efficiency analysis: An application of data envelopment analysis. Scientometrics 2008, 76, 483–501. [Google Scholar]
- Hsu, F.M.; Hsueh, C.C. Measuring relative efficiency of government-sponsored R&D projects: A three-stage approach. Eval. Progr. Plan. 2009, 32, 178–186. [Google Scholar]
- Lee, H.; Park, Y.; Choi, H. Comparative evaluation of performance of national R&D programs with heterogeneous objectives: A dea approach. Eur. J. Oper. Res. 2009, 196, 847–855. [Google Scholar]
- Kim, Y.H. The ivory tower approach to entrepreneurial linkage: Productivity changes in university technology transfer. J. Technol. Transf. 2013, 38, 180–197. [Google Scholar] [CrossRef]
- Jeon, I.; Lee, H. Performance evaluation of R&D commercialization: A dea-based three-stage model of R&BD performance. J. Korean Inst. Ind. Eng. 2015, 41, 425–438. (In Korean) [Google Scholar]
- Sexton, M.G.; Barrett, P.; Aouad, G. Diffusion mechanisms for construction research & innovation into small to medium sized construction firms. In CRISP-99/7; CRISP: London, UK, 1999. [Google Scholar]
- Bozeman, B.; Rimes, H.; Youtie, J. The evolving state-of-the-art in technology transfer research: Revisiting the contingent effectiveness model. Res. Policy 2015, 44, 34–49. [Google Scholar] [CrossRef]
- Min, J.W. Analysis of Success Factors About Technology Transfer and Commercialization of Public Institutes and University. Ph.D. Thesis, Korea University, Seoul, Korea, 2015. [Google Scholar]
- Kim, Y.H.; Lim, H.J. A study on the creative economy and diffusion of R&D. Korea Product. Assoc. 2013, 27, 285–307. (In Korean) [Google Scholar]
- Guan, J.; Chen, K. Measuring the innovation production process: A cross-region empirical study of China’s high-tech innovations. Technovation 2010, 3, 348–358. [Google Scholar] [CrossRef]
- Guan, J.; Wang, J. Evaluation and interpretation of knowledge production efficiency. Scientometrics 2004, 59, 131–155. [Google Scholar]
- Liu, J.S.; Lu, W.-M. Dea and ranking with the network-based approach: A case of R&D performance. Omega 2010, 38, 453–464. [Google Scholar]
- Guan, J.; Chen, K. Modeling the relative efficiency of national innovation systems. Res. Policy 2012, 41, 102–115. [Google Scholar] [CrossRef]
- Schmidt, P. Production frontier functions. Econ. Rev. 1985, 4, 289–328. [Google Scholar] [CrossRef]
- Ray, S.C. Data Envelopment Analysis-Theory and Techniques for Economics and Operations Research; Cambridge University Press: New York, NY, USA, 2004. [Google Scholar]
- Banker, R.D. Maximum likelihood, consistency, and data envelopment analysis: A statistical foundation. Manag. Sci. 1993, 39, 1265–1273. [Google Scholar] [CrossRef]
- Simar, L. Estimating efficiencies from frontier models with panel data: A comparison of parametric, non-parametric and semi-parametric methods with bootstrapping. In International Applications of Productivity and Efficiency Analysis; Springer: Dordrecht, The Netherlands, 1992; pp. 167–199. [Google Scholar]
- Simar, L.; Wilson, P.W. Sensitivity analysis of efficiency scores: How to bootstrap in nonparametric frontier models. Manag. Sci. 1998, 44, 49–61. [Google Scholar] [CrossRef]
- Simar, L.; Wilson, P.W. A general methodology for bootstrapping in non-parametric frontier models. J. Appl. Stat. 2000, 27, 779–802. [Google Scholar] [CrossRef]
- Simar, L.; Wilson, P.W. Estimation and inference in two-stage, semi-parametric models of production processes. J. Econ. 2007, 136, 31–64. [Google Scholar] [CrossRef]
- Ahn, T.S. Efficiency and Related Issues in Higher Education: A Data Envelopment Analysis Approach. Ph.D. Thesis, University of Texas at Austin, Austin, TX, USA, 1987. [Google Scholar]
- Beasley, J.E. Comparing university departments. OMEGA Int. J. Manag. Sci. 1990, 18, 171–183. [Google Scholar] [CrossRef]
- Shcefczyk, M. Operational performance of airlines: An extension of traditional measurement paradigms. Strateg. Manag. J. 1993, 14, 301–317. [Google Scholar] [CrossRef]
- Pina, V.; Torres, L. Evaluating the efficiency of nonprofit organizations: An application of data envelopment analysis to public health service. Financ. Account. Manag. 1992, 8, 213–224. [Google Scholar] [CrossRef]
- Park, J.; Lee, D.; Zhu, J. An integrated approach for ship block manufacturing process performance evaluation: Case from a Korean shipbuilding industry. Int. J. Prod. Econ. 2014, 156, 214–222. [Google Scholar] [CrossRef]
- Park, J.; Bae, H.; Dinh, T.-C.; Ryu, K. Operator allocation in cellular manufacturing system by integrated genetic algorithm and fuzzy-data envelopment analysis. Int. J. Adv. Manuf. Technol. 2014, 75, 464–477. [Google Scholar] [CrossRef]
- Park, J.; Bae, H.; Bae, J. Cross-evaluation based multi-criteria ABC inventory classification. Comput. Ind. Eng. 2014, 76, 40–48. [Google Scholar] [CrossRef]
- Kao, C.; Hwang, S.N. Efficiency decomposition in two-stage data envelopment analysis: An application to non-life insurance companies in Taiwan. Eur. J. Oper. Res. 2008, 196, 1107–1112. [Google Scholar] [CrossRef]
- Bonaccorsi, A.; Daraio, C. A robust nonparametric approach to the analysis of scientific productivity. Res. Eval. 2003, 12, 47–69. [Google Scholar] [CrossRef]
- Meng, W.; Zhang, D.; Qi, L.; Liu, W. Two level DEA approaches in Research Evaluation. Omega 2008, 36, 950–957. [Google Scholar] [CrossRef]
Figure 1.
Two-stage structure of research and business development (R&BD) performance. R&D: research and development; BD: business development.
Figure 1.
Two-stage structure of research and business development (R&BD) performance. R&D: research and development; BD: business development.
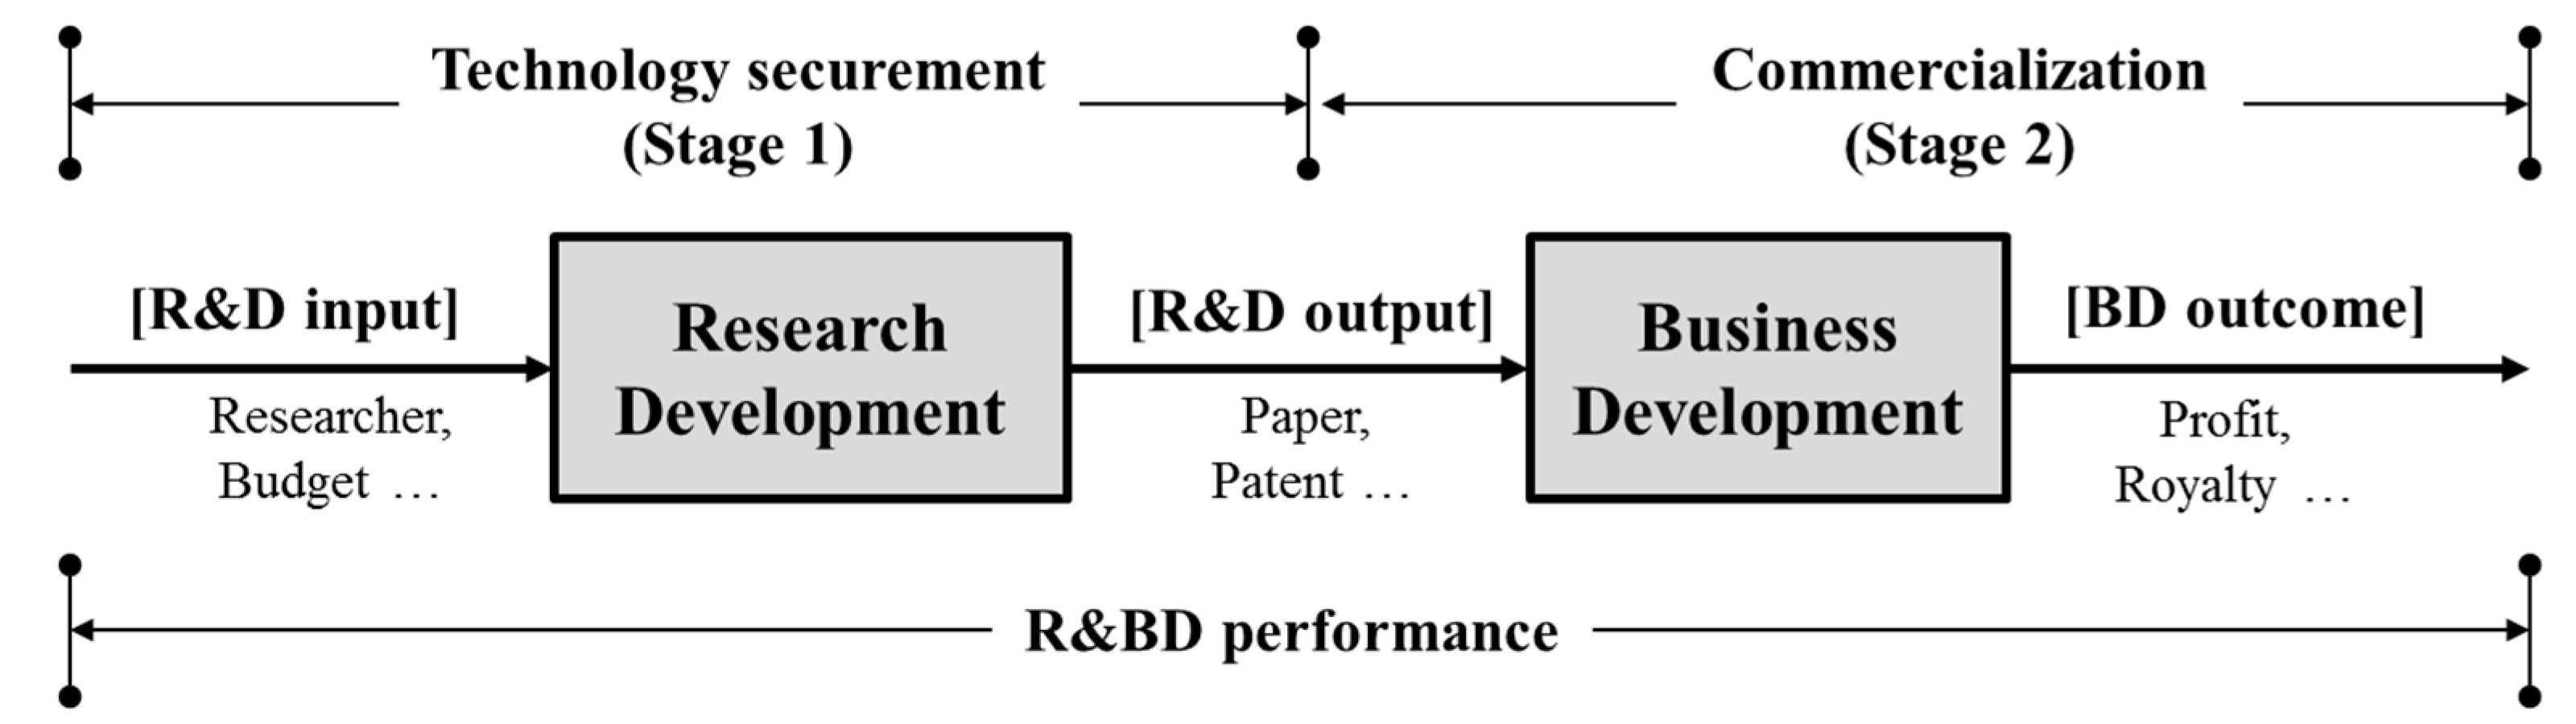
Figure 2.
Comparison of the average performance scores of A and B.

Figure 3.
Technology securement and commercialization performances on a two-dimentional plane.
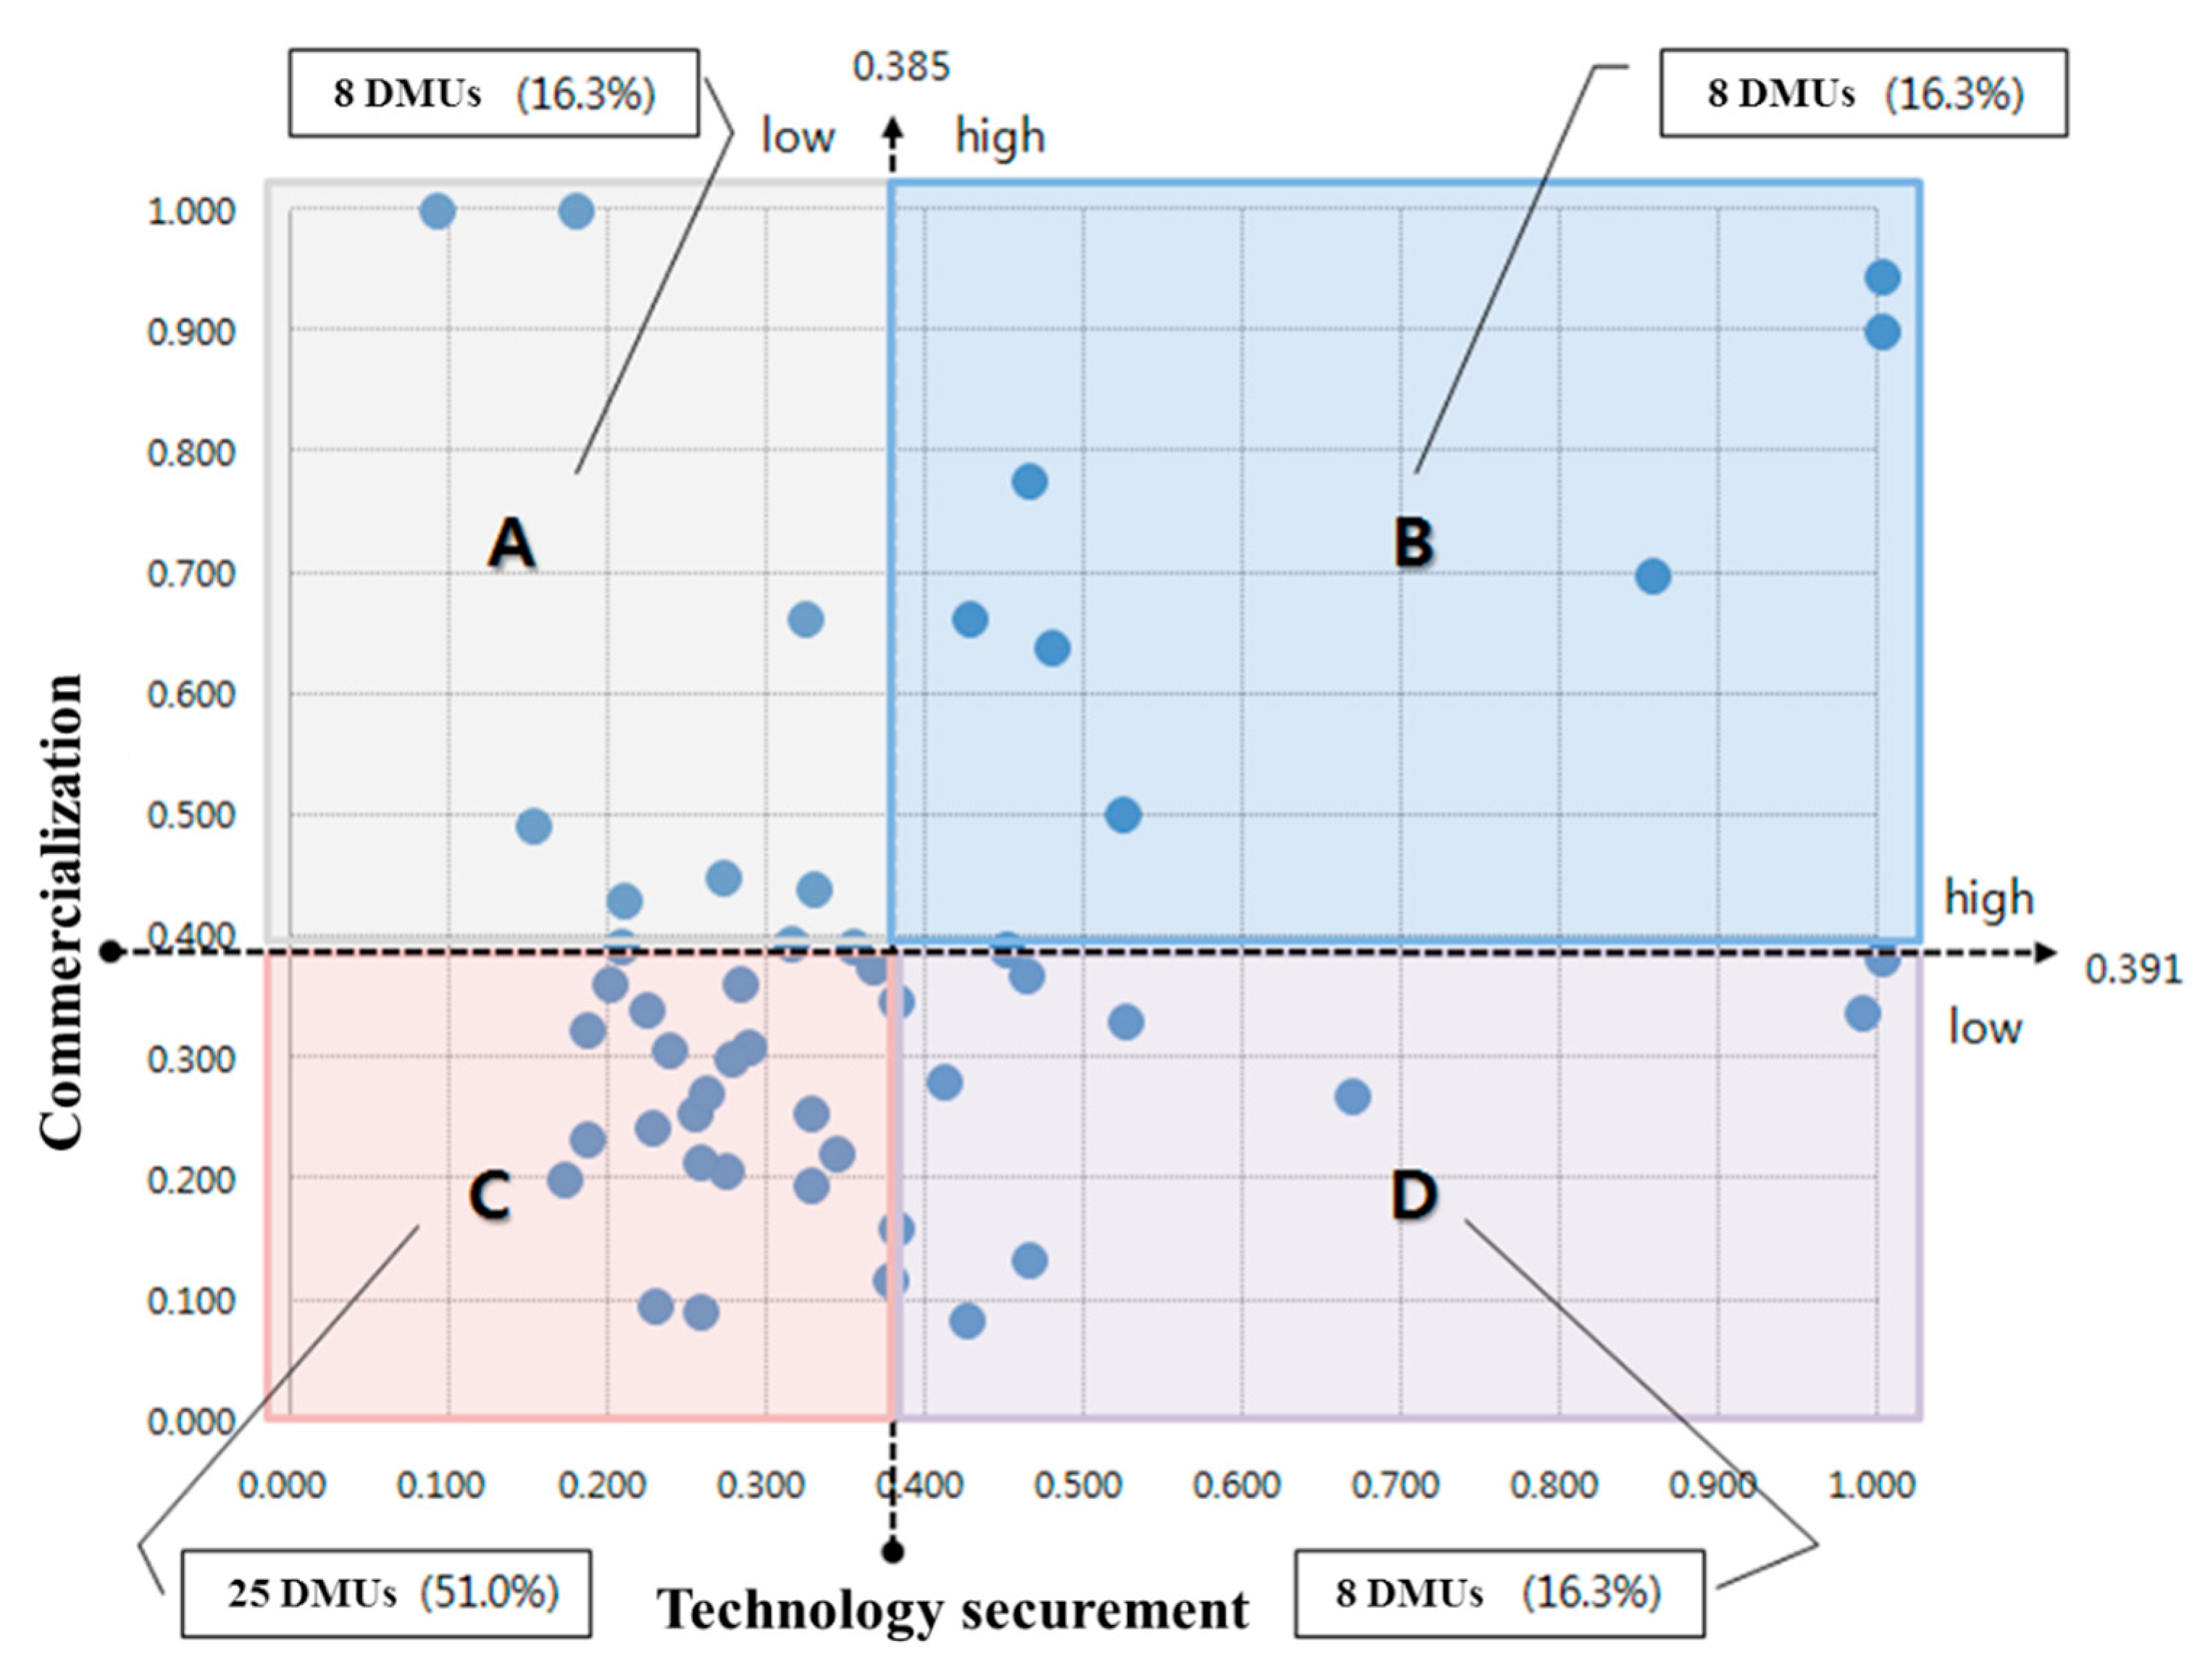
Table 1.
Sample data. DMU: decision-making units.
| DMU | R&D Inputs | R&D Output | BD Outcome | Results | |||||
|---|---|---|---|---|---|---|---|---|---|
| X1 | X2 | Y1 | Q2 | R&BD Performance | Ej(C1) | Ej(C2) | (1 − IA(C1)) | (1 − IA(C2)) | |
| A | 20 | 40 | 100 | 170 | 1.00 | 1.00 | 1.00 | 1.00 | 1.00 |
| B | 40 | 20 | 100 | 120 | 0.71 | 1.00 | 0.71 | 1.00 | 0.00 |
| C | 30 | 60 | 100 | 170 | 0.67 | 0.67 | 1.00 | 0.00 | 1.00 |
| D | 50 | 60 | 100 | 150 | 0.48 | 0.55 | 0.88 | 0.12 | 0.88 |
| E | 60 | 30 | 100 | 100 | 0.39 | 0.67 | 0.59 | 0.45 | 0.55 |
| F | 60 | 40 | 100 | 130 | 0.46 | 0.60 | 0.76 | 0.26 | 0.74 |
| G | 70 | 70 | 100 | 150 | 0.38 | 0.43 | 0.88 | 0.08 | 0.92 |
Table 2.
Sensitivity analysis for DMU G to improve performance.
| X1 | X2 | R&BD Performance | Q2 | R&BD Performance |
|---|---|---|---|---|
| 70 | 70 | 0.378 | 150 | 0.378 |
| 60 | 60 | 0.441 | 160 | 0.403 |
| 50 | 50 | 0.529 | 170 | 0.429 |
| 40 | 40 | 0.662 | 180 | 0.429 |
| 30 | 30 | 0.882 | 190 | 0.429 |
| 20 | 20 | 0.882 | 200 | 0.429 |
| 10 | 10 | 0.882 | 210 | 0.429 |
Table 3.
Comparison of the performance scores of A and B.
| DMU | 1 | 2 | 3 | 4 | 5 | 6 | 7 | 8 | 9 | 10 |
| Performance A | 0.073 | 0.146 | 0.162 | 0.527 | 0.180 | 0.202 | 0.210 | 0.325 | 0.632 | 0.173 |
| Performance B | 0.024 | 0.044 | 0.065 | 0.115 | 0.062 | 0.089 | 0.076 | 0.171 | 0.179 | 0.075 |
| DMU | 11 | 12 | 13 | 14 | 15 | 16 | 17 | 18 | 19 | 20 |
| Performance A | 0.817 | 0.327 | 0.228 | 0.166 | 0.236 | 0.145 | 0.164 | 0.973 | 0.639 | 1.000 |
| Performance B | 0.175 | 0.139 | 0.082 | 0.060 | 0.061 | 0.071 | 0.083 | 0.383 | 0.334 | 0.599 |
| DMU | 21 | 22 | 23 | 24 | 25 | 26 | 27 | 28 | 29 | 30 |
| Performance A | 0.364 | 0.079 | 0.243 | 0.339 | 0.244 | 0.186 | 1.000 | 1.000 | 0.149 | 0.170 |
| Performance B | 0.144 | 0.034 | 0.064 | 0.076 | 0.043 | 0.073 | 0.900 | 0.360 | 0.055 | 0.122 |
| DMU | 31 | 32 | 33 | 34 | 35 | 36 | 37 | 38 | 39 | 40 |
| Performance A | 1.000 | 1.000 | 0.280 | 0.384 | 0.134 | 0.130 | 0.325 | 0.306 | 0.133 | 0.200 |
| Performance B | 0.945 | 0.091 | 0.179 | 0.090 | 0.057 | 0.036 | 0.132 | 0.138 | 0.022 | 0.084 |
| DMU | 41 | 42 | 43 | 44 | 45 | 46 | 47 | 48 | 49 | |
| Performance A | 0.479 | 0.352 | 0.740 | 0.305 | 0.461 | 0.399 | 0.139 | 0.296 | 0.202 | |
| Performance B | 0.283 | 0.214 | 0.305 | 0.124 | 0.262 | 0.173 | 0.055 | 0.102 | 0.072 |
Table 4.
Performance scores in the technology securement and commercialization stages.
| DMU | 1 | 2 | 3 | 4 | 5 | 6 | 7 | 8 | 9 | 10 | 11 | 12 | 13 |
| Ej(C1) | 0.257 | 0.376 | 0.254 | 0.409 | 0.464 | 0.287 | 0.223 | 0.463 | 0.179 | 0.151 | 0.449 | 0.354 | 0.208 |
| Ej(C2) | 0.092 | 0.117 | 0.255 | 0.281 | 0.135 | 0.310 | 0.340 | 0.369 | 1.000 | 0.494 | 0.391 | 0.392 | 0.393 |
| 1 − IA(C1) | 0.544 | 0.575 | 0.483 | 0.519 | 0.602 | 0.468 | 0.44 | 0.493 | 0.000 | 0.356 | 0.477 | 0.448 | 0.413 |
| 1 − IA(C2) | 0.456 | 0.425 | 0.517 | 0.481 | 0.398 | 0.532 | 0.56 | 0.507 | 1.000 | 0.644 | 0.523 | 0.552 | 0.587 |
| DMU | 14 | 15 | 16 | 17 | 18 | 19 | 20 | 21 | 22 | 23 | 24 | 25 | 26 |
| Ej(C1) | 0.186 | 0.381 | 0.261 | 0.277 | 1.000 | 0.988 | 0.856 | 0.328 | 0.172 | 0.326 | 0.343 | 0.185 | 0.236 |
| Ej(C2) | 0.325 | 0.160 | 0.273 | 0.300 | 0.383 | 0.338 | 0.699 | 0.440 | 0.200 | 0.196 | 0.221 | 0.233 | 0.308 |
| 1 − IA(C1) | 0.438 | 0.56 | 0.478 | 0.47 | 1.000 | 0.973 | 0.456 | 0.416 | 0.482 | 0.528 | 0.523 | 0.474 | 0.457 |
| 1 − IA(C2) | 0.562 | 0.44 | 0.522 | 0.53 | 0.000 | 0.027 | 0.544 | 0.584 | 0.518 | 0.472 | 0.477 | 0.526 | 0.543 |
| DMU | 27 | 28 | 29 | 30 | 31 | 32 | 33 | 34 | 35 | 36 | 37 | 38 | 39 |
| Ej(C1) | 1.000 | 0.464 | 0.226 | 0.272 | 1.000 | 0.091 | 0.667 | 0.208 | 0.273 | 0.424 | 0.381 | 0.367 | 0.229 |
| Ej(C2) | 0.900 | 0.776 | 0.244 | 0.450 | 0.945 | 1.000 | 0.269 | 0.432 | 0.208 | 0.085 | 0.348 | 0.376 | 0.096 |
| 1 − IA(C1) | 1.000 | 0.211 | 0.480 | 0.399 | 1.000 | 0.000 | 0.643 | 0.395 | 0.507 | 0.605 | 0.478 | 0.459 | 0.534 |
| 1 − IA(C2) | 0.000 | 0.789 | 0.520 | 0.601 | 0.000 | 1.000 | 0.357 | 0.605 | 0.493 | 0.395 | 0.522 | 0.541 | 0.466 |
| DMU | 40 | 41 | 42 | 43 | 44 | 45 | 46 | 47 | 48 | 49 | AVG. | ||
| Ej(C1) | 0.327 | 0.426 | 0.323 | 0.477 | 0.314 | 0.523 | 0.525 | 0.256 | 0.281 | 0.199 | 0.385 | ||
| Ej(C2) | 0.256 | 0.664 | 0.664 | 0.640 | 0.395 | 0.502 | 0.331 | 0.214 | 0.363 | 0.362 | 0.391 | ||
| 1 − IA(C1) | 0.503 | 0.296 | 0.281 | 0.324 | 0.436 | 0.435 | 0.538 | 0.500 | 0.443 | 0.425 | 0.489 | ||
| 1 − IA(C2) | 0.497 | 0.704 | 0.719 | 0.676 | 0.564 | 0.565 | 0.462 | 0.500 | 0.557 | 0.575 | 0.511 | ||
Table 5.
Guidelines for performance improvement of the 10 most underperforming DMUs.
| DMU | |||||
|---|---|---|---|---|---|
| 39 | 2 | 10 | 2 | 273 | - |
| 1 | 1 | 7 | - | 200 | - |
| 22 | 2 | 14 | - | 574 | - |
| 36 | 1 | 6 | - | 288 | - |
| 25 | 16 | 103 | - | 0 | - |
| 2 | 1 | 9 | - | 46 | - |
| 29 | 3 | 21 | 11 | 0 | - |
| 47 | 4 | 27 | 46 | 0 | - |
| 35 | 4 | 26 | - | 695 | - |
| 14 | 6 | 36 | - | 909 | - |
© 2017 by the authors. Licensee MDPI, Basel, Switzerland. This article is an open access article distributed under the terms and conditions of the Creative Commons Attribution (CC BY) license (http://creativecommons.org/licenses/by/4.0/).
Share and Cite
MDPI and ACS Style
Park, J.; Kim, J.; Sung, S.-I. Performance Evaluation of Research and Business Development: A Case Study of Korean Public Organizations. Sustainability 2017, 9, 2297. https://doi.org/10.3390/su9122297
AMA Style
Park J, Kim J, Sung S-I. Performance Evaluation of Research and Business Development: A Case Study of Korean Public Organizations. Sustainability. 2017; 9(12):2297. https://doi.org/10.3390/su9122297
Chicago/Turabian StylePark, Jaehun, Joonyoung Kim, and Si-Il Sung. 2017. "Performance Evaluation of Research and Business Development: A Case Study of Korean Public Organizations" Sustainability 9, no. 12: 2297. https://doi.org/10.3390/su9122297
Note that from the first issue of 2016, this journal uses article numbers instead of page numbers. See further details here.