1. Introduction
Haze, as a threat to human health, has been a hot topic that greatly raises public concern after the serious fine particulate matter (PM2.5) event at the end of October 2011 in China. Especially, the blue sky during the APEC conference in Beijing revived people’s confidence in haze management. Meanwhile, heavy-polluting enterprises were exposed to the public. Much of the negative social concern forced heavy-polluting enterprises to lower their accounting book data and take downward earnings management to reduce corporate exposure.
Rohde [
1] studied the causes of haze in Beijing and pointed out that most haze pollutions are attributed to heavy industrial districts nearby with a small proportion attributed to local factories. It is worth mentioning that accounting information is one of the important means through which the public can evaluate whether a heavy-polluting enterprise is “the heartless rich” and failed to commit to the social and environmental responsibilities. Therefore, accounting information disclosure of heavy-polluting enterprises is extremely important. It is not only the basis for making accurate judgment whether they have illegal operations, but also one of the critical references for policy implementation. Therefore, accounting information has attracted extensive attention from scholars, society and government. The public is concerned about whether heavy-polluting enterprises are “the heartless rich” and whether they have fulfilled social responsibilities in environmental protection practically, while scholars pay more and more attention to the authenticity of the disclosed information. Using the breakpoint regression model, Guo et al. [
2] tested whether heavy-polluting enterprises adopted obvious earnings management measures before and after the launch of the control policy for them in 2010 under the influence of air pollution during 2008–2012, and found that heavy-polluting enterprises have adopted downward earnings management when Air Pollution Indexes (APIs) were 100, 200 and 300. Liu et al. [
3] discussed the influence of haze-induced political cost on earnings management of heavy-polluting enterprises through the exogenous PM
2.5 event, and found that the experimental groups adopted downward earnings management measures after the event to avoid social and government attention.
As discussed above, most of the previous studies based on the serious PM
2.5 event focus on the influence of haze on the heavy-polluting enterprises. The previous studies explore the relationship between haze and the quality of accounting information disclosure of heavy-pollution enterprises from the perspective of political costs. In comparison, our study chooses a different approach to study this problem; that is, from the perspective of public pressure. Because the PM
2.5 event broke out suddenly and people had little knowledge of haze, public attention on haze has only put small pressure on heavy-polluting enterprises. Hence, PM
2.5 is inapplicable as the exogenous event of this study. By contrast, the occurrence of “APEC Blue” in 2014 raised the public awareness and drew people’s attention to hazy weather. The present study discussed the influence of haze on the quality of accounting information disclosure of listed heavy-polluting enterprises under negative social attention based on earnings management changes before and after the “APEC Blue”. After studying the impacts of the rich list on accounting information disclosure of enterprises, Ye et al. [
4] pointed out that negative social attention would influence the quality of disclosed accounting information from enterprises to some extent. Recently, the public has been paying attention to some heavy-polluting enterprises after their environmental pollution behavior was disclosed by social media. The public will label a company as “the heartless rich” if they earn high profits but produce a large amount of pollution. The public will also resist the products produced by those enterprises. Therefore, these heavy-polluting enterprises keep a “reasonably” low profile and sacrifice the quality of disclosed information, especially the profit information, aiming to avoid being labeled by the public as “seeking happiness at the cost of causing pain to the public”.
In addition, the present study discussed the earnings management of heavy-polluting enterprises from the new perspective of negative social attention. Therefore, our conclusions are of strong theoretical and practical significance, especially to the research on the motivation of earnings management of heavy-polluting enterprises. In the present study, heavy-polluting enterprises were divided into three categories according to different motivations of earnings management. Our results provide important implications for future research, especially by providing references for researchers to identify heavy-polluting enterprises that may significantly reduce the accounting information quality. Our study will therefore improve the accuracy and reliability of follow-up empirical studies based on the accounting information. Moreover, our research will contribute to the study on the authenticity of accounting information disclosure, which is helpful for related authorities to formulate air pollution control policies.
The rest of this paper is organized as follows.
Section 2 outlines the theoretical analysis and research hypotheses.
Section 3 describes the method of the empirical research, which involves sample selection, data collection, model development and definition of variables, while the empirical results and analysis are presented in
Section 4.
Section 5 summarizes and concludes with suggestions for future research.
2. Theoretical Analysis and Research Hypotheses
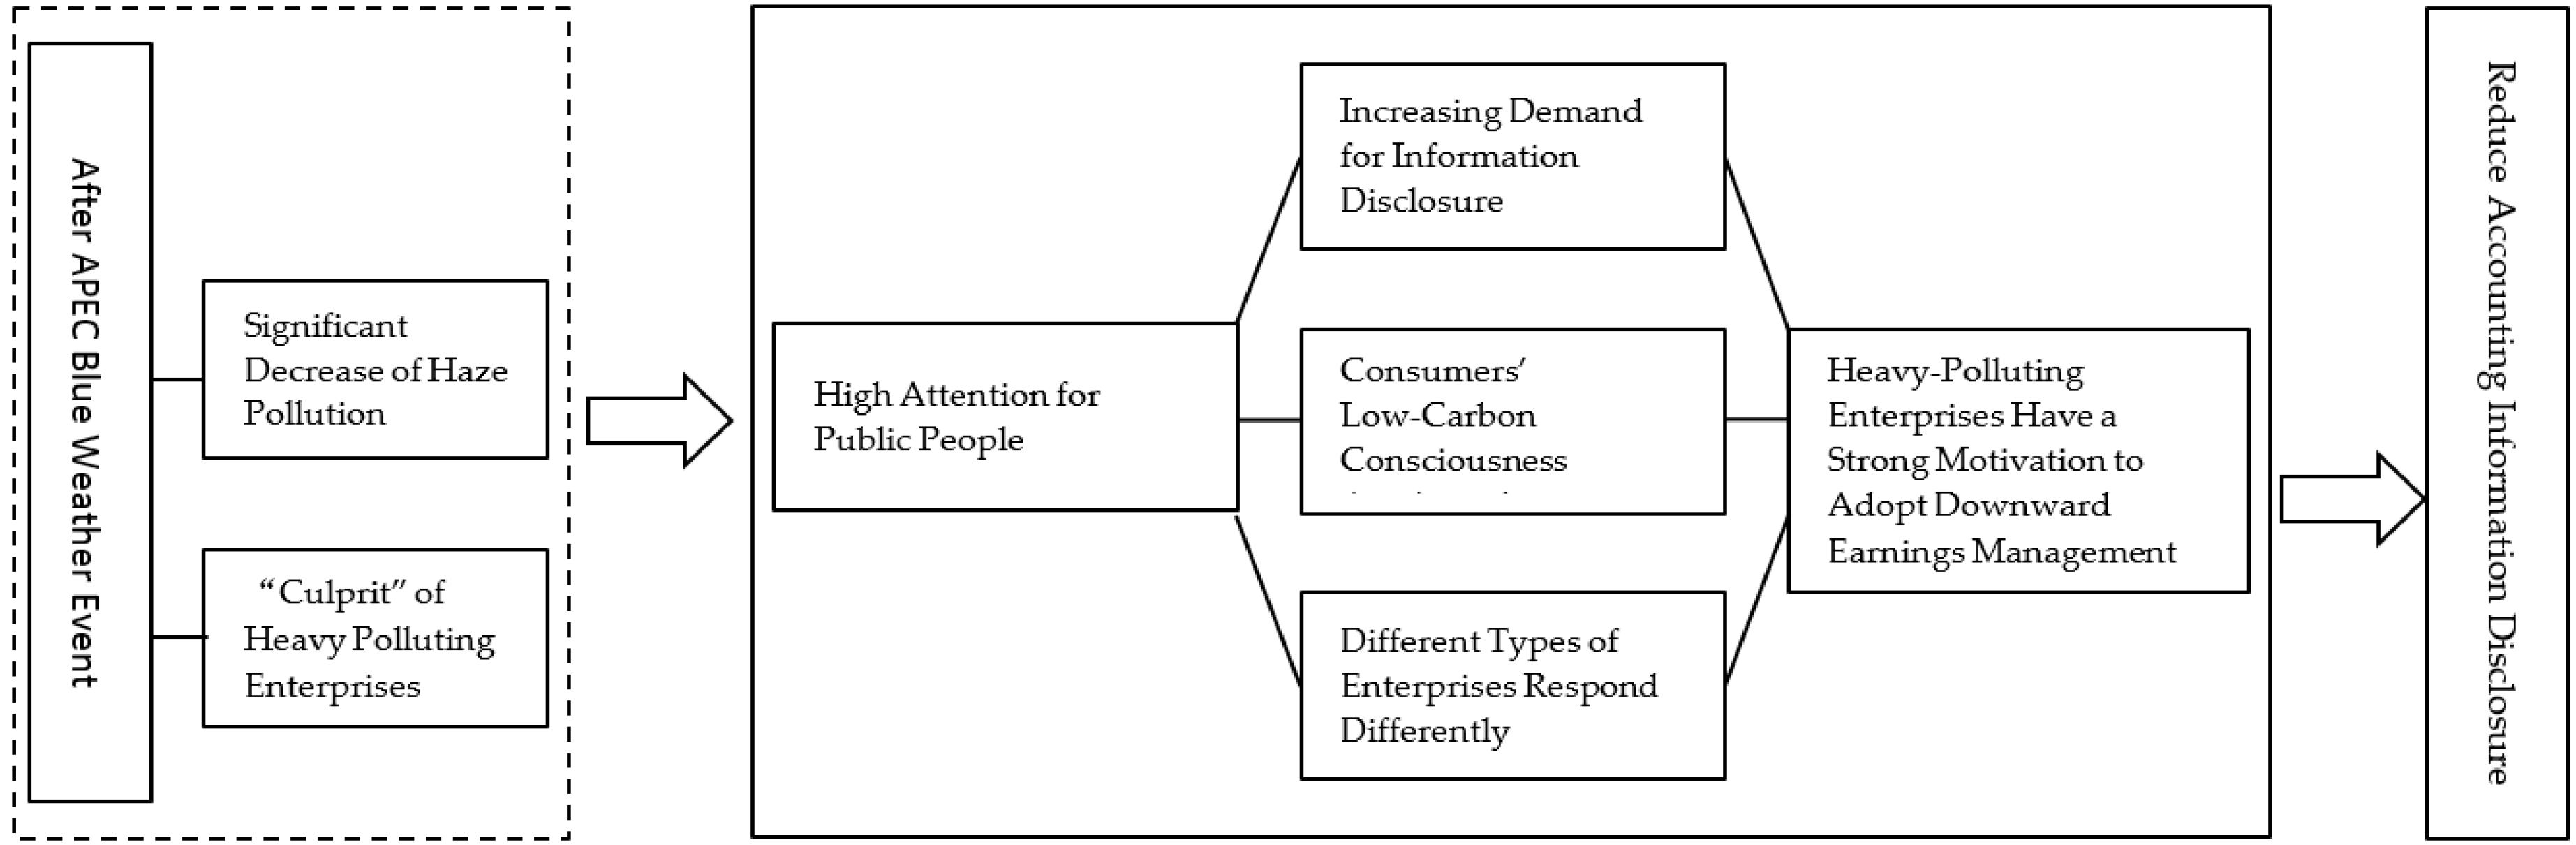
Social attention on haze has brought pressure to all sections of society, causing heavy-polluting enterprises to reduce the quality of accounting information disclosure. After the “APEC Blue” event, those heavy-polluting enterprises asked to halt production during the APEC meeting are highly concerned by local public. These enterprises are considered as the “culprit” of local hazy weather and are therefore strongly suppressed by the local public. Thus, reducing negative social attention becomes the primary motivation for earnings management of heavy-polluting enterprises. Heavy-polluting enterprises with high profits are “highlighted” which attract wide attention of the public and government. Such high profits of heavy-polluting enterprises, with the image of “culprit” for air pollution, are viewed as “ill-gotten gains” by the public. Due to the development of Internet, both capital market and the public’s low-carbon consciousness result in the high demand for enterprise information disclosure. In the present study, the theoretical analysis of the relationship between social pressure caused by haze and accounting information disclosure of heavy-polluting enterprises from the perspective of earnings management involves the growth in the demand for accounting information disclosure, the increase of consumers’ low-carbon consciousness [
5,
6] and differences in the amount of attention on enterprises of different properties and scales. The influence mechanism of haze-induced social pressure on accounting information disclosure quality of heavy-polluting enterprises is shown in
Figure 1.
Firstly, since heavy polluting-enterprises are unwilling to face the increasing demand for accounting information disclosure caused by haze, they have a strong intention to control earnings after the “APEC Blue” to avoid increasing other costs caused by excessive social attention. When studying the social responsibility of information disclosure of enterprises, Dan [
7] pointed out that China’s heavy-polluting enterprises are passive in disclosing information and believe that relevant information disclosure to the public will increase the costs of enterprises. Liu et al. [
3] reported that high-quality accounting information disclosure and high profit are easier to make heavy-polluting enterprises more transparent and consequently disclose problems of other enterprises. Subsequently, social media will make deep investigations and reports, further increasing social attention on enterprises. To decrease the negative social attention caused by haze and meet the increasing demand for information disclosure, enterprises have a strong motivation to adopt downward earnings management to reduce book profit. Downward earnings management can cope with the growth of information disclosure demand caused by haze and reduce negative social attention on their production management. In other words, enterprises successfully gain sympathy from the public through downward earnings management, which can not only relieve negative social attention and suppression, but also effectively avoid control from relevant governmental authorities. These enterprises can even obtain certain subsidies for environmental protection. Hence, based on the theory of enterprise information disclosure, a hypothesis (H1) is proposed as follows:
Hypothesis (H1). Heavy-polluting enterprises have a strong motivation to reduce the quality of accounting information disclosure after the “APEC Blue” event and adopt downward earnings management to reduce social attention and meet the increasing information disclosure demand.
Secondly, consumers’ low-carbon consciousness is awakening. Social pressure on heavy-polluting enterprises will directly influence consumers’ demand for their products. Heavy-polluting enterprises that are directly related with consumers (e.g., cloth and shoes manufacturers) have a strong motivation to adopt downward earnings management and create a corporate image of “low profits but quick turnover”, aiming to avoid large-scale consumer boycott against their products because of their heavy pollution. As the intensification of hazy weather which causes serious threats to the public’s living quality, people’s “indignation” for haze reaches the peak. They begin to actively look out for environmental pollution behavior of local heavy-polluting enterprises and publicize it through network propaganda and large-scale protest. With the enhancing low-carbon consciousness of consumers, people concern more on green production techniques [
8] and the fulfillment of enterprises’ social responsibilities in environmental protection [
9,
10]. When heavy-polluting enterprises are labeled as the “heartless rich”, they will face abundant negative attention from consumers, which will bring great pressure to their future production development. Moreover, such negative attention from consumers is likely to disclose more improper acts from the enterprises if there is any, and even results in real-time monitoring, hefty fine or forced shutdown from relevant department. To leave a good impression with consumers, heavy-polluting enterprises that are directly related with consumers have to create a corporate image of actively fulfilling environmental protection responsibilities and avoid consumers’ attention caused by the sharp contrast and association between high profits and heavy pollution. Taken together, based on the theory of green consumption, the second hypothesis (H2) is proposed as follows:
Hypothesis (H2). Heavy-polluting enterprises that are directly related to consumers have a strong motivation to reduce accounting information disclosure quality after the “APEC Blue” event and adopt downward earnings management to retain consumers’ loyalty.
Finally, heavy-polluting enterprises with different properties and scales will receive different levels of social attention and are thereby motivated to different degrees for earnings management. Large-sized enterprises are easier to attract public attention than small-sized ones. In other words, the public expects a higher social responsibility from large-sized enterprises, compared to small-sized ones. The western scale hypothesis postulates that large-sized enterprises have a stronger motivation to conceal huge profits and prefer downward earnings management to relieve attention from government departments with the increase of government cost. As a large-scale experiment of haze control in China, “APEC Blue” has achieved considerable effects. It enhances the confidence of environmental protection departments in haze control and provides the government with an explicit management direction. Therefore, large-sized enterprises would keep a reasonably “low profile” to avoid public attention after the “APEC Blue” event. They protect their production and operation from increasing political costs through the downward earnings management. In terms of enterprise properties, compared to non-state-owned enterprises, state-owned enterprises have certain advantages in government-enterprise relationship and financing. Besides, they possess rich resources and subsidies, enabling them to cope with the increasing cost caused by environmental regulation [
11]. Most environmental regulations are to restrict non-state-owned enterprises, so they will face higher political costs and more social attention. Therefore, non-state-owned enterprises have a stronger motivation of earnings management than state-owned enterprises when coping with public pressure and government regulations caused by haze [
12,
13]. Hence, based on the theory of political cost and the theory of enterprise scale, the third and fourth hypotheses (H3 and H4) are proposed as follows:
Hypothesis (H3). Large-sized heavy-polluting enterprises have a strong motivation to adopt downward earnings management to avoid unnecessary political cost and social attention after the “APEC Blue” event.
Hypothesis (H4). Non-state-owned heavy-polluting enterprises have a stronger motivation to decrease accounting information disclosure quality and adopt downward earnings management to avoid unnecessary political cost and social attention after the “APEC Blue” event.
3. Research Method
3.1. Sample Selection and Data Source
Considering the data availability, the sample interval is set at 2012–2016. According to settings of difference-in-difference model, heavy-polluting enterprises are used as the experimental group and non-heavy-polluting enterprises are used as the control group based on the “APEC Blue” event. Heavy-polluting enterprises are divided according to Announcement on Special Emission Limit of Atmospheric Pollutants (hereinafter referred as Announcement), which covers the industries of thermal power, steel, petrifaction, cement, nonferrous metals and chemical engineering. Non-heavy-polluting enterprises are divided according to Guideline for Industrial Classification of Listed Companies of China Securities Regulatory Commission revised by Liu et al. in 2012. The remaining listed companies in the same category of heavy-polluting enterprises are considered as non-heavy-polluting enterprises. A total of 417 enterprises are selected, including 204 heavy-polluting enterprises and 213 non-heavy-polluting enterprises. A further selection is conducted to ensure the complete disclosed enterprises data: (1) enterprise samples with poor and missing financial data and ST enterprises are eliminated; and (2) enterprise samples with obvious business crossing over the heavy-polluting enterprises and non-heavy-polluting enterprises are eliminated. Finally, there are in total 1205 available observation data points, including those for 204 heavy-polluting enterprises and 205 non-heavy-polluting enterprises. All data are collected from the Wonder Database and the missing enterprise data is supplemented manually from disclosed information in the enterprises’ annual reports.
3.2. Model Setting and Definition of Variables
3.2.1. Measurement Model of Earnings Management
The early studies of earnings management mostly employed the basic Jones model [
14]. Later, scholars found that the modified Jones model can recognize accruable earnings management and estimate operating accruable profit better in panel data classified by industries. In the present study, earnings management quality indexes are estimated by the basic Jones model. In addition, the annual regression of industries is accomplished based on the cross-sectional modified Jones model. The annual non-operating accruable profit and operating profits of enterprises are established according to estimation parameters, and the earnings management index is measured by operating accruable profit [
15]. Therefore, earnings management is measured by the basic Jones model and the modified Jones model, resulting in indexes EM1 and EM2.
The basic Jones model is:
where
is the non-operating accruable profits of the listed company
i after the final total assets of
t − 1 period,
is the final total assets of company
i of the
t − 1 period,
is the changes of sales revenue of company i in the current year and the last year after t period, and
is the original value of fixed assets at t period. Based on the annual regulations of different industries, the estimation parameters
are gained and brought into Equation (1b), producing the total profits of the year (
). The model is:
Equations (1a) and (1b) are calculated and the results are put into Equation (1c) for regression, thus EM1 can be gained as:
The modified Jones model is:
where
is the receivables difference of company
i between the end of
t period and the end of last period. The other variables have the same meaning as the variables in the basic Jones model. In comparison, the receivables difference (
) is deducted from the sales revenue of company (
) in the modified Jones. Based on the annual regulations of different industries, the estimation parameters
are gained and brought into Equation (2b), producing the total profits of the year (
). The model is:
Equations (2a) and (2b) are calculated and the results are put into (2c) for regression, thus EM2 can be gained as:
3.2.2. Empirical Model
A difference-in-difference (DID) model is built to verify the proposed hypotheses. Settings of the DID model are similar with those in Bertrant [
16] and Hanlon et al. [
17]. Bertrant pointed out that the DID model can effectively avoid mixing effects of other events on time sequences and recognize causal relationships of variables. It is widely used in empirical studies. The DID model can be expressed as:
In Model 2, is a dependent variable covering and , which is substituted into models during test and stands for the earnings management index. and independent variables. is an indicator variable set according to hypothesis, with 1 for the experimental group and 0 for the control group. is an indicator variable that distinguishes before and after the “APEC Blue” event, with 1 indicating before the event and 0 after the event. is the interaction term of two variables and its regression coefficient is the main observation data of the present study. It reflects whether the experimental group (heavy-polluting enterprises) after the event (“APEC Blue”) has a stronger motivation to control accruable profits and adopt significantly downward earnings management than the control group (non-heavy-polluting enterprises) before the event. According to proposed hypotheses, is expected to be negative in the present study. Other variables are control variables, including scale of company (), age of listed company (), leverage ratio (), growth opportunity () and avoiding loss ().
3.2.3. Definitions of Variables
(1) Explained Variables
Earnings management (EM): It is measured by the basic Jones model and the modified Jones model in order to ensure accuracy of research results. Jones model mainly considers total assets, fixed assets, receivables and sales revenue. Regression analysis on annual EM of different industries is performed, finally getting earnings management quality indexes (EM1 and EM2).
(2) Explanatory Variables
- ①
: Since the present study mainly focuses on heavy-polluting enterprises, we choose the heavy-polluting enterprises as the experimental group and therefore is set as 1. of non-heavy-polluting enterprises is defined as 0. Heavy-polluting enterprises and non-heavy-polluting enterprises are mainly divided manually according to the Announcement which was released in 2012. To meet H2, H3 and H4, samples in the present study are further divided into three subgroups according to consumers, enterprise properties and scale of company to verify the proposed hypotheses. According to the relationship between consumers and heavy-polluting enterprises, the heavy-polluting enterprises that are directly related with consumers are used as the experimental group ( = 1) and those indirectly related with consumers are defined as the control group ( = 0). In terms of enterprise properties, non-state-owned heavy-polluting enterprises are defined as the experimental group ( = 1) and the rest are the control group ( = 0). In terms of scale of enterprises, large-sized heavy-polluting enterprises are defined as the experimental group ( = 1) and small-sized enterprises are the control group ( = 0). Scale division is accomplished according to the median of different industries.
- ②
the “APEC Blue” event occurred in November 2014: Enterprises have inadequate time to revise submitted accounting data. Therefore, 2012–2014 is defined as the time before the event () and 2015–2016 is defined as the time after the event ().
- ③
: The regression coefficient of is the main observation data of DID model and an important content in the research analysis. It indicates whether the experimental group (heavy-polluting enterprises) has a stronger motivation to control accruable profits after the “APEC Blue” event than the control group (non-heavy-polluting enterprises) before the event.
(3) Control Variables
Based on the results of Ye and Yao et al. [
18], scale of company (
), age of listed company (
), leverage ratio (
), growth opportunity (
) and avoiding loss (
) are chosen as the control variables of company characteristics. Considering the applicability of Torbin’s Q on Chinese stock markets, growth of companies is defined by growth rate of sales revenue. Controlling growth opportunity of enterprises will influence earnings management of enterprises. Variables and their definitions are listed in
Table 1.
4. Empirical Results and Analysis
4.1. Descriptive Statistics
The descriptive statistics of the whole sample are shown in
Table 2. To avoid influences of extremum, all continuous values are processed by winsorize. In
Table 2, EM is generally low and the mean of EM is −0.0116. Descriptive statistics of different variable groups before and after the “APEC Blue” are shown in
Table 3. Based on the comparison of data before and after the “APEC Blue” in
Table 3, heavy-polluting enterprises have a strong motivation to adopt downward earnings management after the event. According to EM of experimental group and control group before the event, EM is insignificant except mean EM in the modified Jones model is negatively significant on the 5% level. However, both mean and median of EM between the experimental group and control group have significant differences (−0.018) on the 1% level after the event, indicating that, compared to the control group, the experimental group implements downward earnings management more deeply after the event. In
Table 3, two groups have significant differences in term of mean and median of Growth but the differences are small. Although there are certain differences in company characteristics between the two groups, it does not affect the results, as shown by the follow-up study. Here, we control the company characteristic variables.
4.2. Correlation Coefficients
Correlation coefficients of variables are shown in
Table 4. Obviously, correlation coefficients of variables are far smaller than 0.5 and the variance inflation factor (VIF) is significantly lower than 10, indicating that there is no obvious multicollinearity problem. To ensure the reliability of regression results and reduce effects of heteroscedasticity on the robustness of estimated results, White test is performed when using the Robust Command to correct SD and t statistics as well as to eliminate heteroscedasticity. Therefore, the model has no serious collinearity or heteroscedasticity and can be used for further regression test.
4.3. Analysis of Regression Results
4.3.1. Whole Sample Regression Analysis
The regression analysis results of the whole sample are shown in
Table 5. EM1 and EM2 are earnings management of heavy-polluting enterprises that are measured by manageable accruable profits by the basic and the modified Jones models. They are used to analyze changes of earnings management before and after “APEC Blue” event. In the present study, special attention is paid to
, because it reflects the net effect of earnings management of heavy-polluting enterprises as a consequence of the “APEC Blue” event. According to H1,
is expected to be negative. In
Table 5, Columns (1) and (2) are earnings management quality (EM1), which is measured by the basic Jones model, while Columns (3) and (4) are earnings management quality (EM2), which is measured by the modified Jones model. Columns (2) and (4) are simplified models without control variables. By comparing Columns (1), (2), (3) and (4), the involvement of control variables will not significantly affect regression results of major variables. Therefore, certain difference in company characteristic variables will not affect the final results.
In Columns (1) and (3),
is negative, which is consistent with the expectation and significant on the 10% level.
in Columns (2) and (4) without control variables are negatively significant on the 10% level, indicating that heavy-polluting enterprises have a strong motivation to decrease accounting information disclosure quality after the “APEC Blue” event and adopt downward earnings management to reduce social attentions and meet increasing information disclosure demand. In other words, H1 is confirmed.
is the effect of other events after the “APEC Blue” on earnings management. It has a significantly positive correlation with earnings management on the 1% level, indicating that haze-related events might influence earnings management except for the “APEC Blue”. This conforms to China’s practical situation and reflects haze has caused great attentions after the “APEC Blue”, which forces heavy-polluting enterprises to avoid such attention through earnings management. It is interesting that
depicts earnings management difference between heavy-polluting enterprises and non-heavy-polluting enterprises before the event. Regression results of
in Columns (1) and (2) are insignificant, but regression results of
in Columns (3) and (4) are negative and significant on the 1% level. This means that heavy-polluting enterprises have obvious downward earnings management compared to non-heavy-polluting enterprises before the event and such downward earnings management is further intensified after the “APEC Blue” event. This agrees with descriptive statistics of different group variables in
Table 3. Heavy-polluting enterprises indeed adopt downward earnings management and disclose unsatisfying accounting information. The regression results of
show that heavy-polluting enterprises implement significantly downward earnings management after the event, supporting H1.
The other control variables are significantly correlated with earnings management indexes of enterprises. in Column (1) has a significantly positive correlation with EM on the 1% level, indicating that the larger the company is, the lower the earnings management will be. The internal control level is more perfect in the larger company, where earnings management is subject to certain restrictions. Age has a significantly positive correlation with EM on the 10% level, indicating that the “older” the company is, the weaker the motivation of earnings management will be. Size and Age are significant in Column (3). Leverage in Column (3) has a significantly positive correlation with EM2 on the 5% level, indicating that the higher leverage rate the company has, the lower the earnings management will be. Leverage reflects the company’s solvency. The higher the leverage rate is, the stronger solvency the company has. With strong financial support, enterprise has greater confidence to deal with negative social concern caused by haze. Growth in Column (3) has a significantly positive correlation with EM2 on the 1% level, indicating that the greater the Growth is, the lower the earnings management will be. A high growth capacity of a company may signal its good business performance to investors, markets and the public, and its motivation of downward earnings management is weak. Avloss in Column (3) has a significantly positive correlation with EM2 on the 5% level, indicating that the stronger the motivation to avoid losses, the lower the earnings management will be. For the motivation of avoiding loss, enterprise prefer showing more decent book assets to downward earnings management to enhance employee motivation and win the trust of investors.
4.3.2. Subsample Regression
The whole sample is further divided into three subgroups based on H2, H3 and H4. The division is made in terms of the relationship between consumers and heavy-polluting enterprises, enterprise properties and enterprise scale. Columns (1) and (2) in
Table 6 show regression results of the subsample of heavy-polluting enterprises that are directly related with consumers. In Column (1),
and EM1 are negative, but not significant. It is interesting that, in Column (2),
is −16.62 and is significantly correlated with EM2 on the 5% significance level. Hence, it is speculated that errors might be caused by the difference between EM1 and EM2. Wang et al. [
19] pointed out that the modified Jones model can recognize accruable earnings management and estimate operating accruable earnings management better in panel data of industries. Therefore, the present study concludes that H2 is true based on EM2. In Columns (1) and (2), some control variables are significantly correlated with earnings management. It is noteworthy that Age in Column (2) is negatively correlated with EM on the 1% significance level and is different from the regression results of the whole sample. In other words, “older” heavy-polluting enterprises that are directly related with consumers concern more on a good impression with consumers. After the haze event, “younger” enterprises have a stronger motivation to adopt downward earnings management to reduce consumers’ attention.
Columns (3) and (4) in
Table 6 are the regression results of the subsample of heavy-polluting enterprises divided in terms of size based on median of enterprises. Heavy-polluting enterprises larger than the median are large enterprises and defined as 1; otherwise, they are defined as 0. Attention is paid to whether
in Column (4) is consistent with the expectation of the present study. It can be seen from Column (4) that
is negative and significant on the 10% level. Therefore, H3 is true. Based on a further study,
is negative and significant on the 5% level, indicating that large-sized enterprises have implemented a significant downward earnings management before the “APEC Blue” event, which is further intensified after the event. This further proves that H3 is true. Large-sized enterprises are easier to attract social attention than small-sized ones. After the “APEC Blue” event, large-sized heavy-polluting enterprises are easier to attract attention from the government and the public, so they are more careful with information disclosure than small-sized ones, resulting in low quality of disclosed accounting information, even mixed with false information.
Columns (5) and (6) in
Table 6 are the regression results of the subsample of heavy-polluting enterprises that are classified according to enterprise properties.
in Column (6) is negative, which is consistent with the expectation of the present study. It is significant on the 1% level. Therefore, H4 is true.
is negative and significant on the 5% level, indicating that non-state-owned heavy-polluting enterprises have adopted obvious downward earnings management before the event. This further proves that H4 is true. In terms of practical significance, non-state-owned enterprises are inferior to state-owned enterprises with respect to resources accession. To cope with increasing social negative attention and government cost caused by haze events, they have a strong motivation to adopt downward earnings management to avoid excessive attention and unnecessary monitoring.
4.3.3. Robustness Test
To ensure the robustness of the results, the robustness of the whole samples is tested. Since the regression analysis is mainly based on EM2, it is used as the dependent variable of robustness test. Panel data and OLS are applied in the above empirical test. This paper adopts the method of replacing measurement method to test the robustness, which is substituting fixed effect panel regression for ordinary OLS. The panel model with fixed effect is used and control variables are added gradually. Regression results are shown in
Table 7. It is noteworthy that there is a significant negative correlation between Growth and EM2 in
Table 7, while a significant positive correlation is shown in Column (3) of
Table 5, which needs further explanation. Enterprise with great growth has good prospects for development, whose corporate performance has shown steady growth in recent years. Meanwhile, some well-developed enterprises begin to receive public attention and bear more social responsibilities, thus having motivation to control earnings management for reducing public attention to avoid the social costs associated with additional social concern. From the point of view of data structure and regression model, this article uses the panel regression, the results of which are more convincing than ordinary OLS regression results. Therefore, from a practical point of view, heavy-polluting enterprises with better growth are more motivated to control earnings management. Apart from the Growth control variable, the regression results of main variables are similar to the previous hypotheses and regression results. Hence, empirical results in the present study have robustness.
5. Conclusions and Discussion
Based on the “APEC Blue” event in 2014, effects of social pressure caused by negative social attention on accounting information disclosure of heavy-polluting enterprises are discussed in this paper with the use of empirical data. We have investigated whether social pressure increase information disclosure quality of heavy-polluting enterprises. In terms of information disclosure intention of heavy-polluting enterprises, low-carbon consciousness of consumers and enterprise properties and size, heavy-polluting enterprises have a strong motivation to adopt downward earnings management. In the present study, net influences of haze effect on earnings management of enterprises are discussed based on interference of other events on time series eliminated by DID model, further verifying the proposed hypotheses. After the “APEC Blue” event, heavy-polluting enterprises have motivations to decrease book profits and the disclosed accounting information quality is decreased accordingly. According to the regression results of H2, H3 and H4, heavy-polluting enterprises that are directly related with consumers, non-state-owned enterprises and large-sized enterprises have stronger motivations to adopt downward earnings management. In addition, Guay [
20] pointed out that negative social attention will influence the production process of enterprise information to some extent. More extensive scenarios are needed to test it. However, most existing studies describe effects of haze event on accounting information disclosure of enterprises from the perspective of political cost. In the present study, an empirical study is carried out from the perspective of negative social attention, which provides a new microscopic perspective to study haze. Considering downward earnings management of heavy-polluting enterprises in an attempt to reduce public attention and avoid environmental regulation, three suggestions are hereby proposed.
Firstly, non-state-owned heavy-polluting enterprises have a stronger feeling of “insecurity” upon negative social attention and strict environmental regulations caused by haze than state-owned enterprises. How to increase non-state-owned heavy-polluting enterprises’ feeling of “security” is crucial to improve information disclosure quality. Relevant authorities should offer “punishment” and “award” simultaneously. In addition, the auditing department should perfect the auditing system of accounting information of enterprises, severely punish enterprises with financial fraud while offer certain subsides to heavy-polluting enterprises struggling with environmental pollution. Moreover, government should urge enterprises to enhance the “honesty” culture and encourage social media to pay attention to their social responsibilities in environmental protection and disclosure of financial information. Large-sized heavy-polluting enterprises need more strict supervision.
Secondly, consumers who are greatly associated with enterprises’ benefits should play an important role in influencing enterprise behavior. According to the regression results, Treated * After of subsamples related with consumers is about −16 and significant on the 5% level, indicating that enterprises that are directly related with consumers have stronger motivations to adopt downward earnings management after the haze event. Therefore, it is extremely important to raise low-carbon consciousness of consumers. As the hot topic for three consecutive years, “haze” has wide concern in the public. Since haze control is not satisfactory in recent years, people have more concern for environmental issues and put forward higher and higher requirements on information disclosure quality of heavy-polluting enterprises due to the awakening low-carbon consciousness. However, people’s low-carbon consciousness still focuses on energy conservation and power saving, paying little attention to the behavior of heavy-polluting enterprises. When low-carbon consciousness of consumers reaches a certain extent, the consumers will ask heavy-polluting enterprises to disclose high-quality information. They will take the initiative to supervise local heavy-polluting enterprises, which are conducive to avoid environmental pollution and pretended behaviors.
Thirdly, based on the empirical test data, we suggest that scholars pay more attention to heavy-polluting enterprises that are directly related with consumers, non-state-owned enterprises and large-sized enterprises. They should test the authenticity of disclosed accounting information and eliminate “false” information to reduce research error. According to the empirical regression in the present study, these types of enterprises have a stronger motivation to adopt earnings management when coping with social attention and government supervision, disclosing false accounting information to some extent. Scholars should judge the authenticity of data in future studies.
Finally, our study suggests several promising avenues for future research. Firstly, researchers could investigate other types of heavy-polluting enterprises (e.g., industry classification and brand awareness of enterprises). Secondly, researchers could explore whether heavy-polluting enterprises take action to conserve energy and reduce emission under public pressure, increasing operating costs and resulting in a deviation from earnings management results. Thirdly, whether the real economic structure has changed before and after the “APEC Blue” event needs to be further studied.
Acknowledgments
This study is funded by the National Social Science Foundation of China (No. 13CGL094), the Priority Academic Program Development of Jiangsu Higher Education Institutions, Top-notch Academic Programs Project of Jiangsu Higher Education Institutions (PPZY2015A072), Jiangsu Province Social Science Research Excellence Project (17SCB-23) and The Practice Innovation Training Program of College Students in Jiangsu Province (201610300004).
Author Contributions
Xiaodong Zhu and Bingbing Wu came up the original idea for the manuscript. Rongrong Gu was responsible for data collection. Xiaodong Zhu, Rongrong Gu carried out the analysis. Shunsuke Managi put forward the valuable suggestions and edited language for the policy implications. All authors read and approved the submission.
Conflicts of Interest
The authors declare no conflict of interest.
References
- Rohde, R.A.; Muller, R.A. Air pollution in China: Mapping of concentration and sources. PLoS ONE 2015, 10, e0135749. [Google Scholar] [CrossRef] [PubMed]
- Guo, J.; Chen, S.S.; Wu, X.H. Does air pollution affect the earnings management of local heavily polluting enterprises?—An empirical study based on the modified Jones model and breakpoint regression. Friends Account. 2017, 7, 30–36. (In Chinese) [Google Scholar]
- Liu, Y.G.; Liu, M.N. Does haze affect the earnings management of heavy polluting enterprises?—Based on the study of political cost hypothesis. Account. Res. 2015, 3, 26–33. (In Chinese) [Google Scholar]
- Ye, Q.; Li, Z.Q.; Li, G.Q. Rich list will affect the quality of corporate accounting information?—Based on the perspective of political costs. Manag. World 2012, 1, 104–120. (In Chinese) [Google Scholar]
- Wang, J.M.; He, A.Z. Psychological attribution and policy intervention path of consumer low-carbon consumption behavior: An exploratory study based on grounded theory. Nankai Bus. Rev. 2011, 14, 80–89. (In Chinese) [Google Scholar]
- Chen, H.; Long, R.; Niu, W.; Feng, Q.; Yang, R. How does individual low-carbon consumption behavior occur?—An analysis based on attitude process. Appl. Energy 2014, 116, 376–386. (In Chinese) [Google Scholar] [CrossRef]
- Dhaliwal, D.S.; Li, O.Z.; Tsang, A.; Yang, Y.G. Voluntary nonfinancial disclosure and the cost of equity capital: The initiation of corporate social responsibility reporting. Account. Rev. 2011, 86, 59–100. [Google Scholar] [CrossRef]
- Liu, F.J.; Kong, W.; Li, H. Study on the Mechanism of Corporate Social Responsibility to Consumers’ Resistance to Internalization—Based on the Theory of AEB Theory and Discount Principle. Nankai Bus. Rev. 2015, 18, 52–63. (In Chinese) [Google Scholar]
- Becker-Olsen, K.L.; Cudmore, B.A.; Hill, R.P. The impact of perceived corporate social responsibility on consumer behavior. J. Bus. Res. 2006, 59, 46–53. [Google Scholar] [CrossRef]
- Cheung, R.; Lam, A.Y.C.; Mei, M.L. Drivers of green product adoption: the role of green perceived value, green trust and perceived quality. J. Glob. Sch. Mark. Sci. 2015, 25, 232–245. [Google Scholar] [CrossRef]
- Zmijewki, M.E.; Hagerman, R.L. An income strategy approach to the positive theory of accounting standard setting. J. Account. Econ. 1981, 3, 129–149. [Google Scholar] [CrossRef]
- Peng, H.L. Reflection on corporate social responsibility from the perspective of haze haze control. Econ. Forum 2014, 4, 152–155. (In Chinese) [Google Scholar]
- Wang, F.S.; Ji, S.S.; Cheng, F. Study on the impact of earnings management on the future performance of listed companies—Based on the comparison between accrual earnings management and real earnings management. Nankai Bus. Rev. 2014, 17, 95–106. (In Chinese) [Google Scholar]
- Jones, J.J. Earnings management during import relief investigations. J. Account. Res. 1991, 29, 193–228. [Google Scholar] [CrossRef]
- Liu, H.L.; Wang, C.F.; Wu, L.S. Decision Allocation, Earnings Management and Investment Efficiency. J. Econ. Res. 2014, 8, 93–106. (In Chinese) [Google Scholar]
- Bertrand, M.; Duflo, E.; Mullainathan, S. How Much Should We Trust Differences-in-Differences Estimates? Q. J. Econ. 2004, 119, 249–275. [Google Scholar] [CrossRef]
- Hanlon, M.; Maydew, E.L.; Shevlin, T. An unintended consequence of book-tax conformity: A loss of earnings informativeness. J. Account. Econ. 2008, 46, 294–311. [Google Scholar] [CrossRef]
- Yao, S.; Sun, M.J. Alternative effects of earnings management and environmental information management—Based on the perspective of public pressure change. J. Account. Econ. 2016, 5, 49–65. (In Chinese) [Google Scholar]
- Wang, S.B.; Xu, Y.Z. Effects of environmental regulation and haze halogenation—Based on the perspective of enterprise investment preference. China Ind. Econ. 2015, 4, 18–30. (In Chinese) [Google Scholar]
- Guay, W. Discussion of elections and discretionary accruals: Evidence from 2004. J. Account. Res. 2010, 48, 477–487. [Google Scholar] [CrossRef]
© 2017 by the authors. Licensee MDPI, Basel, Switzerland. This article is an open access article distributed under the terms and conditions of the Creative Commons Attribution (CC BY) license (http://creativecommons.org/licenses/by/4.0/).

