Article

Implications of Water Use and Water Scarcity Footprint for Sustainable Rice Cultivation

by
Thapat Silalertruksa
1,2,
Shabbir H. Gheewala
1,2,*,
Rattanawan Mungkung
3,4,
Pariyapat Nilsalab
1,2,
Naruetep Lecksiwilai
1,2 and
Wanchat Sawaengsak
1,2
1
The Joint Graduate School of Energy and Environment, King Mongkut’s University of Technology Thonburi, 126 Prachauthit, Bangmod, Tungkru, Bangkok 10140, Thailand
2
Center of Excellence on Energy Technology and Environment, PERDO, Bangkok 10140, Thailand
3
Centre of Excellence on enVironmental strategy for GREEN business (VGREEN), Faculty of Environment, Kasetsart University, Bangkok 10903, Thailand
4
Department of Environmental Technology and Management, Faculty of Environment, Kasetsart University, Bangkok 10900, Thailand
*
Author to whom correspondence should be addressed.
Sustainability 2017, 9(12), 2283; https://doi.org/10.3390/su9122283
Submission received: 31 October 2017 / Revised: 4 December 2017 / Accepted: 7 December 2017 / Published: 8 December 2017

Abstract

:
Rice cultivation is a vital economic sector of many countries in Asia, including Thailand, with the well-being of people relying significantly on selling rice commodities. Water-intensive rice cultivation is facing the challenge of water scarcity. The study assessed the volumetric freshwater use and water scarcity footprint of the major and second rice cultivation systems in the Chao Phraya, Tha Chin, Mun, and Chi watersheds of Thailand. The results revealed that a wide range of freshwater use, i.e., 0.9–3.0 m3/kg of major rice and 0.9–2.3 m3/kg of second rice, and a high water use of rice was found among the watersheds in the northeastern region, like the Mun and Chi watersheds. However, the water scarcity footprint results showed that the second rice cultivation in watersheds, like in Chao Phraya and Tha Chin in the central region, need to be focused for improving the irrigation water use efficiency. The alternate wetting and drying (AWD) method was found to be a promising approach for substituting the pre-germinated seed broadcasting system to enhance the water use efficiency of second rice cultivation in the central region. Recommendations vis-à-vis the use of the water stress index as a tool for agricultural zoning policy were also discussed.

1. Introduction

Rice (paddy) is the staple food crop feeding more than half the global population, accounting for about 19% of the world’s dietary energy supply [1]. Especially for Asian countries like China, India, Indonesia, Bangladesh, Vietnam, as well as Thailand, rice cultivation is recognized as a vital economic sector vis-à-vis their socio-economic development. It is estimated that food production needs to be increased by around 60% to meet the global demands for food in 2050 [2]. Freshwater demands for food production have been projected to increase significantly in the coming decades due to population growth, urbanization, and economic development [3]. Meanwhile, agriculture is the most land- and freshwater-consuming sector, accounting around 37.5% of the global land area [4] and 85% of the global freshwater consumption [5]. The water crises nowadays are prioritized as one of the top five global risks [6]. In addition, several countries have promoted biofuels as one of the measures to boost the livelihood of farmers in rural areas along with improving the national gross domestic product (GDP). The rapid expansion of crops production leads to concerns on food and fuels competition, particularly on water scarcity caused by the overexploitation of water for food and biofuel crops [7,8,9,10]. The concern is not limited to the water competition between food and fuels but also among other water users in the water basins. Hence, the improvement of water use efficiency and productivity, as well as appropriate water and land and resources management are essential for the sustainability of agricultural production [11].
Water footprint is recognized as a tool for evaluating the relationship between agricultural production, water resources, and environmental impacts in order to enhance water use efficiency, sustainability of water use within the watersheds, mitigating the impact of water use and improving water resource management [12,13,14,15]. The same term “water footprint” is used by two approaches, i.e., Water Footprint Network and life cycle assessment (LCA), although their definitions in the two approaches are different [16,17]. The two approaches can provide different views of useful information to support the policy decision for enhancing water resource management as well as for water impacts mitigation to avoid the water risks [8,18]. The volumetric quantification of water use for agricultural products in water footprint assessment of the Water Footprint Network approach provides useful information in terms of water use efficiency and water productivity by considering the freshwater consumption over the production chain of crops. Meanwhile, the water footprint assessment based on the LCA approach will combine the volumetric freshwater consumption with the water stress index of the region where the water is extracted in order to determine the impact of freshwater consumption in view of water deprivation potential [19,20].
The water footprint of rice has so far been conducted by focusing on the volumetric water consumption of rice cultivation in various countries as the virtual water footprint [21,22,23]. The results revealed that although the water footprint of rice in Asia is high, the contribution to water scarcity is relatively low because the rice is generally grown in the wet season (rainfed paddy field) and rainwater is the major water source. However, the environmental impact due to the irrigation water use in rice production should be specifically analyzed based on the location and timing of the water use [21]. This is consistent with the concept of water scarcity footprint in which the potential environmental impact of water use is assessed considering the water stress situation of each location and also the time [24,25]. There is still a lack in assessing the potential impact of rice cultivation in terms of water scarcity footprint, especially for the case where rice cultivation systems are shifted due to limited water resources. This study aims to integrate water footprint based on the LCA approach as a tool for providing recommendations to support the policy makers on promoting sustainable rice cultivation in view of water efficiency and water scarcity footprint reduction. The water scarcity footprint of different rice cultivation systems of Thailand have been investigated. The studied areas covers the four key watersheds of rice cultivation in Thailand, including Mun, Chi, Chao Phraya, and Tha Chin.

2. Materials and Methods

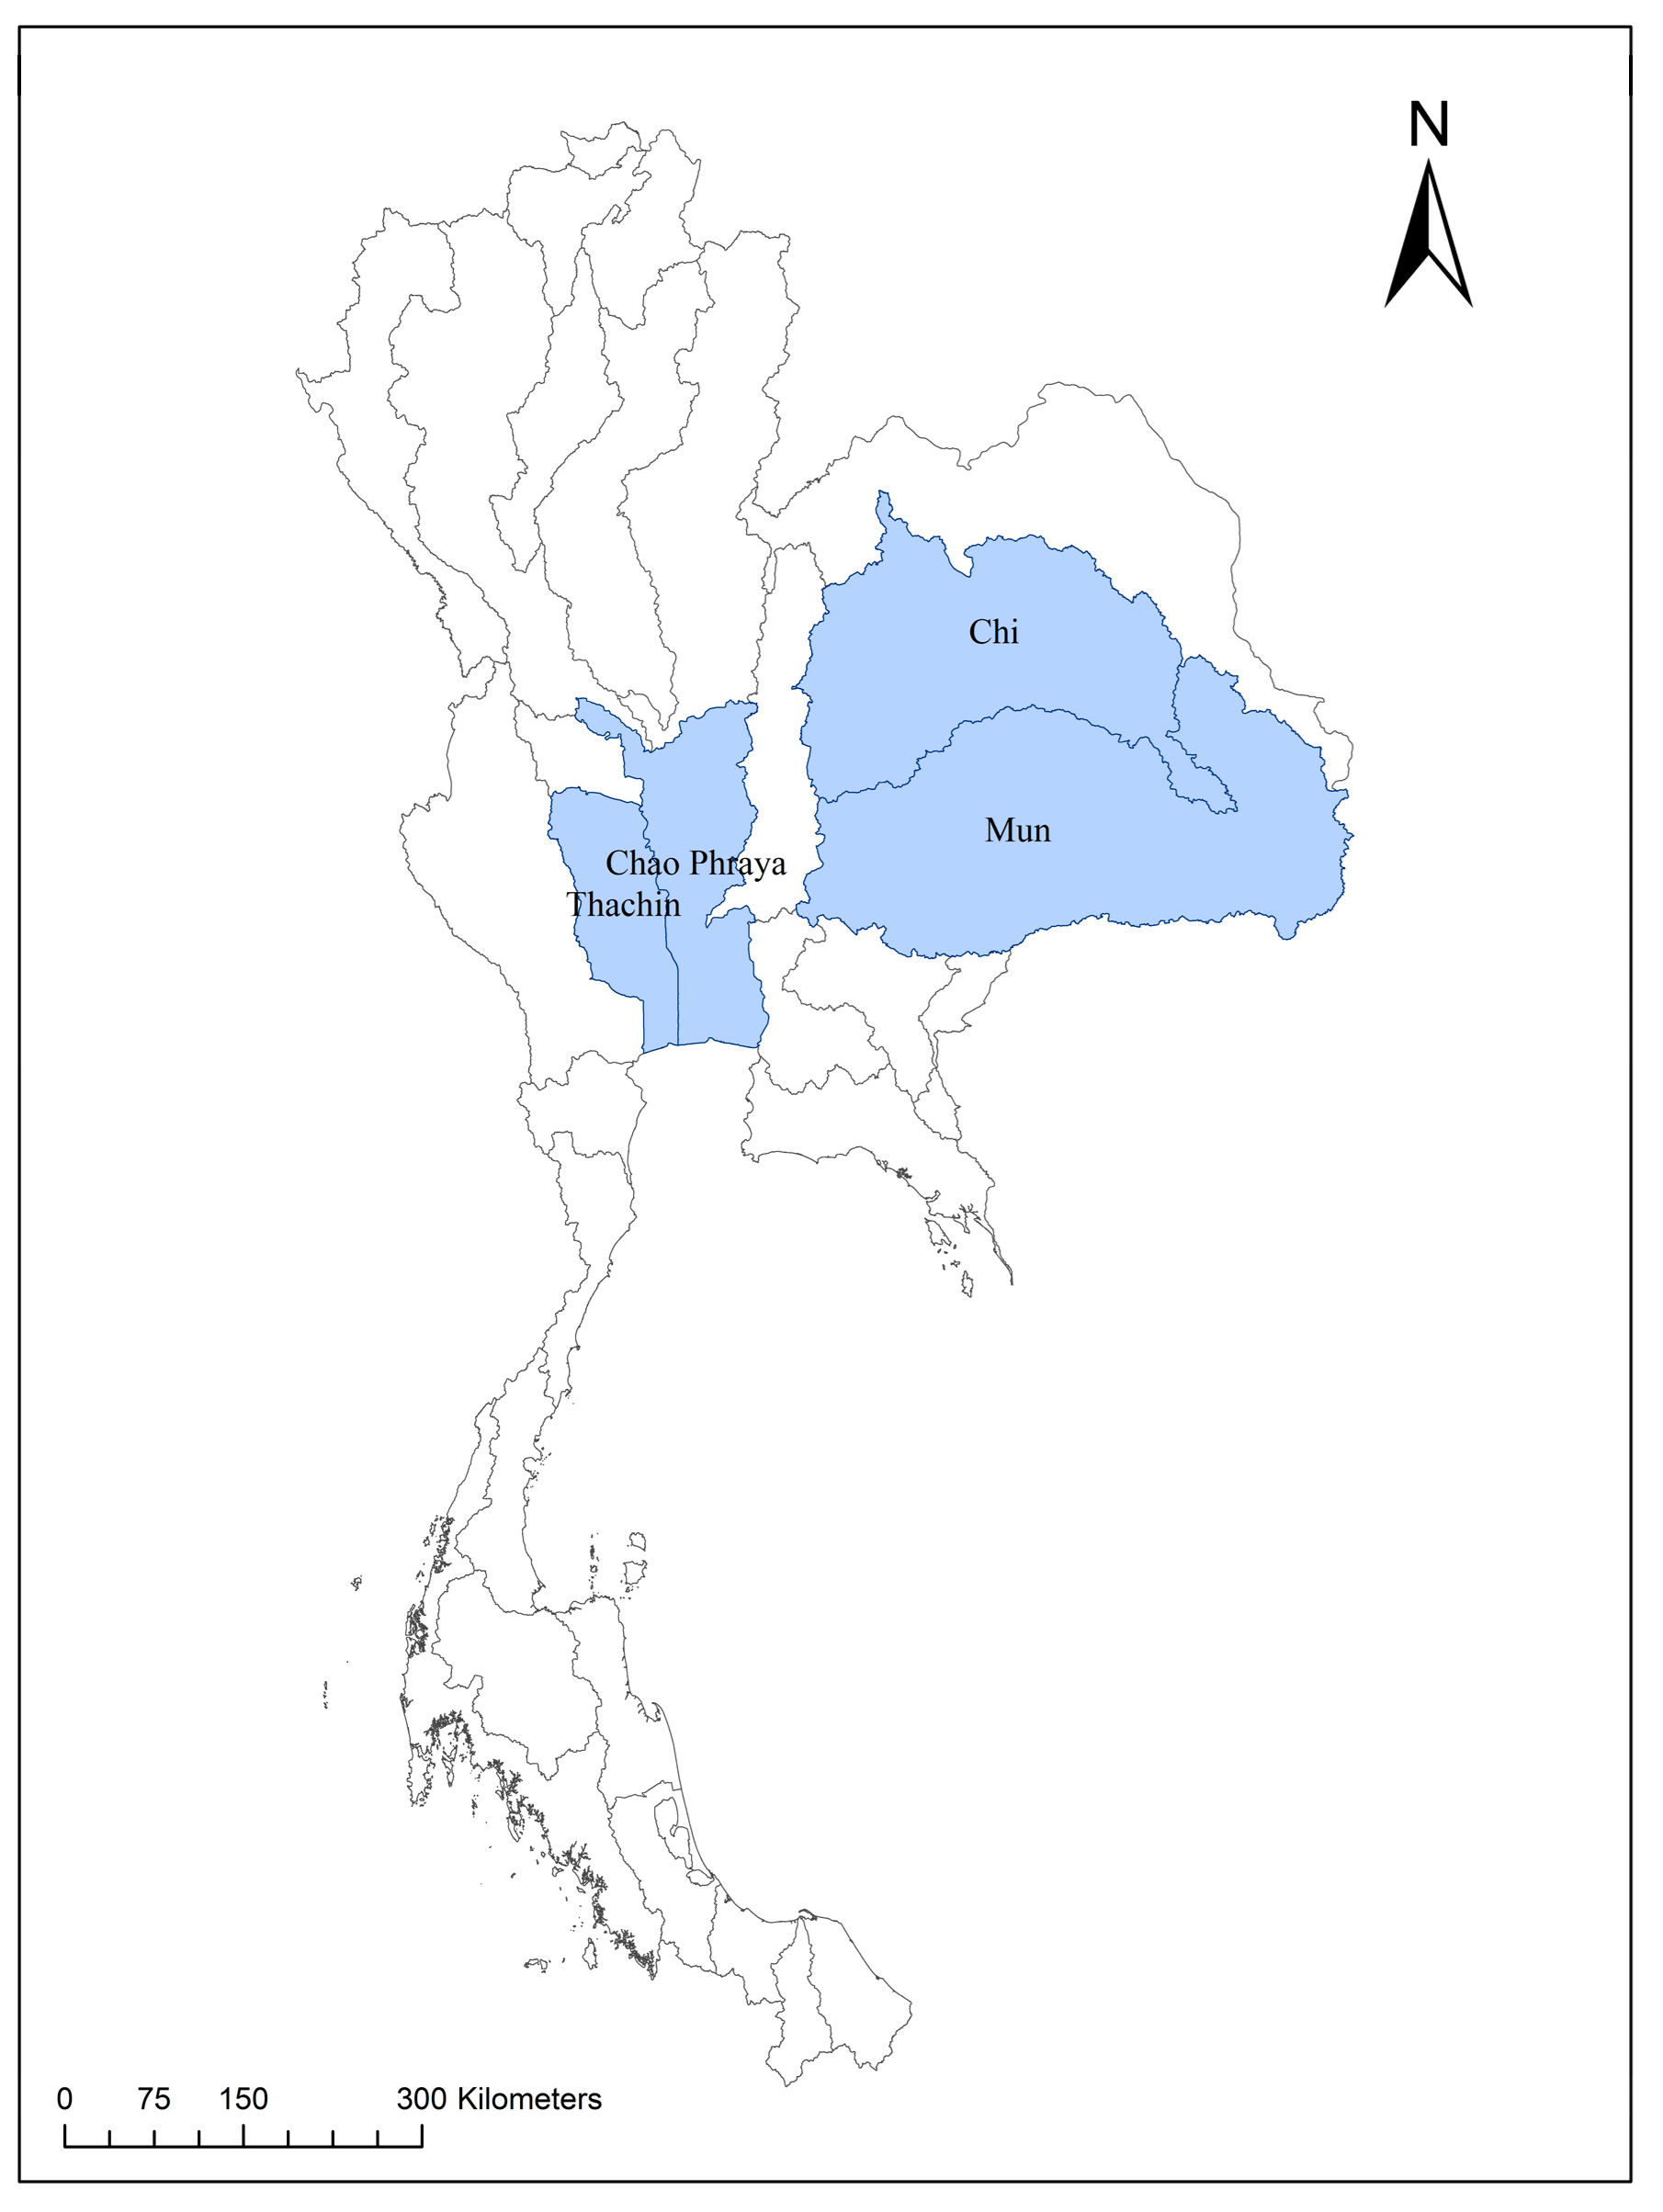
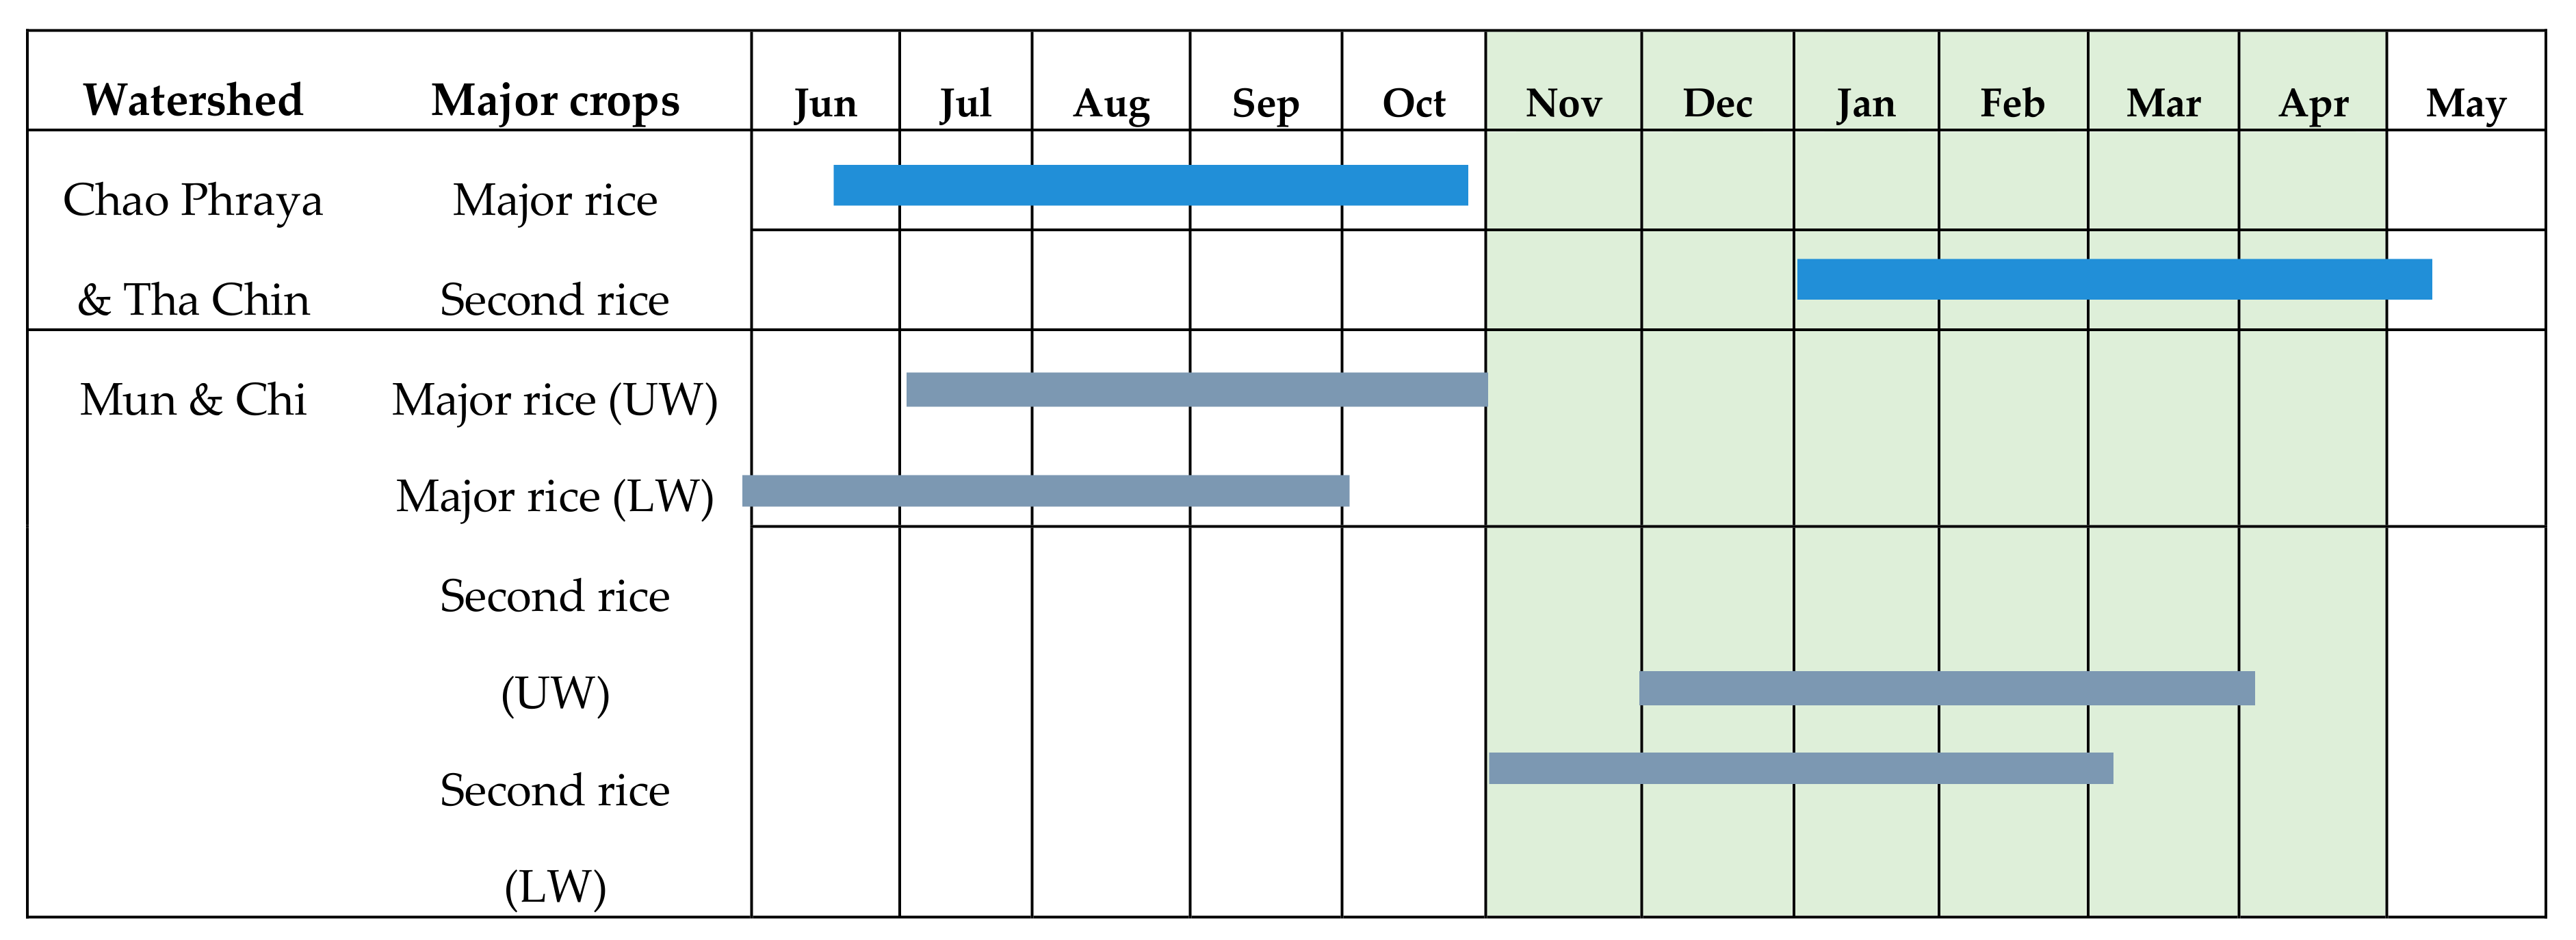
2.1. Rice (Paddy) Production in Thailand and the Studied Areas

Thailand is located in the tropical region where a variety of crops, fruits, and plants are grown. Of the country’s total land area of about 51.3 million hectares, 46% is agricultural land, followed by forest land at 32%, and other lands at 22% [26]. For the agricultural land, rice fields occupy the highest at around 11.2 Mha or 47% of the total, followed by perennial crops and fruit orchards, cropland, vegetables and flowers, and others at about 23%, 21%, 1% and 8%, respectively. This has led Thailand to be the 6th largest rice producer and one of the world’s leading countries for rice exports. In 2015, Thailand produced around 30 Mt and exported around 10 Mt of rice [26]. Rice is grown nationwide but the capacity of rice cultivation in each region is different, depending on the availability of water. In general, rice cultivation in Thailand can be classified into two crops depending on the period of plantation. The first crop, or “major rice”, is grown in the rainy season (between May and October), while the second crop, or “second rice”, is grown in the dry season (between November and April) using water from irrigation. The main region of paddy plantation in Thailand is the northeast, contributing around 51% of the total planted areas [26]. The northeastern region dominates in terms of the largest major rice production (rainfed paddy fields). However, the central region is outstanding in terms of the irrigated paddy fields and the ability to cultivate two crops a year. Table 1 summarizes the rice planted areas, production, and yields in Thailand from a geographical perspective.
From a hydrological perspective, Thailand can be divided into 25 major watersheds, as shown in Figure 1. The hydrological boundary is essential for policy makers to use for water resource management. The study highlights the four key watersheds, i.e., Chao Phraya, Tha Chin, Mun, and Chi, in the water use and water scarcity footprint assessment of rice (paddy) production in Thailand. This is because the Chao Phraya and Tha Chin watersheds represent the central region with the irrigated cultivation system where both major and second rice can be grown. Meanwhile, Mun and Chi are located in the northeastern region where major rice is widely grown under the rainfed cultivation system.

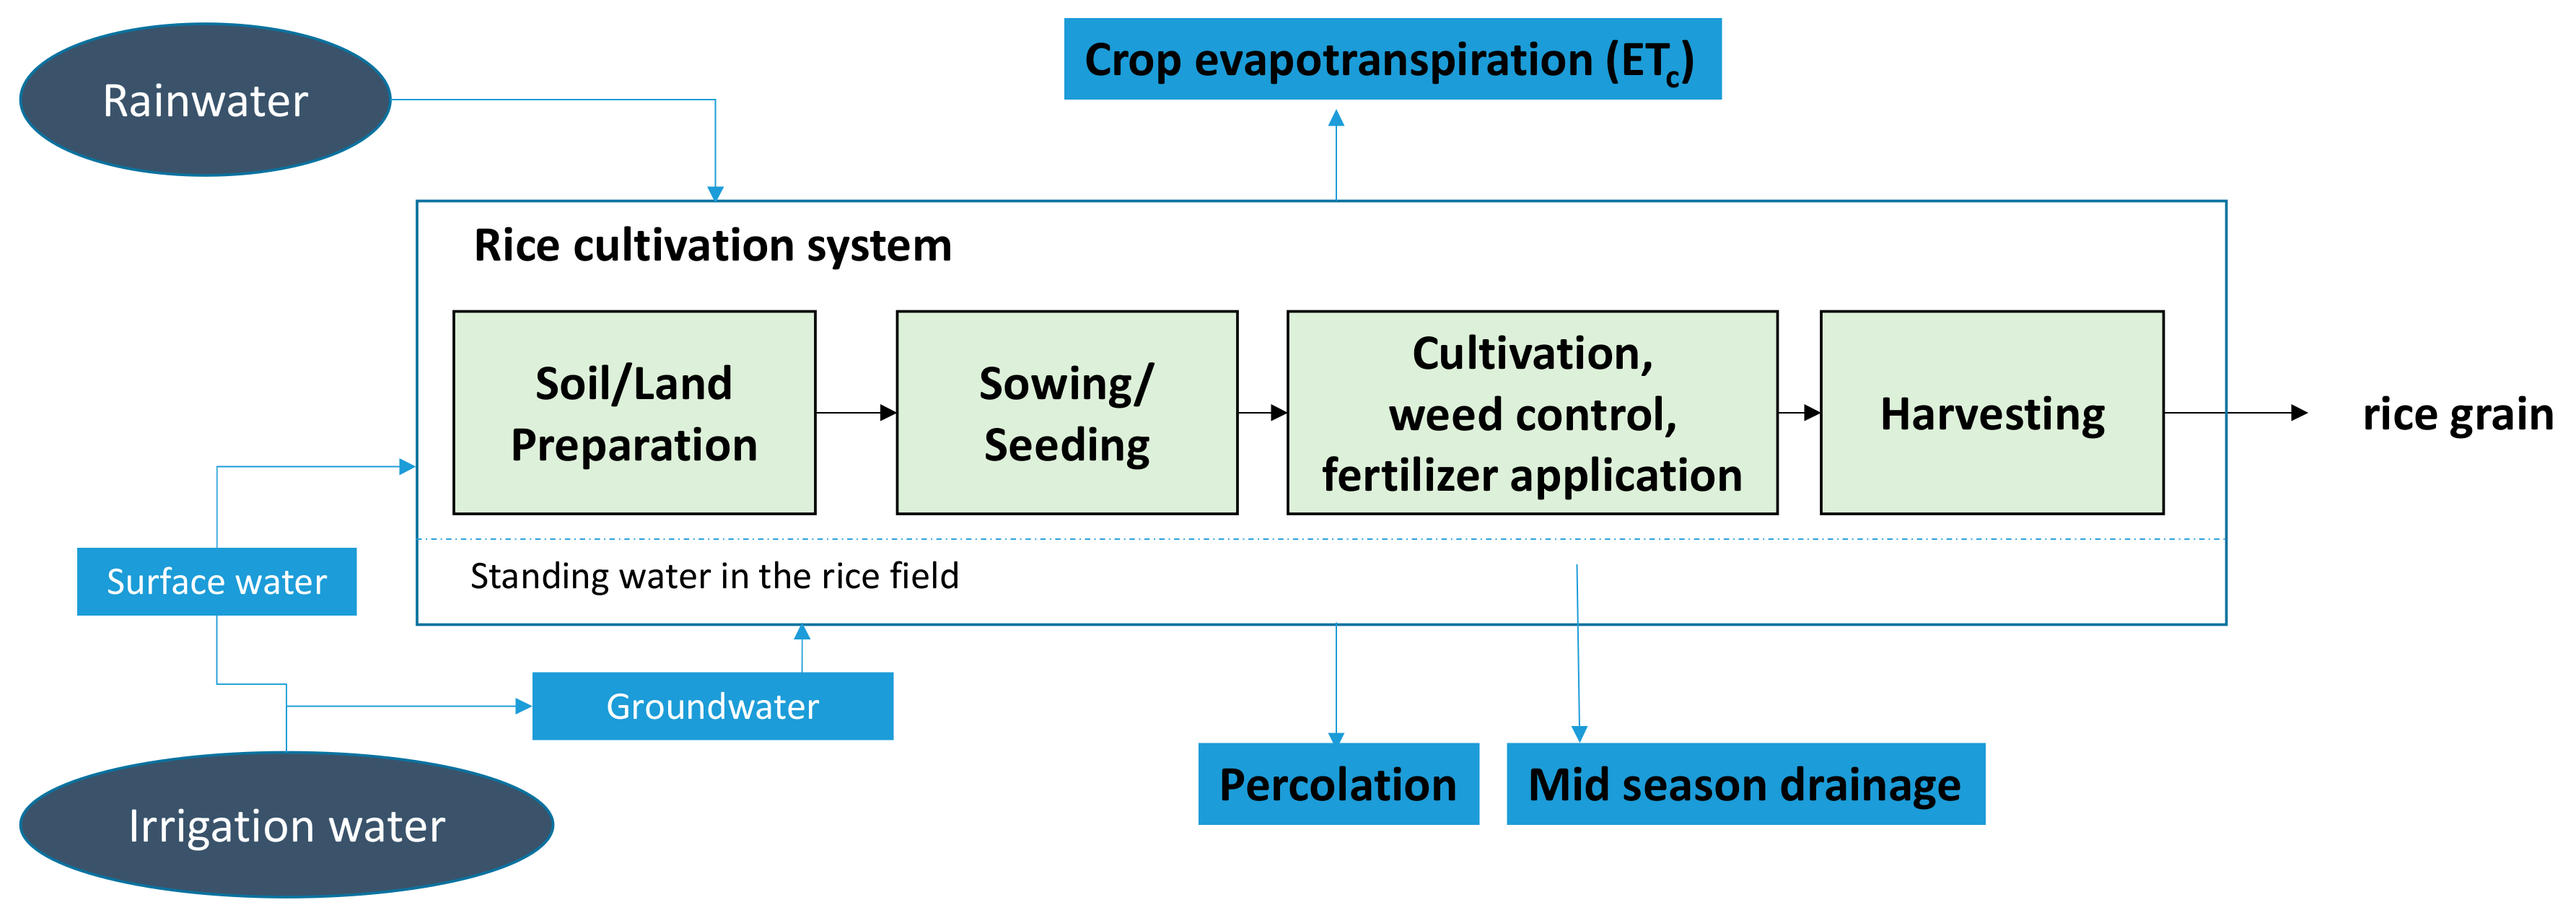
2.2. Rice Cultivation Systems

Rice cultivation in Thailand uses mainly the wet system, i.e., rice fields are prepared and the soil is kept saturated. There are three major types of rice cultivation found in the studied areas viz. (1) transplanting, (2) dry ungerminated seed broadcasting, and (3) pre-germinated seed broadcasting. Transplanting is a traditional technique for growing rice, done by transplanting seedlings that are firstly grown in nurseries. This method requires less seeds and is easy for controlling weeds, but is labor intensive and the crop takes longer to mature [1]. Dry ungerminated seed broadcasting, or so called “dry direct seeding”, is a technique for rainfed ecosystems, where farmers will sow the ungerminated seeds onto the dry soil surface and then incorporate them either by ploughing or by harrowing. Pre-germinated seed broadcasting, or so called “wet direct seeding”, is a technique commonly used for irrigated areas, i.e., seed is normally pre-germinated prior to broadcasting onto the recently drained, well-puddled seedbeds or into pre-standing water in the fields [1]. Figure 2 shows the simplified rice cultivation system and water use covering soil preparation, sowing, cultivation, and harvesting to get the rice grain product.
Figure 3 shows the cropping calendar of rice which is referred to as the baseline for estimating crop water requirement (CWR). The dry season of Thailand runs from November through April (shaded in the figure). The geographical location of Chao Phraya and Tha Chin watersheds is in the central region where the rainfall occurs in mid-May to mid-August due to the southwest monsoon and another with northwest monsoon in mid-October to the end of November. Therefore, more than one crop of rice is generally grown if the farmers have enough water supply for land preparation. It was found that in the Ayuthaya, Nakhon Pathom, and Pathum Thani provinces, the farmers are able to grow rice twice a year. However, in case of the northeastern region (i.e., Mun and Chi watersheds), the rainy season generally comes a bit later than the central region, so the farmers generally start to prepare their rice fields in mid-July and then start sowing in mid-August in order to use the rainwater. Nowadays, the non-irrigated rice fields have been promoted by the Department of Agriculture to cultivate mung bean or other beans in order to improve soil quality.
Data on rice cultivation collected from farmers and local government authorities in 15 provinces covering the Mun, Chi, Chao Phraya, and Tha Chin watersheds are shown in Table 2. Selection of representative areas was done based on plantation area and management practices. Thus, the samples are identified by the provincial agricultural officers to represent various practices of farmers in the studied provinces. About 1257 local farmers were surveyed via questionnaires. The planted areas of rice in the Tha Chin and Chao Phraya watersheds are generally with lowland paddy rice for which the farmers are able to use irrigation water. Meanwhile, the cultivated areas in the Mun and Chi watersheds mostly rely on rainwater. In Chao Phraya and Tha Chin, the cultivation system of the surveyed samples for both major and second rice is pre-germinated seed broadcasting. However, in the Mun watershed, the cultivation systems for major rice consist of dry ungerminated seed broadcasting (50%), pre-germinated seed broadcasting (30%), and the transplanting method (20%); and the cultivation system for second rice is mainly dry ungerminated seed broadcasting. In the Chi watershed, the cultivation systems for major rice consist of dry ungerminated seed broadcasting (40%), pre-germinated seed broadcasting (27%), and the transplanting method (33%); and the cultivation system for second rice is mainly the pre-germinated seed broadcasting.

2.3. Crop Water Requirement Assessment

Crop water requirement (CWR) refers to the volume of water lost via the evapotranspiration process including evaporative water from soil and crop surfaces and transpired water from crops to the atmosphere. CWR is denoted as crop evapotranspiration (ETc). The water use of rice is estimated based on the crop evapotranspiration calculation complemented with the rainfed and/or irrigated conditions of the planted areas as well as irrigation practices of farmers. Data on farming practices, irrigation techniques and efficiency are primarily collected, compiled, and aggregated from farmers. The general formula (Equation (1)) used for estimating CWR is expressed as follows [27,28].
ETc = Kc × ET0
where ET represents the crop evapotranspiration i.e., the amount of water evapotranspired by the crops in a specific climate regime and adequate soil water is maintained by rainfall, irrigation, or both; KC represents the crop coefficient of Penman–Monteith; and ET0 represents the reference crop evapotranspiration of Penman–Monteith [27]. Accordingly, the CWR of rice (major and second) can be estimated. The reference crop evapotranspiration (ET0), crop coefficients, and monthly average rainfall data for different provinces of Thailand are referred from [29,30,31]. The calculated ET0 by province and KC values of rice are provided by the Royal Irrigation Department (RID). RID have measured ETC of rice via both direct measurements performed at their irrigated water management experiment stations and indirect calculation-applied provincial climate data. Using Equation (1) for estimating ETC of rice is also recommended by RID, as it will serve as a quick assessment and be valid for rice cultivation in the studied provinces. However, other factors influencing CWR, such as rice varieties and soil characteristics, should be considered for a more comprehensive assessment. The crop evapotranspiration (ETC) and the effective rainfall are calculated for the given set of data on ET0, monthly rainfall, KC, and the crop calendar. Effective rainfall is the amount of rainfall actually used by the crops.
In general, rice cultivation begins with the land preparation by puddling. This is done by saturating the soil layer for one month prior to sowing. The volume of water that is necessary for saturated soil is about 200 mm [32]. For the lowland rice cultivation, standing water is required for weed control. The wet system has a constant percolation and seepage loss during this period. Since the percolation loss is primarily a function of soil texture, the study refers to the percolation loss factor based on RID, which is about 1 mm/day for the central region and 1.5 mm/day for the other regions of Thailand [33]. A water layer is assumed to be established during transplanting or sowing and maintained throughout the growing season, but the level of water can differ depending on the farmers’ practices. This standing water is assumed to be used for the entire period of rice cultivation, except for the last 15 days when the field will be dried out to facilitate harvesting. The total freshwater demand for rice cultivation is therefore calculated from the summation of ETC, standing water, and percolation for each time step.
To classify the crop water use into rainwater and irrigation water, if rice is grown in non-irrigated areas, the water used for growing rice is supposed to be equal to the amount of effective rainfall. If CWR is higher than effective rainfall, water withdrawal for rice in non-irrigated areas is equivalent to the amount of effective rainfall. On the other hand, if effective rainfall is higher than CWR, water withdrawal for rice in non-irrigated areas is equivalent to the amount of CWR. Water required for cultivating crops in irrigated areas is expected to meet the total amount of CWR. Thus, the sum of effective rainfall and irrigation water is accounted as the total water withdrawal for crops cultivated in irrigated areas. This irrigation water is the additional amount of water required to reach the total CWR. In general, to calculate the amount of irrigation water requirement for irrigated agriculture, irrigation efficiency and water loss through percolation are taken into account as expressed by Equation (2) [33]. Even though the irrigation efficiency at 0.65 (for surface irrigation) is suggested by the specialist from RID using a rule of thumb approach, this factor depends also on geographical conditions.
Irrigation   water =   ( crop   water   use effective   rainfall ) + water   loss   ( percolation ) × 100 Irrigation   efficiency   *
Remark: * Irrigation efficiency = 0.65 [derived from the efficiency of water conveyance (0.9) × efficiency of irrigation system (0.9) × efficiency of irrigation (0.8)].

2.4. Water Scarcity Footprint Assessment

The environmental impact of water use depends on not only the amount of water consumed but also the water stress situation of the area where the water was extracted. The water deprivation potential, or called as “water scarcity footprint”, is therefore proposed as the proxy indicator to determine and compare the potential impact of water use in view of the amount of water deficiency to downstream human users and ecosystems [14,19]. A low water scarcity footprint indicates lower impacts on water consumed. Equation (3) shows the general formula for water scarcity footprint assessment. The water scarcity footprint is calculated based on the “monthly water stress index (WSI)” of the 25 watersheds of Thailand [10]. The monthly WSI is derived from the ratio of monthly total water withdrawals to hydrological availability of a watershed. This index does not account for water pollution which is captured by other indicators such as eutrophication, acidification, toxicity, etc. The temporal aspects of the monthly WSI for the 25 watersheds were evaluated based on the seasonal and monthly variations of water consumption in agriculture for each watershed due to different cropping systems and cycles [10]. Table 3 shows the monthly WSI of the Mun, Chi, Chao Phraya, and Tha Chin watersheds.
Water scarcity footprintrice,i = Irrigation water userice,i × WSIi
where, irrigation water userice,i represents the amount of irrigation water use for rice cultivation in the watershed i; WSIi represents the water stress index of watershed (i). The water scarcity footprint is measured in terms of “m3 H2Oeq”. Actually, only the actual amount of irrigation water consumption for rice should be used for calculating the water scarcity footprint. The standing water in a rice field that can percolate and recharge surface water and ground water should not be considered as a loss for the catchment area [34]. However, the volumetric irrigation water used for rice cultivation is referred to in the study because its timing of use will contribute to the local water availability in the region. Policy makers have also considered the amount of standing water as well as water percolation loss in their irrigation water allocation plan for rice cultivation.

3. Results and Discussion

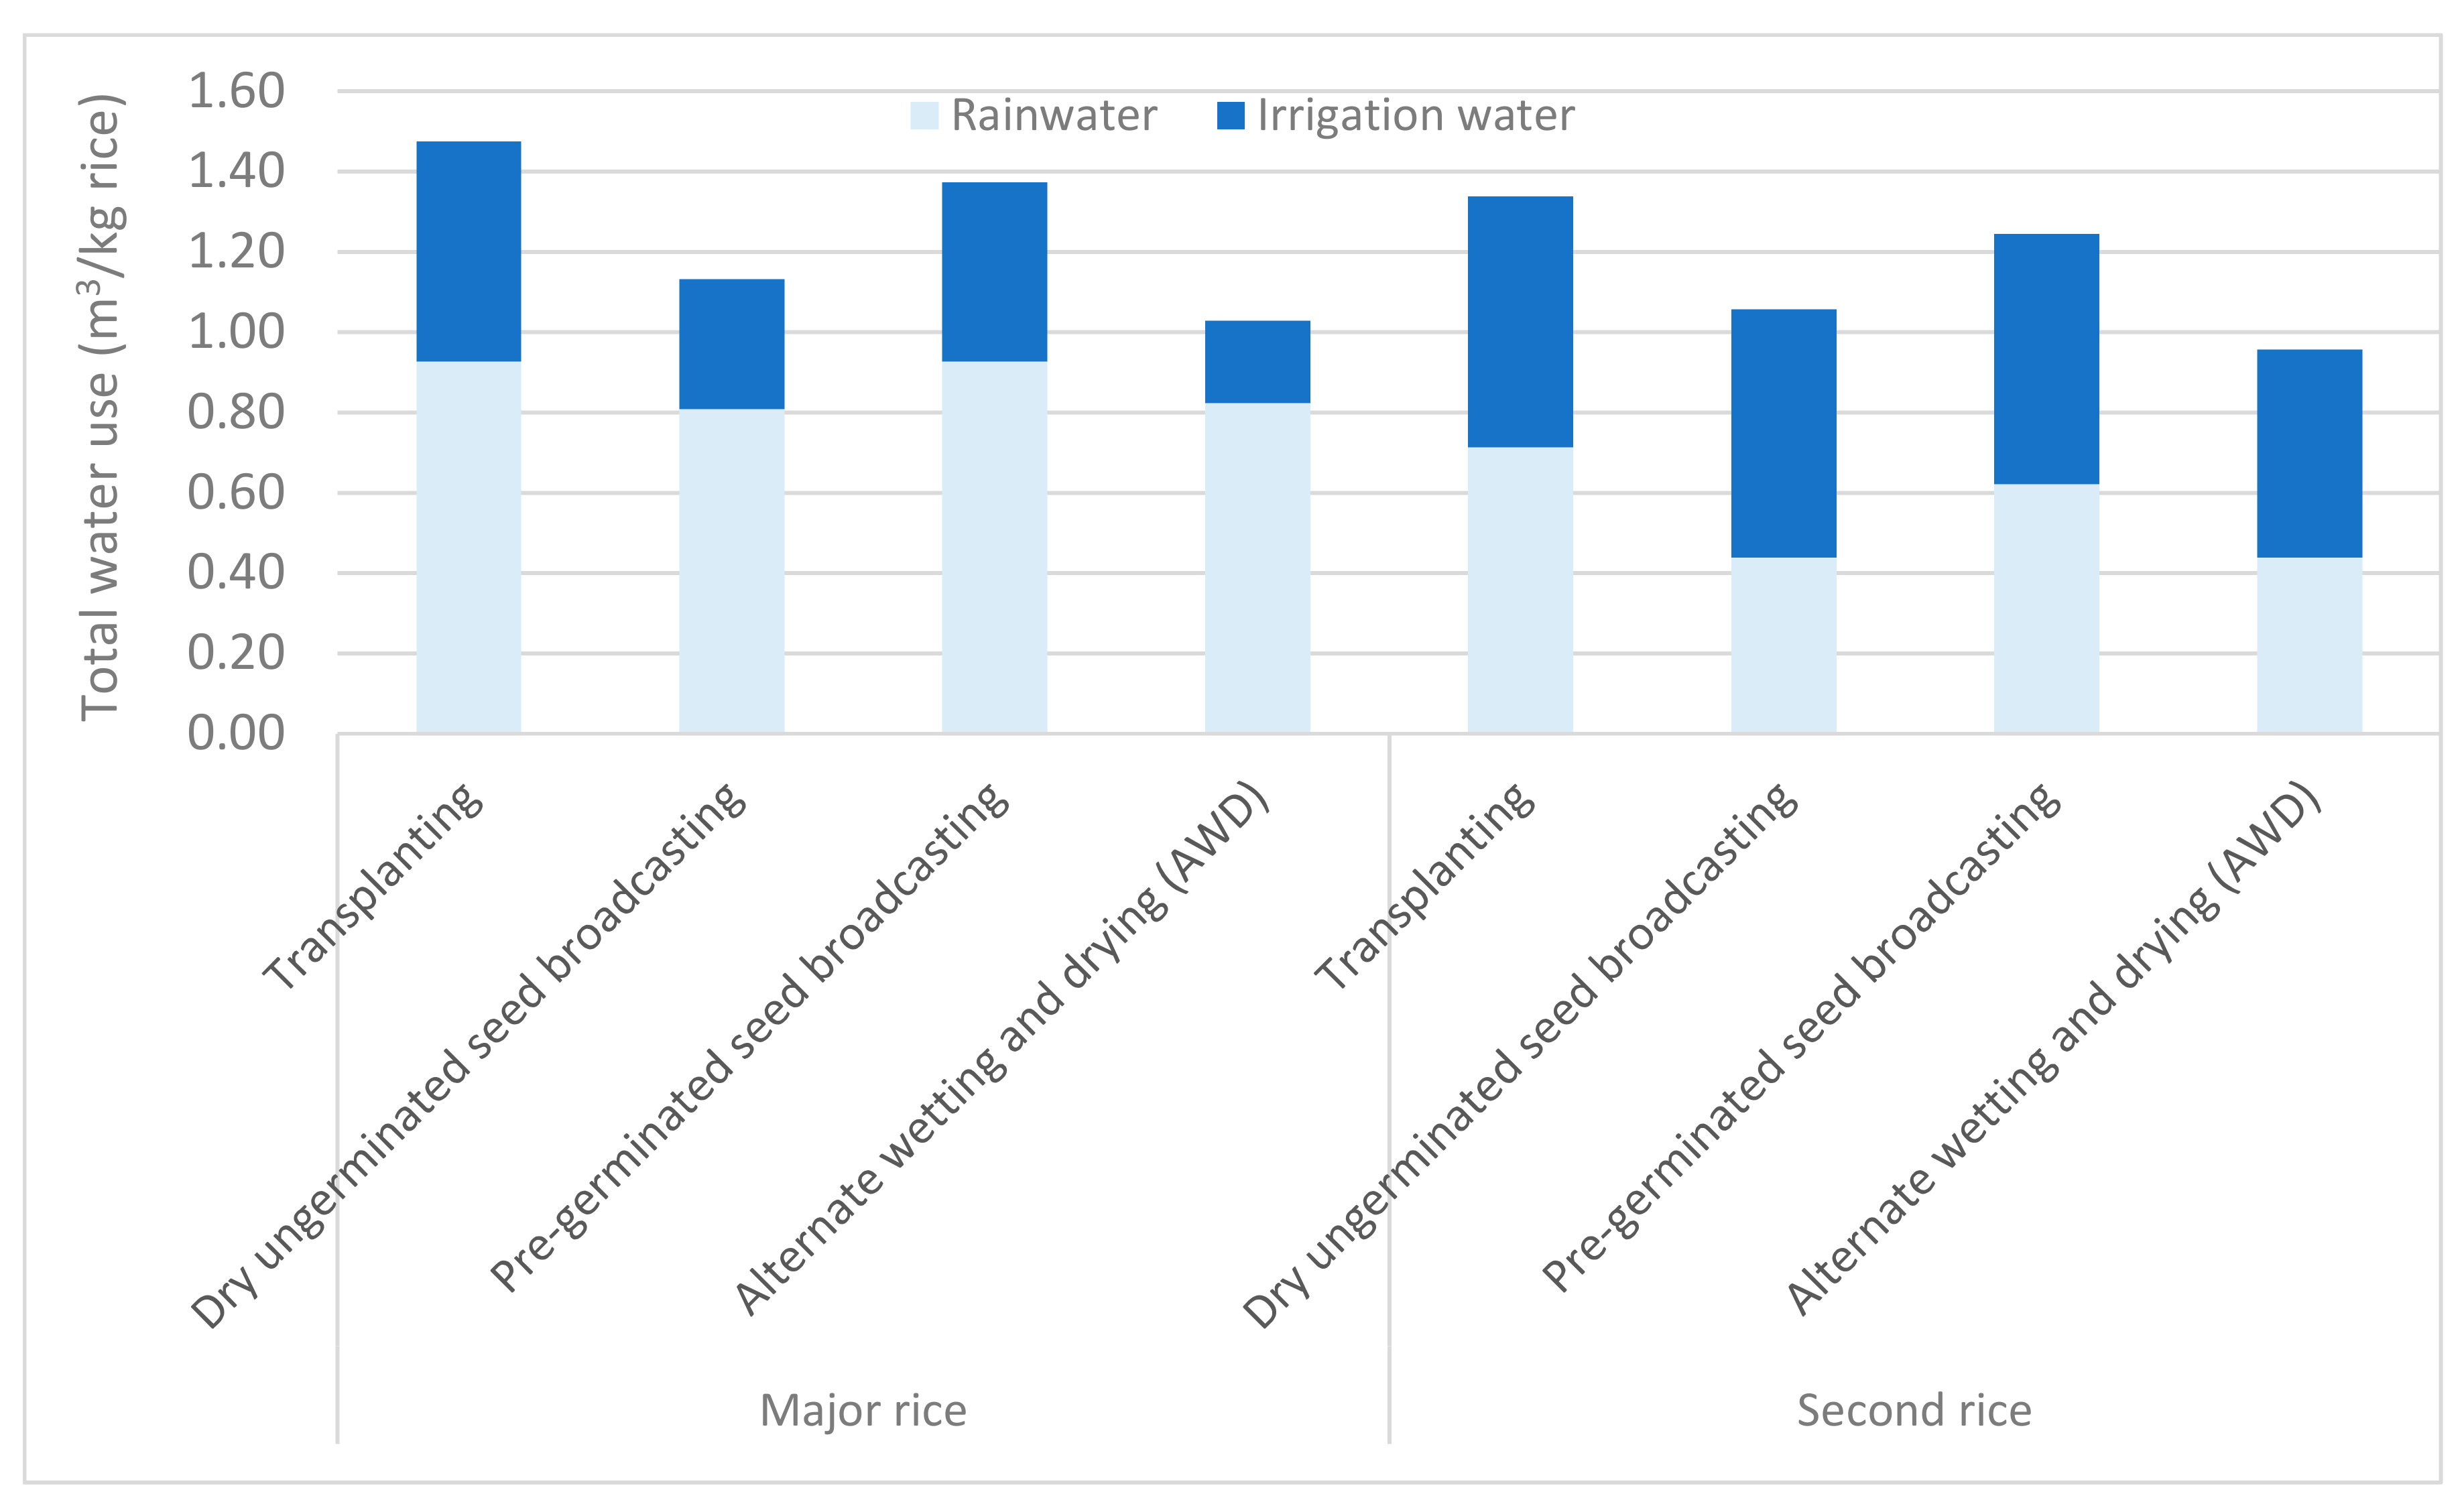
3.1. Water Use for Rice Cultivation in Different Watersheds

Table 4 shows the comparison of freshwater use for major and second rice cultivation in the Chao Phraya, Tha Chin, Mun, and Chi watersheds. For major rice, the results revealed that the total freshwater used per unit area for rice cultivation in those four watersheds is not different, i.e., ranging between 6800 and 7500 m3/ha. Rainwater is the main water source for major rice cultivation, sharing around 75% of total freshwater used. Irrigation water is used only when the rainwater is not sufficient to meet the CWR. However, per kilogram of rice product, the results showed a significant difference between major rice grown in the central region (Chao Phraya and Tha Chin) and the northeastern region (Mun and Chi), i.e., about 0.9–1.4 m3/kg and 2.2–3.0 m3/kg of rice, respectively. This is due to the differences in rice yields of each region. Rice yield depends on a number of factors, such as the crop variety, soil quality, fertilization, and treatment practices; however, the Mun watershed has the famous Hom Mali rice (Thai jasmine rice), whose yield is generally lower than ordinary rice.
Contrary to the major rice, irrigation water is the major source contributing around 70–75% of total water used for second rice cultivation. The yields obtained from the second rice cultivation in Mun and Chi are increased as compared to major rice because only the irrigated rice fields can grow the second rice. Meanwhile, the major rice grown in those two regions are rainfed and might be cultivated in a deficit condition as compared to the CWR if the rainfall if not enough. However, for the central region, the yields between major and second rice do not differ much because they are generally irrigated and enough water will be supplied to the field as per the crop’s requirement both for major rice and second rice cultivation. The total water used for second rice grown in Mun, Chao Phraya, Chi, and Tha Chin are about 2.30, 1.53, 1.14, and 0.89 m3/kg rice, respectively. The amount of water used can be divided into two main purposes, i.e., (1) the water used for rice growing and (2) percolation loss and standing water. The water used for rice growing based on the crop evapotranspiration is estimated to be around 55% of the total water used; the remaining being the percolation loss. Considering the irrigation water used, which the policy makers have to manage and allocate to other users as well, the results show that the lowest irrigation water used per kilogram of rice is for the second rice grown in Tha Chin, followed by Chi, Chao Phraya, and Mun.

3.2. Water Scarcity Footprint of Rice in Different Watersheds

To compare the potential impact from the freshwater use for rice cultivation in the different watersheds, the scarcity footprint is then assessed by combining the volume of irrigation water used for rice with the water stress index of each watershed and each period of time that water is used as shown in Equation (3). The irrigation water is focused in the scarcity assessment because it is the resource that will be competed for with other water users. Table 5 shows the water scarcity footprints of major and second rice cultivation in the four studied regions. The results show that although the total water used for rice grown in Mun is the highest, i.e., 2.81 m3/kg rice, the water scarcity footprint of major rice grown in Mun is almost equal to the Chao Phraya and Tha Chin watersheds, i.e., ranging between 0.28 and 0.31 m3 H2Oeq/kg rice. This implies that the water deprivation potential impact from freshwater used for major rice cultivation does not differ among the three studied watersheds. Only the rice grown in the Chi watershed has a much lower water scarcity footprint value, indicating lower potential impacts on water consumed [19]. The low water scarcity footprint of major rice cultivated in Mun and Chi is because of the lower water stress index during June to August of those two watersheds as compared to Chao Phraya and Tha Chin.
For second rice cultivation as well, the Chi watershed has to the lowest water deprivation potential, followed by the Mun, Tha Chin, and Chao Phraya watersheds. The high water scarcity footprint of second rice cultivated in Chao Phraya and Tha Chin watersheds is because, during January to March, the water stress index of both watersheds are indicated as severe. The irrigation water during those three months of dry season should therefore be considered as a scarce resource that needs to be used efficiently. In addition, the high amount of irrigation water used for second rice cultivation in the Chao Phraya watershed showed low efficiency of water use and need for further improvement. The water scarcity footprint results imply that second rice grown in Chao Phraya and Tha Chin should be focused on by the policy makers to identify measures for improving efficiency of irrigation water use. Otherwise, there will be a high risk of irrigation water competition between farmers who want to grow second rice and the other water users in those two watersheds. The obtained results of water scarcity footprint directly match the real situation in the country where there has been an increasing risk of freshwater shortage over the past two years that made farmers, especially in the central region like Chao Phraya and Tha Chin watersheds, lose production because of the lack of freshwater [35]. In case of drought, the second rice cultivation, which is recognized as water intensive, will be abandoned or delayed by the government in order to save water resources for domestic (sanitation) uses and for ecosystem preservation.

3.3. Recommendations for Enhancing Sustainable Rice Production

The results from water footprint assessment revealed that second rice cultivation in the central region of Thailand, like in the Chao Phraya and Tha Chin watersheds, will potentially face the challenge of water scarcity. To enhance sustainable rice production in those two watersheds, several measures should be encouraged or taken into account by the policy makers:

3.3.1. Improve Water Use Efficiency of Rice Cultivation

The study has compared the freshwater use for different rice cultivation systems including the traditional practices like the transplanting method, pre-germinated seed broadcasting, dry ungerminated seed broadcasting, and the alternate wetting and drying (AWD). The “AWD system”, a water-saving technique for rice cultivation, is being encouraged to farmers in order to reduce irrigation water use in rice fields due to the increasing water scarcity situation, without decreasing yields. In AWD, irrigation water is applied a few days after the disappearance of the ponded water. Hence, the field is alternately flooded and non-flooded. The number of days of non-flooded soil between irrigation events can vary from 1 to more than 10 days depending on a number of factors, such as soil type, weather, and crop growth stage. To implement AWD, a “field water tube” is used to monitor the water depth on the field. Figure 4 presents the estimated water use for second rice cultivation in the irrigated rice fields in the central region (Ayutthaya province, Chao Phraya watershed). The results revealed that the transplanting method brings about the highest water use at 1.34–1.48 m3/kg rice, followed by pre-germinated seed broadcasting (1.25–1.37 m3/kg), dry ungerminated seed broadcasting (1.06–1.17 m3/kg), and alternate wetting and drying (0.96–1.03 m3/kg). The high water use for transplanting and pre-germinated broadcasting is due to the water requirement for land preparation and standing water as compared to the AWD method. Thus, the AWD method can be an option for farmers in the area. The focus of the AWD method should be for second rice cultivation because for major rice cultivation, the control of water level in the field is difficult in practice as the water source relies on rainfall.
The Office of Agricultural Economics (OAE) revealed that about 92% of the second rice planted areas in the central region of Thailand followed the pre-germinated seed broadcasting system. Hence, it is estimated that if the AWD method is applied to replace the pre-germinated seed broadcasting method for second rice cultivation in the central region, the irrigation water requirement for rice would be reduced by around 570 m3/hectare or around 17% irrigation reduction. This estimation is based on the conservative assumption that the yield would not be affected by the difference in water delivery method, although several field experiments have indicated that the AWD would help increase the productivity of rice by around 10%. Of the total second rice planted areas in the central region of about 523,134 hectares, if 10% were changed to AWD method, the government would save around 298 million m3 of irrigation water. However, the challenge is that the farmers must be able to control the water level in their fields appropriately, and manual weed control may be required because of less standing water in the field as compared to the traditional rice cultivation. Hence, more efforts of farmers for field management are required, which might in turn lead to the increased cost and working time spent as compared to the traditional practice.

3.3.2. Expansion of Irrigated Areas

The assessment revealed that the irrigated rice fields bring about higher productivity than the rainfed ones. Thailand is an agro-industry-based country; however, the irrigation area is nowadays just only 4.8 million hectares or about 20% of the total agricultural areas. This is one of the constraints to the development of productivity and competitiveness of the Thai agriculture industry because the production is very dependent on rainfall. This is also one of the reasons that rice yields have been lower in Thailand than in other rice-producing countries. Apart from the expansion of irrigated areas, the irrigation efficiency should also be improved by reducing loss of water conveyance, setting the water distribution schedule appropriate to the crop growing, etc.

3.3.3. Agricultural Zoning by Integrating the Water Stress Index

The agricultural zoning system is gaining attraction by the policy makers. The crop zoning policy is expected to mitigate the risks of farmers on low-productivity crop production, simultaneously helping manage the supply of crops in the market to avoid overproduction, which in turn will bring about lower prices. The suitable agricultural zones are generally identified by using the agricultural land use data and matching it with the criteria such as (1) natural factors, e.g., soil conditions, water (rainfall), sunlight, and humidity data for a particular region like district and provinces; and (2) crop requirement for those natural resources in order to create the land suitability level for each crop and to identify how much of the current planted area of crops are on the suitable and non-suitable land. This approach is well recognized for identification of the suitable agricultural zones for the crops for a particular region because all the natural factors essential for crop growing are accounted in the screening process. However, it does not consider the external challenges such as the actual available water in that particular region, both the current situation (after accounting the water demands for other uses in the area) and future scenarios (if the land use for crops is changed according to the zoning policy as well as according to the demands for crops in the future). Water competition might occur in the future if zoning is set on areas that are currently facing water stress. The water stress index (WSI) should therefore be used as one of the criteria for future agricultural zoning. Also, the water scarcity footprint should be applied to identify the water use impact potential from rice cultivation in other regions.
Additionally, the implication of this research study is not only specific for enhancing sustainable rice cultivation in Thailand but can also extended to other rice-producing countries. This is especially for the countries in Asia where climatic modeling results show that the global temperature will rise and the flooded rice production areas are expected to shrink in the future [36]. It has been estimated that around 13 Mha of the irrigated wetland rice in Asia may confront physical water scarcity; meanwhile, around 22 Mha of the irrigated dry-season rice may suffer from economic water scarcity [37]. The potential use of research results is as follows: (1) use of the water scarcity index as well as water scarcity footprint assessment for each country for informing policy makers on rice cultivation planning, and (2) use of the alternative rice cultivation practices in the study, such as the alternate wetting and drying (AWD) method, as an option in the suitable areas.

4. Conclusions

The study integrated the volumetric freshwater use, water stress index, and water scarcity footprint as a tool for enhancing sustainable rice cultivation in Thailand in view of water sustainability. The major and second rice cultivation systems in the central region (Chao Phraya and Tha Chin watersheds) and the northeastern region (Mun and Chi watersheds) have been investigated and assessed. The results revealed that a wide range of freshwater is used among the watersheds, i.e., 0.9–3.0 m3/kg of major rice and 0.9–2.3 m3/kg of second rice. The variability of water used stems from factors such as rice productivity, cultivation practices of farmers, irrigation water availability, etc. The total water used shows high water consumption of rice grown in the northeastern regions, like the Mun and Chi watersheds. However, based on the results of the water scarcity footprint, the second rice cultivation in the central region, like the Chao Phraya and Tha Chin watersheds, should be focused by the policy makers to identify measures for improving the efficiency of irrigation water use. This is because of the higher water scarcity footprint values obtained from second rice cultivation in both watersheds. Hence, the water scarcity footprint approach can be useful for identifying the water risks of irrigation water use in view of water deprivation potential, instead of focusing only the total amount of water used. To enhance the water use efficiency for rice cultivation, AWD was found to be a promising approach to substitute the pre-germinated seed broadcasting system, which is the common practice for second rice cultivation in the central region of Thailand. From this practice change, the irrigation water requirement for rice would be reduced by around 570 m3/hectare or around 17% irrigation reduction. Further recommendations for policy makers in order to improve the water use efficiency of rice and the use of water stress index and water scarcity assessment as the tool for agricultural zoning policy have also been discussed.

Acknowledgments

The authors would like to gratefully thank for financial support the Agricultural Division (Division 2) under the Thailand Research Fund (RDG5620052) for implementing the project “Water footprinting of food, feed, fuel, and fibre for effective water resource management (Phase II)”, the King Mongkut’s University of Technology Thonburi, and the Thailand Research Fund (Grant No. TRG5980018).

Author Contributions

All authors contributed to the data collection; N.P., N.L. and T.S. analyzed the data; T.S. wrote the paper and S.G. corrected it.

Conflicts of Interest

The authors declare no conflict of interest.

References

  1. IRRI. Rice Facts. Available online: http://www.sustainablerice.org/Resources/ (accessed on 1 October 2017).
  2. Food and Agriculture Organization of the United Nations (FAO). Energy-Smart for People and Climate; Issue Paper; FAO: Rome, Italy, 2011. [Google Scholar]
  3. Hoff, H. Understanding the Nexus. In Proceedings of the Bonn 2011 Conference: The Water, Energy and Food Security Nexus, Stockholm, Sweden, 16–18 November 2011; Stockholm Environment Institute (SEI): Stockholm, Sweden, 2011. [Google Scholar]
  4. World Bank. Databank: Agricultural Land (% of Land Area). Available online: https://data.worldbank.org/indicator/AG.LND.AGRI.ZS (accessed on 5 May 2017).
  5. Hoekstra, A.Y.; Chapagain, A.K. Water footprints of nations: Water use by people as a function of their consumption pattern. Water Resour. Manag. 2007, 21, 35–48. [Google Scholar] [CrossRef]
  6. World Economic Forum (WEF). The Global Risks Report 2017; WEF: Cologny, Switzerland, 2017. [Google Scholar]
  7. Zhang, G.P.; Hoekstra, A.Y.; Mathews, R.E. Water footprint assessment (WFA) for better water governance and sustainable development. Water Resour. Ind. 2013, 1–2, 1–6. [Google Scholar] [CrossRef]
  8. Gheewala, S.H.; Silalertusksa, T.; Nilsalab, P.; Mungkung, R.; Perret, S.R.; Chaiyawannakarn, N. Water footprint and impact of water consumption for food, feed, fuel crops production in Thailand. Water 2014, 6, 1698–1718. [Google Scholar] [CrossRef] [Green Version]
  9. Gheewala, S.H.; Silalertruksa, T.; Nilsalab, P.; Mungkung, R.; Perret, S.R.; Chaiyawannakarn, N. Implications of the biofuels policy mandate in Thailand on water: The case of bioethanol. Bioresour. Technol. 2013, 150, 457–465. [Google Scholar] [CrossRef] [PubMed]
  10. Gheewala, S.H.; Silalertusksa, T.; Nilsalab, P.; Lecksiwilai, N.; Sawaengsak, W.; Mungkung, R.; Ganasut, J. Water stress index and its implication for agricultural land-use policy in Thailand. Int. J. Environ. Sci. Technol. 2017. [Google Scholar] [CrossRef]
  11. Xinchun, C.; Mengyan, W.; Xiangping, G.; Yalian, Z.; Yan, G.; Nan, W.; Weiguang, W. Assessing water scarcity in agricultural production system based on generalized water resources and water footprint framework. Sci. Total Environ. 2017, 609, 587–597. [Google Scholar] [CrossRef] [PubMed]
  12. Mekonnen, M.M.; Hoekstra, A.Y. The green, blue and grey water footprint of crops and derived crop products. Hydrol. Earth Syst. Sci. 2011, 15, 1577–1600. [Google Scholar] [CrossRef] [Green Version]
  13. Mekonnen, M.M.; Hoekstra, A.Y. Water footprint benchmarks for crop production: A first global assessment. Ecol. Indic. 2014, 46, 214–223. [Google Scholar] [CrossRef]
  14. Pfister, S.; Bayer, P. Monthly water stress: Spatially and temporally explicit consumptive water footprint of global crop production. J. Clean. Prod. 2014, 73, 52–62. [Google Scholar] [CrossRef]
  15. Lovarelli, D.; Bacenetti, J.; Fiala, M. Water Footprint of crop productions: A review. Sci. Total Environ. 2016, 548–549, 236–251. [Google Scholar] [CrossRef] [PubMed]
  16. Hoekstra, A.J. A critique on the water-scarcity weighted water footprint in LCA. Ecol. Indic. 2016, 66, 564–573. [Google Scholar] [CrossRef]
  17. Pfister, S.; Boulay, A.-M.; Berger, M.; Hadjikakou, M.; Motoshita, M.; Hess, T.; Ridoutt, B.; Weinzettel, J.; Scherer, L.; Döll, P.; et al. Understanding the LCA and ISO water footprint: A response to Hoekstra (2016) “A critique on the water-scarcity weighted water footprint in LCA”. Ecol. Indic. 2017, 72, 352–359. [Google Scholar] [CrossRef]
  18. Hoekstra, A.Y.; Chapagain, A.K.; Zhang, B. Water footprints and sustainable water allocation. Sustainability 2016, 8, 20. [Google Scholar] [CrossRef]
  19. Pfister, S.; Koehler, A.; Hellweg, S. Assessing the environmental impacts of freshwater consumption in LCA. Environ. Sci. Technol. 2009, 43, 4098–4104. [Google Scholar] [CrossRef] [PubMed]
  20. Yano, S.; Hanasaki, N.; Itsubo, N.; Oki, T. Water scarcity footprints by considering the differences in water sources. Sustainability 2015, 7, 9753–9772. [Google Scholar] [CrossRef]
  21. Chapagain, A.K.; Hoekstra, A.Y. The blue, green and grey water footprint of rice from production and consumption perspectives. Ecol. Econ. 2011, 70, 749–758. [Google Scholar] [CrossRef]
  22. Shrestha, S.; Chapagain, R.; Babel, M.S. Quantifying the impact of climate change on crop yield and water footprint of rice in the Nam Oon Irrigation Project, Thailand. Sci. Total Environ. 2017, 599–600, 689–699. [Google Scholar] [CrossRef] [PubMed]
  23. Marano, R.P.; Filippi, R.A. Water footprint in paddy rice systems. Its determination in the provinces of Santa Fe and Entre Ríos, Argentina. Ecol. Indic. 2015, 56, 229–236. [Google Scholar]
  24. Jeswani, H.K.; Azapagic, A. Water footprint: Methodologies and a case study for assessing the impacts of water use. J. Clean. Prod. 2011, 19, 1288–1299. [Google Scholar] [CrossRef]
  25. Nunez, M.; Pfister, S.; Anton, A.; Munoz, P.; Hellweg, S.; Koehler, A.; Rieradevall, J. Assessing the environmental impact of water consumption by energy crops grown in Spain. J. Ind. Ecol. 2012, 17, 90–102. [Google Scholar] [CrossRef]
  26. Office of Agricultural Economics (OAE). Basic Information of Agricultural Economics; OAE: Bangkok, Thailand, 2016.
  27. Allen, R.G.; Pereira, L.S.; Raes, D.; Smith, M. Crop Evapotranspiration: Guidelines for Computing Crop Water Requirements; FAO Drainage and Irrigation Paper 56; Food and Agriculture Organization: Rome, Italy, 1998. [Google Scholar]
  28. Food and Agriculture Organization of the United Nations (FAO). CROPWAT 8.0 Model; FAO: Rome, Italy, 2010. [Google Scholar]
  29. RID. Estimation of Crop Water Requirement during Crop Cultivation; Royal Irrigation Department, Ministry of Agriculture and Cooperatives: Bangkok, Thailand, 2010. Available online: http://water.rid.go.th/hwm/cropwater (accessed on 15 July 2016).
  30. RID. Crop Water Requirement; Work Manual No. 7/16; Royal Irrigation Department, Ministry of Agriculture and Cooperatives: Bangkok, Thailand, 2011. Available online: http://ridceo.rid.go.th/buriram/download/manual-07.pdf (accessed on 15 July 2016).
  31. Thai Meteorological Department (TMD). Mean Monthly Rainfall in Thailand (mm) 30 Year; TMD: Bangkok, Thailand, 2014.
  32. Brouwer, C.; Heibloem, M. Irrigation Water Management, Training Manuals; Food and Agriculture Organization of the United Nations: Rome, Italy, 1986. [Google Scholar]
  33. RID. Assessing Water Consumption by Sectors. Work Manual No. 8/16; 2011. Available online: http://ridceo.rid.go.th/buriram/download/manual-08.pdf (accessed on 17 October 2012). (In Thailand)
  34. Bouman, B.A.M.; Humphreys, E.; Tuong, T.P.; Barker, R.; Donald, L.S. Rice and Water; Advances in Agronomy; Academic Press: Cambridge, MA, USA, 2007; pp. 187–237. [Google Scholar]
  35. LDD. Repetitive Drought areas in Thailand 2015; Land Development Department, Ministry of Agriculture and Cooperatives: Bangkok, Thailand, 2015.
  36. Korres, N.E.; Norsworthy, J.K.; Burgos, N.R.; Oosterhuis, D.M. Temperature and drought impacts on rice production: An agronomic perspective regarding short- and long-term adaptation measures. Water Resour. Rural Dev. 2017, 9, 12–27. [Google Scholar] [CrossRef]
  37. Tuong, T.P.; Bouman, B.A.M. Rice production in water-scarce environments. In Water Productivity in Agriculture: Limits and Opportunities for Improvements; Kijne, J.W., Barker, R., Molden, D., Eds.; CABI Publishing: Oxfordshire, UK, 2003; pp. 53–67. [Google Scholar]
Figure 1. Mun, Chi, Chao Phraya, and Tha Chin watersheds of Thailand.
Sustainability 09 02283 g001
Figure 2. Rice cultivation system and water use.
Sustainability 09 02283 g002
Figure 3. Cropping calendar for rice cultivation. Note: UW: Upper watershed; LW: Lower watershed.
Sustainability 09 02283 g003
Figure 4. Water use for different rice cultivation methods in the central region of Thailand.
Sustainability 09 02283 g004
Table 1. Rice productions and yields in Thailand classified by regions (Year 2015).
WatershedPlantation Areas (ha)Rice Production (Tonne)Yields (t/ha)
Major RiceSecond RiceTotalMajor RiceSecond RiceTotalMajor RiceSecond RiceTotal
North2,042,903594,6602,637,5636,801,7182,339,5519,141,2693.333.933.47
Northeast5,790,946188,8705,979,81512,230,973606,67712,837,6502.113.212.15
Central1,321,831523,1341,844,9654,904,4102,244,6697,149,0793.714.293.87
South134,47647,058181,534374,438156,018530,4562.783.322.92
Total country9,290,156822,03010,112,18624,311,5395,346,91529,658,4542.626.502.93
Table 2. Data sources.
WatershedProvincesData Collection Area (Hectare)
Major RiceSecond Rice
Chao PhrayaPathum Thani, Ayutthaya, Nakhon Sawan, Chai Nat, Lop Buri 34432607
Tha ChinSuphan Buri, Kanchanaburi, Nakhon Pathom322297
MunUbon Ratchathani ,Nakhon Ratchasima, Buri Ram1020362
ChiNakhon Ratchasima, Chaiyaphum, Kalasin, Khon Kaen828245
Table 3. Monthly water stress index (WSI) of the four selected watersheds [10].
Monthly WSI (Dimensionless)
JanuaryFebruaryMarchAprilMayJuneJulyAugustSeptemberOctoberNovemberDecember
Chao Phraya1.001.000.990.080.040.520.900.860.280.050.350.98
Tha Chin1.001.000.940.040.030.420.760.820.280.040.060.69
Mun0.080.070.020.020.020.370.360.340.250.030.010.04
Chi0.100.070.030.020.020.210.340.180.200.030.020.03
Table 4. Water use of rice production in different watersheds.
ParameterUnitChao PhrayaTha ChinMunChi
Major riceYieldkg/ha5088 (5019–5156)5769 (5519–6631)2669 (2569–2769)2994 (2919–3069)
Total water usedm3/ha7275559674996796
(7026–7528)(5077–7493)(6653–8389)(6421–7181)
m3/kg1.43 (1.4–1.46)0.97 (0.92–1.13)2.81 (2.59–3.03)2.27 (2.2–2.34)
Rain water usedm3/ha5495409652046317
(5270–5723)(3698–5637)(4470–5981)(5983–6659)
m3/kg1.08 (1.05–1.11)0.71 (0.67–0.85)1.95 (1.74–2.16)2.11 (2.05–2.17)
Irrigation water usedm3/ha178115002268449
(1656–1908)(1214–2586)(1772–2796)(359–552)
m3/kg0.35 (0.33–0.37)0.26 (0.22–0.39)0.85 (0.69–1.01)0.15 (0.12–0.18)
Second riceYieldkg/ha5525 (5350–5700)5300 (4844–6881)3375 (3363–4688)4088 (2813–5625)
Total water usedm3/ha8453471777634660
(7918–9006)(3875–8258)(5178–11,156)(2813–8438)
m3/kg1.53 (1.48–1.58)0.89 (0.8–1.2)2.30 (1.54–2.38)1.14 (1.0–1.5)
Rain water usedm3/ha2100132523631390
(1926–2280)(872–3303)(673–3609)(844–2250)
m3/kg0.38 (0.36–0.4)0.25 (0.18–0.48)0.70 (0.20–0.77)0.34 (0.30–0.40)
Irrigation water usedm3/ha6354339254003270
(5939–6783)(2761–6124)(4506–7547)(1969–6750)
m3/kg1.15 (1.11–1.19)0.64 (0.57–0.89)1.60 (1.34–1.61)0.80 (0.7–1.2)
Table 5. Water scarcity footprint of rice production in different watersheds.
UnitChao PhrayaTha ChinMunChi
Major riceTotal water usem3/kg rice1.430.972.812.27
Water scarcity footprintm3 H2Oeq/kg rice0.310.280.290.04
Second riceTotal water usem3/kg rice1.530.892.301.14
Water scarcity footprintm3 H2Oeq/kg rice1.150.620.100.06

