1. Introduction
Sector-specific aid has direct effects on foreign direct investment (FDI) and aid-financed infrastructure has provided higher preference to foreign investors than other aid [
1,
2]. From donor the perspective of donor countries, direct investment in recipient countries is a kind of reciprocal benefits situation, according to anticipation on improving their endowment with infrastructure in transportation, communication, energy, and finance. Other direct effects of official development assistance (ODA) than FDI are construction project orders awarded by contractors from donor countries [
3]. For instance, Chinese companies have increased their market shares through China’s ODA. For projects in which Japanese companies have participated, the Japanese government has supported a portion of the construction project fund since 2014 [
4]. Centered on untied grants linked to normative elements of human rights and good governance, the EU has established a multilateral aid system primarily through the OECD’s Development Assistance Committee. Denmark, which is one of the top six donor countries in terms of ODA as a percentage of gross national income (GNI), holds the position that the eradication of poverty in underdeveloped countries results in benefits for developed countries in the long run. On the other hand, as a major emerging donor, China, with no intention to intervene in the domestic politics, has expanded trade and investment-linked ODA mainly through its bilateral relations with recipient countries. Accordingly, conventional donors and emerging donors have become a new agenda in reforming the international aid system. Thus, understanding the discourses and contentions in aiding recipients between the EU and China will provide key insights as to how South Korea will assume a bridging role between conventional donors and emerging donors. It is under such circumstances that South Korea held the 13th National Assembly Financial Forum for International Development in July 2015. The participants in this forum discussed practical solutions to support overseas construction businesses. As consequences, the South Korean government has expanded the budget for ODA and establishment of a strategy for maintaining competitive advantages in the Asian region to counter the establishment of the Asian Infrastructure Investment Bank (AIIB).
Various studies have been conducted to explore the correlations between the ODA from donor countries and national economic growth of recipient countries. However, the scope of these studies is limited to the correlations between the ODA from the donor countries and the number of construction projects awarded to companies originating from the recipient countries.
From the perspective of a donor country, to establish strategies to expand its market-share by facilitating ODA while contributing to the development of a recipient country, it is necessary to predict the requirements for ODA in terms of number and budgets and the variations. Therefore, a couple of questions raised regarding the effects of ODA on the both parties, recipient and donor countries, are: (1) does ODA for specific sectors influence the general economic status of recipient countries? if so, then (2) are the effects of ODA generally irrelevant to economic fundamentals of recipient countries? and finally (3) can a specific business sector of donor countries, construction industry in this research, be influence by ODA? As the philosophy of ODA is currently changing, some donor countries including South Korea are gradually increasing the amount of ODA, and are utilizing ODA to win overseas construction contracts. This study analyzed the impact of ODA on the performance of the companies of a donor country in a recipient country, especially in winning construction contracts. Several studies have focused on ODA and its impact on the economic development in recipient countries [
5]. Some of these researches have been published by OECD [
6]. However, it appears that only a few studies focused on the relationship between ODA and the probability of a donor country winning construction contracts in each recipient country. The latest approach is to focus on specific recipient and donor countries. Sahoo and Bishnoi [
7] analyzed the role of Japanese ODA in enhancing infrastructure development in India.
Despite few references and empirical data, due to the limited budget of ODA, donor countries have to establish priorities such as performance of specific business sector of donor country and contribution to the development of recipient countries. It is challenging to prove the latter. However, it is necessary to predict the requirements for ODA in terms of number and budget, which could help the governments in assigning financial resources. It is in this aspect that the performance of the construction industry can indicate an ODA requirement trend for budgeting and provide a rationale to persuade tax payers of donor countries.
The objective of the research is to present an analytical model considering the correlations between the competitiveness of ODA donor countries in local construction markets and the general economic status of ODA recipient countries. The model is validated by analyzing the performance of South Korean construction companies in terms of project orders awarded by them and the economic variables representing the variation in economic situations of recipient countries that the South Korean government have provided ODA. As a preliminary analysis to evaluate the characteristics of the time-series data obtained, the unit root and Granger causality tests are conducted. A model to explore the relations is established by introducing the Vector Error Correction Modeling method.
2. Background
2.1. Status of South Korea’s Overseas Construction Business
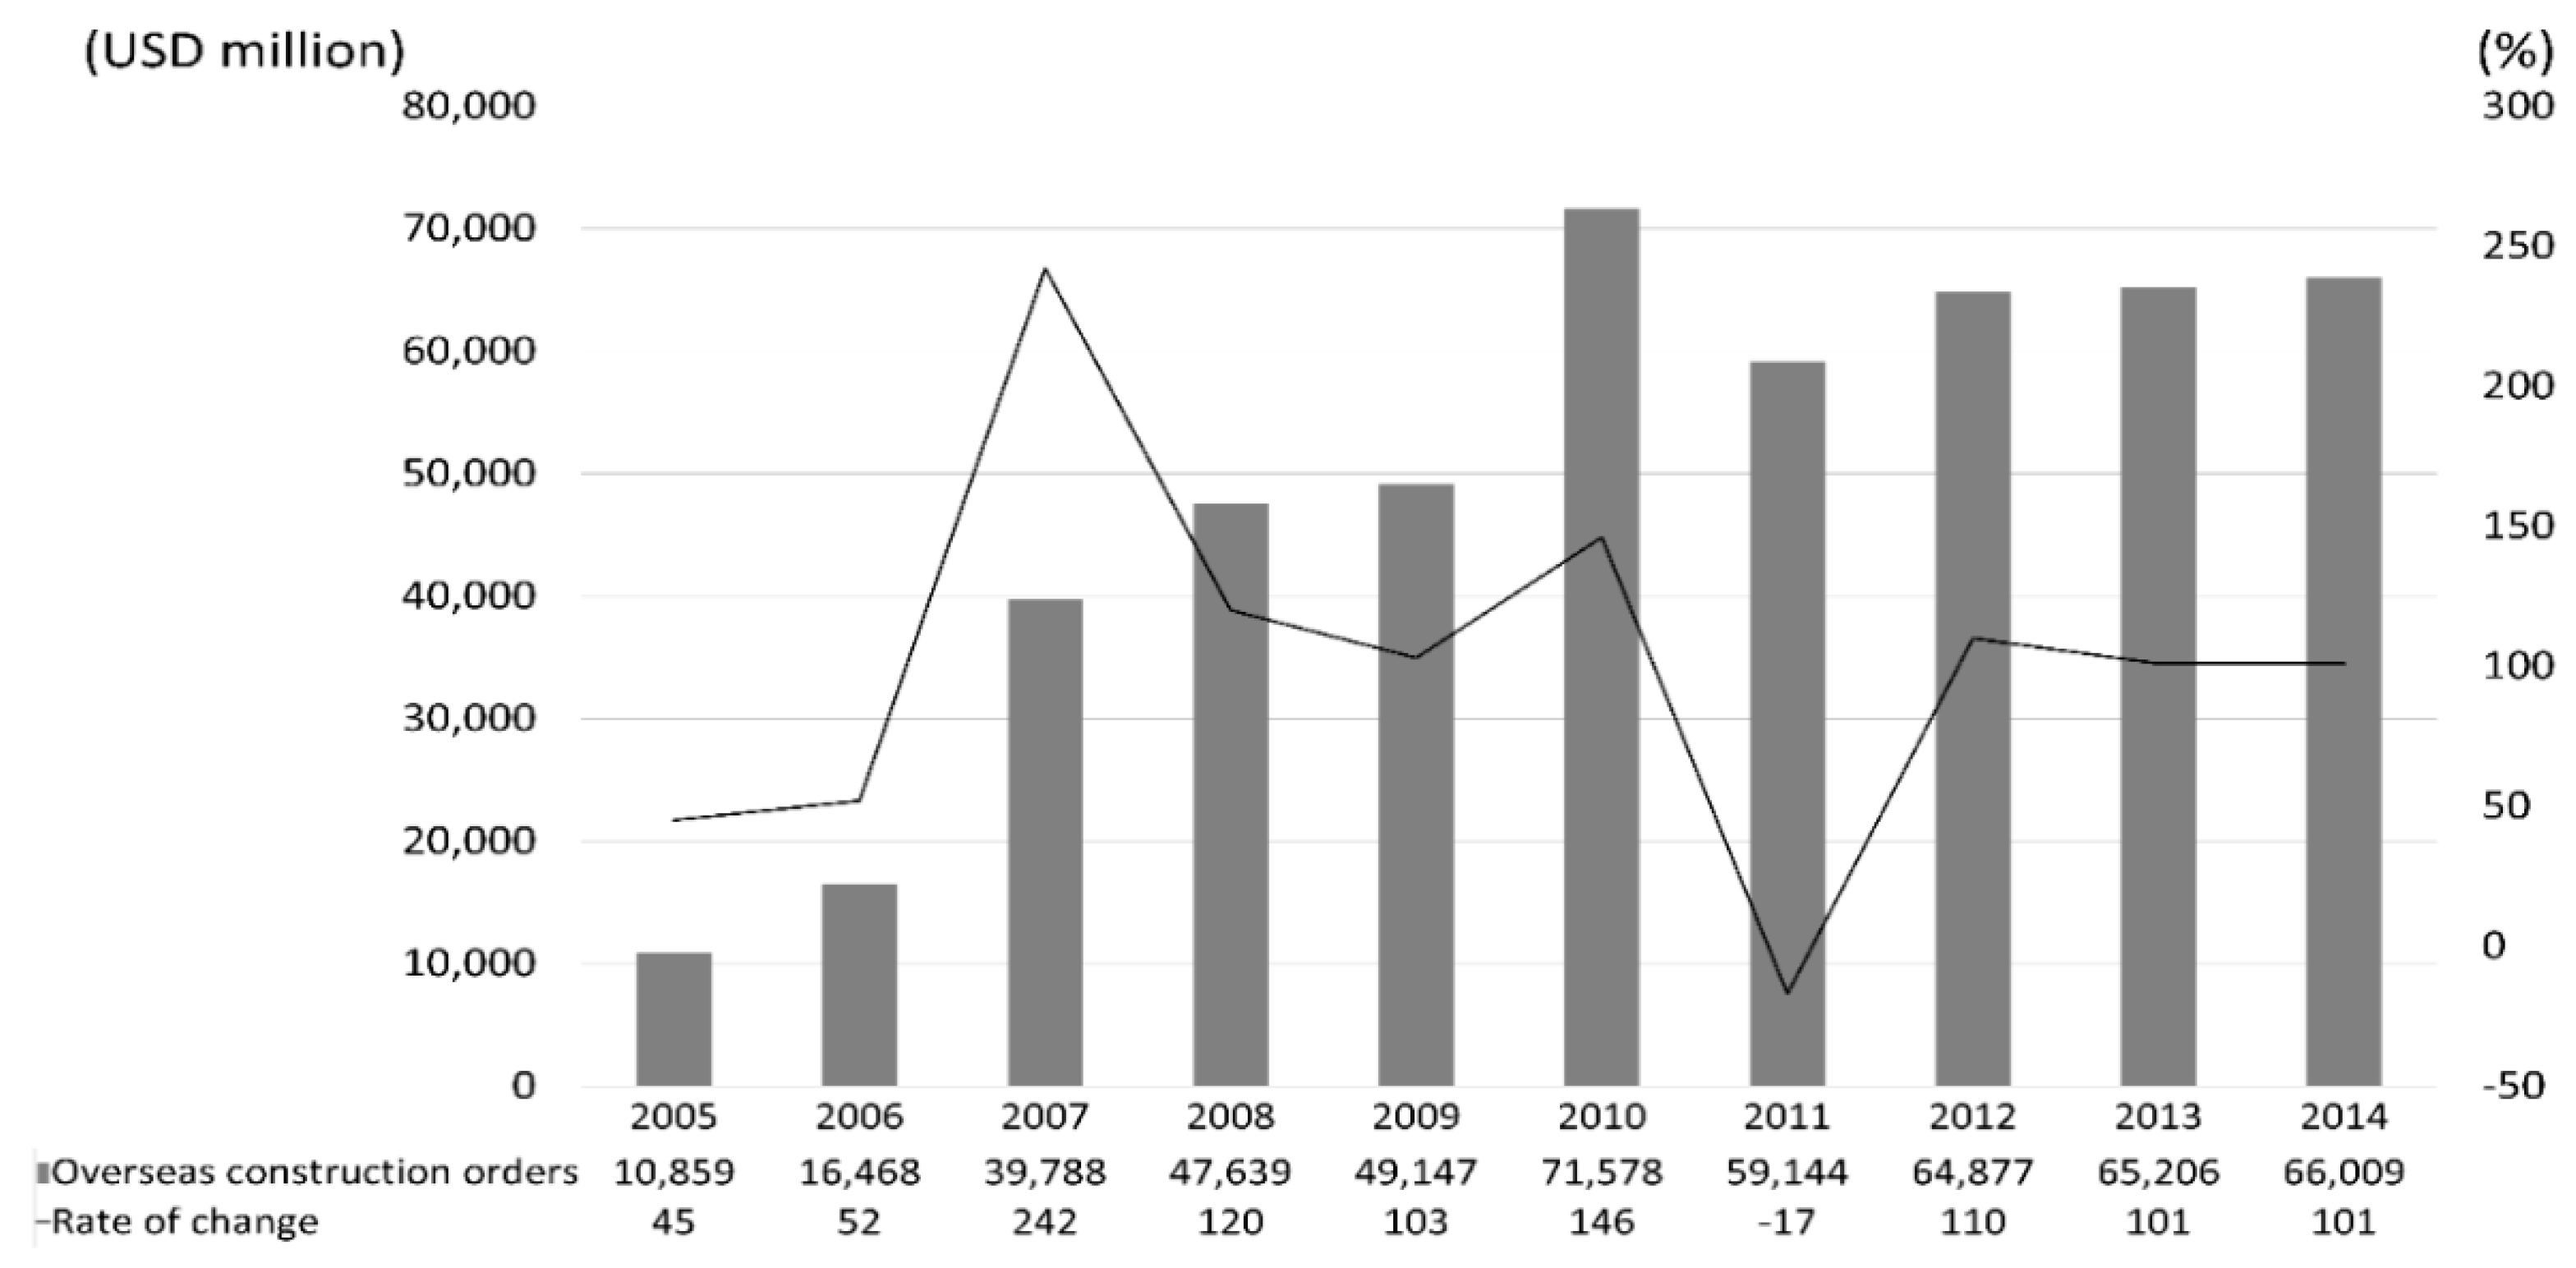
Since 2005, South Korea’s overseas construction business has continuously increased, reaching its peak of approximately USD 71.6 million in 2010, and it is recovering after an intermediate decline, as illustrated in
Figure 1.
However, the rate of increase of project orders awarded by South Korean construction companies after 2011 is 3.7%, which is significantly lower than the annual growth rate of the international construction business, which is estimated to be 10% [
9]. According to the statistics of the International Constructors Association, in 2014, the Middle East was the most prominent region for the South Korean construction business, accounting for 47.5% of its total worldwide orders. As the shares of South Korean construction companies in the global construction market were expected to decrease because of the economic fluctuations globally, which include a reduction in the prices of crude oil and natural gas, the competitive advantage of these companies in the cash-cow market segments has been challenged by emerging countries. In such circumstances, South Korean companies established 726 local corporations in Asia, occupying over 63% of worldwide investments, for better profitability. However, they continue to lack localization skills and, furthermore, require a fresh strategy for stabilizing their position in the regional market. Thereby, an in-depth discussion for establishing the strategy for each regional market segment from the country level to the regional level is required.
2.2. Status of Korea’s Official Development Assistance
In 1987, South Korea attained the status of a donor country to the World Bank and in 1991 established the Korea International Cooperation Agency (KOICA) for aiding other countries. In the 2000s, it became the first ODA donor among developing countries. Although its economic power decreased because of the 2008 global financial crisis, its aid continued to increase, and it went on to join the Organization of Economic Co-Operation Development/Development Assistance Committee (OECD/DAC) in 2010 [
10].
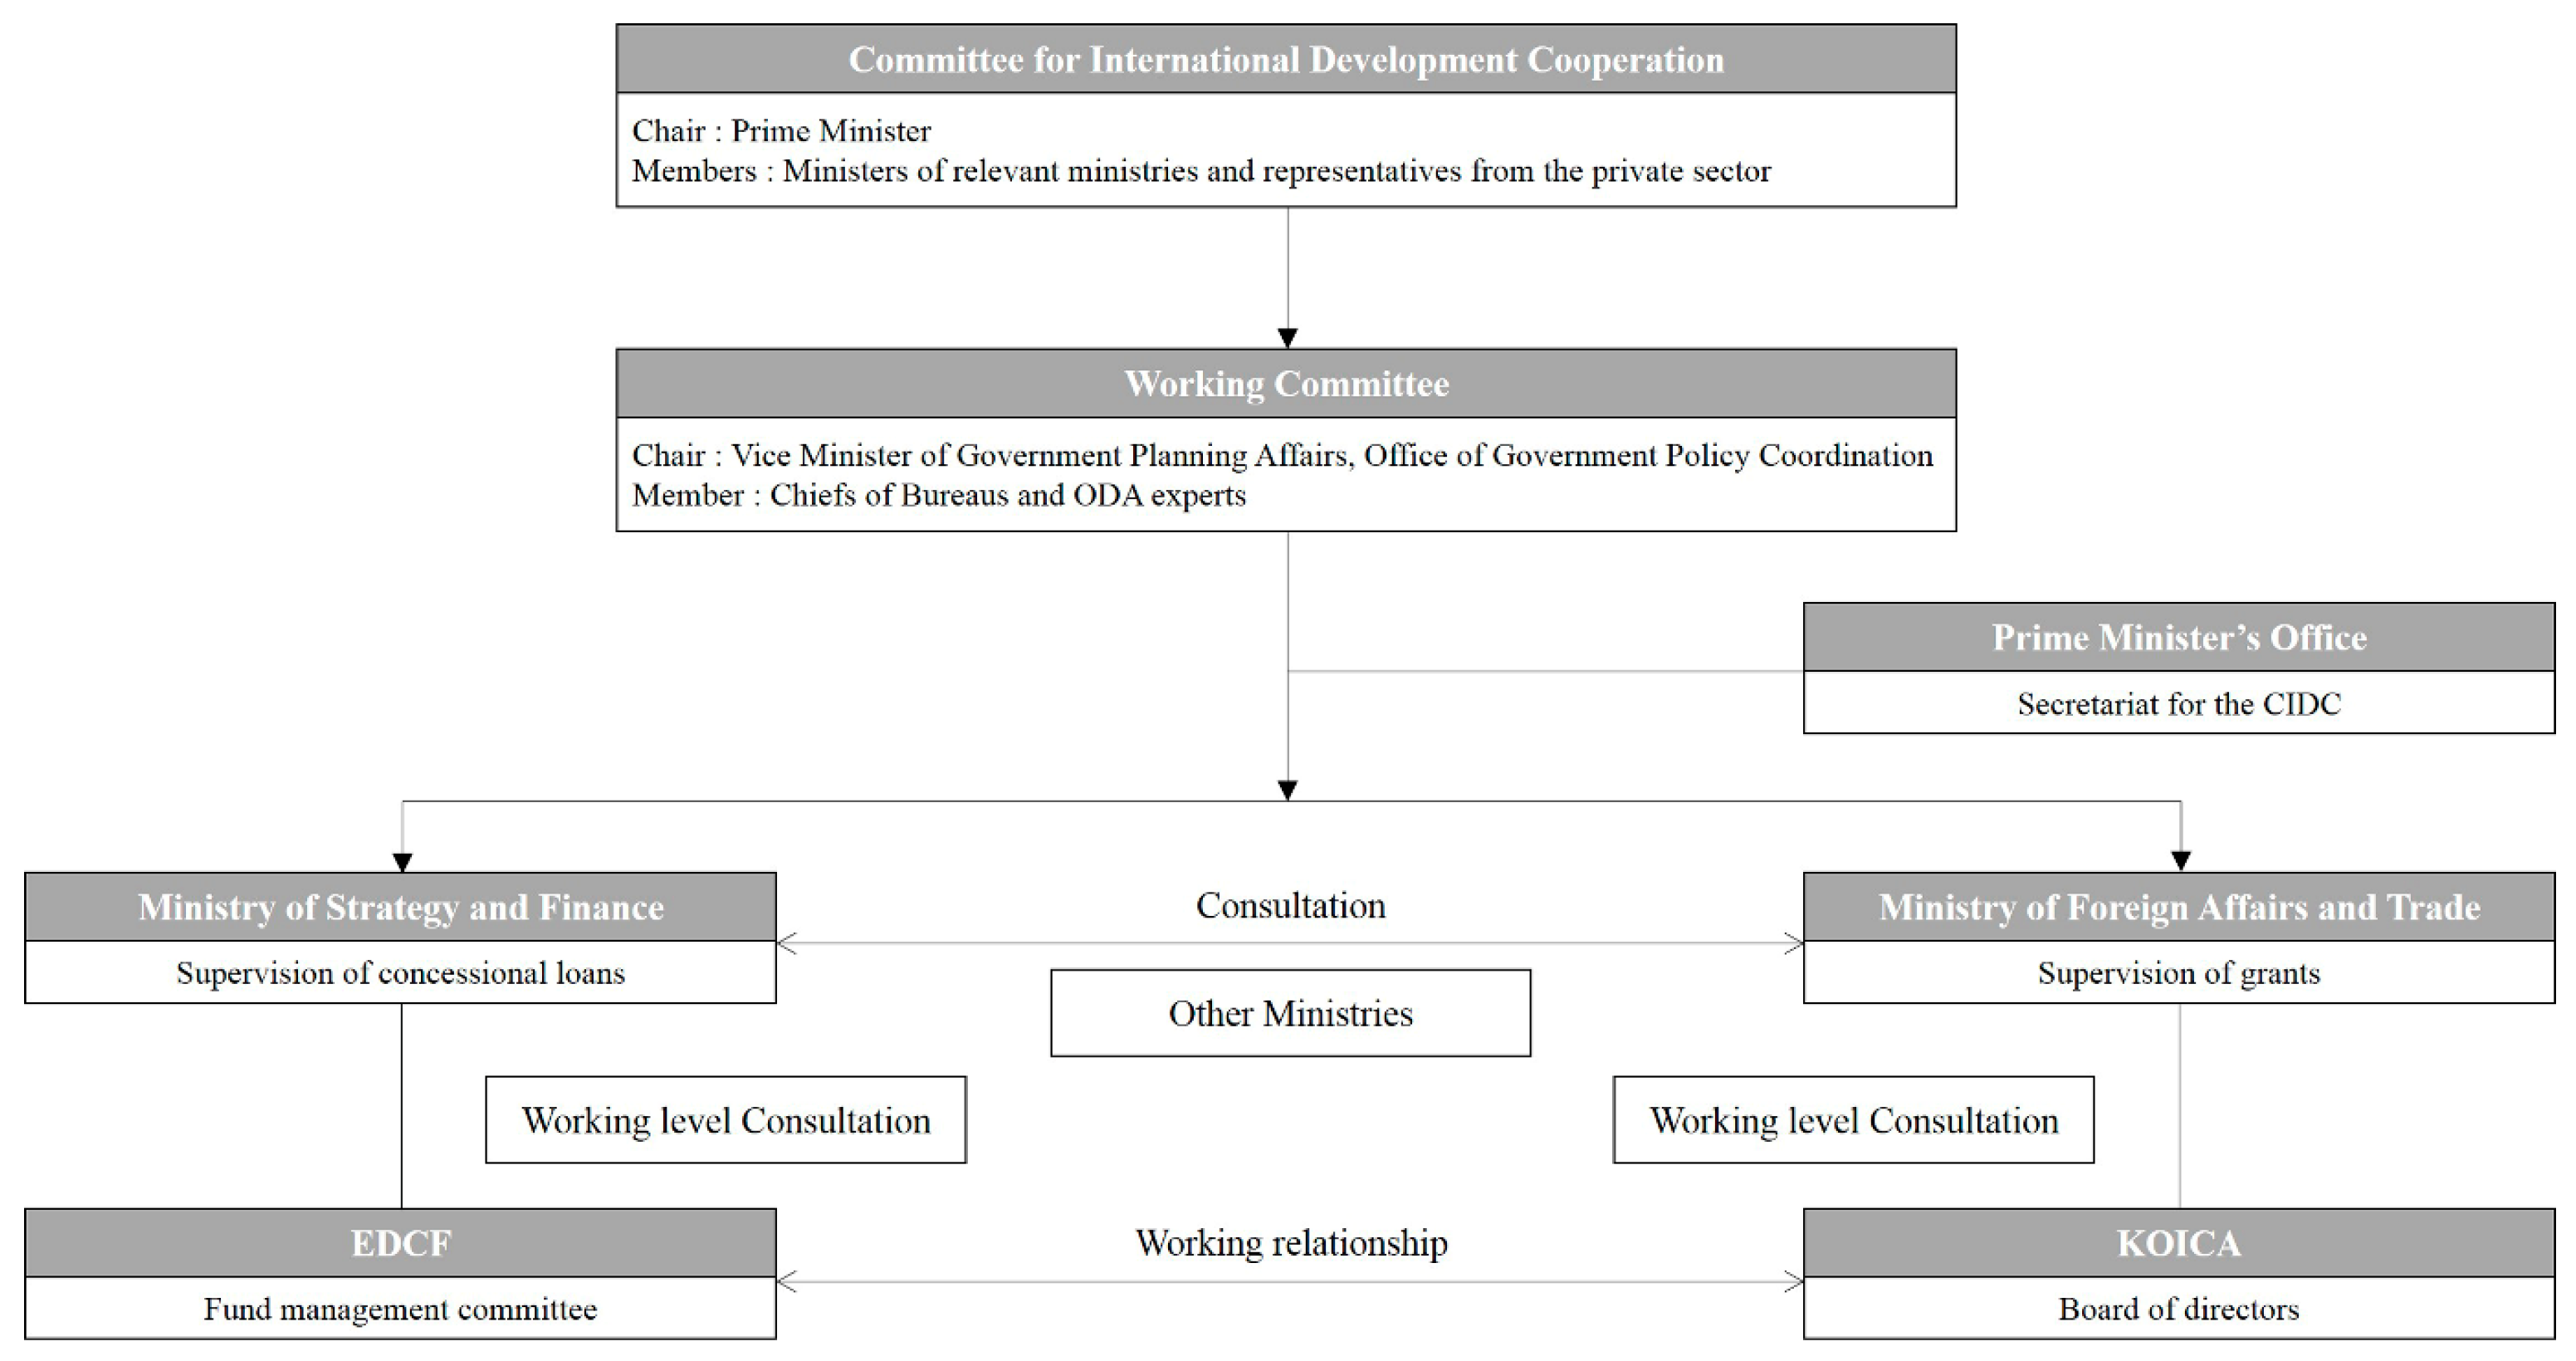
Subsequently, South Korea continuously increased its ODA budget, recording an annual rate of increase of 21.7% from 2006 to 2011. However, according to the OECD, the amount of ODA granted by it in 2013 (USD 1.74 billion) ranked 16th among all OECD/DAC members. The ODA/GNI (ODA/Gross National Income) index of 0.13% represents the amount of ODA funds in comparison with the nation’s economic scale. The index of 0.13% is significantly lower than the 0.3% average of all OECD/DAC members. The amount of ODA will continue to increase in order to achieve the ODA/GNI ratio target of 0.20% by the year 2020. The ODA organization charts of the External Economic Cooperation Fund (EDCF) and KOICA are presented in
Figure 2.
Korea’s ODA project organization is composed of the general and coordination body, the main organization, and the executive organizations. The Committee for International Development Cooperation, as the general and coordination body, deliberates and coordinates the main issues in order to systematically execute the policies of the ODA. KOICA and EDCF are the executive organizations that implement the ODA.
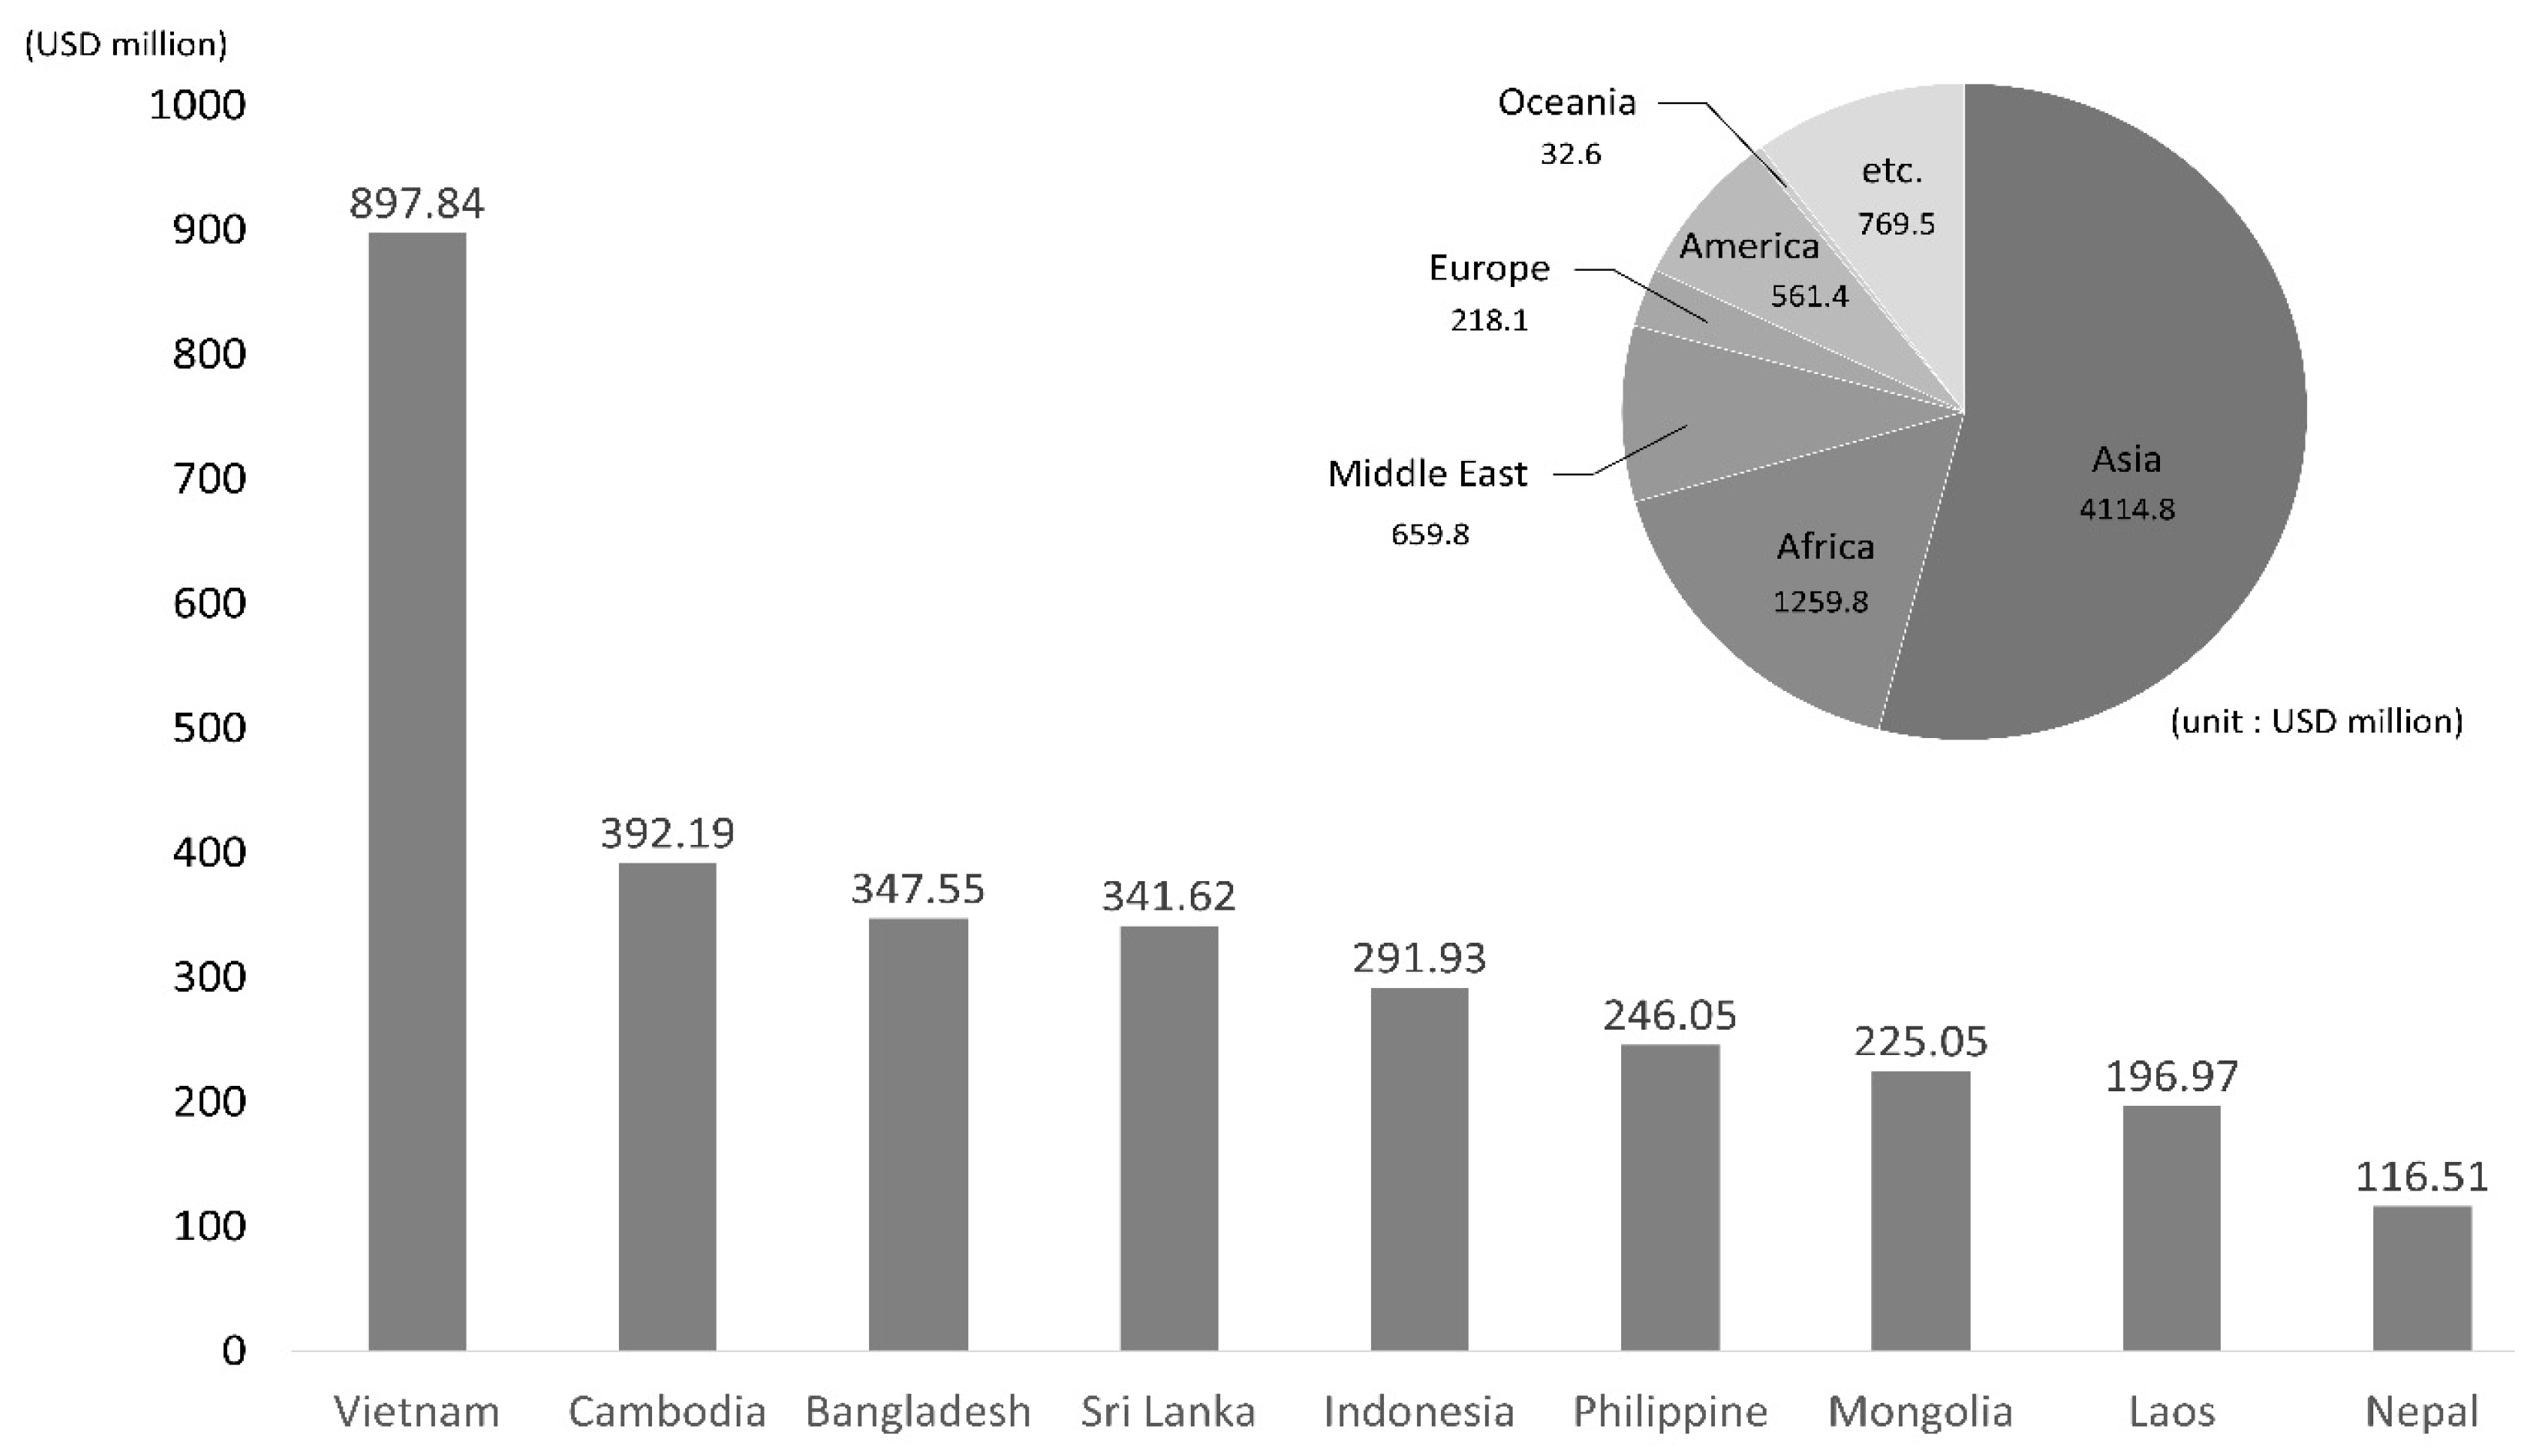
In addition, from 2002 to 2013, the amount of support according to South Korea’s ODA recipient countries (top 10) is as follows:
Figure 3 presents the ODA recipient countries and the amount of support received by the top 10 of these from 2002 to 2013. South Korea has provided the largest ODA to Asian countries (USD 4.11 billion). Regarding the amount of ODA support for the aforementioned 10 countries from 2002 to 2013, Vietnam accounts for the highest at 29% (USD 897.84 million;
Figure 3). Among the recipient countries where the proportion of South Korea’s ODA support is high, Vietnam, Bangladesh, and Sri Lanka appear to require better consideration.
2.3. Previous Research on ODA and Its Effects
A literature review is conducted to extract variables for establishing a model. This model is established to explore the relationship between the performance of the international construction business of companies (from ODA donor countries) and the economic status of recipient countries. Blaise (2005) [
1] conducted quantitative statistical analysis and determined that the ODA and Foreign Direct Investment (FDI) of donor countries are highly correlated. However, the policies and trends of public and private national infrastructure projects of the ODA recipient country—China in this study—are not considered. Choi et al. [
3] clarified the role of ODA as a method to support overseas construction business. However, only the ODA donations by South Korea are analyzed, and the target markets or companies are not investigated. Driffield and Jones [
5] approached ODA as an international aid and analyzed its supported areas and amounts according to recipient countries. Their quantitative data were limited and could not reveal the unique characteristics of recipient countries. The research results discussed thus far indicate that a hypothesis test is insufficient to clarify the relations between the economic growth and amount of ODA while considering the unique situations of recipient countries. Kang [
12] collected data of developing countries to which the South Korean government granted ODA; however, the cases of individual countries are merged into one for regression analysis, considering that the number of suitable projects was insufficient. This is because a significant number of projects were at an early stage, and thus an analysis on a national basis was not feasible. Sahoo and Bishnoi [
7] conducted a qualitative analysis of ODA projects granted by Japan to India.
Results of the literature review showed that previous studies used variables that indicate the economic situation of the recipient country (see
Table 1).
The results of the preliminary analysis reveal that in order to derive benefits for companies from the donor country, a continuous increase in ODA, both in its scope and amount, is required. The trend can be examined by means of variables representing the economic situation of the recipient country. The gross national income (GNI) and gross domestic product (GDP) are conventional indicators to represent the national economic growth of each recipient country. As indicators of international investment attractiveness, FDI and current account balance excluding international monetary trade are to be considered. The Consumer Price Index is an indicator to measure variations of domestic economic status. Therefore, this study selected analysis variables that indicate the economic situation of South Korea’s recipient countries (see
Table 2).
It is practical to assume that the effects of ODA on each recipient country’s economic growth vary. This diversity can be measured by GNI, GDP, and FDI. As a dynamic cycle, the growth facilitated by ODA may influence the number of construction project orders awarded by companies from donor countries. This phenomenon is not straightforward, considering that ODA impacts are not immediate and vary according to the economic development status, government policies, and trends of the major industries of each recipient country. In addition, the economic variation of donor countries can add variety to construction projects. For example, South Korean construction companies are less keen on participating in international construction projects ordered by ODA recipient countries. Further, they are less keen on participating in core overseas markets when their domestic residential construction is booming. The discussion thus far emphasizes the requirement for a rigorous empirical analysis.
3. Modeling Procedure
3.1. Variables and Unit Root Test
As discussed thus far and observed from the trend of ODA by the South Korean government and construction project orders (see
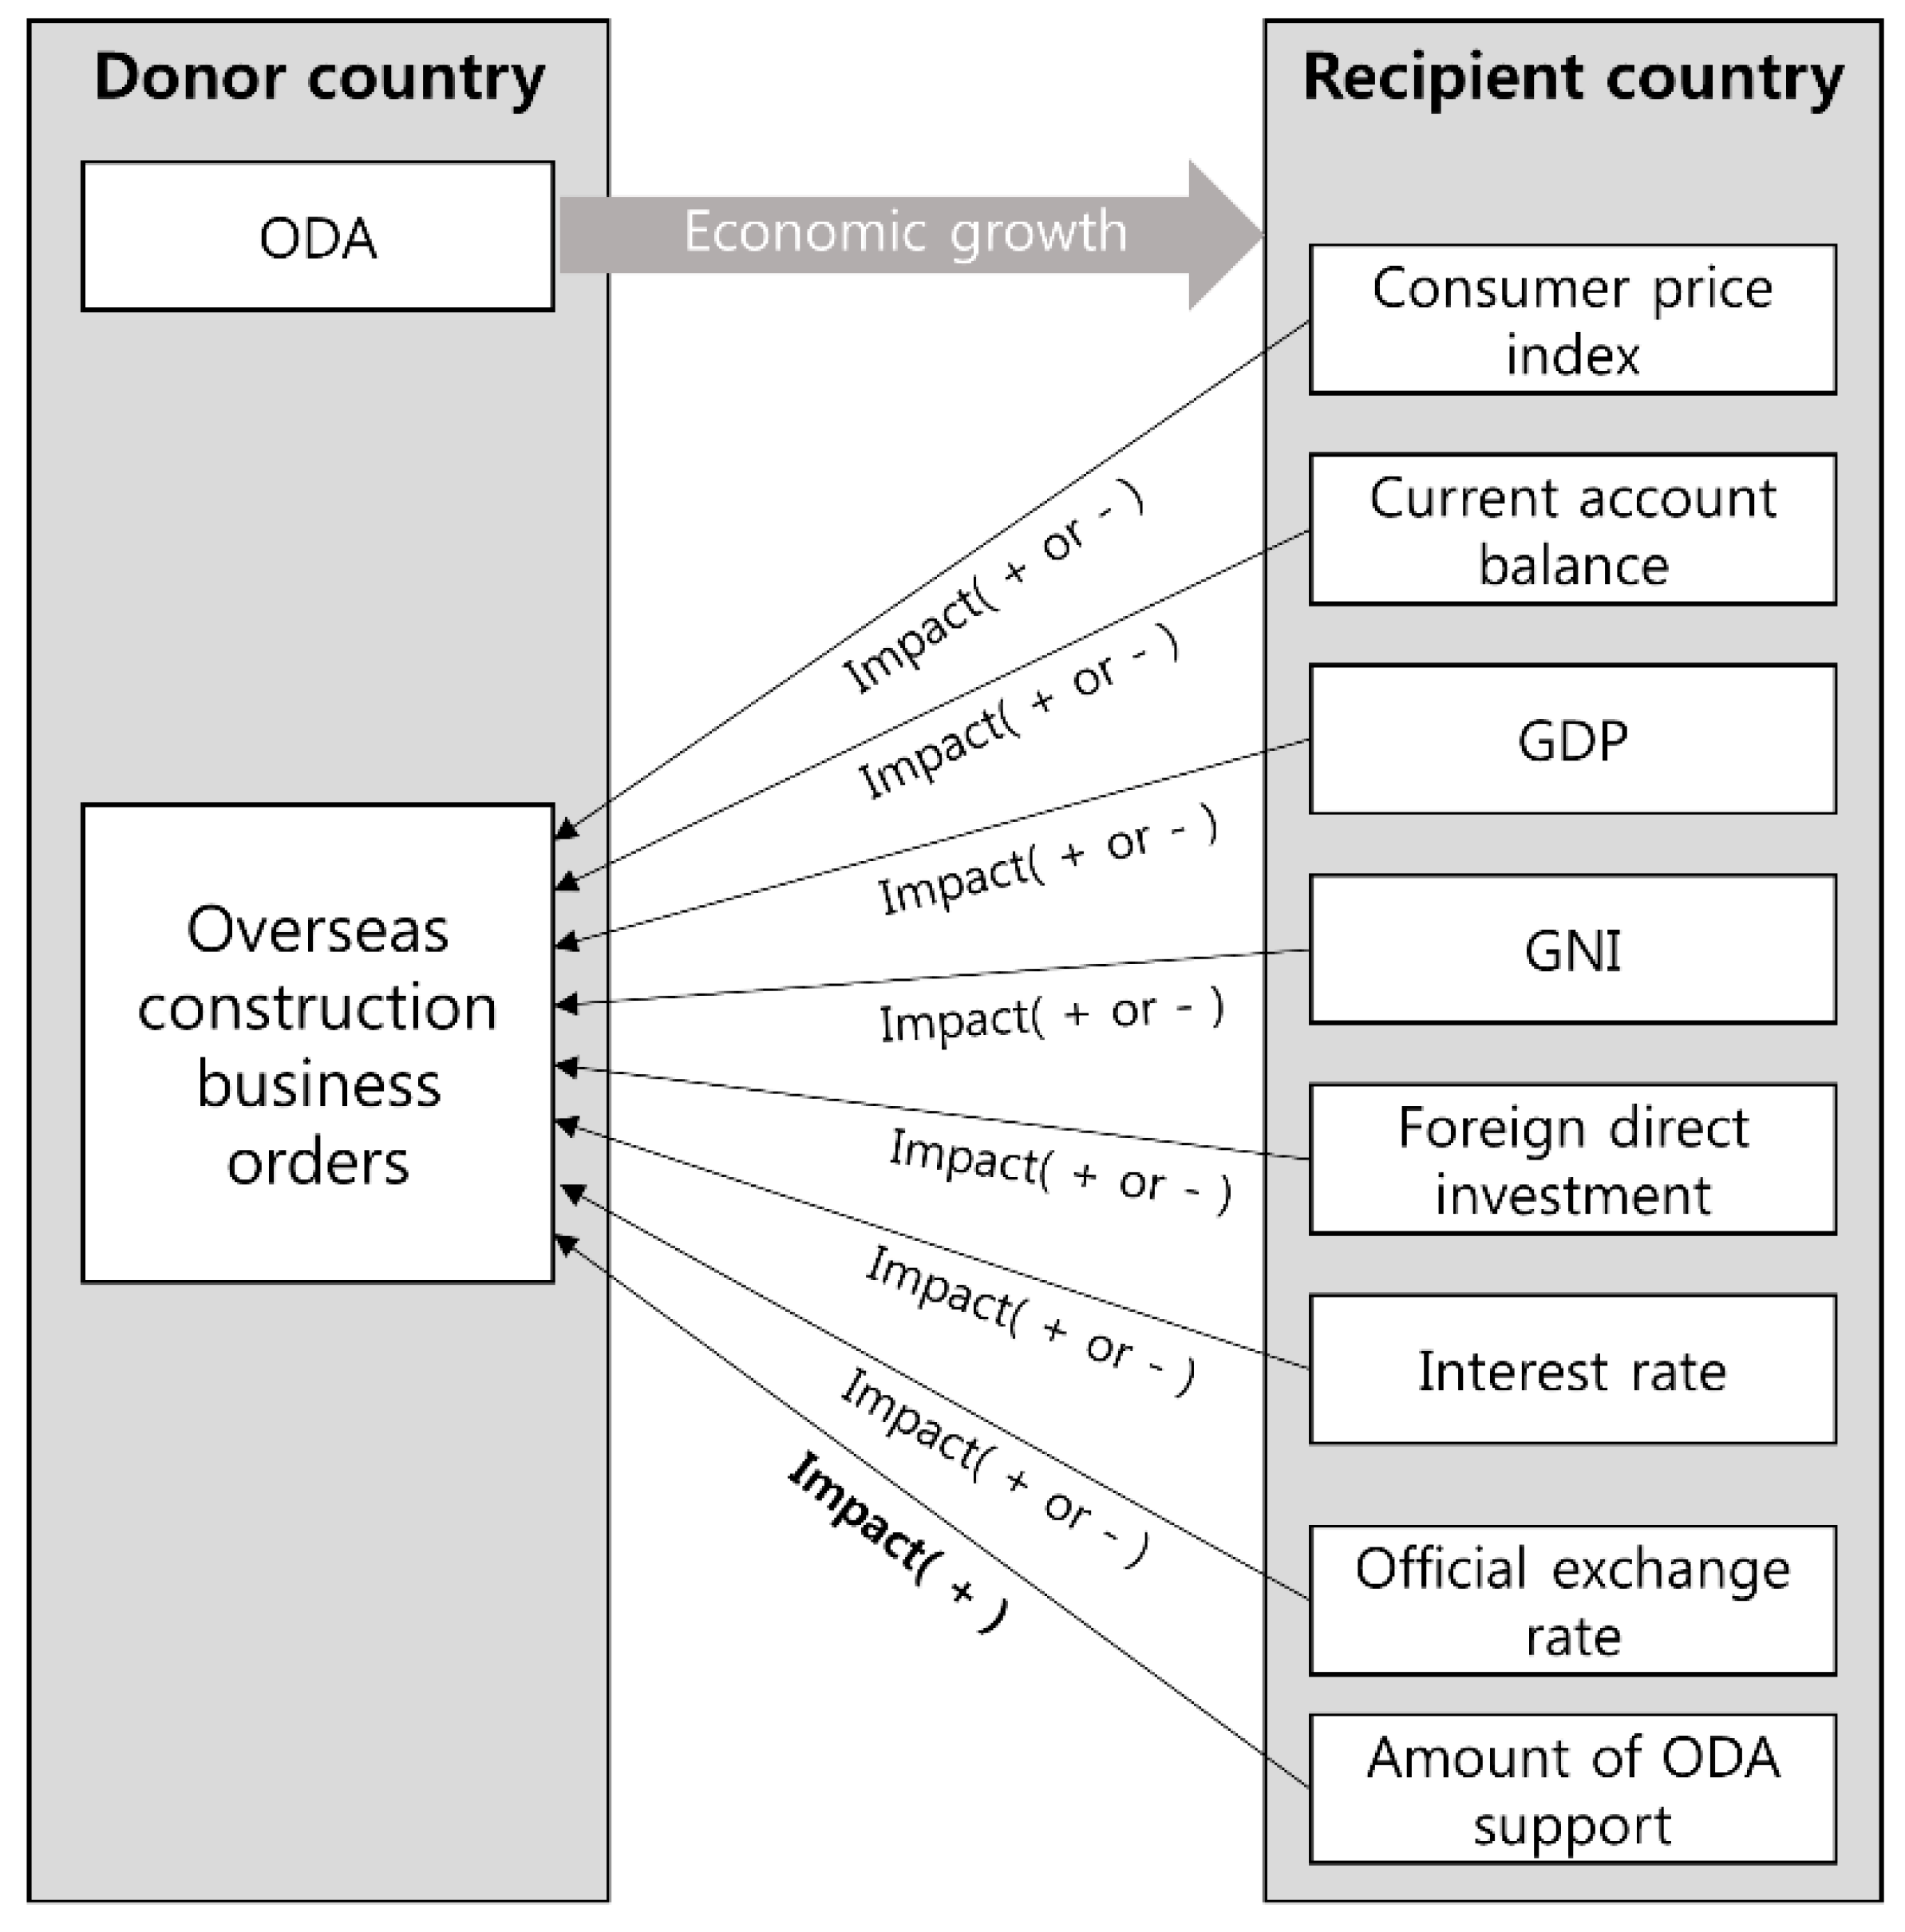
Figure 3), increments of ODA cause positive variations of the economic status of recipient countries and increases in construction project orders awarded by companies from donor countries. The variations of economic status according to ODA can be assessed by means of the time series data described in
Figure 4. The consumer price, current account balance, GDP, GNI, FDI, interest rate, and official exchange rate, which are the basic indicators of economic growth, are variables for analyzing the economic status of each recipient country. Variables relevant to the donor country are the amount of ODA by it and construction project orders awarded to its companies by recipient countries.
The positive and proportional impacts of ODA on economic status appear to exist. However, economic variables generally tend to follow random patterns, which are unstable time-series. If a variable does this, the effect remains permanently without dissipating, and the time-series process becomes non-stationary. Thus, a stationary time series implies that it does not have a unit root, and a non-stationary time-series implies that it has a unit root. Therefore, the unit root test is conducted to determine whether a time-series variable is stationary or non-stationary without resulting in the problem of spurious regression. The augmented Dickey-Fuller (ADF) test, which is a representative unit root test, is an extension of the Dickey-Fuller test [
13]. After the time-series to be tested is returned to its time-lag variable, it is verified whether the least-squares estimate of the coefficient of the time lag is significantly different from the unit root.
The null hypothesis implies that the unit root exists. If the t-statistic is greater than the ADF critical value, the null hypothesis is not rejected; this implies that the unit root exists. On the other hand, if the t-statistic is smaller than the ADF critical value, the null hypothesis is rejected; this implies that the unit root does not exist. In this study, therefore, the existence of the unit root was investigated for the time-series data of each analytical variable for Vietnam, Bangladesh, and Sri Lanka.
3.2. Time Lag Test
It is necessary to determine the time lag of the vector auto regression (VAR) model after the stability of the time-series data is established. In the case of the univariate, the appropriate degree is determined using partial autocorrelations. In the VAR model, it can also be determined by time or experience using the partial autocorrelations matrix. In general, Akaike information criteria (AIC) and Schwartz-Bayesian information criteria (SIC) are used to determine the time lag, and the point where the values of these information criteria are minimum is determined [
14].
3.3. Cointegration Test
The regression analysis of a variable that has been determined as an unstable time-series through the unit-root test results in the problem of spurious regression, and it has no statistical significance. However, although time-series are unstable, they are in a cointegration relationship if there is a linear coupling that forms a stable time-series between them, that is, a long-term balance relationship between the time-series variables. Furthermore, Engle and Granger [
15] argued that if cointegration exists, then a model-setting error is within the VAR model that consists of variables with a primary difference. Therefore, it is valid to configure a new VAR model (a vector error correction model (VECM)) using the error term obtained from cointegration. Consequently, the VAR model is used if the cointegration relationship between time-series variables with a unit root is absent, while the VECM is used if a cointegration relationship is present. In this study, therefore, the existence of a cointegration relationship among the variables was verified using the Johansen test; then, VECM was configured.
3.4. Vector Auto Regression Model
In a VAR model, all variables act as dependent variables. The VAR model can be a dynamic model where variables influence each other in the analysis of several time series data [
15].
Each individual macroeconomic variable is not independent but has correlations with and an effect on other variables. A VAR model can lead to a better understanding of the nature of any non-stationarity among the different component series and can also improve the longer term forecast over an unconstrained model. The VAR model can be a dynamic model where variables influence each other in the analysis of several time series data [
16].
The VAR model comprises
linear regression equations. Each equation sets the current observations of each variable having a casual relation with it as dependent variables, and the past observations of it and other variables as explanatory variables. A VAR specification is used to model each variable as a function of all the lagged endogenous variables in the system. Johansen considered that the process
is defined by an unrestricted VAR system of order (
p) as follows:
where
is the independent I(1) variables, the
are estimable parameters and
~ niid (0,
) is vector of impulses which represent the unanticipated movements in
. However, such a model is only appropriate if each of the series in
is integrated to order zero, I(0), meaning that each series is stationary. However, Engle et al. (1987) demonstrated that once a number of variables are found to be cointegrated, there always exists a corresponding error-correction representation that implies that changes in the dependent variable are a function of the level of disequilibrium in the cointegrating relationship (captured by the error-correction term) as well as changes in other explanatory variable(s) [
15]. The VECM is a limited form of the VAR model, used in cases when cointegration exists. It is a dynamic model in which the cointegration relation between the time series is taken into account along with other short-term dynamic relations, which can be expressed as follows:
where
is and I(0) vector,
is the intercept, the matrix
reflects the short-run aspects of relationship among the elements of
and the matrix
captures the long-run information. The number of linear combinations of
that are stationary can be determined by the rank of
, which is denoted as
r. If the rank of
is zero, this implies that the elements of
are not cointegrated, and thus no stationary long-run relationship exists [
17].
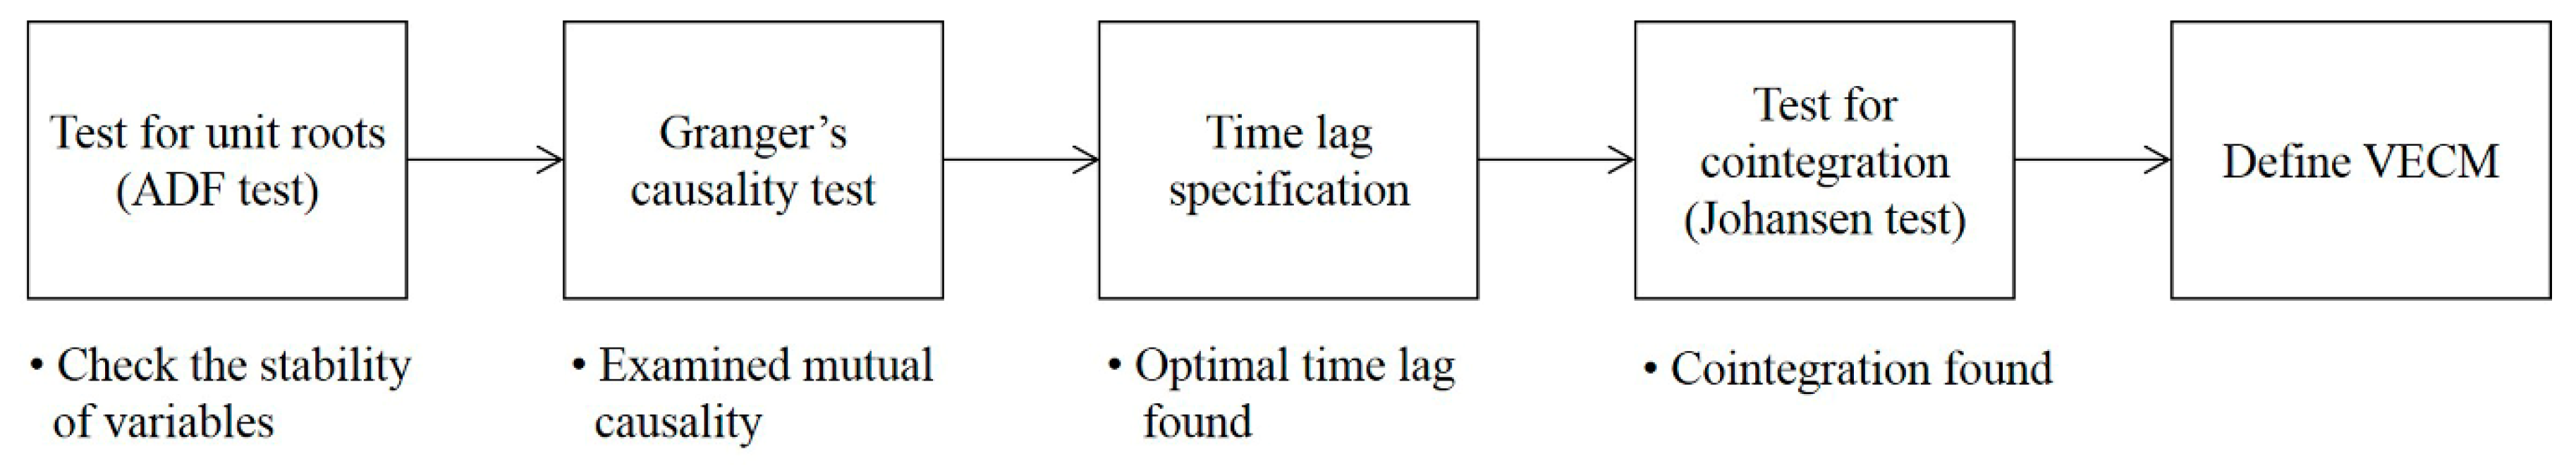
We checked for stationarity of each macroeconomic variable and of the EDF value by performing the augmented Dickey-Fuller (ADF) unit root test. For variables identified as stationary, we examined mutual causality using Granger’s causality test. Next, to build the model, we had to determine an optimal time lag. We conducted a time lag test for the first differenced variables, which gave us the optimal time lag of the model. To verify the data loss on the original time-series data, we determined whether cointegration existed for the first differenced variables by using the Johansen test method. In the absence of cointegration, a VAR model would be suitable. If cointegration were present, the VECM would be suitable. The entire tests process is illustrated in
Figure 5.
In this study, the cointegration test of the analysis variables determined the presence of cointegration. Therefore, the VECM was used for the empirical analysis.
4. Data Analysis and Interpretation
4.1. Data Collection and Unit Root Test
The purpose of this study is to examine the correlations among the construction project orders awarded by South Korean companies in Vietnam, Bangladesh, and Sri Lanka—the recipient countries of its ODA—variation of ODA donations by it, and economic fluctuations in these recipient countries. For the variables selected in this study, the time-series data between 1987 and 2014 were used. The time-series data on the total amount of ODA donations from South Korea were collected from the OECD/DAC. Further, the time-series data on the number of construction projects awarded by its companies were collected from the International Contractors Association of Korea, while data on the economic variables were collected from the data bank of the World Bank.
While conducting a general quantitative resolution, the spurious regression, which demonstrates a high correlation between the variables when such a regression is not present, occurs when unstable time-series data are used [
13]. Therefore, an ADF test was used in this study to confirm the existence of unit roots in the time-series data of each variable. In order to determine the existence of the unit root of the time-series for each analytical variable, the ADF null hypothesis [
18] states that the unit root exists at significance levels of 1%, 5%, or 10%.
As presented in
Table 3, the analysis variables of Vietnam, Bangladesh, and Sri Lanka could not reject the null hypothesis, implying that the unit root exists at the 1%, 5%, or 10% significance level. Therefore, primary difference was conducted to reject the abovementioned null hypothesis (see
Table 3).
4.2. Results of Granger Causality Test
In most regression analyses, when the cause and effect are unclear, it is not feasible to clearly determine the functional relationship between the two. To overcome such a problem, a lag-distributed model—the Granger causality test [
19]—was used to confirm the cause and effect. As this test assumes the time-series data to be stabilized, prior to the test, the selection of the unit root was conducted for determining the stability of each analysis variable. The statement “X Granger causes Y” implies that in addition to Y’s past values, X’s past values establish Y as an exogenous variable. After estimating
, the null hypothesis
, which states that the causality between variables is not established at the significance level of 1%, 5%, or 10%, was tested. This implies that when
is rejected as the result, it is concluded that “X Granger causes Y.” Thus, in this study, the causality between the amounts of ODA support from South Korea to Vietnam, Bangladesh, and Sri Lanka and the economic variables and number of construction project orders awarded by South Korean companies was identified (see
Table 4).
As presented in
Table 4, the analysis of the data on the three countries resulted in the rejection of the null hypothesis that there is no causality between the economic variables (the FDI in Vietnam, the GNI and FDI in Bangladesh, and the GDP and FDI in Sri Lanka) and the number of construction project orders awarded by South Korean companies at 1%, 5%, or 10% significance levels. Therefore, the above variables were determined to be the causes.
4.3. Results of Time-Lag Test
Through the unit root test, the stability of the time-series data was determined. Subsequently, to constitute the VECM, an appropriate time lag was selected. A negligible time lag widened the range of rejection toward the null hypothesis “no cointegration exists”; for significantly high values of the time lag, the reliability of the test weakens [
20]. The AIC and SIC are among the methods for determining the appropriate time lag, which is the point at which the value of information data reaches its minimum [
21].
In this study, by constituting an unrestricted VECM, which includes the primary difference variables, the appropriate time-lag test was conducted in accordance with the SIC standard. The results are presented in
Table 5. In this study, Time Lag 4 was confirmed as the appropriate time lag according to the SIC standard.
4.4. Results of Cointegration Test
To resolve the instability problem of the time-series data, which was determined as unstable based on the results of the unit root test, primary or secondary differences were conducted. In this case, the long-term relationship between the variables, which is critical, can be lost. Therefore, a cointegration test was conducted to confirm the long-term balance between the variables [
22]. Consequently, in this study, Johansen’s cointegration test was utilized (see
Table 6). As presented in
Table 6, it was determined that a cointegration relationship between the actual variables, prior to the difference, exists. Therefore, the VECM was used; however, if the trace test had indicated no cointegrating equation(s) at the 0.05 level, the VAR would have been used.
4.5. Results of Variance Decomposition Analysis
Variance decomposition analysis is a method for dynamically analyzing the relative influence of one variable on another within the VECM [
14]. Therefore, the relative influence of other variables on the variations of major variables can be measured. Accordingly, in this study, the relative influence of South Korea’s ODA support and the economic variables on the variations of the number of orders by South Korean companies’ overseas construction business in Vietnam, Bangladesh, and Sri Lanka was measured. The results are presented in
Table 7,
Table 8 and
Table 9.
In the case of Vietnam, the amount of ODA support had approximately 4.58% influence on the initial variations in the number of the construction project orders awarded by South Korean companies; this influence increased to approximately 6.30% by the end of the period. Moreover, FDI increased from Period 2; it was determined to be 21.95% influential in the final period, Period 10, and was demonstrated to be relatively more influential than ODA (see
Table 7).
In addition, in the case of Bangladesh, the influence of ODA increased from the beginning to reach 23.68% in Period 10. The amount of ODA support was determined to be relatively more influential than the amount of FDI and GNI (see
Table 8).
Further, in the case of Sri Lanka, the ODA was approximately 0.15% influential in the beginning; however, the influence increased from Period 2 and reached approximately 12.6% in Period 10. Additionally, FDI was determined to be relatively more influential than the amount of ODA support and GDP, decreasing to about 4.88% in Period 10 (see
Table 9).
4.6. Results of Impulse Response Analysis
Impulse response analysis is used to comprehend the ripple effect and correlation between variables through the time-lapse, as well as the dynamic responses to the influence of other variables when a unit impact is applied to a certain variable in the VECM [
15]. In this study, considering the amount of ODA support by South Korea to Vietnam, Bangladesh, and Sri Lanka, as well as the impact of economic variables, the dynamic response results of the number of construction project orders awarded to the South Korean companies were measured.
In the case of Vietnam, the number of orders awarded to South Korean companies were determined to be positively (+) influenced by self-impact. The impacts of the amount of ODA support by South Korea and FDI negatively influenced the number of orders (see
Table 10).
Moreover, in the case of Bangladesh, the number of orders by South Korean companies was determined to be positively (+) affected by both self-impact and its ODA support to Vietnam. Moreover, regarding FDI in Vietnam, the order performance was continuously positively (+) affected from Period 4 onward. However, the orders were continuously negatively (−) influenced by the Vietnam’s GNI (see
Table 11).
Additionally, in the case of Sri Lanka, the number of construction project orders awarded by South Korean companies was found to be positively (+) influenced by self-impact. Further, FDI and GDP also positively affected order performance. It was determined that with the passage of time, the number of orders responded to the GDP impact at a higher level of sensitivity. On the other hand, the ODA support by South Korea negatively (−) influenced the number of orders from the beginning (see
Table 12).
4.7. Interpretation
The construction project orders awarded by companies from South Korea to Vietnam are influenced more by FDI than by the ODA provided by South Korea. Vietnam is a World Trade Organization member that exports crude oil, clothes, and agricultural products, which are industries established with national infrastructure. It received foreign financing and ODA for its three major socioeconomic development strategies: “of the market economy, nurturing of professional workforce, and supplementation of infrastructure” [
23]. Thereafter, because of limitations in the national income, aggravation in ODA, and increased public debt, private sector capital increases with foreign investment; therefore, the influence of FDI is high. On the other hand, FDI is irrelevant to a majority of construction project orders awarded by South Korean companies. Thus, the influence is determined as negative (−) with negligible fluctuation. Regarding the ODA performance of South Korea, negative (−) influence was determined, which indicates that the amount of ODA support from South Korea is still negligible enough to influence the project orders awarded by South Korean companies. Furthermore, according to the Vietnamese Ministry of Planning and Investment, Japan, South Korea and Germany are the greatest donors among the major donors of ODA. In the past five years (2011–2015), South Korea and Japan have provided support worth USD 1 billion and USD 10 billion, respectively; the difference between these figures is significantly high.
The construction project orders awarded by South Korean companies in Bangladesh are influenced by ODA, rather than by Bangladesh’s FDI and GNI. Bangladesh ranks among the lowest in the world in terms of direct tax collection, and has been continuously dependent on aid by the international society [
24]. The influence of GNI fluctuations is determined to be negligible and negative (−). The national development projects for supplementing the national infrastructure in Bangladesh are propelled by the ODA of the donor country rather than by the national budgets. Therefore, the influence of ODA is higher than that of FDI, which is related to private capital. Among the construction project orders for national infrastructure, majority are placed by the Export–Import Bank of Korea, as well as the Korea International Cooperation Agency; thus, the influence of ODA demonstrates a positive (+) outcome.
The construction project orders awarded by South Korean companies in Sri Lanka are more influenced by FDI and GDP than by ODA from South Korea. A majority of the corporations that lead the industry in Sri Lanka have production facilities there; however, they are multinational local corporations based on foreign investment. Therefore, the FDI and GDP display a positive (+) influence. For the realization of environmental protection, improvement and development, a nation’s financial and technological limitations are addressed by the cooperation between the government and private corporations, and on the basis of foreign investment. Thus, the influence of FDI is relatively high. The ODA performance displays a negative (−) influence; moreover, the ODA granted by South Korea is negligible and does not significantly affect the number of orders of its companies. For example, by 2012, the largest donor to Sri Lanka was Japan, providing an average annual support of up to USD 130 million, while the corresponding figure for South Korea was USD 23 million; moreover, China provided approximately USD 820 million in 2010. Furthermore, Japan is the largest ODA donor to Sri Lanka, while China is concentrating on the construction of harbors, power plants, and roads in Sri Lanka. South Korean companies continue to face challenges while attempting to gain construction project orders in Sri Lanka; these challenges are reflected in the negligible and negative (−) influence of ODA support by South Korea.
Lastly, for the companies of a donor country to expect positive outcomes when attempting to gain construction project orders in ODA recipient countries, the scale and field of support, the execution policies, the expenditure of ODA in recipient countries, the economic scale, and the industrial trends in the recipient countries, should all be considered.
5. Summary and Conclusions
This study aimed to analyze the dynamic influence of ODA granted by South Korea on the economic status of ODA recipient countries with respect to the number of project orders awarded by its companies in the recipient countries. Among the ODA recipient countries, Vietnam, Bangladesh, and Sri Lanka were selected for analysis. Time-series data from 1987 to 2013, obtained from the OECD/DAC, International Constructors Association of Korea, and World Bank were selected as variables representing variations of the economic status of recipient countries.
After conducting the variance decomposition and impulse response analyses, it was determined that construction project orders in Vietnam are more significantly influenced by FDI than by the ODA granted by South Korea. However, both variables display a negative (−) albeit statistically insignificant effect. This is due to the limitation on the increase of the national income of Vietnam, availability of additional ODA funds, and increase in public debt, which, in turn, increases private capital through foreign investment. This is also due to the fact that there is a negligible relationship between the construction project orders awarded by South Korean companies and foreign investment.
In the case of Bangladesh, the construction project orders are more likely influenced by the ODA granted by South Korea than by the fluctuations of FDI and GNI, because Bangladesh has continuously depended on aid from the international society for its national development projects. A majority of the projects awarded by South Korean construction companies were initiated by ODA from the Export–Import Bank of Korea and Korea International Cooperation Agency.
In the case of Sri Lanka, the influence of FDI and GDP was higher in terms of the number of construction project orders awarded by South Korean companies than that of ODA because the national development projects of Sri Lanka are managed by multinational local corporations that have been established by foreign investment. This is because of the challenges that South Korean companies face in gaining project orders as Japan provides a significantly larger amount of ODA and China provides a lot of support in the field of construction.
In order to maximize the positive influence on the performance of the construction business of the donor country, the scale and field of ODA, the government’s policy on this issue, the expenditure on ODA, the economic growth level in the recipient country, and the industrial trends in the recipient country must all be considered. In recipient countries that are underdeveloped, it is feasible to attain the level of competitiveness of South Korean companies by forming a partnership or consortium between the ODA support organization of South Korea and its companies. This can be achieved through the ODA project, which is aid provided through international agreements. Such partnership or consortium could guarantee financial support and the acquisition of stable profits from construction projects in the recipient country. It could facilitate smooth progress of projects for the ordering organization of the recipient country.
ODA as tied aid can ensure stable profits for the companies of a donor country in the short term. However, in the long term, this type of ODA could prevent those companies from participating in projects supported by other donor countries. Accordingly, it is absolutely necessary to increase the percentage of untied aid. Moreover, the improvement in the quality of ODA will enhance the image of the companies of a donor country and also increase the probability of being awarded a contract for the follow-up projects.
Many developing countries, which are recipient countries of ODA, need a large-scale national project to revitalize their economy. In this situation, when a donor country expands the scale of aid to support a large development project in a recipient country, the constructors of the donor country could improve their recognition.


