A New Approach to Identify Social Vulnerability to Climate Change in the Yangtze River Delta

1
State Key Laboratory of Pollution Control & Resource Re-use, School of the Environment, Nanjing University, Nanjing 210093, China
2
School of Transportation, Southeast University, Nanjing 210096, China
3
Department of Philosophy, Nanjing University, Nanjing 210023, China
*
Author to whom correspondence should be addressed.
Sustainability 2017, 9(12), 2236; https://doi.org/10.3390/su9122236
Submission received: 26 October 2017
/
Revised: 30 November 2017
/
Accepted: 2 December 2017
/
Published: 4 December 2017
Abstract
:This paper explored a new approach regarding social vulnerability to climate change, and measured social vulnerability in three parts: (1) choosing relevant indicators of social vulnerability to climate change; (2) based on the Hazard Vulnerability Similarity Index (HVSI), our method provided a procedure to choose the referenced community objectively; and (3) ranked social vulnerability, exposure, sensitivity, and adaptability according to profiles of similarity matrix and specific attributes of referenced communities. This new approach was applied to a case study of the Yangtze River Delta (YRD) region and our findings included: (1) counties with a minimum and maximum social vulnerability index (SVI) were identified, which provided valuable examples to be followed or avoided in the mitigation planning and preparedness of other counties; (2) most counties in the study area were identified in high exposure, medium sensitivity, low adaptability, and medium SVI; (3) four cities, Shanghai, Nanjing, Suzhou, and Hangzhou were much less vulnerable than others due to their high adaptability; (4) to some extent, there were geographical similarities of SVI, exposure index, sensitivity index, and adaptability index; and (5) the indicator of “Employees in primary industry” related to SVI the most, the indicator of “Renter” related to exposure index (EI) most, the indicator of “Elderly” related to sensitivity index (SI) the most, and the indicator of “Urban residents” relates to adaptability index (AI) most. These results can help decision makers find the focus of their mitigation works, where the efficient of practices will then be improved.
1. Introduction
In recent decades, changes in climate including increases in warm temperature extremes, extreme high sea levels, and extreme weather events have threatened both natural systems and human society [1]. It should be noted that the economic losses and fatalities caused by climate change are not equally distributed among and within nations, regions, and communities [2,3]. It is certain that already vulnerable groups of people such as children and the elderly, lower socioeconomic persons, those with pre-existing health conditions, or communities with a high climate risk of exposure such as those living in low-lying areas, will be disproportionately affected by the impacts of climate change [2]. In China, the mainland continuous coastline measures about 18,000 km on the western shore of the Pacific Ocean [4]. It is acknowledged that in particular, the coastland below five meters is exposed to climate change and related hazards. Such a high-risk area in China is about 14.39 million km2 and has more than 70 million inhabitants [5]. The State Oceanic Administration of China has found that the annual rate of China’s sea level rise reached 3.2 mm from 1980 to 2016, much higher than the average rate of the world, and the sea level in 2016 was the highest during this period [6]. Such rapid rates of rising sea level will bring to this country even more storm surges, flooding and sea erosion; furthermore, it will exacerbate the damage from these climate-related hazards. Located halfway along China’s eastern coastline, the Yangtze River Delta (YRD) is considered to be a high-risk area of climate change. It has been indicated that the YRD along with the Yellow River Delta and the Pearl River Delta are the most vulnerable coastal regions in China [7]. Therefore, a good trial of social vulnerability assessment is required so that the vulnerable regions or groups can be identified and given more attention.
This paper focused on China’s social vulnerability to climate change and explored a modified approach based on the method of the Hazard Vulnerability Similarity Index (HVSI) [8]. The remainder of the paper is organized as follows. Section 2 of this paper situates the research within the literature that is directly relevant to social vulnerability to climate change or natural hazards, clarifies the methodologies for assessment, and describes their limitations; it also provides the whole process for assessing social vulnerability with our modified similarity-based method, and presents it in our case study of the Yangtze River Delta (YRD) region. Section 3 presents a detailed analysis of the study results on social vulnerability to climate change. Section 4 concludes with a discussion of our findings and some recommendations for future research and practices in assessing social vulnerability to climate change.
2. Materials and Methods
2.1. Definition
As this paper focused on vulnerability to climate change, the Intergovernmental Panel on Climate Change’s (IPCC) definition of vulnerability was adopted in this context: vulnerability is the degree to which a system is susceptible to, or unable to cope with the adverse effects of climate change including climate variability and extremes [9]. In the field of climate change, vulnerability is often classified into biophysical vulnerability and social vulnerability [10,11]. Biophysical vulnerability describes the characteristics of a natural system. Social vulnerability is an a priori condition and an inherent state of people, organizations, and society, which is determined by socio-economic factors. It always relates to both their sensitivity and adaptability to the adverse impacts from climate varieties or multiple hazards [12,13]. Both theoretical research and field-based case studies indicate that social vulnerability is multi-faceted in nature and consists of various dimensions of a social system, for example, social, economic, cultural, institutional, structural, and so on [13,14,15]. Essentially, social vulnerability in the context of climate change is produced by social stratification and the social inequalities nested in all these dimensions [16].
2.2. Traditional Methods for Social Vulnerability Assessment
The results of the existing literature in climate change, particularly in the natural hazards associated with climate change, show that a methodology of developing a composite index of social vulnerability based on some relevant indicators has been accepted by most scholars and has become a popular paradigm in social vulnerability assessment [17,18,19]. In general, there are two primary approaches applied for measuring the social vulnerability index: the deductive approach and the inductive approach.
The deductive approach is an approach driven by theory and is based on existing scientific knowledge. These theories, or scientific knowledge such as conceptual frameworks, are about the nature and causes of social vulnerability and are always used for identifying its relevant variables [20,21,22]. For example, after proposing the famous model of “hazards-of-place”, Cutter et al. (2000) chose eight relevant variables to quantify the social vulnerability of residents living in hazardous zones in Georgetown County, South Carolina [23]. Grounded in the existing literature, Wu et al. (2002) used nine important variables for evaluating social vulnerability to sea level rise in a GIS-based methodology and applied it in Cape May County, New Jersey [24]. With knowledge of flood damage, Zahran et al. (2008) only chose three crucial variables including “minority”, “economic status”, and “female-headed households with children” to estimate the relationship between social vulnerability and flood casualties [25]. Based on the literature of geological disasters, Hou et al. (2016) applied Data Envelopment Analysis (DEA) to study the social vulnerability to China’s geological disasters, and only 11 variables were used [26]. When reviewing the literature on Hurricane Katrina, Maharani and Lee selected 12 variables for evaluating social vulnerability to typhoon hazards in the South of Korea [27]. The deductive approach is characterized by expert knowledge and less indicators, hence, subjectivity is inevitably added into the process of indicator choice, particularly in the case of data unavailability [28].
The inductive approach is a data-driven approach that generally relies on their statistical relationships with the vulnerability outcomes that can be observed [20,29]. Even though it also selects variables drawn from the vulnerability literature, the inductive approach is characterized by a large number of potential indicators mentioned in the literature, and final selection may be determined by Principle Components Analysis (PCA) or other statistical methods [30,31]. Cutter et al. (2003) originally collected more than 250 variables that characterized social vulnerability. With PCA, they derived 42 variables to measure the social vulnerability of all counties in the United States [3]. Following Cutter’s research in the US, many other scholars have examined social vulnerability to specific hazards or stressors. Wood et al. (2010) selected 42 variables in the original social vulnerability indicator derivation and ultimately applied 29 variables in PCA to study the community social vulnerability of tsunamis in the Northwest of America [32]. Wang and Yarnal (2012) selected 64 variables to explore the correlation of vulnerability and the elderly to hurricane hazards with a case study in Sarasota County, Florida [33]. Guillard-Gonçalves et al. (2015) chose 46 variables to develop a social vulnerability index of 149 civil parishes of Great Lisbon with PCA [34]. Following the hazard-of-place model, Frigerio et al. (2016) used multiple proxy variables to calculate social vulnerability with Factor Analysis (FA) [35]. Mendes (2017) also applied PCA to estimate social vulnerability in the Centre Region of Portugal. In his study, 76 variables were originally used and 50 were retained [36].
With respect to the above-mentioned descriptions, some weaknesses can still be found in the traditional methods for measuring the social vulnerability index. For example, the question of how to balance increasing the number of input variables and reducing subjectivity has become a bottleneck problem in developing social vulnerability assessments. The deductive approach applies less variables to assess social vulnerability; however, it inevitably adds more subjectivity into the process of indicator choice. The inductive approach adds less subjectivity in the social vulnerability assessment, but requires a larger set of metrics to construct the composite index. As Stafford concluded, in general, most studies applying PCA used variables between 25 and 40, and he also found that there was a tendency to include more and more variables into the social vulnerability assessment [17]. However, most variables constructing an SVI have weak explanatory power in predicting actual outcomes. Additionally, though dividing an SVI into key dimension indexes (e.g., exposure index, sensitivity index, and adaptability index) is a feasible remedial measure, applying too many variables for developing an SVI still reduced the interpretability of the composite index. Therefore, practitioners or managers will be confused as to how to target changes in a single indicator influencing the index, which lessens the tangible contribution made by the SVI method [8].
2.3. Alternative Methods for Social Vulnerability Assessment
Fortunately, two innovative categories of alternative methods to the SVI have emerged in the literature of social vulnerability assessment: first, the measurement of social vulnerability with a similarity method [8]; and second, the identification of social vulnerable regions with a k-means clustering method [17]. A good example of the first type was a study of vulnerability made by Chang. In 2015, Chang et al. proposed a method to develop a Hazard Vulnerability Similarity Index (HVSI) of administrative districts in British Columbia. Rather than calculating and ranking each community with the values of social vulnerability, this HVSI method only used vulnerability indicators to measure the similarity of places to find commonalities or differences of social vulnerability among places. Similarity can be roughly described to quantify the likeness between two or more objects in statistics and other related fields. It was first developed by biologists to compare vegetation patterns in different locations [37]. Studies of similarity have been overwhelmingly explored and are widespread in various scientific fields [38,39], for example, in ecology, similarity measures have been used to assess similarity or interspecific relationships between ecological communities on their species composition [40,41]. In the field of semantics, this method is used to identify concepts or terms having common “characteristics” by defining a topological similarity [42]. In the graph field, similarity measures are applied to quantify the structural similarity for two different graphs [43,44]. In the context of fuzzy set theory, measuring similarity among fuzzy subsets has been developed and applied in management, medicine, and meteorology [45]. In biology, similarity measures are used to find the sequence similarity between gene profiles [46,47]. In psychology, similarity measures are applied to study personality profiles [48]. Furthermore, similarity is seen as a real-valued function on the numerical distance between multiple data objects and is typically represented as a numeric range from 0 through 1. Generally, this value is computed based on Euclidean distance, the Pearson correlation coefficient, Salton’s Cosine formula, the Jaccard Index, Gower’s similarity coefficient, and so on. Of these, Gower’s similarity coefficient is able to handle mixed data types at the same time such as continuous, ordinal, or categorical variables. Chang also pointed out that the similarity method is helpful for a comparison of communities, knowledge transfer, and information propagate, that can ultimately reduce the gap between knowledge and practice in reducing climate-related risk.
As an example of the second type, Stafford and Abramowitz applied cluster analysis (e.g., k-means) to target socially vulnerable places. Rather than reducing the data matrix to a single ordinal value like the traditional methods always do, this alternative method groups similar observations into clusters that share common characteristics, and based on the characteristics of each cluster, researchers can further judge whether places in that cluster are socially vulnerable. This method considers factors holistically, for example, an indicator that may contribute little to urban vulnerability, but would certainly affect rural vulnerability, can be included in the process of assessment. However, limitations also exist in cluster analysis. This method requires that researchers subjectively judge the relative importance of various indicators and the number of clusters. Additionally, this method can only provide cluster patterns, and cannot rank each place by degree of social vulnerability.
In this paper, we proposed our method for social vulnerability assessment with the HVSI approach modified by objectively choosing the reference communities and ranking the social vulnerability of community relatively with the deviation of similarities.
2.4. Study Area
The Yangtze River Delta (YRD) region in China served as the study area for this research. Geographically, the YRD is the natural alluvial plain formed by the Yangtze River and the Qiantang River. It refers to the region located south of the Nantong-Yangzhou Canal, north of the Qiantang River and Hangzhou Bay in Zhejiang Province, east of Nanjing in Jiangsu Province, and west of the coast (118°20′–122°46′E, 28°2′–33°25′N) [49]. The YRD covers an area of more than 112,000 square kilometers, among which, 85.3% of the region is flat plain with an average elevation of 83.3 m and the rest is a mountainous area lying in the southwest [50]. The YRD region encompasses Shanghai Municipality, eight cities in the central and south parts of Jiangsu Province (e.g., Yangzhou, Taizhou, Nantong, Nanjing, Zhenjiang, Changzhou, Wuxi, and Suzhou), and seven cities in the northern and eastern parts of Zhejiang Province (e.g., Huzhou, Jiaxing, Hangzhou, Shaoxing, Ningbo, Zhoushan, and Taizhou). These 16 cities governing 139 counties (or city districts) make up this region (Figure 1).
We selected the YRD region as our case study due to its high risk to climate change in China as above-mentioned. First of all, a significant urban heat island (UHI) effect in this area coupled with the potential impacts of global warming have led to an increase of the surface temperature by 0.53 °C in summer in the major cities [51]. Specifically, the average temperature in Shanghai has risen 2.53 °C in the past 50 years, which is four times more than the global average temperature [52]. Since 1990, the average temperature in Shanghai has increased 0.73 °C, and that of other cities has increased 0.23 °C per decade [53]. Second, apparent land subsidence in this area has been detected due to its intensive human and economic activities. Over the past three decades, land with accumulated sediment over 200 mm was nearly 10,000 km2, which covers one-third of this area. This land subsidence coupled with the low-lying nature of the terrain makes this region face accelerated effects of a rise in sea level. the Intergovernmental Panel on Climate Change’s (IPCC) pointed out that the sea level in the YRD region had been rising at a faster rate than other regions in China from 1978–2007 [54]. In particular, the sea level by the estuary near Shanghai has risen by 11.5 cm in the past 30 years, and it will rise 360–380 mm per year by 2030. Additionally, the sea level in the YRD will rise 210–230 mm between 2030 and 2050 [53]. Third, the YRD region has seen an upward trend of the severity and frequency of weather and climate disasters. Flood is taken as an example, because it affects the YRD the most. The YRD region was hit by catastrophic floods in 1991, 1998, and 1999 [55]. At the same time, a significant upward trend of flood risk was observed in this area. In Nanjing, from the 1920s to the 1990s, the precipitation in flood season increased from 433.4 to 850.7 mm and the frequency of storms increased from 5.2 times to 7.8 times per year [53]. As for the whole region, since the 1990s, the tendency of extreme precipitation events has continued to increase under the background of climate change [50]. More detail on weather damage and climate disasters in the YRD are described in Table 1.
The YRD is the most urbanized region with the highest population density in China. In 2014, the YRD had a total population of 138.06 million, about 7.06% of China’s total. Furthermore, the population density reached 1684 people per km2, which was almost 12 times the national population density. The YRD is also a rich and prosperous region with the fastest economic growth, largest economic scale, and has the strongest development potential in China [49]. In 2014, the regional Gross Domestic Product (GDP) was 1732.59 billion US dollars, making up nearly 16.66% of China’s total GDP and 25% of the national revenue. Undoubtedly, this region contributes to about one-third of every percentage point of China’s economic growth and has been the engine for China’s reform and development [57]. More details about the social-economic conditions in the Yangtze River Delta region are displayed in Table 2.
2.5. Selection of Vulnerability Indicators
Different locations or different groups in the same location may experience vulnerability at different levels. In line with the IPCC assessment reports, social vulnerability to climate change can be understood as a function of three basic dimensions: exposure, sensitivity, and adaptive capacity [58]. Hence, all indicators for social vulnerability assessment will be classified based on these dimensions. The indicators belong to two dimensions such as exposure and sensitivity that are considered to add social vulnerability, that is, they have a positive effect on the SVI (“+” in Table 3). The left indicators belong to the dimension of adaptive capacity and have a negative effect on the SVI (“−” in Table 3). There is a subclass between the indicators and dimensions: factor. Every factor describes the common attributes of all indicators that belong to it. Based on the 2010 China Civil Affairs Statistical Yearbook, the 2010 statistical yearbooks of each city published by the respective Statistical Bureaus, the sixth national population census in 2010, and other relevant statistical databases, we selected 24 county-level indicators after referring to the literature regarding social vulnerability to climate change. Table 3 shows the information of the indicators in detail. Before conducting the modified similarity-based approach, we first normalized all the variables (as commonly done in similar research) to avoid the confounding effect from using variables of different scales. In addition, the data type of every indicator was continuous.
2.6. A Modified Similarity-Based Methods
Chang et al. (2015) proposed a method to develop a Hazard Vulnerability Similarity Index (HVSI), which was novel and valuable to the social vulnerability assessment. However, there are some drawbacks when using this method. First of all, when comparing the similarity of places, it is critical to determine which community should be referenced; however, no criterion or approach has been introduced to choose the focus community. Second, an index about completeness ranging from 0 to 1 is displayed in the HVSI method. Though this completeness index can describe the degree of completeness of the data, there is still confusion as to how to resolve the problem on data incompleteness with this index and how to improve the HVSI method. In this paper, a modified similarity-based measure was proposed that aimed at the first problem.
● Step 1: calculate the Exposure Similarity Index (ESI), Sensitivity Similarity Index (SSI), Adaptability Similarity Index (ASI), and Vulnerability Similarity Index (VSI).
where x and y represent two different counties; n1, n2, n3, and n4 describes the number of exposure, sensitivity, adaptability and vulnerability indicators, respectively. Thus, according to Table 1, n1 = 9, n2 = 9, n3 = 6, n4 = 24, and , 0 indicates x and y are not at all similar, and 1 shows x and y are completely similar. The value of denotes the similarity between the kth indicator of county x and y. The value of means the weighing of the kth indicator, and is usually 1 or 0 depending on whether the comparison is valid for the kth indicator. Both and are defined for different data types and explained in detail in Chang [8]. Considering there was only one type, the continuous data, collected in this study, we defined and as follows:
where Rk is the range of values for the kth indicator.
● Step 2: choose the reference community objectively.
Construct the matrixes of Exposure Similarity Index (ESI), Sensitivity Similarity Index (SSI), Adaptability Similarity Index (ASI), and Vulnerability Similarity Index (VSI) after computing all the pairwise similarities between counties in our study. As the following step considering these four matrixes are the same, we will use the VSI matrix as an example.
If vij (1 < I < m, 1 < j < m) is the minimum of the VSI matrix, then it shows that county i and county j are the most dissimilar to each other. Thus, one of them may be the minimum of vulnerability in this study area, and then, the other is the maximum of social vulnerability among the 139 counties. Both of these can be chosen as our reference community. Results showed that “Binjiang District” of Hangzhou City and “Xianju County” of Taizhou City were the most dissimilar to each other. According to our relevant research in this study area and local studies on risk management, Xianju County should be the most vulnerable community, and Binjiang District the least vulnerable community [66]. That is, VSIi,max is the similarity value between the ith county and Xianju County, VSIi,min is the similarity value between the ith county and Binjiang District.
Similarly, based on matrixes of ESI, SSI, and ASI, it was found that Huangpu District of Shanghai was the least exposed and Baoying County of Yangzhou was the most exposed; Haimen County of Nantong was the least sensible community and Yuhuan County of Taizhou (Z) was the most sensible community; Xinghua County of Taizhou (J) lacked the most of adaptability, and Shangcheng District of Hangzhou was the most adaptable. Hence, the reference communities of ESI, SSI, and ASI were all identified.
● Step 3: calculate the Social Vulnerability Index (SVI), Exposure Index (EI), Sensitivity Index (SI), and Adaptability Index (AI) based on similarity index matrixes.
Using the VSI matrix as an example again, if a county was more similar to Xianju County, then it was more vulnerable. Inversely, if a county was more similar to Binjiang District, then it was less vulnerable. Therefore, the social vulnerable index (SVI) of counties can be calculated as follows:
Similarly, EI, SI, and AI can be calculated as follows:
3. Results
Our results support the idea that social vulnerability can help decision makers find the focus of their mitigation works, where the efficiency of practices will then be improved. First of all, based on the ESI, SSI, ASI, and VSI matrixes, the referenced communities were found (Table 4). According to our relevant research in this study area, practical works of local risk management and the statistical data in the “Atlas of Natural Disaster in China”, it was easy to compare these referenced communities. In detail, it was deduced that the SVI of Xianju County was definitely worse than Binjiang; then, Xianju County was the most vulnerable community, and Binjiang District was the least vulnerable community. Huangpu District of Shanghai was exposed less than Baoying County of Yangzhou; then, the former was the minimum and the latter the maximum. Similarly, Haimen County of Nantong was the least sensible community and Yuhuan County of Taizhou (Z) was the most sensible community; Xinghua County of Taizhou (J) lacked the most adaptability, and Shangcheng District of Hangzhou was the most adaptable [56,66].
Aside from helping calculate EI, SI, AI, and SVI in the process of assessment, this result is extremely useful for risk managers to bridge their professional knowledge and practice in their mitigation works. In detail, if managers of a district or county plan to reduce exposure, they can refer to the portfolio of Huangpu. The exposure of Huangpu District was the least that was calculated. If they want to reduce sensitivity, Haimen provides a good example. Furthermore, if they focus on improving local adaptability, they can follow the development of Shangcheng. Of course, if they plan to reduce social vulnerability directly, the portfolio of Binjiang District is worth taking into account.
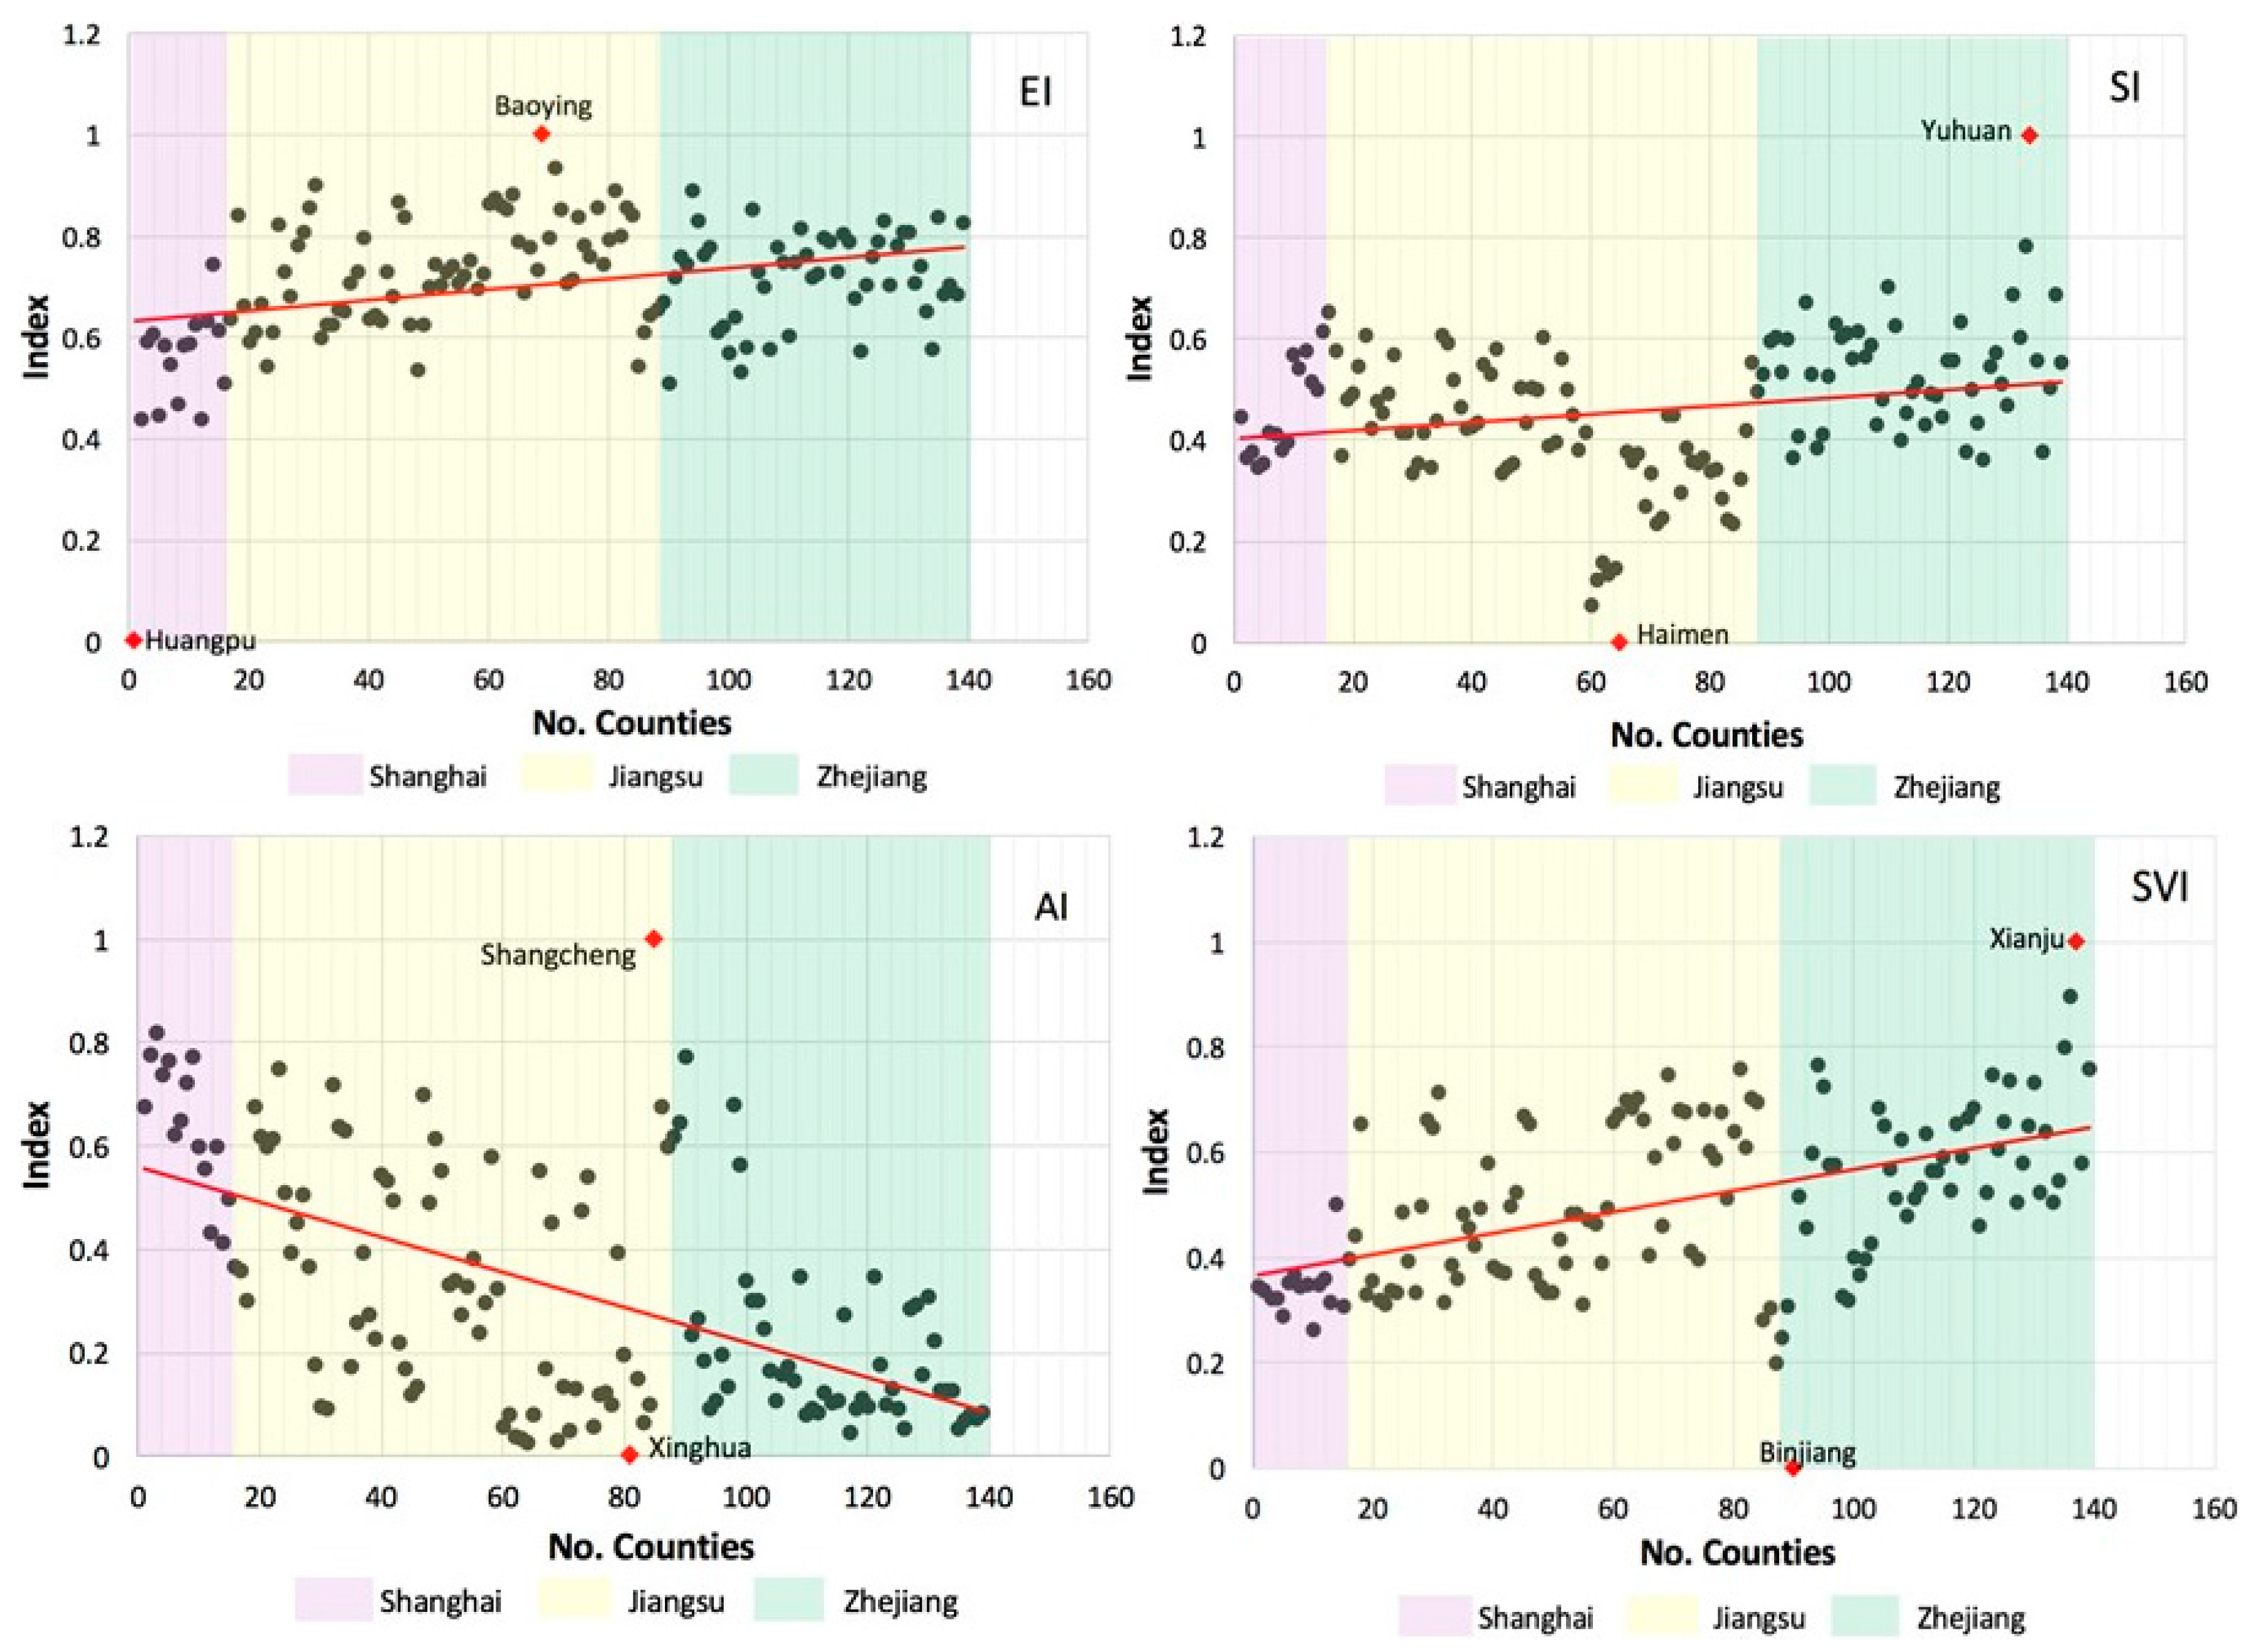
Table 5 shows the general statistics about exposure index (EI), sensitivity index (SI), adaptability index (AI) and social vulnerability index (SVI) of all counties in the Yangtze River Delta (YRD). More details can be found in Figure 2. In this figure, counties from 1–18 belong to the Municipality of Shanghai, which are located in the purple zone, numbers 19–84 belong to Jiangsu Province that are located in the yellow zone, and numbers 85–139 belong to Zhejiang Province, which are located in the green zone. According to Figure 2, several conclusions can be drawn. First, the condition of the counties’ adaptability was different based on the condition of exposure, sensitivity, and social vulnerability. In detail, from Shanghai, Jiangsu to Zhejiang, the trend of the adaptability index was decreasing, which meant that adaptability in Zhejiang Province was the worst, and adaptability in Shanghai was the best. However, the other three indexes all displayed an ascending order. Hence, exposure and social vulnerability in Shanghai were less than those of Jiangsu Province, and the exposure, sensitivity, and social vulnerability of Jiangsu Province were less than those of Zhejiang Province. Moreover, this picture of SI showed that many counties of Jiangsu Province (e.g., numbers 60–84) were less sensitive than that of the Shanghai Municipality and Zhejiang Province. Second, the average value of EI was the highest (0.707) and the average value of AI was the lowest (0.323). The average value of SI was 0.459 and the average value of SVI was 0.507. Thus, in general, counties in the study area had high exposure, medium sensitivity, low adaptability, and medium SVI. This result corresponded to the reality of the YRD region we alluded to previously: it is one of the most threatened by climate change in China. Third, the standard deviation of AI was the highest (0.236), while the value of EI was the lowest (0.125), which indicated there were the least differences in EI among all counties in the study area, but among them AI varied the most. Therefore, developing adaptability of the YRD region should be one of the most important and efficient works in the process of reducing social vulnerability to climate change.
Figure 3a shows the spatial pattern of SVI of 16 cities in the YRD region. Taizhou of Jiangsu Province and Taizhou of Zhejiang Province are the most vulnerable to climate change. Adjacent to them, the cities of Yangzhou, Nantong, Shaoxing, and Ningbo are more vulnerable than the others. Suzhou and Shanghai together form the low zone of the SVI map. Cities of Nanjing, Zhenjiang, Changzhou, and Wuxi form a medium zone of the SVI map. Furthermore, the other medium zone located in the cities of Huzhou, Jiaxing, and Hangzhou. In conclusion, from the low zone (Suzhou and Shanghai) to the south or north, the SVI increased. In addition, the distribution of EI, SI, AI, and SVI is displayed in Figure 3b from the cities in the northern part to cities in the southern part of the YRD region. First, the average values of EI were higher than the other three indexes, which again proves that the exposure to climate change in the YRD region is serious. Second, the distribution of EI, SI, and AI was similar to the SVI. Generally, Yangzhou, Taizhou, and Nantong belonged to one kind; Nanjing, Changzhou, Wuxi, Suzhou, and Shanghai were very similar; the cities of Zhejiang Province including Huzhou, Jiaxing, Hangzhou, Shaoxing, Ningbo, Zhoushan, and Taizhou (Z) were likely to be clustered. It should be noted that variation of AI was the largest: the values in the big cities (e.g., Nanjing, Wuxi, Suzhou, Shanghai, and Hangzhou) were all much higher than the other cities. This AI result relates closely to the economic characteristics of cities as shown in Table 2, where the correlation coefficient between the AI and GDP of cities reached 0.84. Third, as is known, only adaptability was negatively correlated with social vulnerability, but the adaptability performance of the 16 cities’ performance was not as good: AI was much less than the SI and EI (except for Shanghai). This led to the SVI of 16 cities in the YRD region being high. However, it is worth noting that the four cities of Shanghai, Nanjing, Suzhou, and Hangzhou were much less vulnerable than the others due to their high adaptability.
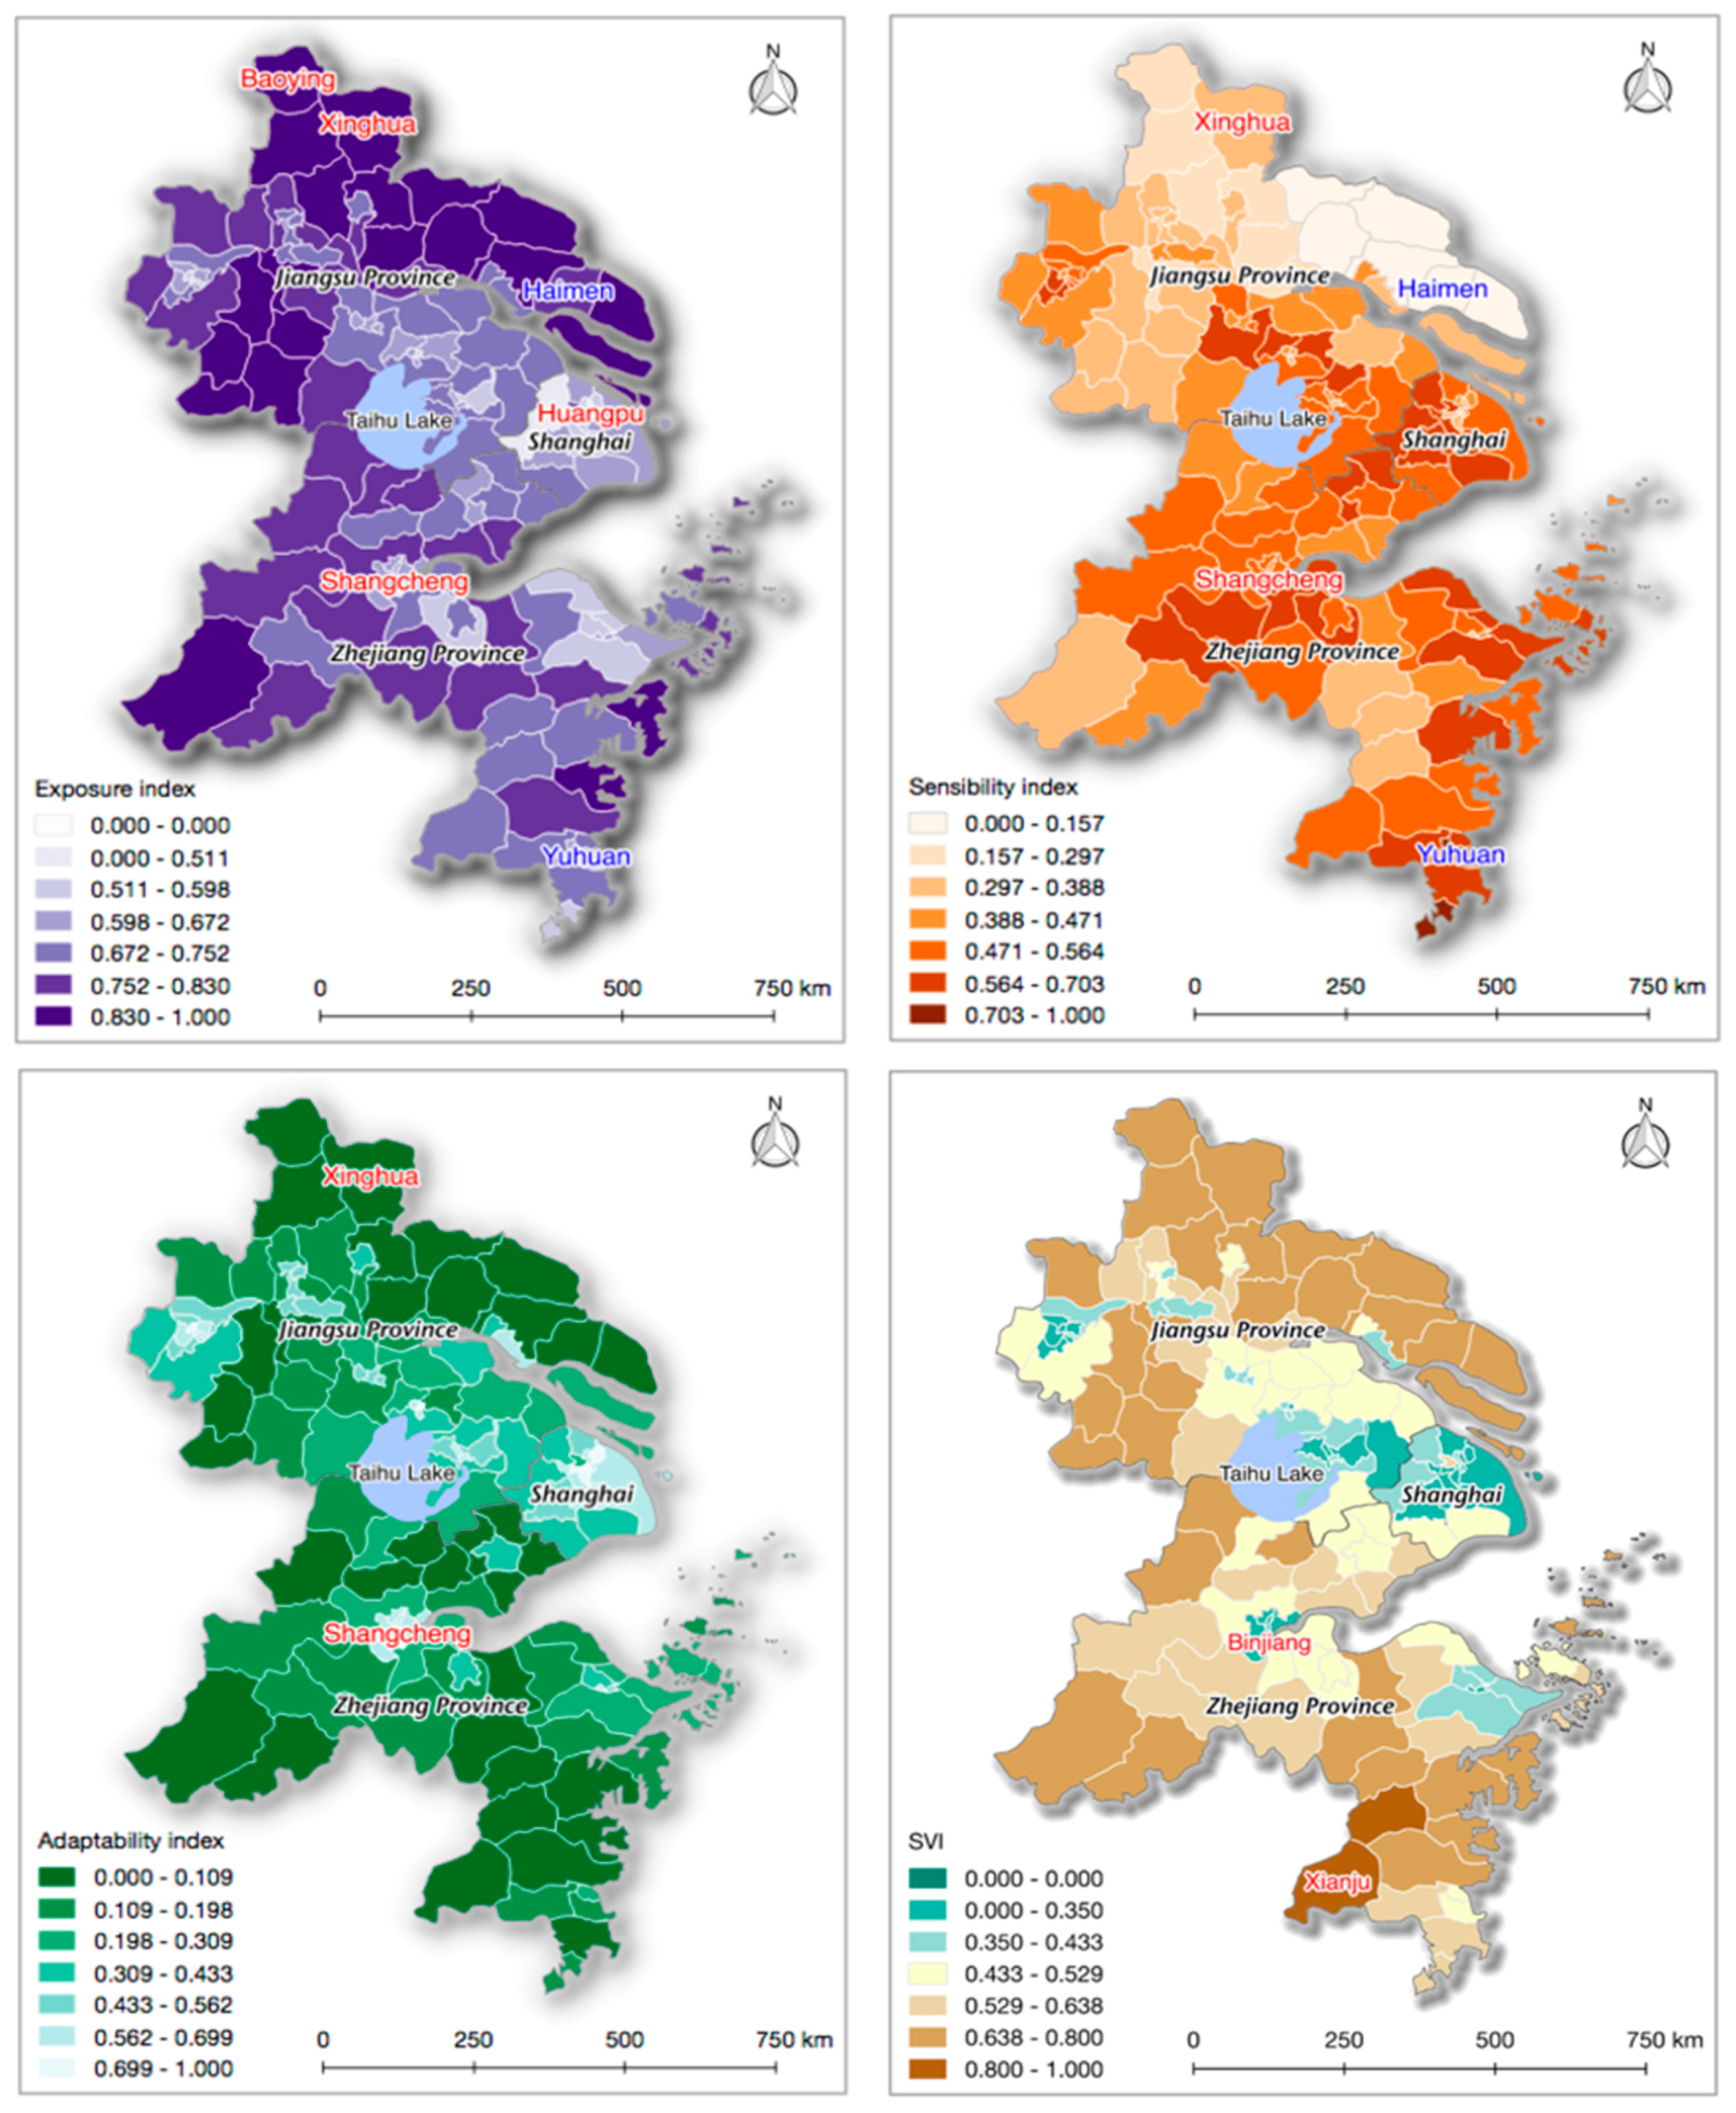
For the whole YRD region, more detailed information can be seen in the spatial patterns of EI, SI, AI, and SVI (Figure 4). Based on Figure 4, several conclusions can be drawn. First, although the deviation of EI in the YRD region was low according to Figure 2, obvious variations still can be found in the spatial patterns. High EI was observed in the northern part of the YRD region, for example, the cities of Yangzhou, Taizhou, and Nantong; the western part including parts of Nanjing, Zhenjiang and Changzhou, and parts of Hangzhou City. This also indicated that the exposure did not simply relate to the distance from the locations to the coastline.
Second, a high SI emerged in the center of the YRD region such as Wuxi, Suzhou, Shanghai, Ningbo, and Taizhou. However, sensitivity in North Jiangsu Province was low, especially for Haimen County. Therefore, following the portfolio on the dimension of sensitivity in Haimen County is a feasible way to reduce sensitivity in other districts or counties. Compared to the distribution of the other two indexes (EI and AI), the number of counties with high values was less, which means the whole level of sensitivity was not very bad.
Third, low AI could be found in the Northern YRD (e.g., cities of Yangzhou, Taizhou, and Nantong), the Western YRD (some parts of Hangzhou City), and Southern YRD (Shaoxing City and Taizhou City). Based on Figure 4, it was found that adaptability in most counties was low or medium-low.
Fourth, an overall high SVI was generally spread across the Northern, Western, and Southern parts of the YRD, especially, the Taizhou city in South Zhejiang Province. Though the sensitivity indexes of the main urban areas in Nanjing, Changzhou, Suzhou, Shanghai, Hangzhou, and Ningbo were high or medium-high, all of them had a low social vulnerability because of their low to medium EI and sufficiently high AI. This has provided another way to reduce social vulnerability: increasing the adaptability of communities can be useful if the exposure and sensitivity are not reduced.
Fifth, to evaluate whether the spatial patterns of four indexes were clustered, dispersed, or random, the Global Moran’s I was calculated. It was found that the Moran’s I of AI was 0.7196, which was bigger than the others. The next was the Moran’s I of SVI (0.7137), which was followed by the Moran’s I of EI (0.6232), and that of SI (0.590). Hence, there are geographical similarities to some extent.
Finally, the correlation coefficients of the indicators and indexes were calculated and are shown in Table 6. Separately, the indicator of “Employees in primary industry” related most to SVI and the indicator of “Ethnic minorities” related to SVI the least. The indicator of “Renter” related to EI the most and the indicator of “Houses with no tap water” related to EI the least. As for SI, the indicator of “Elderly” related to it the most and the indicator of “Higher education graduate” related to it least. Considering AI, the indicator of “Urban residents” related to it most, while the indicator of “Ethnic minorities” related to it least. These results can help decision makers find the focus of their mitigation works to improve the efficiency of practices.
4. Discussion and Conclusions
A modified approach based on the HVSI method was explored in this paper and a pilot demonstration was provided to illustrate its practical use. The strengths of our method were that first, based on the similarity matrix, our modified method could provide a procedure to choose the referenced community objectively and conveniently. Secondly, our method ranked social vulnerability, exposure, sensitivity, and adaptability according to profiles of the similarity matrix and specific attributes of the referenced community.
With the modified method, our findings are summarized as follows. First, according to the matrixes of Exposure Similarity Index (ESI), Sensitivity Similarity Index (SSI), Adaptability Similarity Index (ASI), and Vulnerability Similarity Index (VSI), the crucial referenced counties were found: Huangpu District, Baoying County, Haimen County, Yuhuan County, Xinghua County, and Shangcheng District. Second, most counties in the study area had high exposure, medium sensitivity, low adaptability, and medium social vulnerability. Third, there were the least differences of exposure among all counties in the study area, but adaptability among them varied the most. Fourth, when focusing on the city-level scale in the Yangtze River Delta, it showed that the adaptability performance of the 16 cities was not so good: adaptability index was much less than sensitivity index and exposure index (except for Shanghai). This led to the social vulnerability of 16 cities in this region being high, whereas the four cities of Shanghai, Nanjing, Suzhou, and Hangzhou were much less vulnerable than the other cities due to their high adaptability. Fifth, there were geographical similarities in separate patterns of the exposure index, sensitivity index, adaptability index, and social vulnerability index. Finally, the indicator of “Employees in primary industry” related to social vulnerability index the most, the indicator of “Renter” related to exposure index the most, the indicator of “Elderly” related to sensitivity index the most, and the indicator of “Urban residents” related to adaptability index the most.
Though this modified method provided a new way for measuring social vulnerability to climate change and climate-related hazards, limitations still exist. First, there is still a lack of a consistent set of metrics to measure social vulnerability to climate change. In this paper, the indicators on the dimension of adaptability was less than the other two dimensions (exposure and sensitivity). Second, the missing data can be accepted and treated in this method theoretically, but the impact on results has not been evaluated apparently and accurately. Considering that data availability in China is one of the most crucial factors affecting indicator selection—especially at the county or town level—it is valuable and necessary to pay more attention to data incompleteness. Regarding the problem of missing data, this will particularly be explored and analyzed in our future study. After that, we will overlay our social vulnerability index with flood maps or other climate-related hazards to explore where vulnerable people are. Finally, validating the results of the social vulnerability assessment has remained difficult until now. Our results in this paper were not validated directly, but can be justified by similar research conducted in the Yangtze River Delta region [66,67]. Moreover, the results can be proven indirectly by differentiated patterns of socioeconomic status and demographic changes in the Yangtze River Delta region.
Acknowledgments
This study was financially supported by the National Natural Science Foundation of China (Grant No. 41571488, Grant No. 41401382, and Grant No. 41701186), the National Foundation of Philosophy and Social Sciences, Philosophical Study on the Climate Science Debates (Grant No. 13BZX029). Special thanks to the reviewers and the editors for their critical comments that have greatly helped in improving the quality of this paper.
Author Contributions
Yi Ge and Jianping Dai contributed the materials; Wen Dou designed and performed the computer code of method; Yi Ge and Wen Dou analyzed the data; and Yi Ge wrote the paper.
Conflicts of Interest
The authors declare no conflict of interest.
References
- Intergovernmental Panel on Climate Change (IPCC). Climate Change 2014 Synthesis Report Summary Chapter for Policymakers; IPCC: Copenhagen, Denmark, 2014. [Google Scholar]
- Petkova, E.P.; Ebi, K.L.; Culp, D.; Irwin, R. Climate Change and Health on the U.S. Gulf Coast: Public Health Adaptation is Needed to Address Future Risks. Int. J. Environ. Res. Public Health 2015, 12, 9342–9356. [Google Scholar] [CrossRef] [PubMed]
- Cutter, S.L.; Boruff, B.J.; Shirley, W.L. Social Vulnerability to Environmental Hazards. Soc. Sci. Q. 2003, 84, 242–261. [Google Scholar] [CrossRef]
- Su, S.; Pi, J.; Wan, C.; Li, H.; Xiao, R.; Li, B. Categorizing social vulnerability patterns in Chinese coastal cities. Ocean Coast. Manag. 2015, 116, 1–8. [Google Scholar] [CrossRef]
- Wang, J.; Wang, W.; Wang, S. Climate Change and Coastal Vulnerability Assessment: A Case Study of China’s Yangtze River Delta Region. Geomat. Spat. Inf. Technol. 2017, 40, 81–89. [Google Scholar]
- State Oceanic Administration of PRC. China Marine Disaster Bulletin; SOA: Beijing, China, 2017.
- Global Change Research Institute; Battelle Memorial Institute; Pacific Northwest Division. China: Impact of Climate Change to 2030—A Commissioned Research Report; National Intelligence Council: Washington, DC, USA, 2009. [Google Scholar]
- Chang, S.E.; Yip, J.Z.K. Using vulnerability indicators to develop resilience networks: A similarity approach. Nat. Hazards 2015, 78, 1827–1841. [Google Scholar] [CrossRef]
- Cambridge University Press. Climate Change 2001: Impacts, Adaptation and Vulnerability; McCarthy, J.J., Canziani, O.F., Leary, N.A., Dokken, D.J., White, K.S., Eds.; Cambridge University Press: Cambridge, UK, 2001. [Google Scholar]
- Ge, Y.; Liu, J.; Li, F.; Shi, P. Quantifying social vulnerability for flood disasters of insurance company. J. Southeast Univ. 2008, 24, 147–150. [Google Scholar]
- Füssel, H.-M. Vulnerability: A generally applicable conceptual framework for climate change research. Glob. Environ. Chang. 2007, 17, 155–167. [Google Scholar] [CrossRef]
- Ge, Y.; Dou, W.; Liu, N. Planning Resilient and Sustainable Cities: Identifying and Targeting Social Vulnerability to Climate Change. Sustainability 2017, 9, 1394. [Google Scholar] [CrossRef]
- Cutter, S.L.; Finch, C. Temporal and spatial changes in social vulnerability to natural hazards. Proc. Natl. Acad. Sci. USA 2008, 7, 2301–2306. [Google Scholar] [CrossRef] [PubMed]
- Aubrecht, C.; Steinnocher, K.; Mario, K.; Zuger, J.; Loibl, W. Long-term spatio-temporal social vulnerability variation considering health-related climate change parameters particularly affecting elderly. Nat. Hazards 2013, 68, 1371–1384. [Google Scholar] [CrossRef]
- Birkmann, J.; Cardona, O.D.; Carreño, M.L.; Barbat, A.H.; Pelling, M.; Schneiderbauer, S.; Kienberger, S.; Keiler, D.; Alexander, M.; Zeil, T.; et al. Framing vulnerability, risk and societal responses: The MOVE framework. Nat. Hazards 2013, 67, 193–211. [Google Scholar] [CrossRef]
- Yenneti, K.; Tripathi, S.; Wei, Y.D.; Chen, W.; Joshi, G. The truly disadvantaged? Assessing social vulnerability to climate change in urban India. Habitat Int. 2016, 56, 124–135. [Google Scholar] [CrossRef]
- Stafford, S.; Abramowitz, J. An analysis of methods for identifying social vulnerability to climate change and sea level rise: A case study of Hampton Roads, Virginia. Nat. Hazards 2017, 85, 1089–1117. [Google Scholar] [CrossRef]
- Maria, B.; Hummell, D.L.; Cutter, S.L.; Emrich, C.T. Social Vulnerability to Natural Hazards in Brazil. Int. J. Disaster Risk Sci. 2016, 7, 111–122. [Google Scholar]
- Lundgren, L.; Jonsson, A. Assessment of Social Vulnerability: A Literature Review of Vulnerability Related to Climate Change and Natural Hazards; Centre for Climate Science and Policy Research: Norrköping, Sweden, 2012. [Google Scholar]
- Nguyen, T.T.X.; Bonetti, J.; Rogers, K.; Woodroffe, C.D. Indicator-based assessment of climate-change impacts on coasts: A review of concepts, methodological approaches and vulnerability indices. Ocean Coast. Manag. 2016, 123, 18–43. [Google Scholar] [CrossRef]
- Adger, W.N.; Vincent, K. Uncertainty in adaptive capacity. C. R. Geosci. 2005, 337, 399–410. [Google Scholar] [CrossRef]
- Mahendraa, R.S.; Mohanty, P.C.; Bisoyia, H.; Kumara Srinivasa, T.; Nayak, S. Assessment and management of coastal multi-hazard vulnerability along the Cuddalore–Villupuram, east coast of India using geospatial techniques. Ocean Coast. Manag. 2011, 54, 302–311. [Google Scholar] [CrossRef]
- Cutter, S.L.; Mitchell, J.T.; Scott, M.S. Revealing the Vulnerability of People and Places: A Case Study of Georgetown County, South Carolina. Source Ann. Assoc. Am. Geogr. 2000, 90, 713–737. [Google Scholar] [CrossRef]
- Wu, S.; Yarnal, B.; Fisher, A. Vulnerability of coastal communities to sea-level rise: A case study of Cape May County, New Jersey, USA. Clim. Res. 2002, 22, 255–270. [Google Scholar] [CrossRef]
- Zahran, S.; Brody, S.D.; Peacock, W.G.; Vedlitz, A.; Grover, H. Social vulnerability and the natural and built environment: A model of flood casualties in Texas. Disasters 2008, 32, 537–560. [Google Scholar] [CrossRef] [PubMed]
- Hou, J.; Lv, J.; Chen, X.; Yu, S. China’s regional social vulnerability to geological disasters: Evaluation and spatial characteristics analysis. Nat. Hazards 2016, 84, 97–111. [Google Scholar] [CrossRef]
- Noradika, Y.; Sungsu, M. Assessment of social vulnerability to natural hazards in South Korea: Case study for typhoon hazard. Spat. Inf. Res. 2017, 25, 99–116. [Google Scholar]
- Vincent, K. Creating an Index of Social Vulnerability to Climate Change in Africa; University of East Anglia: Norwich, UK, 2004. [Google Scholar]
- Singh, S.R.; Eghdami, M.R.; Singh, S. The Concept of Social Vulnerability: A Review from Disasters Perspectives. Int. J. Interdiscip. Multidiscip. Stud. 2014, 1, 71–82. [Google Scholar]
- Yoon, D.K. Assessment of social vulnerability to natural disasters: A comparative study. Nat. Hazards 2012, 823–843. [Google Scholar] [CrossRef]
- Vincent, K. Uncertainty in adaptive capacity and the importance of scale. Glob. Environ. Chang. 2007, 17, 12–24. [Google Scholar] [CrossRef]
- Wood, N.J.; Burton, C.G.; Cutter, S.L. Community variations in social vulnerability to Cascadia-related tsunamis in the U.S. Pacific Northwest. Nat. Hazards 2010, 52, 369–389. [Google Scholar] [CrossRef]
- Wang, C.; Yarnal, B. The vulnerability of the elderly to hurricane hazards. Nat. Hazards 2012, 63, 349–373. [Google Scholar] [CrossRef]
- Guillard-gonçalves, C.; Cutter, S.L.; Emrich, C.T. Application of Social Vulnerability Index (SoVI) and delineation of natural risk zones in Greater Lisbon, Portugal. J. Risk Res. 2015, 9877, 1–24. [Google Scholar] [CrossRef]
- Frigerio, I.; Ventura, S.; Strigaro, D.; Mattavelli, M.; De Amicis, M.; Mugnano, S.; Bof, M. A GIS-based approach to identify the spatial variability of social vulnerability to seismic hazard in Italy. Appl. Geogr. 2016, 74, 12–22. [Google Scholar] [CrossRef]
- De Mendes, J.M.O. Social vulnerability indexes as planning tools: Beyond the preparedness paradigm. J. Risk Res. 2017, 12, 43–58. [Google Scholar] [CrossRef]
- Goodall, D.W. Statistical Plant Ecology. Ann. Rev. Ecol. Syst. 1970, 1, 99–124. [Google Scholar] [CrossRef]
- Hruby, T. Using Similarity Measures in Benthic Impact Assessments. Environ. Monit. Assess. 1987, 8, 163–180. [Google Scholar] [CrossRef] [PubMed]
- Ashby, F.G.; Ennis, D.M. Similarity measures. Scholarpedia 2007, 2, 4116. [Google Scholar] [CrossRef]
- Hastings, A.; Gross, L.J. Encyclopedia of Theoretical Ecology; University of California Press: Oakland, CA, USA, 2012. [Google Scholar]
- Zhao, Y.; He, T.; Cheng, Z.; Zhang, J.; Yang, M.; Zhang, Y. Interspecific Relationships among Common Plant Species in Wetlands in the Yinchuan Plain. Arid Zone Res. 2013, 30, 838–844. [Google Scholar]
- Feng, Y.; Bagheri, E.; Ensan, F.; Jovanovic, J. The state of the art in semantic relatedness: A framework for comparison. Knowl. Eng. Rev. 2017. [Google Scholar] [CrossRef]
- Zhang, M.; Hu, H.; He, Z.; Gao, L.; Sun, L. A comprehensive structural-based similarity measure in directed graphs. Neurocomputing 2015, 167, 147–157. [Google Scholar] [CrossRef]
- Zager, L.A.; Verghese, G.C. Graph similarity scoring and matching. Appl. Math. Lett. 2008, 21, 86–94. [Google Scholar] [CrossRef]
- Beg, I.; Ashraf, S. Similarity Measures for Fuzzy Sets. Appl. Comput. Math. 2009, 8, 192–202. [Google Scholar]
- Deshpande, R.; VanderSluis, B.; Myers, C. Comparison of profile similarity measures for genetic interaction networks. PLoS ONE 2013, 8. [Google Scholar] [CrossRef] [PubMed]
- Yu, Z. Comparison Method of DNA Sequence Similarity in Aquatic Organisms. Chin. J. Fish. 2016, 29, 22–26. [Google Scholar]
- Furr, R.M.; Wood, D. On the similarity between exchangeable profiles: A psychometric model, analytic strategy, and empirical illustration. J. Res. Personal. 2013, 47, 233–247. [Google Scholar] [CrossRef] [PubMed]
- Fang, N. China’s Democracy Path; Springer: Berlin/Heidelberg, Germany, 2015. [Google Scholar]
- Han, L.; Xu, Y.; Pan, G.; Deng, X.; Hu, C.; Xu, H.; Shi, H. Changing properties of precipitation extremes in the urban areas, Yangtze River Delta, China, during 1957. Nat. Hazards 2015, 79, 437–454. [Google Scholar] [CrossRef]
- Zhong, S.; Qian, Y.; Zhao, C.; Leung, R.; Wang, H.; Yang, B.; Fan, J.; Yan, H.; Yang, X.-Q.; Liu, D.Q. Urbanization-induced urban heat island and aerosol effects on climate extremes in the Yangtze River Delta region of China. Atmos. Chem. Phys. 2017, 17, 5439–5457. [Google Scholar] [CrossRef]
- Zhang, D.; You, X.; Wang, C. New and Excellent Tree Species Selection in Shanghai’s Response to Climate Change. Chin. Landsc. Archit. 2010, 9, 72–77. [Google Scholar]
- Gu, C.; Hu, L.; Zhang, X.; Wang, X.; Guo, J. Climate change and urbanization in the Yangtze River Delta. Habitat Int. 2011, 35, 544–552. [Google Scholar] [CrossRef]
- IPCC Climate Change 2013: The Physical Science Basis; Working Group I to the Fifth Assessment Report of the Intergovernmental Panel on Climate Change; Cambridge University Press: Cambridge, UK, 2013.
- Liu, B.; Ling, Y.; Gordon, S.; Wei, M. Exceedance probability of multiple natural hazards: Risk assessment in China’s Yangtze River Delta. Nat. Hazards 2013, 69, 2039–2055. [Google Scholar] [CrossRef]
- The National Disaster Reduction Center of China (Ministry of Civil Affairs of China). Atlas of Natural Disaster in China; SinoMaps Press: Beijing, China, 2017.
- Ge, Y.; Dou, W.; Zhang, H. A New Framework for Understanding Urban Social Vulnerability from a Network Perspective. Sustainability 2017, 9, 1723. [Google Scholar] [CrossRef]
- Tucker, J.; Daoud, M.; Oates, N.; Matheson, S. Social vulnerability in three high-poverty climate change hot spots: What does the climate change literature tell us? Reg. Environ. Chang. 2015, 15, 783–800. [Google Scholar] [CrossRef]
- Holand, I.S.; Lujala, P.; Rød, J.K. Social vulnerability assessment for Norway: A quantitative approach. Nor. Geogr. Tidsskr. 2011, 65, 1–17. [Google Scholar] [CrossRef]
- Feroz, R.A. Climate Change Vulnerability Assessment for Sustainable Urban Development: A Study on Slum Population of Kota, India; Linköping University: Linköping, Sweden, 2012. [Google Scholar]
- Morrow, B.H. Identifying and Mapping Community Vulnerability. Disasters 1999, 23, 1–18. [Google Scholar] [CrossRef] [PubMed]
- Wisner, B.; Blaikie, P.; Cannon, T.; Davis, I. At Risk: Natural Hazards, People’s Vulnerability, and Disasters, 2nd ed.; Routledge: London, UK, 2004. [Google Scholar]
- Frigerio, I.; Amicis, M. De Mapping social vulnerability to natural hazards in Italy: A suitable tool for risk mitigation strategies. Environ. Sci. Policy 2016, 63, 187–196. [Google Scholar] [CrossRef]
- Mildrexler, D.; Yang, Z.; Cohen, W.B.; Bell, D.M. A forest vulnerability index based on drought and high temperatures. Remote Sens. Environ. 2015, 173, 314–325. [Google Scholar] [CrossRef]
- Zhou, Y.; Li, N.; Wu, W.; Wu, J.; Shi, P. Local spatial and temporal factors influencing population and societal vulnerability to natural disasters. Risk Anal. 2014, 34, 614–639. [Google Scholar] [CrossRef] [PubMed]
- Ge, Y.; Dou, W.; Gu, Z.; Qian, X. Assessment of social vulnerability to natural hazards in the Yangtze River Delta, China. Stoch. Environ. Res. Risk Assess. 2013, 27, 1899–1908. [Google Scholar] [CrossRef]
- Ge, Y.; Zhang, H.; Dou, W.; Chen, W.; Liu, N.; Wang, Y.; Shi, Y.; Rao, W. Mapping Social Vulnerability to Air Pollution: A Case Study of the Yangtze River Delta Region, China. Sustainability 2017, 9, 109. [Google Scholar] [CrossRef]
Figure 1.
The geographic location of the Yangtze River Delta region in China.
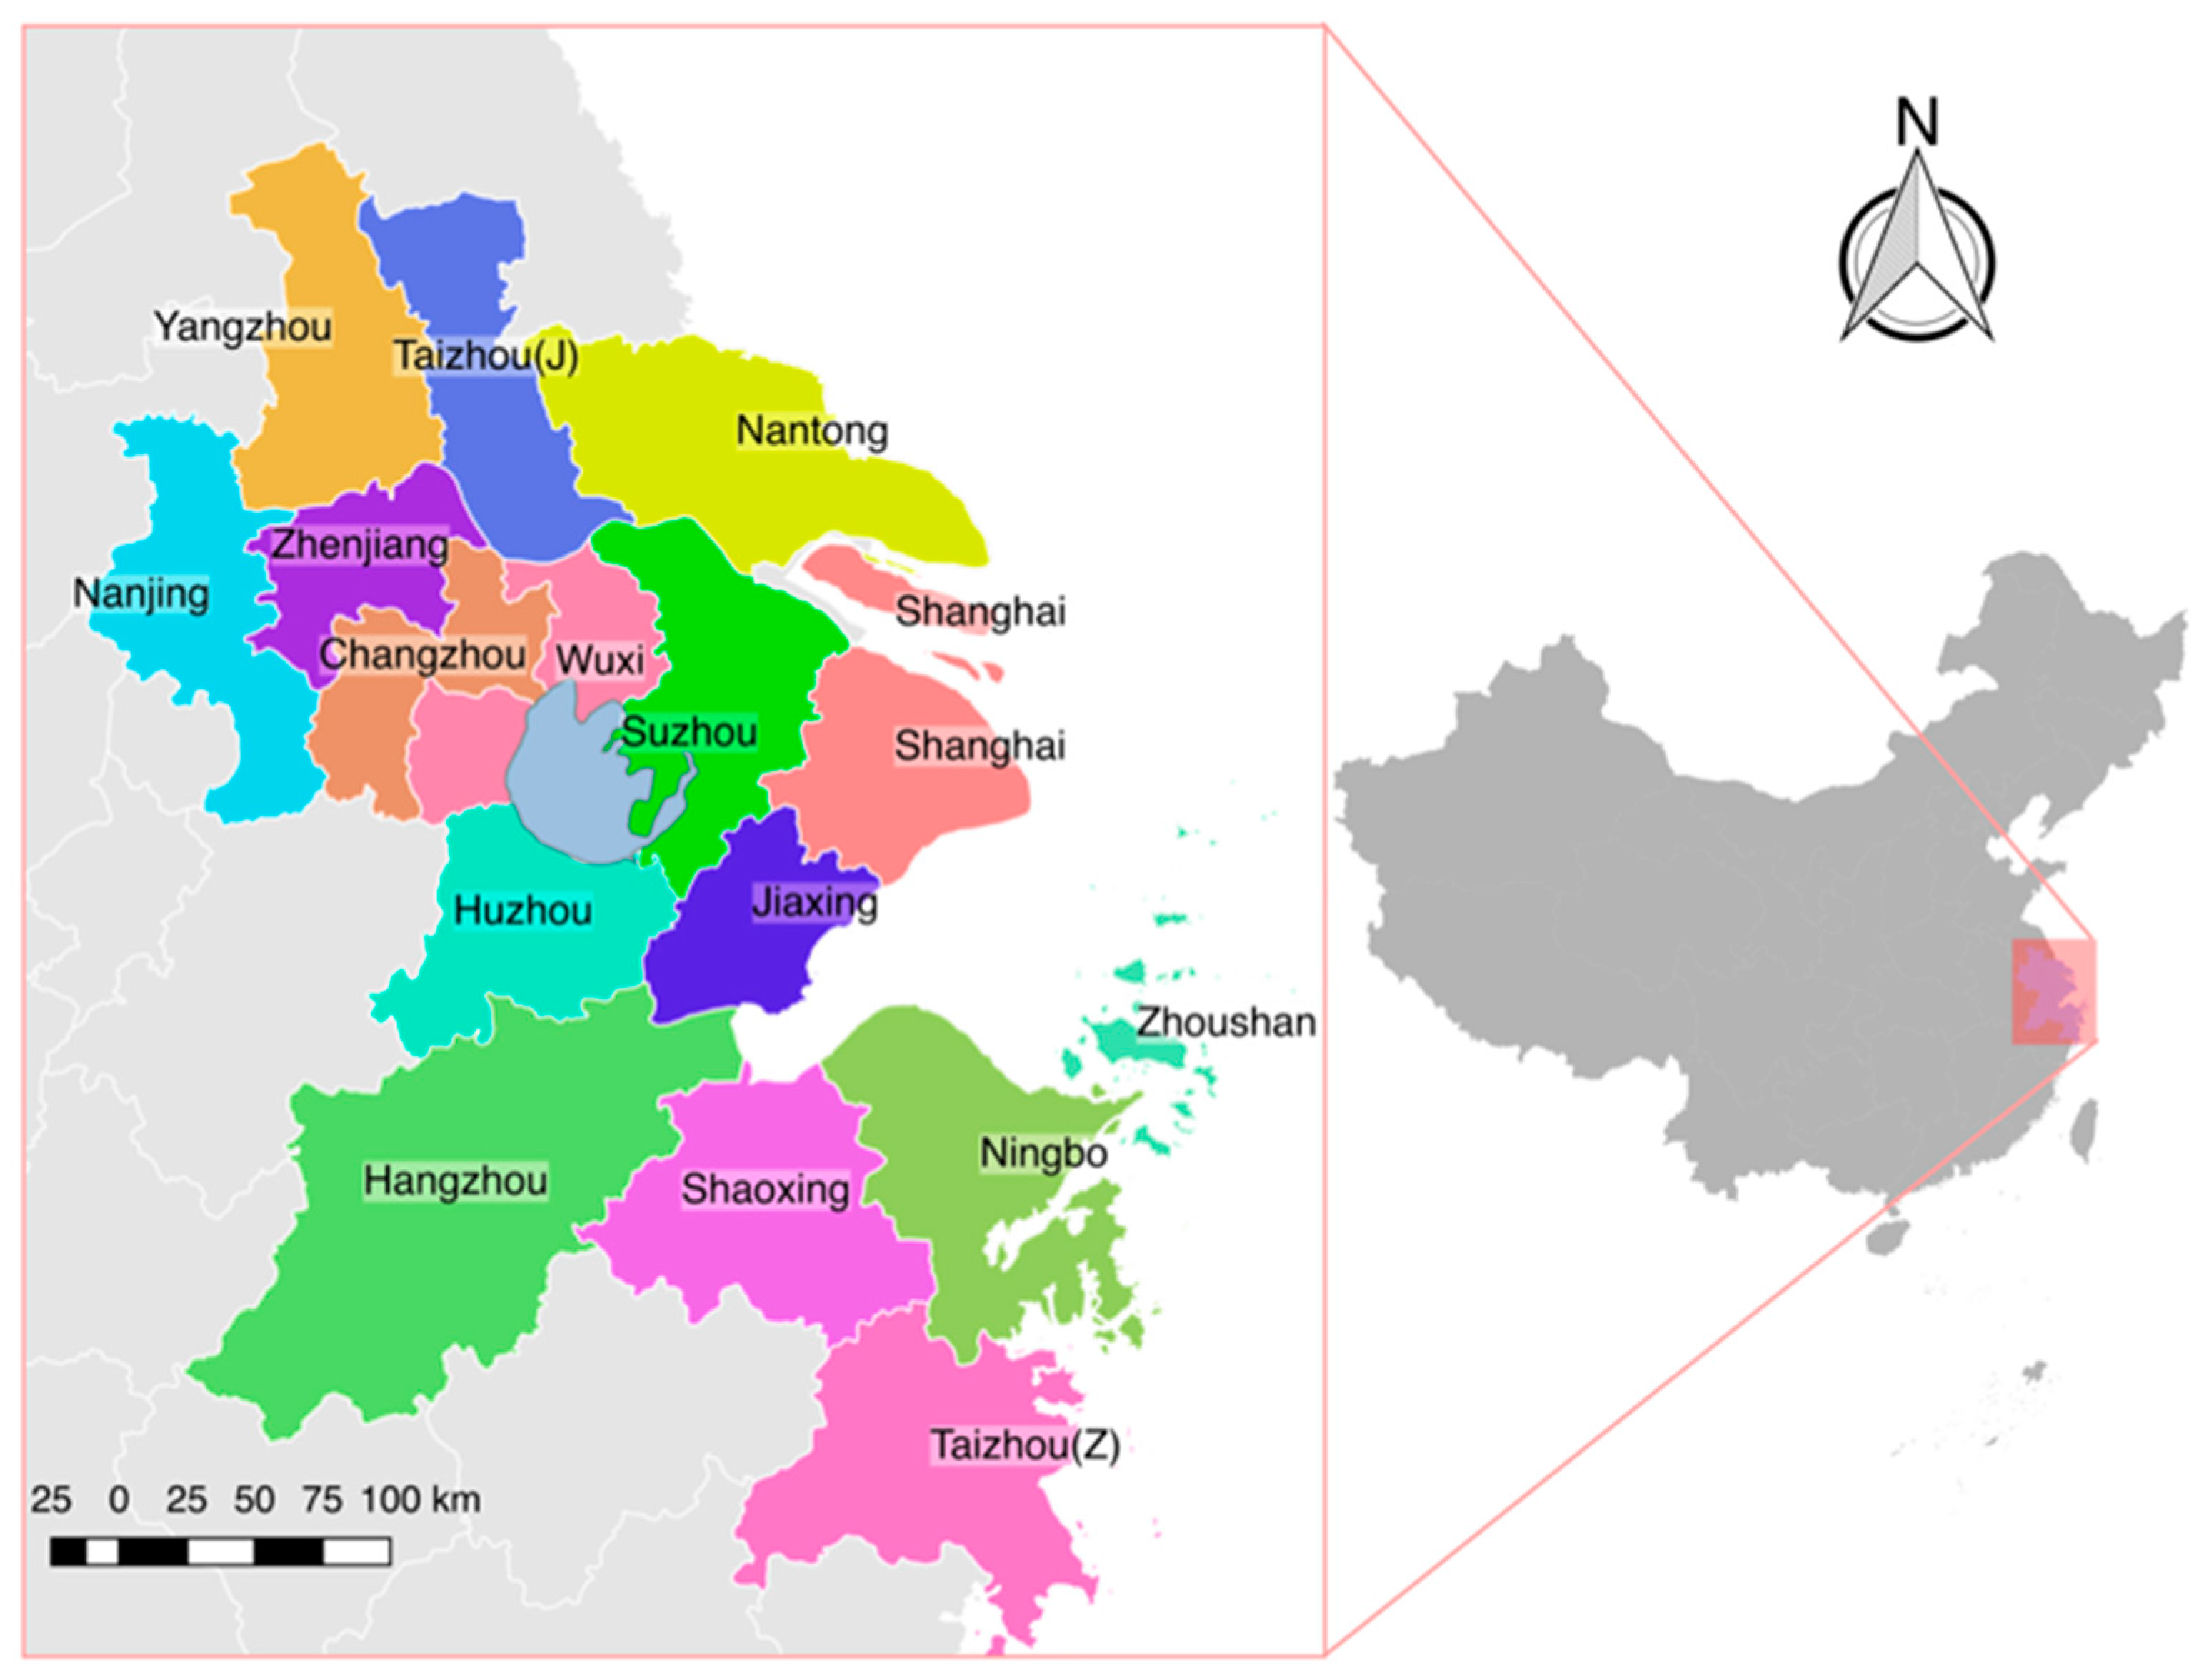
Figure 2.
Distribution of exposure index (EI), sensitivity index (SI), adaptability index (AI) and social vulnerability index (SVI) values based on similarity index matrixes (the referenced counties are labelled as red diamond).
Figure 2.
Distribution of exposure index (EI), sensitivity index (SI), adaptability index (AI) and social vulnerability index (SVI) values based on similarity index matrixes (the referenced counties are labelled as red diamond).

Figure 3.
Spatial pattern of SVI at the city level (a) and distribution of EI, SI, AI, and SVI values (b).
Figure 3.
Spatial pattern of SVI at the city level (a) and distribution of EI, SI, AI, and SVI values (b).
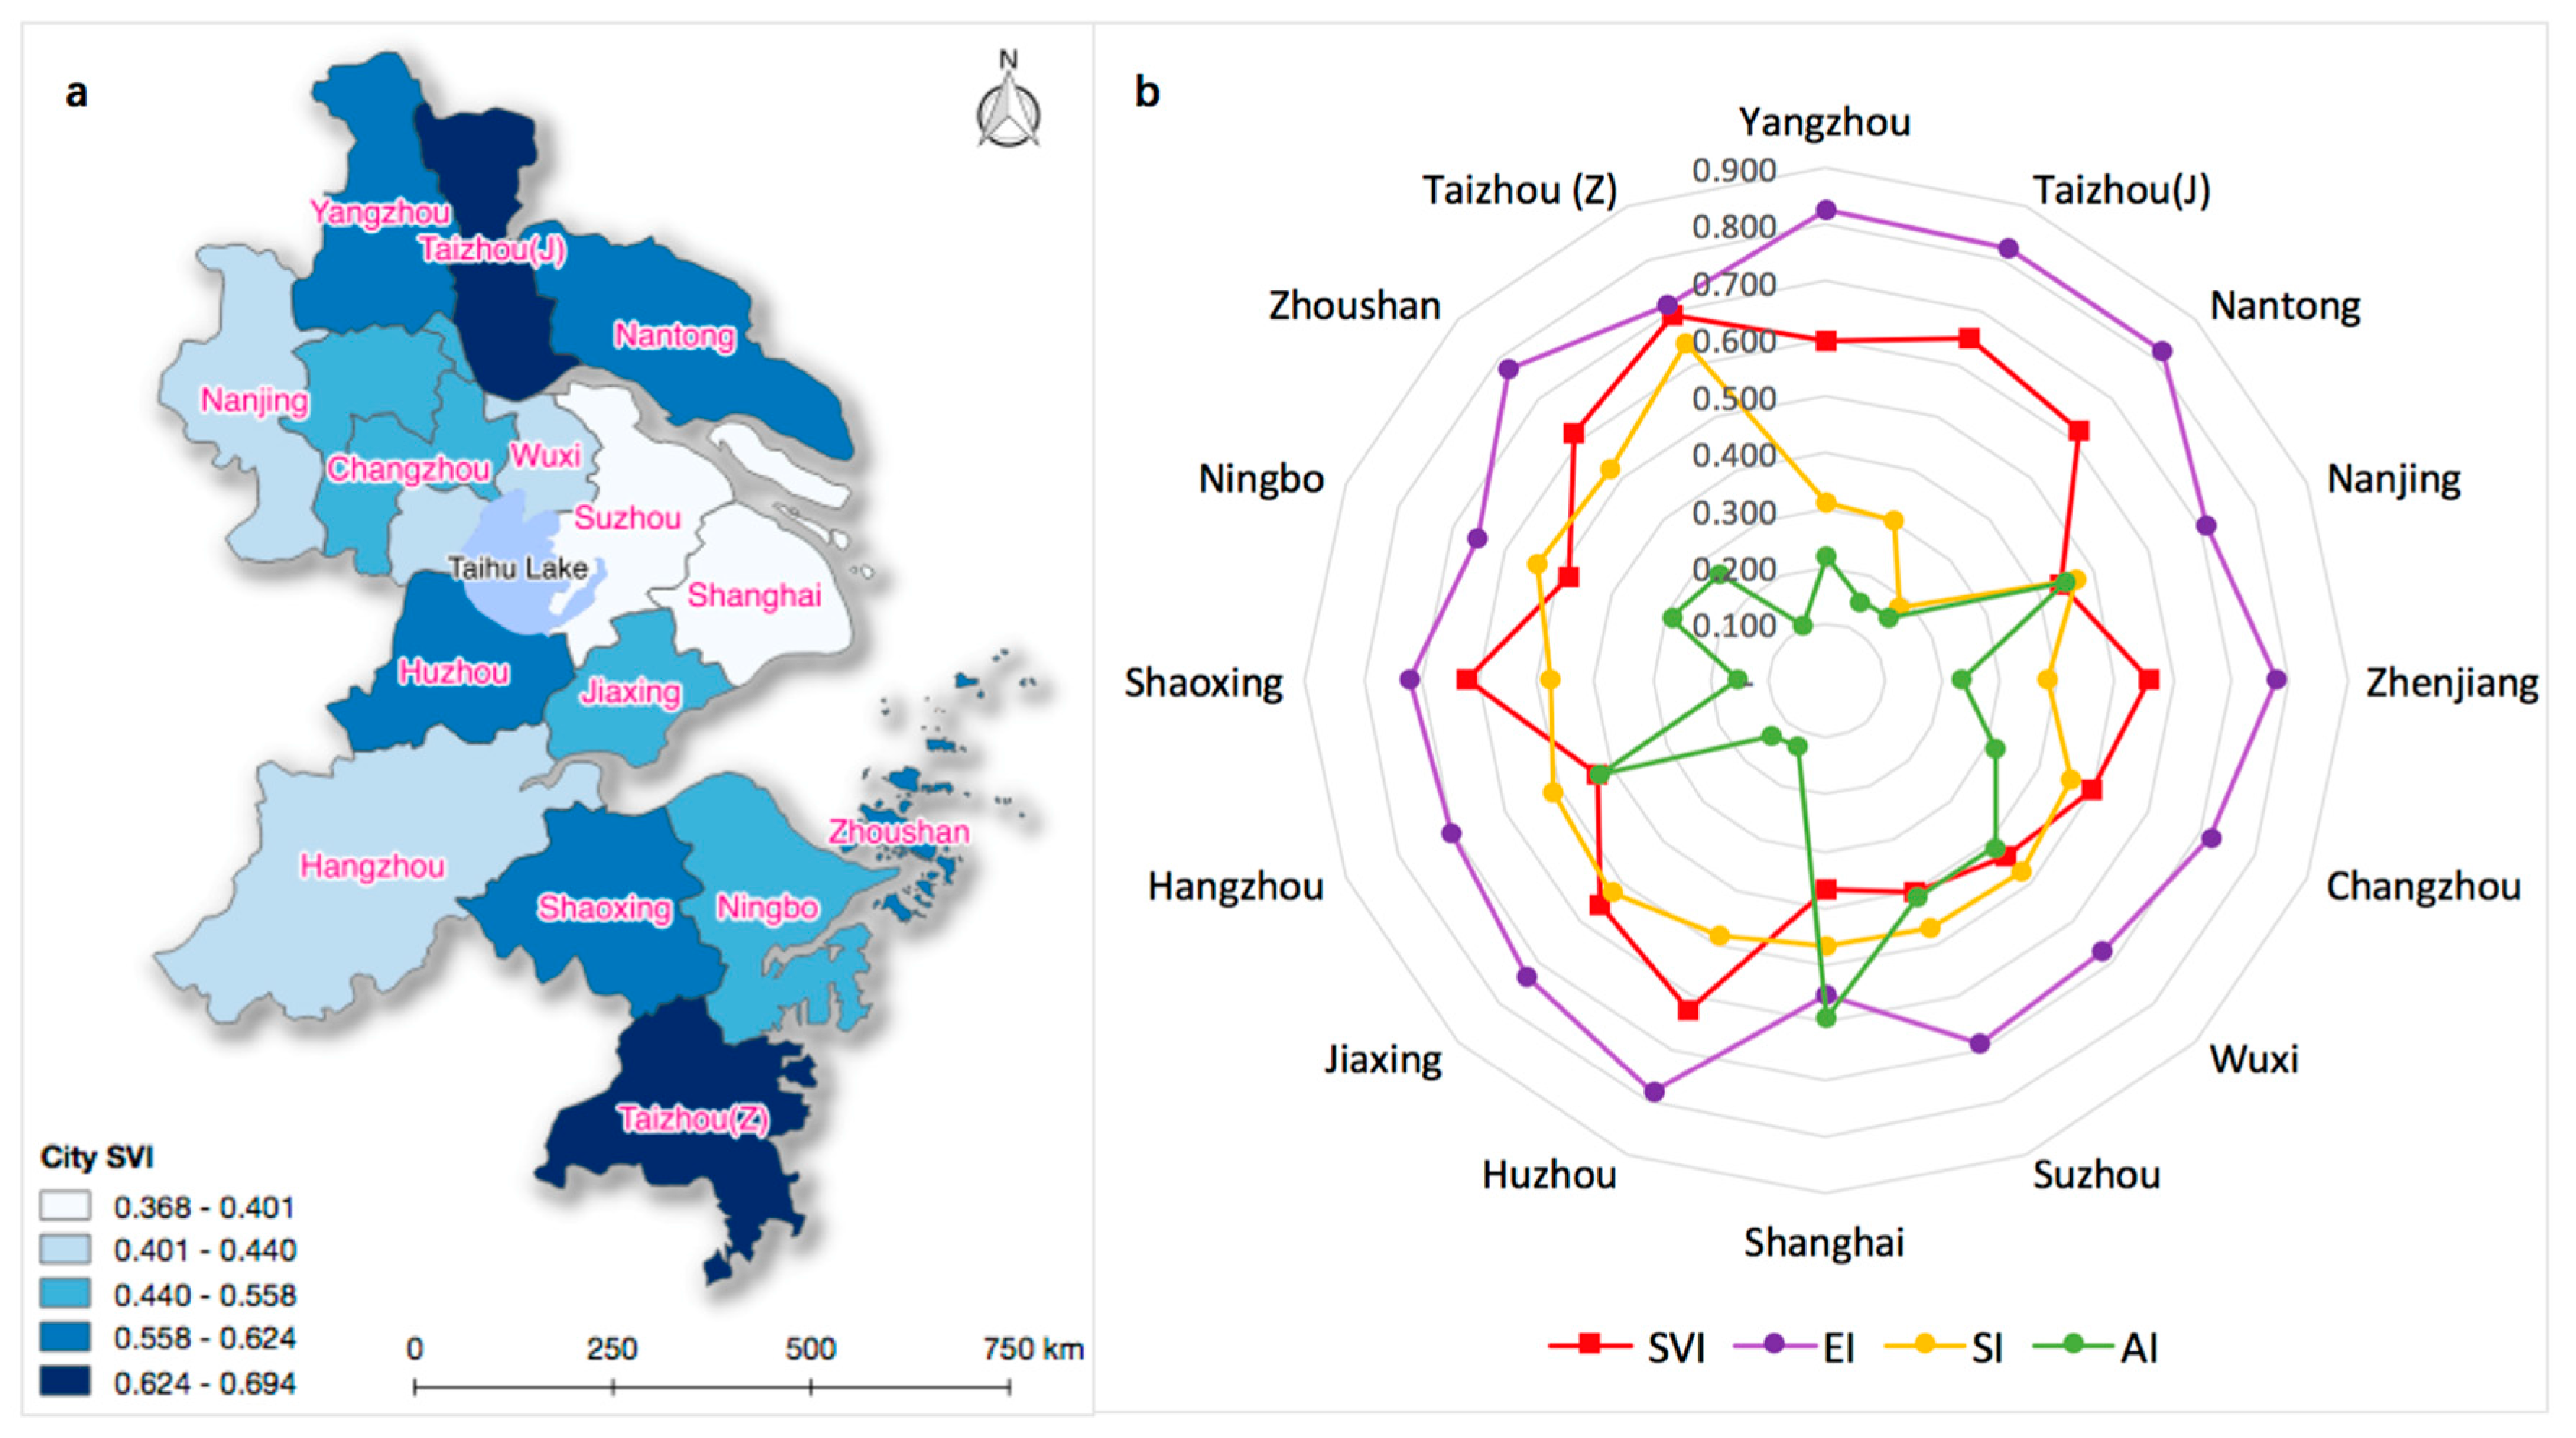
Figure 4.
Spatial patterns of EI, SI, AI, and SVI values.

Table 1.
Damage of weather and climate disasters in the Yangtze River Delta region (2011–2015) [56].
Table 1.
Damage of weather and climate disasters in the Yangtze River Delta region (2011–2015) [56].
| Disaster | Province | Affected (10,000) | Death and Missing | Homeless (10,000) | Estimated Damage (Million Yuan) |
|---|---|---|---|---|---|
| drought | Shanghai | 0 | 0 | 0 | 0 |
| Jiangsu | 440.9 | / | / | 156 | |
| Zhejiang | 93.3 | / | / | 1580 | |
| flood | Shanghai | 2.2 | 0 | 0 | 40 |
| Jiangsu | 126.8 | 0 | 2.2 | 1830 | |
| Zhejiang | 200.8 | 11 | 10.6 | 4230 | |
| hail | Shanghai | 0.02 | 2 | 0 | 2 |
| Jiangsu | 174.0 | 9 | 1.0 | 1300 | |
| Zhejiang | 9.3 | 3 | 0.1 | 110 | |
| Typhoon | Shanghai | 20.8 | 1 | 16.3 | 270 |
| Jiangsu | 121.4 | 0 | 8.3 | 1270 | |
| Zhejiang | 610.0 | 6 | 124.8 | 22760 | |
| Snow and freezing | Shanghai | 0 | 0 | 0 | 0 |
| Jiangsu | 26.1 | 0 | 0.1 | 290 | |
| Zhejiang | 41.8 | 2 | 0.4 | 440 |
Table 2.
The social-economic conditions in the Yangtze River Delta region (2014).
| Province | City | GDP (Billion US Dollars) | Population (Million) | Land Area (km2) | Population Density (People per km2) |
|---|---|---|---|---|---|
| Shanghai | Shanghai | 385.04 | 24.26 | 6341 | 3826 |
| Jiangsu | Nanjing | 144.15 | 6.49 | 6587 | 1247 |
| Wuxin | 134.10 | 4.77 | 4627.46 | 1405 | |
| Changzhou | 80.11 | 3.69 | 4372 | 1074 | |
| Suzhou | 224.89 | 6.61 | 8657 | 1225 | |
| Nantong | 92.38 | 7.68 | 10,549 | 692 | |
| Yangzhou | 60.43 | 4.61 | 6591 | 679 | |
| Zhenjiang | 53.15 | 2.72 | 3847 | 826 | |
| Taizhou | 55.09 | 5.09 | 5787 | 802 | |
| Total | 844.30 | 41.65 | 51,017 | 816 | |
| Zhejiang | Hangzhou | 150.45 | 7.16 | 16,596 | 431 |
| Ningbo | 124.37 | 5.84 | 9816 | 595 | |
| Jiaxing | 54.79 | 3.48 | 3915 | 889 | |
| Huzhou | 31.97 | 2.64 | 5820 | 453 | |
| Shaoxing | 69.72 | 4.43 | 8279 | 535 | |
| Zhoushan | 16.59 | 0.97 | 1455 | 670 | |
| Taizhou | 55.36 | 5.97 | 9411 | 634 | |
| Total | 503.25 | 30.50 | 55,292 | 552 | |
| China | 10,401.42 | 1367.82 | 9,600,000 | 142 | |
| YRD | 1732.59 | 96.56 | 112,650 | 857 | |
| Ratio of YRD to China | 16.66% | 7.06% | 1.17% | 6.04 | |
Table 3.
Indicators for social vulnerability assessment with similarity approach.
| No. | Indicator | Description | Impact to SVI | Factor | Dimension of SVI |
|---|---|---|---|---|---|
| 1 | Population density | High population density means more people exposed in risk and makes evacuation and recovery management more complicated [59] | + | People exposure | Exposure |
| 2 | Rate of natural increase (RNI) | Communities with high RNI may challenge the available public services [3]. | + | ||
| 3 | Employees in primary industry | These employees are affected by climate hazards directly and severely due to greater dependence on resource extraction economies [12]. | + | ||
| 4 | GDP in primary sector | GDP in this sector gained most from resource extraction economies which affected climate change most [12]. | + | Economic exposure | |
| 5 | GDP density | A substitute for fixed assets exposed to extreme events [3]. | + | ||
| 6 | Houses with no bath facilities | People living in poor housing conditions, such as lacking sufficient living space or access to safe drinking water and sanitation, are more fragile to climate change and hazards [60]. | + | House exposure | |
| 7 | Houses with no lavatory | + | |||
| 8 | Houses with no tap water | + | |||
| 9 | Houses with no kitchen | + | |||
| 10 | Children | Children are more fragile to extreme events than adults [61]. | + | People sensitivity | Sensitivity |
| 11 | Elderly | Elderly may have mobility constraints and be sensible to diseases [61]. | + | ||
| 12 | Female | Responsibilities make women have more difficulty than men after extreme events [62]. | + | ||
| 13 | Family size | Families with large numbers of dependents will reduce the resilience of the whole family [63]. | + | Family sensitivity | |
| 14 | Ethnic minorities | Language and cultural barriers limited their access to efficient aid [12]. | + | Vulnerable group | |
| 15 | Illiterate | Their access to recovery information is often constrained [64]. | + | ||
| 16 | Unemployed | They are more likely to be exposed to hazardous environmental changes and take fewer precautions and recovery actions [64]. | + | ||
| 17 | Renter | They lack sufficient shelter options and access to information of aid [3]. | + | ||
| 18 | Immigrates from other provinces | The unfamiliar environment limited their access to aid [12]. | + | ||
| 19 | GDP per capita | Wealth enables the residents to absorb and recover from losses quickly [3]. | − | Economic adaptability | Adaptability |
| 20 | Higher education graduate | Higher education links to higher socioeconomic status and more access to prevention and recovery [59]. | − | Individual adaptability | |
| 21 | Urban residents | Rural residents depend more on resource extraction economies affected by climate change largely [3]. | − | ||
| 22 | Beds in hospital per 1000 people | Sufficient medical services including beds and physicians will help relief and recovery in mitigation [3]. | − | Health care infrastructures | |
| 23 | Physicians in hospital per 1000 people | − | |||
| 24 | Employees in management sector | Management services can alleviate the potential losses and improve the resilience of communities [65]. | − | Management services |
Note: “+” indicates the indicator tends to increase social vulnerability; “−” indicates the indicator tends to decrease social vulnerability.
Table 4.
Referenced communities (county-level) in this study.
| Value | Referenced Community (Max) | Referenced Community (Min) | |
|---|---|---|---|
| ESI matrix | 0.344 | Baoying County of Yangzhou City | Huangpu District of Shanghai City |
| SSI matrix | 0.445 | Yuhuan County of Taizhou (Z) City | Haimen County of Nantong City |
| ASI matrix | 0.360 | Shangcheng District of Hangzhou City | Xinghua County of Taizhou (J) City |
| VSI matrix | 0.466 | Xianju County of Taizhou (Z) City | Binjiang District of Hangzhou City |
Table 5.
Statistics about exposure index (EI), sensitivity index (SI), adaptability index (AI) and social vulnerability index (SVI) values at the county level in the Yangtze River Delta (YRD).
Table 5.
Statistics about exposure index (EI), sensitivity index (SI), adaptability index (AI) and social vulnerability index (SVI) values at the county level in the Yangtze River Delta (YRD).
| Maximum | Minimum | Average Value | Stand Deviation | |
|---|---|---|---|---|
| EI | 1 | 0 | 0.707 | 0.125 |
| SI | 1 | 0 | 0.459 | 0.458 |
| AI | 1 | 0 | 0.323 | 0.236 |
| SVI | 1 | 0 | 0.507 | 0.506 |
Table 6.
Correlation coefficients of indicators and indexes.
| Indicator Name | SVI | EI | SI | AI |
|---|---|---|---|---|
| Children | 0.69 | 0.41 | 0.17 | −0.65 |
| Elderly | 0.50 | 0.33 | −0.77 | −0.21 |
| Family size | 0.32 | 0.43 | −0.20 | −0.37 |
| Female | 0.33 | 0.25 | −0.75 | −0.17 |
| Ethnic minorities | −0.17 | −0.33 | 0.72 | −0.02 |
| Immigrates from other provinces | −0.84 | −0.72 | 0.61 | 0.65 |
| Illiterate | 0.67 | 0.43 | 0.22 | −0.61 |
| Unemployed | 0.71 | 0.50 | 0.06 | −0.63 |
| Renter | −0.72 | −0.78 | 0.65 | 0.51 |
| Rate of natural increase (RNI) | −0.32 | −0.09 | 0.66 | 0.09 |
| Population density | −0.51 | −0.66 | −0.09 | 0.69 |
| Employees in primary industry | 0.89 | 0.72 | −0.43 | −0.74 |
| GDP in primary sector | 0.84 | 0.70 | −0.22 | −0.75 |
| GDP per capita | −0.44 | −0.72 | −0.10 | 0.62 |
| Houses with no tap water | −0.40 | −0.01 | −0.21 | 0.30 |
| Houses with no kitchen | 0.27 | 0.64 | −0.66 | −0.09 |
| Houses with no lavatory | −0.35 | 0.22 | 0.13 | 0.26 |
| Houses with no bath facilities | −0.20 | 0.30 | −0.47 | 0.24 |
| Urban residents | −0.86 | −0.71 | −0.11 | 0.94 |
| Higher education graduate | −0.78 | −0.57 | 0.00 | 0.91 |
| Employees in management sector | −0.67 | −0.52 | 0.13 | 0.81 |
| Physicians in hospital per 1000 people | −0.58 | −0.51 | −0.14 | 0.86 |
| Beds in hospital per 1000 people | −0.56 | −0.46 | −0.03 | 0.64 |
| GDP per capita | −0.61 | −0.41 | 0.29 | 0.41 |
© 2017 by the authors. Licensee MDPI, Basel, Switzerland. This article is an open access article distributed under the terms and conditions of the Creative Commons Attribution (CC BY) license (http://creativecommons.org/licenses/by/4.0/).
Share and Cite
MDPI and ACS Style
Ge, Y.; Dou, W.; Dai, J. A New Approach to Identify Social Vulnerability to Climate Change in the Yangtze River Delta. Sustainability 2017, 9, 2236. https://doi.org/10.3390/su9122236
AMA Style
Ge Y, Dou W, Dai J. A New Approach to Identify Social Vulnerability to Climate Change in the Yangtze River Delta. Sustainability. 2017; 9(12):2236. https://doi.org/10.3390/su9122236
Chicago/Turabian StyleGe, Yi, Wen Dou, and Jianping Dai. 2017. "A New Approach to Identify Social Vulnerability to Climate Change in the Yangtze River Delta" Sustainability 9, no. 12: 2236. https://doi.org/10.3390/su9122236
Note that from the first issue of 2016, this journal uses article numbers instead of page numbers. See further details here.