Dynamic Land-Use Map Based on Twitter Data


1
Graduate School of Environmental Engineering, The University of Kitakyushu, Kitakyushu 808-0135, Japan
2
School of Management Informatics and Computer (STMIK Handayani Makassar), Makassar 90231, Indonesia
3
Department of Architecture, Faculty of Engineering, Bandar Lampung University, Bandar Lampung 35142, Indonesia
4
Department of Architecture, Faculty of Environmental Engineering, The University of Kitakyushu, Kitakyushu 808-0135, Japan
*
Author to whom correspondence should be addressed.
Sustainability 2017, 9(12), 2158; https://doi.org/10.3390/su9122158
Submission received: 28 September 2017
/
Revised: 6 November 2017
/
Accepted: 17 November 2017
/
Published: 23 November 2017
(This article belongs to the Section Sustainable Engineering and Science)
Abstract
:Location-based social media allows people to communicate and share information on a popular landmark. With millions of data records generated, it provides new knowledge about a city. The identification of land use intends to uncover accurate positions for future urban development planning. The purpose of this research is to investigate the use of social networking check-in data as a source of information to characterize dynamic urban land use. The data from this study were obtained from the social media application i.e., Twitter. Three kinds of data that are prioritized in this research are check-ins (specific location), timestamps, and a user’s status text or post activities. In this study, we propose a grid-based aggregation method to divide the urban area. Two different approaches are compared—rank and clustering methods to group the place’s activities. Then we utilize time distribution frequency to attain the land-use function. In this case, Makassar City, Indonesia, has been selected as the case study. An analysis shows that the check-in activity and the method we proposed can be used to group the actual land-use types.
1. Introduction
Urban planning is a technical process in the formation, arrangement, and development of a city. One kind of study on urban planning is land-use mapping, related to accurate land determination for urban zoning. The problem on urban land-use mapping is deciding upon the particular region for certain land use. Previous studies have been conducted to detect land use over time, such as the use of aerial photographs for mapping and quantifying the change in forest land-use patterns [1], remote sensing [2], geographic information systems techniques [3], and Landsat images via satellite, which provide an efficient means for land-use detection [4,5]. However, these approaches have some weaknesses, such as the inability of numerous sensors to obtain data and information in cloudy areas. Clouds make the resolution of the satellite imagery too coarse for detailed mapping and for distinguishing small contrasting areas, yet high-resolution satellite imagery is very costly and time-consuming [6].
With the development of an embedded system planted on the smartphone, a user’s movement could be tracked [7]. Researchers use the mobile phone’s footprint to predict the user’s behavior [8], Bluetooth traces [9], Global Position System (GPS) hint [10], and smart card data [11]. In the literature, we find that some researchers use these devices for land-use identification—for instance, the demonstration of GPS data for discovering a region and sensing human activity [12], urban Wi-Fi characterization [13], land-use and landscape identification using cell-phone data [14,15,16]. However, these models concentrate on a particular region in a specific area, the lack of information from this data [17] and difficult to identify the user's footprint.
To overcome these research challenges, some scientists use location-based-on-social-network (LBSN) data to capture people’s travel behavior as an alternative approach. These data contain information on their interests, hobbies, and place activities. Recently, the data source of social media’s geolocation has provided new information in terms of understanding an individual’s activity pattern. In the literature, we found that some researchers discuss social media—that is, foursquare check-in data—to catch people’s social events distribution, such as by investigating human travel activity patterns [18], inferring individual lifestyle patterns [19], and predicting the next venue [20]. Additionally, many researchers have used Twitter’s check-in data to capture the individual’s activity in the urban area, such as in home-location identification [21], and to estimate the user’s location [22,23].
On the basis of the above description, the information on the people visiting a particular place will be pertinent to form a new area. In the perspective of urban planning, geolocation becomes an indicator to identify a specific urban area. In this paper, we analyze social media data from Twitter for detecting the dynamics of urban land use. The data includes the period (time-stamped), the user’s status text or post information (tweet), and the geolocation or specific location that is the point of interest where and when people undergo check-in activity. To analyze the data, we propose a grid-based aggregation method and text mining to split the Twitter land map. The proposed method uses a grid to divide the urban area and text-mining activity to count popular keywords among different categories. We compare two distinct methods: a rank method and k-means clustering to classify different areas. To validate the analysis, we combine the individual’s travel time spread on weekdays and weekends as the parameters to define the land-use.
2. Related Work
Various studies has been conducted to describe urban structure. For example, a study [24] used large-scale taxicab data to characterize the urban dynamics in New York City on the basis of three aspects. First, they checked the urban activity pattern by aggregating pick-up and drop-off locations using trip dynamics. Second, they analyzed similar taxi travel patterns. Third, they explored the connection between the taxi trips and people’s mobility. They used a clustering algorithm to classify the trip origin and the destination data. They concluded that there is a tendency for taxi travel to represent human mobility. With other datasets, another study [25] presented GPS trajectory data to discover the region of different cities: New York, Tokyo, and Paris. They analyzed the individual’s movement using the probability model to categorize the point of interest (POI). As a result, they created a framework that could produce some applications for urban planning, business location, and social recommendation.
The development of social media data geolocation has provided new insights into the shape of a city. From the literature review, the authors found some studies that have used location-based social media data to catch the individual’s journey pattern. For instance, a study [26] demonstrated Twitter check-in data for land-use identification in three cities: Madrid (Spain), Manhattan (USA), and London (UK). They used the spectral clustering technique to analyze the individual’s travel pattern every 20 minutes, deducing the user’s trip average on weekday and weekend activities. They concluded that Twitter geolocation is a useful data source for urban planning application and could potentially provide information for urban land use. Another study [27] explores the Flickr location tag to describe the city’s center. To deal with this issue, a kernel density method was used to estimate the number of check-ins in each area. They argued that these data did not only cover all the city activities but could also describe the city boundaries. Similarly, a study [28] presented location base social network data to identify the city’s center. Three methods were used to find an accurate location with a vital and precise boundary: local Getis-Ord (LGOG), density-based spatial clustering of applications with noise (DBSCAN), and the Girvan–Newman (GN) algorithm. They deduced that the three methods could describe the geometrically regular boundaries of a monocentric city and that the last method was suitable for polycentric cities. In the reviews, we found some weaknesses in the previous studies, such as a lack of validation, and that there is a particular bias of using only specific data sources to characterize land-use types. In general, previous studies have focused on the geolocation check-in (latitude and longitude coordinates) as the only criterion to make the measurement, where this feature is not explained in detail, as well as the name of the existing location.
In this research, our focus is not only the check-in data but also involving the Twitter text record, where we use a specific filter on the location name search. The use of both features (check-in and user text posting) has been studied by some researchers. For instance, a study [29] used Twitter data to characterize a places activity. The researchers proposed an unsupervised learning algorithm with the latent Dirichlet allocation (LDA) approach to classify geotagged Tweets. Then another study [30] used geotagged Chinese social media (Sina Weibo) to model urban land use. To define land use, both articles used one parameter, namely the time distribution pattern on weekdays and weekends. Besides the grid-based aggregation method and status update posts as additional criteria, we compare two techniques to characterize a place’s activity. We regard the comparison between these two approaches, which distinguishes our work from others’.
3. Data and Methodology
3.1. Data Collection
Twitter is an application operated by Twitter Inc. (San Francisco, CA, USA) that offers a social networking microblogging service, allowing users to post and read text-based messages of up to 140 characters, called tweets. From its members, Twitter has gathered a vast amount of personal information, such as names, genders, phone or e-mail addresses, and passwords. For data collection, we utilized the Twitter streaming application program interface (API), a Windows application that allows developers to access the user’s profile data displayed in the JavaScript Object Notation (JSON) format. Through the service, Twitter provides the data to be downloaded, such as names, locations, profile locations, descriptions, follower counts, friend counts, account creation dates, and time-zone coordinate positions (latitude and longitude) [31]. One important Twitter feature is that users can display a location map that reveals the time and place at which the status was posted or where they were. This feature becomes a key to catch the individual’s behavioral activity in urban areas. For our research, we focused on Makassar City, Indonesia. We analyzed 170,595 user check-in data records consisting of 43 days (6 weeks) of Twitter activity from 24 August to 5 October 2016.
Makassar is a city with the largest population in eastern Indonesia. The 2010 census of population registered 1.34 million residents in an area of 175.7 km2 [32]. From the data collection, we identified that Twitter users have an average age of 15–40 years, where 34% are males and 66% are females [33]. This research is essential, as the land-use map of Makassar City is not up-to-date, while the current design for projection is 20 years ahead [34]
3.2. Text Mining for Place-Name Identification
The main purpose of text mining is to support the process of knowledge discovery on large document collection. In principle, text mining is a science field that involves information retrieval, text analysis, natural language processing, and a logic-based learning machine [35]. In this regard, text mining specifies the places at which the individuals make the tweets. Through this service, the check-in locations are grouped using the clustering method, and the place-names are individually identified from the user’s status post on Twitter marked with the symbols # and @ to define the place-name (e.g., “eating at #thexxxrestaurant” and “playing soccer at @theyyystadium”). Because of this, the Twitter application does not insert the location name on the APIs’ search engines but includes the geographic location in the form of latitude and longitude coordinates. We use a Voyan tool, an open-source web-based application used to discover most frequently used words, to analyze and count the documented texts and to ease text separation.
Figure 1 shows the data flow and methods proposed for urban land-use identification, where two data-grouping methods are compared. To conclude the land hypothesis, we used the daily time distribution on weekdays and weekends activities.
3.3. Aggregation Grid for Dividing Land Area
In a Twitter dataset, check-ins are separate; thus the issue arises of how to unite their spreads in one or several information units. We propose a grid-based aggregation method to identify each area for detecting urban land use, a technique to combine distinct objects into different groups. Figure 2 shows the 16 × 6.5 km2 tweet distribution map of Makassar City.
To facilitate the analysis, we divided the grid into 500 × 500 m2 areas and produced 558 blocks. We then removed the blocks without check-in activity. A total of 160 blocks were removed, and 398 blocks with tweet activity were used. The figure below illustrates the spread of twitter check-ins. The dots represent the locations, and the block gradations indicate the frequency of each block.
To recognize the place type on each block, we used the user’s text-posting activity on Twitter. A total of 85 venues were found from the whole blocks. We then divided the area into six categories (Table 1). From this result, we could see the description about the information of the land.
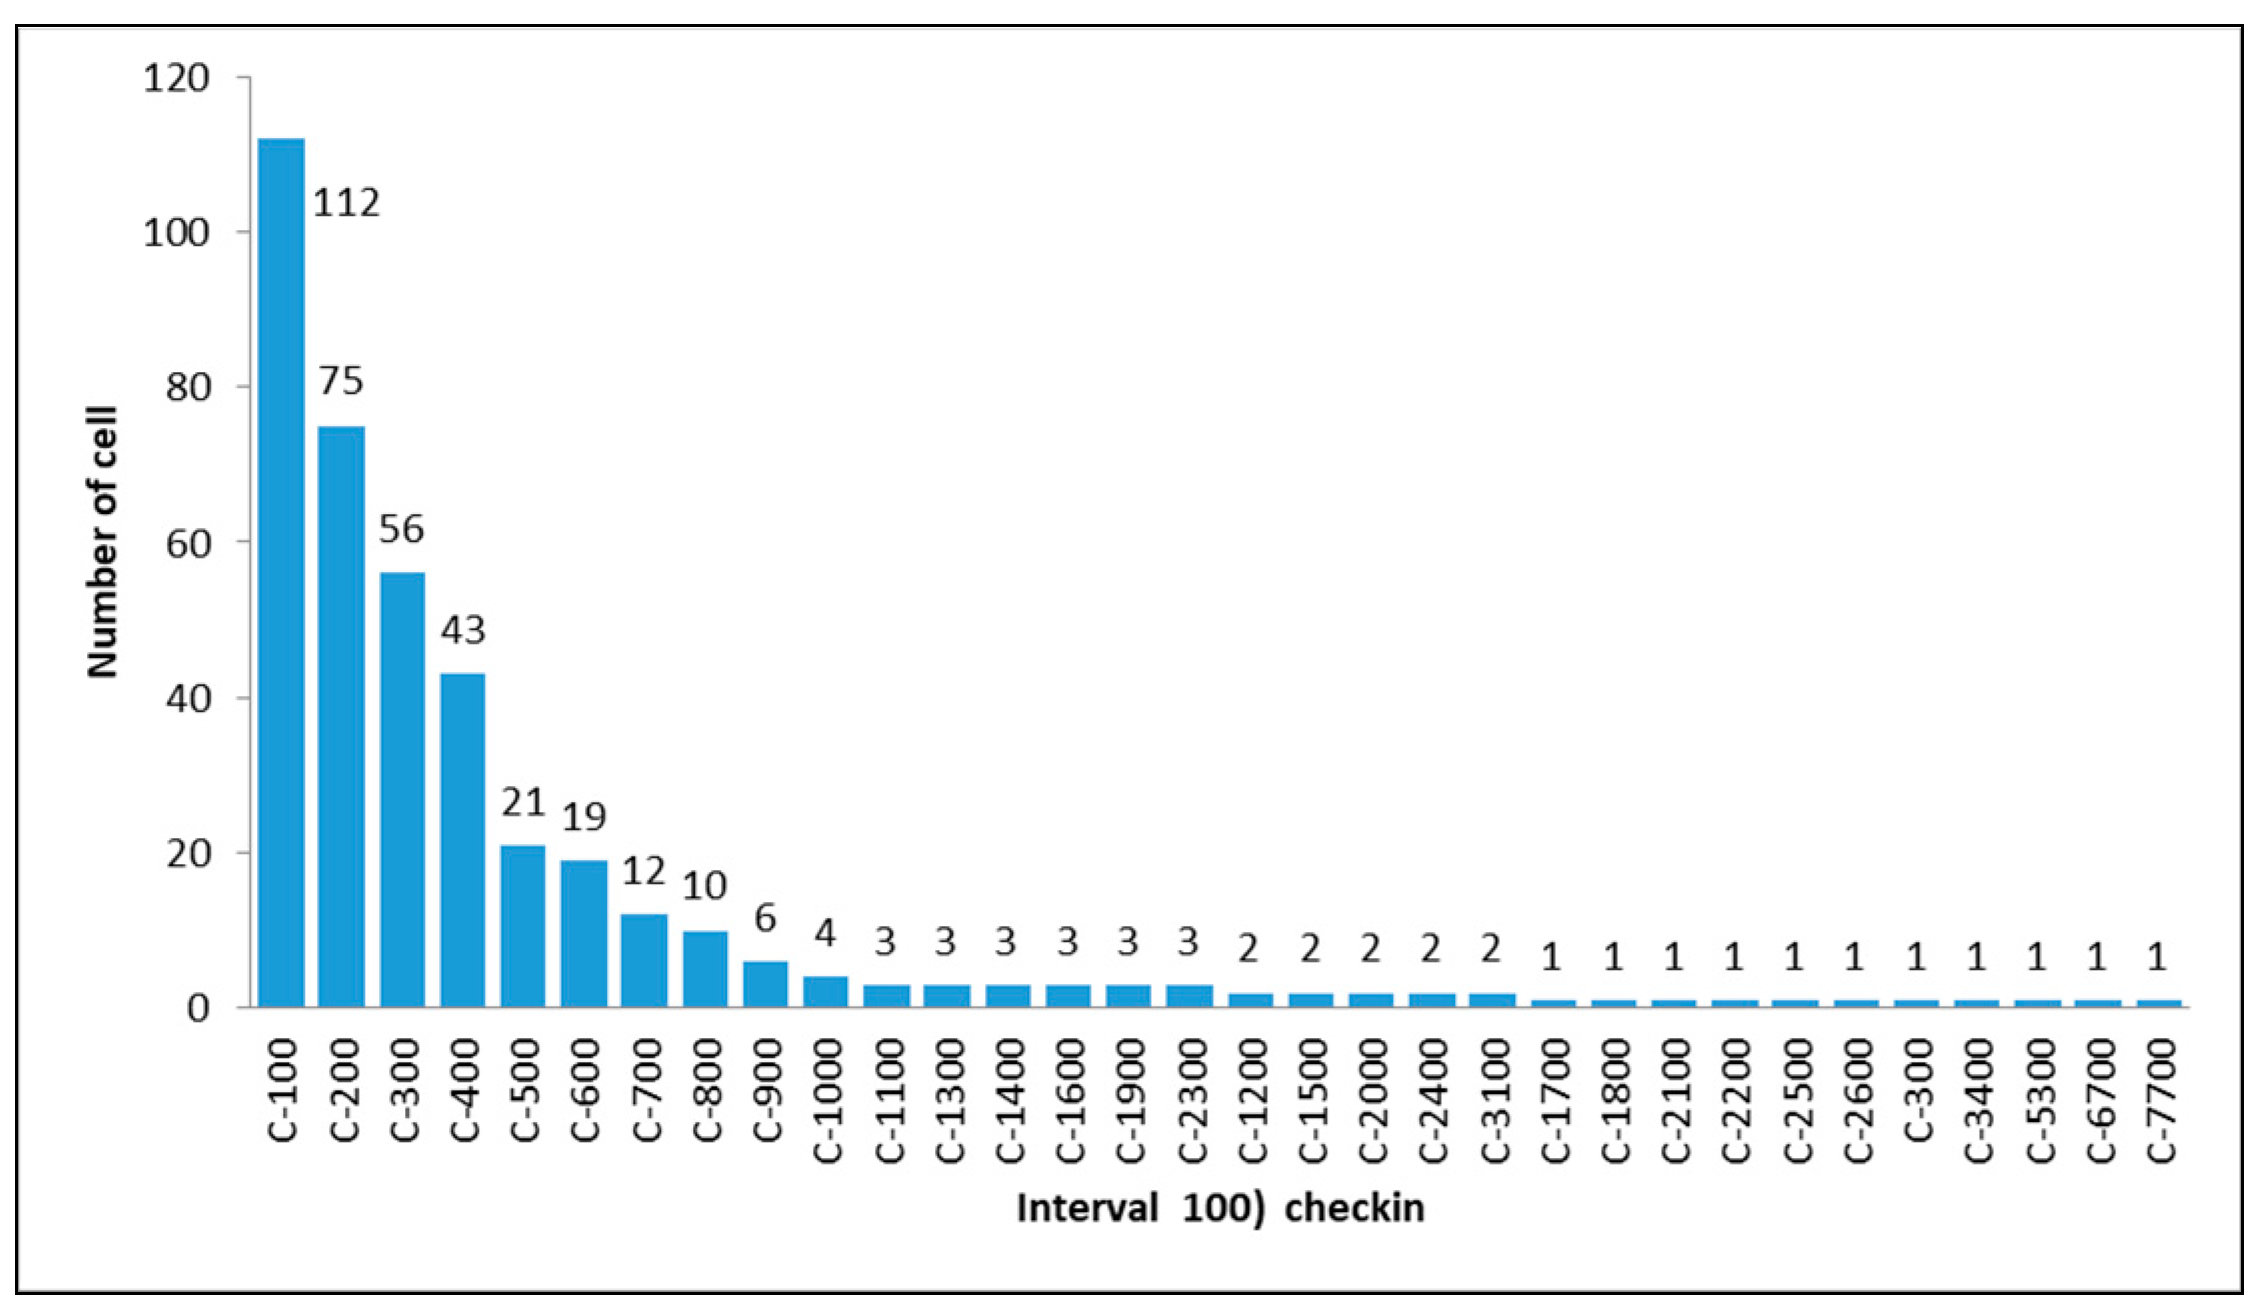
To calculate the number of check-ins on each block, we grouped each block into 32 classes with an interval of 100 check-ins. The grouping provided a description of the frequency of data diversity. Figure 3 shows the graph of block allocation based on each class (e.g., the class C100 contains 112 blocks).
3.4. K-means Clustering for Land-Use Characterizing
Clustering is a method to group objects into classes with identical characteristics [36]. The k-means clustering is one algorithm of unsupervised learning that uses a nearest mean approach. This reliable algorithm can quickly process huge amounts of data [37]. The k-means clustering attempts to group objects into two or more clusters so that the objects within one cluster share similarities. To measure the similarity among objects, k-means clustering utilizes the distance function as the parameter to determine the group members. The k-means algorithm uses the following steps:
- Decide the number of clusters (in this research, five clusters are specified).
- Determine the centroid value (center of measurement) randomly.
- Calculate the distance between the centroid points and the point of each object. To measure, we use the Euclidean distance:where De is the Euclidean distance, i is the number of the object, (x, y) are the object coordinates, and (s, t) are the centroid coordinates.
- Assign object to closest cluster.
- Go back to step 2 and recalculate the centroid value until the cluster members do not move to other clusters.
From the place activity (see Appendix A), we then grouped the data and produced five clusters. Table 2 shows the different places visited by people.
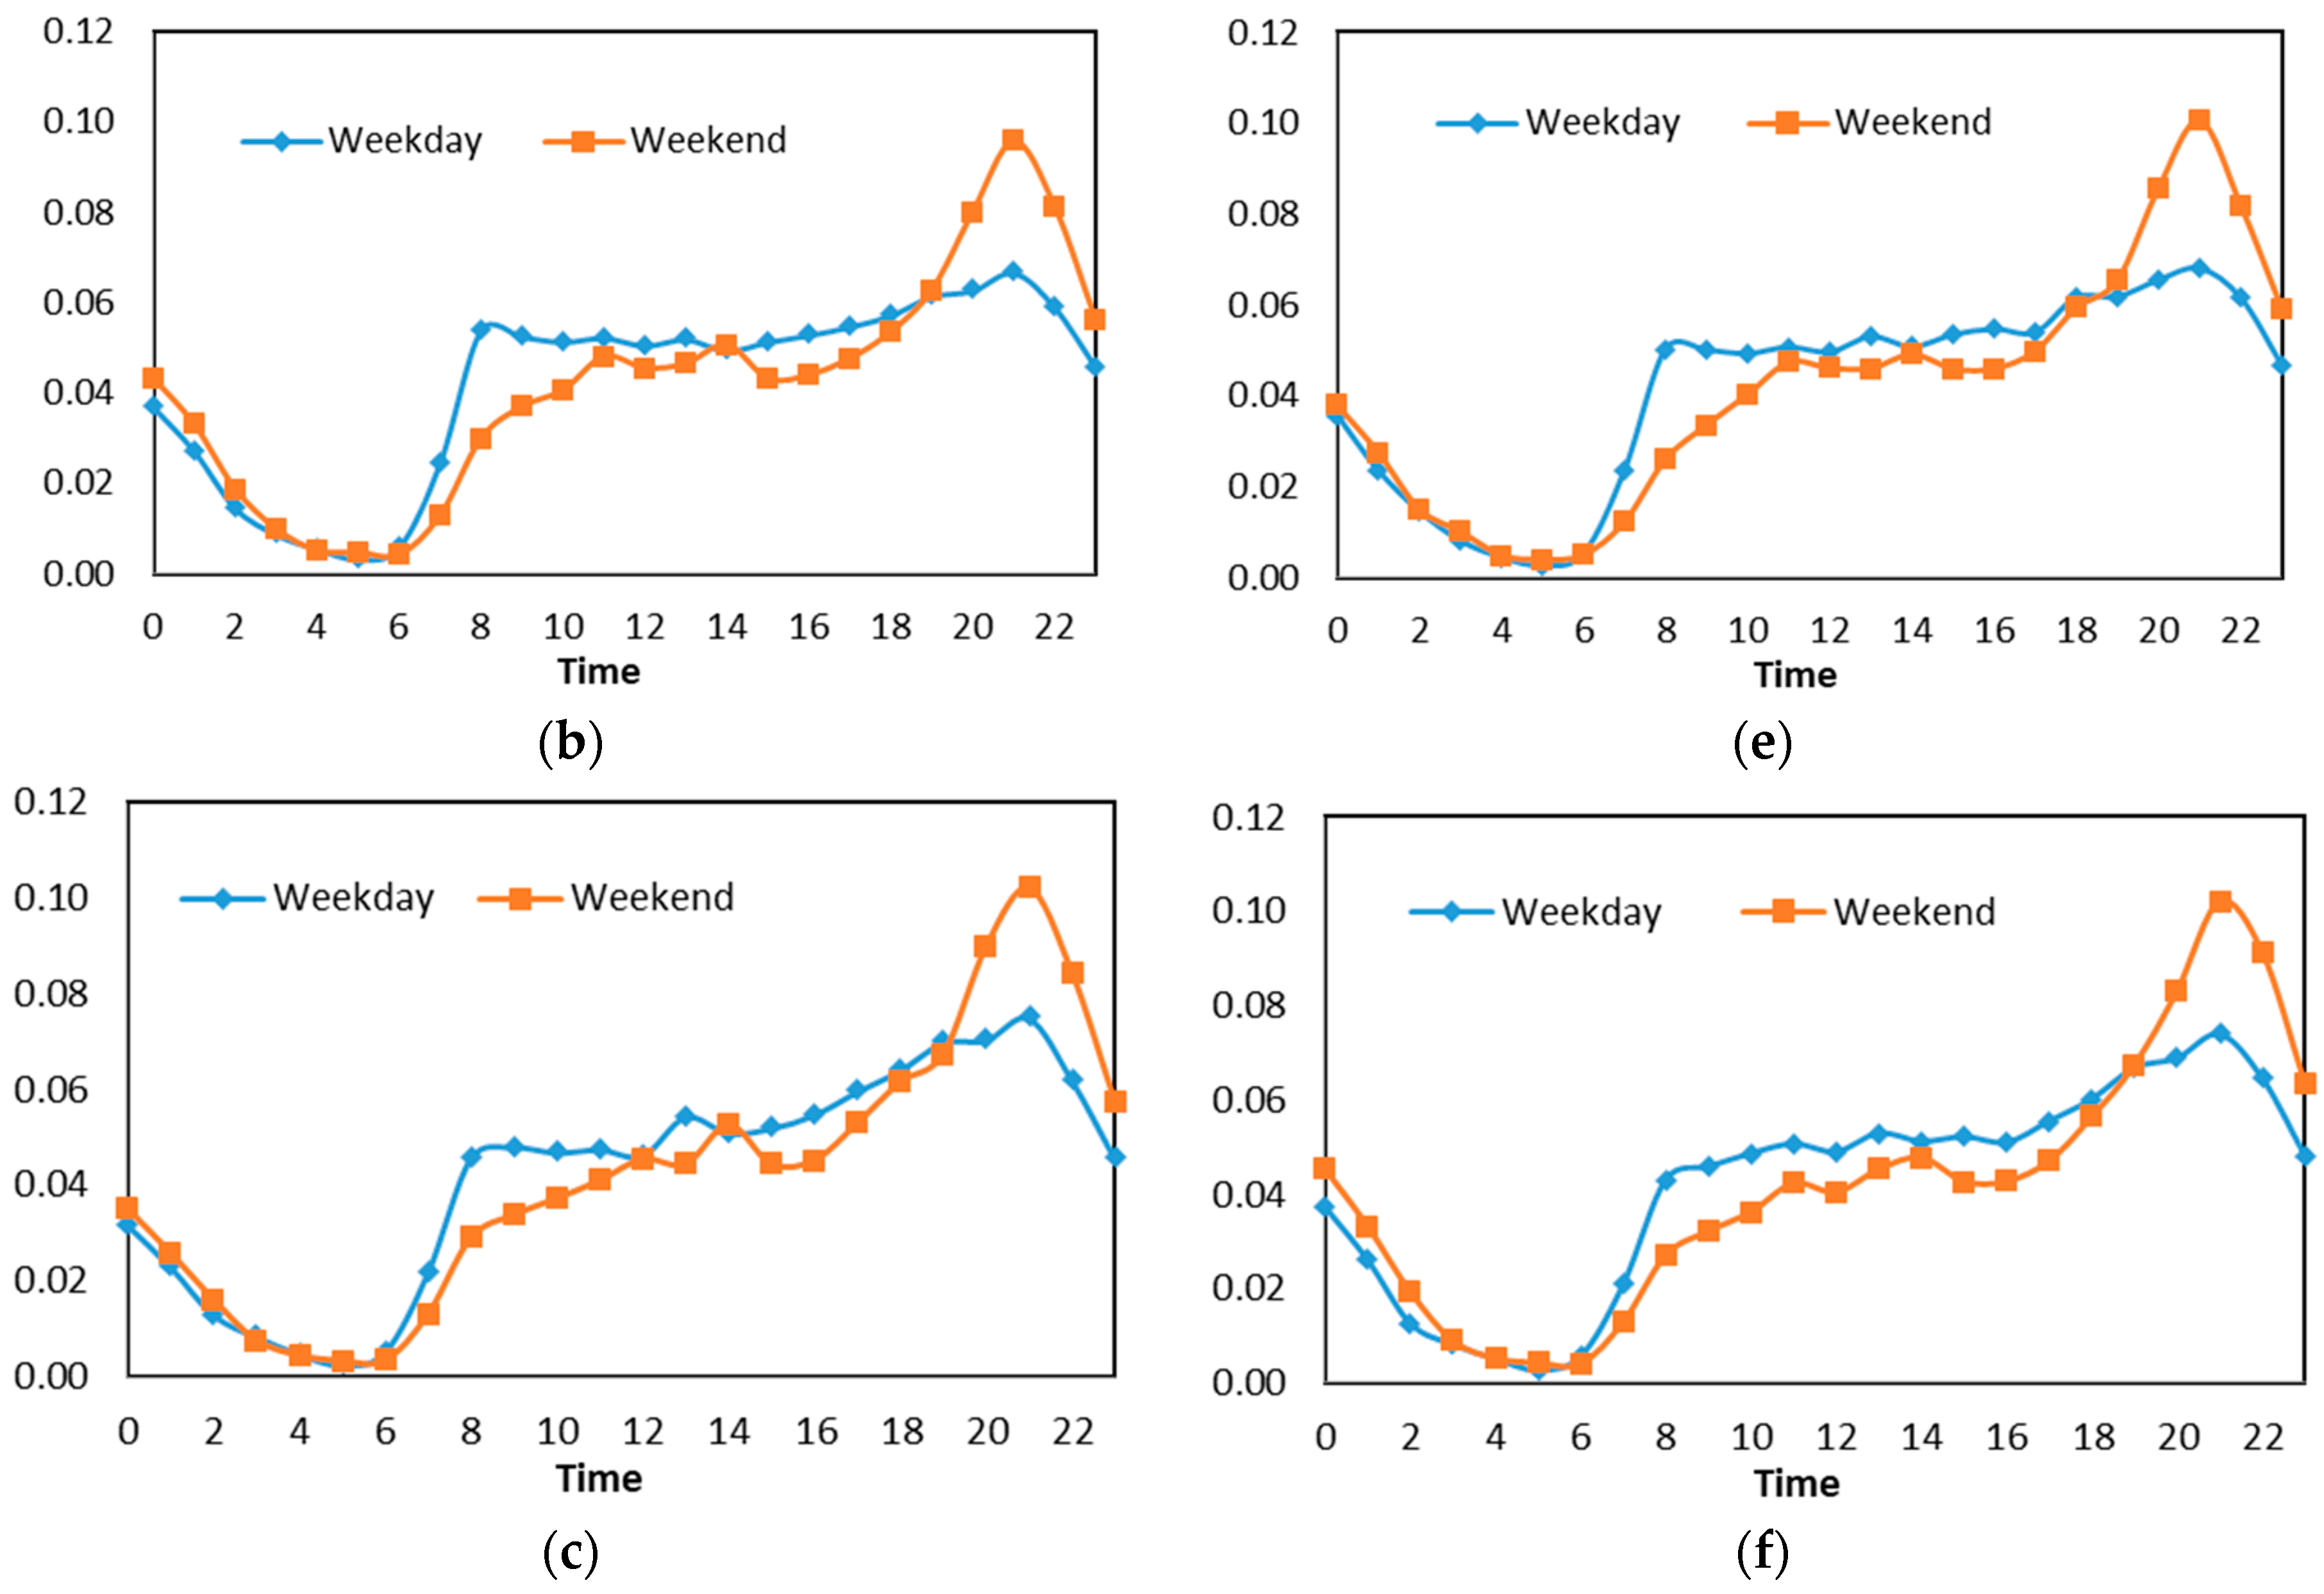
Figure 4 shows the time distribution pattern on weekdays and weekends from k-means clustering. To analyze the land use type, the method will be compared with the group result from the ranking method to determine the potential land use.
4. Land-Use Segmentation
We tried a method of grid-based aggregation to divide the urban area. After class grouping (see Table 3), we then characterized each region to understand the type of land use. To identify the land area, we grouped the check-in activity blocks on the basis of the following:
- We determined the frequency of places visited by comparing the percentage data of each block. We then combined the blocks into several classes and grouped the classes into several clusters. In this case, each cluster was decided by the place with the highest frequency as a decision-making indicator. For example, on the basis of tweets, we found that classes C100, C200, C300, and C400 were dominated by the individual’s activities in residential areas (see Table A1). Thus, the combination of these classes was called cluster 1.
- To identify the land-use type, we ranked every place on each cluster to determine the most visited venue (see Table 4).
- We then analyzed the time distribution frequency on each class to determine the trends of each region by comparing weekday and weekend check-in patterns. In doing so, the identification of land use could be detected.
On the basis of the above criteria, we classified the class interval (see Table 3) into four clusters. The clusters illustration can be seen in the following table:
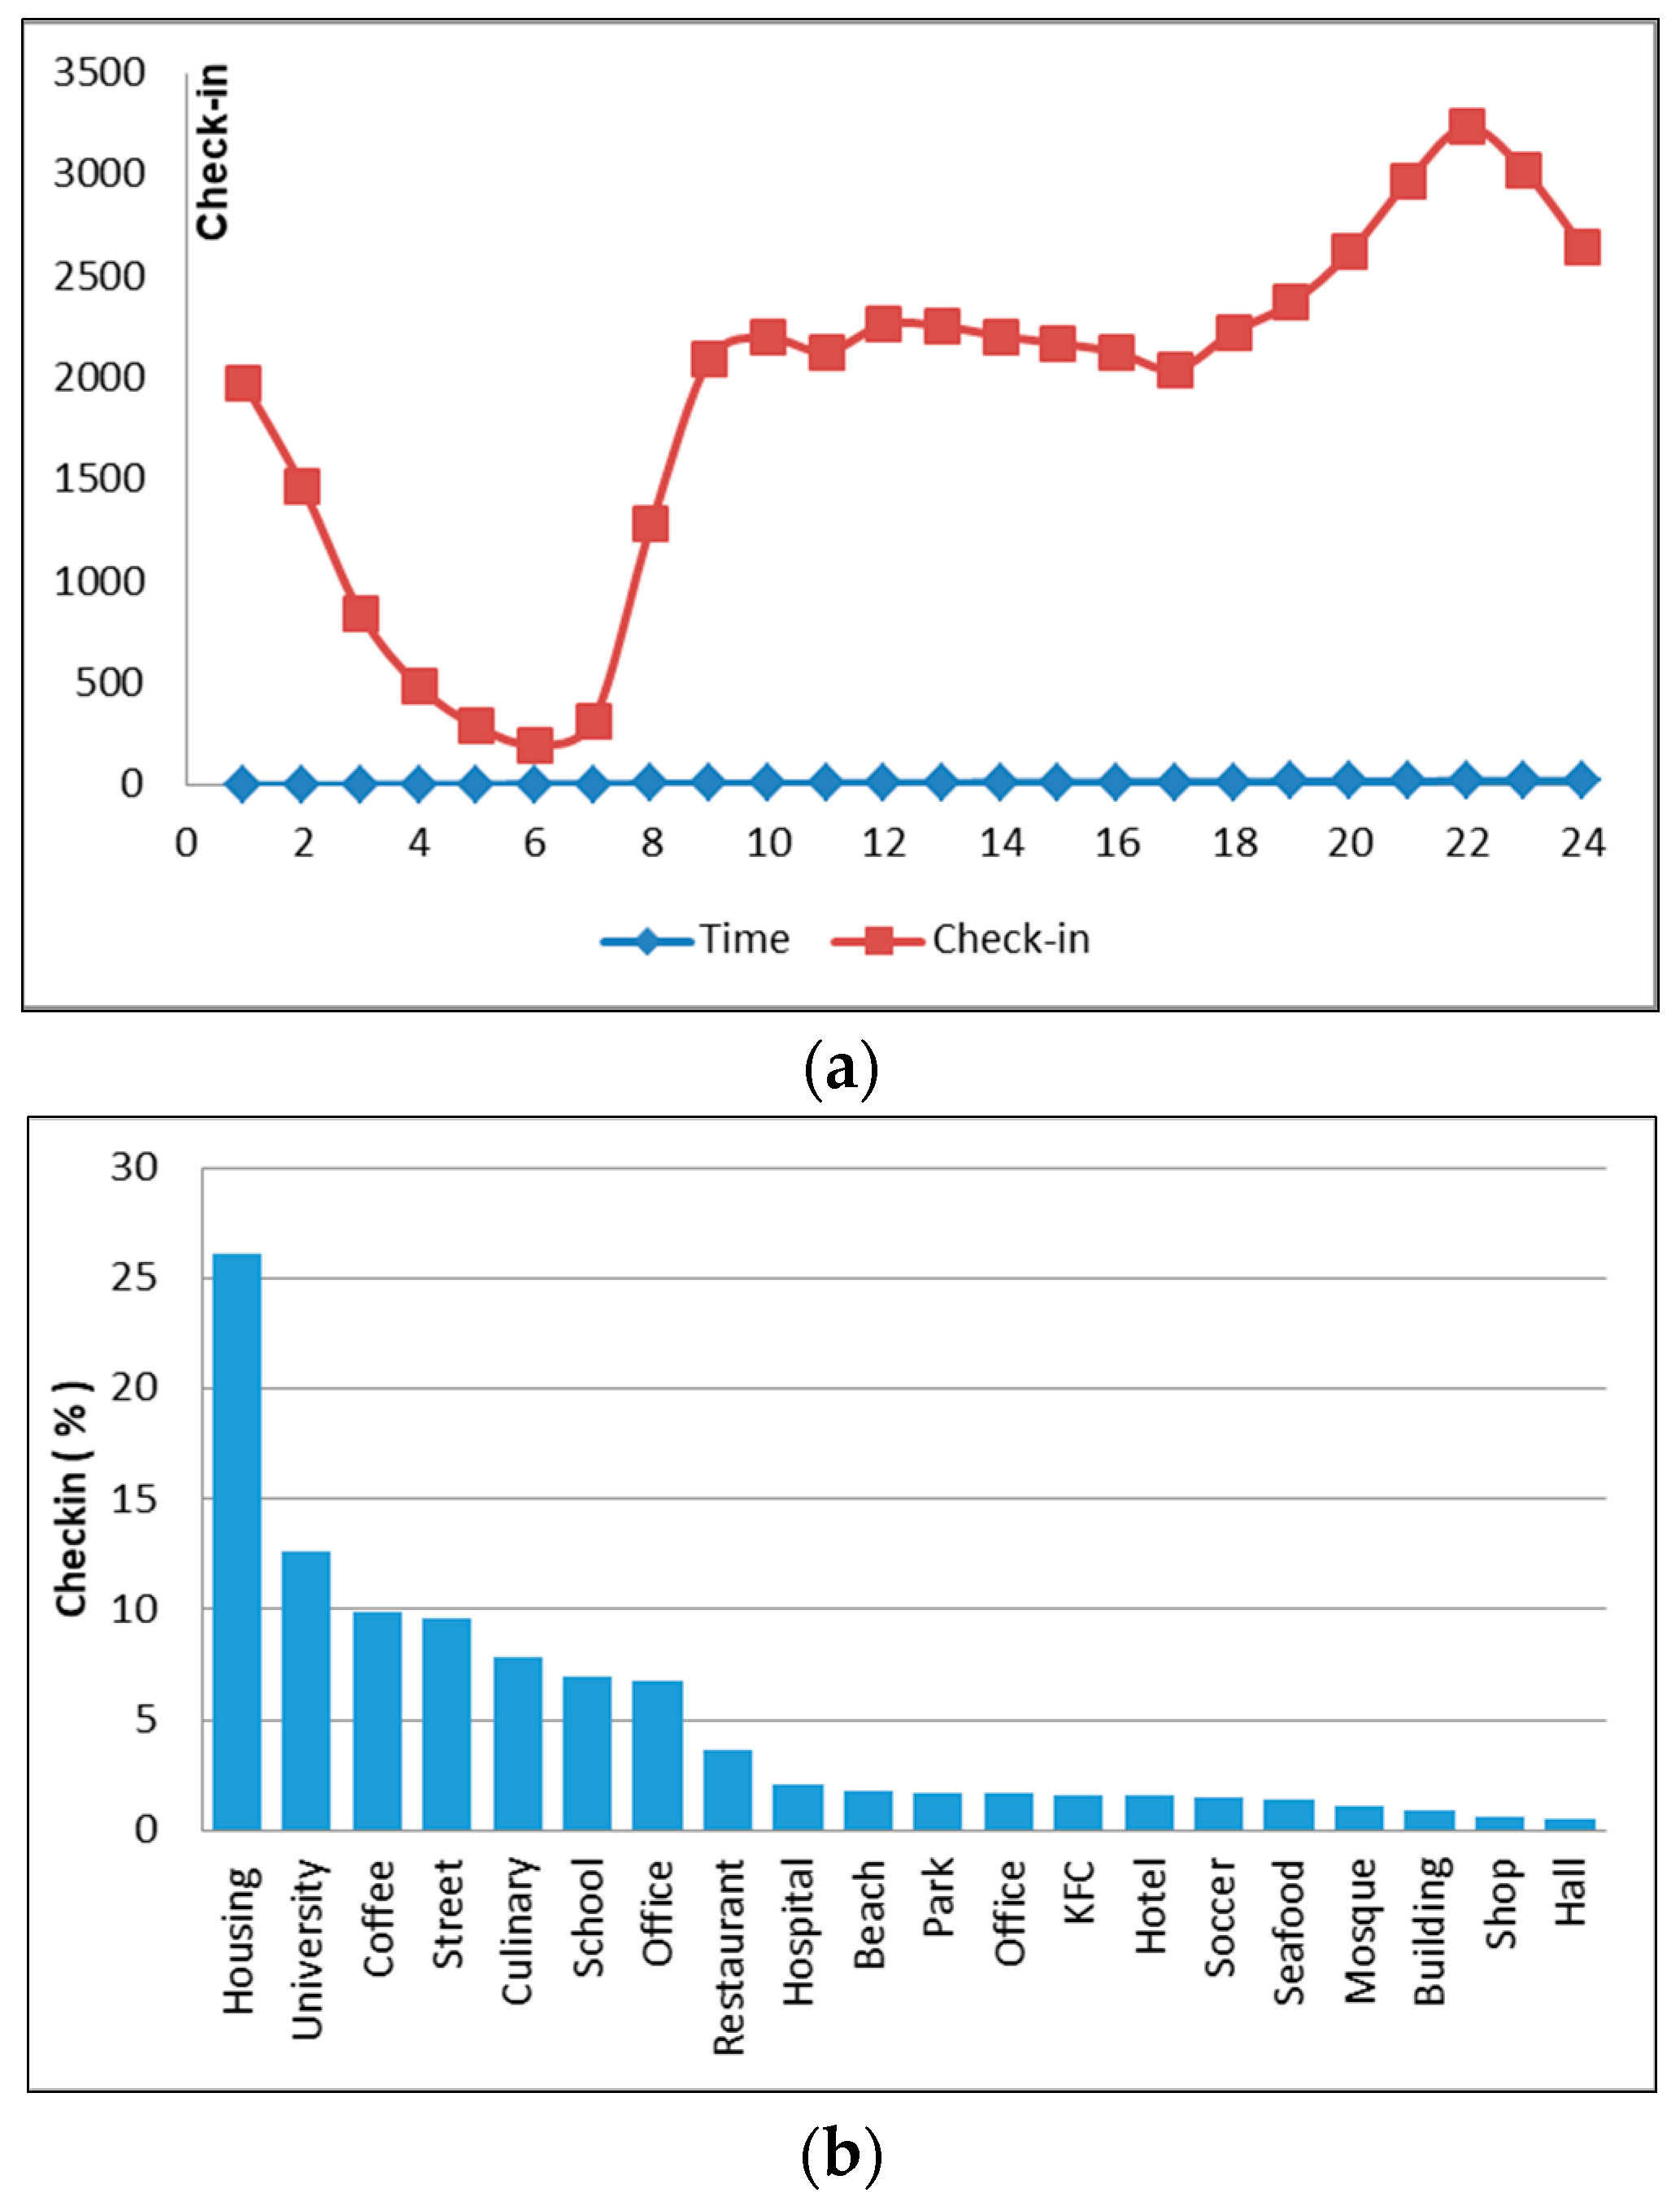
Figure 5a illustrates the user’s daily frequency times. We observe that the peak of individual activity occurs at 10 p.m. and the lowest check-in activity at 6 a.m. On Figure 5b, we see that majority of user frequency is between 20 up to 100 check-ins.
From the 85 places (see Table 1), we then identified the venue type and found 31 places with significant check-ins. Table 4 depicts the spatial distribution cluster showing the check-in numbers and percentages in each place. This cluster would provide an overview of potential land use.
4.1. Housing Area (Cluster 1)
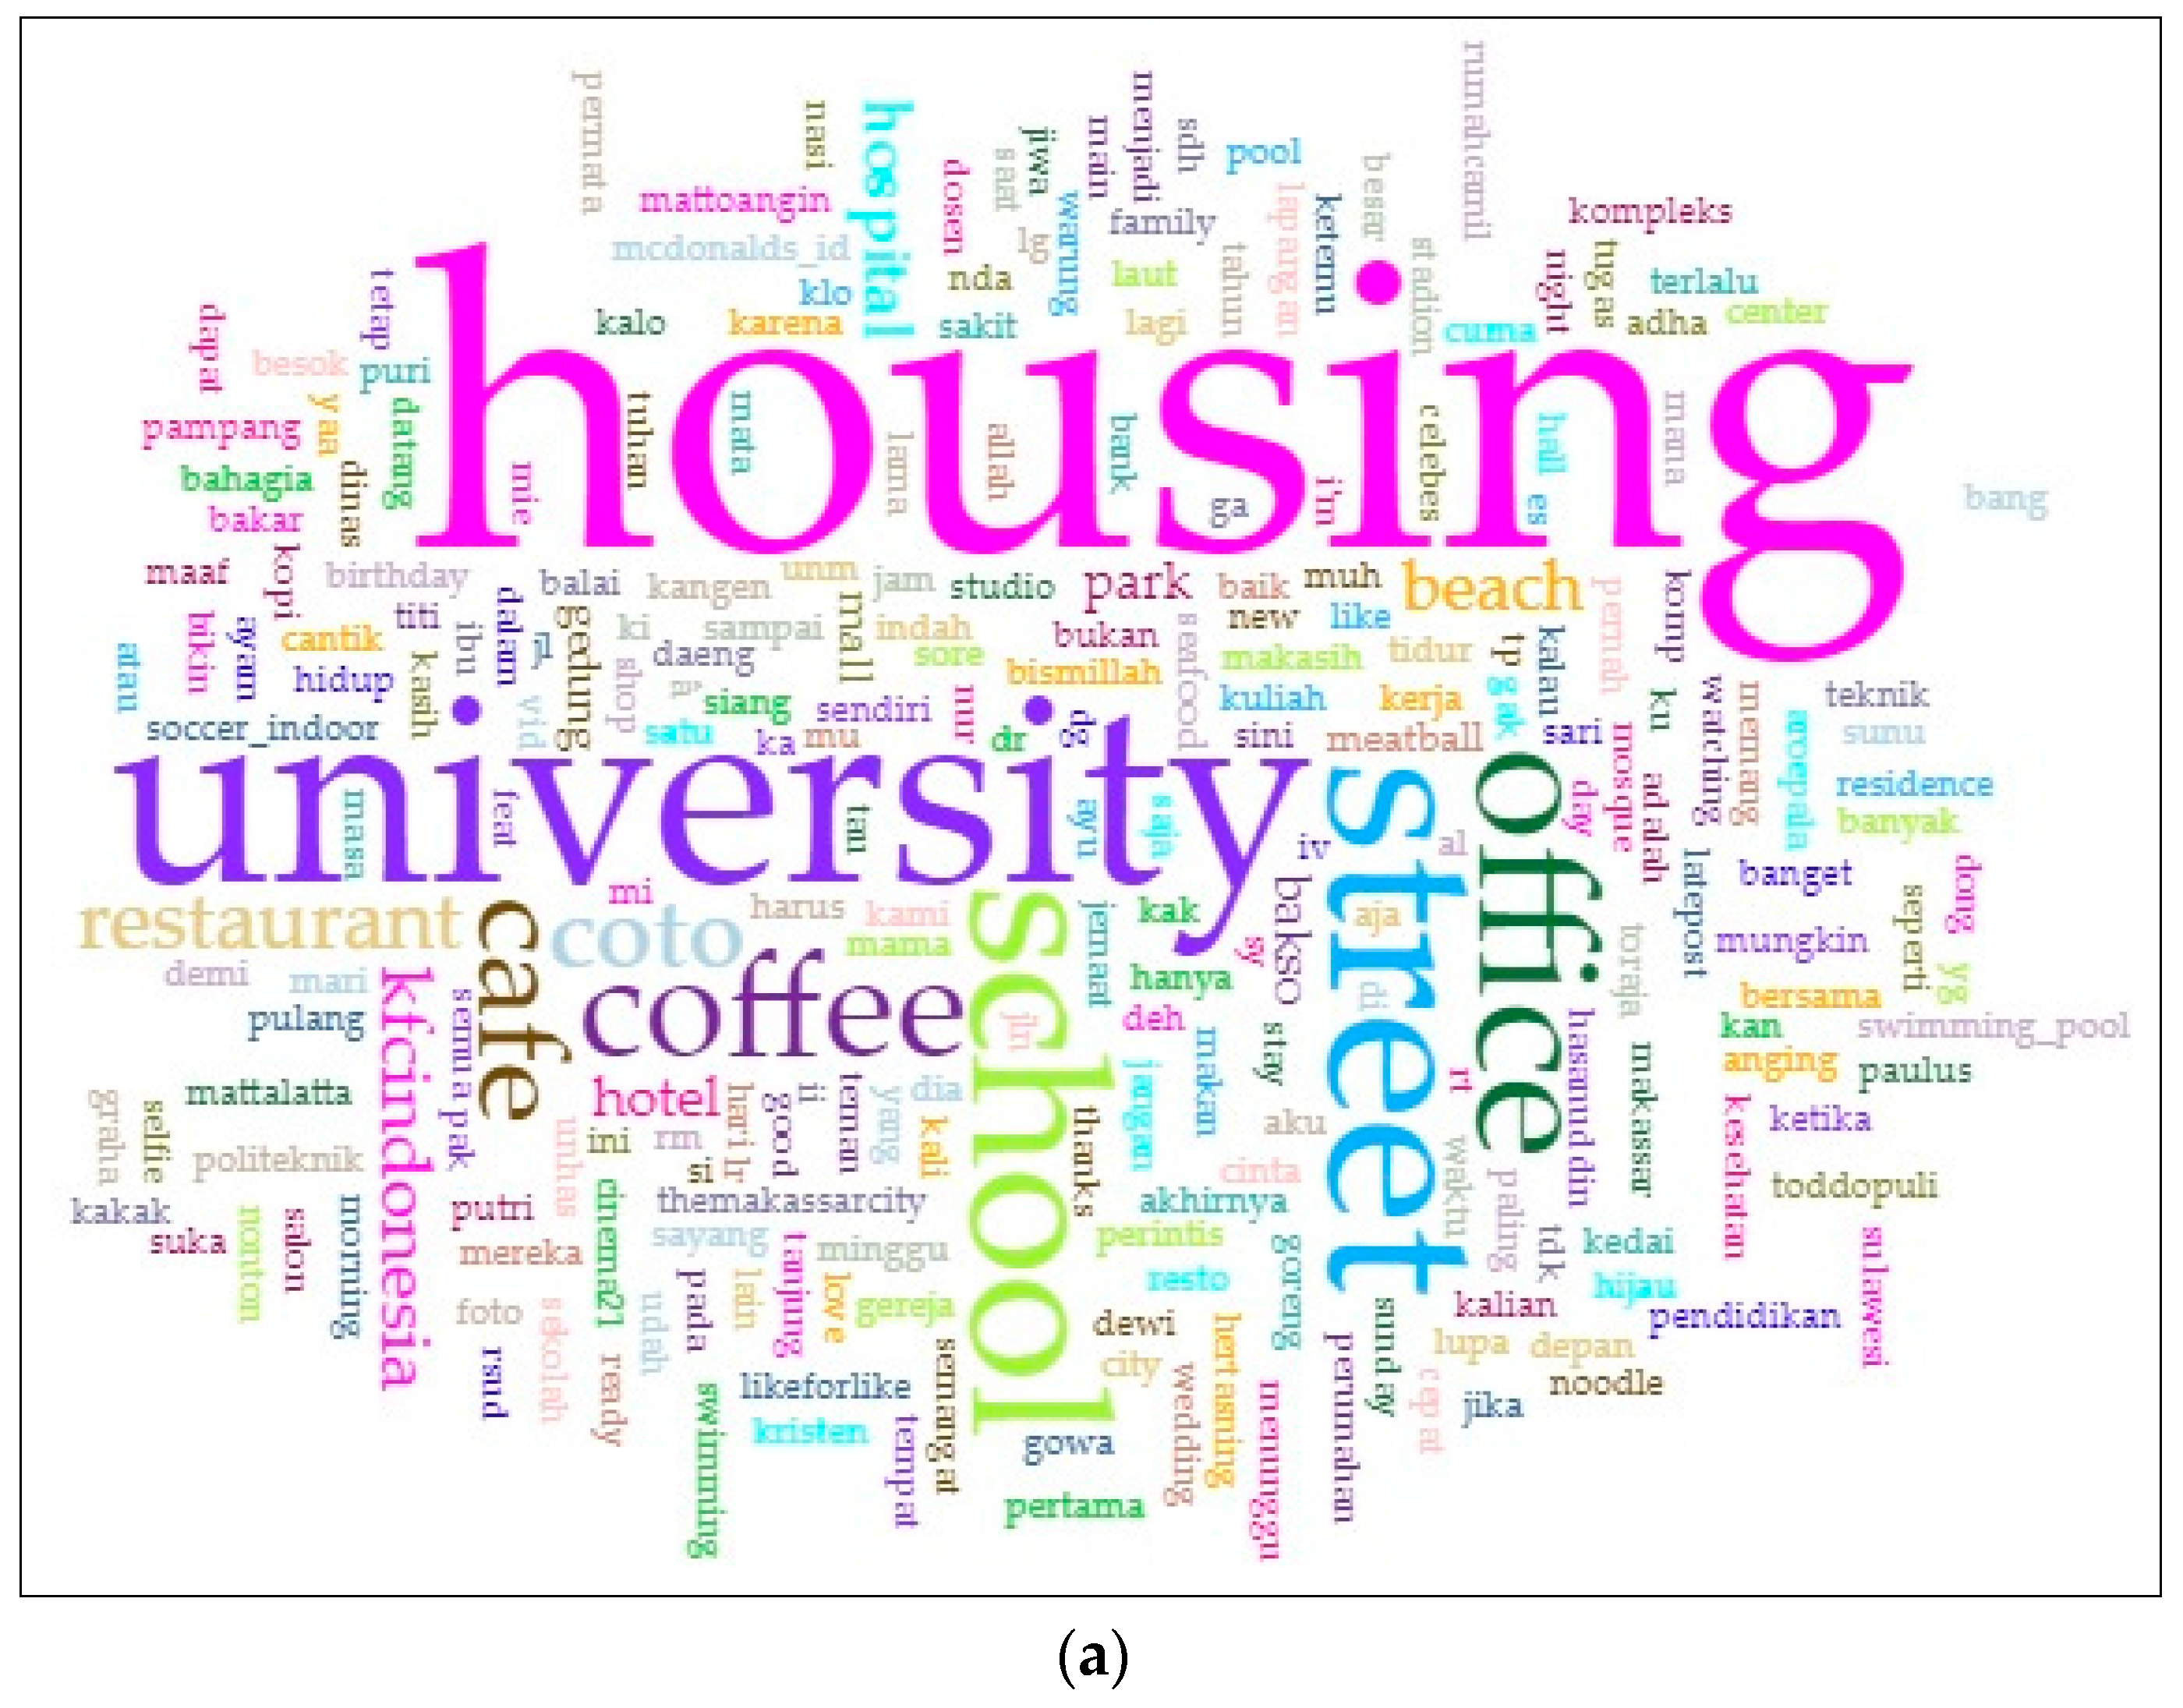
To understand the land use of this region, we compared the classes by considering the most frequently visited places. We observed that in general, the tweet activity in cluster 1 was closely related to the activities of people who were around the residential area (see Figure 6a). We found about 26% of the tweet activity covered by this group (see Figure 7b). We then analyzed the daily tweet pattern and found that the peak of tweet activity occurs at 10:00 p.m. (Figure 7a), related to the individual’s activity before bed. Meanwhile, other activities, such as being in or going to a university, a café, and others, were done during the day and peaked from 11 a.m. to noon. We observed about 70% of this area was covered by this cluster. Thus, this cluster can be associated with the housing area. If we compare this to the k-means clustering, then this group is identical with clusters 1 and 3 (see Table 2 and Figure 4). Thus we associate this area to housing.
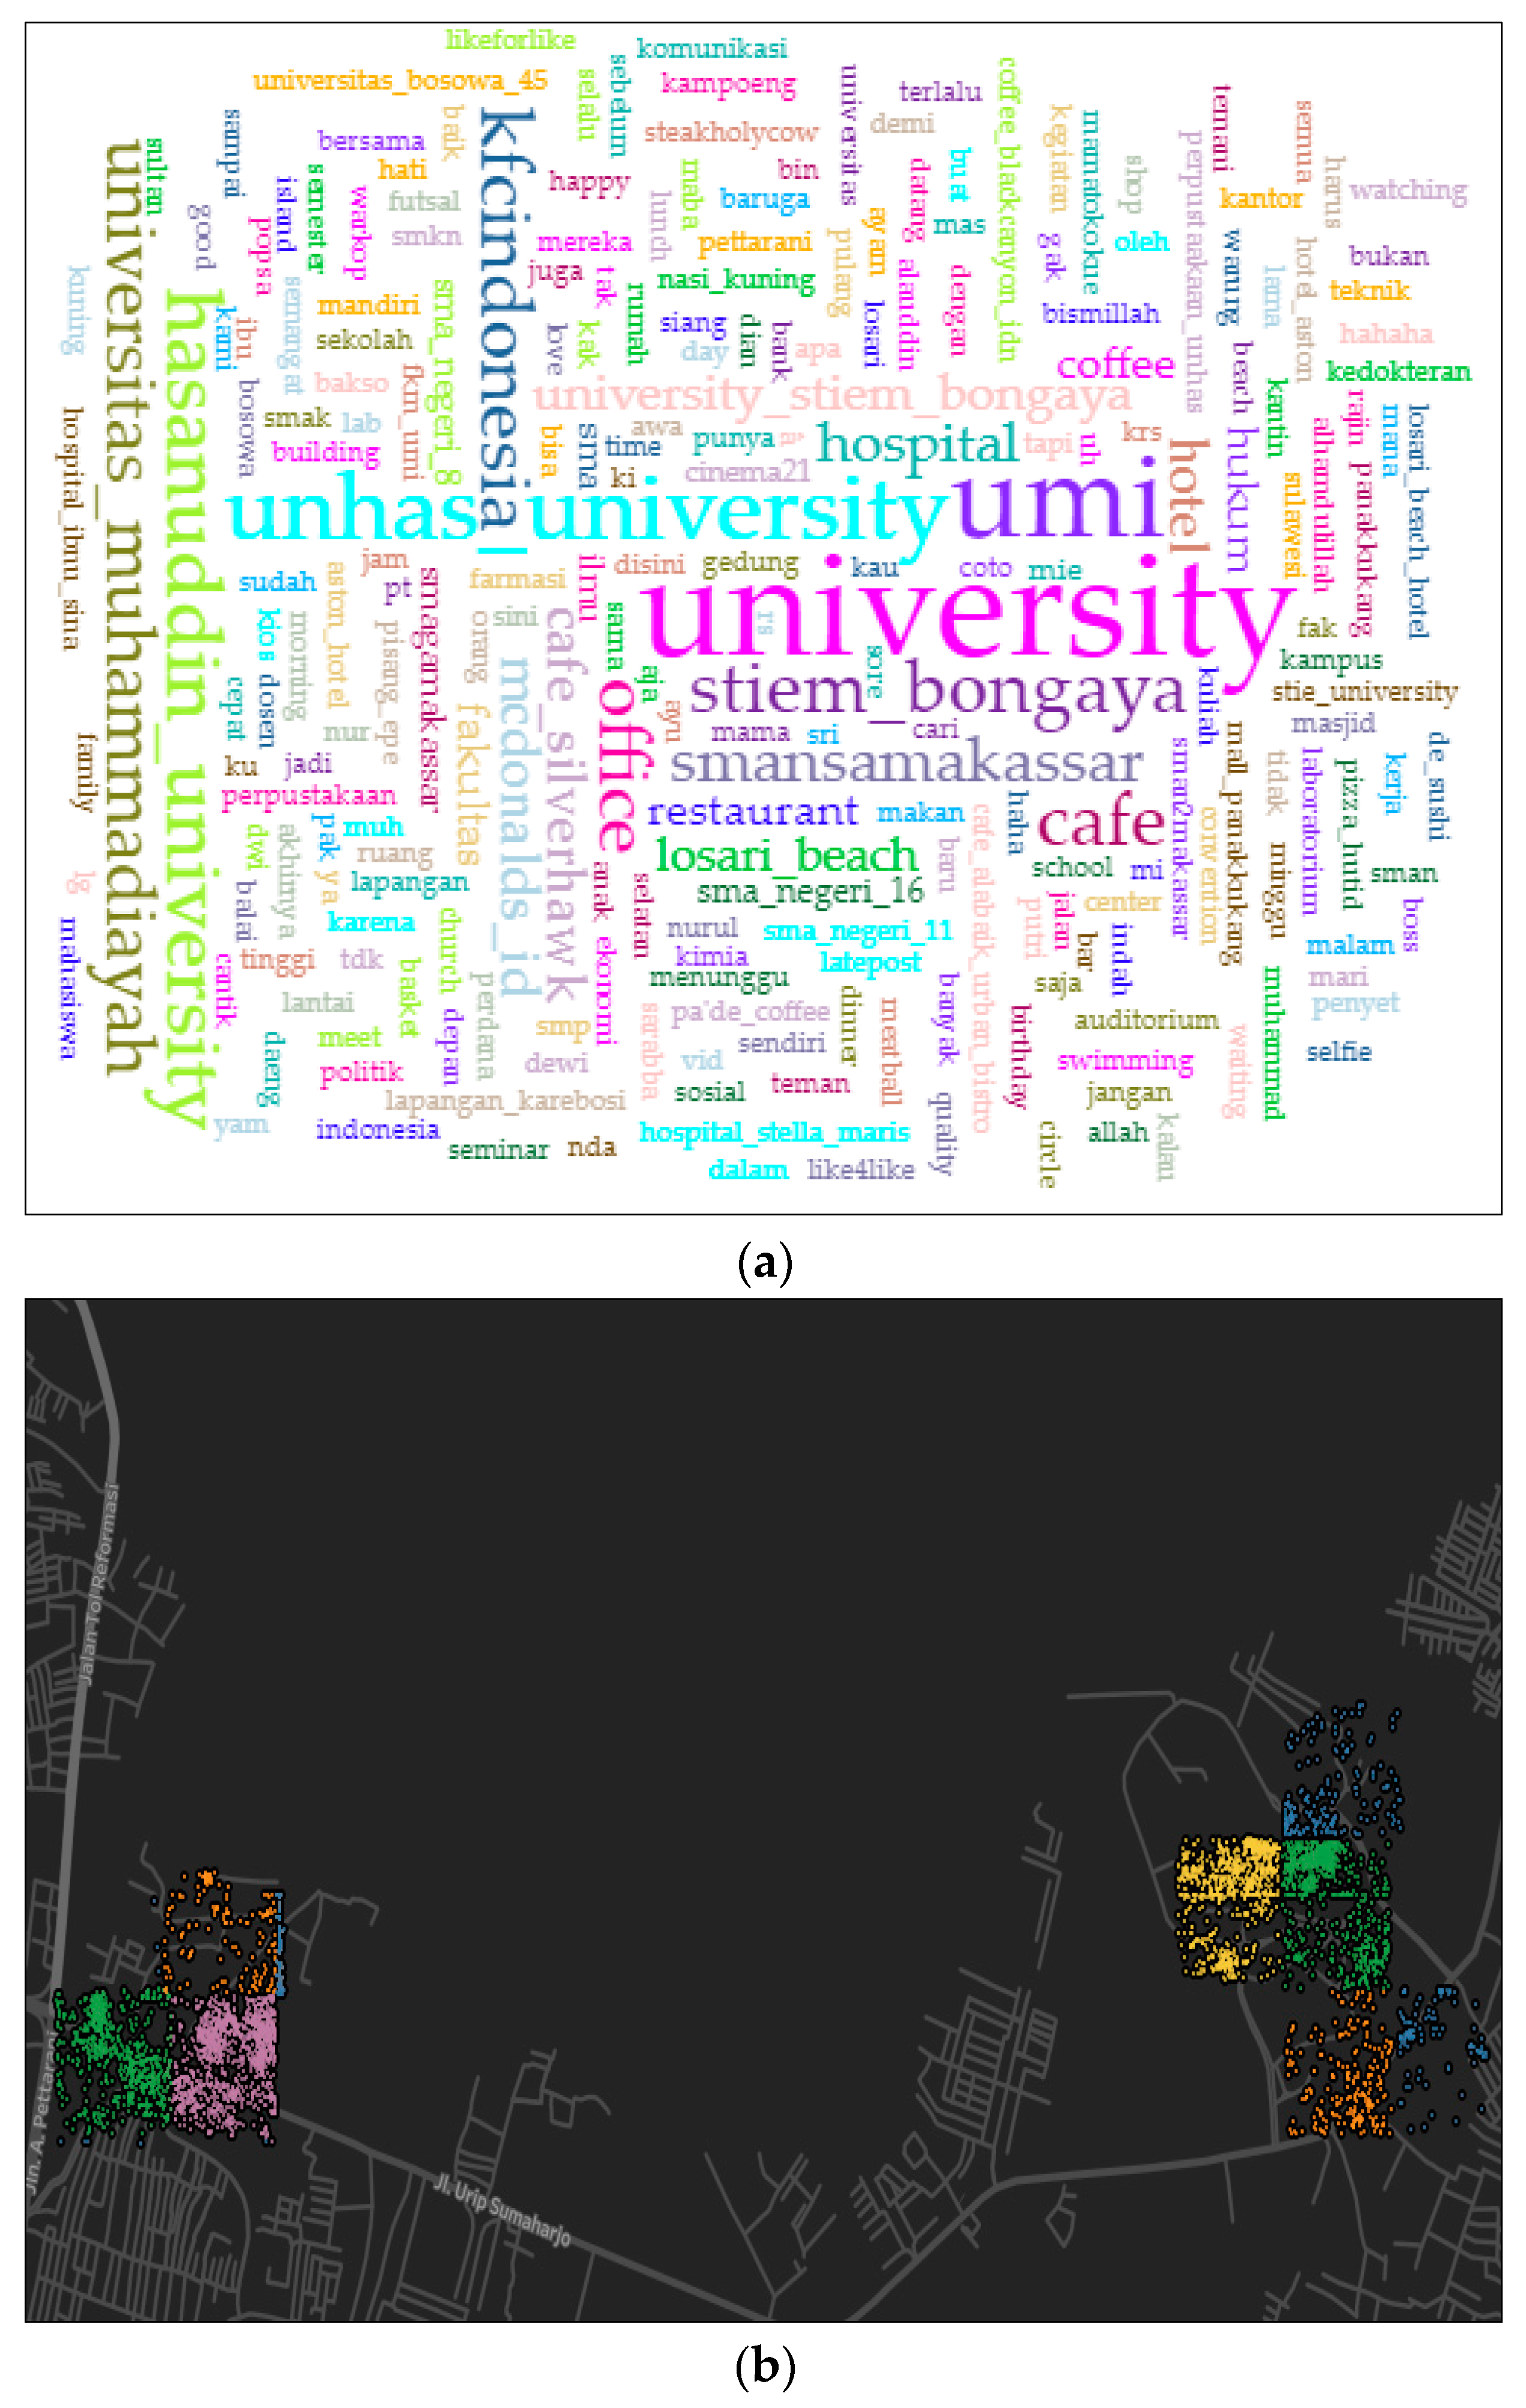
4.2. Education Area (Cluster 2)
As shown in Figure 8d, we compared the pattern of weekday and weekend activities. During weekday, tweet activity increased at 8 a.m. We observed a changing trend between 10:00 a.m. and 2:00 p.m. Then on the weekends, the peak activity was at 8:00 a.m. and 11:00 p.m. We compared the pattern of weekdays and weekends and found a very significant difference in that, on the weekends, the tweet activities decreased. This was because on weekdays, the frequency of university visits increases, while on weekends, only a handful of individuals come to the university.
In general, this cluster was more populated in places such as universities and schools. The existence of other venues such as restaurants—Pizza Hut and McDonald’s—malls, and others was because of the university and was not influenced by other regions. On the basis of this analysis, we then concluded that this cluster is related to education. This can be seen in the word frequency and graph percentage of each place (Figure 8a,c). This group is similar to clusters 2 and 5 (see Table 2 and Figure 4) from the k-means result. If we observe the difference between Figure 4c,f, we find that there are contrasting activities during weekdays and weekends, except for during night.
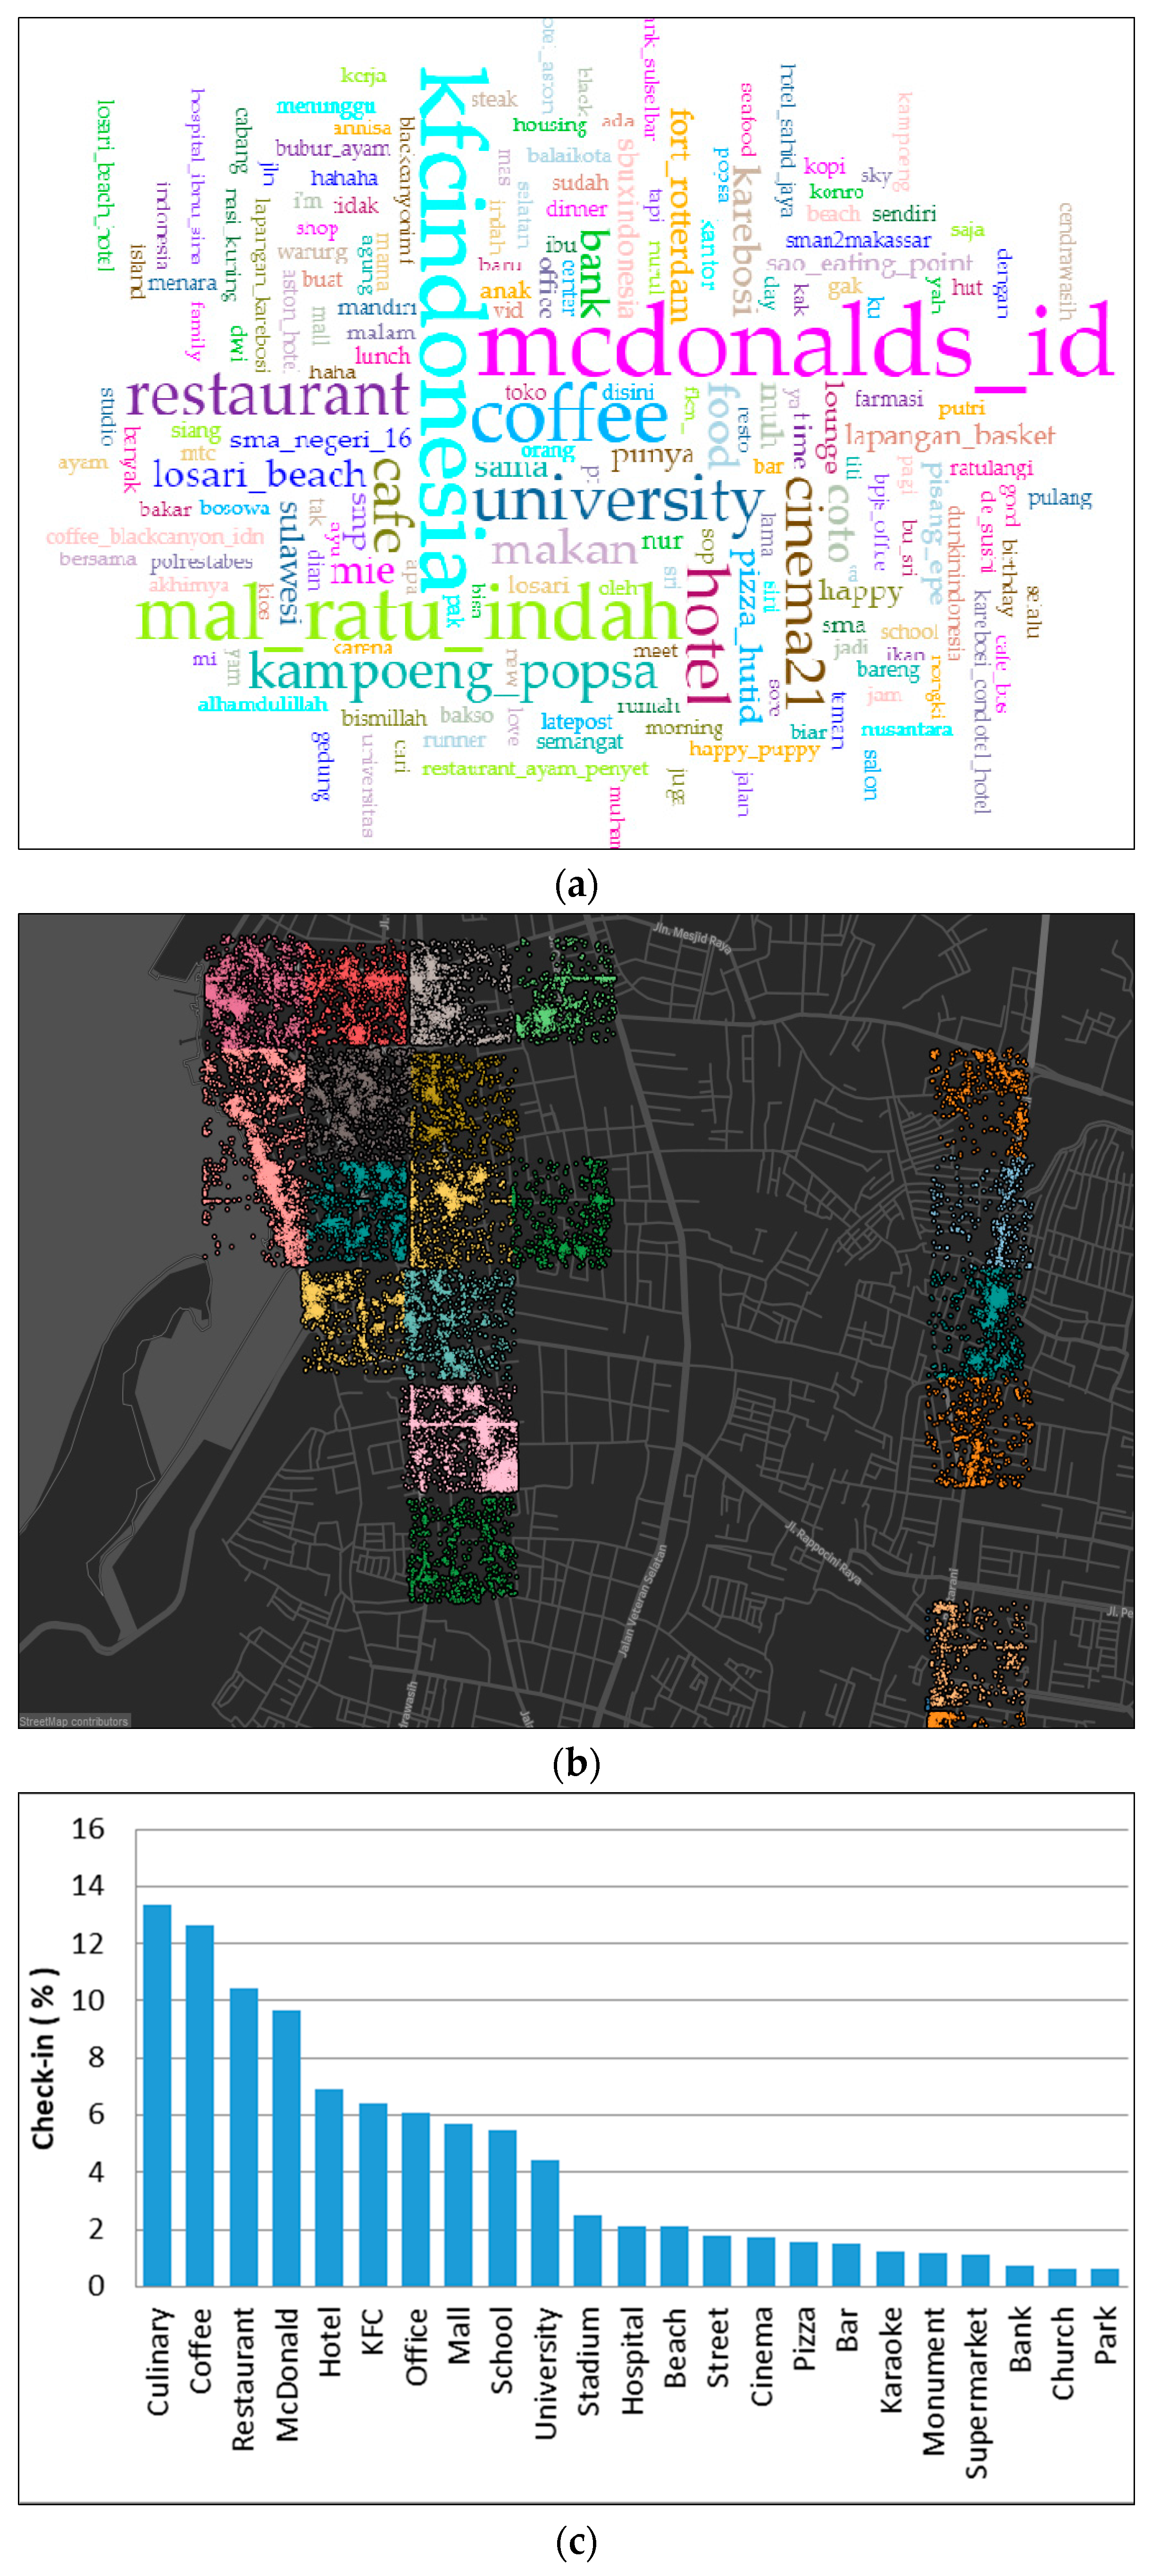
4.3. Commercial, Business, and Work Area (Cluster 3)
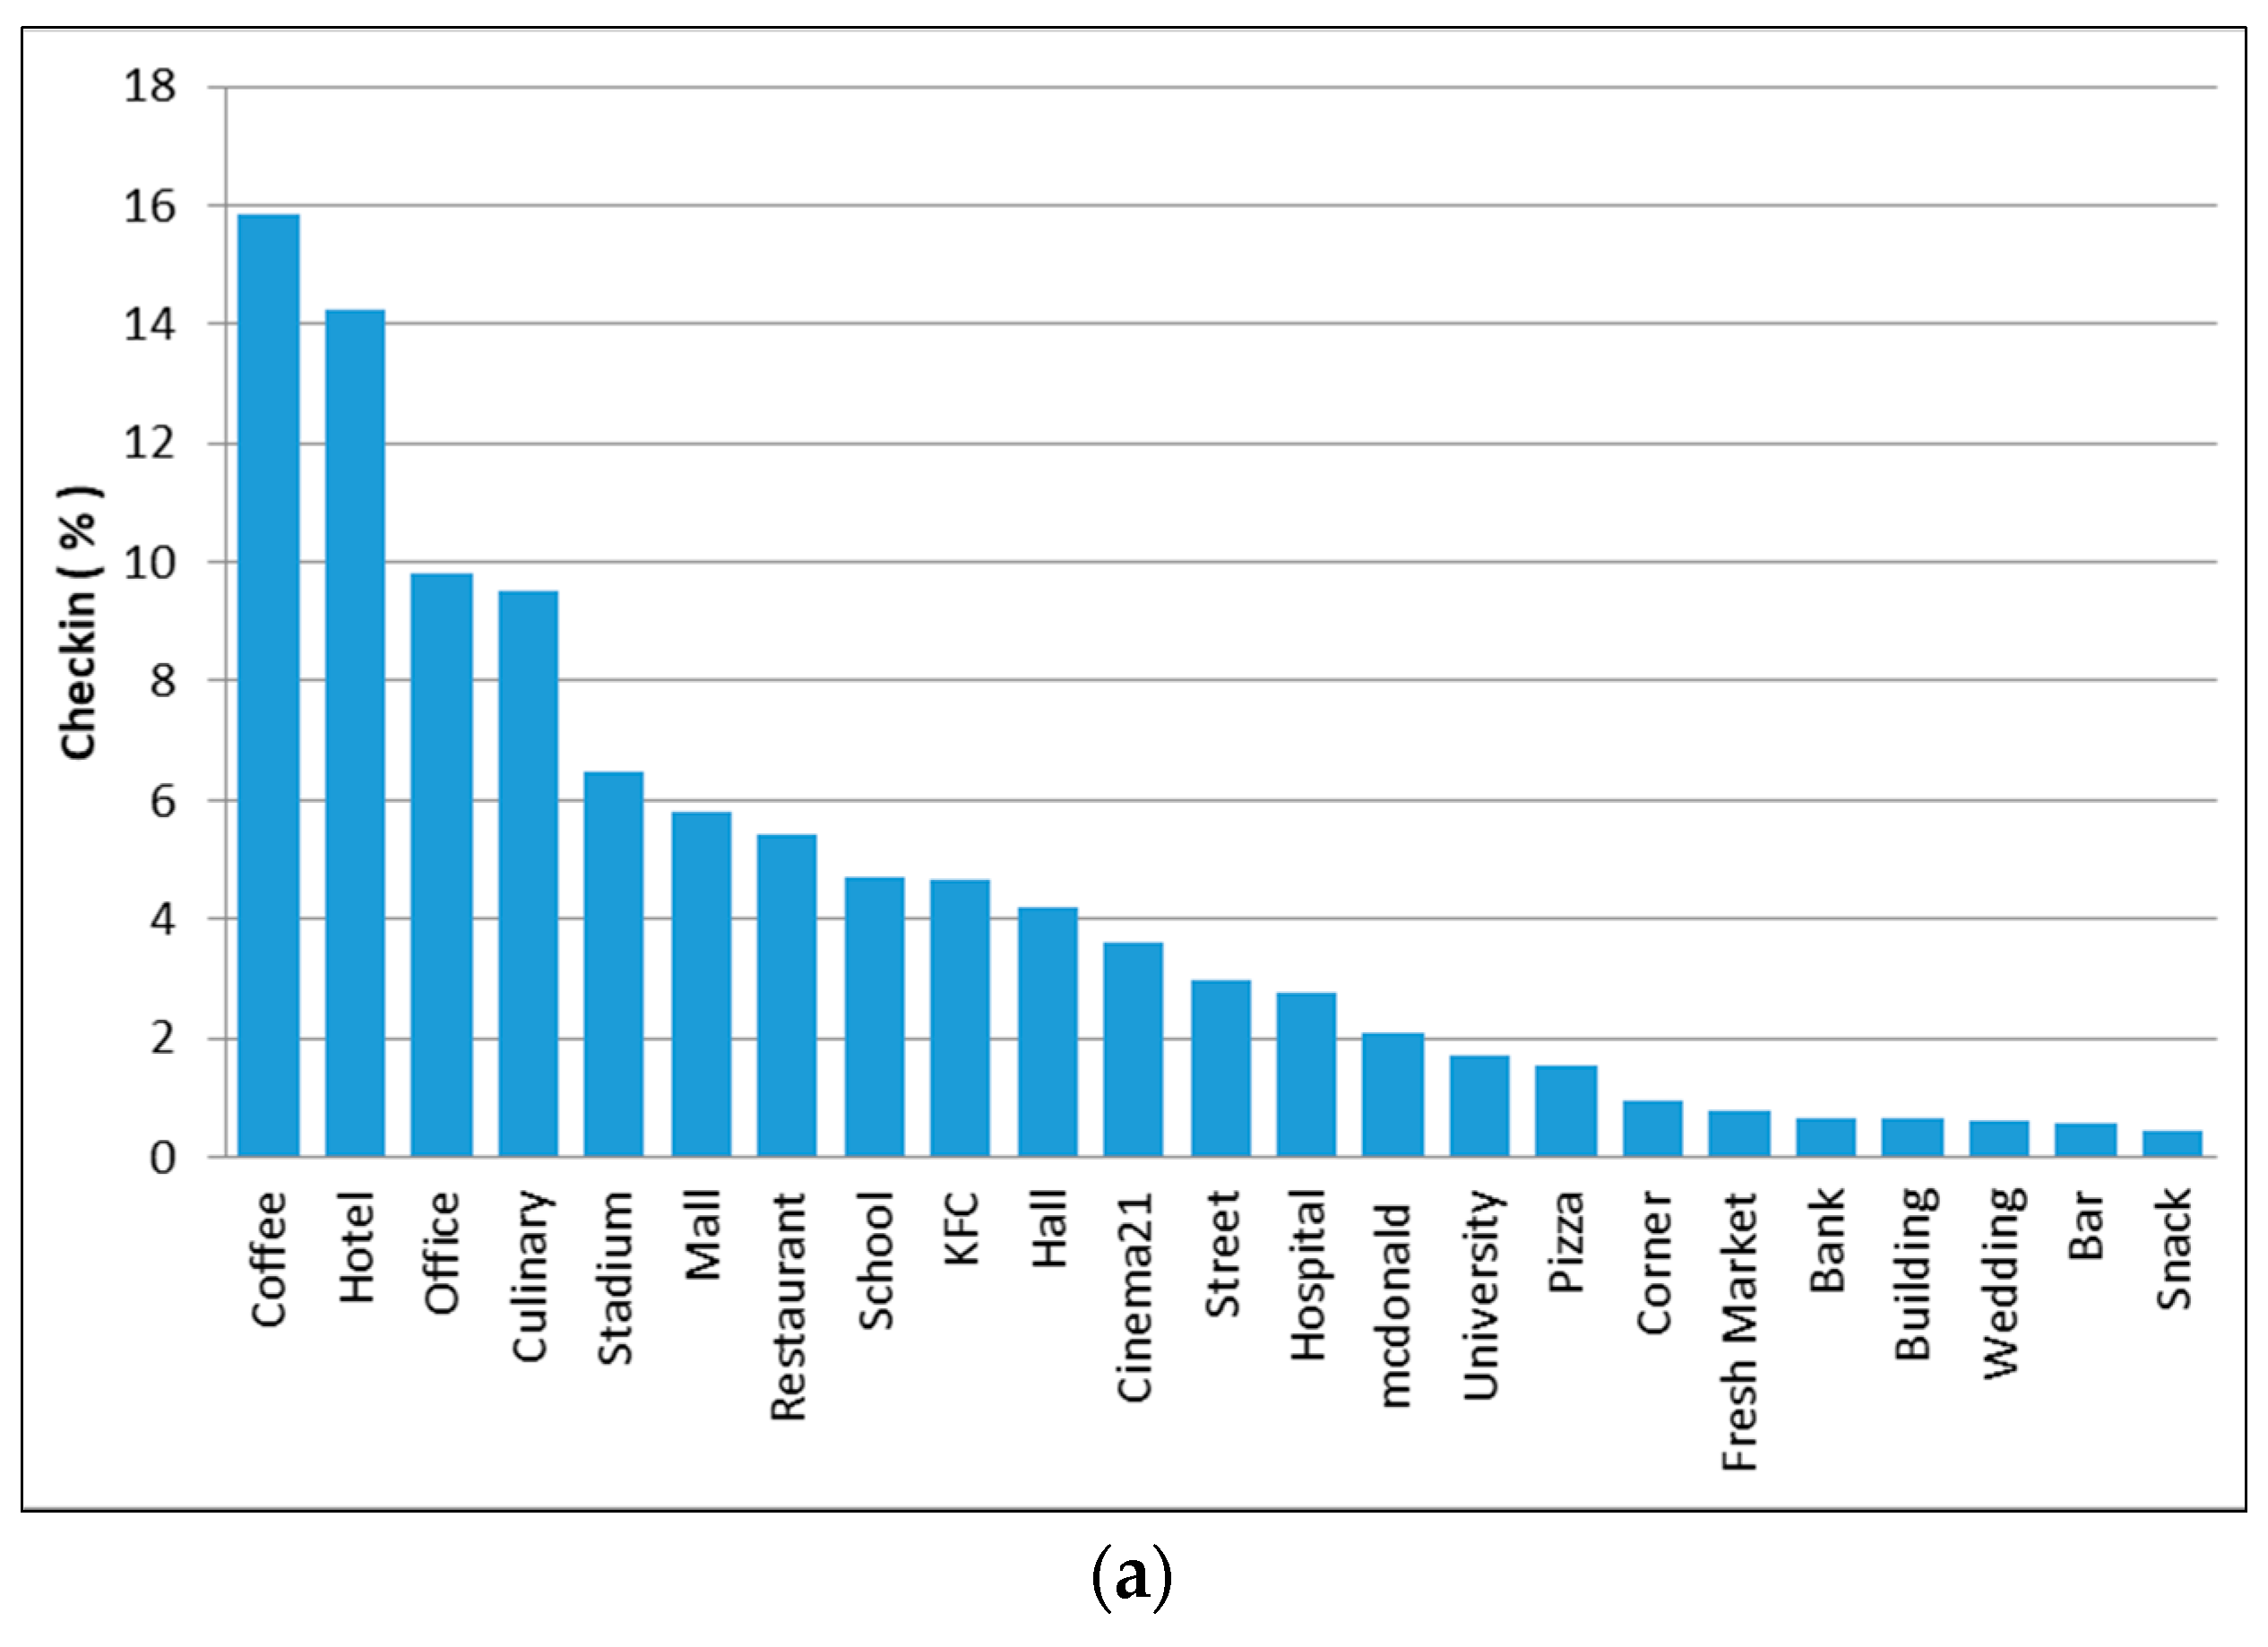
In cluster 3, we divided the time spread into two parts (evening and morning). In the evening, the peak of tweet activity occurred at 9 p.m. We observed that this cluster was dominated by individual activity at places such as culinary venues, coffee, and restaurants (see Figure 9c). It is therefore most likely that people go out for dinner. We would argue that this cluster represents the commercial area for eating or other culinary activities, which can be proven by the decrease of check-in activity one hour later (see Figure 9d).
Then in the morning, the peak occurred at around 8–9 a.m., and then the trend fluctuated until noon or 2 p.m. (see Figure 9d). We observed that this cluster was populated in places such as hotels, offices, and malls. We argue that in addition to visitors, this check-in was also made by employees and office staff. We therefore concluded that this was a working or business area. There was a large difference when we compared the tweet pattern on weekdays and weekends; weekends showed a decrease in tweet activity when compared to weekdays. Thus, we concluded that check-in at work places started from the morning and continued until noon. Then in the afternoon (returning home from work), people would look for other activities, such as shopping or going to dinner. Comparing this with the k-means result, we find that cluster 4 (see Table 2) has a similarity with the group pattern of the rank method. We concluded that this is a work area.
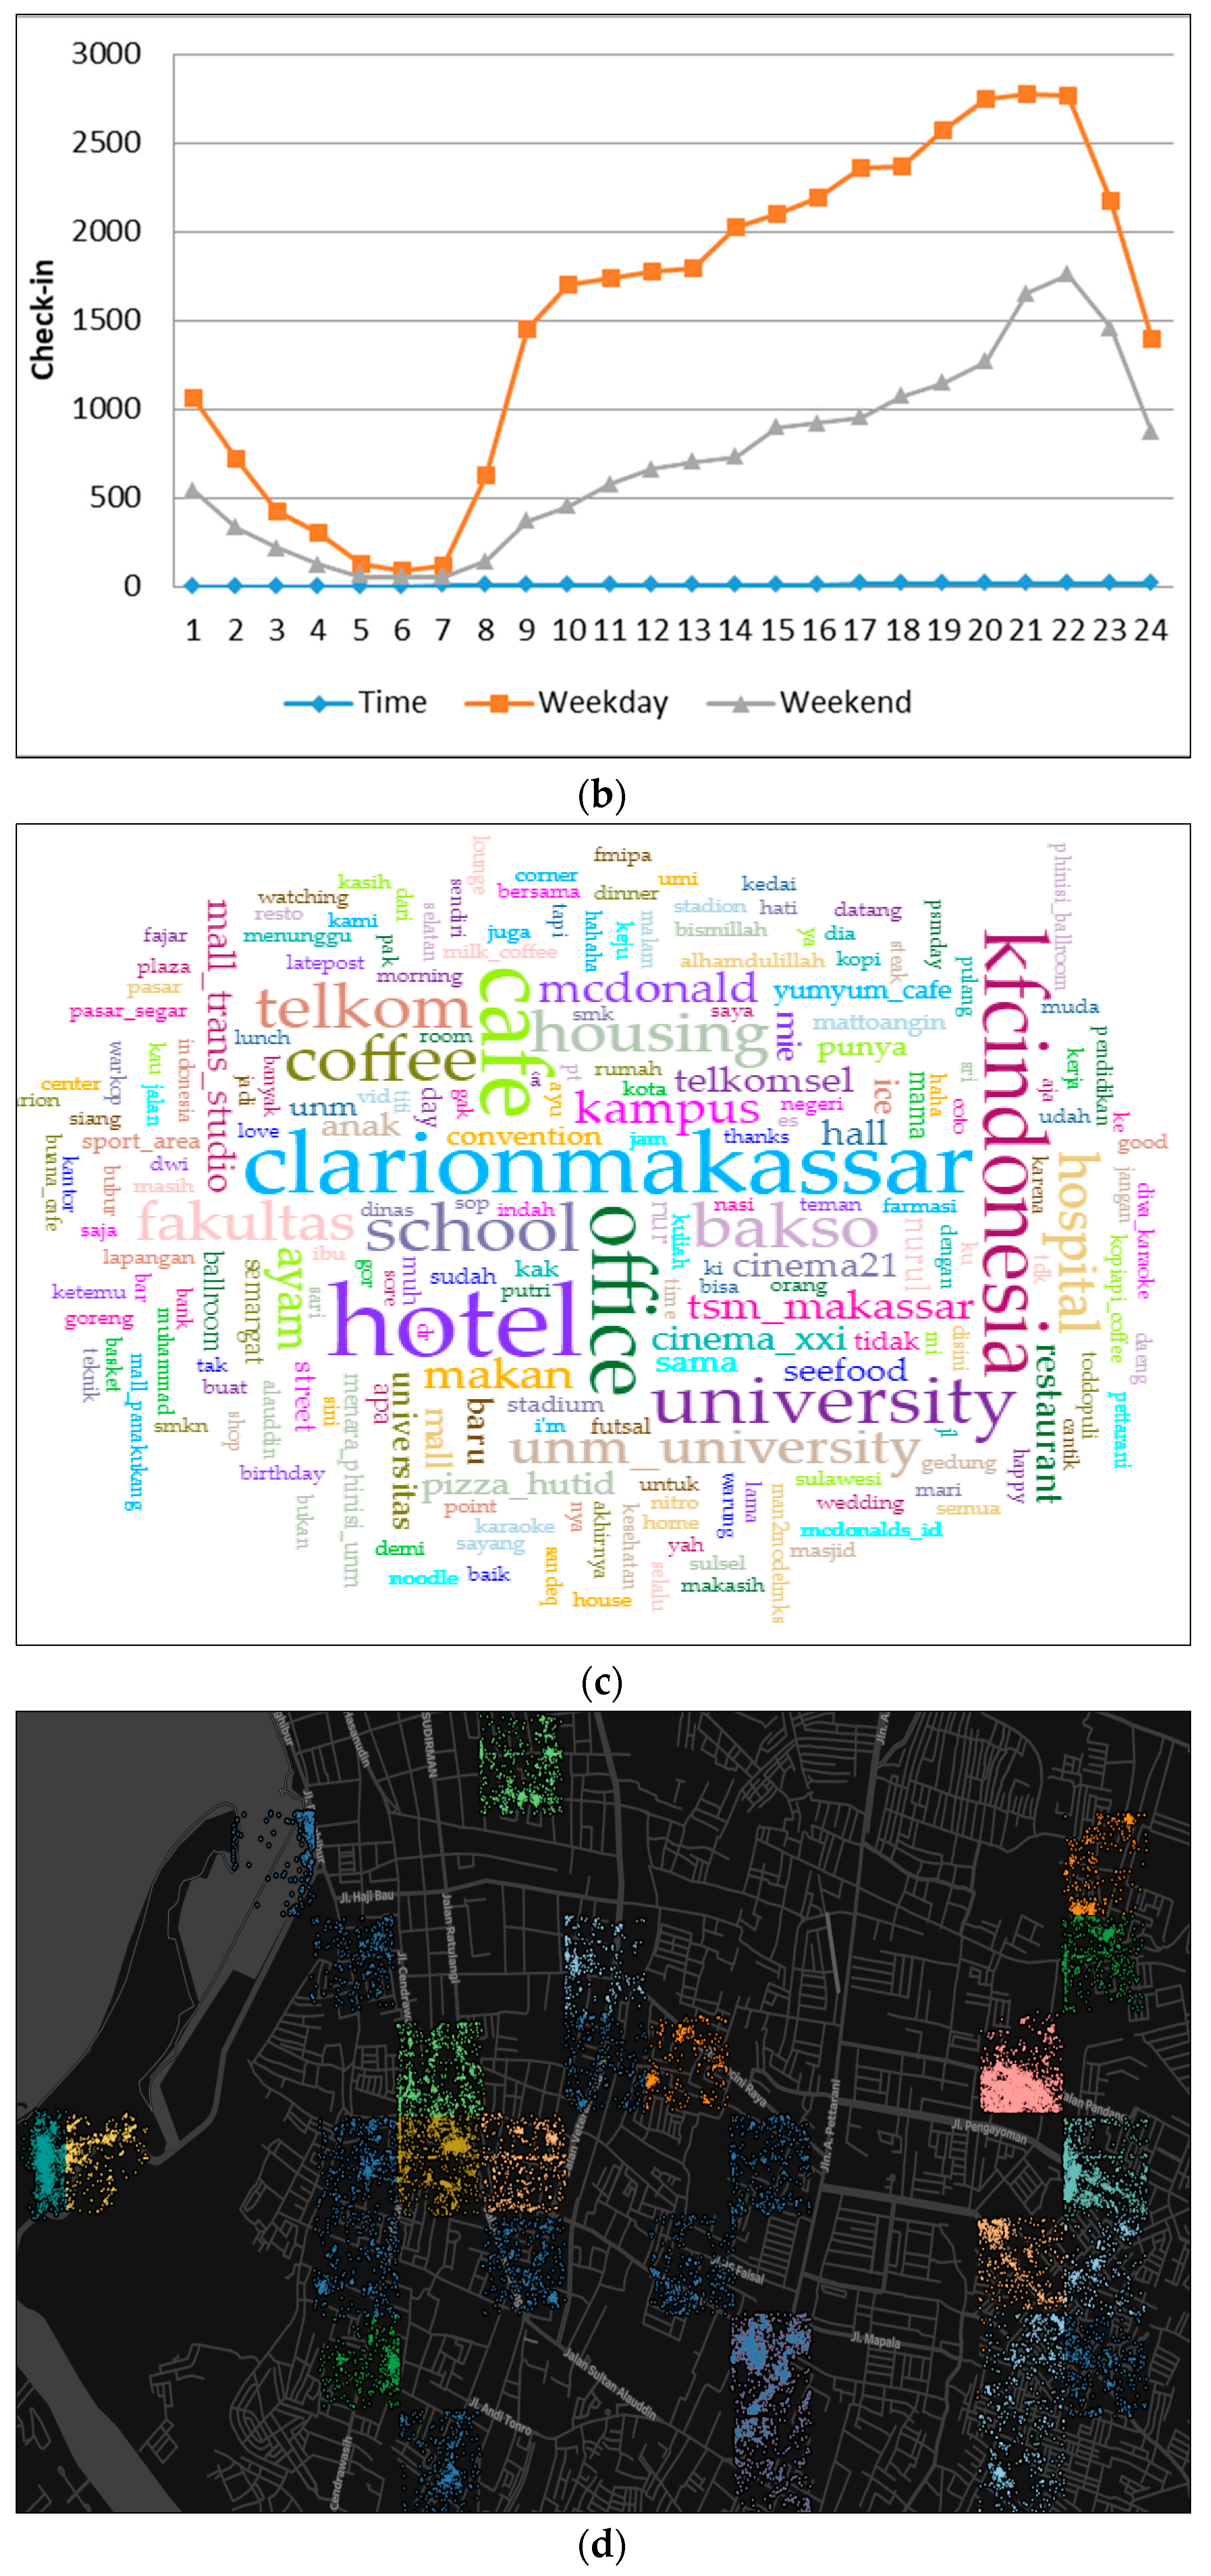
4.4. Mixed Area (Cluster 4)
We could not explain specifically the land use of this region. We called this the mixed cluster, because in this region, there were various activities in venues such as hotels, shopping centers, office centers, and sports centers (see Figure 10a). In the morning, check-in activity for this cluster began at 7 a.m. and increased until the afternoon. The spread of time on weekdays and weekends had similar patterns. We concluded that this area was the most active area as the tendency of check-in activity did not decrease until 10:00 p.m. (see Figure 10b).
5. Conclusions
In this study, we used Twitter as a source of data to analyze urban land use. To investigate the regional profile, we collected information from Twitter in the form of users’ text posts, time zones, and coordinates. In this paper, we proposed a grid-based aggregation method to explore urban areas. The proposed approach divided the region in the form of a grid, where on each grid, there was a 500 × 500 m2 block, thus yielding 398 blocks. We divided the area into 32 classes, where each class had 100 check-in intervals, and then classified the existing classes into some clusters. Land identification was determined on the basis of, firstly, the highest number of check-ins and, secondly, the result of a comparison of check-in patterns on weekdays and weekends.
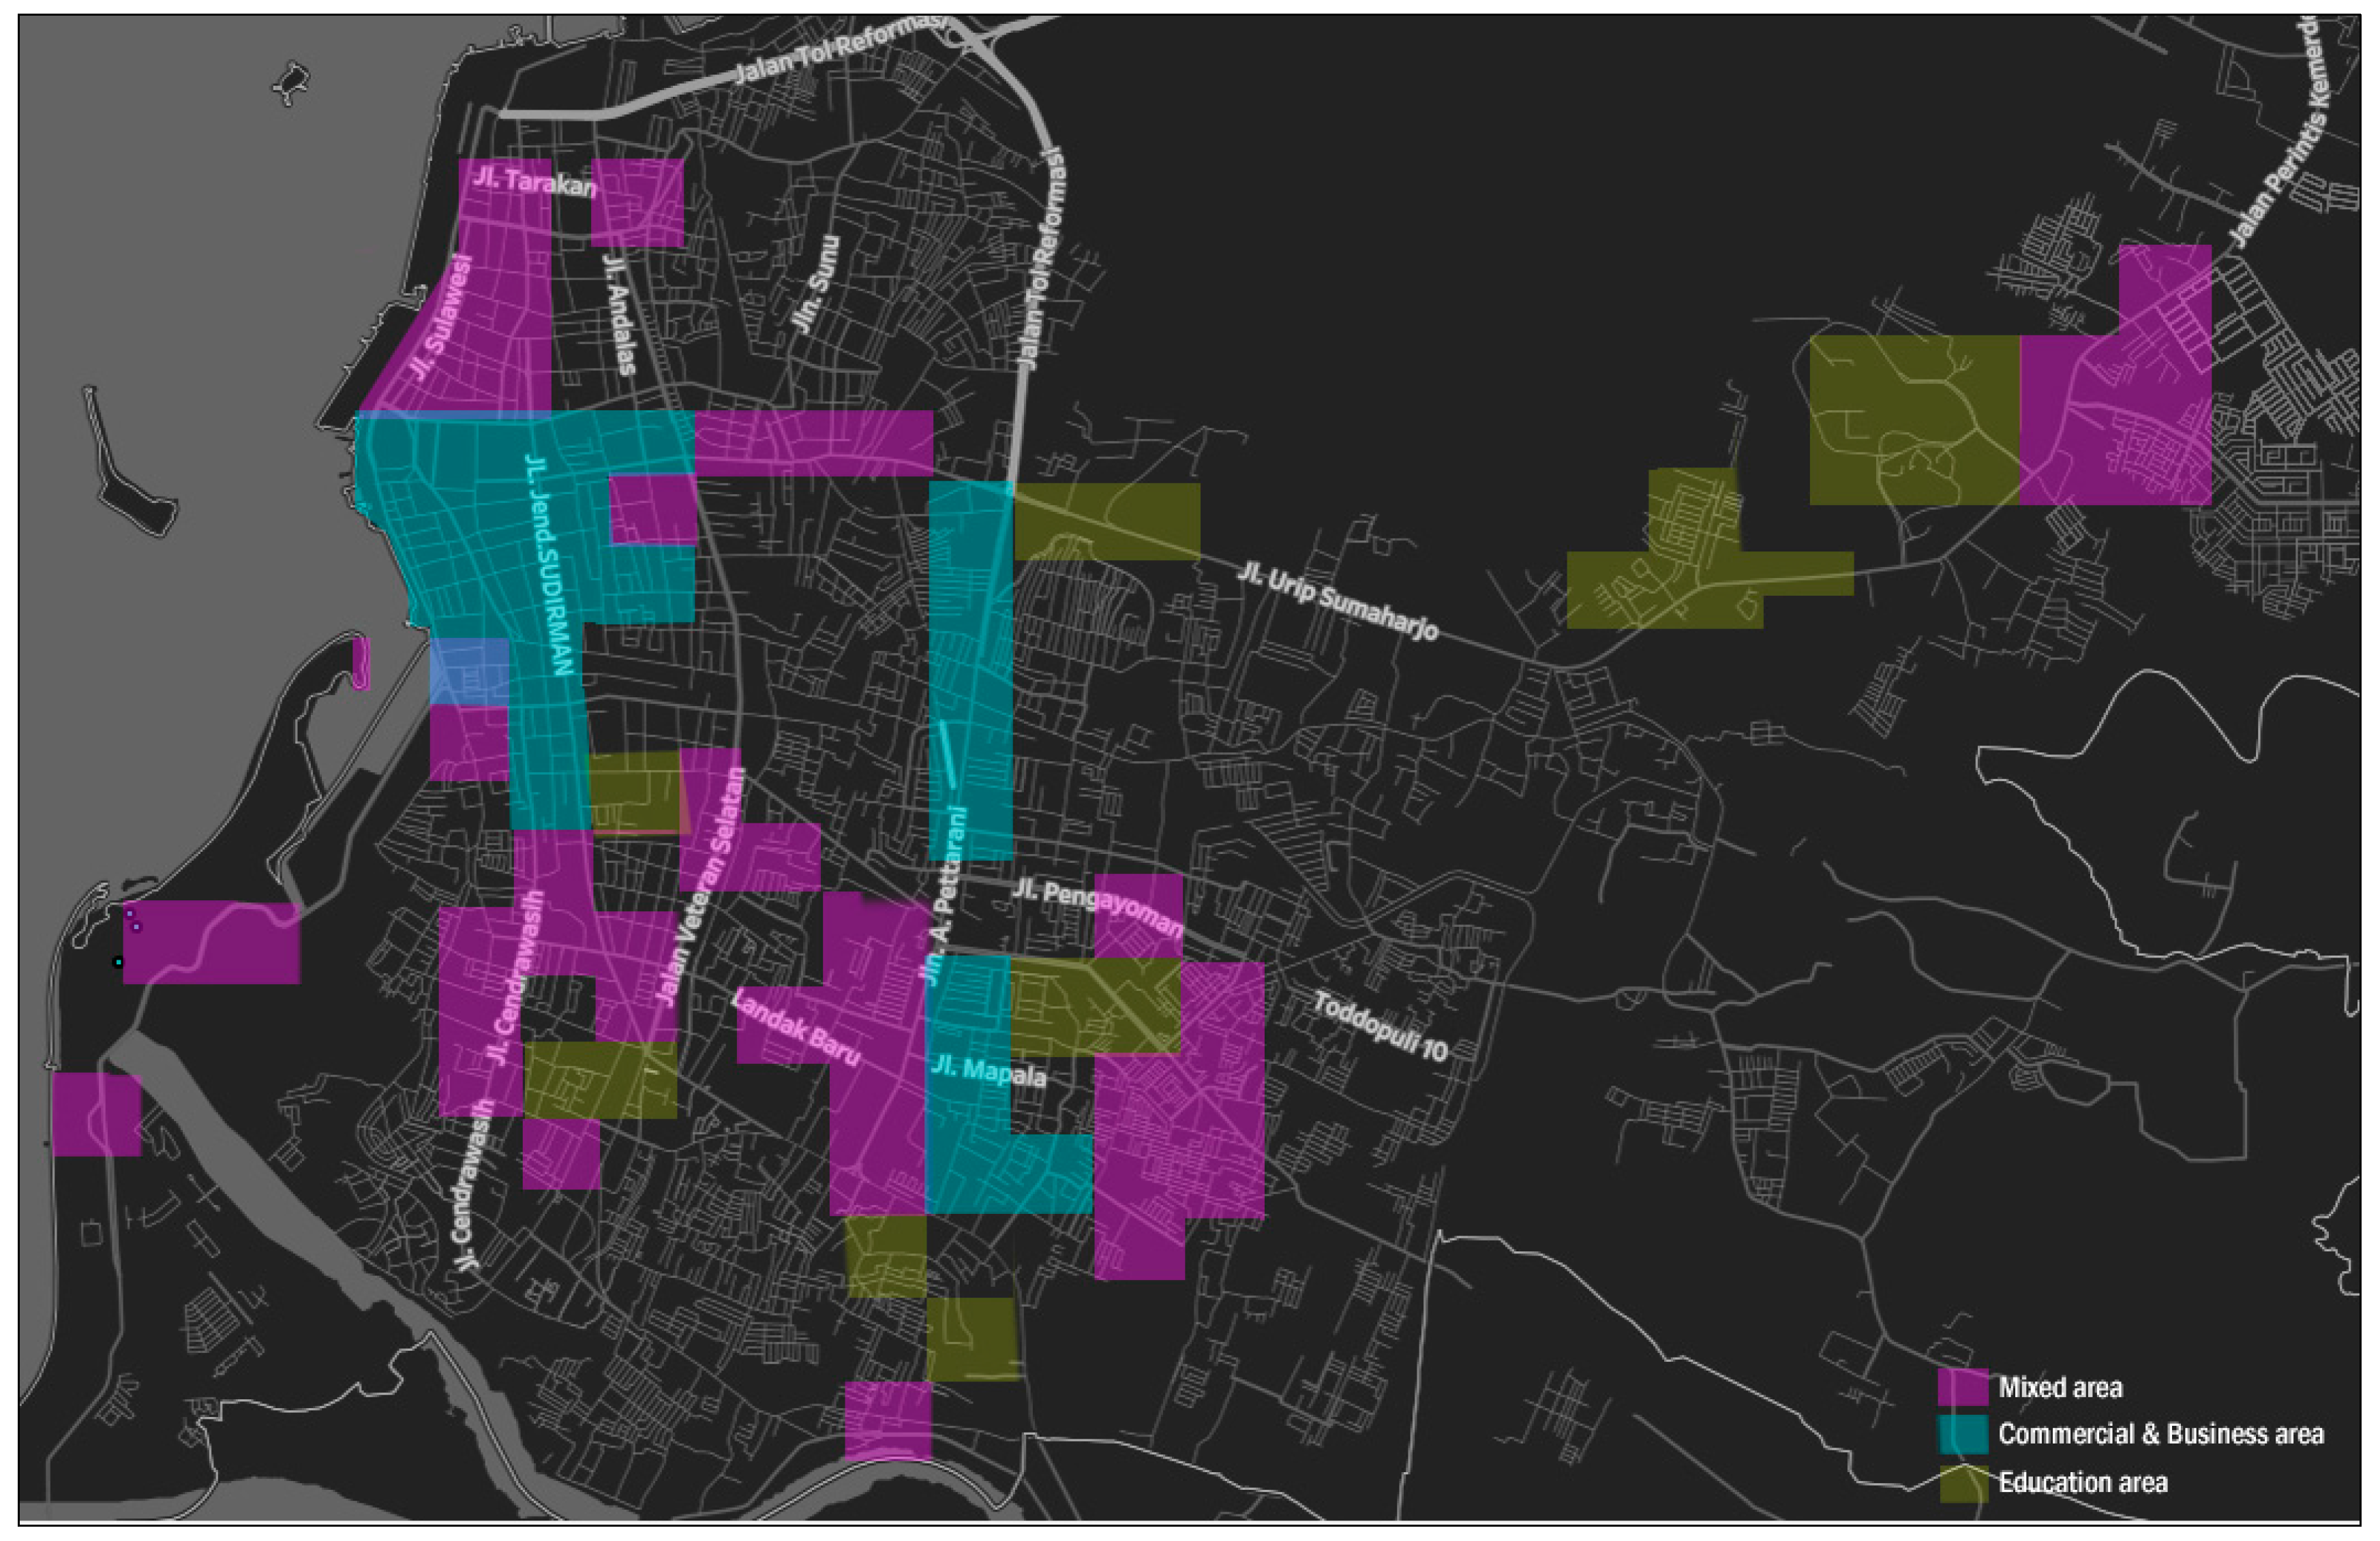
Our proposed method could characterize the urban area, particularly for land-use identification. The model used produces a polycentric area—not centered on one particular region—which means that in the city, there will be more than one similar land-use type (see Figure 11). For example, the education and commercial areas are not only centered on one area but also spread over several regions. We concluded that Twitter check-in data can be used to understand the actual urban land use. Our new method can contribute additional data or input for city planners and stakeholders to solve these problems, specifically the analysis of urban land use. As such, the method we propose is cheap to implement and easy to use. In this regard, this research could become a part of the city’s sustainability, specifically for the development of urban land use. To obtain maximum measurement results, this method depends and relies on the size of the used grid. For this, larger grid sizes will provide at least twice as many land-use functions in a region. In this regard, grid-size standardization is necessary for the partition of land types. This challenge needs to be considered for future research.
If we compare the ranking and k-means clustering methods, we found that the rank method measures on the basis of the order of data; the highest-ranking order became a standard to determine the state of the region. Meanwhile, the k-means clustering method used a similarity-and-distance approach to group the data. Other than being reliable, both methods can solve huge amounts of data.
Acknowledgments
This research was supported by the University of Kitakyushu, the Directorate General of Higher Education of Indonesia (DIKTI), and STMIK Handayani Makassar, Indonesia.
Author Contributions
Yuyun performed the experiment and wrote the paper. Fritz Akhmad Nuzir reviewed the writing. Bart Julien Dewancker contributed to the conceptual design and as a supervisor in guiding this research.
Conflicts of Interest
The authors declare that there is no conflict of interest regarding the writing of this paper.
Appendix A

Table A1.
The classes group of place activity.
| C200 | Check-In | C300 | Check-In | C400 | Check-In | C500 | Check-In |
| Housing | 1350 | Housing | 1135 | Housing | 1060 | School | 866 |
| University | 469 | University | 885 | Street | 877 | University | 696 |
| Office | 400 | School | 407 | University | 600 | Housing | 457 |
| Street | 303 | Street | 305 | Coffee | 619 | Coffee | 556 |
| School | 299 | Coffee | 267 | Office | 427 | Hospital | 318 |
| Restaurant | 269 | Café | 253 | School | 349 | Office | 189 |
| Coffee | 454 | Office | 248 | Culinary | 268 | Hotel | 119 |
| Pool | 133 | Park | 194 | KFC | 268 | Bank | 109 |
| Seafood | 117 | Meatball | 165 | Meatball | 255 | Ice | 107 |
| Beach | 116 | Culinary | 154 | Hospital | 222 | Street | 107 |
| Culinary | 112 | Restaurant | 149 | Beach | 188 | Unhas | 106 |
| Shop | 96 | Hospital | 119 | Eating | 181 | Meatball | 104 |
| Park | 92 | Noodle | 113 | Hotel | 150 | Eating | 97 |
| Cinema21 | 88 | Hotel | 109 | Noodle | 114 | Culinary | 66 |
| Meatball | 82 | Hall | 92 | Seafood | 108 | Chicken | 62 |
| Field | 81 | Mosque | 83 | Mosque | 97 | ||
| C900 | Check-In | C1100 | Check-In | C5200 | Check-In | C700 | Check-In |
| KFC | 427 | McDonald | 390 | Mall | 845 | Coffee | 763 |
| Coffee | 450 | Ice | 217 | KFC | 631 | Hospital | 268 |
| Housing | 288 | Stadium | 191 | Cinema21 | 364 | University | 366 |
| Hospital | 242 | Restaurant | 319 | McDonald | 333 | Street | 212 |
| Eating | 329 | Office | 181 | Eating | 245 | Office | 206 |
| Mall | 164 | Coffee | 105 | Coffee | 501 | Meatball | 175 |
| Noodle | 126 | Noodle | 101 | Pizza | 216 | Housing | 174 |
| Pizza | 97 | Meatball | 91 | Street | 148 | Seafood | 164 |
| Office | 149 | Café | 68 | Hotel | 133 | Eating | 124 |
| Soccer | 73 | Hotel | 64 | Karaoke | 121 | School | 118 |
| Hotel | 64 | Karaoke | 51 | Restaurant | 117 | Restaurant | 101 |
| Street | 60 | Shop | 45 | Culinary | 117 | Skincare | 98 |
| Porridge | 59 | Mall | 44 | Supermarket | 100 | Cheese | 88 |
| Noodle | 55 | Housing | 39 | Office | 165 | Eating | 85 |
| Cinema21 | 53 | Church | 37 | Shop | 91 | ||
| C1200 | Check-In | C3300 | Check-In | C600 | Check-In | C1000 | Check-In |
| School | 592 | Coffee | 606 | Hotel | 1354 | Coffee | 488 |
| Church | 91 | KFC | 219 | Hall | 341 | University | 344 |
| Coffee | 86 | Cinema21 | 194 | University | 314 | School | 322 |
| Culinary | 147 | Market | 142 | Café | 168 | Culinary | 140 |
| Coffee | 73 | Mall | 122 | School | 136 | Restaurant | 119 |
| Restaurant | 138 | Hotel | 52 | Corner | 87 | Housing | 108 |
| Office | 51 | Street | 87 | Office | 66 | Cinema21 | 107 |
| Hotel | 42 | Bar | 80 | Street | 65 | Noodle | 73 |
| Culinary | 38 | Tea | 77 | School | 65 | Shop | 67 |
| Mall | 38 | Eating | 72 | Building | 57 | Mall | 56 |
| Clinic | 35 | Karaoke | 65 | Wedding | 56 | Office | 48 |
| Store | 29 | Culinary | 182 | Swimming | 55 | Eating | 45 |
| Mall | 28 | Pizza | 63 | Garden | 47 | Bank | 38 |
| Donuts | 26 | Snack | 58 | ||||
| C1800 | Check-In | C2500 | Check-In | C6600 | Check-In | C1300 | Check-In |
| Pizza | 291 | Culinary | 544 | Mall | 1145 | University | 928 |
| Coffee | 361 | Hotel | 263 | Cinema21 | 1025 | McDonald | 371 |
| University | 224 | Office | 114 | Tea | 347 | KFC | 199 |
| Culinary | 190 | Bar | 92 | Supermarket | 250 | Hospital | 186 |
| School | 305 | Mall | 159 | Pizza | 191 | Office | 153 |
| Beach | 187 | Culinary | 102 | Mall | 188 | Street | 152 |
| Restaurant | 482 | Tower | 82 | Coffee | 209 | Coffee | 247 |
| Bar | 131 | Park | 60 | Eating | 102 | Restaurant | 77 |
| Meatball | 119 | Bank | 52 | Restaurant | 313 | Monument | 161 |
| Office | 106 | Hospital | 73 | Bank | 61 | Pizza | 60 |
| Hall | 84 | Eating | 44 | Bookstore | 70 | Noodle | 56 |
| Bank | 70 | Coffee | 32 | ||||
| C7600 | Check-In | C3600 | Check-In | C2900 | Check-In | C1900 | Check-In |
| Mall | 1720 | Hotel | 1106 | Restaurant | 444 | McDonald | 914 |
| Cinema | 935 | Office | 571 | Fort | 296 | Coffee | 344 |
| KFC | 159 | University | 325 | Office | 239 | Office | 172 |
| Tea | 243 | Café | 165 | Coffee | 200 | Eating | 163 |
| Eating | 183 | School | 187 | Park | 67 | Culinary | 271 |
| Coffee | 294 | Ballroom | 100 | Food | 44 | Hotel | 77 |
| Pizza | 141 | Happy | 98 | Bar | 87 | Steak | 77 |
| Restaurant | 180 | Corner | 87 | Culinary | 76 | Ice | 74 |
| Snack | 95 | Wedding | 56 | Hotel | 36 | University | 64 |
| Bookstore | 70 | Street | 131 | Eating | 137 | ||
| C1700 | Check-in | C2100 | Check-in | C2400 | Check-in | C800 | Check-in |
| Mall | 687 | Field | 332 | School | 236 | University | 2138 |
| Cinema21 | 318 | KFC | 125 | KFC | 137 | Office | 564 |
| Restaurant | 101 | School | 246 | Culinary | 179 | School | 392 |
| Coffee | 119 | Field | 86 | Hotel | 142 | Culinary | 280 |
| Tea | 39 | Office | 152 | Field | 67 | KFC | 221 |
| Dinner | 33 | Mall | 70 | Bank | 60 | Seafood | 139 |
| Lunch | 27 | Street | 70 | Coffee | 137 | Pizza | 123 |
| Bank | 25 | Pizza | 53 | Hospital | 41 | Coffee | 116 |
| Snack | 25 | Coffee | 96 | Restaurant | 64 | Soccer | 108 |
| Fitness | 18 | Bank | 42 | ||||
| C2000 | Check-in | C2200 | Check-in | C1500 | Check-in | C100 | Check-in |
| Restaurant | 568 | University | 1897 | University | 1715 | Housing | 779 |
| Hotel | 175 | Beach | 438 | Café | 992 | University | 135 |
| Café | 169 | Restaurant | 258 | Cinema21 | 228 | Street | 111 |
| Bar | 139 | KFC | 241 | Mall | 241 | School | 101 |
| Guesthouse | 84 | Culinary | 200 | Building | 130 | Café | 41 |
| Office | 42 | Coffee | 325 | Library | 233 | Coffee | 37 |
| Hospital | 34 | Hotel | 508 | Meatball | 61 | Restaurant | 36 |
| Eating | 52 | Hall | 84 | Hotel | 59 | Office | 29 |
| Culinary | 62 | Hospital | 106 | School | 57 | Culinary | 28 |
| C1600 | Check-in | C3000 | Check-in | C1400 | Check-in | C2300 | Check-in |
| Stadium | 849 | Mall | 1600 | University | 2117 | University | 574 |
| Office | 101 | Restaurant | 342 | Office | 603 | School | 958 |
| Photography | 62 | Cinema21 | 225 | Hospital | 191 | Futsal | 39 |
| Soccer | 57 | Coffee | 150 | Building | 92 | Hospital | 13 |
| School | 45 | Bar | 77 | School | 126 | Mosque | 18 |
| University | 87 | Snacks | 133 | Hall | 164 | ||
| Culinary | 22 | Eating | 31 | Canteen | 52 | ||
| Television | 17 | Fitness | 30 |
References
- Al-Tahir, R.; Rajack, F.; Oatham, M. Aerial photographs for detecting land use changes in Valencia Wildlife Sanctuary and Forest Reserve, Trinidad. Caribb. J. Earth Sci. 2005, 38, 35–42. [Google Scholar]
- Modara, M.; Belaid, M.A. Mapping and assessing land use/land cover change in Muharraq island based on GIS and remote sensing integration. Remote Sens. Spat. Inf. Sci. 2013, XL-4/W1, 57–63. [Google Scholar] [CrossRef]
- Reis, S. Analyzing land use/land cover changes using remote sensing and GIS in Rize, North-east Turkey. Multidiscip. Digit. Publ. Inst. 2008, 8, 6188–6202. [Google Scholar] [CrossRef] [PubMed]
- Fonji, S.F.; Taff, G.N. Using satellite data to monitor land-use land-cover change in North-eastern Latvia. Springerplus 2014, 3, 1–15. [Google Scholar] [CrossRef] [PubMed]
- Hu, T.; Yang, J.; Li, X.; Gong, P. Mapping urban land use by using landsat images and open social data. Remote Sens. Spat. Inf. Sci. 2016, 8, 151. [Google Scholar] [CrossRef]
- Kawakubo, F.S.; Morato, R.G.; Nader, R.S.; Luchiari, A. Mapping changes in coastline geomorphic features using landsat TM and ETM imagery: examples in South Eastern Brazil. Int. J. Remote Sens. 2011, 32, 2547–2562. [Google Scholar] [CrossRef]
- Haeusler, M.H. Enabling low cost human presence tracking. In Proceedings of the International Conference of the Association for Computer-Aided Architectural Design Research in Asia CAADRIA, Melbourne, ON, Australia, 30 March–2 April 2016; pp. 45–54. [Google Scholar]
- Song, J.; Tang, E.Y.; Liu, L. User behavior pattern analysis and prediction based on mobile phone sensors. In Proceedings of the 2010 IFIP International Conference on Network and Parallel Computing, Zhengzhou, China, 13–15 September 2010; Springer: Berlin/Heidelberg, Germany, 2010; pp. 177–189. [Google Scholar]
- Zhang, A. Detecting Human Behavior Patterns from Mobile Phone. J. Comput. Inf. Syst. 2012, 8, 2671–2679. [Google Scholar]
- Jankowska, M.M.; Schipperijn, J.; Kerr, J. A framework for using GPS data in physical activity and sedentary behavior studies. Exerc. Sport Sci. Rev. 2015, 43, 48–56. [Google Scholar] [CrossRef] [PubMed]
- Munizaga, M.; Devillaine, F.; Navarrete, C.; Silva, D. Validating travel behavior estimated from smartcard data. Transp. Res. Part C 2014, 44, 70–79. [Google Scholar] [CrossRef]
- Van der Spek, S.; van Schaick, J.; de Bois, P.; de Haan, R. Sensing human activity: GPS tracking. Sensors 2009, 9, 3033–3055. [Google Scholar] [CrossRef] [PubMed]
- Farshad, A.; Marina, M.K.; Garcia, F. Urban wifi characterization via mobile crowdsensing. In Proceedings of the IEEE NOMS, Krakow, Poland, 5–9 May 2014. [Google Scholar]
- Soto, V.; Martinez, E.F. Automated land use identification using cell-phone records. In Proceedings of the 3rd ACM International Workshop on MobiArch, Bethesda, MA, USA, 28 June 2011; ACM: New York, NY, USA, 2011; pp. 17–22. [Google Scholar]
- Toole, J.L.; Ulm, M.; González, M.C. Inferring land use from mobile phone activity. In Proceedings of the ACM SIGKDD International Workshop on Urban Computing, Beijing, China, 12 August 2012; ACM: New York, NY, USA, 2012; pp. 1–8. [Google Scholar]
- Ratti, C.; Pulselli, R.M.; Williams, S.; Frenchman, D. Mobile Landscapes: Using location data from cell-phones for urban analysis. Environ. Plan. 2006, 33, 727–748. [Google Scholar] [CrossRef]
- Hasan, S.; Zhan, X.; Ukkusuri, S.V. Understanding urban human activity and mobility patterns using large-scale location-based data from online social media. In Proceedings of the 2nd ACM SIGKDD International Workshop on Urban Computing, Chicago, IL, USA, 11–14 August 2013; ACM: New York, NY, USA, 2013; p. 6. [Google Scholar]
- Sun, Y.; Li, M. Investigation of travel and activity patterns using location-based social network data: A case study of active mobile social media users. ISPRS Int. J. Geo. Inf. 2015, 4, 1512–1529. [Google Scholar] [CrossRef]
- Hasan, S.; Ukkusuri, S.V. Location contexts of user check-ins to model urban geo life-style patterns. PLoS ONE 2015, 10, e0124819. [Google Scholar] [CrossRef] [PubMed]
- Noulas, A.; Scellato, S.; Lathia, N.; Mascolo, C. Mining user mobility features for next place prediction in location-based services. In Proceedings of the 2012 IEEE 12th International Conference on Data Mining (ICDM), Brussels, Belgium, 10–13 December 2012. [Google Scholar]
- Mahmud, J.; Nichols, J.; Drews, C. Home Location Identification of Twitter Users. ACM Trans. Intell. Syst. Technol. 2013, 5, 1–47. [Google Scholar] [CrossRef]
- Williams, E.; Gray, J.; Dixon, B. Improving geolocation of social media posts. J. Pervasive Mob. Comput. 2017, 36, 68–79. [Google Scholar] [CrossRef]
- Kong, L.; Liu, Z.; Huang, Y. SPOT: Locating social media users based on social network context. Proc. VLDB Endow. 2014, 7, 1681–1684. [Google Scholar] [CrossRef]
- Qian, X.; Zhan, X.; Ukkusuri, S.V. Characterizing Urban Dynamics Using Large Scale Taxicab Data. In Engineering and Applied Science Optimization; Springer: Berlin, Germany, 2015; pp. 17–33. [Google Scholar]
- Yuan, J.; Zheng, Y.; Xie, X. Discovering regions of different functions in a city using human mobility and POIs. In Proceedings of the 18th ACM SIGKDD International Conference on Knowledge Discovery and Data Mining, Beijing, China, 12–16 August 2012; ACM: New York, NY, USA, 2012; pp. 186–194. [Google Scholar]
- Frias-Martinez, V.; Frias-Martinez, E. Spectral clustering for sensing urban land use using Twitter activity. Eng. Appl. Artif. Intell. 2014, 35, 237–245. [Google Scholar] [CrossRef]
- Hollenstein, L.; Purves, R.S. Exploring place through user-generated content: Using Flickr tags to describe city cores. J. Spat. Inf. Sci. 2010, 1, 21–48. [Google Scholar]
- Sun, Y.; Fan, H.; Li, M.; Zipf, A. Identifying the city center using human travel flows generated from location-based social networking data. Environ. Plan. B Plan. Des. 2015, 43, 480–498. [Google Scholar] [CrossRef]
- Lansley, G.; Longley, P.A. The geography of Twitter topics in London. Comput. Environ. Urban Syst. 2016, 58, 85–96. [Google Scholar] [CrossRef]
- Wang, Y.; Wang, T.; Tsou, M.H.; Li, H.; Jiang, W.; Guo, F. Mapping dynamic urban land use patterns with crowdsourced geo-tagged social media (sina-weibo) and commercial points of interest collections in Beijing, China. Sustain. Urban Rural Dev. 2016, 8, 1202. [Google Scholar] [CrossRef]
- Open Twitter Streaming Api. Available online: https://dev.twitter.com/docs/streaming-api (accessed on 26 August 2016).
- Central Bureau of Statistic. Available online: http://sp2010.bps.go.id/ (accessed on 18 October 2017).
- Wabula, Y.; Dewancker, B.J. Analysis of urban population using twitter distribution data: Case study of Makassar city, Indonesia. Int. Comput. Electr. Autom. Control Inf. Eng. Waset 2016, 10, 1627–1631. [Google Scholar]
- Land Use Map of Makassar City. Available online: http://darimakassar.com/rtrw-kota-makassar-2010-2030-2/ (accessed on 18 October 2017).
- Irfan, R.; King, C.K.; Es, G.; Ewen, S.; Khan, S.U.; Madani, S.A.; Kolodziez, J.O.; Wang, L.; Chen, D.; Rayes, A.; et al. A survey on text mining in social networks. Knowl. Eng. Rev. 2015, 30, 157–170. [Google Scholar] [CrossRef]
- Varghese, B.M.; Jose, J.T.; Unnikrishnan, A.; Poulose, K.J. Clustering Student Data to Characterize Performance Patterns. Int. J. Adv. Comput. Sci. Appl. Spec. Issue Artif. Intell. 2011, 2, 138–140. [Google Scholar]
- Mihai, D.; Mocanu, M. Statistical considerations on the k-means algorithm. Ann. Univ. Craiova Math. Comput. Sci. Ser. 2015, 42, 365–373. [Google Scholar]
Figure 1.
Data flow diagram of method used.
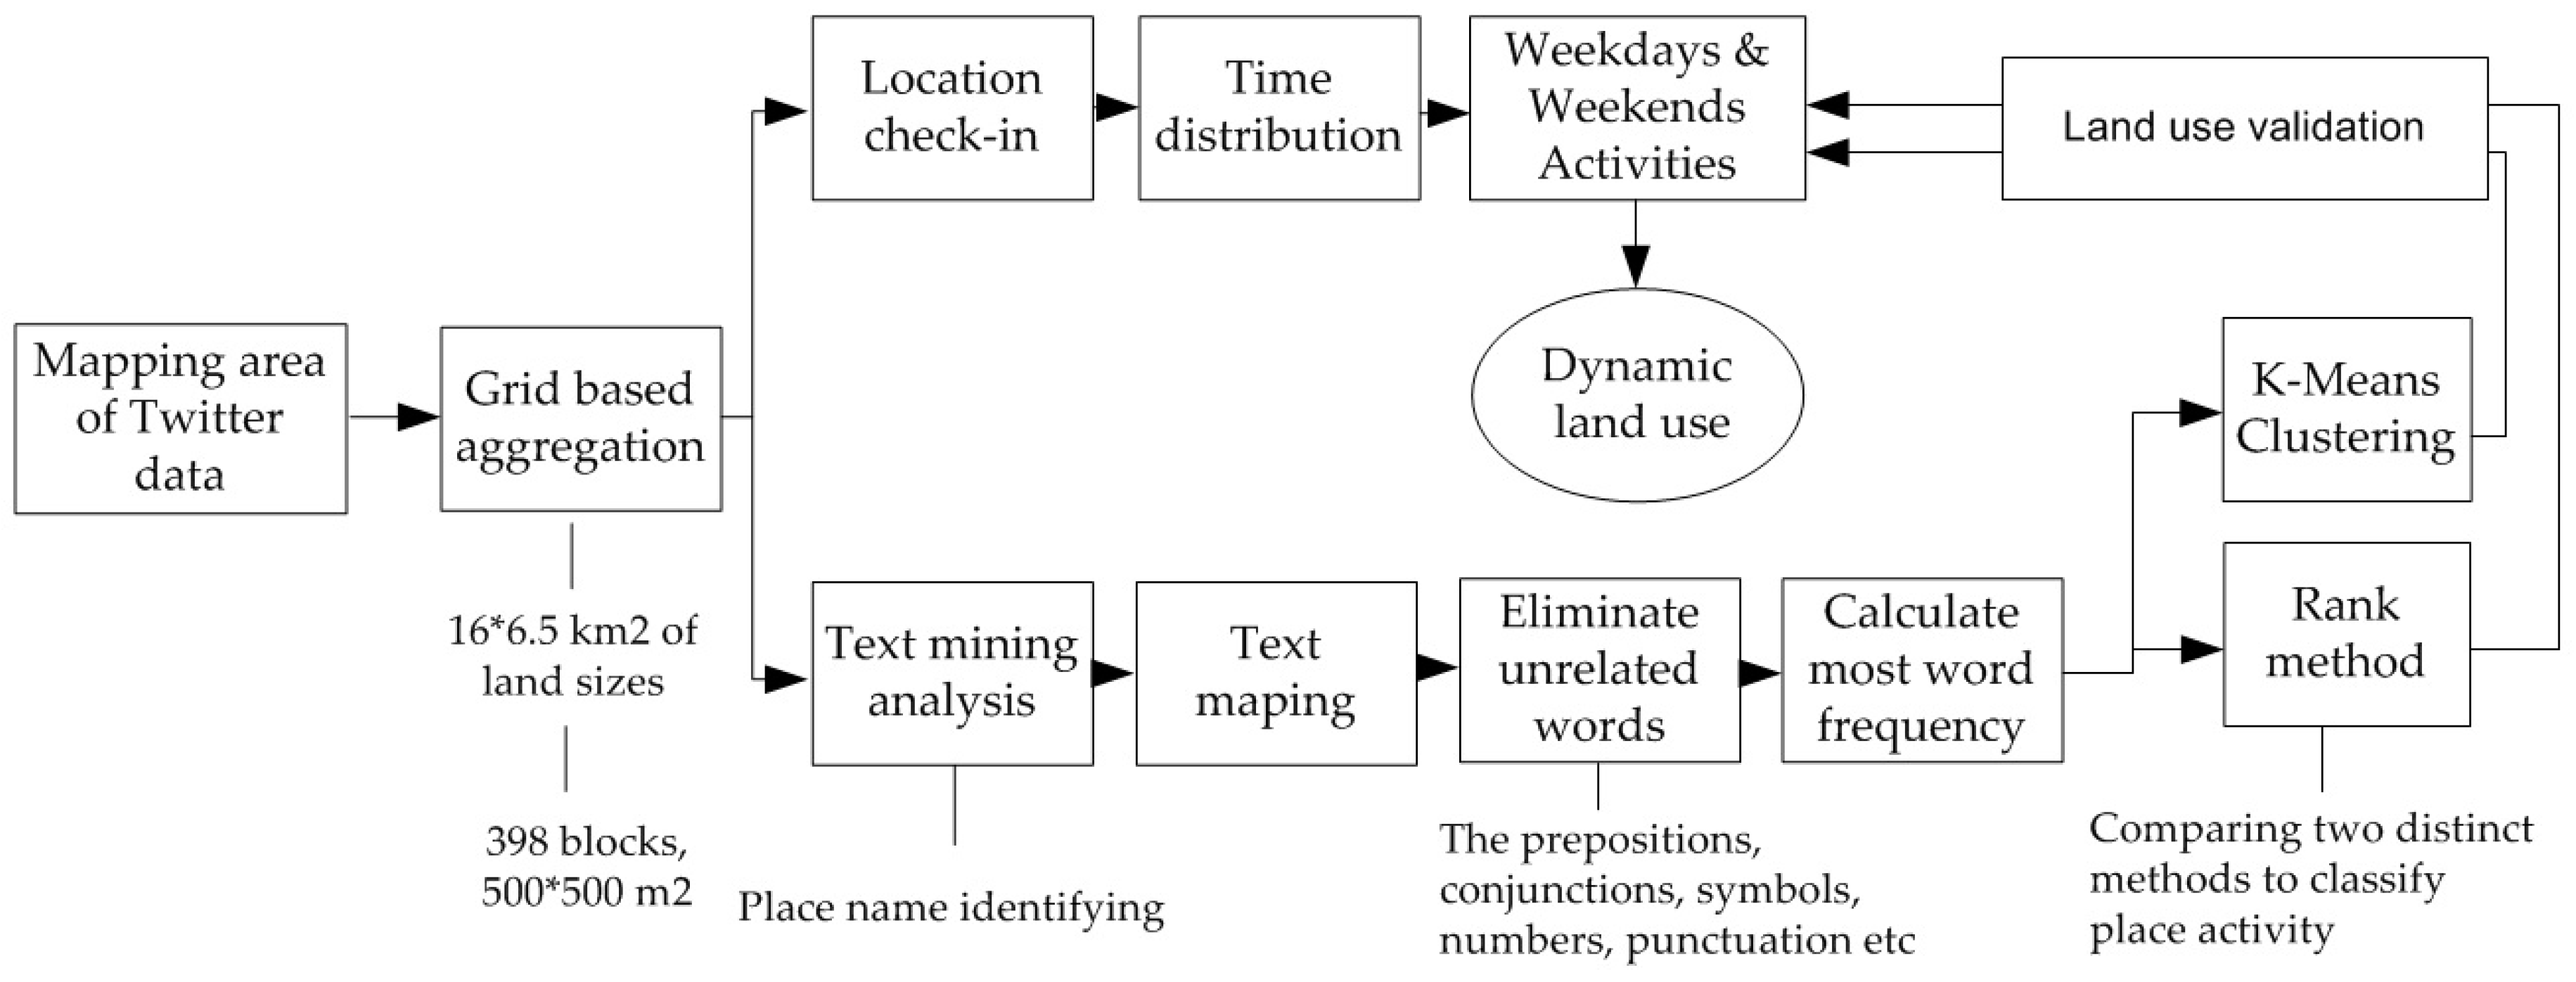
Figure 2.
Grid distribution of check-ins with 500 × 500 m2 blocks. The dots represent the user location tags, and the color describes the Twitter activity frequency.
Figure 2.
Grid distribution of check-ins with 500 × 500 m2 blocks. The dots represent the user location tags, and the color describes the Twitter activity frequency.
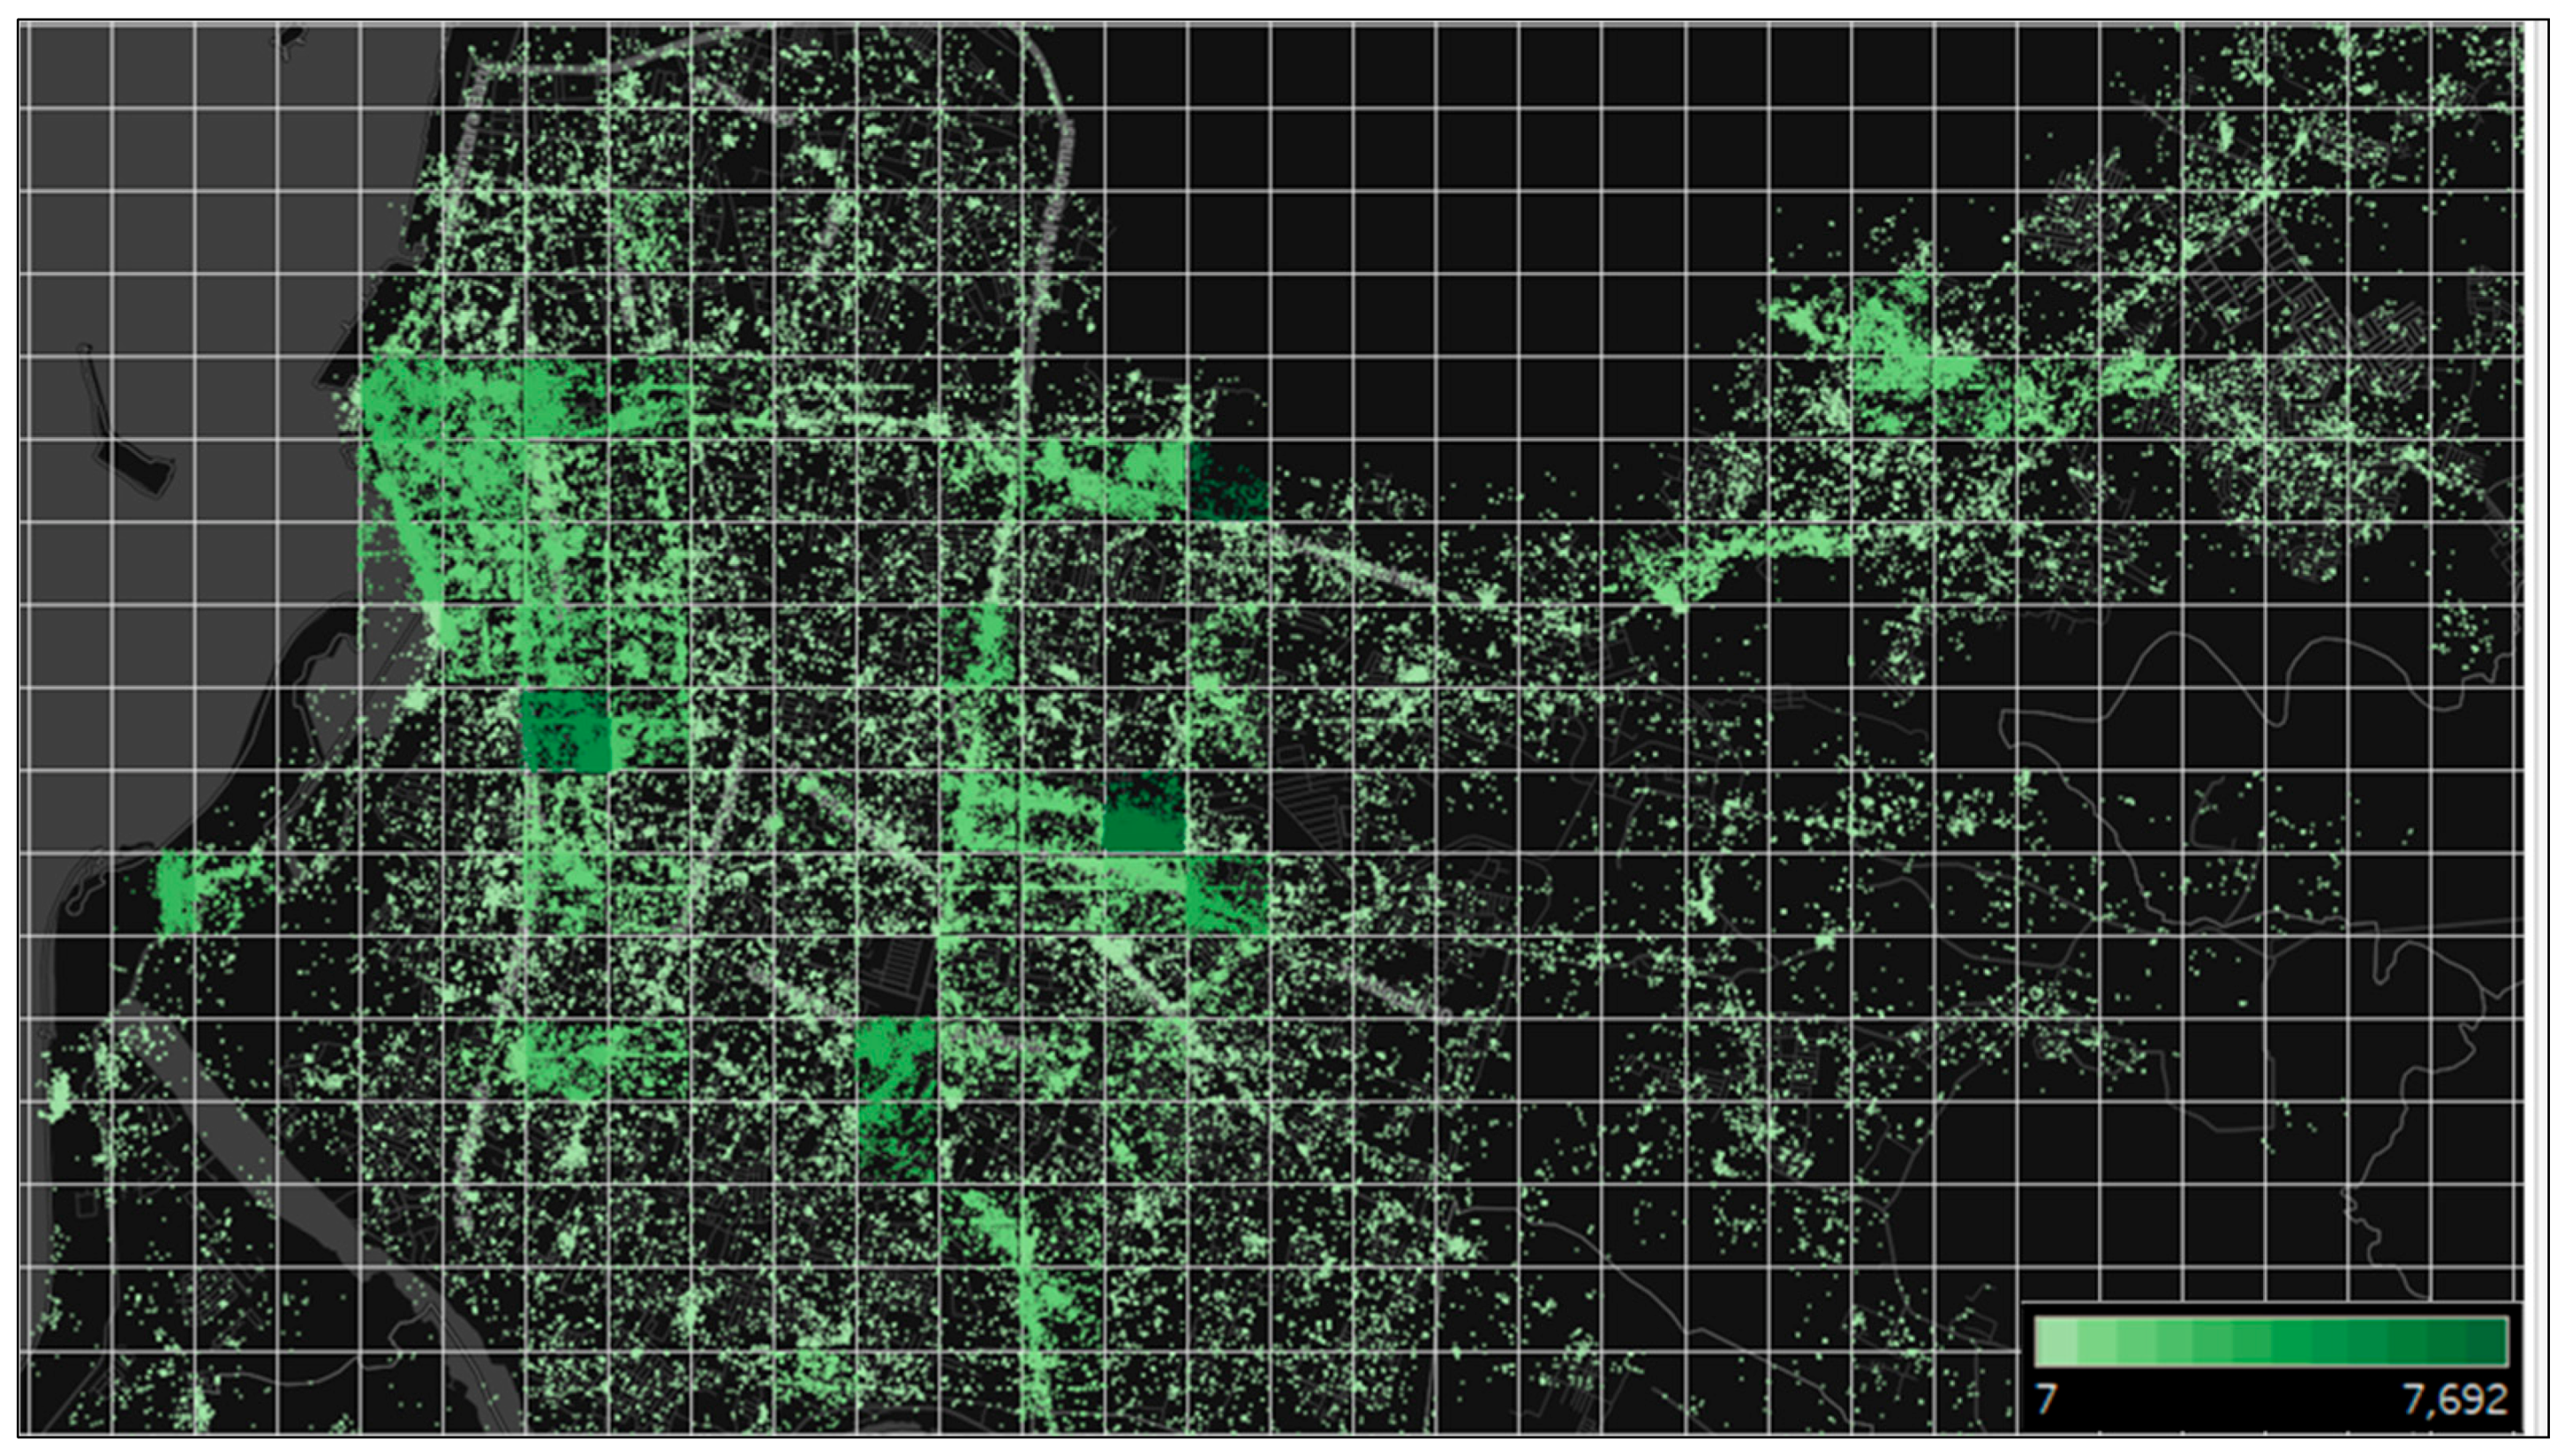
Figure 3.
Frequency distribution classes with each group of 100 check-ins.

Figure 4.
The graph results of k-means clustering in different time frequencies on weekdays and weekends. (a) Clusters’ comparison on weekdays and weekends; (b) cluster 1; (c) cluster 2; (d) cluster 3; (e) cluster 4; (f) cluster 5.
Figure 4.
The graph results of k-means clustering in different time frequencies on weekdays and weekends. (a) Clusters’ comparison on weekdays and weekends; (b) cluster 1; (c) cluster 2; (d) cluster 3; (e) cluster 4; (f) cluster 5.
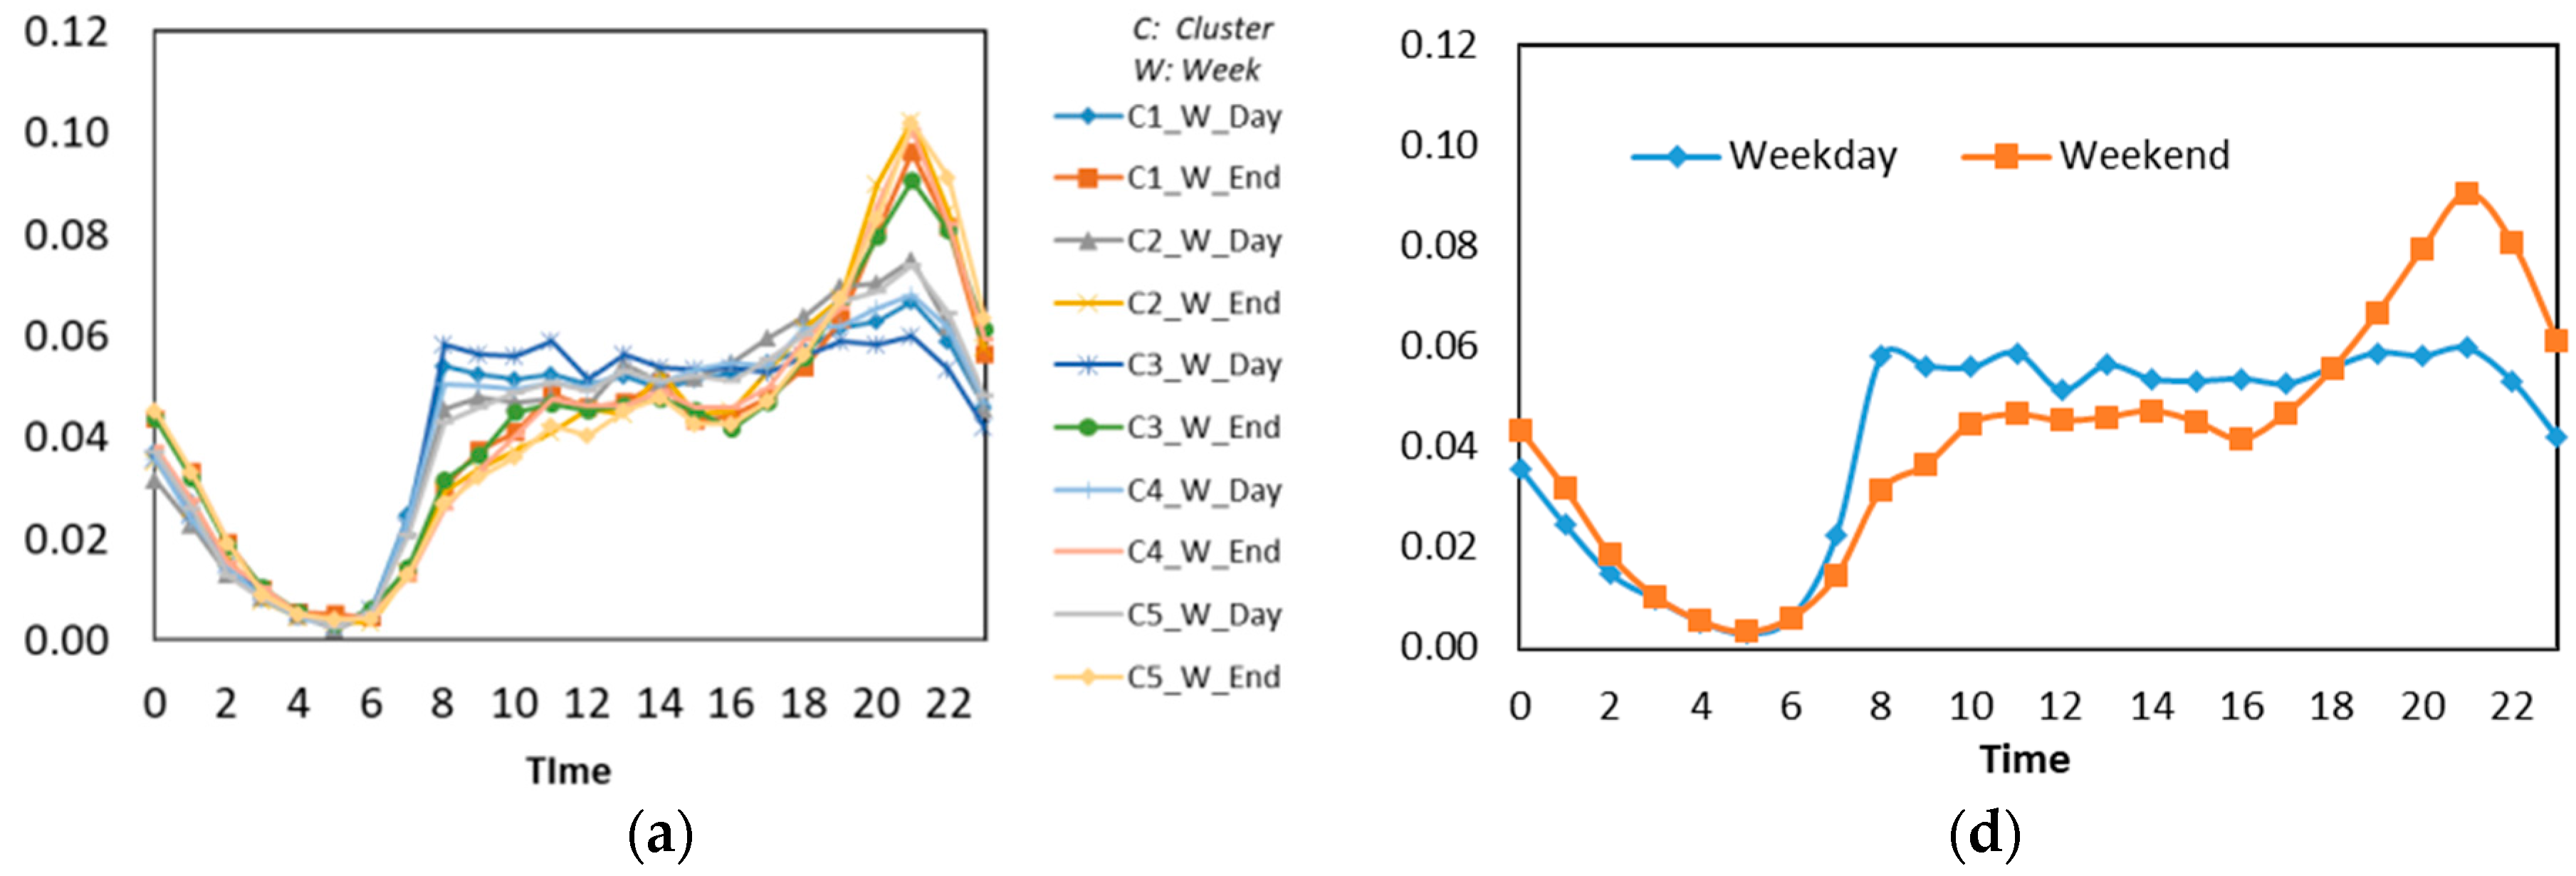

Figure 5.
Daily time distribution activity (a) and trip flow distribution for each user (b).
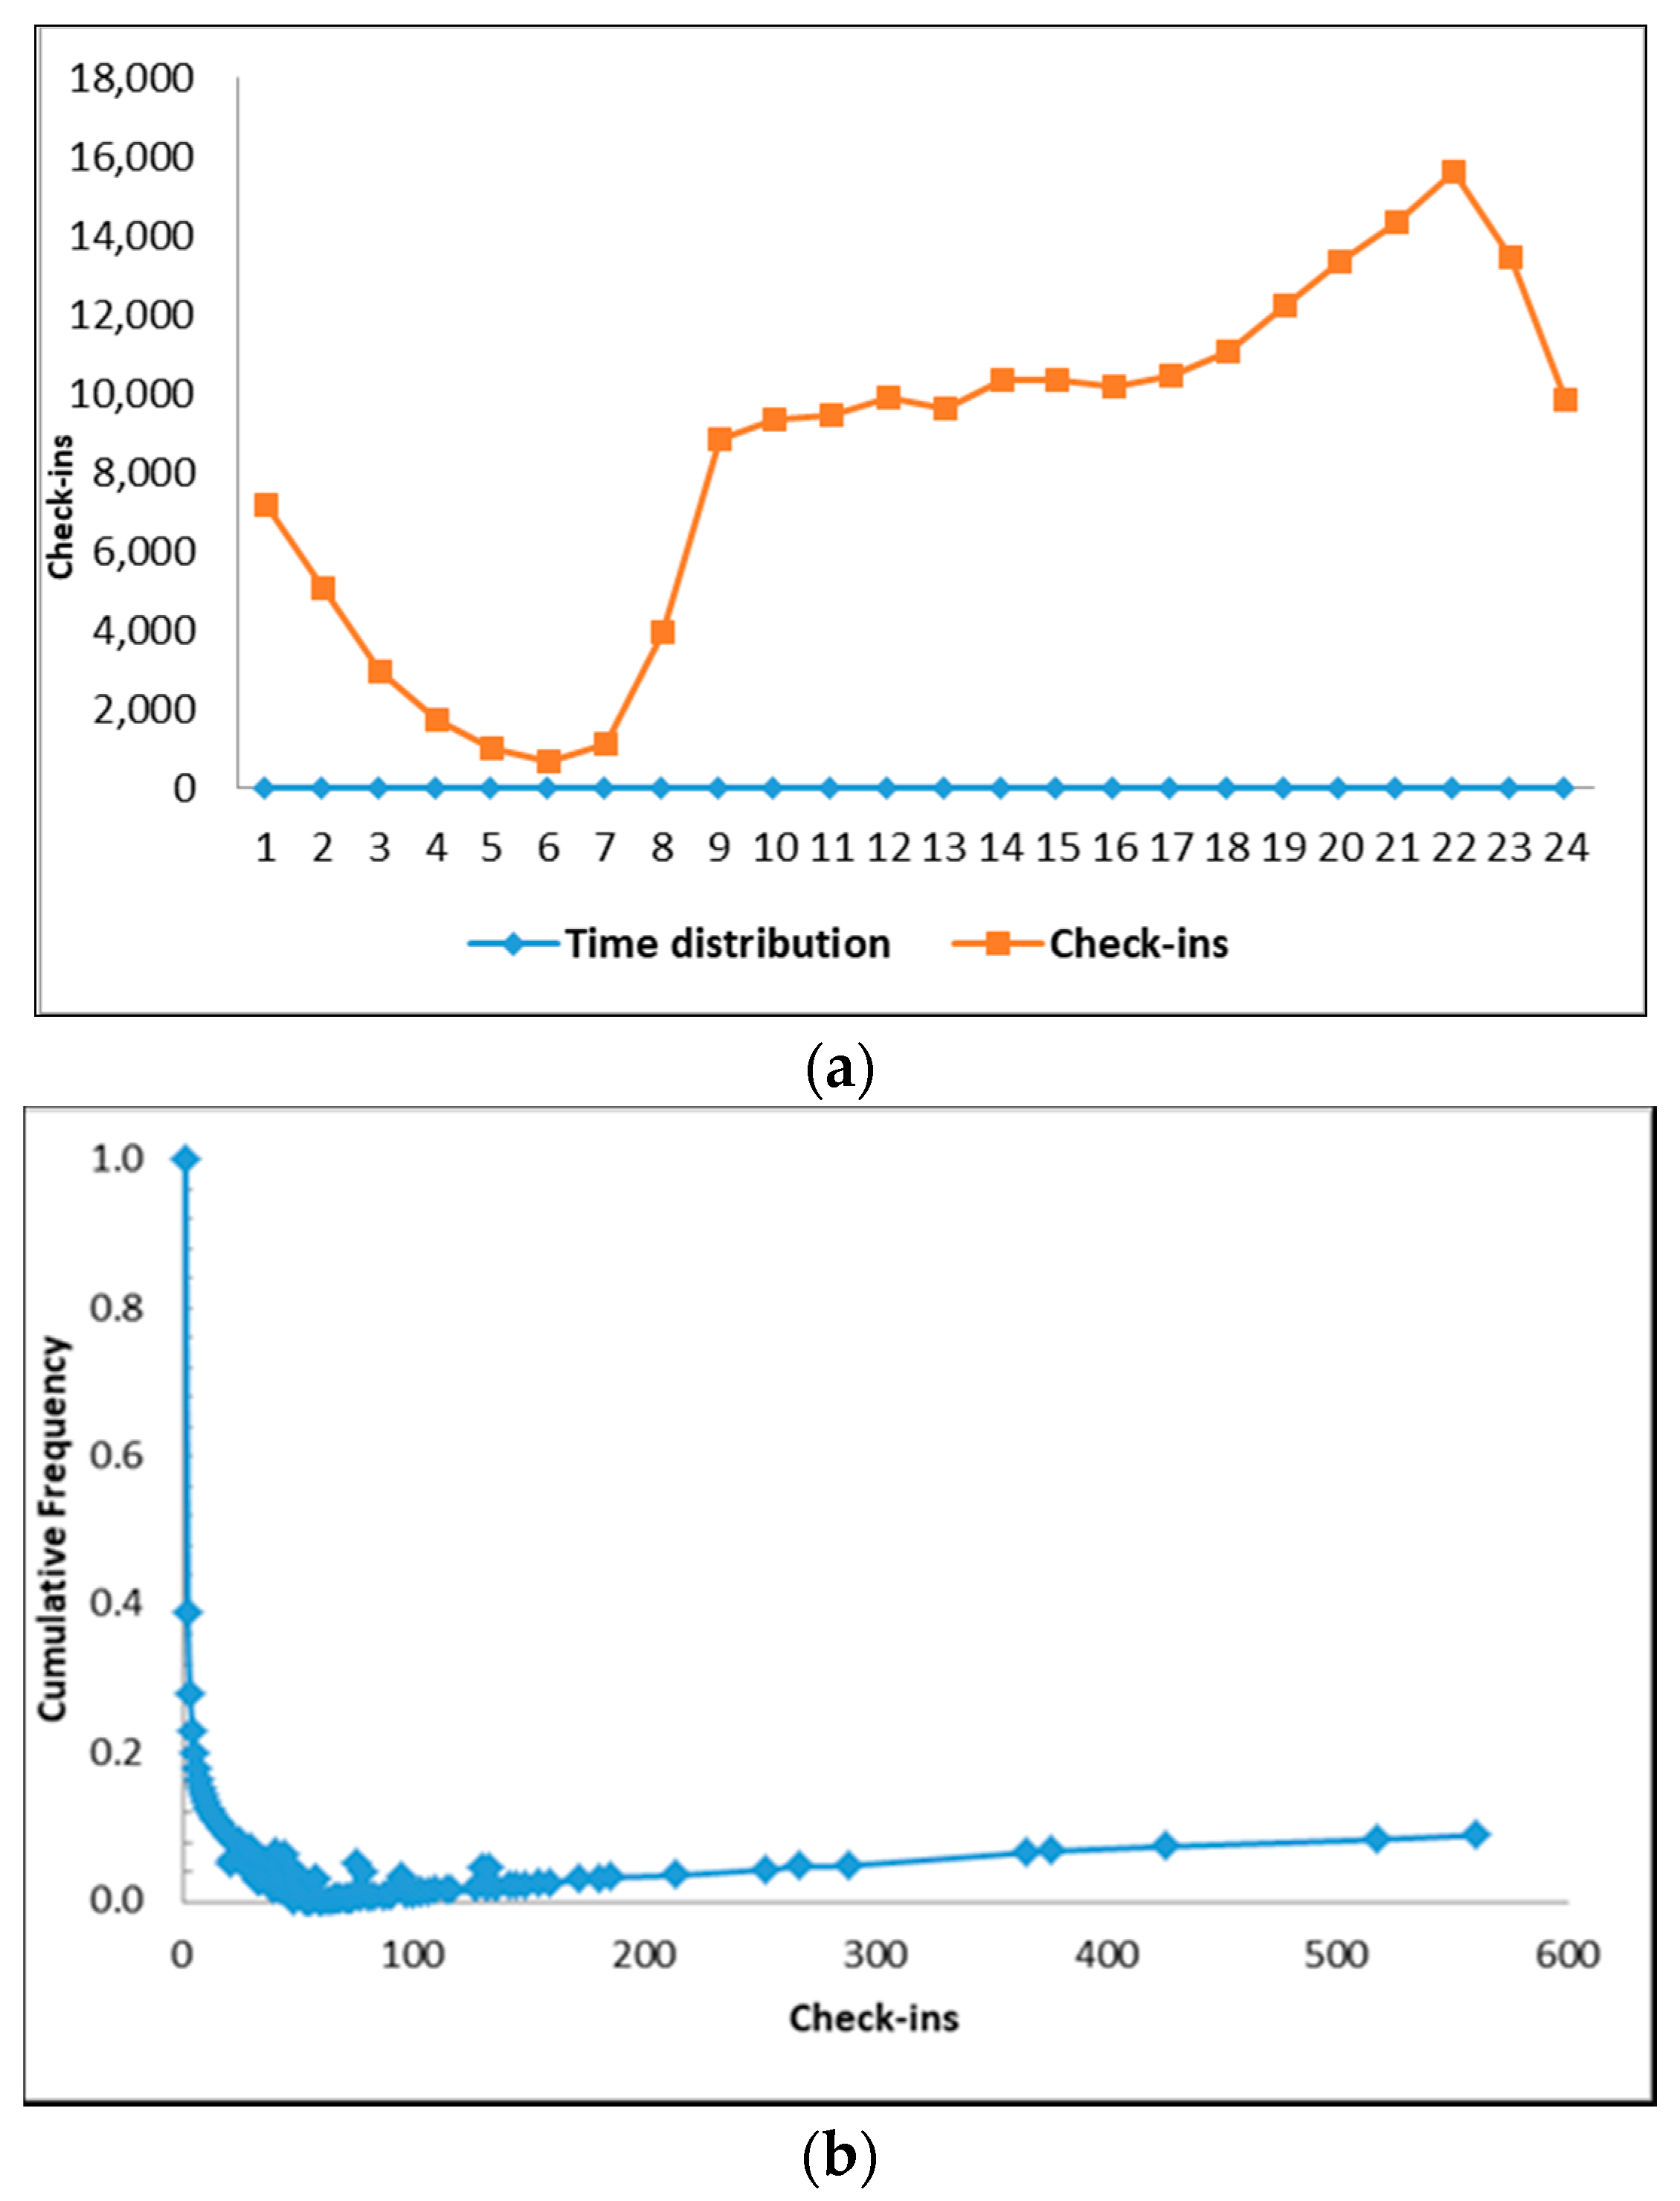
Figure 6.
The words frequency (a) and housing distribution map (b).

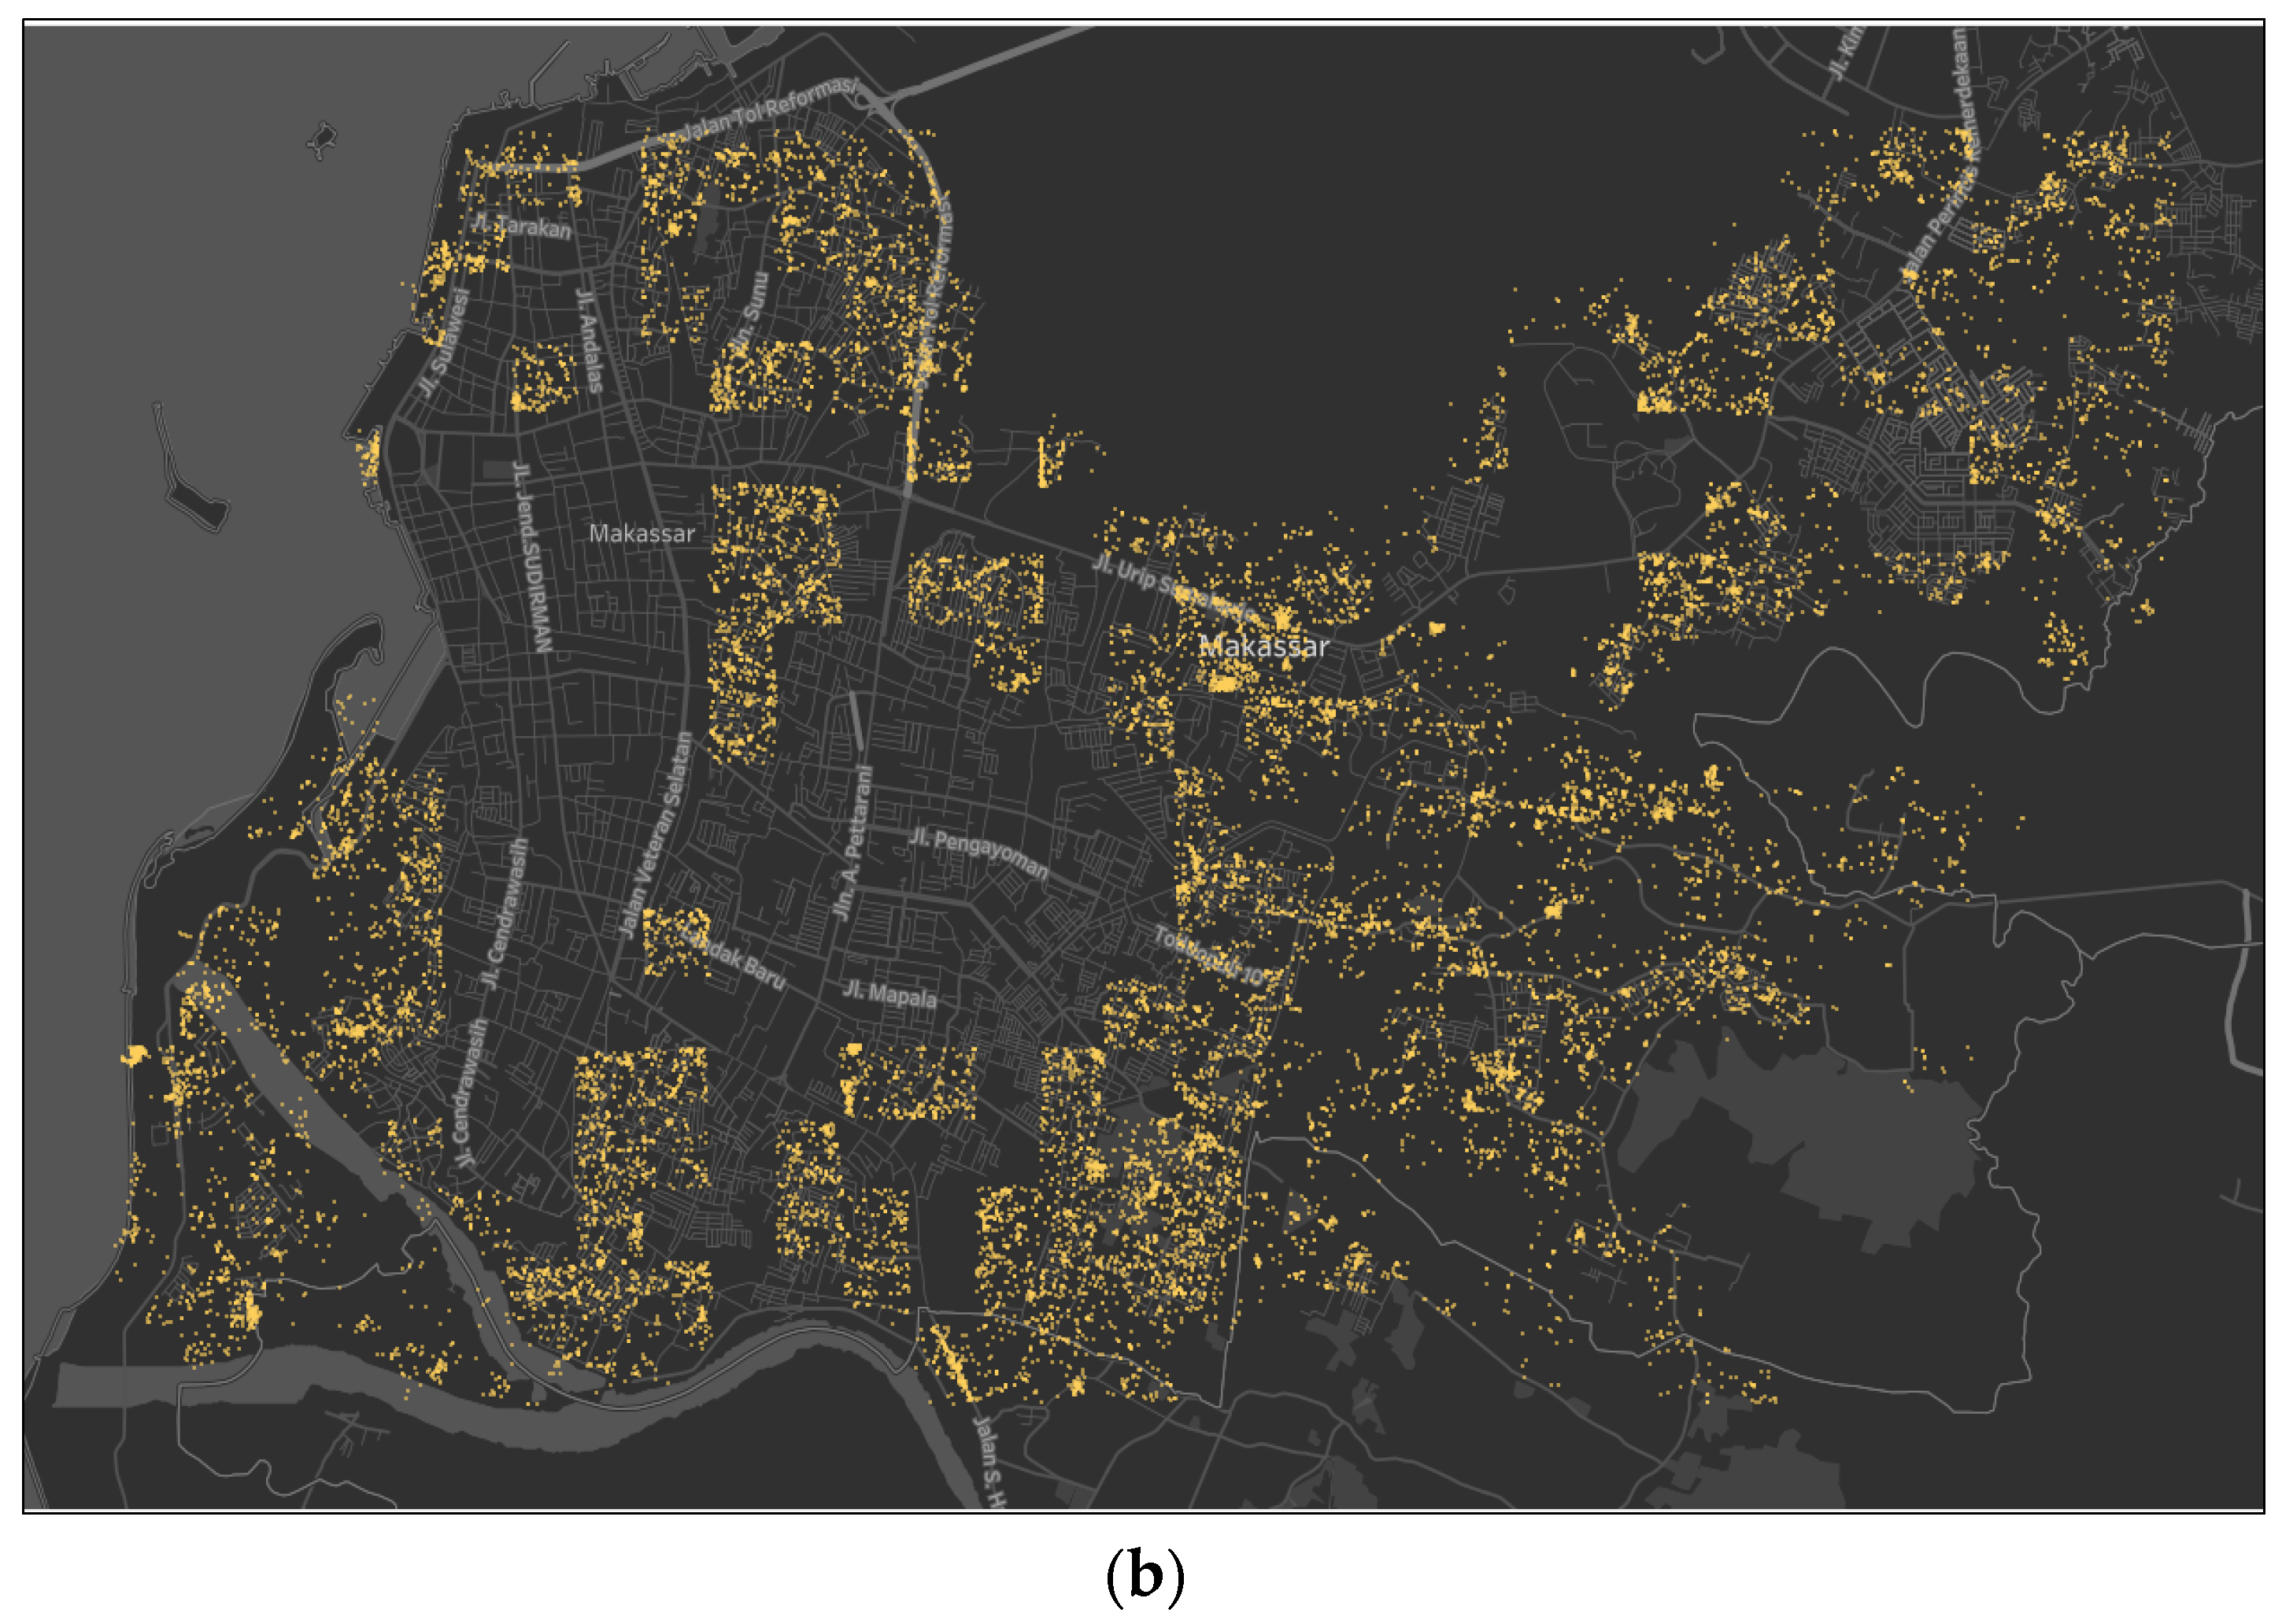
Figure 7.
The daily time spread (a) and percentage of check-ins in different places in cluster 1 (b).
Figure 7.
The daily time spread (a) and percentage of check-ins in different places in cluster 1 (b).

Figure 8.
The analysis of user text posted (a), the map of the education area (b), a graph of different visited places in the education cluster (c), and difference activity on weekdays and weekend (d).
Figure 8.
The analysis of user text posted (a), the map of the education area (b), a graph of different visited places in the education cluster (c), and difference activity on weekdays and weekend (d).

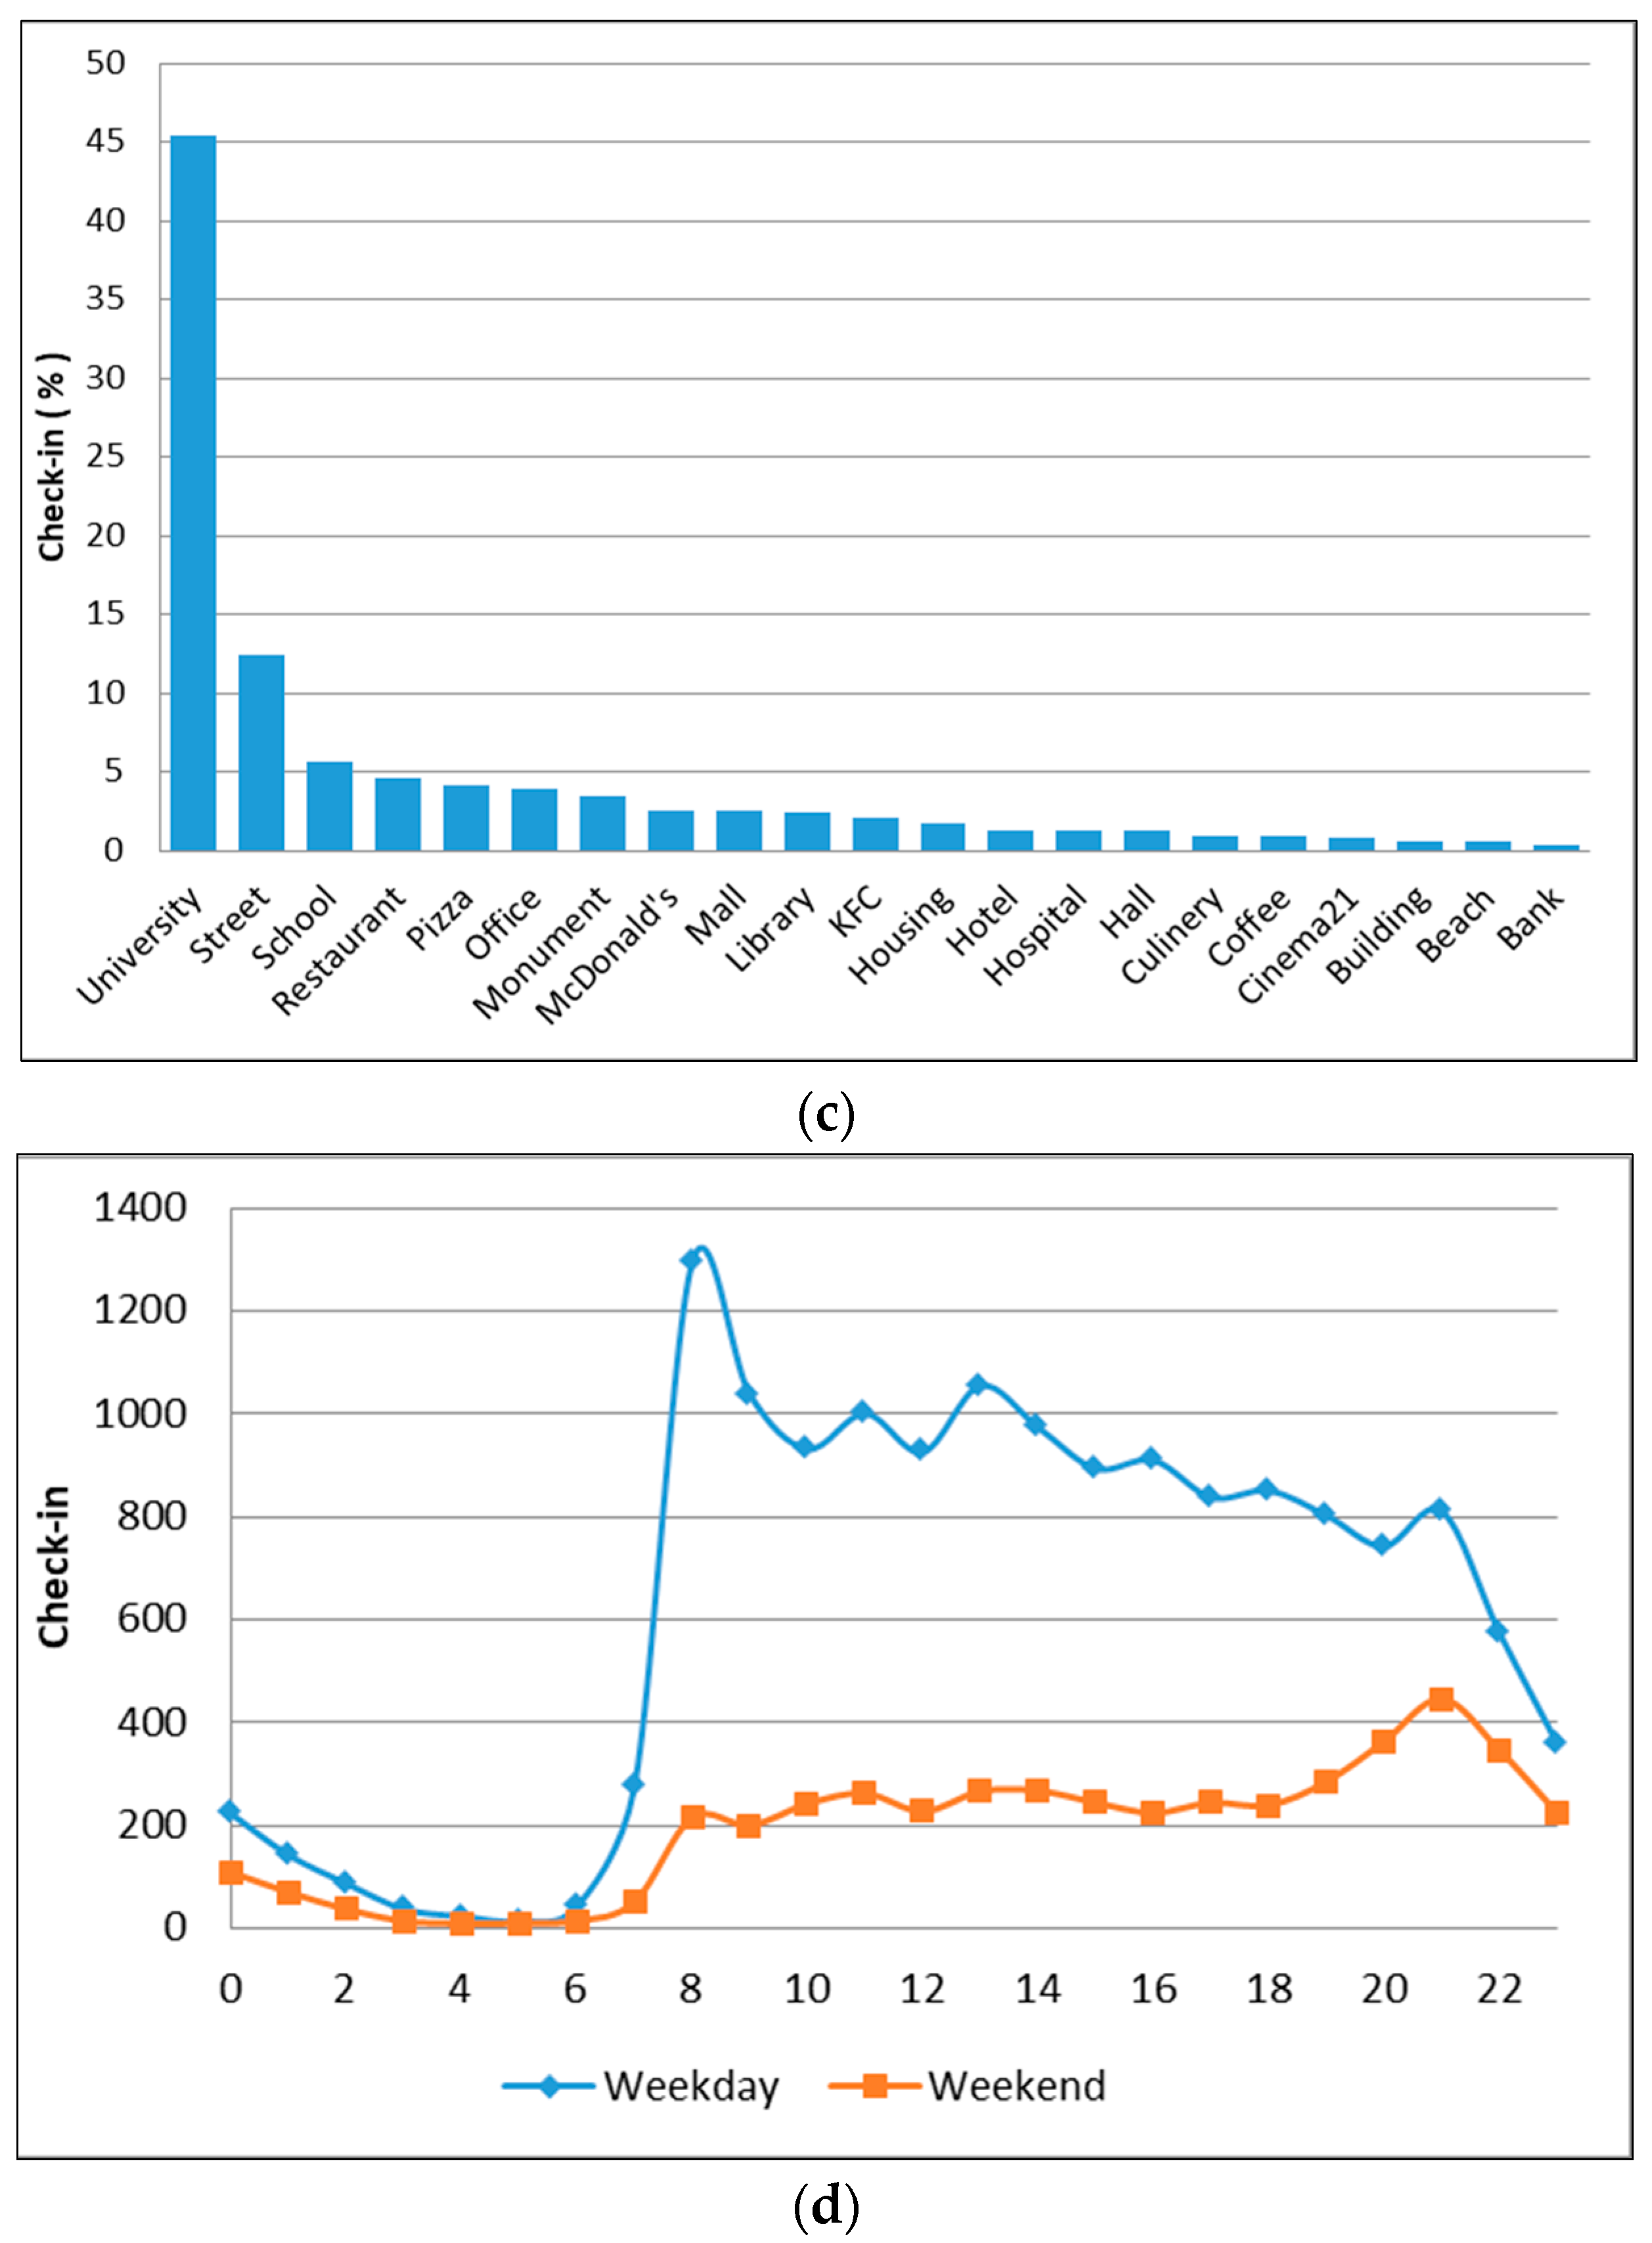
Figure 9.
The word frequency analysis (a), the user distribution map in cluster 3 (b), check-in activity in different places (c), and the time difference of user distribution on weekdays and weekends (d).
Figure 9.
The word frequency analysis (a), the user distribution map in cluster 3 (b), check-in activity in different places (c), and the time difference of user distribution on weekdays and weekends (d).

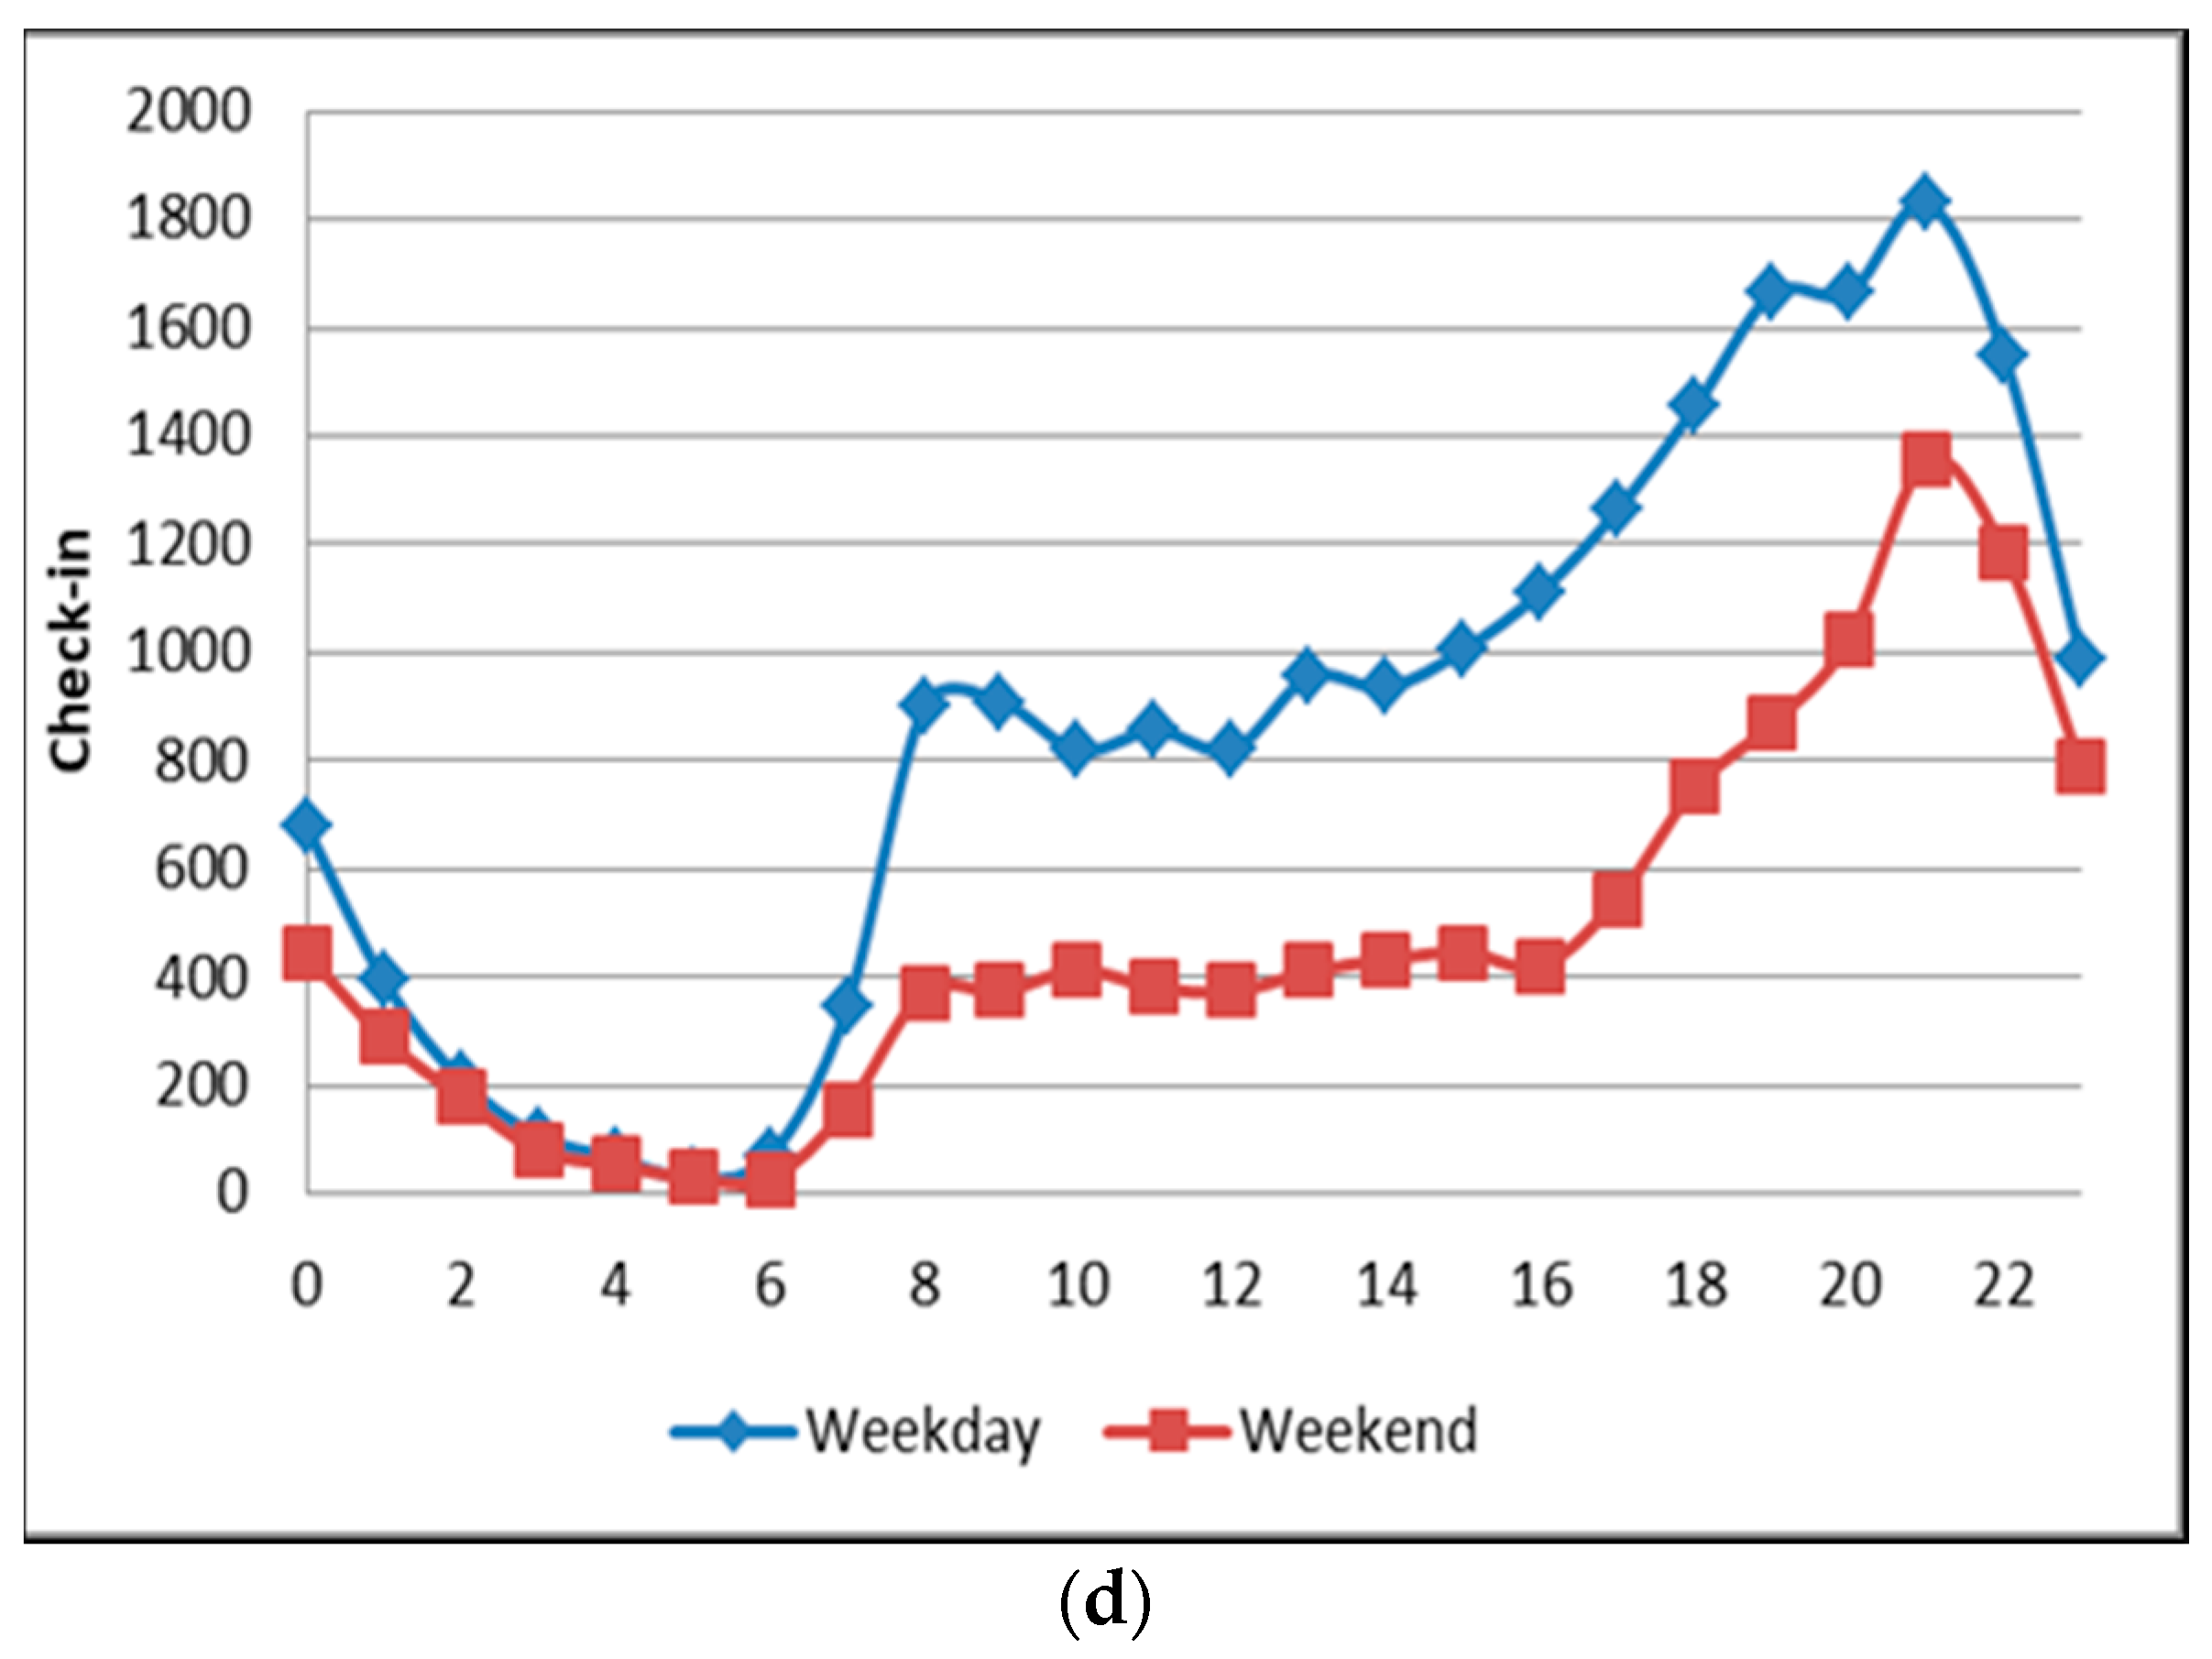
Figure 10.
The graph of check-ins at different places (a), user time deployment activity over 24 h (b), word frequency for analysis and place identification (c), and the physical layout of tweeting activity in cluster 4 (d).
Figure 10.
The graph of check-ins at different places (a), user time deployment activity over 24 h (b), word frequency for analysis and place identification (c), and the physical layout of tweeting activity in cluster 4 (d).


Figure 11.
Land use hypothesis (education, commercial and mixed area).

Table 1.
Location categories visited by user.
| Category | Place |
|---|---|
| Art and Entertainment | Cinema, street park, bar, karaoke, hall, meeting building, monument, wedding hall, fort, photography studio, radio station, television station. |
| Business and Service | Hotel, guesthouse, housing, bank, diagnostic center, pharmacy, skincare clinic, hospital, telecommunication service headquarter |
| Community and Office | Electricity company, church, office, mosque, university, school, library |
| Food and Drink | Café, coffee shop, restaurant (culinary, meatball, seafood, noodle, chicken porridge, ice cream, fried chicken, pizza, donut, steak, snack, lunch, dinner, fried rice, sushi, and udon), tea house, canteen, cake shop, kiosk/corner stand (roasted corn, and fried banana) |
| Shopping | Mall, shop, store, fresh market, bike shop, bookstore |
| Sports and Recreation | Indoor soccer field, basketball court, beach, stadium, sports area, jogging track, garden, swimming pool, field, gym |
Table 2.
K-means clustering result for land use type.
| Place | Check-In | % | Place | Check-In | % | Place | Check-In | % |
|---|---|---|---|---|---|---|---|---|
| Cluster 1 | Soccer | 597 | 0.032 | University | 11187 | 0.805 | ||
| Housing | 2974 | 19.101 | KFC | 450 | 0.024 | Cluster 4 | ||
| Mall | 1691 | 10.861 | Worship | 620 | 0.033 | Office | 2330 | 0.150 |
| Cinema | 1841 | 11.824 | Shop | 278 | 0.015 | School | 1742 | 0.112 |
| School | 1869 | 12.004 | Park | 247 | 0.013 | University | 1969 | 0.127 |
| University | 1780 | 11.432 | Seafood | 278 | 0.015 | Beach | 427 | 0.027 |
| Coffee | 1777 | 11.413 | Karaoke | 421 | 0.023 | Coffee | 3692 | 0.238 |
| Hotel | 958 | 6.153 | University | 436 | 0.023 | Hotel | 568 | 0.037 |
| McDonald’s | 958 | 6.153 | Cinema21 | 269 | 0.014 | Housing | 438 | 0.028 |
| Street | 877 | 5.633 | Hall | 658 | 0.035 | KFC | 1082 | 0.070 |
| Stadium | 845 | 5.427 | Fitness | 182 | 0.010 | Mall | 544 | 0.035 |
| Cluster 2 | Housing | 186 | 0.010 | McDonald’s | 444 | 0.029 | ||
| School | 1017 | 0.054 | Bookstore | 133 | 0.007 | Restaurant | 2309 | 0.149 |
| Hotel | 1003 | 0.054 | Hall | 680 | 0.031 | Cluster 5 | ||
| Culinary | 1372 | 0.073 | Tea | 590 | 0.027 | University | 3517 | 0.160 |
| Bank | 616 | 0.033 | Hotel | 438 | 0.020 | Restaurant | 2938 | 0.133 |
| Restaurant | 2811 | 0.151 | Meatball | 430 | 0.020 | Coffee | 2500 | 0.113 |
| Office | 1164 | 0.062 | Mall | 429 | 0.019 | Hospital | 1889 | 0.086 |
| Coffee | 963 | 0.052 | Beach | 375 | 0.017 | Culinary | 1570 | 0.071 |
| Street | 889 | 0.048 | Fort | 296 | 0.013 | Cinema21 | 1329 | 0.060 |
| Mall | 676 | 0.036 | Supermarket | 250 | 0.011 | Office | 1235 | 0.056 |
| Noodles | 1322 | 0.071 | Stadium | 191 | 0.009 | KFC | 1148 | 0.052 |
| Café | 376 | 0.020 | Cluster 3 | Street | 820 | 0.037 | ||
| Hospital | 506 | 0.027 | Housing | 1350 | 0.097 | McDonald’s | 704 | 0.032 |
| Pizza | 534 | 0.029 | Hotel | 1354 | 0.097 | Pizza | 698 | 0.032 |
Table 3.
Class partition.
| Cluster | Group Class |
|---|---|
| Cluster 1 | C100, C 200, C300, C400 |
| Cluster 2 | C500, C1200, C1300, C1400, C1500, C2200, C2300 |
| Cluster 3 | C1000, C1900, C2000, C2100, C2200, C2400, C2500, C2900, C5200 |
| Cluster 4 | C600, C700, C800, C900, C1100, C1600, C1700, C3300, C3600 |
Table 4.
Place ranking for land-use-type clustering.
| Cluster 1 | Cluster 2 | Cluster 3 | Cluster 4 | ||||
|---|---|---|---|---|---|---|---|
| Place | Check-In (%) | Place | Check-In (%) | Place | Check-In (%) | Place | Check-In (%) |
| Housing | 4324 | University | 8033 | Culinary | 2787 | Coffee | 2943 |
| 26.149 | 46.019 | 13.654 | 16.121 | ||||
| University | 2089 | Street | 2206 | Coffee | 2630 | Hotel | 2640 |
| 12.633 | 12.637 | 12.885 | 14.461 | ||||
| Coffee | 1634 | School | 996 | Restaurant | 2170 | Office | 1820 |
| 9.881 | 5.706 | 10.632 | 9.969 | ||||
| Street | 1596 | Restaurant | 814 | McDonald’s | 2008 | Culinary | 1767 |
| 9.652 | 4.663 | 9.838 | 9.679 | ||||
| Culinary | 1291 | Pizza | 728 | Hotel | 1440 | Stadium | 1205 |
| 7.807 | 4.170 | 7.055 | 6.601 | ||||
| School | 1156 | Office | 684 | KFC | 1333 | Mall | 1073 |
| 6.991 | 3.918 | 6.531 | 5.878 | ||||
| Office | 1112 | Monument | 606 | Office | 1269 | Restaurant | 1003 |
| 6.725 | 3.472 | 6.217 | 5.494 | ||||
| Restaurant | 608 | McDonald’s | 457 | Mall | 1184 | School | 873 |
| 3.677 | 2.618 | 5.801 | 4.782 | ||||
| Hospital | 341 | Mall | 440 | School | 1145 | KFC | 867 |
| 2.062 | 2.521 | 5.610 | 4.749 | ||||
| Beach | 304 | Library | 438 | University | 928 | Hall | 780 |
| 1.838 | 2.509 | 4.547 | 4.273 | ||||
| Park | 286 | KFC | 371 | Stadium | 523 | Cinema21 | 672 |
| 1.730 | 2.125 | 2.562 | 3.681 | ||||
| Office | 277 | Housing | 307 | Hospital | 440 | Street | 555 |
| 1.675 | 1.759 | 2.156 | 3.040 | ||||
| KFC | 268 | Hotel | 233 | Beach | 438 | Hospital | 510 |
| 1.621 | 1.335 | 2.146 | 2.794 | ||||
| Hotel | 259 | Hospital | 228 | Street | 370 | McDonald’s | 390 |
| 1.566 | 1.306 | 1.813 | 2.136 | ||||
| Soccer | 244 | Hall | 222 | Cinema | 364 | University | 314 |
| 1.476 | 1.272 | 1.783 | 1.720 | ||||
| Seafood | 225 | Culinary | 164 | Pizza | 329 | Pizza | 283 |
| 1.361 | 0.940 | 1.612 | 1.550 | ||||
| Mosque | 180 | Coffee | 161 | Bar | 318 | Corner | 174 |
| 1.089 | 0.922 | 1.558 | 0.953 | ||||
| Building | 154 | Cinema21 | 152 | Karaoke | 256 | Fresh market | 142 |
| 0.931 | 0.871 | 1.254 | 0.778 | ||||
| Shop | 96 | Building | 109 | Monument | 243 | Bank | 123 |
| 0.581 | 0.624 | 1.191 | 0.674 | ||||
| Hall | 92 | Beach | 107 | Supermarket | 236 | Building | 122 |
| 0.556 | 0.613 | 1.156 | 0.668 | ||||
© 2017 by the authors. Licensee MDPI, Basel, Switzerland. This article is an open access article distributed under the terms and conditions of the Creative Commons Attribution (CC BY) license (http://creativecommons.org/licenses/by/4.0/).
Share and Cite
MDPI and ACS Style
Yuyun; Akhmad Nuzir, F.; Julien Dewancker, B. Dynamic Land-Use Map Based on Twitter Data. Sustainability 2017, 9, 2158. https://doi.org/10.3390/su9122158
AMA Style
Yuyun, Akhmad Nuzir F, Julien Dewancker B. Dynamic Land-Use Map Based on Twitter Data. Sustainability. 2017; 9(12):2158. https://doi.org/10.3390/su9122158
Chicago/Turabian StyleYuyun, Fritz Akhmad Nuzir, and Bart Julien Dewancker. 2017. "Dynamic Land-Use Map Based on Twitter Data" Sustainability 9, no. 12: 2158. https://doi.org/10.3390/su9122158
Note that from the first issue of 2016, this journal uses article numbers instead of page numbers. See further details here.