Sustainable Block Design Process for High-Rise and High-Density Districts with Snow and Wind Simulations for Winter Cities

 and
and
Abstract
:1. Introduction
2. Method
2.1. Sustainable Urban Design Approach
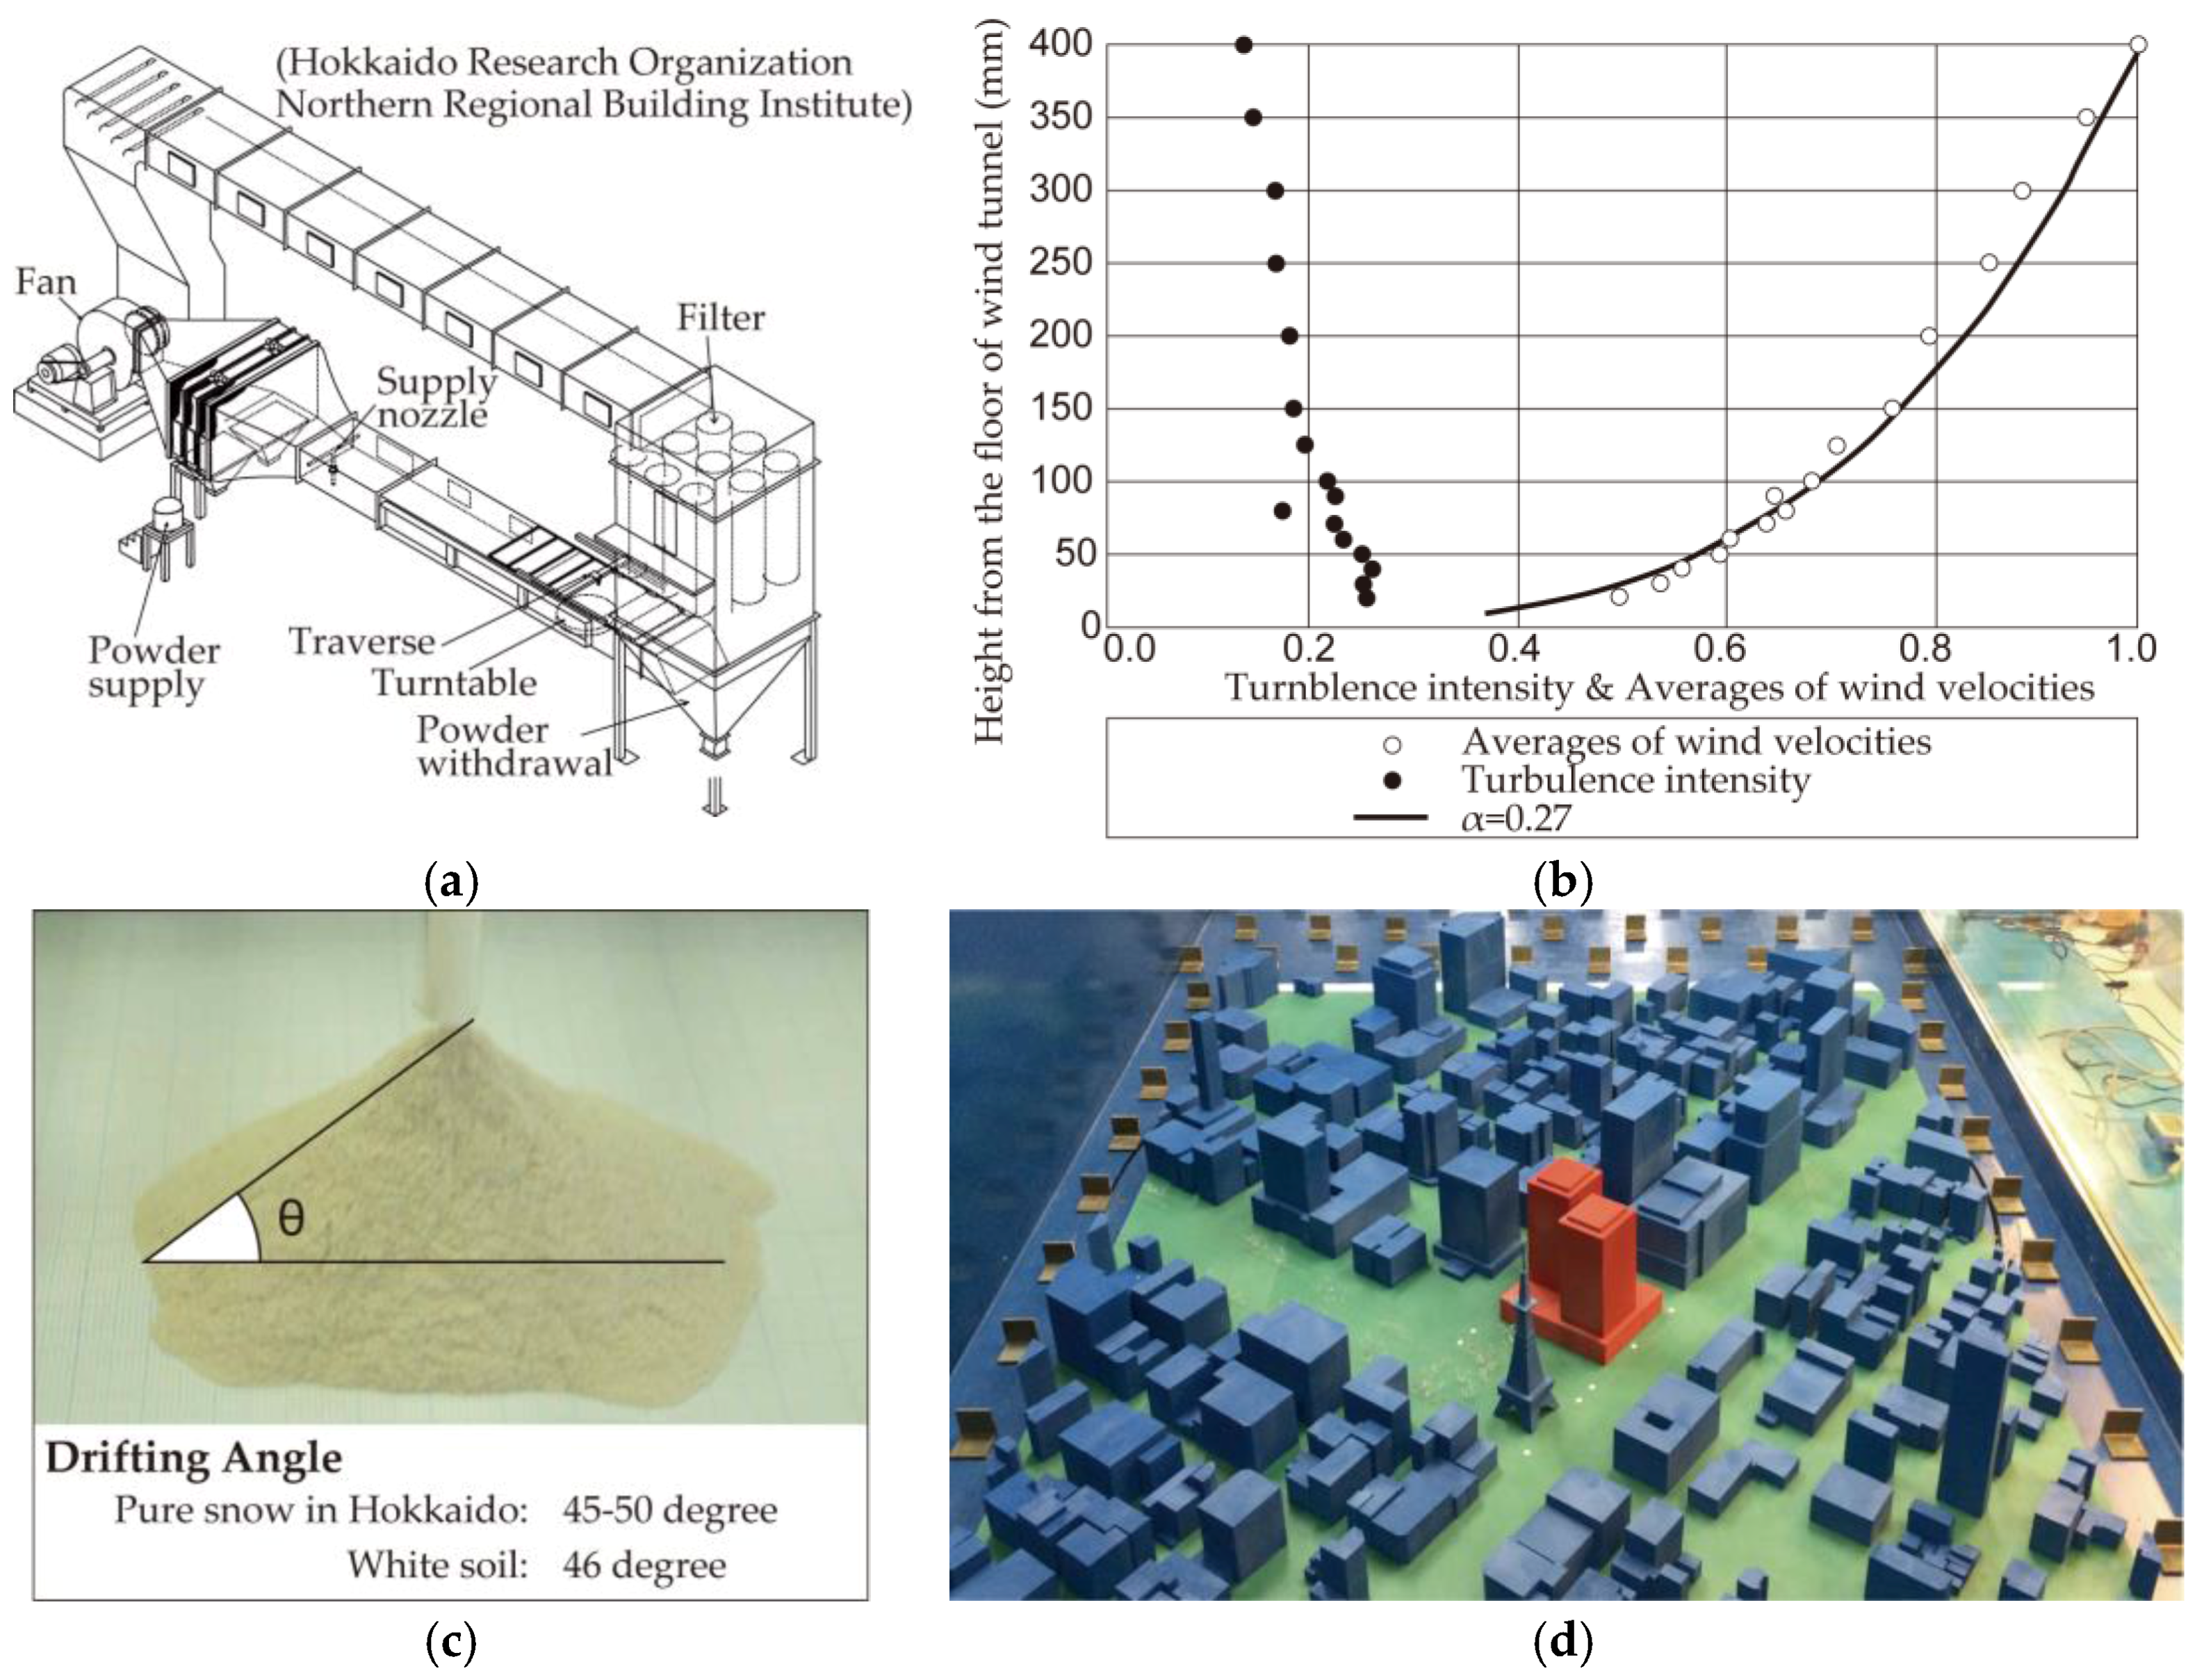
2.2. Snow Simulation
2.3. Wind Simulation
2.4. Building Models
2.5. Snow Removal Energy Consumption
- (1)
- Transportation: The weight of the snow was calculated using the amount of snow in the street and the density of snow in Sapporo (393.9 kg/m3; 2 in Table 3). By assuming that the snow was hauled by 10 t trucks, the number of truckloads required could be calculated using the weight of the snow (3 in Table 3). A trip to the target area and the nearest snow-piling space and back to the target area was of 10.0 km. The fuel consumed by one truck using gas oil is 2.5 km/L, and the caloric value of gas oil is 37.7 MJ/t. The amount of CO2 emitted in order to transport the snow was calculated using the CO2 emission rate of gas oil (2.58 kgCO2/L). The above estimation method showed the required energy and CO2 emissions to transport the snow (6 and 7 in Table 3).
- (2)
- Melting: The weight of the snow was calculated using the amounts of snow on the sidewalks and in the open spaces along with the density of the snow in Sapporo (9 in Table 3). The energy required to melt the snow was calculated using the weight of the snow, the fusion heat of snow (333 MJ/L), the efficiency of the heating of a road (20%), the caloric value of the heating oil (36.7 MJ/L), and the amount of CO2 emitted by the heating oil (2.58 kgCO2/L). The above estimation indicated the required energy and CO2 emissions to melt the snow (11 and 13 in Table 3).
3. Downtown Sapporo Case Study
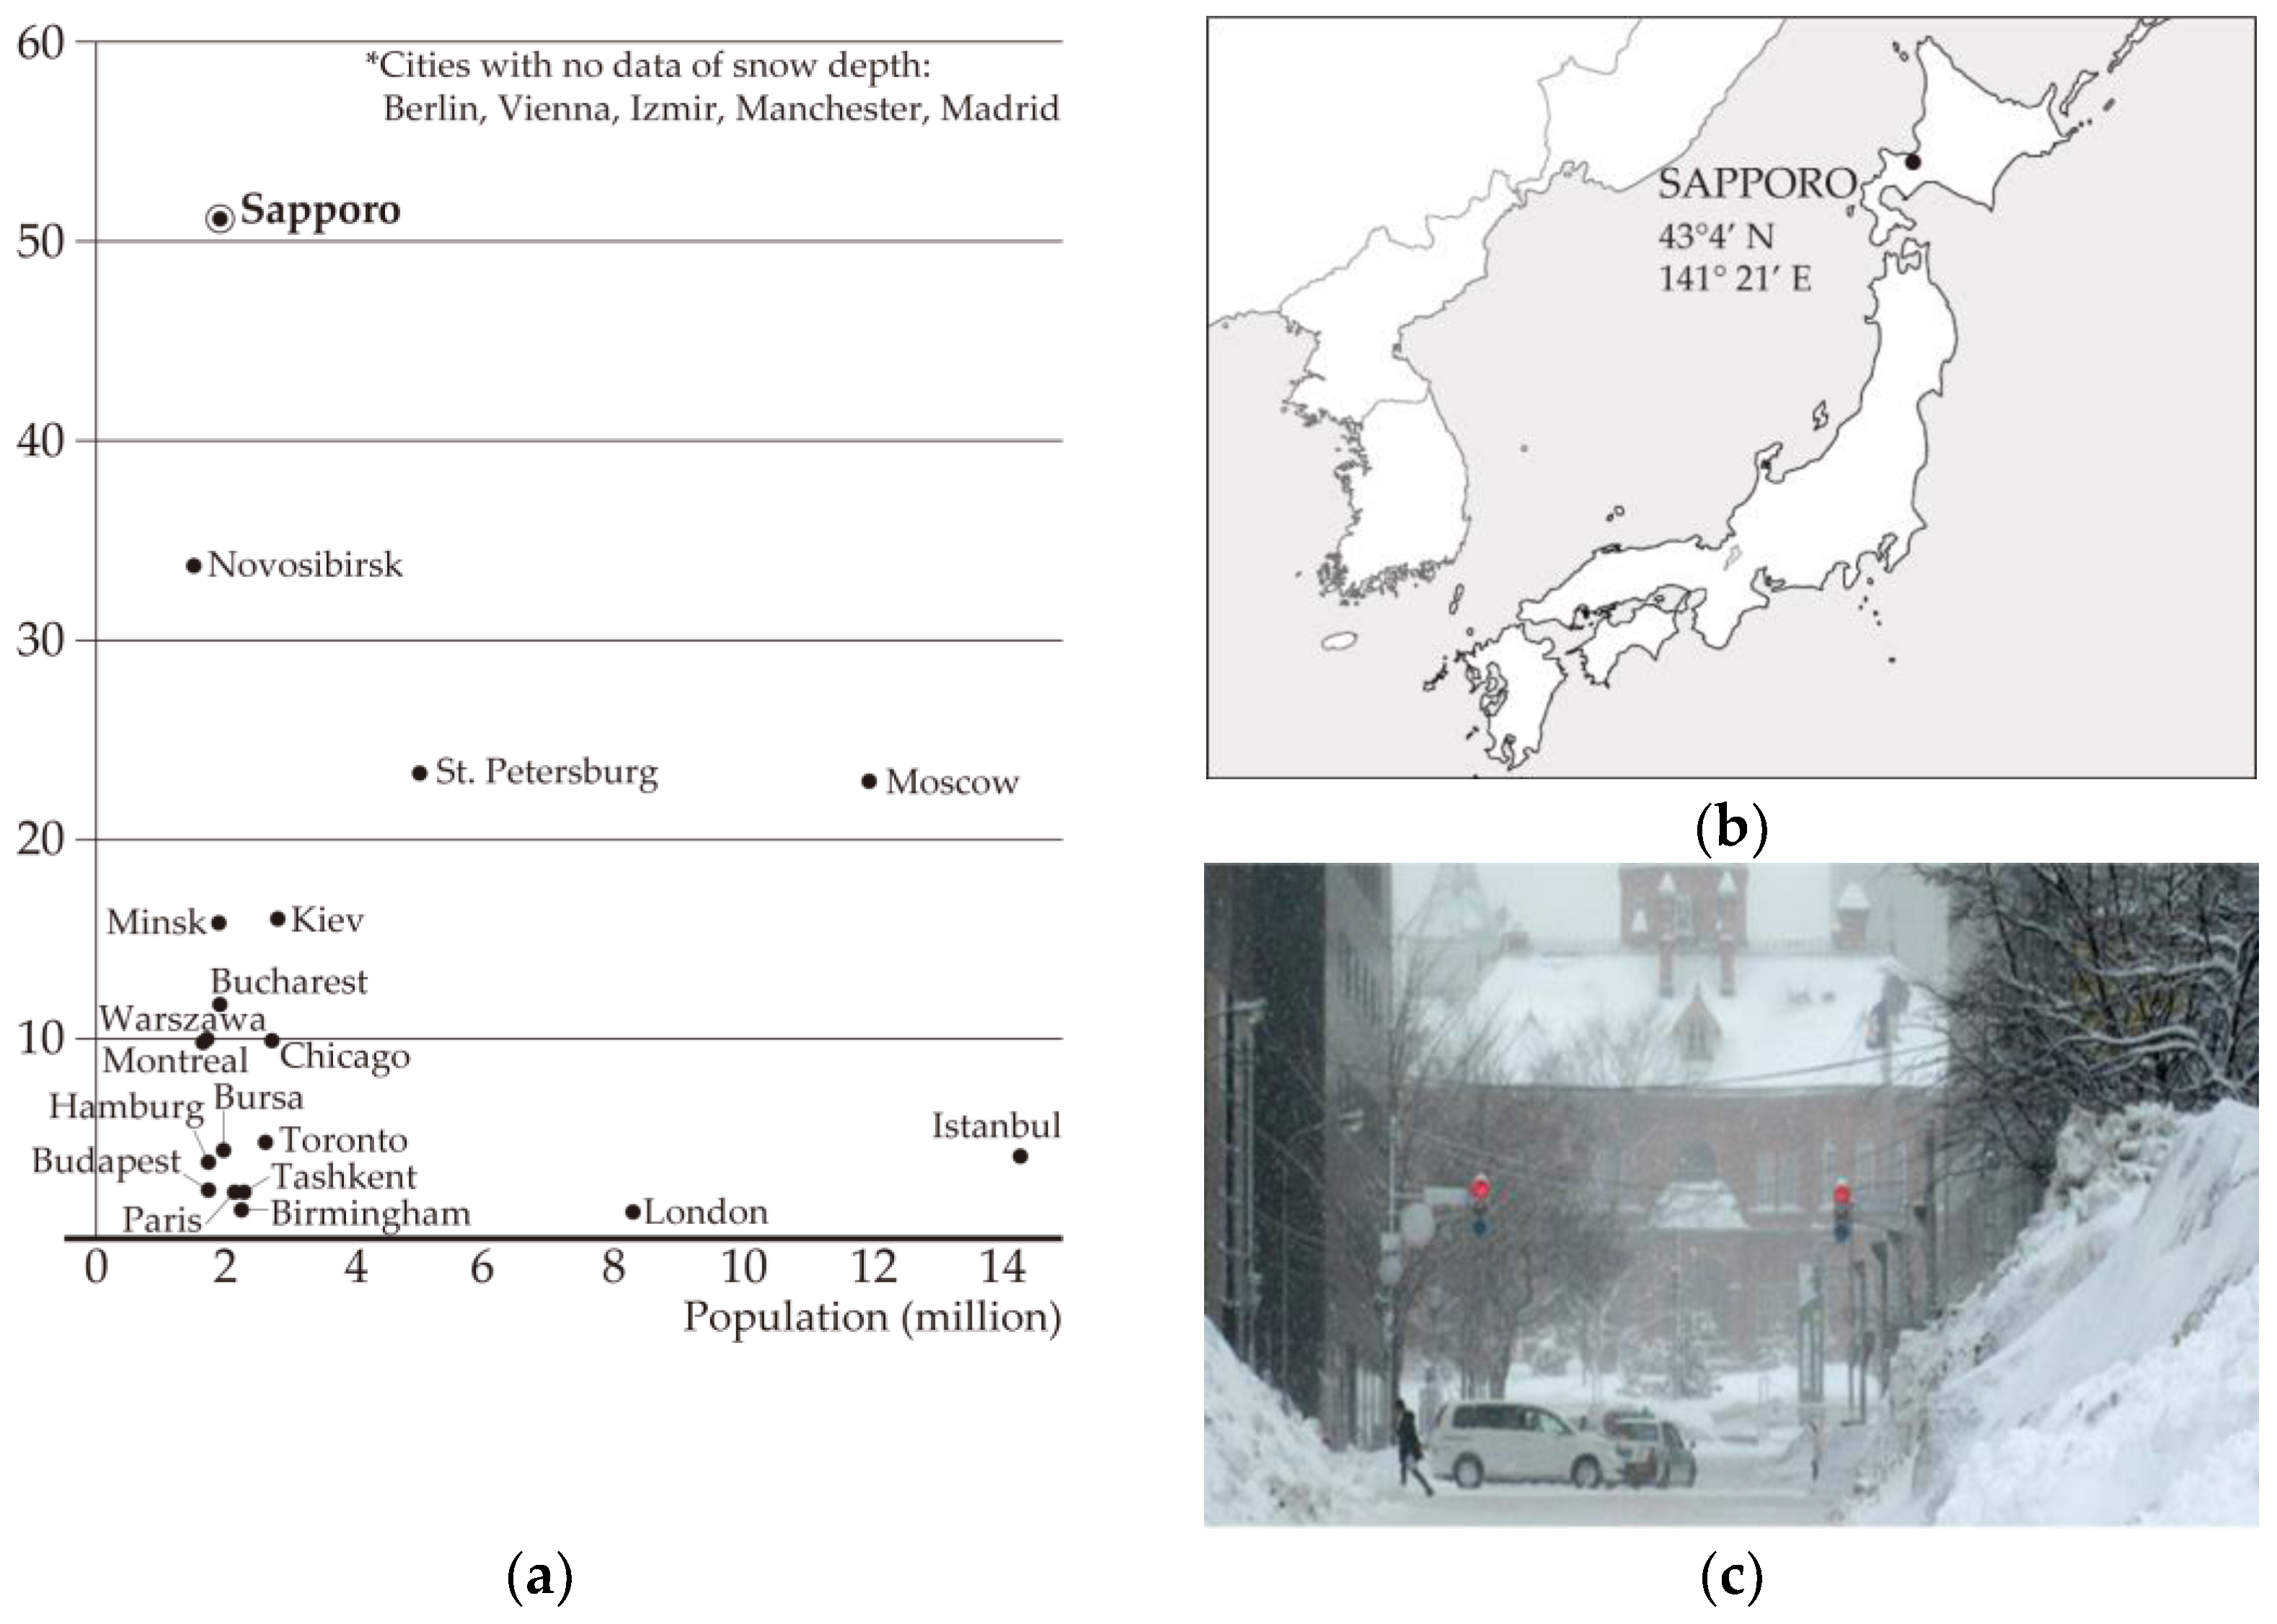
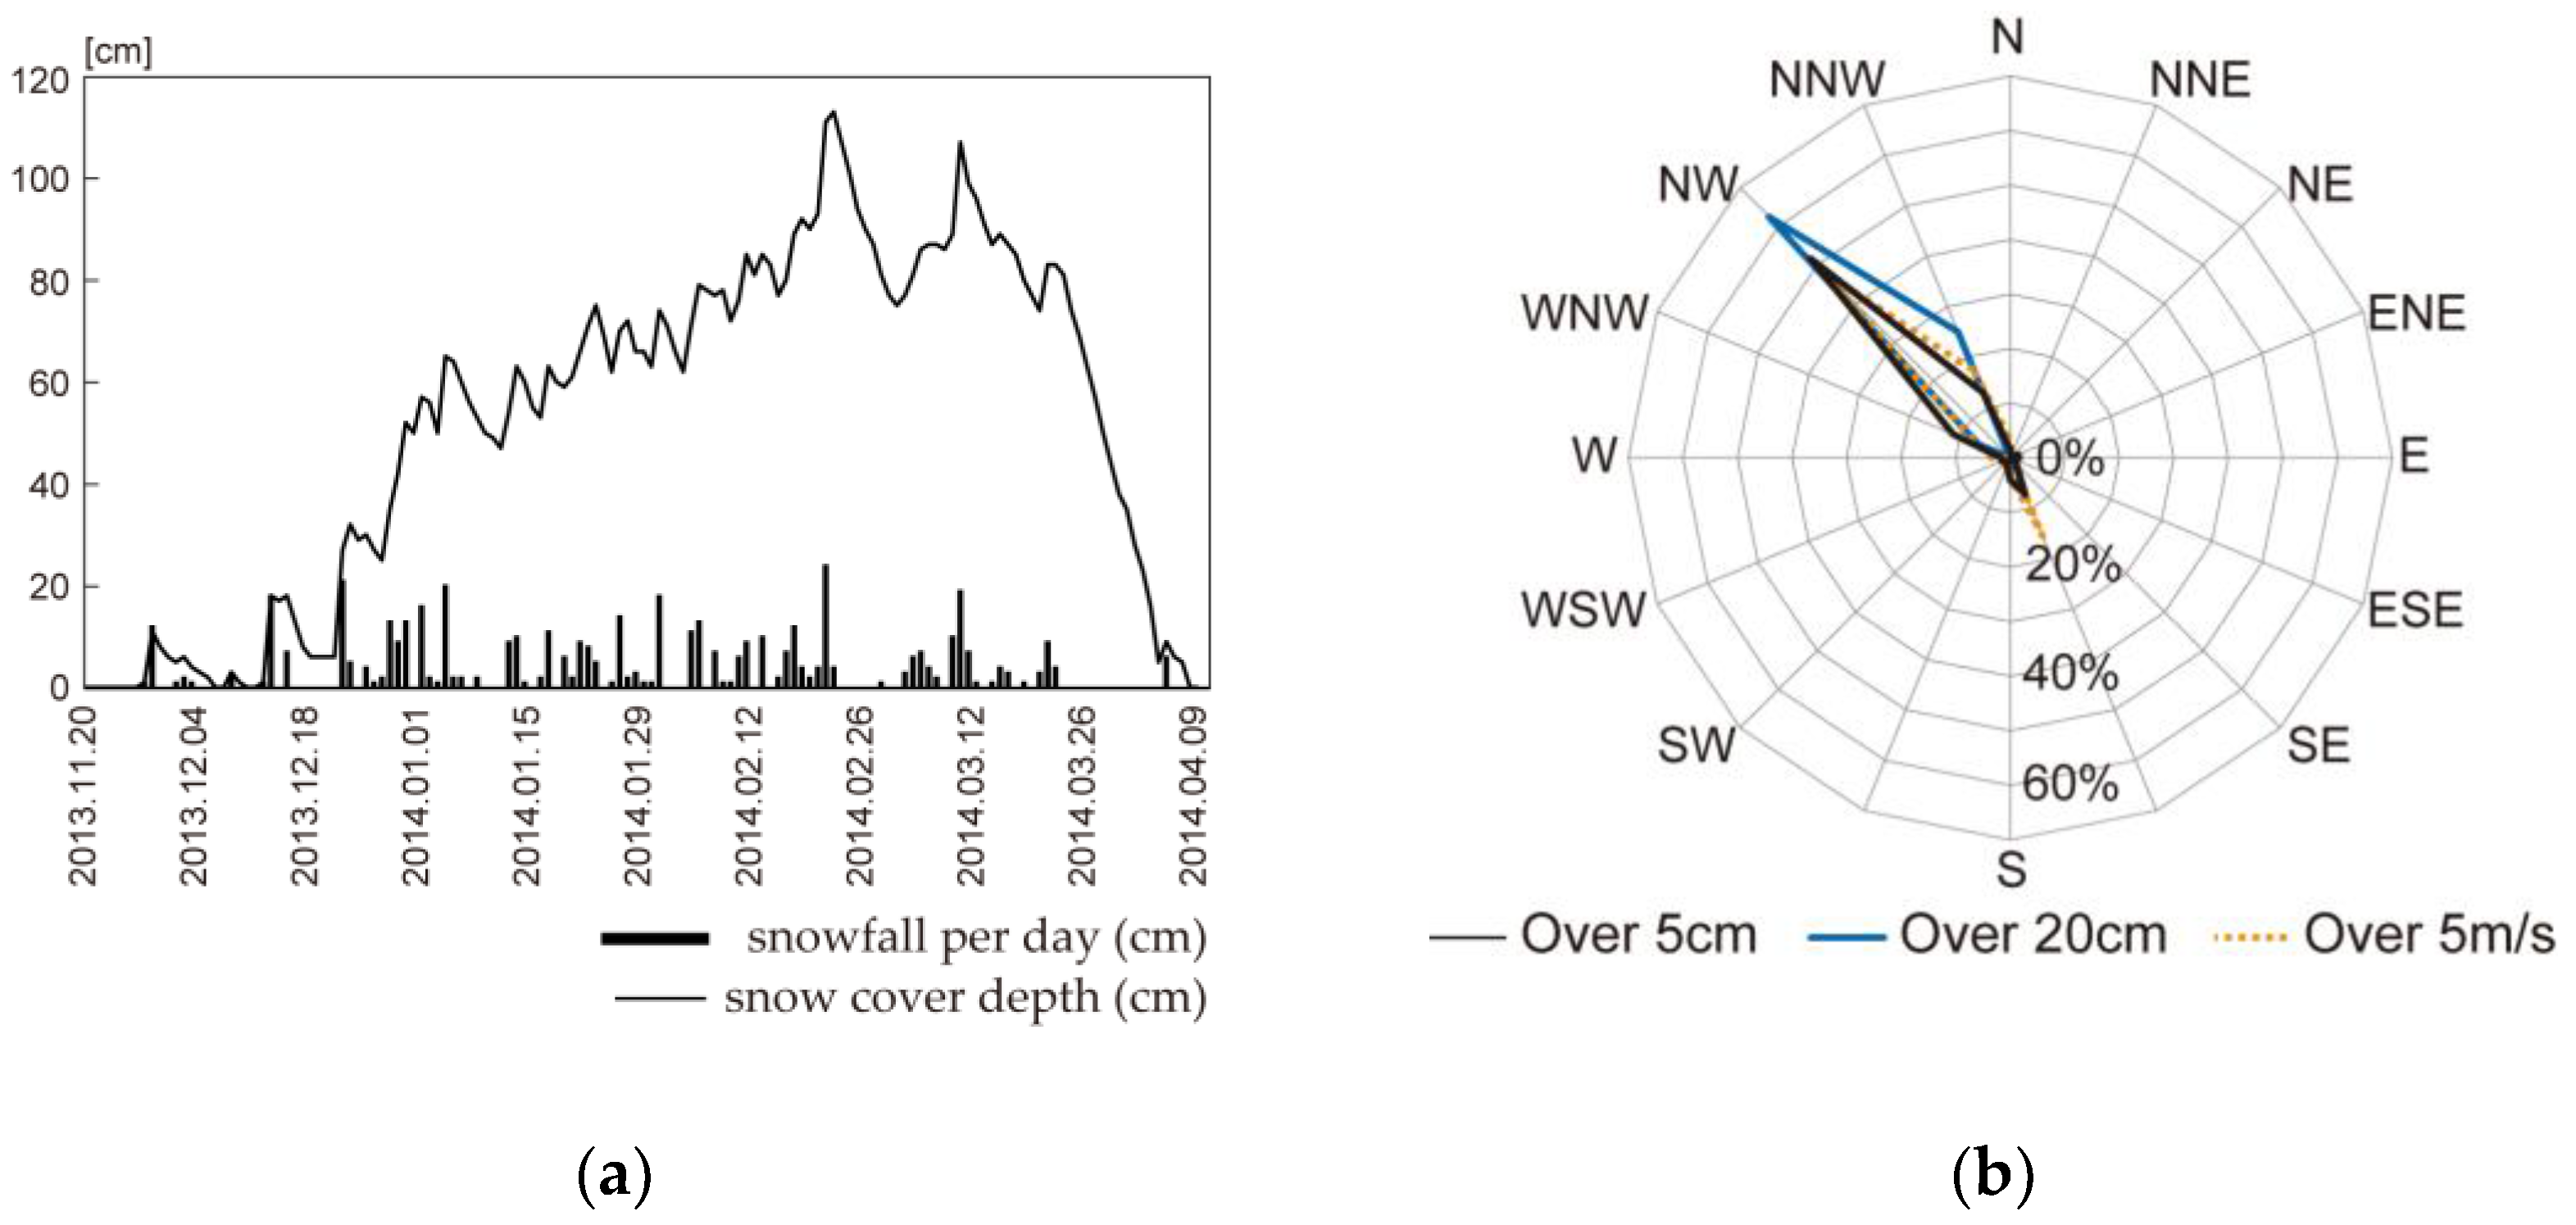
3.1. Winter Climate in Sapporo
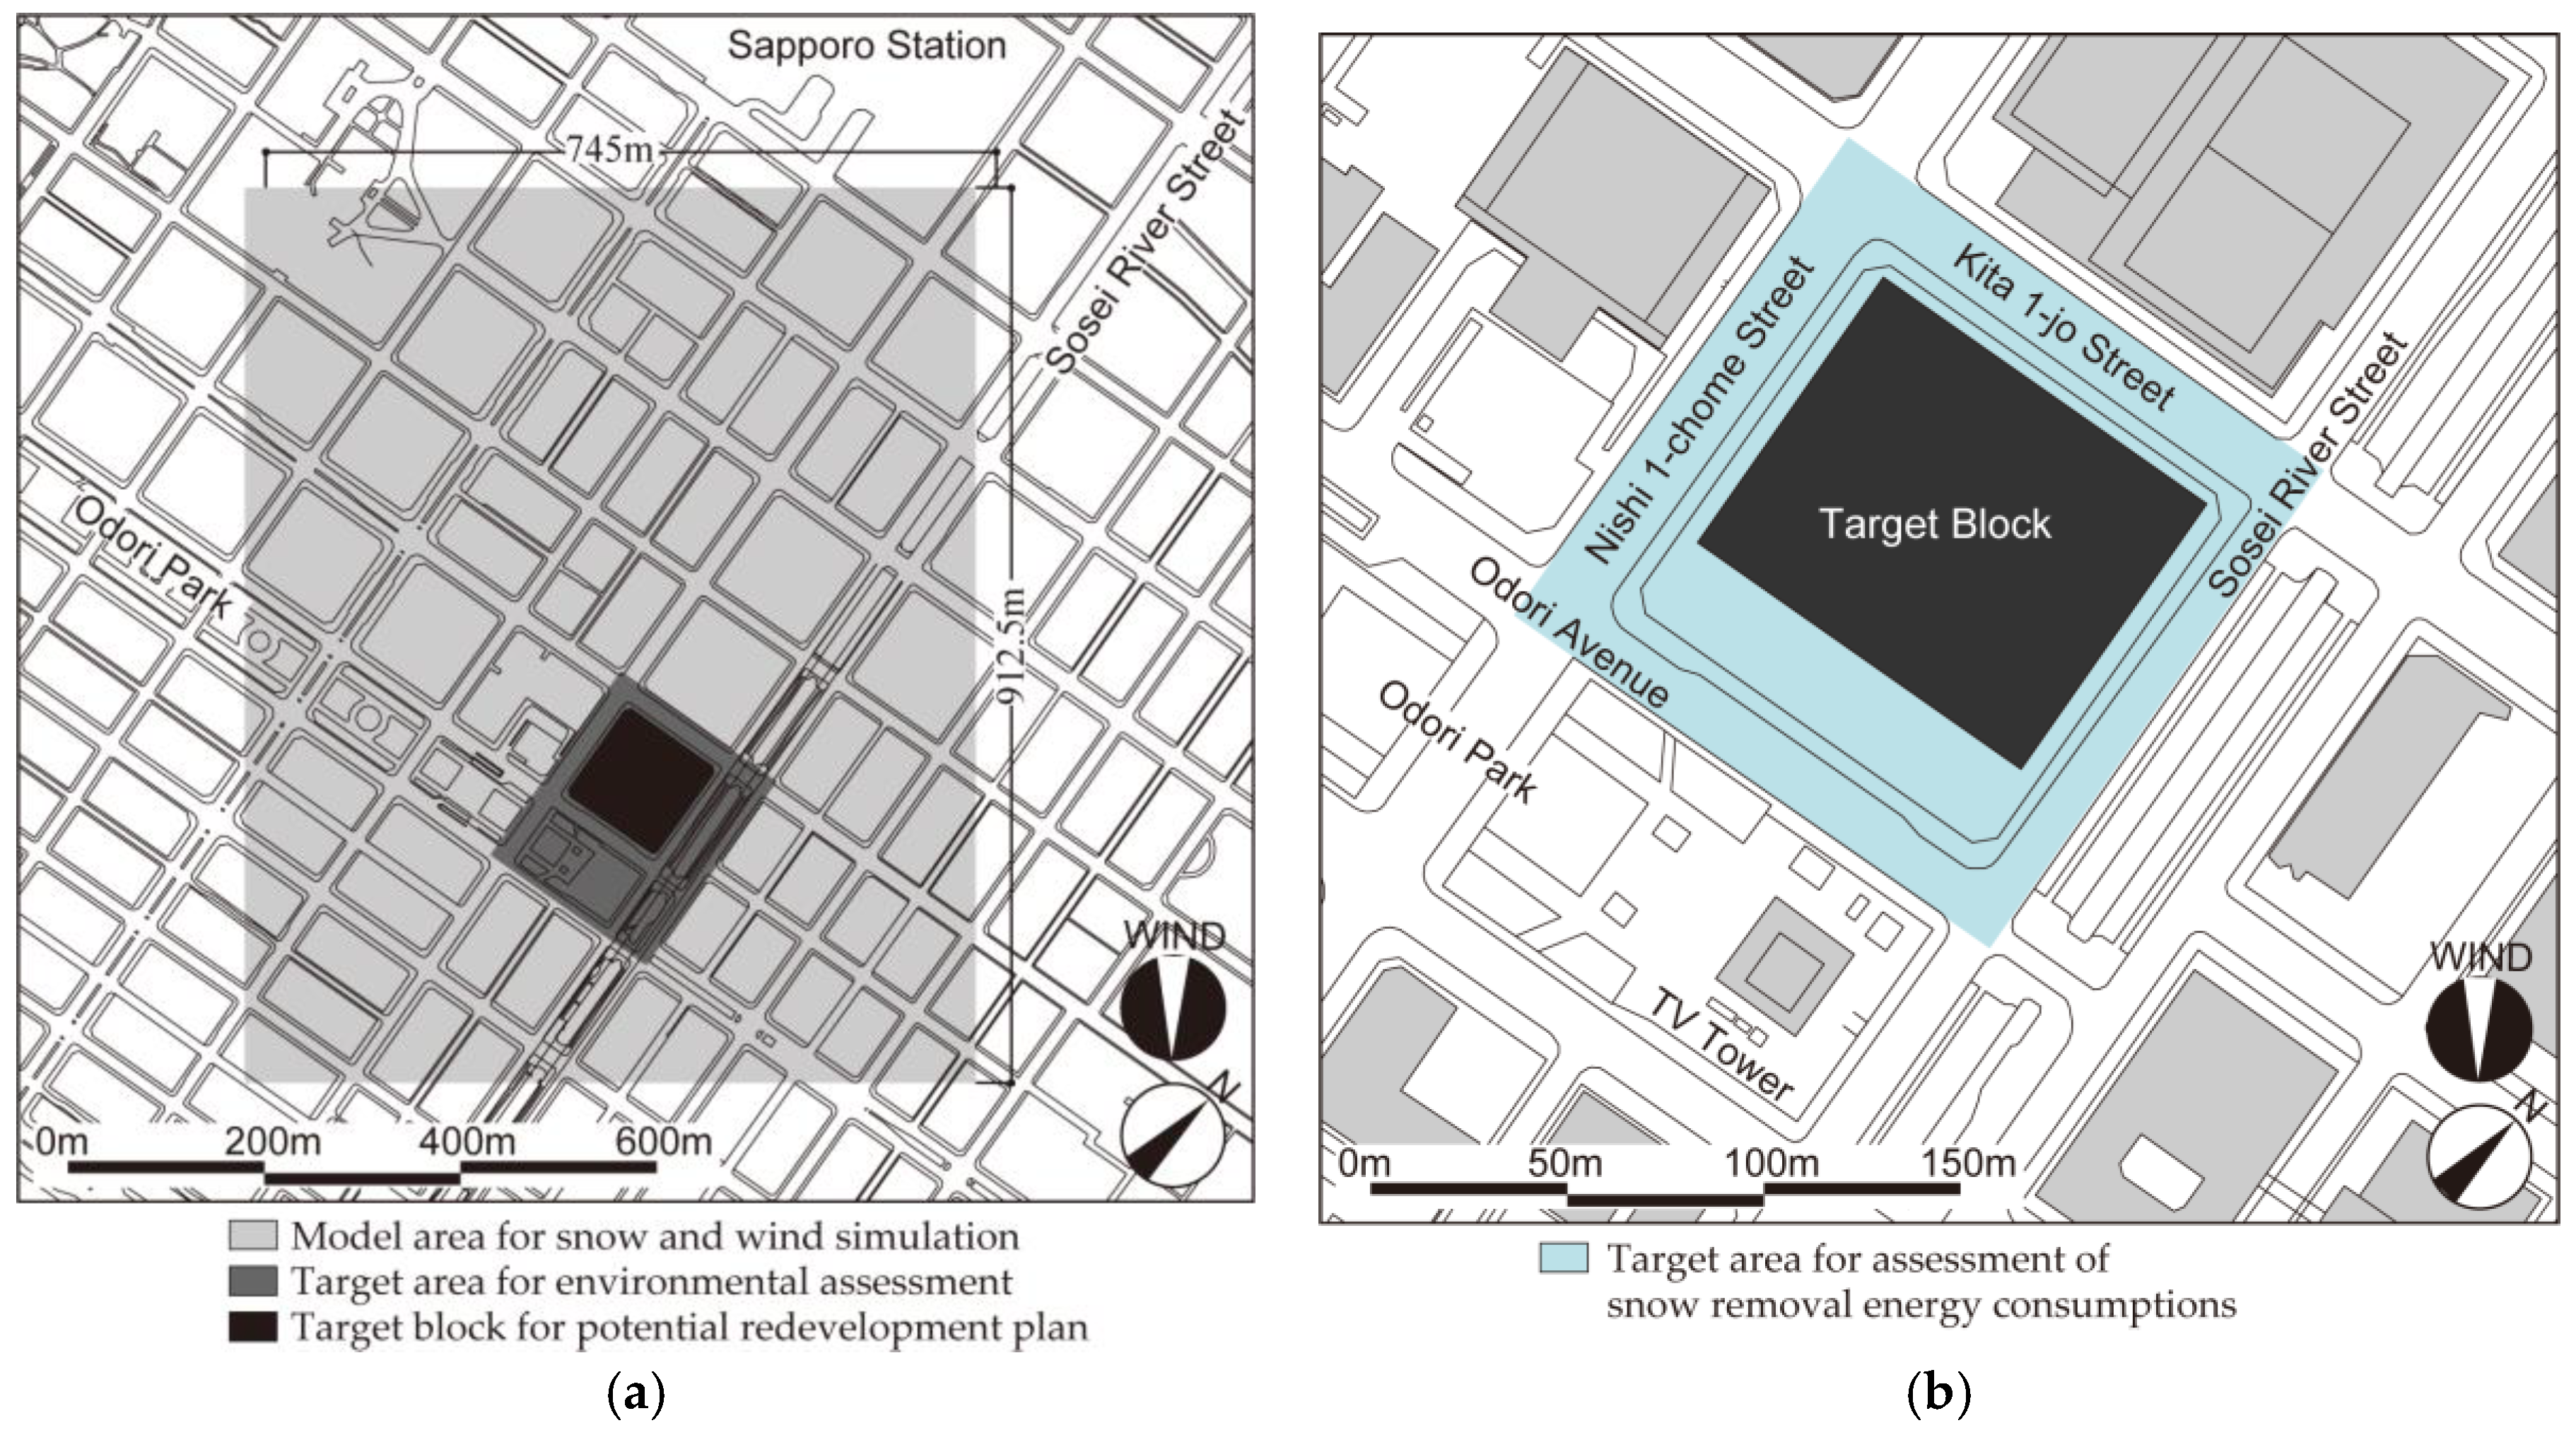
3.2. Target Simulation Area
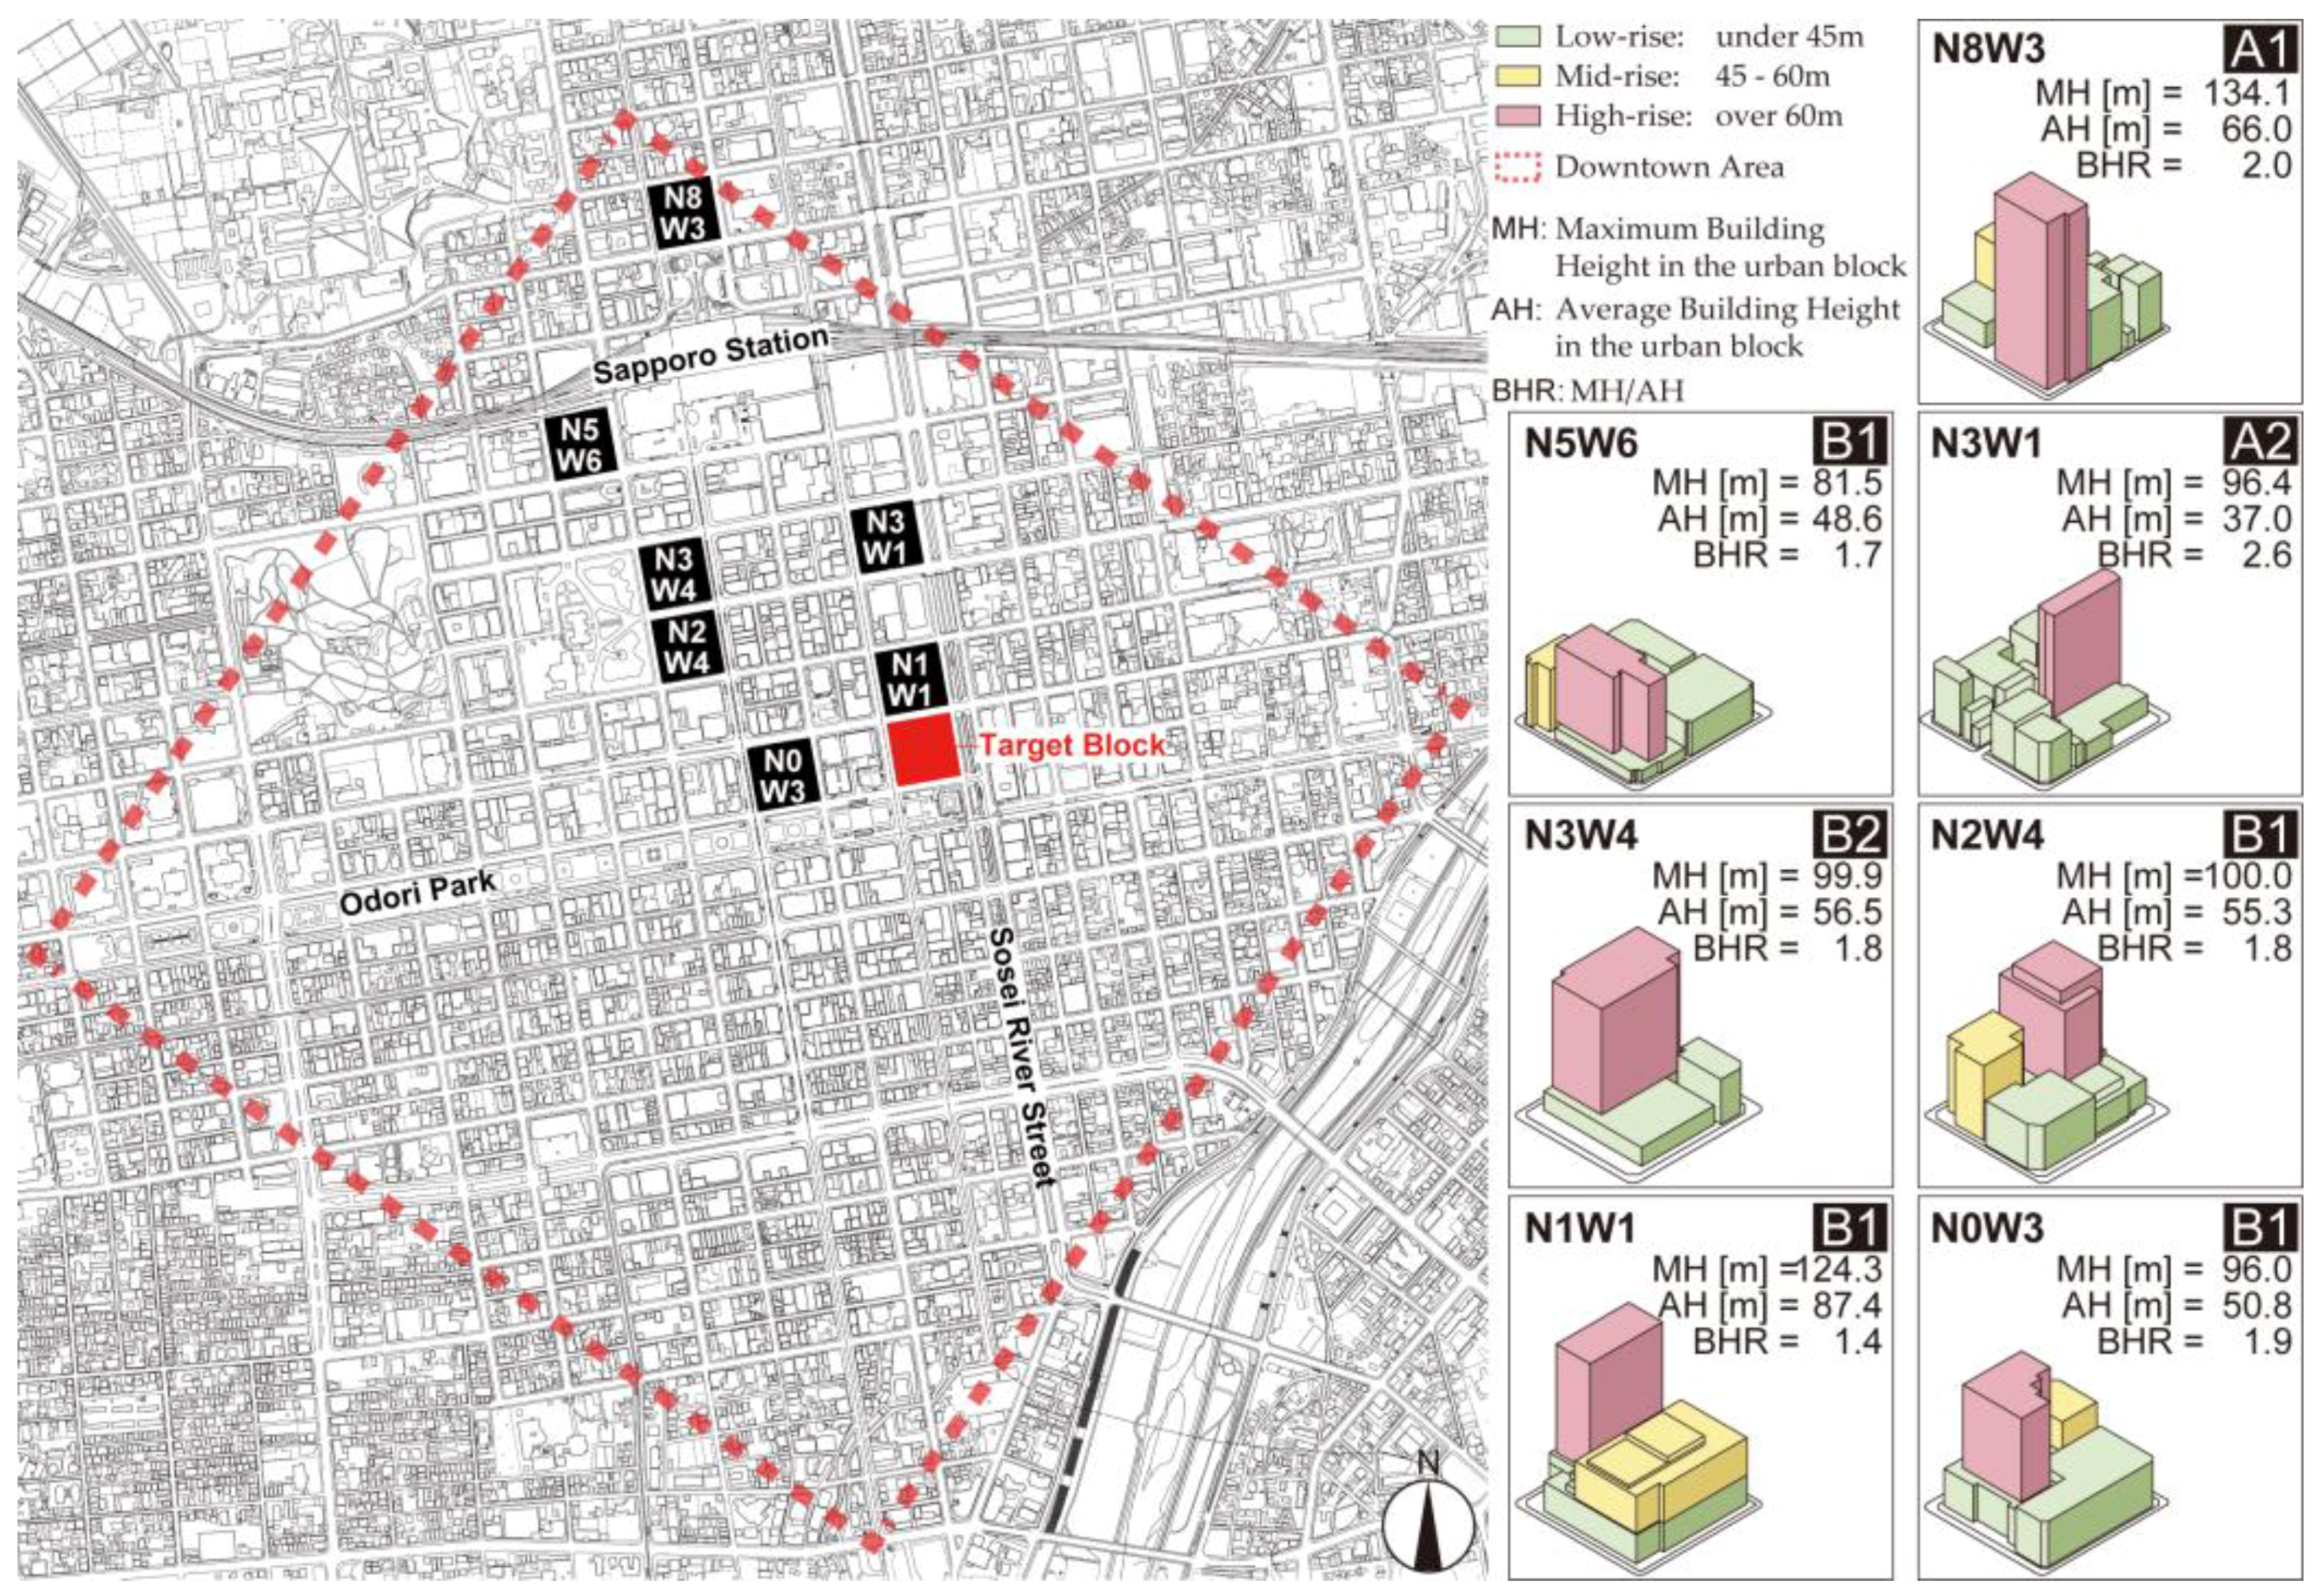
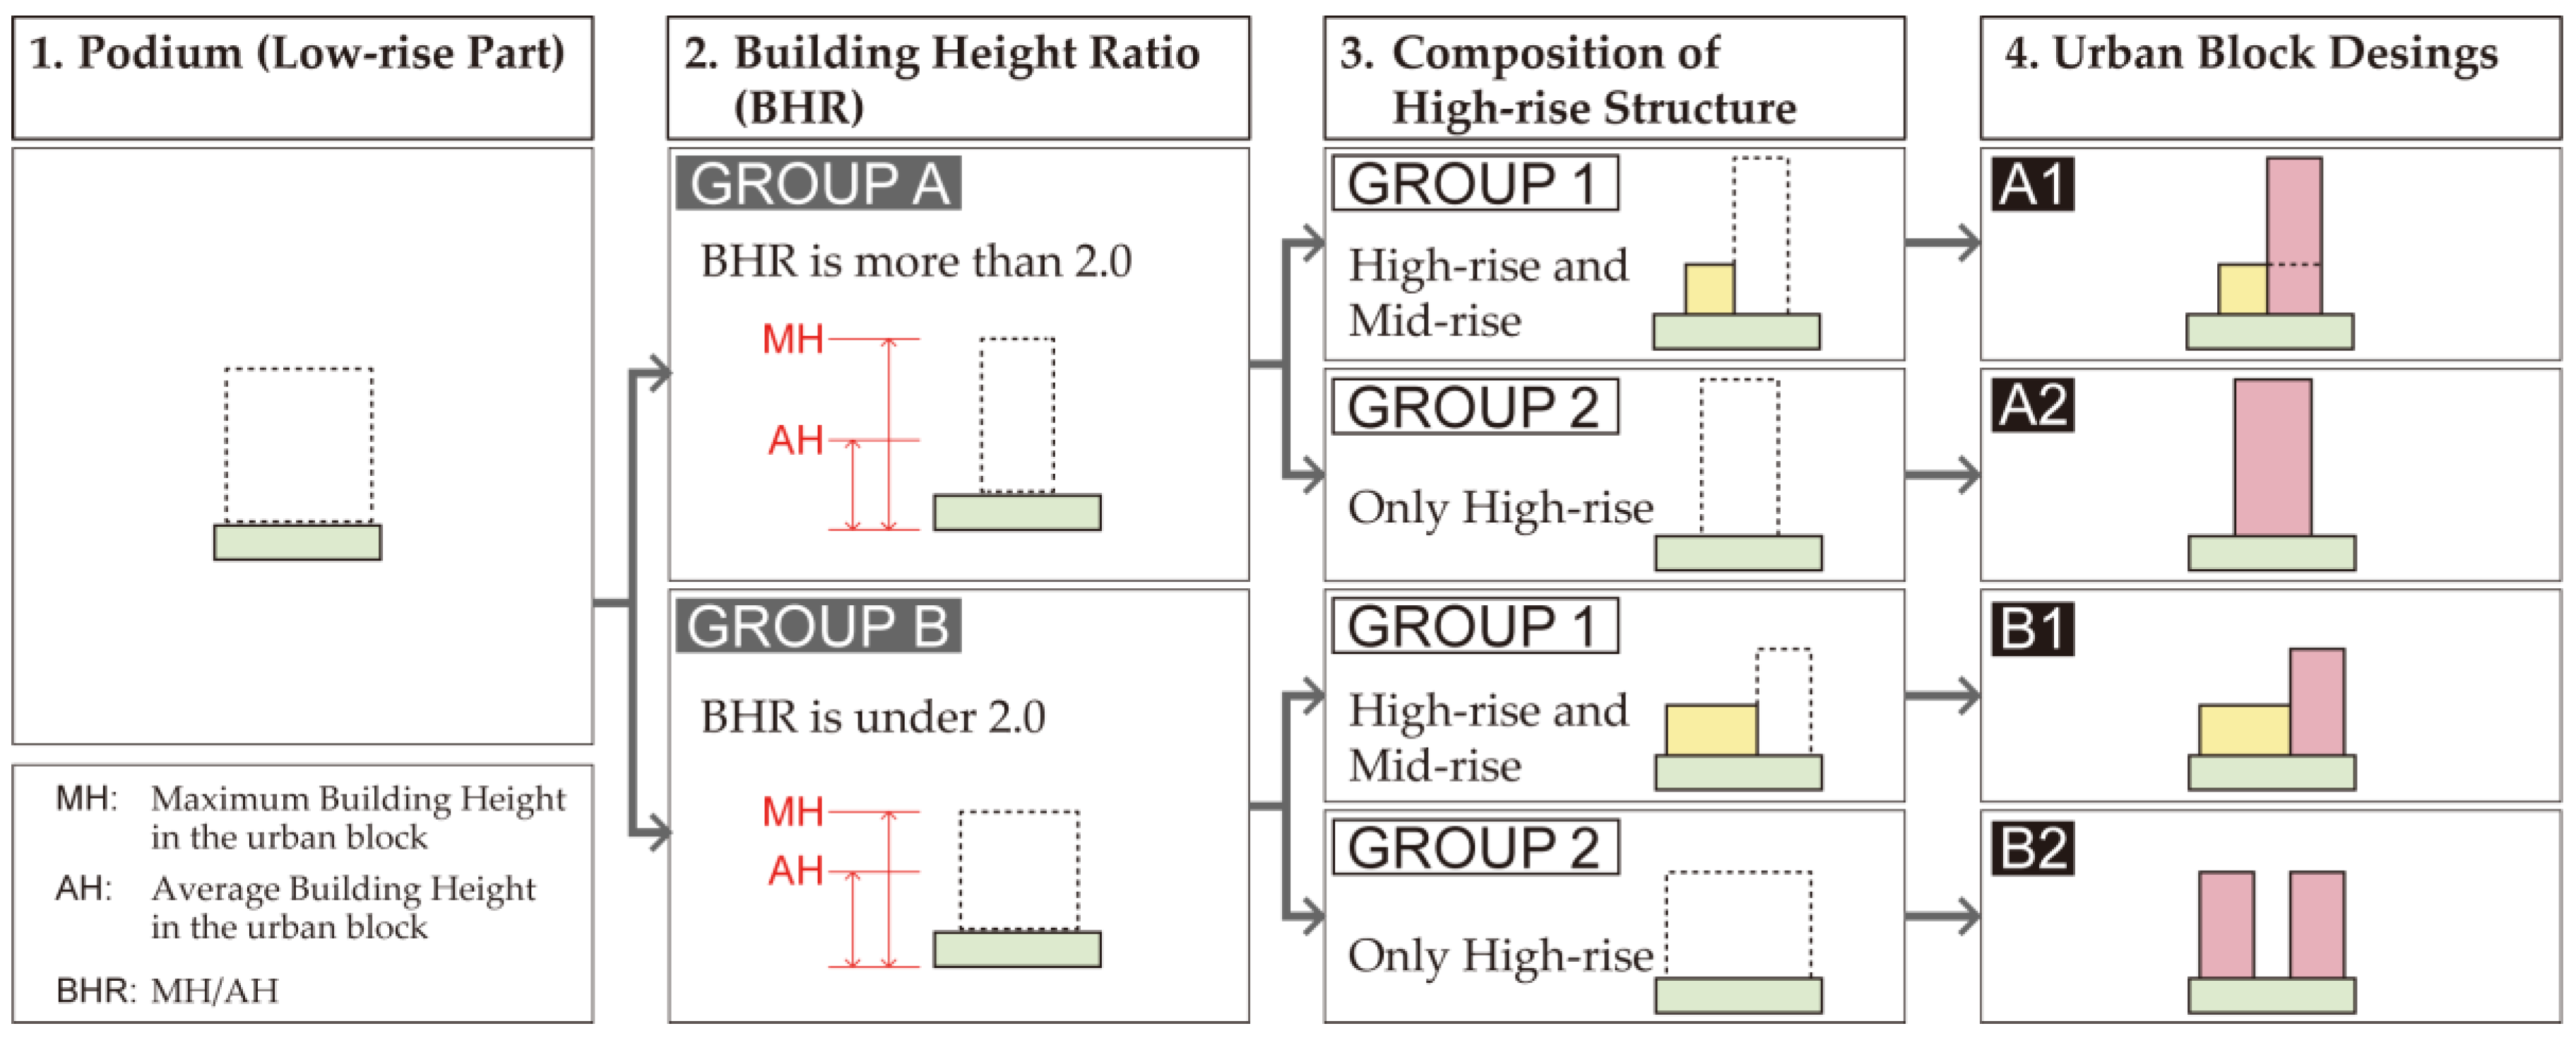
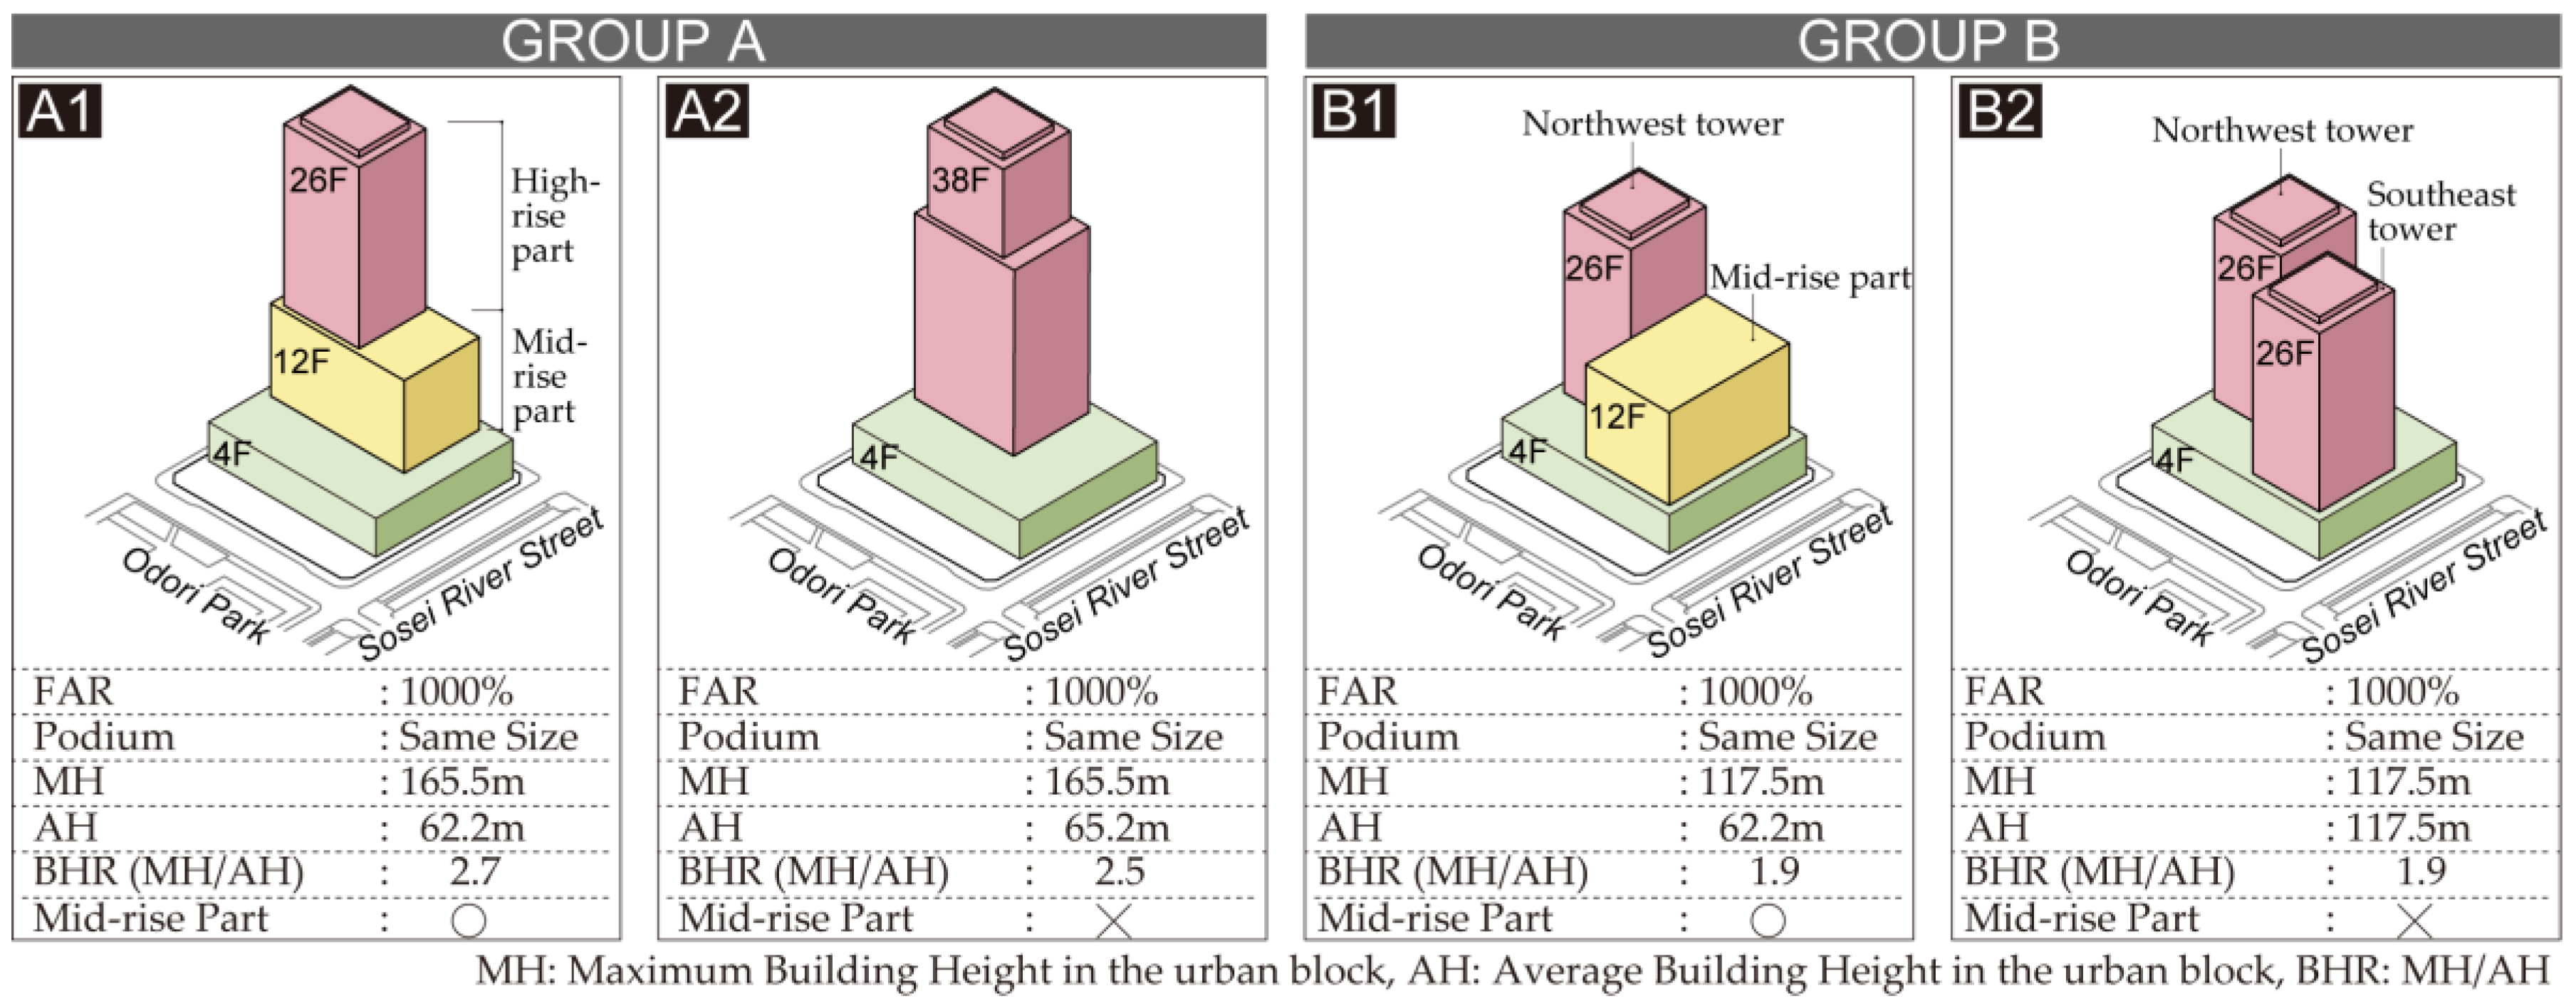
3.3. Analysis of the High-Rise and High-Density Urban Block Designs in Downtown Sapporo
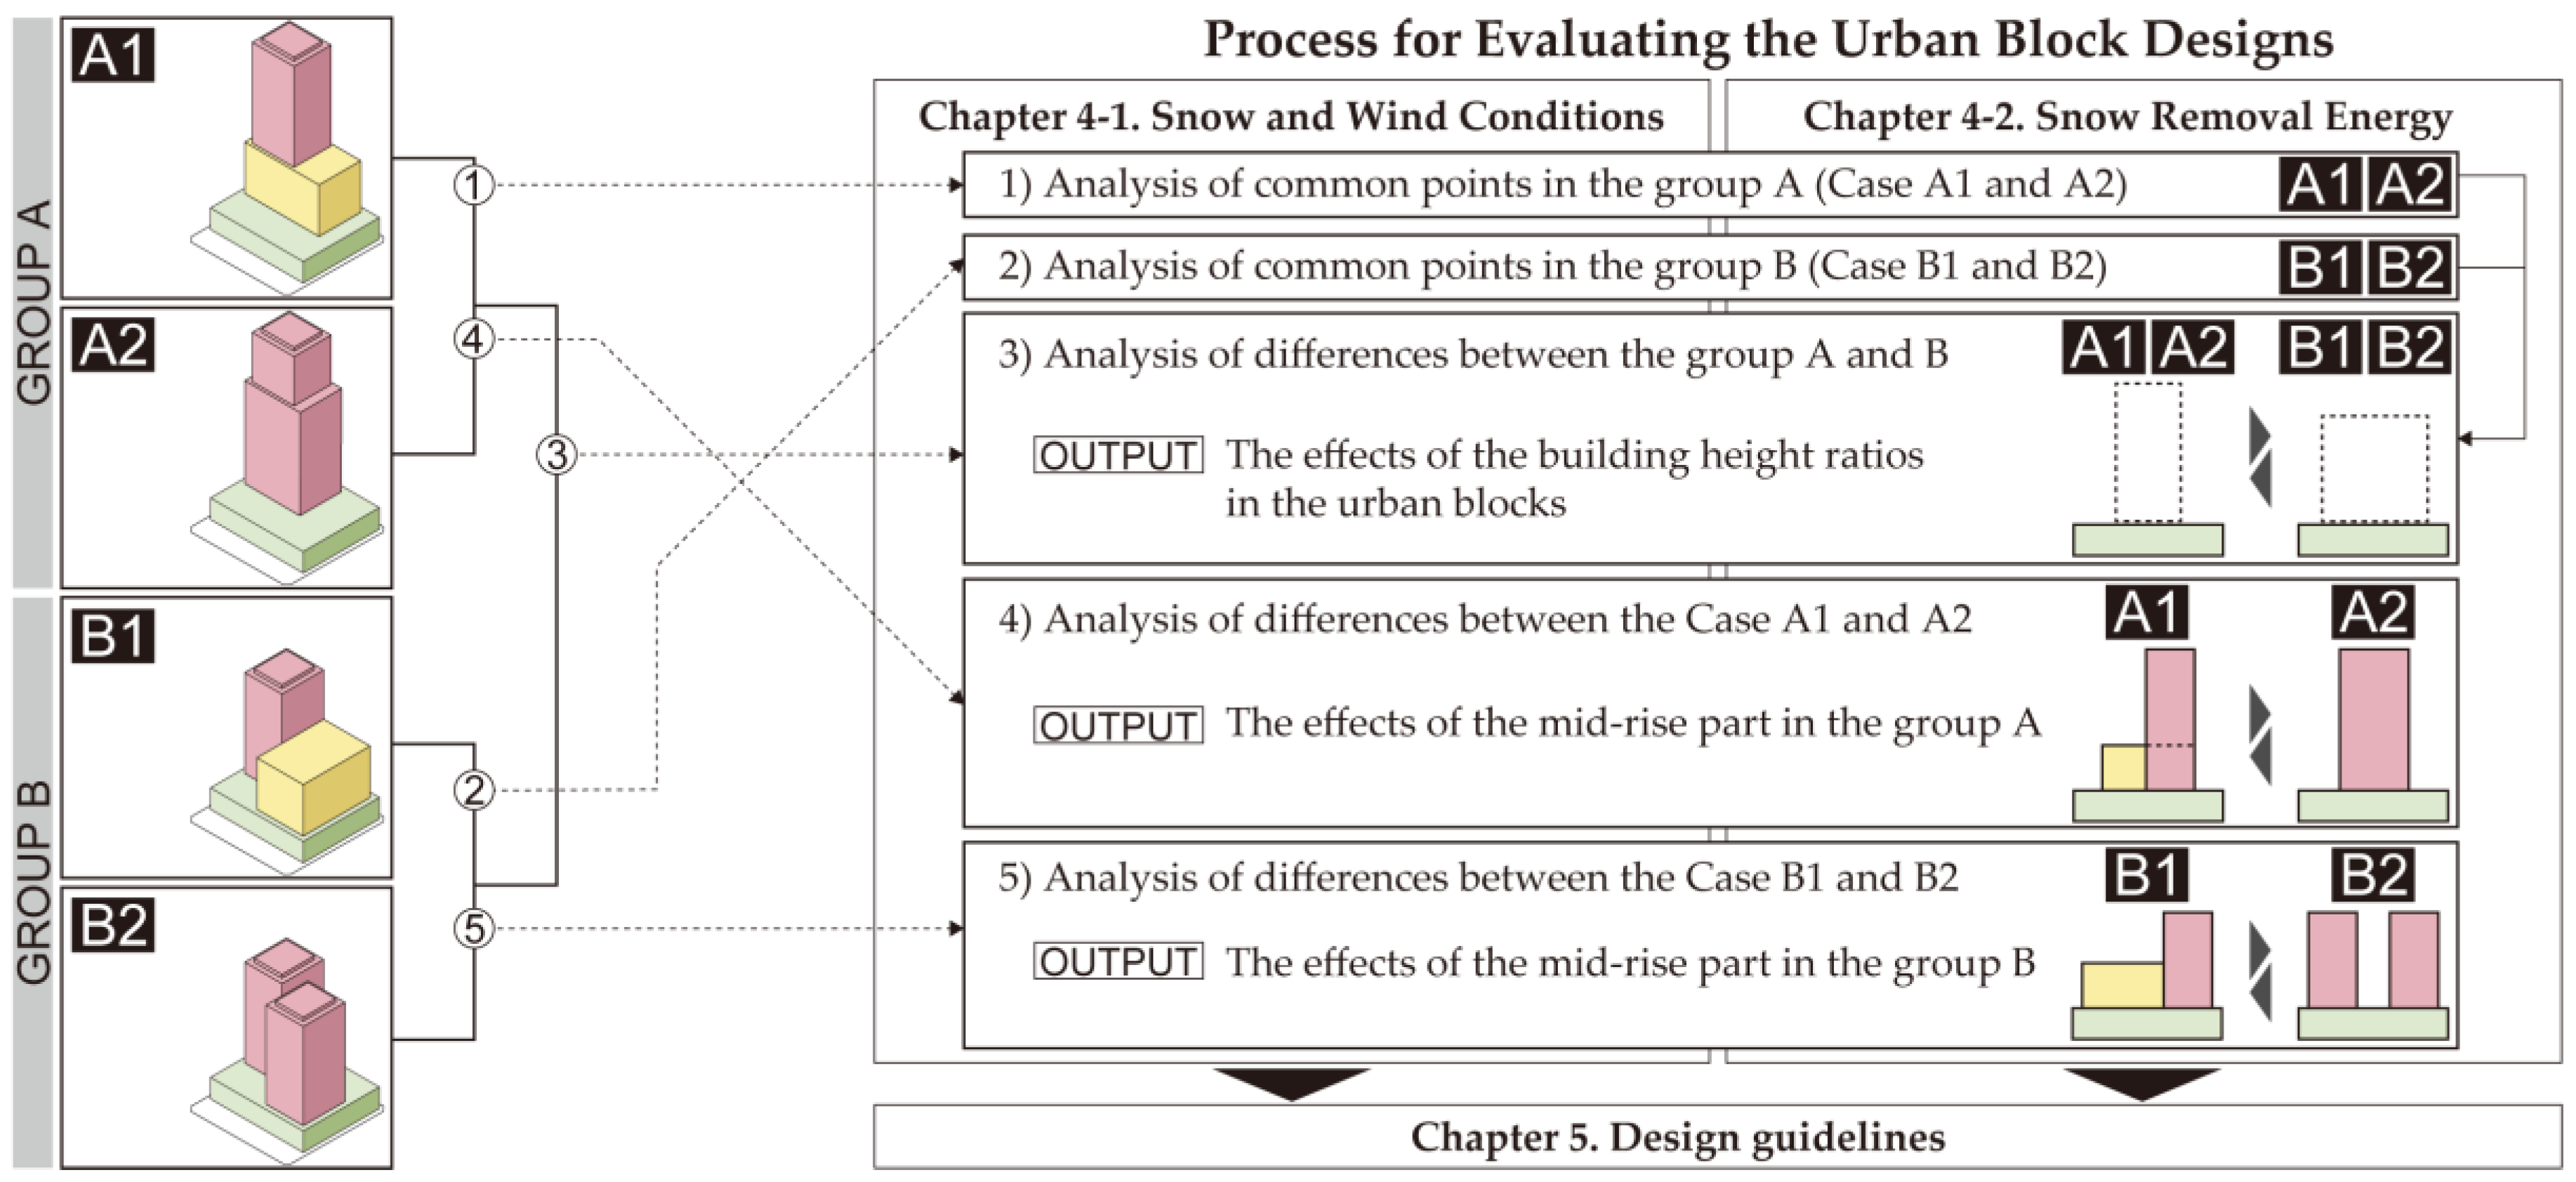
3.4. Process for Evaluating the Urban Block Designs
- 1)
- Analyzing the common points in the group A (Case A1 and A2).
- 2)
- Analyzing the common points in the group B (Case B1 and B2).
- 3)
- Analyzing the differences between the group A and B to clarify the effect of the building height ratios.
- 4)
- Analyzing the differences between the case A1 and A2 to clarify the effects of the mid-rise parts in the group A.
- 5)
- Analyzing the differences between the case B1 and B2 to clarify the effects of the mid-rise parts in the group B.
4. Results and Discussion
4.1. Snow and Wind Conditions
- 1)
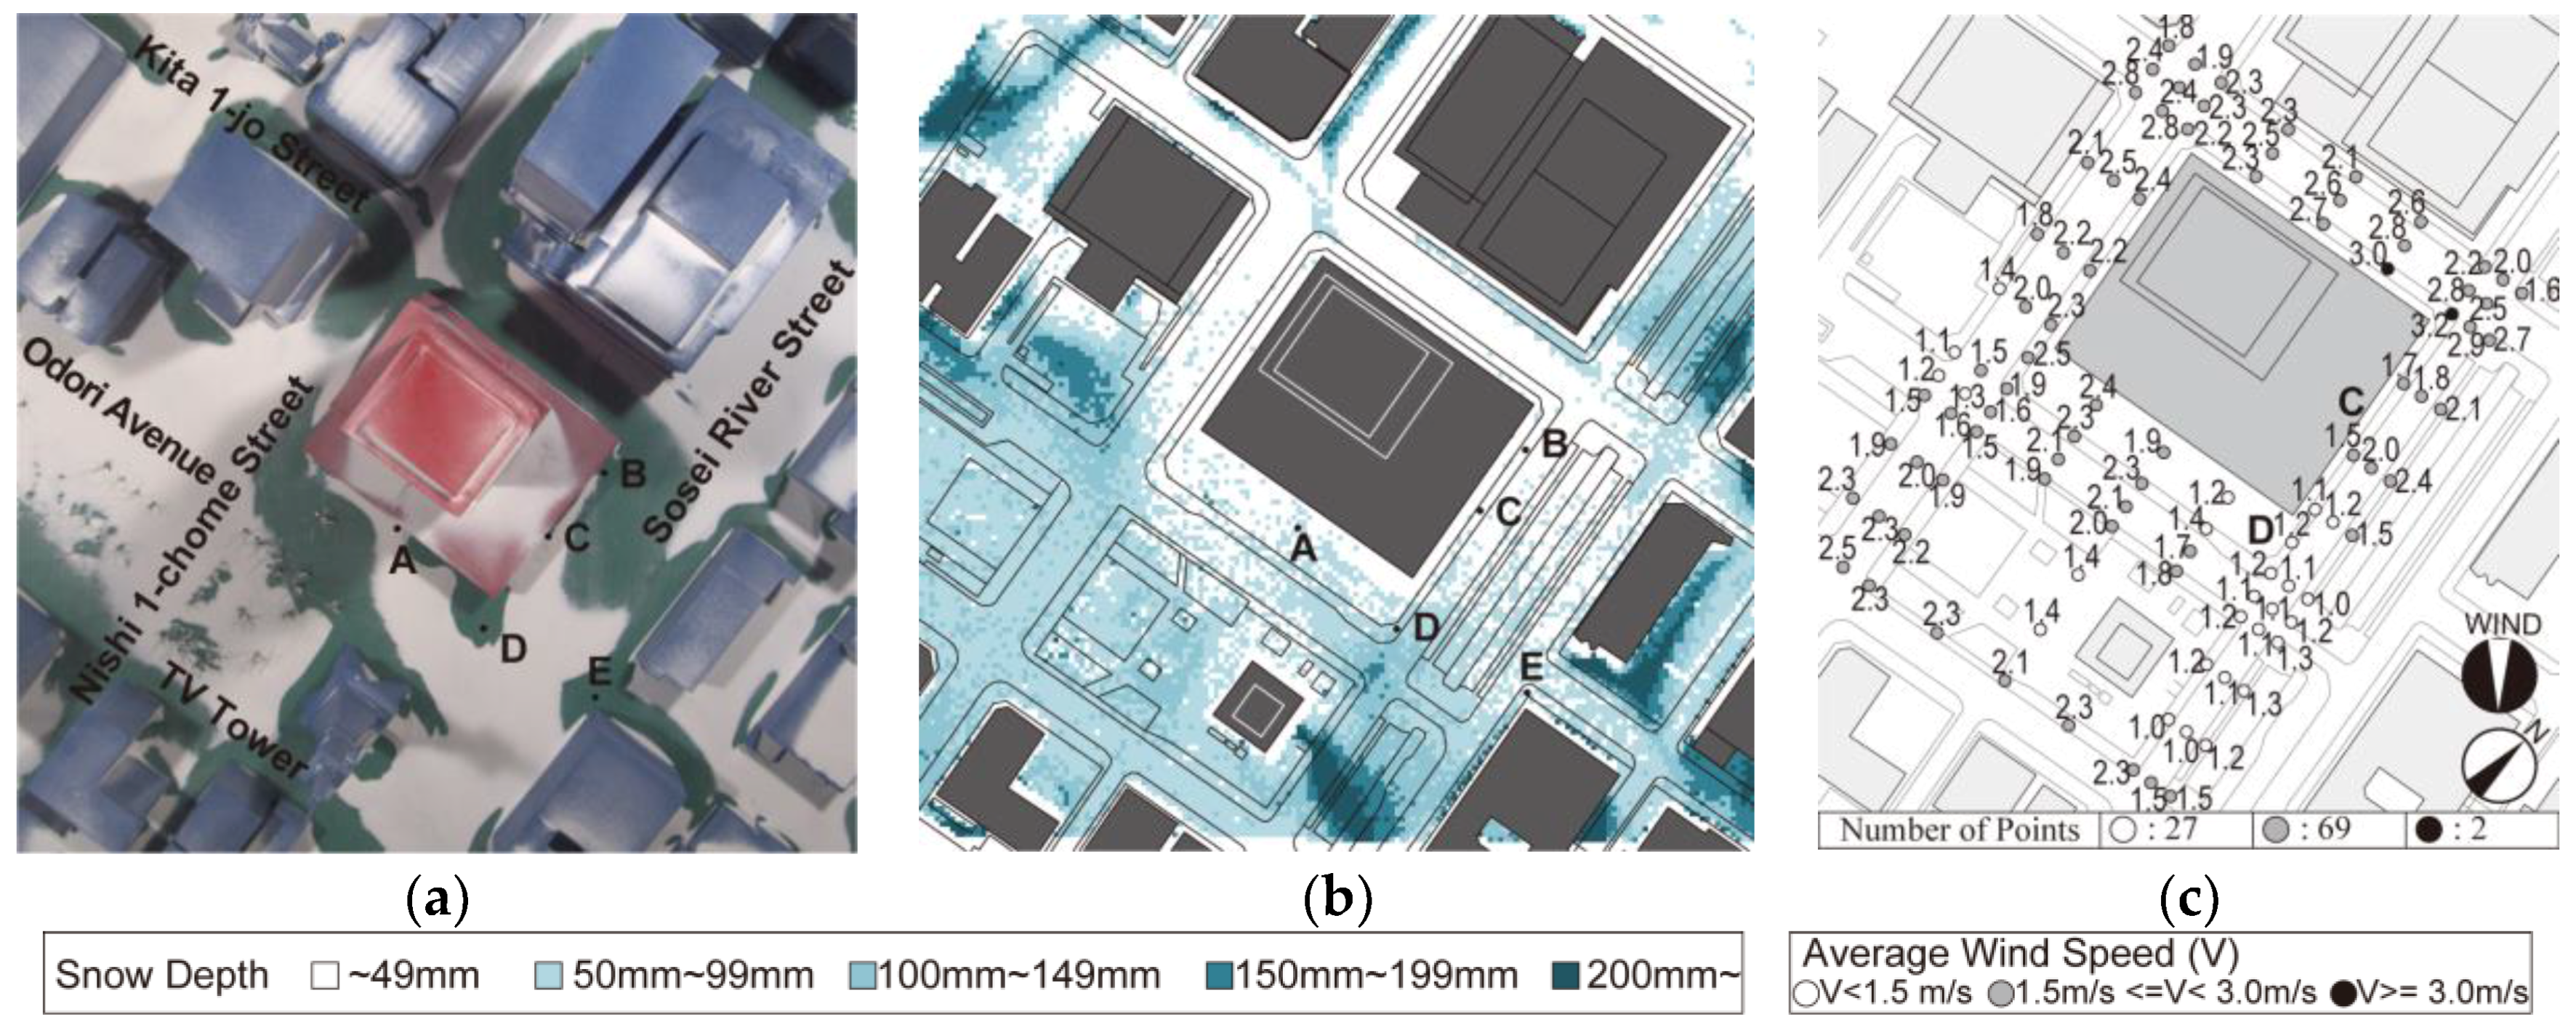
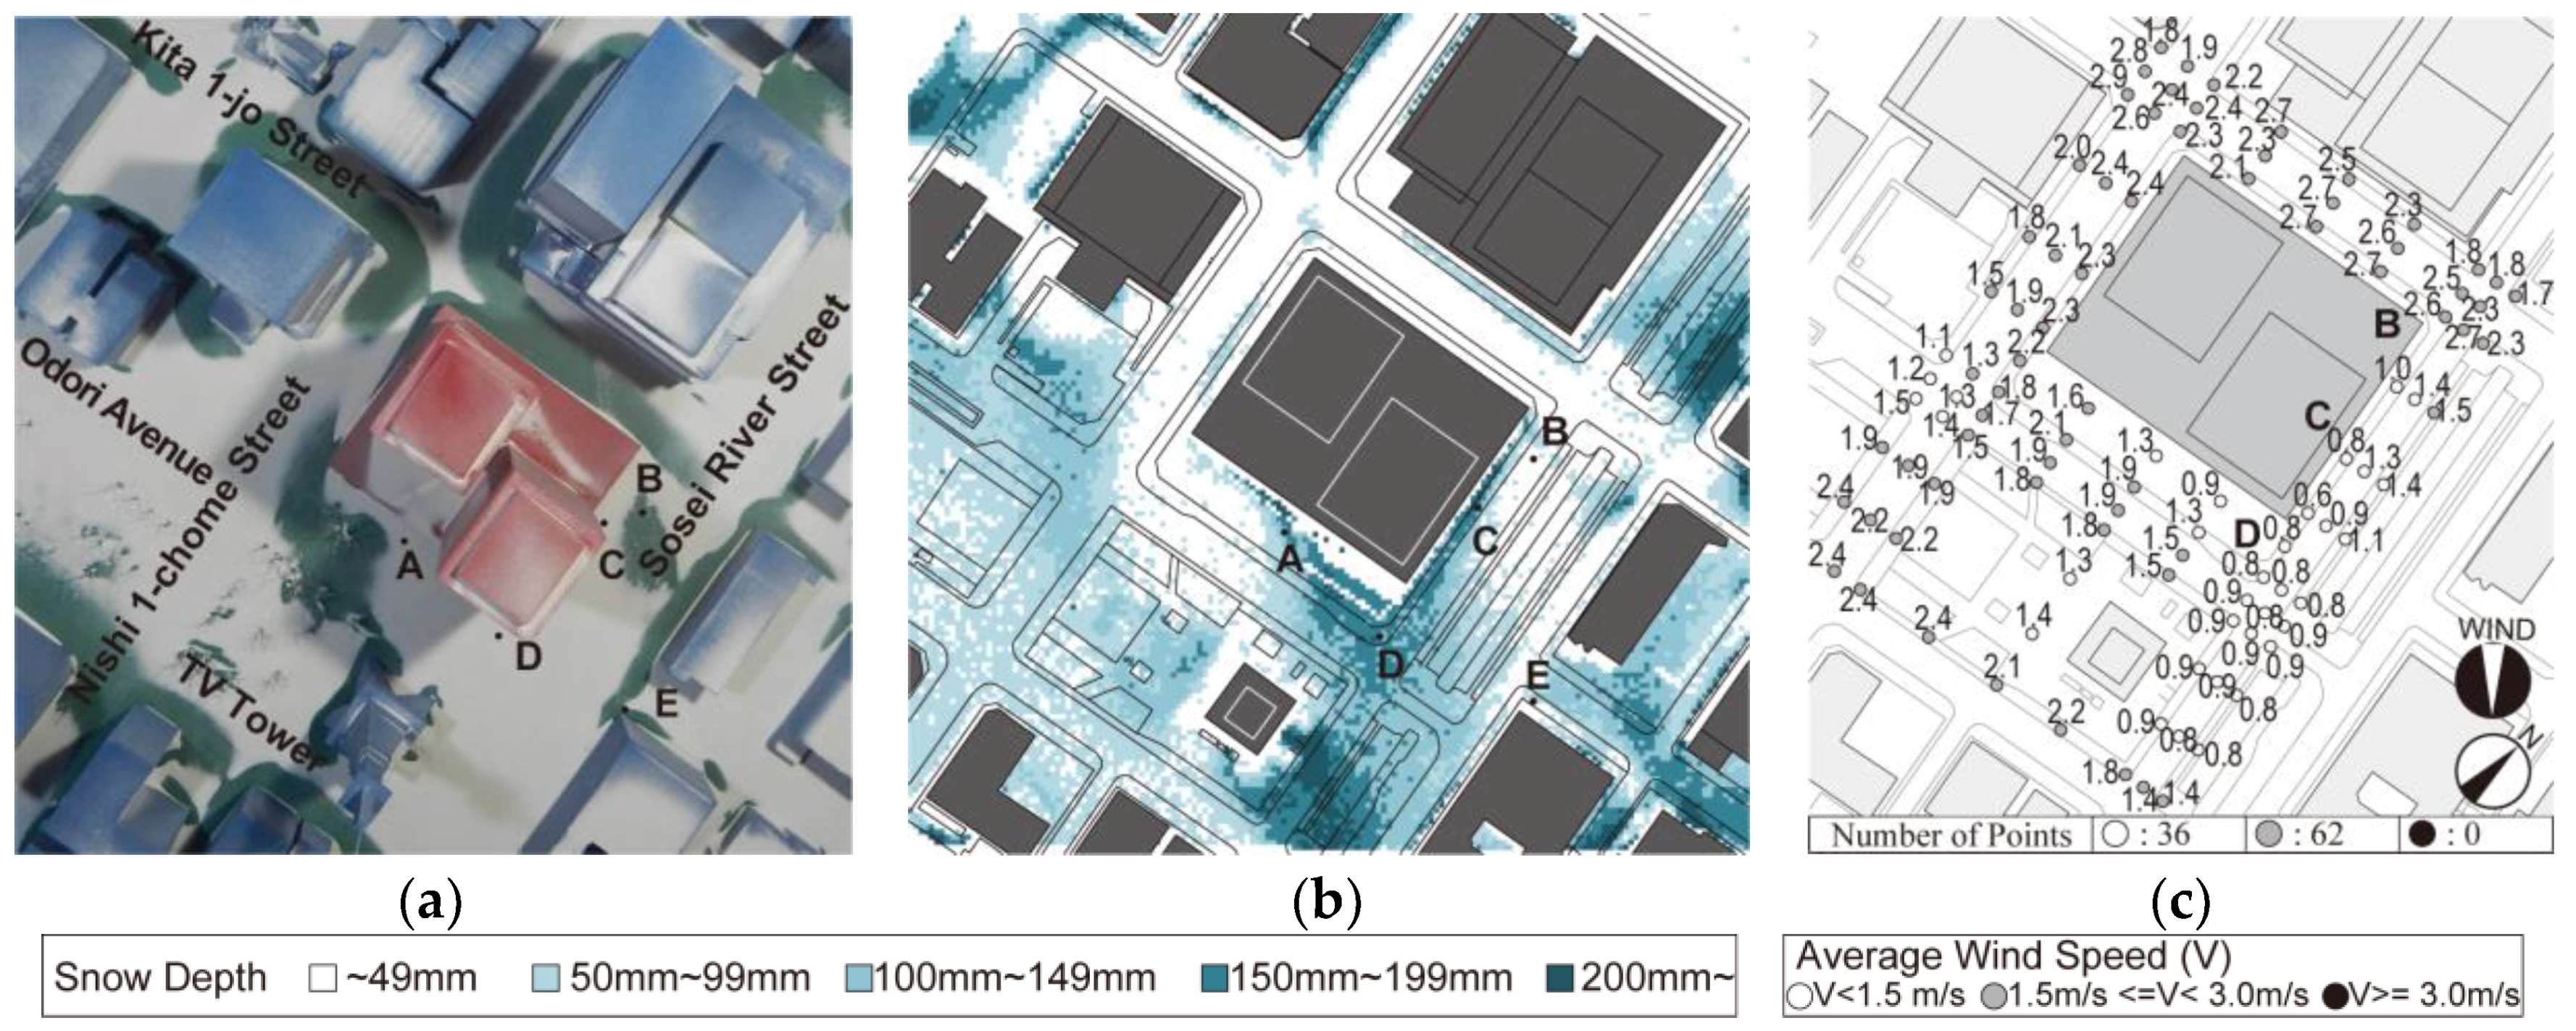
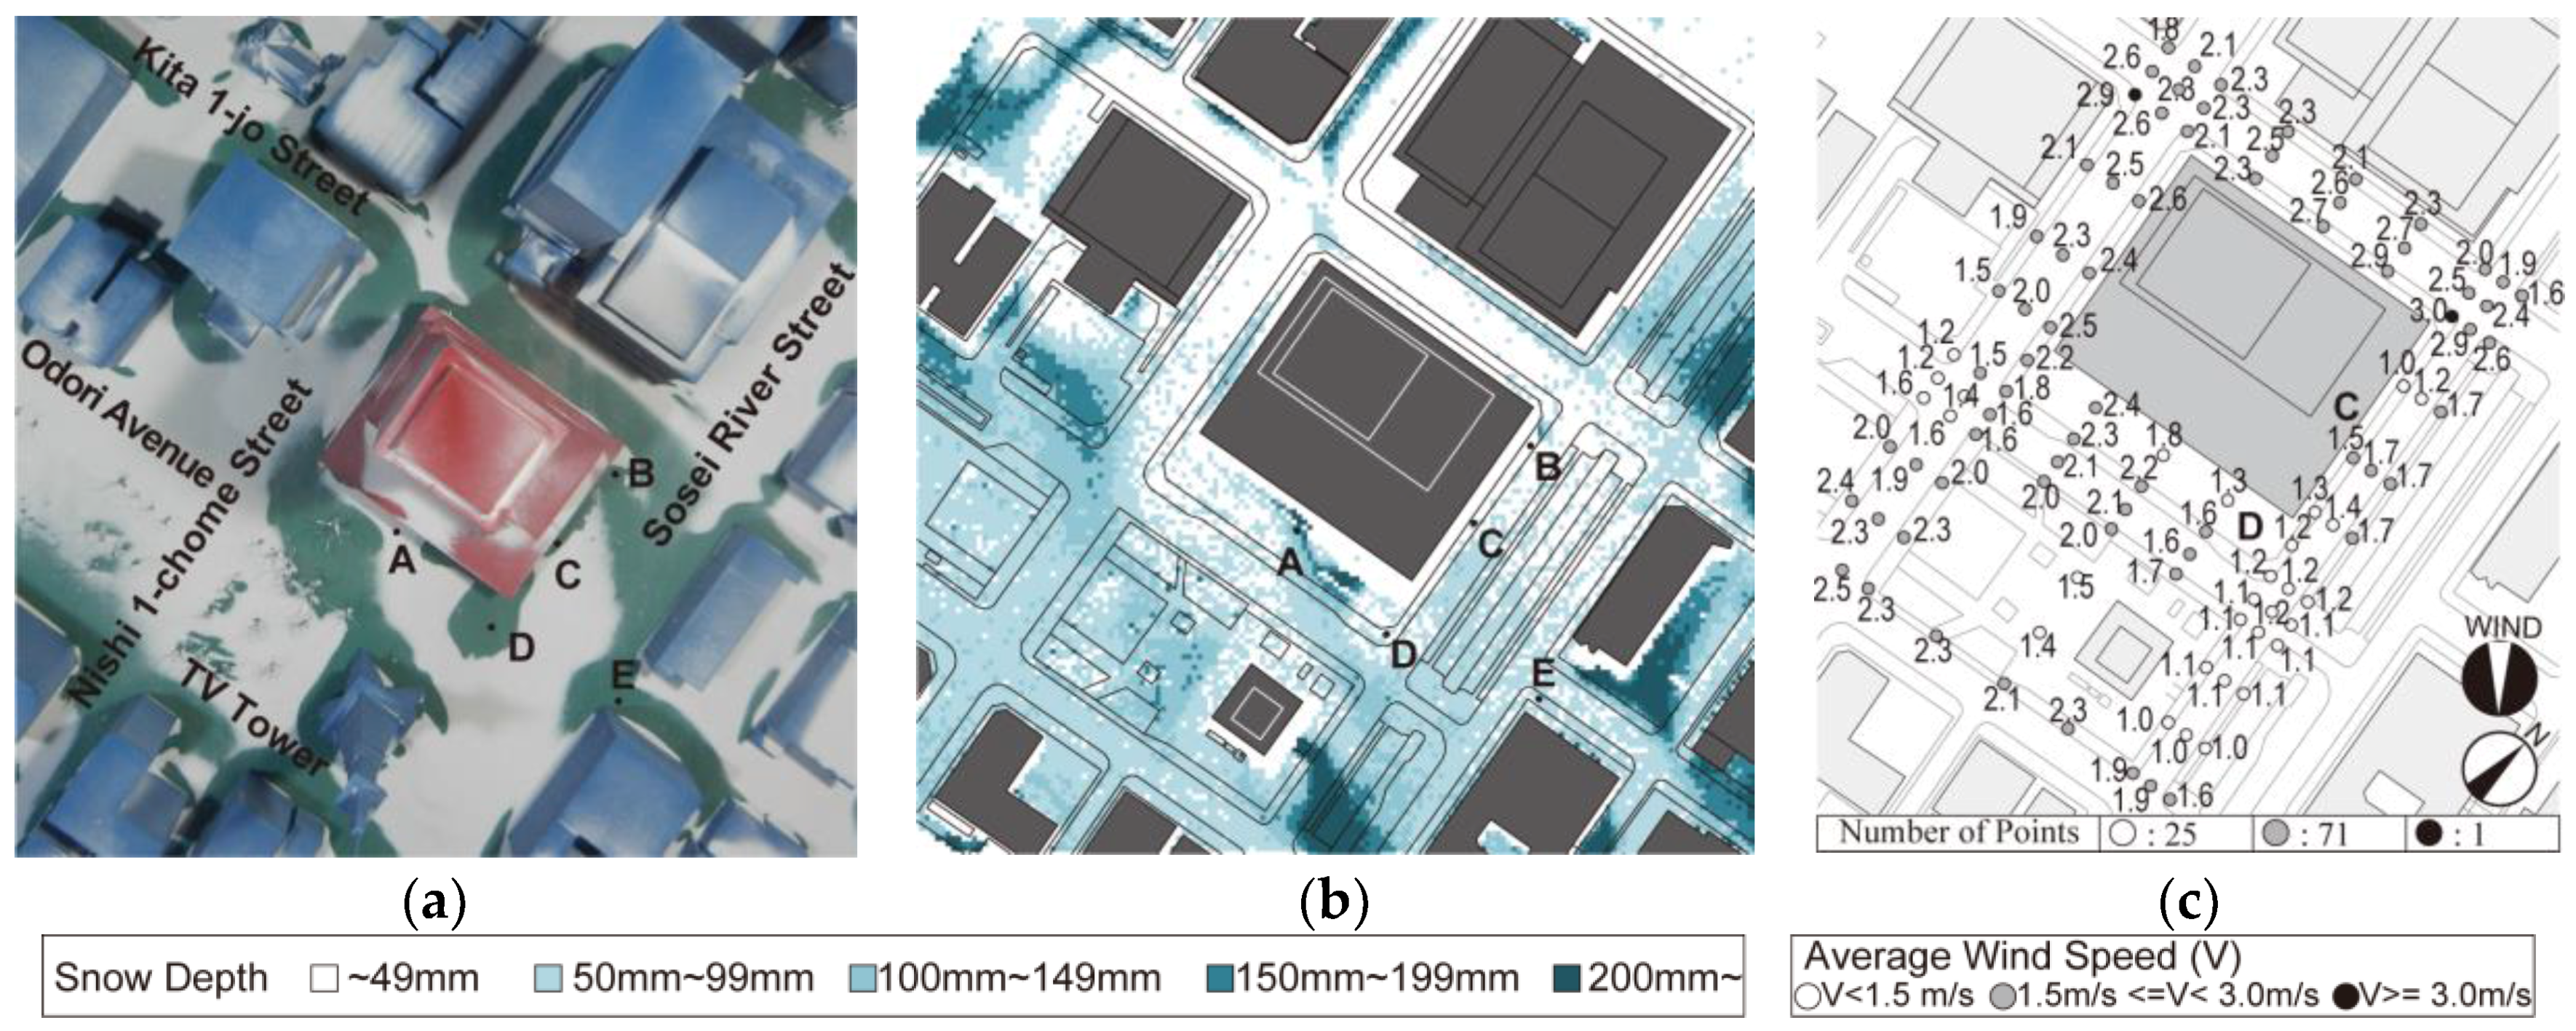
- The common points in group A: Snowdrifts were formed on the open space along Odori Park (point A in Figure 10 and Figure 11). There was no snowdrift around the crossing of Sosei River Street and Kita 1-jo Street (point B in Figure 10 and Figure 11). There was no snowdrift on the sidewalk of Sosei River Street (point C in Figure 10 and Figure 11). No snowdrift was observed around the crossing of Sosei River Street and Odori Avenue (point D in Figure 10 and Figure 11). There was a large area around the southeast block wherein no snowdrift formed (point E in Figure 10 and Figure 11).
- 2)
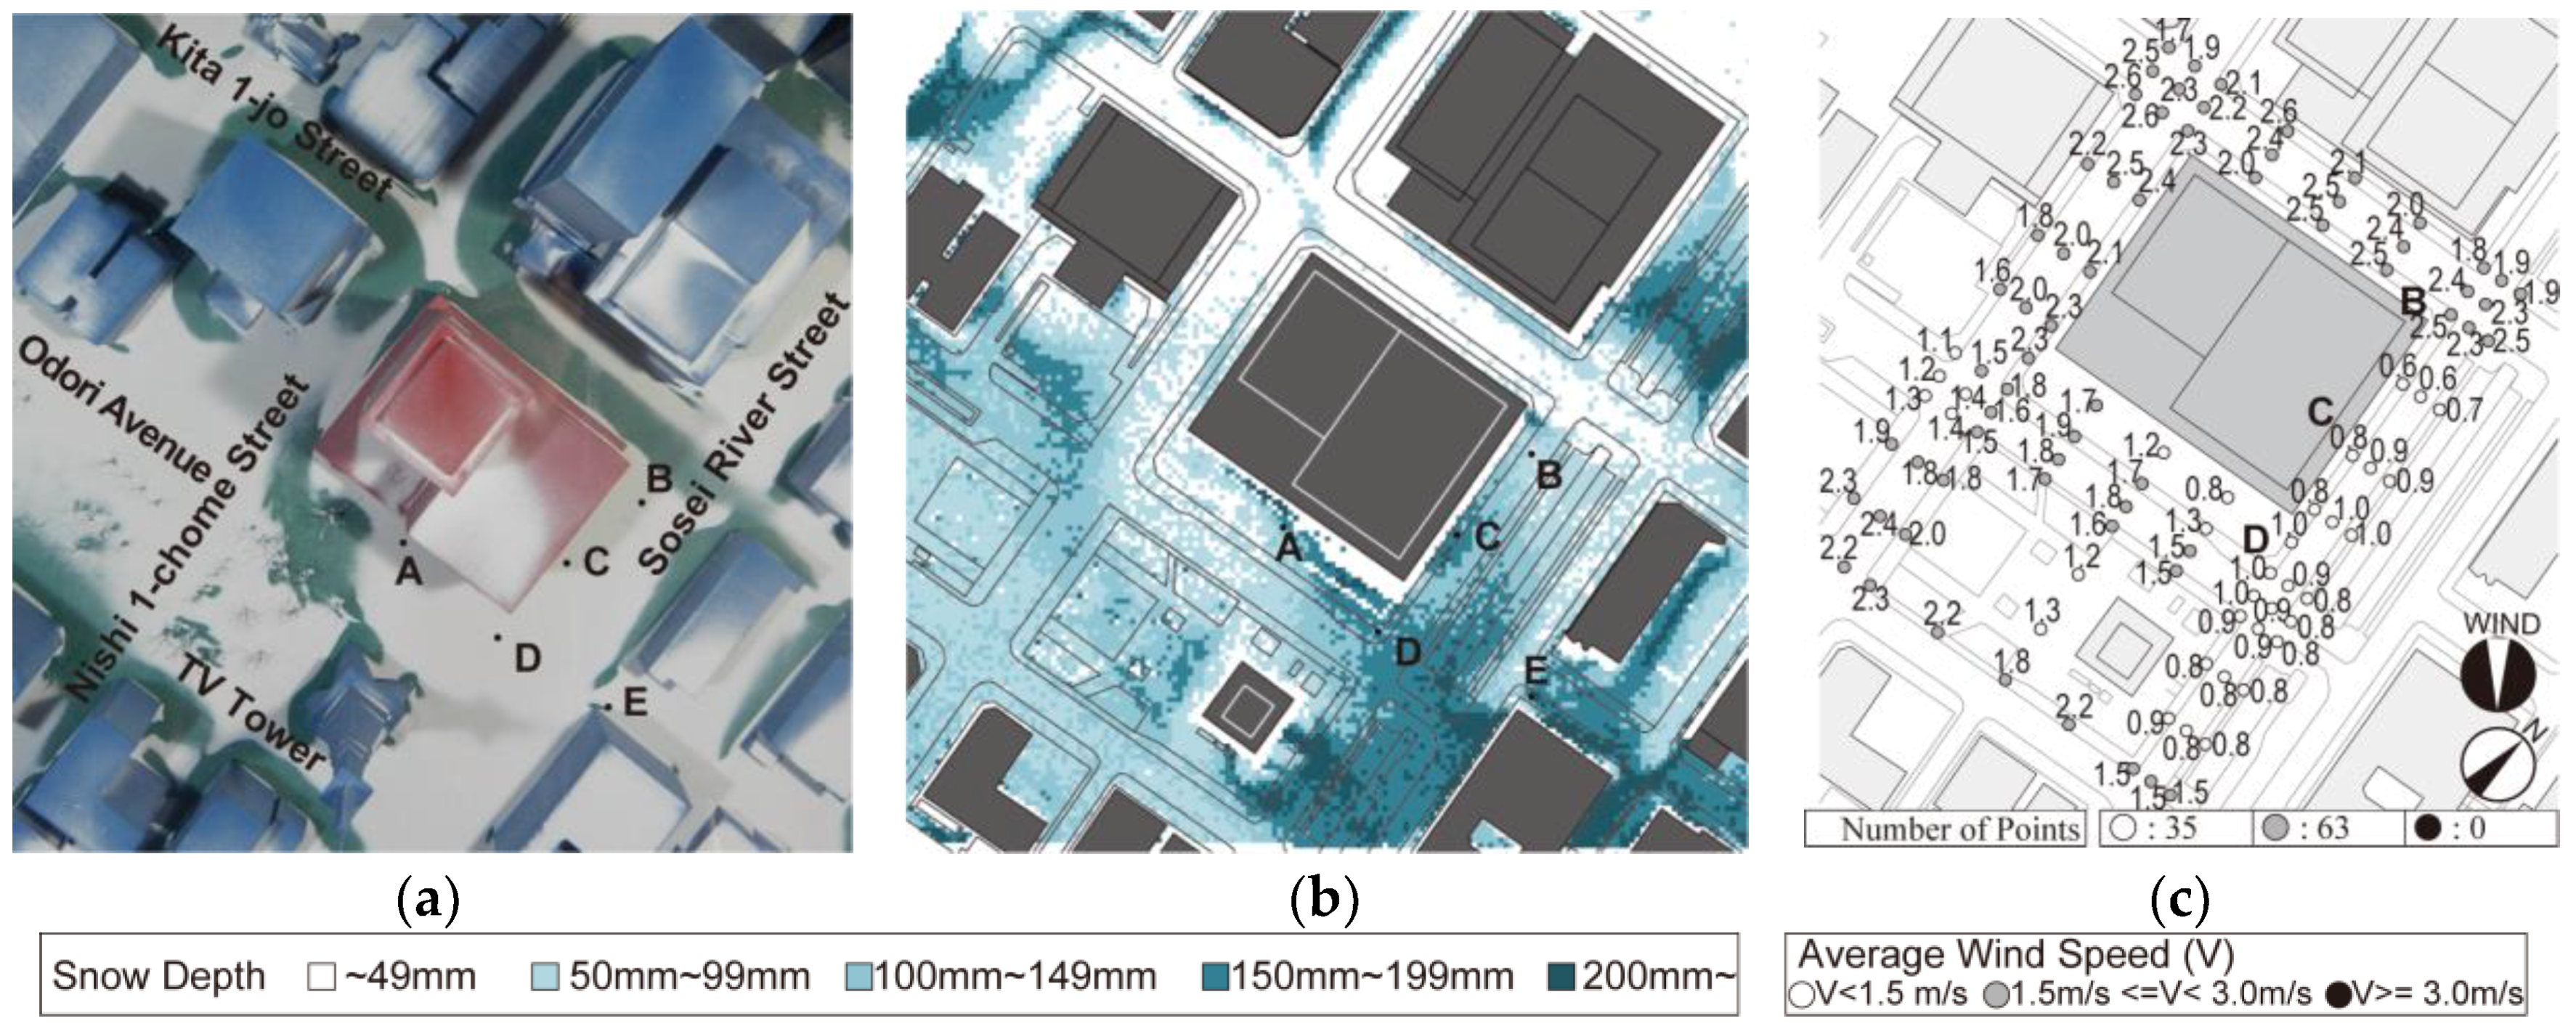
- The common points in group B: Snowdrifts were formed on the open space along Odori Park (point A in Figure 10 and Figure 11). The snowdrift depths were almost same, 23.0 cm and 23.1 cm in the case B1 and B2 respectively, potentially causing problems for pedestrians. Snowdrifts formed on the sidewalk of Sosei River Street (point C in Figure 12 and Figure 13). Snowdrifts formed around the crossing of Sosei River Street and Odori Avenue and the snowdrift depths were 15.9 cm and 16.6 cm in the case B1 and B2 (point D in Figure 12 and Figure 13).
- 3)
- The differences between group A and B: There were two differences between the group A and group B. On the sidewalk of Sosei River Street, there was no snowdrifts in the group A, however, a snowdrift formed in group B (point C in Figure 10, Figure 11, Figure 12 and Figure 13). As the building height was taller in group A, the strong deflected winds produced a larger area with no snowdrifts, which in turn caused no snow to land over a large area. In group B, winds deflected by the northwest tower were intercepted by the southeast tower or the mid-rise part, which reduced the wind velocity on the ground and caused the formation of snowdrifts. In addition, the area of the roof of the podium in group A was larger than that in group B, the snow that could cover the roof was greater, indicating that the design had less snowdrifts.
- 4)
- The differences between the case A1 and A2: The depth of snow covering the open spaces in the case A2 was lower than that in the case A1 (12.0 cm as opposed to 26.6 cm; point A in Figure 10 and Figure 11). Because the area of the roof of the podium was increased in the case A2, more snow covered the roof, and therefore, less snow covered the ground.
- 5)
- The differences between the case B1 and B2: There were two differences between the case B1 and B2. Snowdrifts formed around the crossing of Sosei River Street and Kita 1-jo Street in the case B1, however, there was no snowdrift in the case B2 (point B in Figure 12 and Figure 13). In the case B1, winds deflected by the northwest tower were intercepted by the mid-rise part, which reduced the wind velocity on the ground and caused the formation of snowdrifts.
4.2. Snow Removal Energy
- 1)
- The common points in group A: The amount of snow cover was reduced in group A. Group A required small snow removal energy; 76.9 GJ/day for case A1 and 43.1 GJ/day for case A2.
- 2)
- The common points in group B: The amount of snow cover was increased in group B. Group B required great snow removal energy; 152.0 GJ/day for case B1 and 130.7 GJ/day for case B2.
- 3)
- The differences between group A and B: Group A required less snow removal energy than group B. In group A, the wind deflected from the higher tower produced larger areas with no snowdrifts in them and reduced the amount of snow cover, thereby requiring less snow removal energy.
- 4)
- The differences between case A1 and A2: Case A2 required less snow removal energy than case A1. Because the area of the roof of the podium in case A2 was larger than that in case A1, the amount of snow that could cover the roof was greater, indicating that the design had less amounts of snow covering the ground.
- 5)
- The differences between case B1 and B2: Case B1 required greater snow removal energy than case B2. In case B1, the wind deflected by the northwest tower was intercepted by the mid-rise part, which reduced the wind velocity on the ground and subsequently increased the snowdrifts, thereby requiring greater snow removal energy.
5. Conclusions
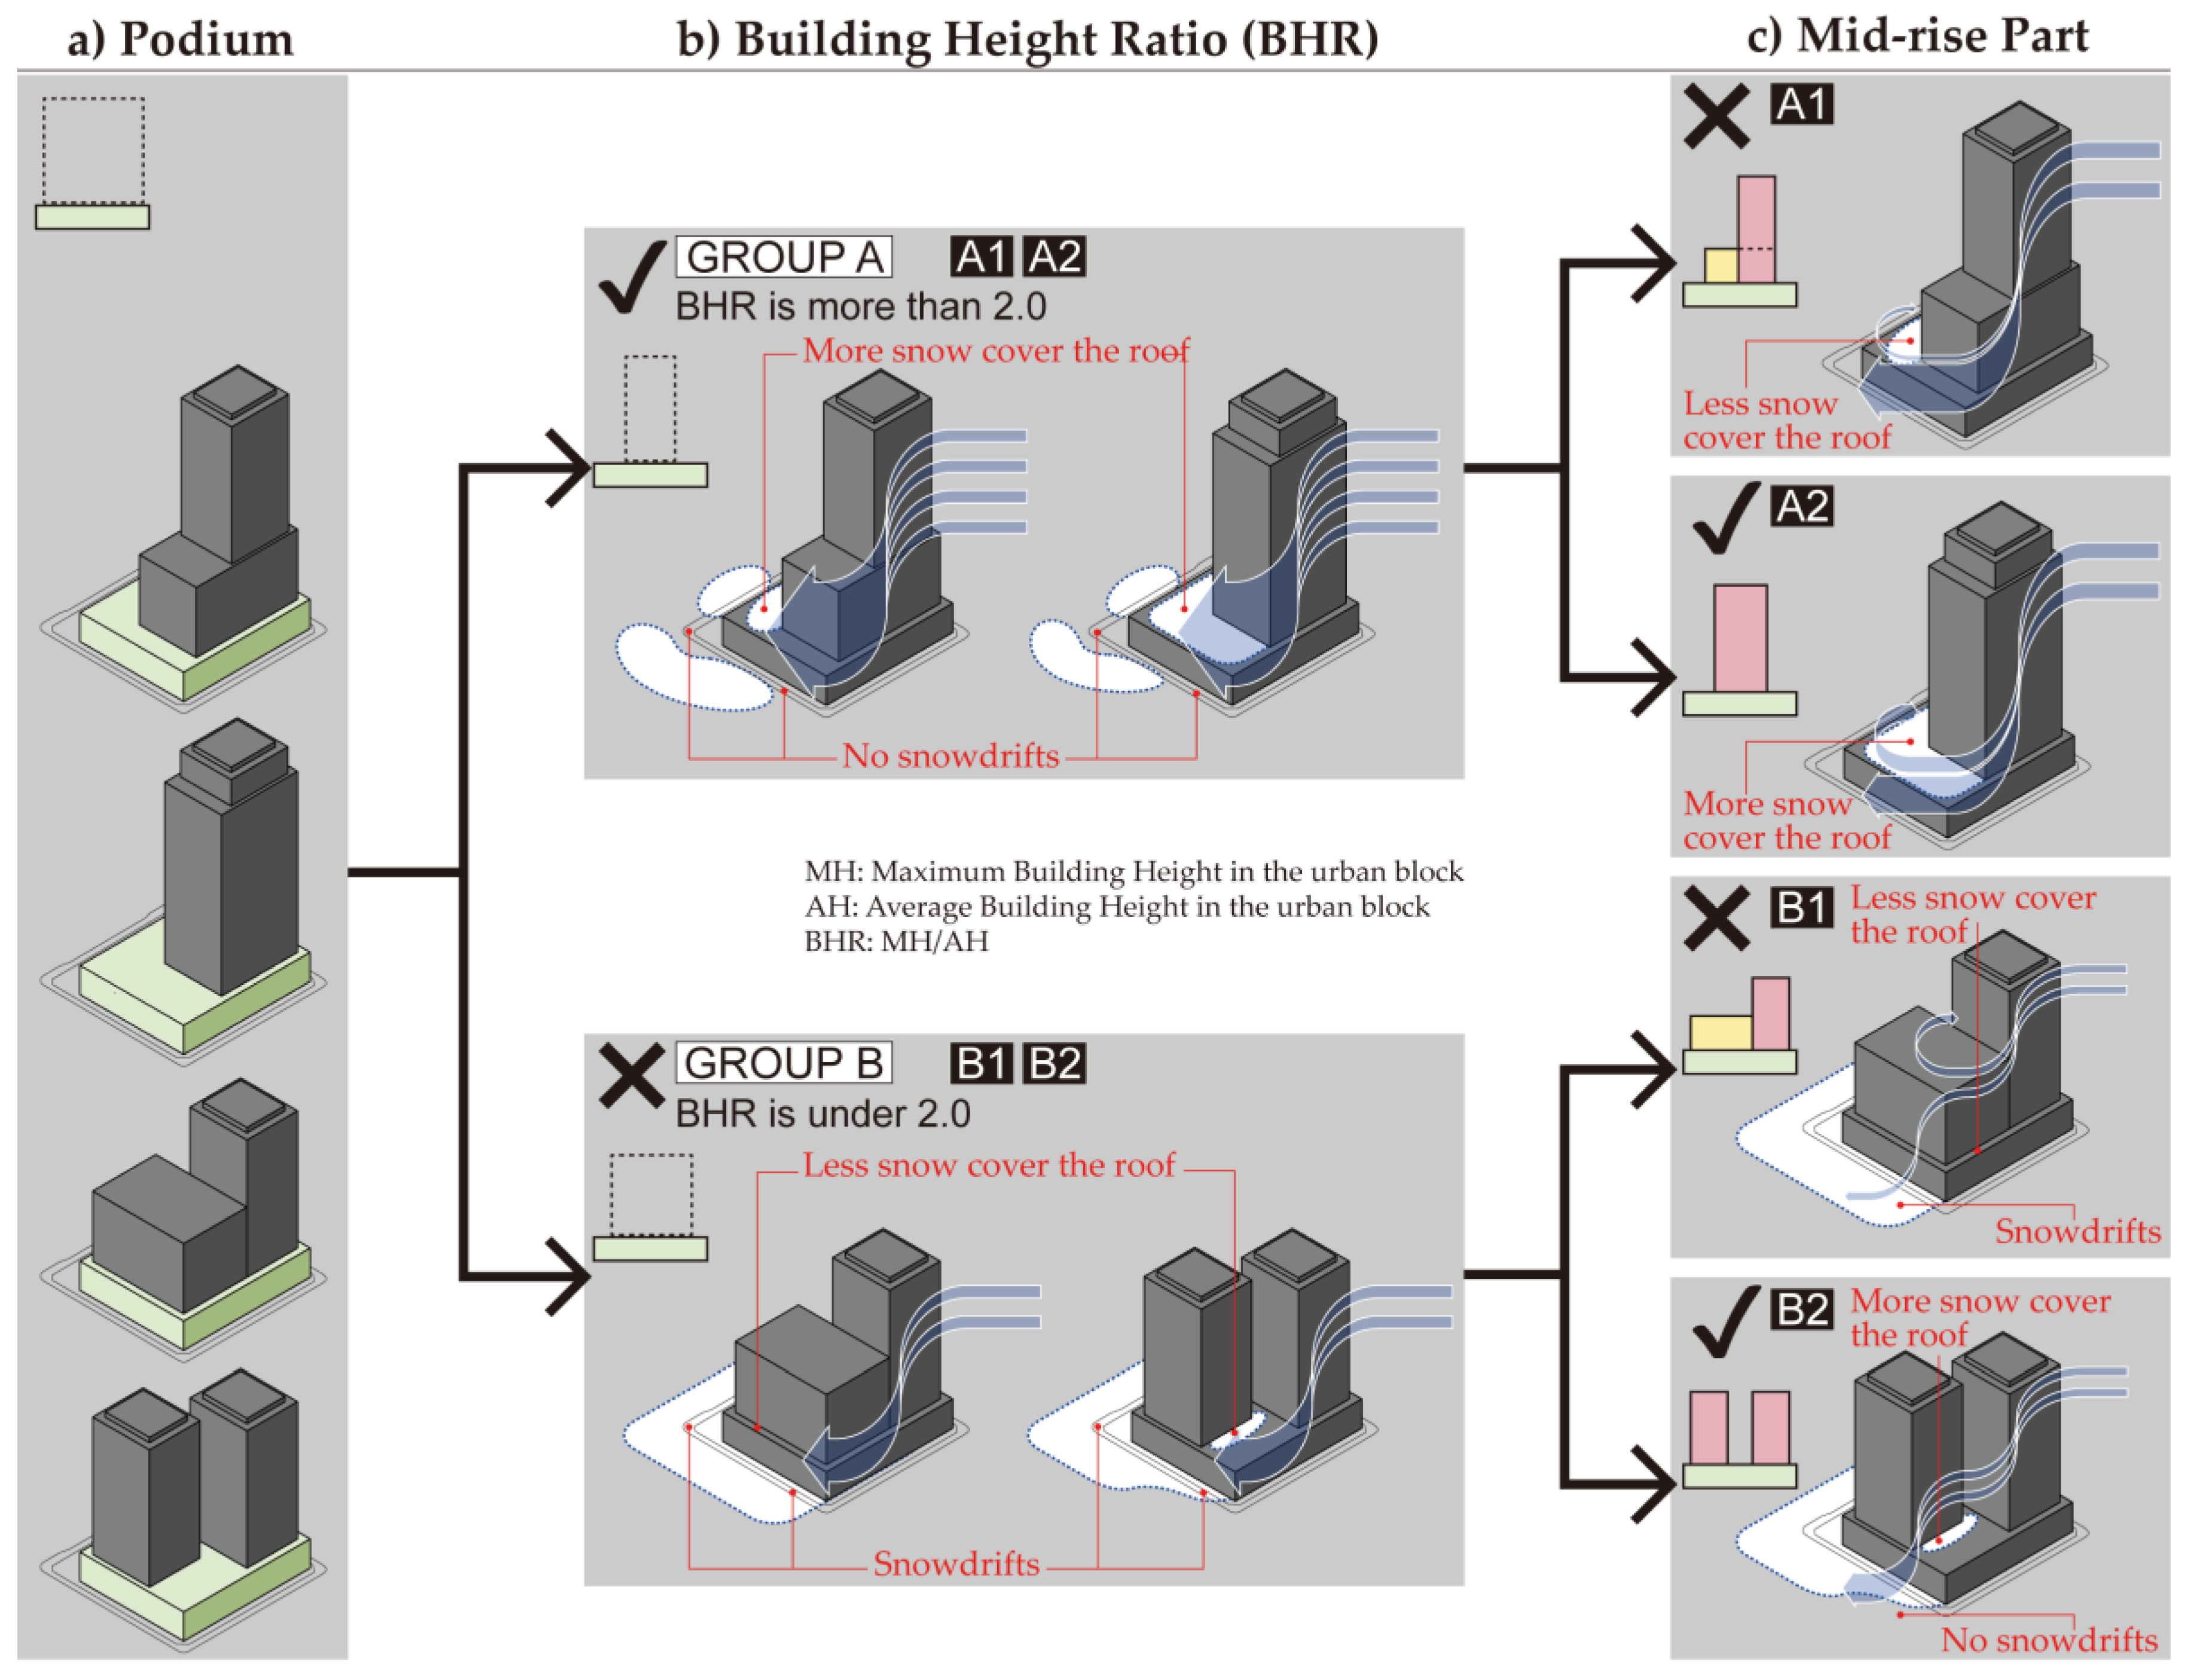
- 1)
- Building Height Ratio (Figure 14b): A higher building height ratio (BHR; the ratio of the maximum building height to the average building height in the urban block) like the group A is better for the urban block as this improves the snow conditions and lowers the required snow removal energy. Because the tower is taller and the area of the roof of the podium is larger, the wind deflected from the tower to the ground can be increased, which can be used to blow away any snow covering the ground, and the amount of snow that could cover the podium’s roof was greater, thereby reducing the formation of snowdrifts and lowering the snow removal energy required.
- 2)
- Mid-rise part in group A (Figure 14c): When an urban block is designed with high BHR like the group A, urban block design without the mid-rise part will reduce the formation of snowdrifts on the ground and lower the required snow removal energy. Because the area of the roof of the podium was larger, the snow covering the roof increased, thereby causing less snow to drift onto the ground.
- 3)
- Mid-rise part in group B (Figure 14c): When an urban block is designed with low BHR like the group B, urban block design with the mid-rise part will increase the formation of snowdrifts on the ground and raise the required snow removal energy. Because the area of the roof of the podium is smaller, the snow covering the roof decreased, thereby causing more snow to drift onto the ground. In addition, the winds deflected by the high-rise tower were intercepted by the mid-rise part, which reduced the wind velocity on the ground and caused the formation of snowdrifts.
Acknowledgments
Author Contributions
Conflicts of Interest
References
- Hebbert, M.; Jankovic, V. Cities and Climate Change: The Precedents and Why They Matter. Urban Stud. 2013, 50, 1332–1347. [Google Scholar] [CrossRef]
- Juan, S.; Yoon, S. Deduction of Optimum Surface Design Factors for Enhancement of Outdoor Thermal Environment in a Micro-Scale Unit. Sustainability 2017, 9, 1381. [Google Scholar] [CrossRef]
- Heidari, A.; Sahebzadeh, S.; Dalvand, Z. Natural Ventilation in Vernacular Architecture of Sistan, Iran; Classification and CFD Study of Compound Rooms. Sustainability 2017, 9, 1048. [Google Scholar] [CrossRef]
- Yuan, C.; Ng, E. Building porosity for better urban ventilation in high-density cities—A computational parametric study. Build. Environ. 2012, 50, 176–189. [Google Scholar] [CrossRef]
- Yuan, C.; Ng, E. Practical application of CFD on environmentally sensitive architectural design at high density cities: A case study in Hong Kong. Urban Clim. 2014, 8, 57–77. [Google Scholar] [CrossRef]
- Ng, E. Policies and technical guidelines for urban planning of high-density cities—Air ventilation assessment (AVA) of Hong Kong. Build. Environ. 2009, 44, 1478–1488. [Google Scholar] [CrossRef]
- Ng, E.; Yuan, C.; Chen, L.; Ren, C.; Fung, J.C. Improving the wind environment in high-density cities by understanding urban morphology and surface roughness: A study in Hong Kong. Landsc. Urban Plan. 2011, 101, 59–74. [Google Scholar] [CrossRef]
- Szűcs, Á. Wind comfort in a public urban space—Case study within Dublin Docklands. Front. Arch. Res. 2013, 2, 50–66. [Google Scholar] [CrossRef]
- Blocken, B.; Janssen, W.D.; Hoff, T.V. CFD simulation for pedestrian wind comfort and wind safety in urban areas: General decision framework and case study for the Eindhoven University campus. Environ. Model. Softw. 2012, 30, 15–34. [Google Scholar] [CrossRef]
- Capeluto, I.G.; Yezioro, A.; Shaviv, E. Climatic aspects in urban design—A case study. Build. Environ. 2003, 38, 827–835. [Google Scholar] [CrossRef]
- Pressman, N. Northern Cityscape: Linking Design to Climate, 1st ed.; Enai, M., Ed.; Hokkaido University Press: Sapporo, Japan, 2002; pp. 49–143. [Google Scholar]
- Ebrahimabadi, S.; Nilsson, K.L.; Johansson, C. The problems of addressing microclimate factors in urban planning of the subarctic regions. Environ. Plan. B Urban Anal. City Sci. 2015, 42, 415–430. [Google Scholar] [CrossRef]
- Tominaga, Y.; Okaze, T.; Mochida, A. CFD modeling of snowdrift around a building: An overview of models and evaluation of a new approach. Build. Environ. 2011, 46, 899–910. [Google Scholar] [CrossRef]
- Okaze, T.; Tominaga, Y.; Mochida, A. Development of new snowdrift model based on two transport equations of drifting snow density: Numerical prediction of snowdrift around building using CFD (Part 2). J. Environ. Eng. 2013, 78, 149–156. [Google Scholar] [CrossRef]
- Kim, H.; Macdonald, E. Wind and the city: An evaluation of San Francisco’s planning approach since 1985. Environ. Plan. B Urban Anal. City Sci. 2015, 44, 10–32. [Google Scholar] [CrossRef]
- Murota, T. Wind tunnel modeling for flow around buildings. J. Wind Eng. 1984, 20, 33–49. [Google Scholar] [CrossRef]
- Kobayashi, T.; Chikamoto, T.; Umemiya, N.; Osada, K. Estimation of Natural Ventilation Flow Rate for a Pitched-Roof Detached House Provided with Monitor Roof. J. Environ. Eng. 2016, 81, 83–91. [Google Scholar] [CrossRef]
- Ishizaki, H.; Sung, I.; Kumatoi, T. Wind Tunnel Experiments of a Suspended Roof. Trans. Arch. Inst. Jpn. 1966, 126, 9–13. [Google Scholar] [CrossRef]
- Meng, X.; Setoguchi, T. Development of Urban Design Guidelines with Wind Tunnel Simulations for Downtown Districts in Winter Cities. J. Asian Arch. Build. Eng. 2010, 9, 355–362. [Google Scholar] [CrossRef]
- Bosselmann, P.; Flores, J.; Gray, W.; Priestley, T.; Anderson, R.; Arens, E.; Dowty, P.; So, S.; Kim, J.J. Sun, Wind, and Comfort: A Study of Open Spaces and Sidewalks in Four Downtown Areas; Institute of Urban & Regional Development, College of Environmental Design, University of California: Berkeley, CA, USA, 1984. [Google Scholar]
- Arens, E.; Bosselmann, P. Wind, sun and temperature—Predicting the thermal comfort of people in outdoor spaces. Build. Environ. 1989, 24, 315–320. [Google Scholar] [CrossRef]
- Anno, Y. Requirements for modeling of a snowdrift. Cold Reg. Sci. Technol. 1984, 8, 241–252. [Google Scholar] [CrossRef]
- Smedley, D.J.; Kwok, K.C.S.; Kim, D.H. Snowdrifting simulation around Davis Station workshop, Antarctica. J. Wind Eng. Ind. Aerodyn. 1993, 50, 153–162. [Google Scholar] [CrossRef]
- Yukawa, T.; Tsutsumi, T.; Taniguchi, N.; Tomabechi, T. Snow accumulation on residential area in snowy cold region. AIJ J. Technol. Des. 2012, 18, 1013–1017. [Google Scholar] [CrossRef]
- Mitsuhashi, H. Snowdrifting on building and wind tunnel experiment using model snow. J. Jpn. Soc. Snow Ice 2003, 65, 287–295. [Google Scholar] [CrossRef]
- Yukawa, T.; Taniguchi, N.; Tomabechi, T. Study on snow sedimentation area and the area planning of detached houses in snow and cold region. J. Arch. Plan. 2010, 75, 781–786. [Google Scholar] [CrossRef]
- Setoguchi, T. Efficiencies of Infill Developments against Snow Problem in Winter Cities—The Snow Simulations for Desirable Block Designs Using Wind Tunnel. J. Asian Arch. Build. Eng. 2004, 3, 335–340. [Google Scholar] [CrossRef]
- Setoguchi, T. New urban design approaches with snow simulations for cold and snowy cities. J. Asian Arch. Build. Eng. 2008, 7, 93–99. [Google Scholar] [CrossRef]
- Setoguchi, T.; Tsutsumi, T.; Takakura, M.; Matsuoka, Y.; Oyanagi, Y. Urban design guidelines for the urban complex redevelopment project provided from environmental assessments with snow and wind simulations: The new urban design approaches with snow and wind environmental assessments for snow and cold regions. J. Arch. Plan. 2006, 71, 131–138. [Google Scholar] [CrossRef]
- Setoguchi, T.; Tsutsumi, T. Snow and wind environmental assessment on the public space comparing high-rise and medium-rise building blocks using the wind tunnel simulation. J. Arch. Plan. 2007, 72, 167–174. [Google Scholar] [CrossRef]
- Setoguchi, T.; Tsutsumi, T. The comparison of snow and wind impacts between high-rise and medium-rise building blocks using the wind tunnel simulation for snow and cold cities. J. Arch. Plan. 2007, 72, 101–108. [Google Scholar] [CrossRef]
- Setoguchi, T.; Satoh, K.; Watanabe, N.; Tsutsumi, T. The urban design assessments for the relationship between urban envelope and snow remove energy using snow and wind simulations in snowy and cold cities. J. Arch. Plan. 2012, 77, 2789–2798. [Google Scholar] [CrossRef]
- Watanabe, N.; Setoguchi, T.; Sato, K.; Tsutsumi, T. New city block design approaches incorporating environmental assessment for downtown districts in cities with severe winter climates. J. Asian Arch. Build. Eng. 2016, 15, 455–462. [Google Scholar] [CrossRef]
- Nishio, F.; Ishida, T. Rate of turbulent energy dissipation during snow drifting. Low Temp. Sci. Ser. A Phys. Sci. 1973, 31, 69–85. [Google Scholar]
- Tomabechi, T.; Ueda, H. The applicability of using model snow with wind-tunnel experiments: Part2 Relation between snowdrift formation and frictional stress. In Proceedings of the AIJ Hokkaido Architectural Research Conference, Otaru, Japan, 23 March 1994; pp. 69–72. [Google Scholar]
- Oikawa, S.; Tomabechi, T.; Ishihara, T. One-day observations of snowdrifts around a model cube. J. Snow Eng. Jpn. 1999, 15, 283–291. [Google Scholar] [CrossRef]
- Oikawa, S.; Tomabechi, T.; Ishihara, T. Study of wind tunnel similarity on snowdrift around buildings. J. Snow Eng. Jpn. 2007, 23, 133–152. [Google Scholar] [CrossRef]
- Tsuchiya, M.; Tomabechi, T.; Hongo, T.; Ueda, H. Characteristics of wind flow acting on snowdrift on a stepped flat roof. J. Struct. Constr. Eng. 2002, 67, 53–59. [Google Scholar] [CrossRef]
- Tsutsumi, T. Issues of snowdrifts around buildings. Wind Eng. JAWE 2012, 37, 4–9. [Google Scholar] [CrossRef]
- Kubota, T.; Miura, M.; Tominaga, Y.; Mochida, A. Wind tunnel tests on the nature of regional wind flow in the 270 m square residential area, using the real model Effects of arrangement and structural patterns of buildings on the nature of regional wind flow part 1. J. Arch. Plan. Environ. Eng. 2000, 65, 109–116. [Google Scholar] [CrossRef]
- Emori, I.; Saito, K.; Sekimoto, K. Mokeijikken no Riron to Ouyou (Theory and Application of Model Experiments), 3rd ed.; Hakuhodo: Tokyo, Japan, 2000; pp. 2–43. [Google Scholar]
- Demographic Yearbook 2013 (United Nations). Available online: https://unstats.un.org/unsd/demographic/products/dyb/dybsets/2013.pdf (accessed on 5 October 2017).
- NNDC Climate Data Online (NOAA). Available online: https://www7.ncdc.noaa.gov/CDO/cdo (accessed on 5 October 2017).
- Weather Online Ltd. Meteorological Services. Available online: http://www.weatheronline.co.uk/about/About.htm (accessed on 5 October 2017).
- Weatherbase. Available online: http://www.weatherbase.com/about.php3 (accessed on 5 October 2017).
- Japan Meteorological Agency, Past Weather Data. Available online: http://www.data.jma.go.jp/obd/stats/etrn/index.php (accessed on 5 October 2017).
- Sapporo Urban Community Development Plan. Available online: http://www.city.sapporo.jp/kikaku/downtown/plan/documents/senryaku.pdf (accessed on 5 October 2017).


| Simulation | Building Design | Urban Design |
|---|---|---|
| For Only Wind | Murota [16] Kobayashi et al. [17] Ishizaki et al. [18] | Kim, H et al. [15] Meng, X et al. [19] Bosselmann et al. [20] Arens et al. [21] |
| For Wind and Snow | Anno [22] Smedley et al. [23] Yukawa et al. [24] Mitsuhashi [25] Yukawa et al. [26] | Setoguchi et al. [27,28,29,30,31,32] Watanabe et al. [33] |
| Basic Information | ||
|---|---|---|
| Natural snowmelt 1 | 3.76 | cm/day |
| Density of snow in Sapporo 2 | 393.9 | kg/m3 |
| Fusion heat of snow 3 | 333 | MJ/t |
| Transporting the snow covering the streets | ||
| Amount of snow per truckload | 10 | T |
| Distance from target area to snow dump and back | 10 | km |
| Fuel consumption by one truck (gas oil) 4 | 2.5 | km/L |
| Caloric value for gas oil 5 | 37.7 | MJ/L |
| CO2 emissions of gas oil 5 | 2.58 | kgCO2/L |
| Road heating for the snow covering the sidewalks | ||
| Efficiency of road heating | 20 | % |
| Caloric value for heating oil 5 | 36.7 | MJ/L |
| CO2 emissions of heating oil 5 | 2.49 | kgCO2/L |
| Estimated Items | Calculation Method | |
|---|---|---|
| 1) Snow cover amount on the streets | (m3/day) | St |
| 2) Weight of snow on the streets | (t/day) | St × 393.9 × 10⁻³ |
| 3) Number of truckloads of snow | Ceil(St × 393.9 × 10−3 × 1/10) | |
| 4) Total distance the snow is hauled | (km/day) | Ceil(St × 393.9 × 10−3 × 1/10) × 10 |
| 5) Gas oil volume required for snow hauling | (L/day) | Ceil(St × 393.9 × 10−3 × 1/10) × 10/2.5 |
| 6) Required energy to transport the snow | (GJ/day) | Ceil(St × 393.9 × 10−3 × 1/10) × 10/2.5 × 37.7 × 10−3 |
| 7) CO2 emissions to transport the snow | (tCO2/day) | Ceil(St × 393.9 × 10−3 × 1/10) × 10/2.5 × 2.58 × 10−3 |
| 8) Snow cover amount on the sidewalks and open spaces | (m3/day) | Sm |
| 9) Weight of snow on the sidewalks and open spaces | (t/day) | Sm × 393.9 × 10⁻³ |
| 10) Heat required to melt the snow | (GJ/day) | Sm × 393.9 × 10−3 × 333 × 10−3 |
| 11) Required energy to melt the snow | (GJ/day) | Sm × 393.9 × 10−3 × 333 × 10−3 × 1/0.2 |
| 12) Heating oil volume required for snow melting | (L/day) | Sm × 393.9 × 10⁻³∙333 × 10−3 × 1/0.2 × 36.7 × 10−3 |
| 13) CO2 emissions to melt the snow | (tCO2/day) | Sm × 393.9 × 10⁻³∙333 × 10−3 × 1/0.2 × 36.7 × 10−3 × 2.49 × 10−3 |
| 14) Total required energy for snow removal | (GJ/day) | Result of Equation 6) + Resut of Equation 11) |
| 15) Total CO2 emissions from snow removal | (tCO2/day) | Result of Equation 7) + Result of Equation 13) |
| Estimated Items | Case A1 | Case A2 | Case B1 | Case B2 | |
|---|---|---|---|---|---|
| a) Snow cover amount on target area | (m3/day) | 599.6 | 478.0 | 869.0 | 702.6 |
| b) Snow cover amount to be removed from target area | (m3/day) | 220.4 | 150.8 | 462.7 | 369.0 |
| c) Percentage of snow on the streets | (%) | 51.5 | 62.1 | 55.8 | 50.6 |
| d) Percentage of snow on the sidewalks and open spaces | (%) | 48.5 | 37.9 | 45.2 | 49.4 |
| 1) Snow cover amount on the streets | (m3/day) | 113.4 | 93.6 | 258.2 | 186.7 |
| 2) Weight of snow on the streets | (t/day) | 44.7 | 36.9 | 101.7 | 73.5 |
| 3) Number of truckloads of snow | 45 | 37 | 102 | 74 | |
| 4) Total distance the snow is haule | (km/day) | 450.0 | 370.0 | 1020.0 | 740.0 |
| 5) Gas oil volume required for snow hauling | (L/day) | 180.0 | 148.0 | 408.0 | 296.0 |
| 6) Required energy to transport the snow | (GJ/day) | 6.8 | 5.6 | 15.4 | 11.2 |
| 7) CO2 emissions to transport the snow | (tCO2/day) | 0.46 | 0.38 | 1.05 | 0.76 |
| 8) Snow cover amount on the sidewalks and open spaces | (m3/day) | 106.9 | 57.2 | 208.3 | 182.3 |
| 9) Weight of snow on the sidewalks and open spaces | (t/day) | 42.1 | 22.5 | 82.0 | 71.8 |
| 10) Heat required to melt the snow | (GJ/day) | 14.0 | 7.5 | 27.3 | 23.9 |
| 11) Required energy to melt the snow | (GJ/day) | 70.1 | 37.5 | 136.6 | 119.6 |
| 12) Heating oil volume required for snow melting | (L/day) | 1911.1 | 1021.3 | 3721.6 | 3258.6 |
| 13) CO2 emissions to melt the snow | (tCO2/day) | 4.76 | 2.54 | 9.27 | 8.11 |
| 14) Total required energy for snow removal | (GJ/day) | 76.9 | 43.1 | 152.0 | 130.7 |
| 15) Total CO2 emissions from snow removal | (tCO2/day) | 5.22 | 2.92 | 10.32 | 8.88 |
© 2017 by the authors. Licensee MDPI, Basel, Switzerland. This article is an open access article distributed under the terms and conditions of the Creative Commons Attribution (CC BY) license (http://creativecommons.org/licenses/by/4.0/).
Share and Cite
Watanabe, N.; Setoguchi, T.; Maeda, K.; Iwakuni, D.; Guo, Z.; Tsutsumi, T. Sustainable Block Design Process for High-Rise and High-Density Districts with Snow and Wind Simulations for Winter Cities. Sustainability 2017, 9, 2132. https://doi.org/10.3390/su9112132
Watanabe N, Setoguchi T, Maeda K, Iwakuni D, Guo Z, Tsutsumi T. Sustainable Block Design Process for High-Rise and High-Density Districts with Snow and Wind Simulations for Winter Cities. Sustainability. 2017; 9(11):2132. https://doi.org/10.3390/su9112132
Chicago/Turabian StyleWatanabe, Norihiro, Tsuyoshi Setoguchi, Kosuke Maeda, Daiki Iwakuni, Zhiming Guo, and Takuya Tsutsumi. 2017. "Sustainable Block Design Process for High-Rise and High-Density Districts with Snow and Wind Simulations for Winter Cities" Sustainability 9, no. 11: 2132. https://doi.org/10.3390/su9112132