Article

Spatial Estimation and Visualization of CO2 Emissions for Campus Sustainability: The Case of King Abdullah University of Science and Technology (KAUST), Saudi Arabia

by
Yusuf A. Adenle
* and
Habib M. Alshuwaikhat
*
Department of City and Regional Planning, King Fahd University of Petroleum & Minerals, KFUPM Box 1632, Dhahran 31261, Saudi Arabia
*
Authors to whom correspondence should be addressed.
Sustainability 2017, 9(11), 2124; https://doi.org/10.3390/su9112124
Submission received: 4 October 2017 / Revised: 10 November 2017 / Accepted: 13 November 2017 / Published: 17 November 2017

Abstract

:
A total of 21 metric tons of CO2 per person in terms of per capita emissions from consumption of energy was recorded in Saudi Arabia in 2011 and forecasts have shown that this emission of CO2 is increasing. This poses the threat of climate change and global warming and therefore the need for the sustainability of the country. The Kingdom of Saudi Arabia’s Vision for 2030 addresses environmental sustainability that includes a reduction in CO2 emissions as well as diversified economic growth. Universities have been regarded as institutions with significant responsibilities to resolve the issues of sustainability as well as serve as role model to society by implementing a sustainability plan. This study established a spatial evaluation, estimation, and visualization of the CO2 emissions of King Abdullah University of Science and Technology (KAUST), Saudi Arabia. The data required for this study were collected from the overall coverage of the university campus buildings by transforming raster data from the satellite image to vector data in the form of polygons, and then multiplying the area by the number of floors of the individual building. ArcGIS 10.3® (ESRI, Redlands, CA, USA) software was used for this campus CO2 emissions evaluation and visualization. The overall estimate of the CO2 emissions for the university campus was 127.7-tons CO2 equivalent. The lowest emission was 0.02-tons CO2 equivalent while the maximum value was 20.9-tons of CO2 equivalent. By this ArcGIS-based evaluation, it is evident that geographically integrated model for campus estimation and visualization of CO2 emissions provides the information for decision makers to develop viable strategies for achieving a higher standard in overall campus sustainability and addressing the issue of climate change.

1. Introduction

The kingdom of Saudi Arabia (KSA) is one of the largest producers of crude oil among the Organization of the Petroleum Exporting Countries (OPEC) with a daily production of 10.19 million barrels and proven crude oil reserves of 266,456 million barrels in 2015 [1]. In 2011, a total of 21 metric tons of CO2 per person in terms of per capita emissions from consumption of energy was recorded in Saudi Arabia [2]. Based on the ranking of CO2 emissions, KSA was ranked 12th, and 13th for its energy consumption per capita on a global scale in the year 2010. In 2008, KSA produced 16.6-ton CO2 equivalent/capita (eq./cap)., and was placed in 12th position in the world ranking for greenhouse gas (GHG) emissions per capita [3]. Scholars such as Olabemiwo et al. (2017) and Ahmed (2016), forecasting the emission of CO2 using different software and methods, discovered that the emission of CO2 is increasing in KSA [2,4]. This poses the threat of climate change and global warming, and therefore the need for the sustainability of the country.
Sustainability has been widely recognized as an important goal by many countries around the world. The Global Goals, which is also referred to as sustainable development goals (SDGs), addresses commitments toward the actualization of several sustainable initiatives and the eradication of key human challenges. Achieving integrated and strategic goals for social, economic and environmental sustainability at the international level have been confronted with various challenges despite the benefits of the global commitments for sustainable development. At the sovereign national level, individual countries are also surmounted with country-specific difficulties in implementing their sustainability initiatives. However, SDGs provides the platform for individual countries to implement their sustainability goals and targets in an approach that is in line with the country’s authority over its economic, human and natural resources [5]. The unique local regulations, development policies, and socio-economic status of each country necessitate a special sustainability initiative that fit the country’s needs and conditions. To put KSA on the course of environmental sustainability that includes a reduction in CO2 emissions as well as diversified economic growth, the country developed a vision for 2030 in the year 2016 [6].
Sustainability has now become a national and an international endeavor with several agencies in KSA performing different responsibilities in attaining the principles of environmental sustainability and reduction in the emission of CO2. Such responsibilities include environmental awareness by the Ministry of Culture and Information (MoCI), periodical checking of vehicles with regards to air pollution by the Ministry of Interior (MOI), as well as the delivery of urban and rural services with reference to waste management and cleaning of urban centers and environmental health by the Ministry of Municipal and Rural Affairs (MOMRA) [7].
However, universities have been regarded as institutions with significant responsibilities to resolve the issues of sustainability as well as serve as role model to the society by implementing the sustainable plan [8,9] that entails monitoring the negative consequences of the university operations. Sustainability has attained much attention in education and research policies [10]. This has made some universities stakeholders have a consensus that universities have a vital role in sustainable development. In addition, that declaration on sustainability in higher education has provided the basis for the acceptance of national legislative measures in most western countries. With no doubt, the sustainability declarations in higher education have great significance in the strategic roles of universities toward the implementation of sustainability at the national level of several countries since 1990 [10].
The 1972 Stockholm declaration states that countries across the globe need to establish an environment that is suitable for both the existing and the unborn generations as a paramount goal to be followed with harmony. The aim of the Talloires Declaration is for higher education institutions (HEIs) to become leaders in creating and maintaining a sustainable world [11] while the mission of the Second Nature, which was created in 1993, is to achieve a sustainable society via HEIs [12]. The Declaration of Barcelona, which was formulated in 2004 during the session on Engineering for Sustainable Development (ESD), charged engineers to assist in redirecting their nations. It also appears in the 2008 Sapporo Declaration that the G8 countries were encouraged to implement explicit initiatives of education and research as well as to ensure stronger synergy between their nations and the university sector to ensure sustainable development [10].
From the review of literature on the assessment and estimation of carbon emissions in developed and developing countries including KSA and despite all the known cases of different CO2 emissions estimation framework from several renowned institutions. There exists a gap in knowledge on the integration of CO2 emissions with the spatial form of academic campuses as space, location, and geography are the prime variables associated with the emission of GHG. Considering all the aforementioned, this research aims to establish a spatial evaluation, estimation, and visualization of the CO2 emissions of one of the government own universities in KSA. The public university that this research covered is the King Abdullah University of Science and Technology (KAUST). It is interesting to study the estimate of CO2 emissions and the potential impacts of this university and its inhabitants over the environment. Lessons learned from this model mini-city (KAUST) could help KSA to prevent the challenges of climate change and global warming and ensure sustainability as it moves onto greater modern systems.

2. Literature Review

2.1. CO2 Emissions and International Organizations Involvement

The “carbon footprint is a measure of the exclusive total amount of carbon dioxide emissions that is directly and indirectly caused by an activity or is accumulated over the life stages of a product” [13] (p. 4). From 1970 to 2004, the world experienced a rise of approximately 70% emission of GHG (CO2, CH4, N2O, HFC, PFC, and SF6, as listed by the Kyoto Protocol), of which CO2 was the highest emission that was released into the atmosphere with 80% [14]. These GHGs have the potentials of causing several global warming effects. The international organizations and efforts, directly and indirectly, combating climate change and ensuring the reduction of the carbon footprint from the perspective of eradication of poverty, energy reduction and sustainable development include the Millennium Development Goals (MDGs), SDGs as well as the UN Commission on Sustainable Development (CSD). Others are the World Bank, UN General Assembly, World Trade Organization (WTO), Clean Energy and Sustainable Development, the Organization for Economic Co-operation and Development (OECD), and the G8 Dialogue on Climate Change [14]. Goal 13 of the SDGs specifically focuses on the need for addressing as well as tackling the issue of climate change, which is the aim of this research.

2.2. The 2030 Global Agenda for the Establishment of a Sustainable World

The 2030 global vision for the establishment of a sustainable world is a vision for a world that is more just, prosperous, and sustainable. Building on the achievements of the MDGs, it is a set of 17 sustainable development goals and 169 targets emphasizing the urgency to promote good well-being and healthy lives, modern and sustainable energy, inclusive and sustainable industrialization, safe and resilient cities, sustainable production and consumption, combat desertification and climate change by 2030 [5]. The SDGs, otherwise referred to as the Global Goals, have remarkable implications in the developed and the developing countries in the aspect of nation-building and calls for a unification and stability among environmental, social and economic expectations [15]. While the goals are universal in nature, the UN acknowledges that countries around the world have flexibility in determining the scale of their aspirations and agenda for transformation.
Much of the international discussions in the formation of the SDGs have tended to concentrate on the pressing needs of the least developed countries and the support they will need from the international community and the developed countries in achieving the goals. While some of the goals and targets tend to emphasize the needs and aspirations of developing countries, others express the responsibilities of the advanced countries to support the development process in the developing countries. Principally, the goals are designed to be global from the perspective of having a universally shared collective mission in the direction of a just and sustainable planet for all. It was unanimously agreed that all nations should be carried along in the direction of actualizing a global vision without anyone being sidelined [16].
In combating the negative impacts of climate change, one of the five targets of Goal 13 of the SDGs is an enhancement in education and capacity of institutions and humans on mitigating as well as raising awareness and giving early warnings of climate change [5]. A recent study conducted by Alshuwaikhat et al. (2016) that assessed the sustainability in Saudi public universities indicates the need for sustainable campus operations and the establishment of impactful sustainability research [8]. This study focuses on the spatial evaluation, estimation and the visualization of CO2 emissions in one of the Saudi public universities.

2.3. Towards a Sustainable Universities

A sustainable university is “a higher educational institution, as a whole or as a part, that addresses, involves and promotes, on a regional or a global level, the minimization of negative environmental, economic, societal, and health effects generated in the use of their resources in order to fulfill its functions of teaching, research, outreach and partnership, and stewardship in ways to help society make the transition to sustainable lifestyles” [17] (p. 812). In the process of developing a framework for evaluating the sustainability of Canadian university campuses in 2003, the Canadian universities campuses project team defines sustainability campus as a community that “acts upon its local and global responsibilities to protect and enhance the health and well-being of humans and ecosystems. It actively engages the knowledge of the university community to address the ecological and social challenges that we face now and in the future” [18] (p. 30). This definition was later modified in 2004 by the University of Waterloo WATgreen Advisory Committee [19].
However, there exists a consensus in the literature that a sustainable university denotes a healthier harmony among environmental, economic and social goals in the development of policy and practice and lasting understanding of the impacts of campus activities and operations [20]. According to Lukman and Glavic (2007), a sustainable university should encompass all the three dimensions of sustainable development. These dimensions are: (i) economic performance; (ii) social cohesion; and (iii) environmental protection [21]. Beringer and Adomssent (2008) stressed that a project of sustainable university should cover all the main aspects of that institution which include teaching, research, community outreach, knowledge sharing, academia and campus operations [22]. Many scholars argued for developing sustainable university project through structures or whole perspective assuming that the campus is a model sustainable community, a learning laboratory, a world of sustainability life or an organization of learning process regarding sustainability.
HEIs, directly or indirectly, influence their local, regional and national environment due to their operations, which mostly affect the future decision-making of the institution’s graduates. Hence, universities exclusively have a significant character in the communication of new knowledge and its distribution through educational information and technologies, and its practice in modern engineering procedures. HEIs have an important obligation in the society in terms of formulation of moral and practical skills and knowledge required to ensure an improved life quality for existing and future generations. Thus, the universities usually encountered challenges in making our futures sustainable, though we cannot achieve a sustainable domain where universities encourage unsustainability. As maintained by the Association of University Leaders for a Sustainable Future (ULSF), a university might adopt many ways to get itself involved in sustainable development [23]. It could be planning, design, community service, purchasing, outreach, education, and transportation. As such, this study demonstrates the integration of spatial dimension of campus operations along with identifying potential hotspots to achieve the estimation and visualization of the CO2 emissions of the university campus.

2.4. Sustainability and Estimation of CO2 Emissions in Saudi Universities

Currently, the Association for the Advancement of Sustainability in Higher Education (AASHE) is involved in the assessment of sustainability in Saudi universities. KAUST and Prince Sultan University are the only two AASHE members registered to use the Sustainability Tracking, Assessment and Rating System (STARS) tools [24]. The STARS framework comprises both private and public HEIs and is primarily formulated to: (a) provide a framework for comprehending sustainability in all areas of tertiary academic institutions; (b) facilitate logical comparisons over time throughout different level of academic institutions with a well-defined set of parameters developed from extensive public participation; (c) encourage constant improvement toward sustainability; (d) assist in the dissemination of information regarding tertiary level academic institutions sustainability achievements; and (e) develop a network of institutions implementing campus sustainability [25]. However, none of these two universities have participated in the original STARS pilot and they have no gold, silver, bronze or platinum rating. King Saud University seeks to attain a sustainable future in terms of its funding as part of the university strategic objectives, while one of the strategic goals of Princess Nourah bint Abdulrahman (a female only university) is to achieve a financial sustainability. Dar Al Uloom (a private university) aims to enhance its community outreach and societal engagement via sustainable development in one of its goals and values. In addition, the King Saud bin Abdulaziz University for Health Science aims to establish a university that is sustainable. Meanwhile, sustainable development is the overall mission of KAUST (the case study university).
A review of the literature that focuses on estimating the CO2 emissions of university campuses revealed that the studies were mostly carried out in the developed countries such as the United States of America [26,27,28,29], United Kingdom [30,31], Spain [32], and Norway [33]. Nonetheless, others were carried out in developing countries such as China [34,35], Thailand [36,37], South Africa [38], and Nigeria [39,40].
However, a study on the estimation of CO2 emissions in a Saudi university was identified. Almufadi and Irfan (2016) estimated the carbon footprint of Qassim University based on the categorization of GHG protocol scope [41]. An overall estimate of approximately 123,997,496 kg CO2 and 4.3-tons CO2 per person for the year 2016 was recorded. Scope 1, which comprises of a fleet of vehicles recorded an estimate of 217,744 kg CO2; Scope 2 comprising of electricity purchases had an estimated value of 79,807,882 kg CO2; and Scope 3 (faculty and student movement) had 44,083,550 kg CO2 [41]. The result shows that energy in the form of electricity had the highest CO2 emissions. Recommendations such as installations of solar power and planting of trees were suggested to ensure sustainability as well as a reduction in CO2 emissions at the university campus.
The construction of KAUST was astonishing because the concept of sustainability was integrated into the design and the building of the University campus from inception with a reward of LEED Platinum rating score for the accomplishment of such mission. However, Wiche (2012) reported that in terms of per capita, KAUST was among the 5 largest consumers of energy and water on the planet [3]. The campus energy source is a fossil-fuel based national electricity grid and a two-megawatt on-campus solar power plant. In 2011, the overall energy consumption of the campus was 431,541.43 MWh/yr. with a 0.83% which is equivalent to 3588.64 coming from the solar power plant. On the other hand, 156.7 MWh/cap.yr. was recorded as the total per capita consumption. However, total yearly CO2 emissions were 279,881.12-ton CO2/yr. for the five satellite stations and services area of KAUST. In addition, CO2 emissions per capita were 101.65-ton CO2/cap.yr. while the monthly average was 8.47 ton/cap.yr. [3].
Based on a comprehensive review of the literature on estimation and assessment of carbon emission, it was discovered that the methods mostly adopted in estimating carbon footprint are protocol scope categories and the extended input-output model. Riddel et al. (2009) [26] estimated CO2 emission of a university campus via the summation of its oil, natural gas and electricity consumption. In China, Li et al. (2015) [35] used an online survey to obtain the energy consumption of a university while Utraskul (2015) [36] utilized the internet based carbon footprint calculator of the Thailand GHG Management Organization to estimate carbon footprint of students in a Thailand university. Larsen et al. (2013) [33] and Gomez et al. (2016) [32] used an extended input-output model to estimate campus carbon footprint while Liu et al. (2017) [34] combined life cycle assessment and ecological foot evaluation to estimate carbon footprint. However, Letete et al. (2011) [38], Oludele et al. (2012) [40], Aroonsrimorakot et al. (2013) [37], Ologun and Wara (2014) [39], Townsend and Barret (2015) [31], and the study by Almufadi and Irfan (2016) [41] for a Saudi university all utilized the Protocol Scope Categories.
Based on all the aforementioned, this study aims at contributing to the research needs of estimating CO2 emissions of KAUST via an innovative method. This research developed a comprehensive spatial-based CO2 emission estimation and visualization for KAUST to cater for the needs of campus sustainability with spatial integration as a core focus. This is because space, geography and location are the paramount variables connected with the emission of GHG. The outcome of the study from KAUST will be channeled towards assisting the improvement of the planning, designing as well as the campus operations of other Saudi universities.

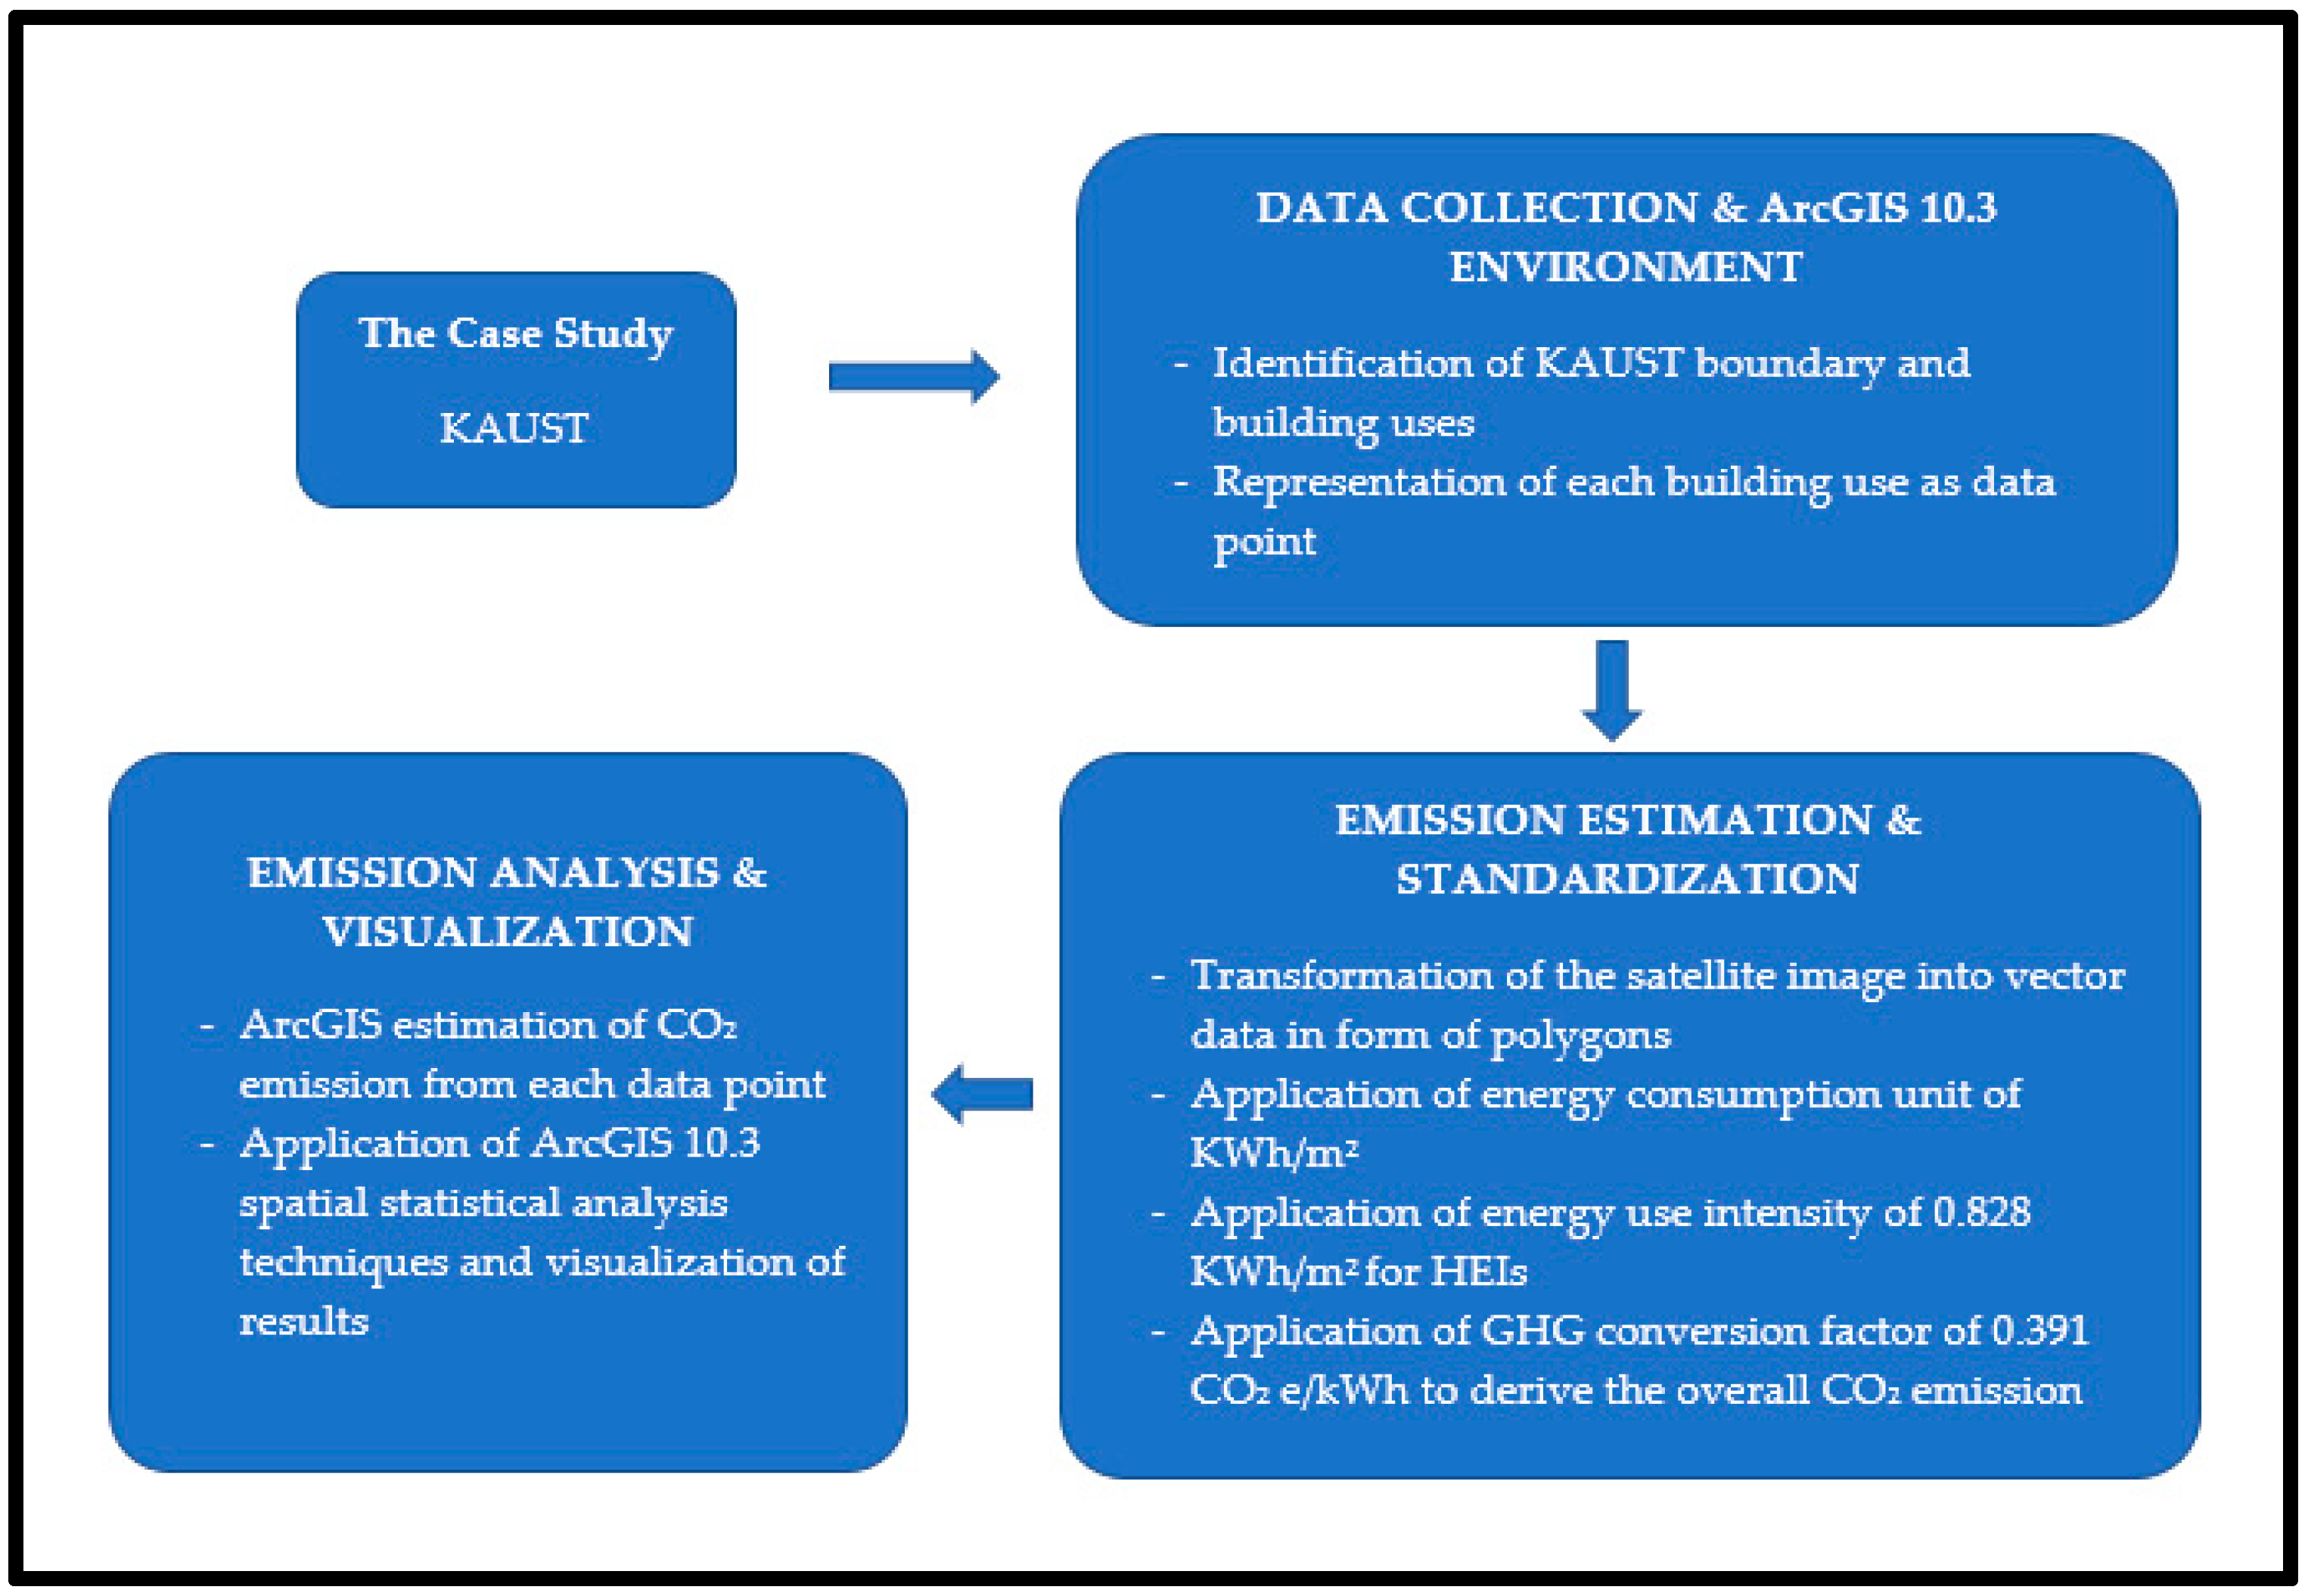
3. Research Methodology

The research structure that allows for reproducibility of this study is displayed in Figure 1, while the detail description of how the model has been developed is provided in Section 3.2, Section 3.3 and Section 3.4.

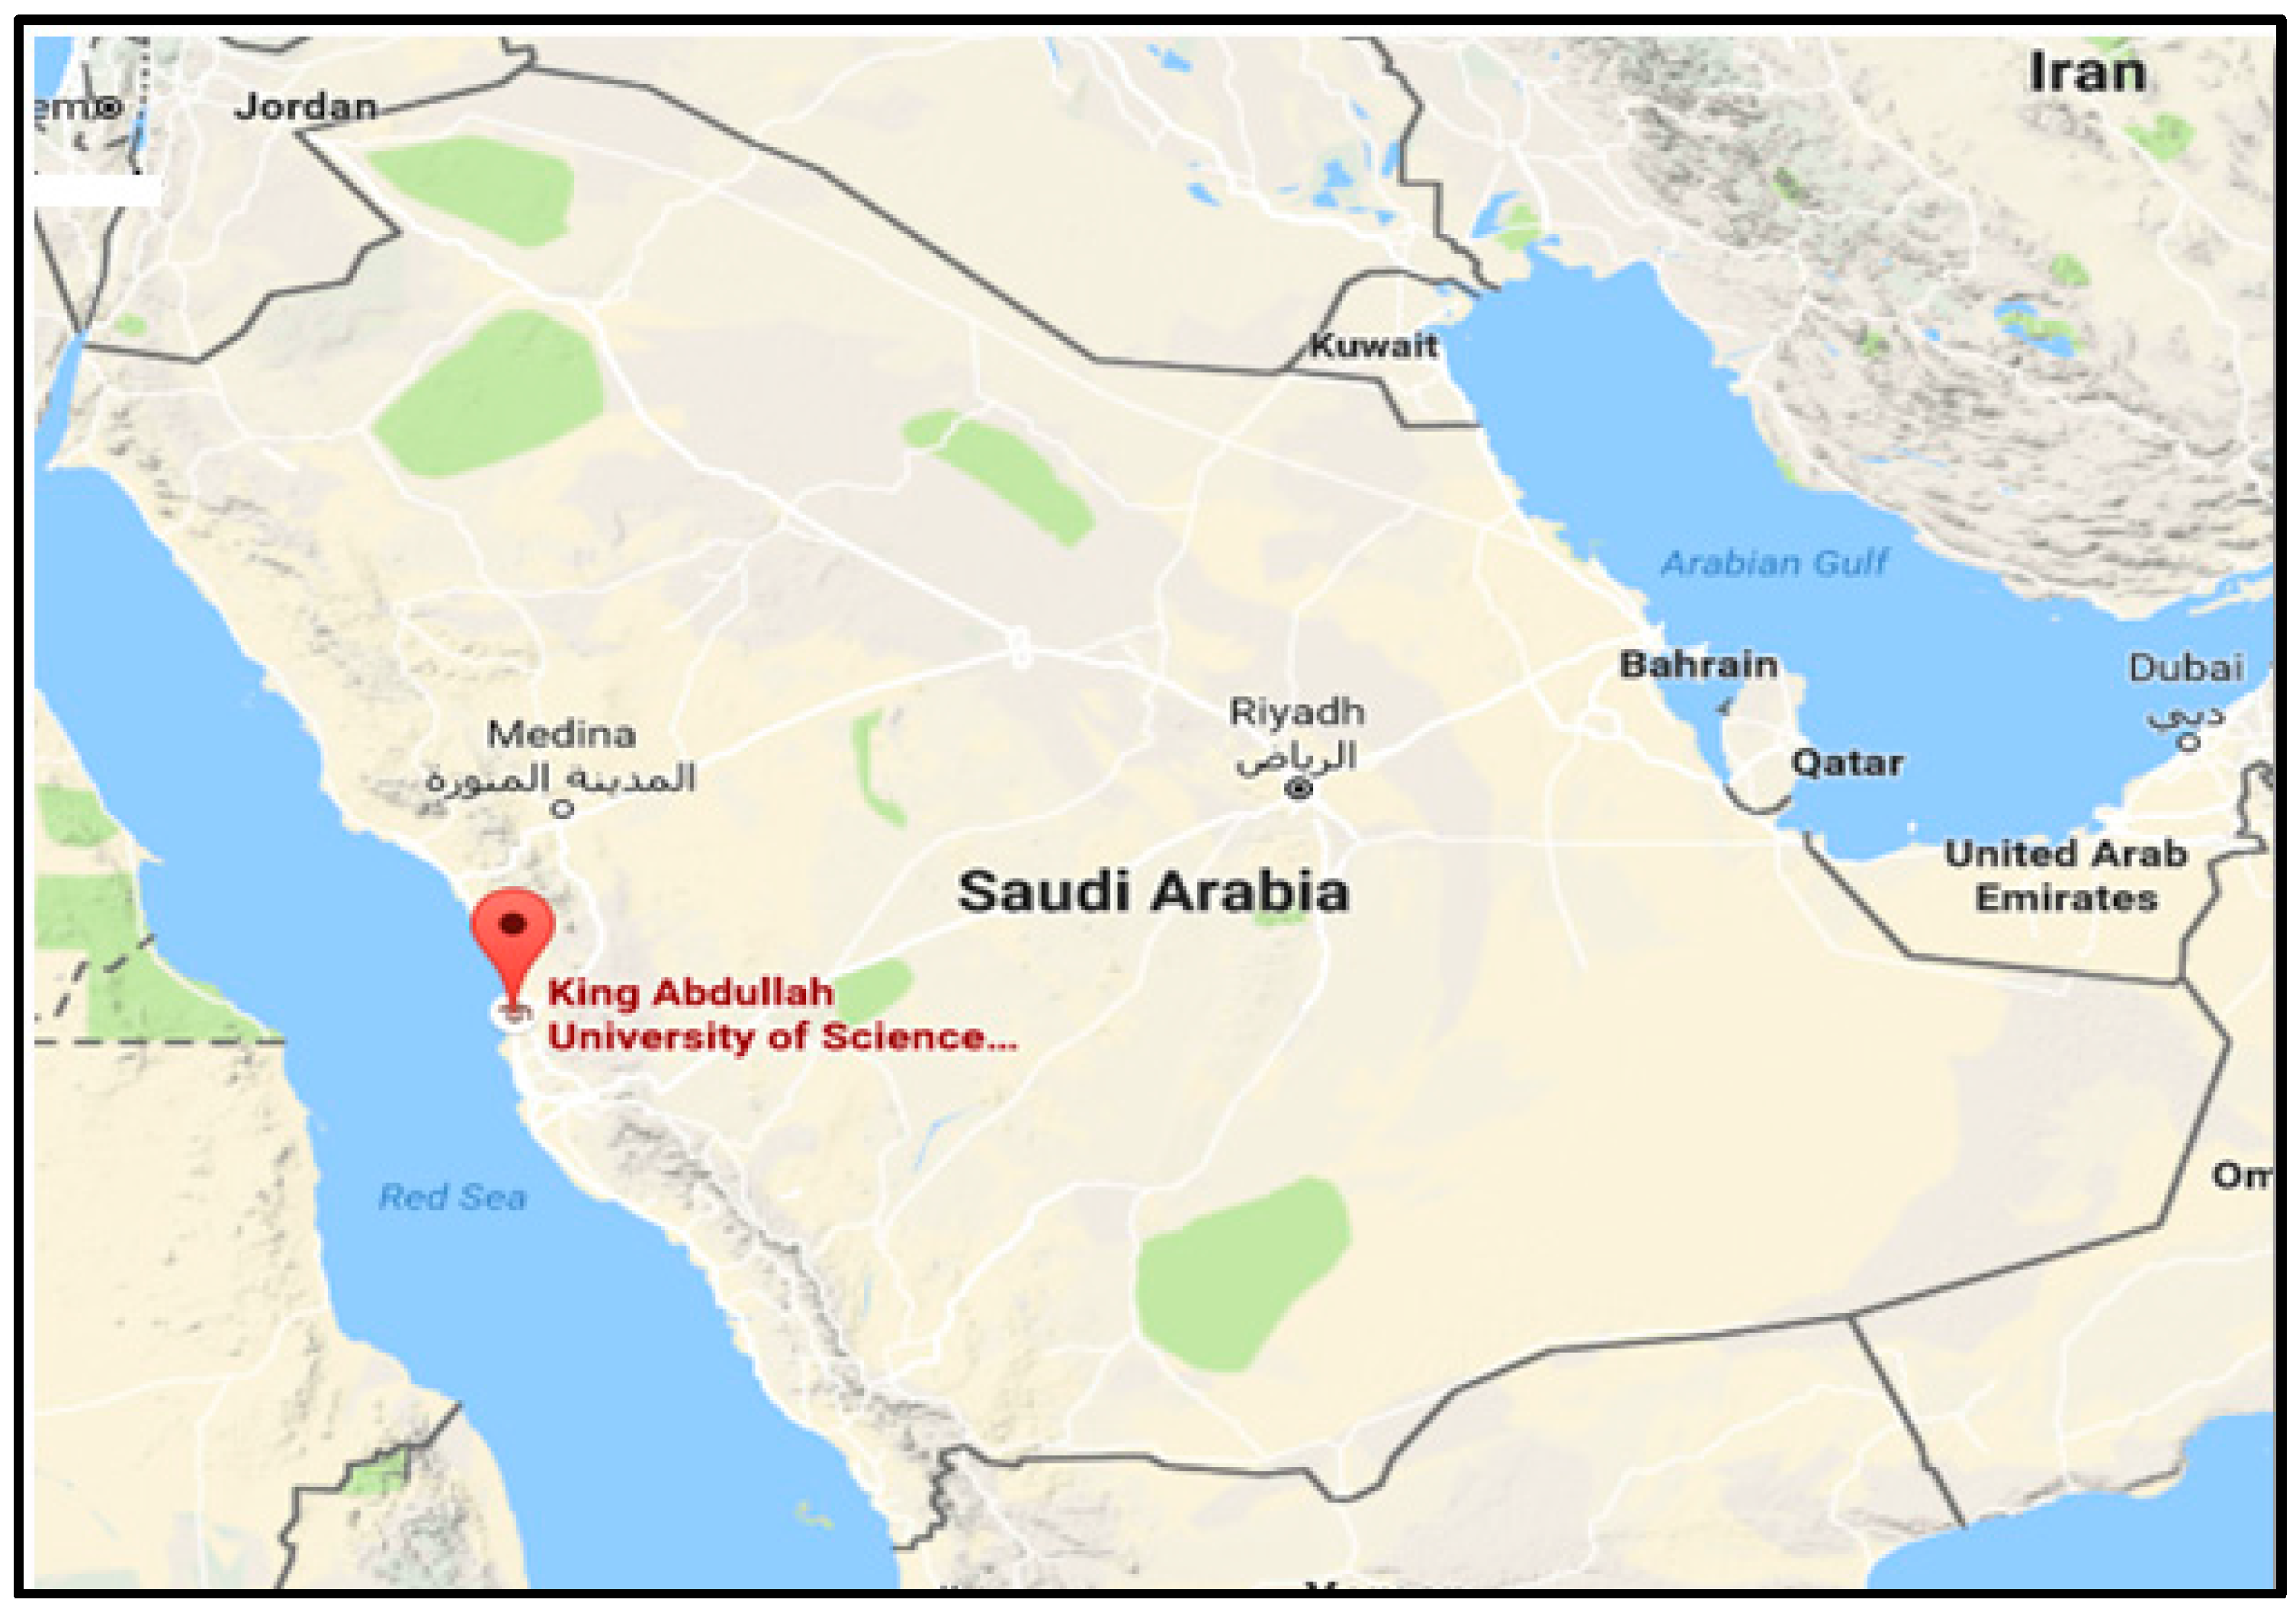
3.1. The Case Study—King Abdullah University of Science and Technology (KAUST)

The public university in KSA that this study covered is KAUST. KAUST is a graduate-only university inside a gated community located near Thuwal, 80 km north of Jeddah, in Saudi Arabia. Figure 2 shows the location of KAUST in KSA, while Figure 3 shows the three distinct areas of the campus: (i) the university campus; (ii) the living commons or community; and (iii) a service area.
However, the scope of this study was limited to the campus district of the study area. The closed character of KAUST gives an invaluable opportunity for estimating and spatially visualizing the campus.

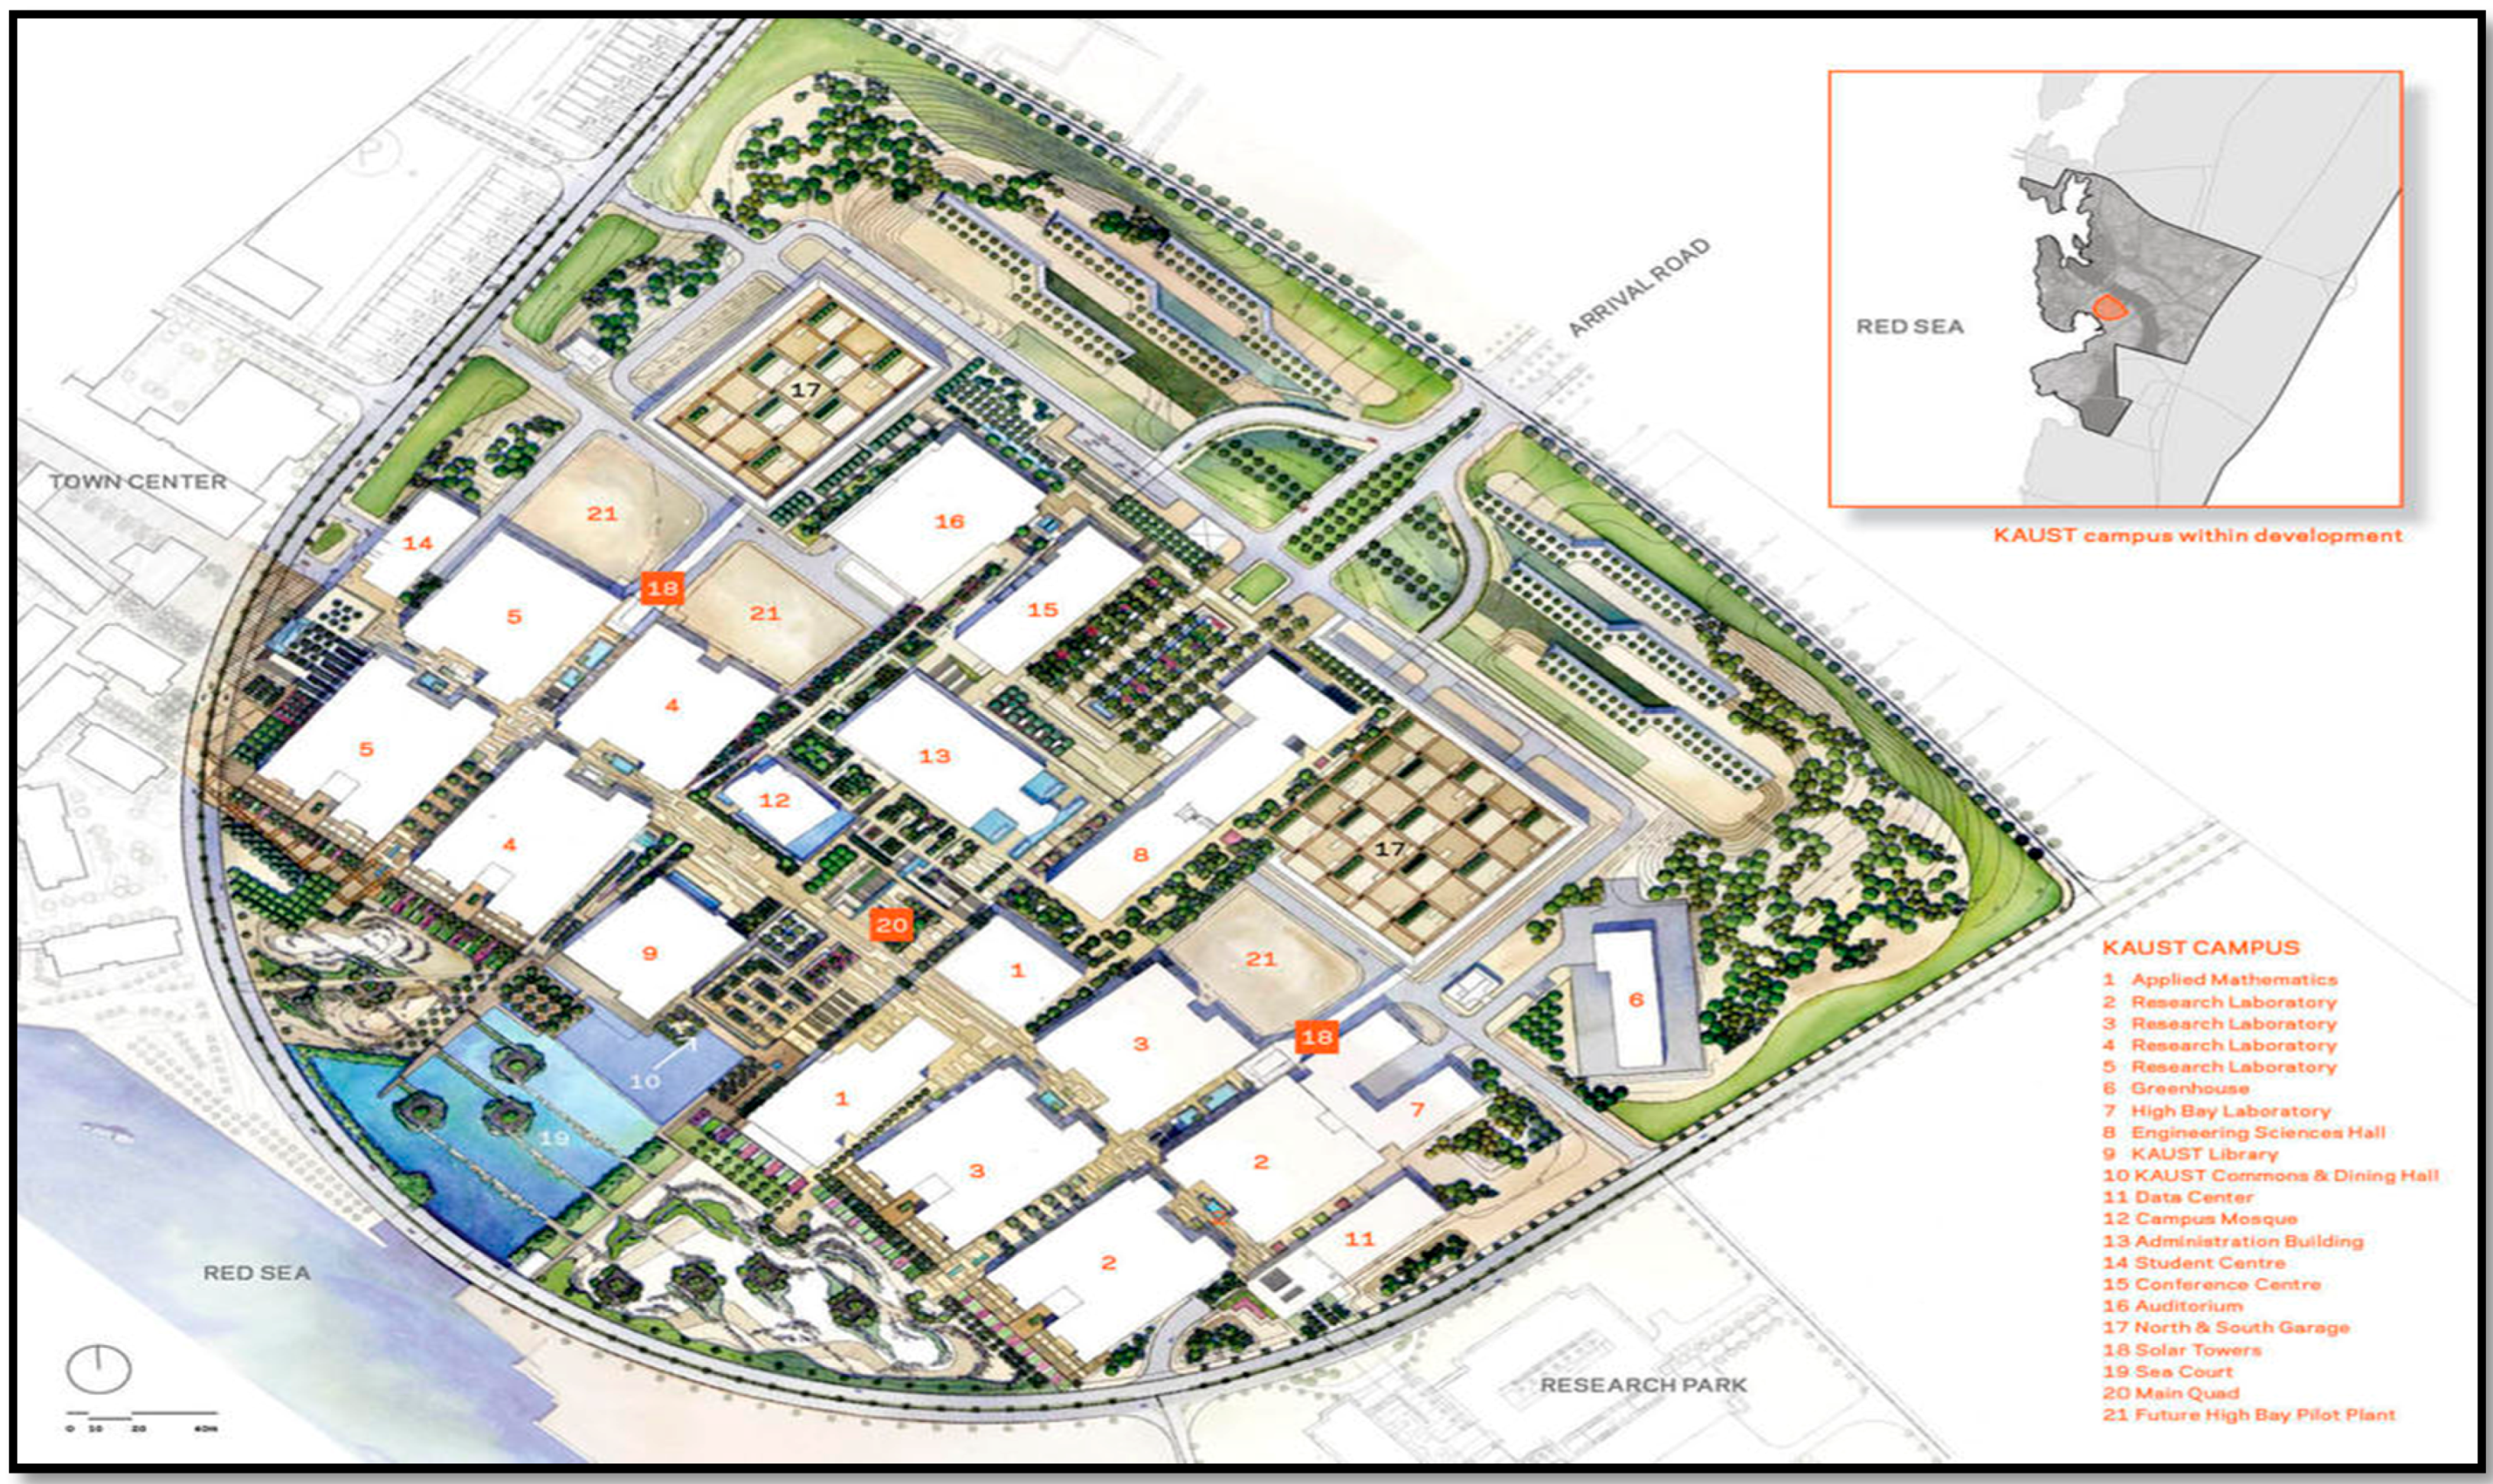
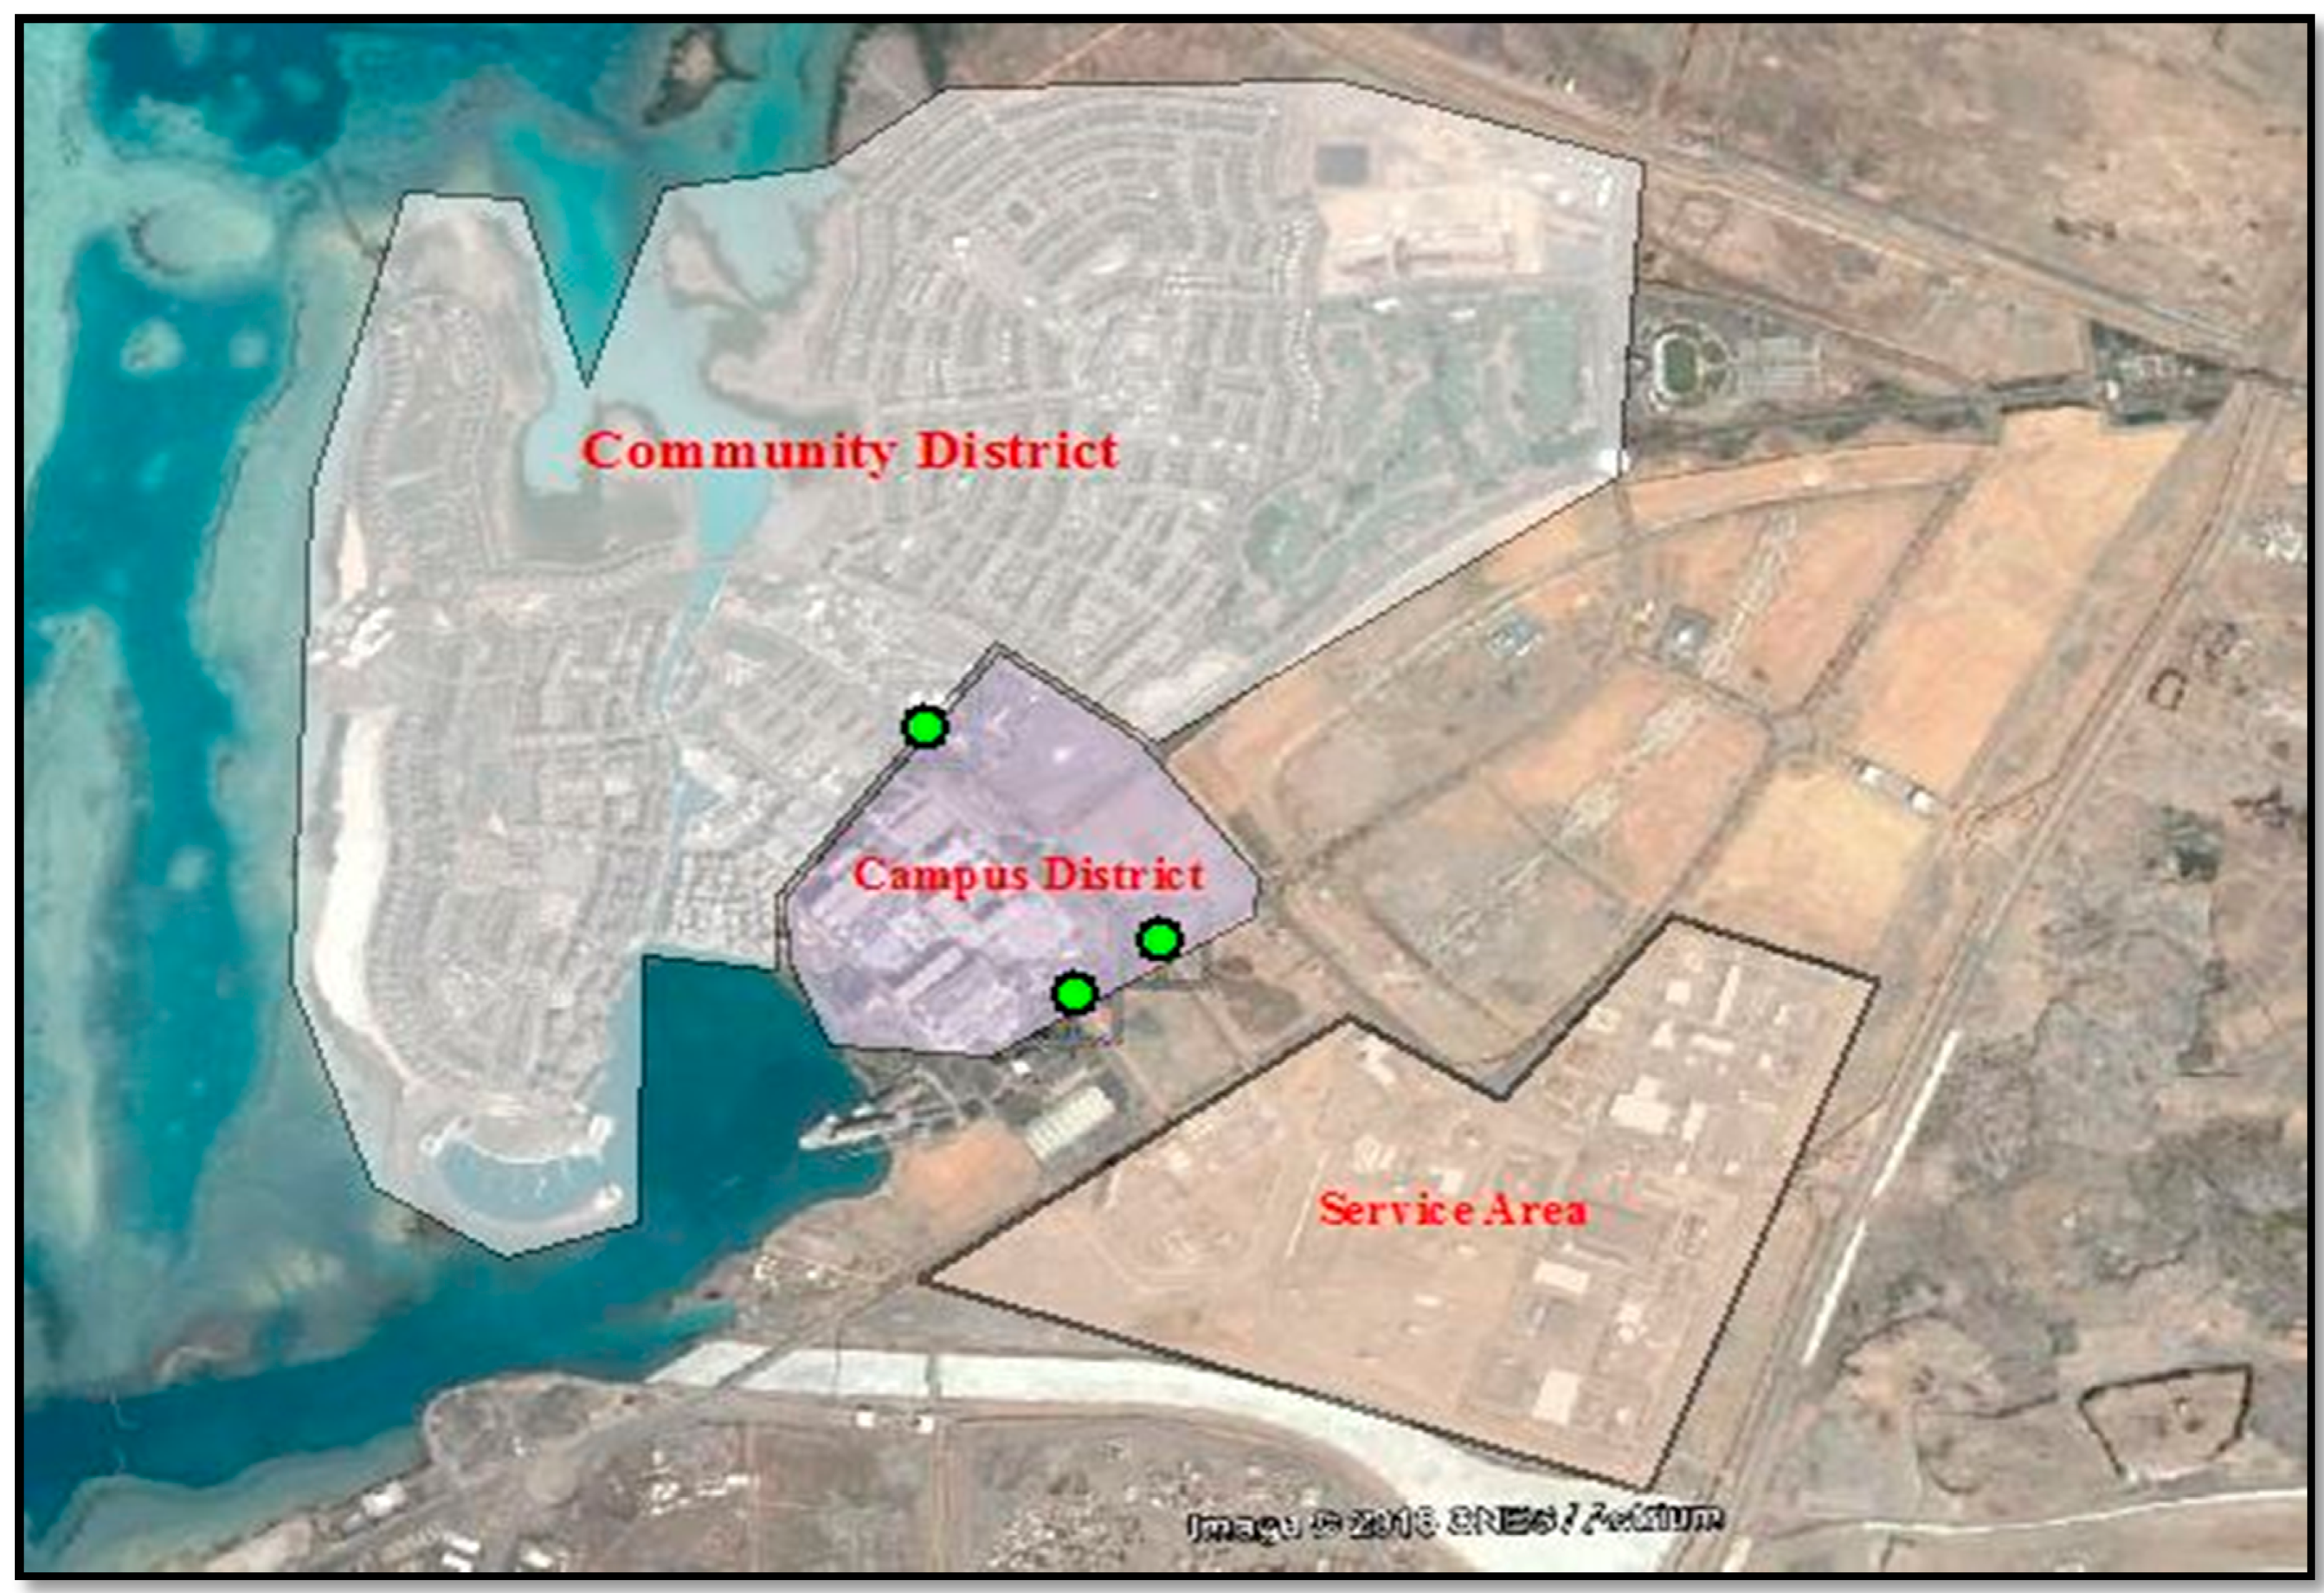
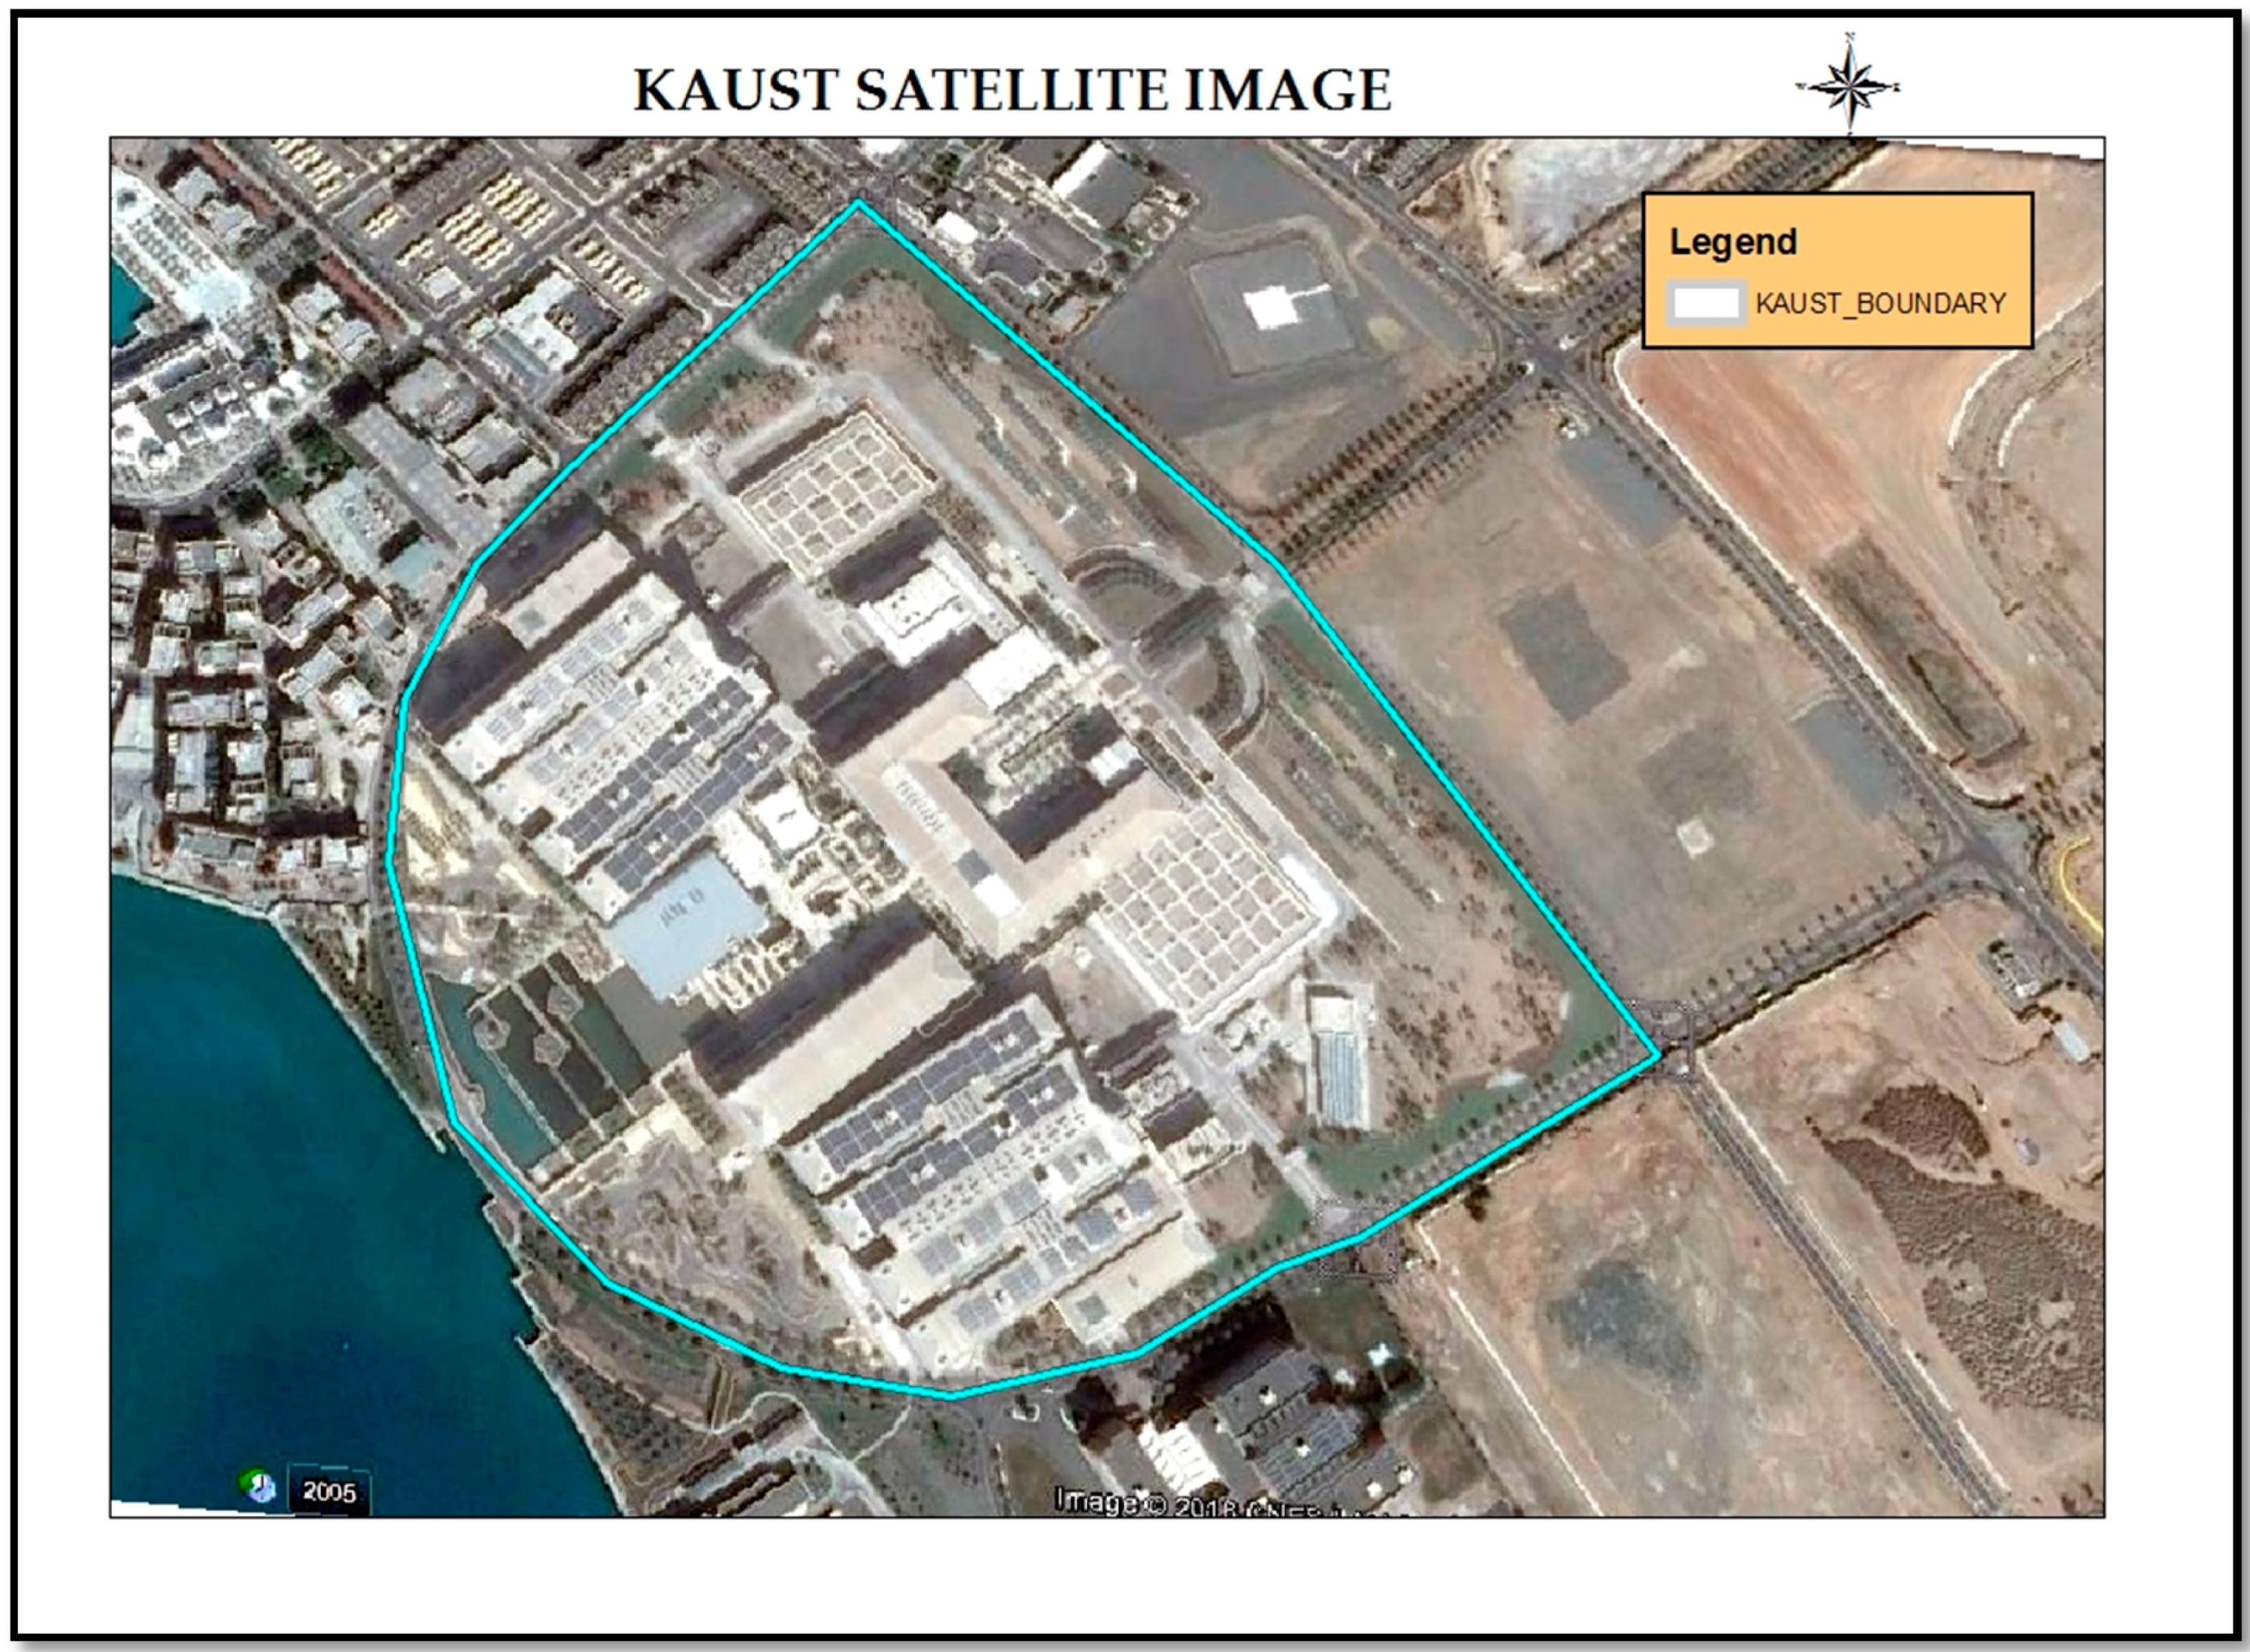
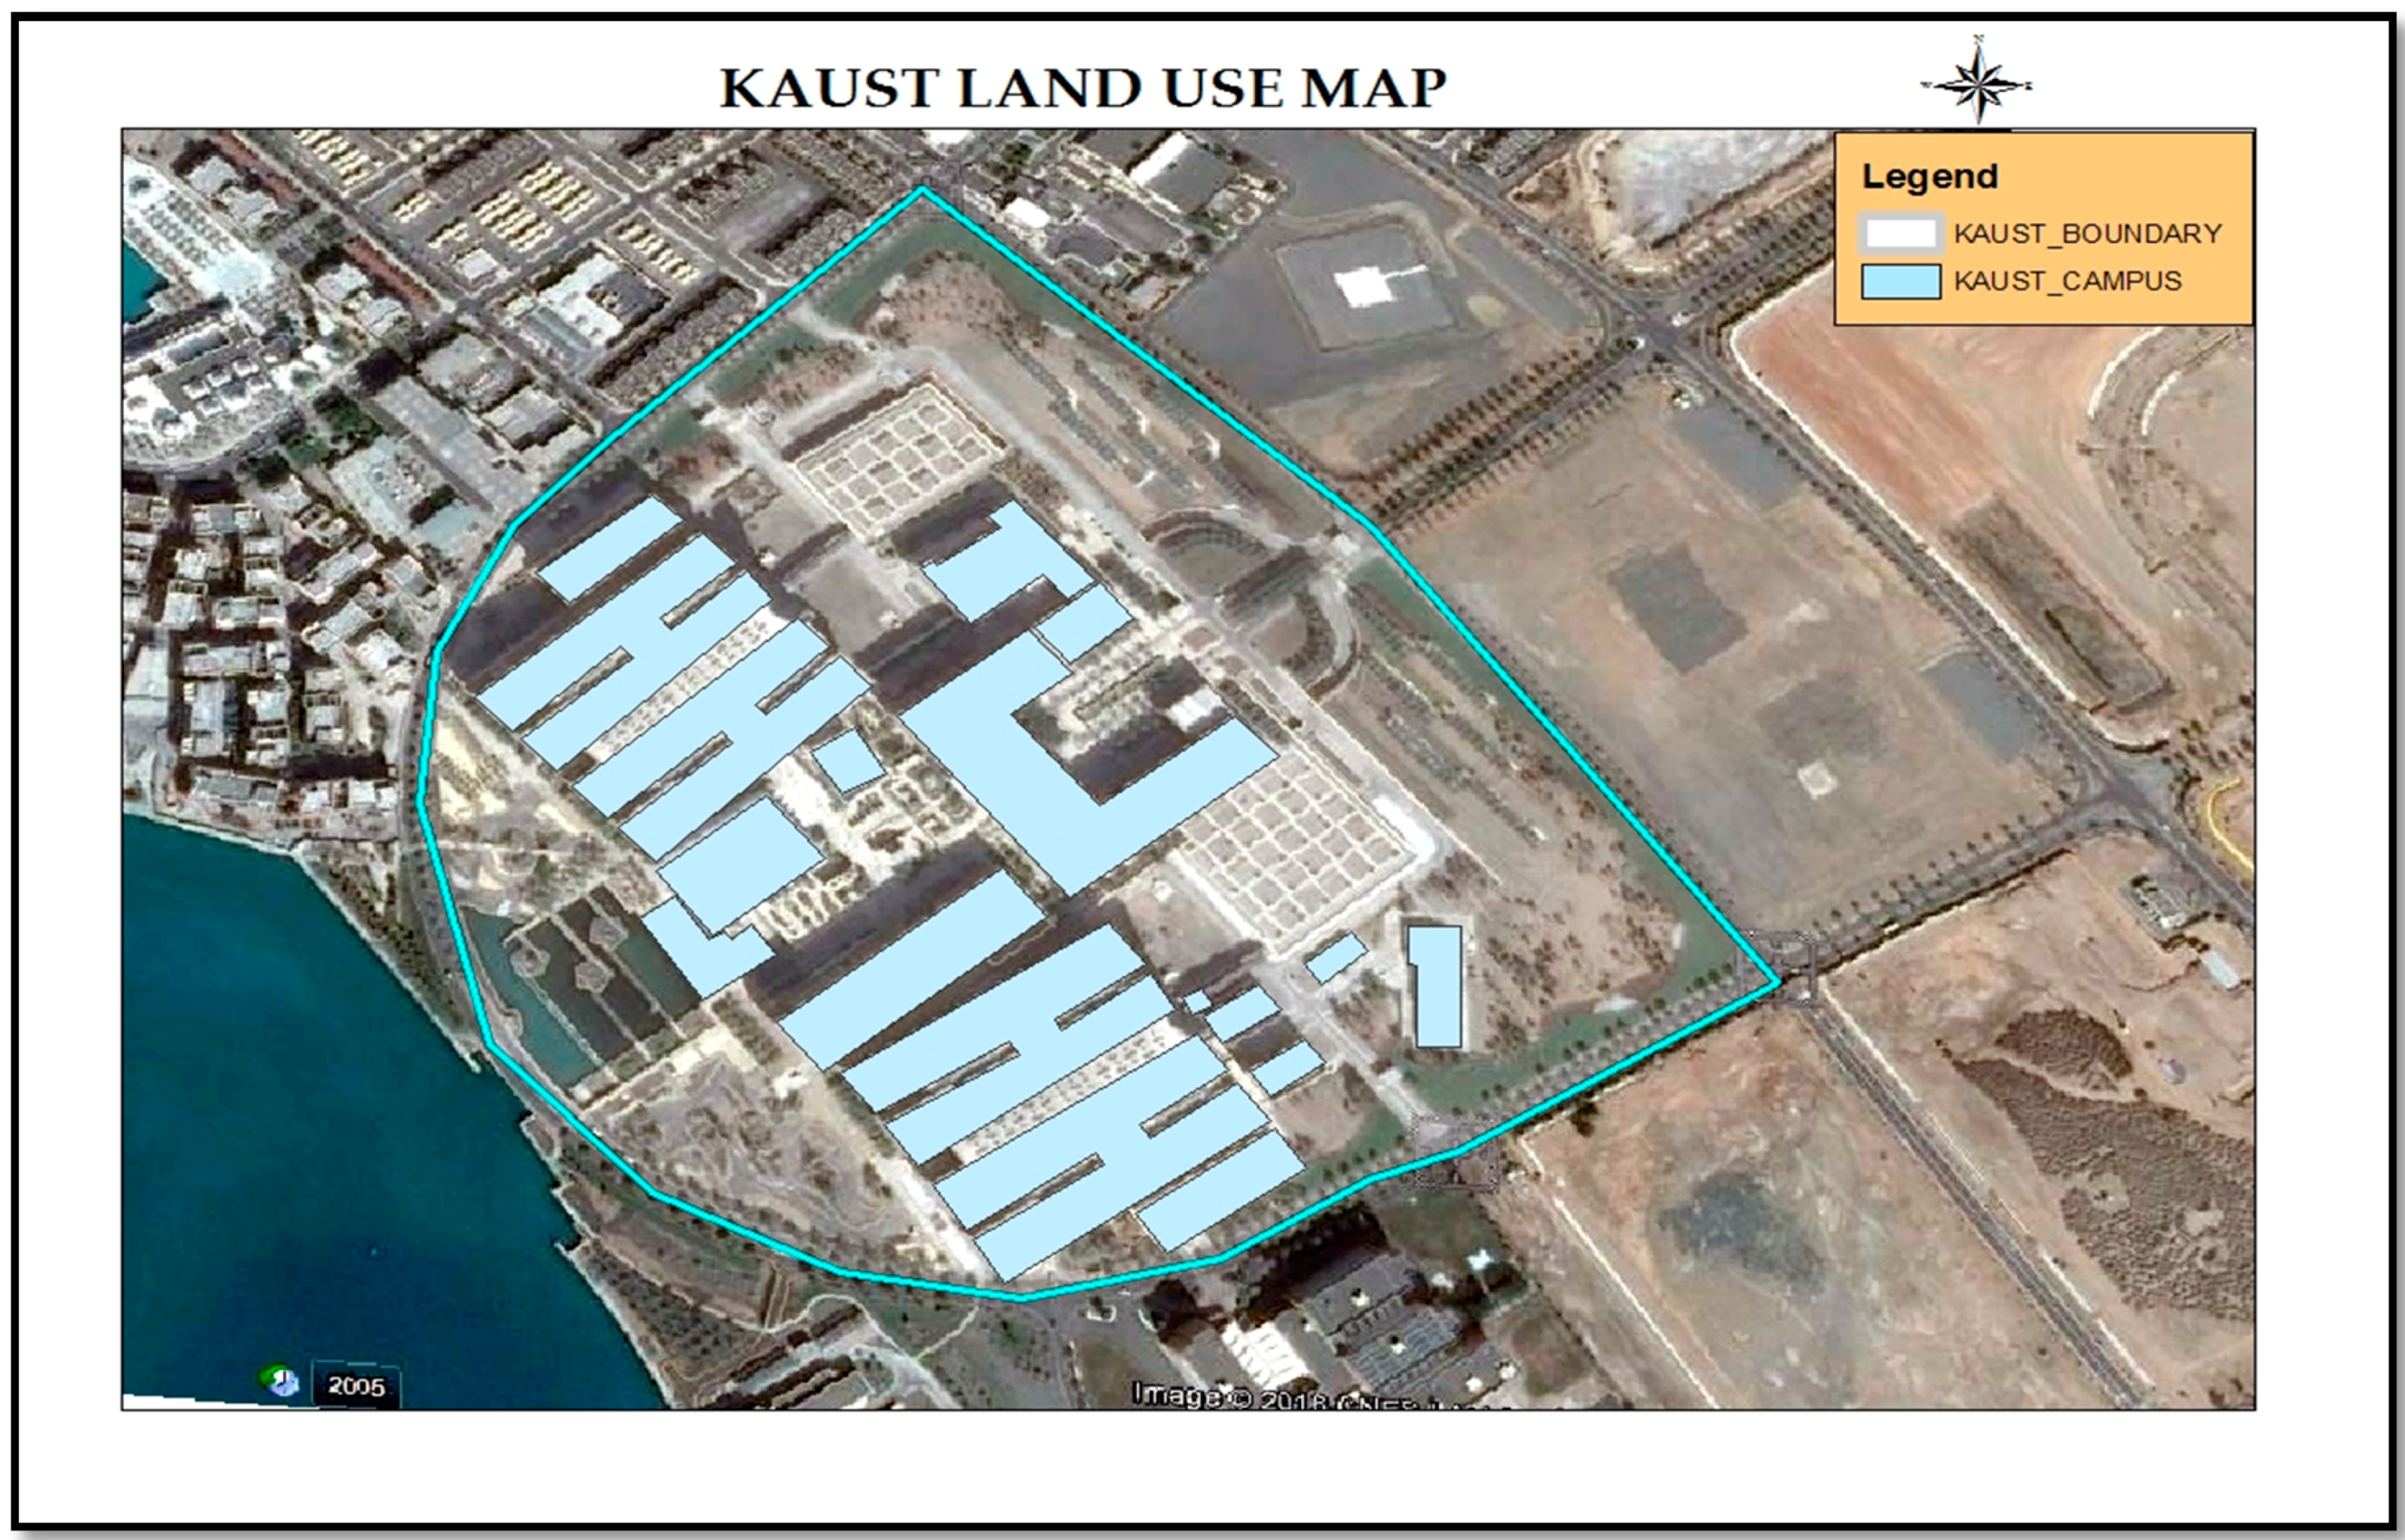
3.2. Boundary and Land Use Identification of the University Campus

The spatial-based campus footprint evaluation and visualization model is based on spatial location requiring a satellite image of the area under study. The satellite image map of KAUST (Figure 4) acted as a baseline for the identification of various building uses and land features of the study area. For this study, the vector dataset for individual buildings was used to add various attributes and values of their variables. These attributes formed the backbone of the whole model of the study.
The satellite image in Figure 4 is an example of raster dataset, whereas Figure 5 is a schematic diagram of KAUST, which has been used to transform raster datasets to vector features in addition to Google Earth inferences for various building uses. Figure 6 shows the layer of the land use map, which aided in obtaining the coverage area into the dataset for analysis. Another big advantage of vector datasets in this study was the distribution of various features in different layers, which made accessibility and analysis easy for the authors. KAUST campus district have been categorized into the following categories: (i) Applied Mathematics; (ii) Research Laboratory; (iii) Greenhouse; (iv) High Bay Laboratory; (v) Engineering Science Hall; (vi) KAUST Library; (vii) KAUST Commons and Dining Hall; (viii) Data Center; (ix) Campus Mosque; (x) Administrative Building; (xi) Student Centre; (xii) Auditorium; (xiii) Solar Tower; and (xiv) Sea Court.
In the ArcGIS 10.3® (ESRI, Redlands, CA, USA) attributes table, a table holding additional information at the backend of each unique object presents information regarding the type of building and its covered area. Vector analysis files and objects are the prime sources for the development of this spatial-based campus footprint evaluation and visualization model. The entire analysis for this spatial-based model used information stored for each individual object of the study area in the ArcGIS10.3® (ESRI, Redlands, CA, USA) software environment.

3.3. Data Collection for Emission Evaluation and Visualization

The data required for this research were collected from the overall coverage of the university campus district buildings by transforming raster data from the satellite image to vector data in the form of polygons, and then multiplying the area by the number of floors of the individual building. This forms the backend data and the backbone of this study. The data were collected for campus buildings and later analyzed in ArcGIS 10.3® (ESRI, Redlands, CA, USA) software for campus CO2 emission evaluation and visualization. Data collected for the study were information regarding energy consumption that was later converted to carbon emissions, which formed the estimated CO2 emission for this study.
The points from which data were collected from KAUST are represented in Figure 7. The data points are distributed throughout the academic campus and have considered all the building uses present at the academic campus.

3.4. ArcGIS-Base Data Model

The environment of ArcGIS 10.3® (ESRI, Redlands, CA, USA) software provides the authors with the ease of carrying out the complex operations comprising of multiple steps by developing a sound and logical model. The model comprises of the datasets prepared for the task as well as the kind of analysis and operations required. Correct and sequential linkup and connections were required for building this model. In this study, the model, which has been developed to evaluate and visualize the CO2 emission, as well as the sustainability of KAUST campus, comprises of multiple datasets.
The unit for energy consumption used is Standard International (SI) unit of kWh/m2 year [43]. However, the value from the U.S Energy Use Intensity National Median Reference Values (March 2016) of 0.828 kWh/m2 for college/university was adopted [44]. The 0.828 kWh/m2 was derived by converting the 262.6 kBtu/ft2 from the U.S Energy Use Intensity National Median Reference Values to kWh/m2. The GHG conversion factor of 0.391 kg CO2 e/kWh was used to derive the overall CO2 emission [45].
Finally, the point shapefiles were processed by Inverse Distance Weightage (IDW) method to analyze and visualize the spatial distribution of the estimated CO2 emission of the academic campus. This method provides the whole visualization of the campus emissions from different land uses by determining the value of all unknown locations. This IDW interpolation technique has been utilized by researchers [46,47,48,49] in the area of agriculture for spatial distribution. This method of interpolation was adopted for the estimation and visualization of the CO2 emission of the university campus because of its robustness and simplicity in visualizing the estimate.

4. Results and Discussion

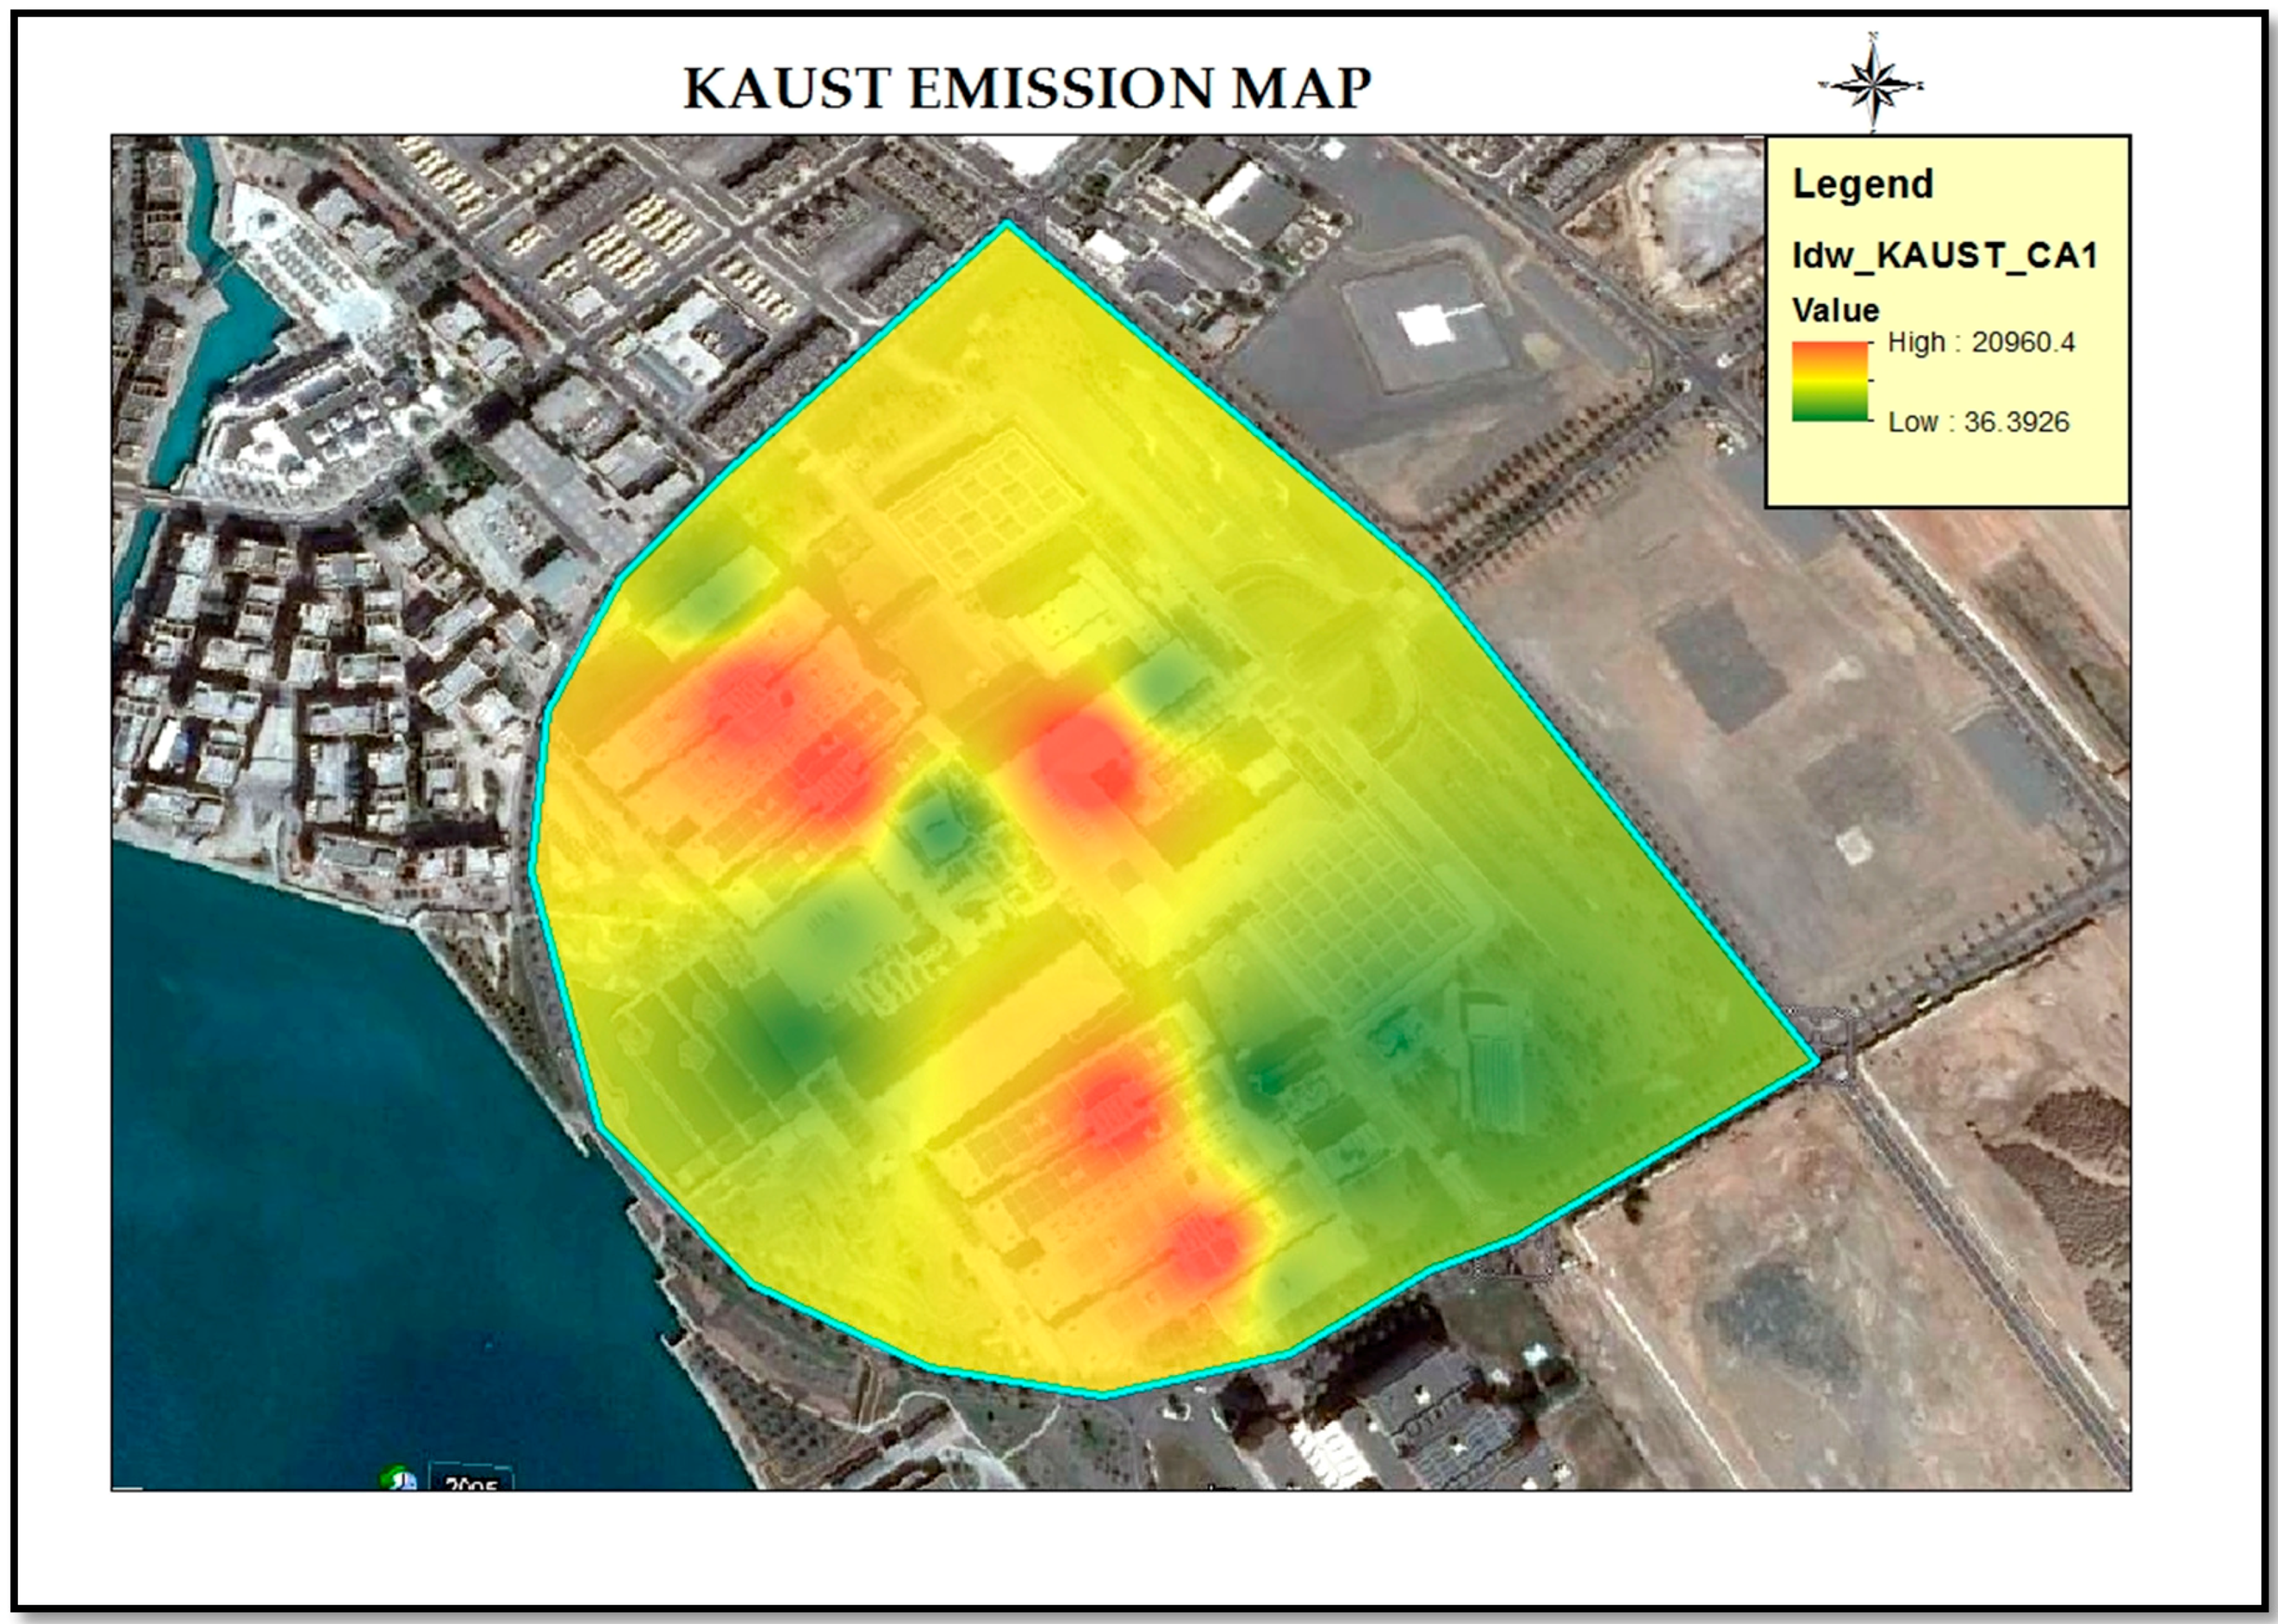
4.1. The Validation of the Spatial Estimation and Visualization of the CO2 Emission

From the values in our backend data, daily data for greenhouse gas emissions have been computed for estimation and visualization purposes in the model analysis and production of raster maps, as shown in Figure 8. When these emissions were added using IDW Spatial Statistical Analysis techniques of ArcGIS 10.3® (ESRI, Redlands, CA, USA), the raster image in Figure 8 shows the spatial visualization of the emission of greenhouse gases. The raster dataset reveals that academic buildings within their concentration prove to be the main area for energy consumption and emission of greenhouse gases. The maximum value of around 20.9-tons of CO2 equivalent has been observed around the academic buildings, especially around the Administration Building and the Research Laboratories.
Foundation has been laid in the form of spatial-based CO2 emission estimation and visualization of university campus, whereby effects of various parameters can be observed, as seen in Figure 8.
Table 1 shows the breakdown of estimated values of the CO2 emissions from the environment of ArcGIS 10.3® (ESRI, Redlands, CA, USA) software. The results were extracted from the attribute table in ArcGIS 10.3 software. The overall estimate of the CO2 emissions for the university campus was 127.7-tons CO2 equivalent while the lowest emission was 0.02-tons CO2 equivalent from the solar tower.

4.2. Comparison with Other Saudi University

Comparing our results with the results of Almufadi and Irfan’s carbon footprint estimation for Qassim University based on their GHG protocol scope categorization, Table 2 shows that Qassim University has a higher CO2 emission than KAUST. This might be because our study only focused on the campus district with the exclusion of the community district and the service area of the whole university. Therefore, future research should consider estimating the CO2 emissions of all land uses of the university.

4.3. The Spatial Estimation and Evaluation of CO2 Emissions Model Limitations

The model for the campus estimation and evaluation of CO2 emissions uses vector datasets generated from raster datasets. The major factor governing the analysis phase is the backend data that have been provided and attached to every parcel or point to represent a feature on the map of KAUST. It must be noted that, similar to all other systems, this system is not completely free from error and is limited by the fact that the results are as good as the information added or the process of digitization carried out.

5. Conclusions

Currently, more than 40% of the world’s energy is consumed in buildings such as campus buildings, of which Saudi Arabia happens to be a major player. GHG associated with buildings was estimated to be approximately 8.6 million metric tons CO2 eq. in 2004 in the Intergovernmental Panel on Climate Change (IPCC) 4th assessment report [14], and is still increasing at an alarming rate. This study provides a better visual picture of the whole scenario of KAUST CO2 emissions visualization. ArcGIS 10.3® (ESRI, Redlands, CA, USA) was used to estimate the CO2 emissions of the university academic campus. By this ArcGIS-based evaluation, it is evident that geographically integrated models for campus estimation and visualization of CO2 emissions provide the account of existing information for decision makers to come up with viable strategies for achieving a higher standard in overall campus sustainability as well as addressing the issue of climate change.
Today, evaluating and visualizing the CO2 emissions of a university campus requires a comprehensive exercise; as such, it must be institutionalized within the campus operation and maintenance departments. Authorities and personnel managing campus operations must possess accurate and up to date information and quantitative data for various parameters to be used in evaluating the amount of GHGs the campus is producing within a period.
CO2 emissions estimation, visualization, and evaluation exercise are temporal in nature. Regular assessment at equal intervals of time must be carried out to keep the emissions and overall sustainability of the university campus in check. In the case of any anomalies, a prompt response can be generated to address the issue. The spatial-based estimation and visualization models require a certain amount of data input for process and result production. Therefore, it becomes imperative to prepare and enter accurate and up to date information in ArcGIS database. The quality of data in ArcGIS database can enhance the results and can produce a more accurate picture of the current situation and future scenarios.

Acknowledgments

The authors acknowledge the support of King Fahd University of Petroleum & Minerals, Saudi Arabia.

Author Contributions

Habib M. Alshuwaikhat contributed in initiating and conceiving the topic of this paper providing guidance throughout the stages of model development and contributed significantly to methods, GIS analysis, results and discussion sections. Yusuf A. Adenle contributed significantly to the collection of all relevant data, model development, spatial analysis, and writing the paper while conducting his graduate studies.

Conflicts of Interest

The authors declare no conflict of interest.

References

  1. Organization of the Petroleum Exporting Countries (OPEC). OPEC: Annual Statistical Bulletin. 2016, pp. 1–128. Available online: https://www.opec.org/opec_web/static_files_project/media/downloads/publications/ASB2016.pdf (accessed on 28 September 2017).
  2. Olabemiwo, F.A.; Danmaliki, G.I.; Oyehan, T.A.; Tawabini, B.S. Forecasting CO2 Emissions in the Persian Gulf States. Glob. J. Environ. Sci. Manag. 2017, 3, 1–10. [Google Scholar]
  3. Wiche, P.A. Water and Energy Consumption at King Abdullah University of Science and Technology. Master’s Thesis, King Abdullah University of Science and Technology, Thuwal, Saudi Arabia, 2012. [Google Scholar]
  4. Ahmed, A.H. Forecasting CO2 Emissions Lev Level in Saudi-Arabia (2014–2018) Using U Zeytun Time Series Statistical Software. Int. Res. J. Environ. Sci. 2016, 5, 27–36. [Google Scholar]
  5. United Nations (UN). Draft Outcome Document of the United Nations Summit for the Adoption of the Post—2015 Development Agenda. 2015. Available online: http://www.un.org/ga/search/view_doc.asp?symbol=A/69/L.85&Lang=E (accessed on 1 November 2016).
  6. Saudi Vision 2030. Available online: http://vision2030.gov.sa/en (accessed on 28 September 2017).
  7. Al-yami, A.M.; Price, A.D.F. An Overview of Sustainability in Saudi Arabia. In Proceedings of the CCIM 2006 Sustainable Development through Culture and Innovation, Dubai, UAE, 26–29 November 2006; pp. 109–119. [Google Scholar]
  8. Alshuwaikhat, H.M.; Adenle, Y.A.; Saghir, B. Sustainability Assessment of Higher Education Institutions in Saudi Arabia. Sustainability 2016, 8, 750. [Google Scholar] [CrossRef]
  9. Trencher, G.; Nagao, M.; Chen, C.; Ichiki, K.; Sadayoshi, T.; Kinai, M.; Kamitani, M.; Nakamura, S.; Yamauchi, A.; Yarime, M. Implementing Sustainability Co-Creation between Universities and Society: A Typology-Based Understanding. Sustainability 2017, 9, 594. [Google Scholar] [CrossRef]
  10. Grindsted, T.S. Sustainable Universities—From Declarations on Sustainability in Higher Education to National Law. Environ. Econ. 2011, 2, 29–36. [Google Scholar] [CrossRef]
  11. The Talloires Declaration. University Leaders for a Sustainable Future. 1990. Available online: http://www.ulsf.org/programs_talloires_td.html (accessed on 17 June 2016).
  12. Second Nature. 1993. Available online: http://www.secondnature.org (accessed on 17 June 2016).
  13. Wiedmann, T.; Minx, J. A Definition of ‘Carbon Footprint’. Science 2007, 1, 1–11. [Google Scholar]
  14. Intergovernmental Panel on Climate Change (IPCC). Mitigation of Climate Change. Contribution of Working Group III to the Fourth Assessment Report of the Intergovernmental Panel on Climate Change. 2007. Available online: http://www.ipcc.ch/pdf/assessment-report/ar4/wg3/ar4_wg3_full_report.pdf (accessed on 28 September 2017).
  15. Allen, C.; Metternicht, G.; Wiedmann, T. National Pathways to the Sustainable Development Goals (SDGs): A Comparative Review of Scenario Modelling Tools. Environ. Sci. Policy 2016, 66, 199–207. [Google Scholar] [CrossRef]
  16. Osborn, D.; Cutter, A.; Ullah, F. Universal Sustainable Development Goals: Understanding the Transformational Challenge for Developed Countries. Universal Sustainable Development Goals. 2015, pp. 1–24. Available online: https://sustainabledevelopment.un.org/content/documents/1684SF_-_SDG_Universality_Report_-_May_2015.pdf (accessed on 1 November 2016).
  17. Velazquez, L.; Munguia, N.; Platt, A.; Taddei, J. Sustainable University: What Can Be the Matter? J. Clean. Prod. 2006, 14, 810–819. [Google Scholar] [CrossRef]
  18. Cole, L. Assessing Sustainability on Canadian University Campuses: Development of a Campus Sustainability Assessment Framework. Master’s Thesis, Royal Roads University, Victoria, BC, Canada, 2003; pp. 1–66. [Google Scholar]
  19. Legacy, C. Campus Sustainability: Sustainability Assessment Framework at the University of Waterloo. Victoria 2004, 93. [Google Scholar]
  20. Alshuwaikhat, H.M.; Abubakar, I. An Integrated Approach to Achieving Campus Sustainability: Assessment of the Current Campus Environmental Management Practices. J. Clean. Prod. 2008, 16, 1777–1785. [Google Scholar] [CrossRef]
  21. Lukman, R.; Glavič, P. What Are the Key Elements of a Sustainable University? Clean Technol. Environ. Policy 2007, 9, 103–114. [Google Scholar] [CrossRef]
  22. Beringer, A.; Adomßent, M. Sustainable University Research and Development: Inspecting Sustainability in Higher Education Research. Environ. Educ. Res. 2008, 14, 607–623. [Google Scholar] [CrossRef]
  23. Association of University Leaders for a Sustainable Future. Welcome Page. Available online: http://ulsf.org/ (accessed on 24 September 2017).
  24. STARS. STARS Participants & Reports. Available online: https://stars.aashe.org/institutions/participants-and-reports/ (accessed on 24 September 2017).
  25. Association for Advancement of Sustainability in Higher Education. STARS Technical Manual; AASHE: Philadelphia, PA, USA, 2017. [Google Scholar]
  26. Riddell, W.; Bhatia, K.K.; Parisi, M.; Foote, J.; Imperatore, J. Assessing Carbon Dioxide Emissions from Energy Use at a University. Int. J. Sustain. High. Educ. 2009, 10, 266–278. [Google Scholar] [CrossRef]
  27. Lindstrom, T.; Middlecamp, C. Campus as a Living Laboratory for Sustainability: The Chemistry Connection. J. Chem. Educ. 2017, 94, 1036–1042. [Google Scholar] [CrossRef]
  28. Chinery, L. Measuring Your University’s Carbon Footprint: What Is a Carbon Footprint? 2008. Available online: http://thesa.utk.edu/docs/Carbon_footprintingL.pdf (accessed on 28 Septmeber 2017).
  29. Stevens, A.; Draucker, L. 2011 Greenhouse Gas Inventory and Sustainability Report. 2011. Available online: https://sustainability.utexas.edu/sites/sustainability.utexas.edu/files/2014GHGInventory.pdf (accessed on 28 September 2017).
  30. Robinson, O.J.; Tewkesbury, A.; Kemp, S.; Williams, I.D. Towards a Universal Carbon Footprint Standard: A Case Study of Carbon Management at Universities. J. Clean. Prod. 2017. [Google Scholar] [CrossRef]
  31. Townsend, J.; Barrett, J. Exploring the Applications of Carbon Footprinting towards Sustainability at a UK University: Reporting and Decision Making. J. Clean. Prod. 2015, 107, 164–176. [Google Scholar] [CrossRef]
  32. Gómez, N.; Cadarso, M.Á.; Monsalve, F. Carbon Footprint of a University in a Multiregional Model: The Case of the University of Castilla-La Mancha. J. Clean. Prod. 2016, 138, 119–130. [Google Scholar] [CrossRef]
  33. Larsen, H.N.; Pettersen, J.; Solli, C.; Hertwich, E.G. Investigating the Carbon Footprint of a University—The Case of NTNU. J. Clean. Prod. 2013, 48, 39–47. [Google Scholar] [CrossRef]
  34. Liu, H.; Wang, X.; Yang, J.; Zhou, X.; Liu, Y. The Ecological Footprint Evaluation of Low Carbon Campuses Based on Life Cycle Assessment: A Case Study of Tianjin, China. J. Clean. Prod. 2017, 144, 266–278. [Google Scholar] [CrossRef]
  35. Li, X.; Tan, H.; Rackes, A. Carbon Footprint Analysis of Student Behavior for a Sustainable University Campus in China. J. Clean. Prod. 2015, 106, 97–108. [Google Scholar] [CrossRef]
  36. Utaraskul, T. Carbon Footprint of Environmental Science Students in Suan Sunandha Rajabhat University, Thailand. Procedia Soc. Behav. Sci. 2015, 197, 1156–1160. [Google Scholar] [CrossRef]
  37. Aroonsrimorakot, S.; Yuwaree, C.; Arunlertaree, C.; Hutajareorn, R.; Buadit, T. Carbon Footprint of Faculty of Environment and Resource Studies, Mahidol University, Salaya Campus, Thailand. APCBEE Procedia 2013, 5, 175–180. [Google Scholar] [CrossRef]
  38. Letete, T.C.M.; Mungwe, N.W.; Guma, M.; Marquard, A. Carbon Footprint of the University of Cape Town. J. Energy S. Afr. 2011, 22, 2–12. [Google Scholar]
  39. Oludele, A.; Malasowe Bridget, O.; Onuiri Ernest, E. Greening the Campus: Design of a Generic Green IT Model for Possible Adoption. (A Case Study of an Educational Institution in Nigeria). Asian J. Comput. Sci. Inf. Technol. 2012, 2, 129–136. [Google Scholar]
  40. Ologun, O.O.; Wara, S.T. Carbon Footprint Evaluation and Reduction as a Climate Change Mitigation Tool—Case Study of Federal University of Agriculture Abeokuta, Ogun State, Nigeria. Int. J. Renew. Energy Res. 2014, 4, 176–181. [Google Scholar]
  41. Almufadi, F.A.; Irfan, M. Initial Estimate of Carbon Footprint of Qassim. Int. J. Appl. Eng. Res. 2016, 11, 8511–8514. [Google Scholar]
  42. Picoulet, J.; HOK. Schematic Diagram of KAUST. 2004. Available online: http://www.aiatopten.org/node/113 (accessed on 17 June 2016).
  43. Pérez-Lombard, L.; Ortiz, J.; Pout, C. A Review on Buildings Energy Consumption Information. Energy Build. 2008, 40, 394–398. [Google Scholar] [CrossRef]
  44. Site, U.M.; Data, U.R. Technical Reference U.S. Energy Use Intensity by Property Type. Energy Star Portfolio Manager, 2016; pp. 1–6. Available online: https://portfoliomanager.energystar.gov/pdf/reference/US%20National%20Median%20Table.pdf (accessed 1 November 2016).
  45. Vásquez, L.; Iriarte, A.; Almeida, M.; Villalobos, P. Evaluation of Greenhouse Gas Emissions and Proposals for Their Reduction at a University Campus in Chile. J. Clean. Prod. 2015, 108, 924–930. [Google Scholar] [CrossRef]
  46. Robinson, T.P.; Metternicht, G. Testing the Performance of Spatial Interpolation Techniques for Mapping Soil Properties. Comput. Electron. Agric. 2006, 50, 97–108. [Google Scholar] [CrossRef]
  47. Mondal, A.; Khare, D.; Kundu, S.; Mondal, S.; Mukherjee, S.; Mukhopadhyay, A. Spatial Soil Organic Carbon (SOC) Prediction by Regression Kriging Using Remote Sensing Data. Egypt. J. Remote Sens. Space Sci. 2017, 20, 61–70. [Google Scholar] [CrossRef]
  48. Desavathu, R.N.; Nadipena, A.R.; Peddada, J.R. Assessment of Soil Fertility Status in Paderu Mandal, Visakhapatnam District of Andhra Pradesh through Geospatial Techniques. Egypt. J. Remote Sens. Space Sci. 2017. [Google Scholar] [CrossRef]
  49. Tunçay, T.; Bayramin, İ.; Atalay, F.; Ünver, İ. Assessment of Inverse Distance Weighting (IDW) Interpolation on Spatial Variability of Selected Soil Properties in the Cukurova Plain. J. Agric. Sci. 2015, 22, 378–384. [Google Scholar]
Figure 1. Structure of the Research.
Sustainability 09 02124 g001
Figure 2. KAUST Geographical Location.
Sustainability 09 02124 g002
Figure 3. Map showing the Three Districts of KAUST.
Sustainability 09 02124 g003
Figure 4. KAUST Satellite Image.
Sustainability 09 02124 g004
Figure 5. KAUST Campus Site Plan [42].
Sustainability 09 02124 g005
Figure 6. KAUST Land use Map.
Sustainability 09 02124 g006
Figure 7. KAUST Data Points.
Sustainability 09 02124 g007
Figure 8. KAUST GHG Emission Map.
Sustainability 09 02124 g008
Table 1. Estimated Values for CO2 Emission.
Building UseCO2 Emission (kg)CO2 Emission (tons)
Student Centre39243.9
Research Laboratory17,90617.9
Research Laboratory 17,90617.9
Commons and Dining Hall8050.8
Campus mosque5290.5
Admin and Eng. Science Hall20,96620.9
Conference Centre26612.6
Auditorium71777.2
Greenhouse6520.7
Greenhouse770.07
High Bay Laboratory11621.2
Data Centre42044.2
Research Laboratory17,90617.9
Applied Mathematics94129.4
Solar Tower160.02
KAUST Library33043.3
Total CO2 emission127,675127.7
2016 Student Population940
Net CO2 emission/Student/Year135.90.1
Table 2. Estimated Values for CO2 Emission.
InstitutionsTotal Carbon Footprint (kg CO2)Net Carbon Footprint/Student/Year (kg CO2)
Qassim University [41]123,997,4764360
KAUST127,675136

