A Study of the Allocation of Carbon Emission Permits among the Provinces of China Based on Fairness and Efficiency


1
College of Politics and Public Administration, Zhejiang University of Technology, Hangzhou 310023, China
2
Center for Green Low-Carbon Development Research, Zhejiang University of Technology, Hangzhou 310023, China
3
College of Economics and Management, Zhejiang University of Technology, Hangzhou 310023, China
*
Authors to whom correspondence should be addressed.
Sustainability 2017, 9(11), 2122; https://doi.org/10.3390/su9112122
Submission received: 6 October 2017
/
Revised: 15 November 2017
/
Accepted: 15 November 2017
/
Published: 17 November 2017
(This article belongs to the Section Energy Sustainability)
Abstract
:Carbon emissions trading systems are implemented to limit the total quantity of carbon emitted. Such trading systems are the main policy tool used by countries worldwide to address climate change. The initial allocation of carbon emission permits is the starting point of a carbon emissions trading system, and it represents the core of such a system. The provinces of China differ in terms of their population, stage of development, economic level, energy structure and industrial structure. Thus, performing the initial allocation of carbon emission permits among the provinces is a key difficulty. This paper focuses on the initial allocation of carbon emission permits among the provinces of China from the perspective of fairness and constructs a model of the initial inter-provincial allocation of carbon emission permits. In addition, a data envelopment analysis (DEA) model including undesirable outputs is used to optimize the resulting fair distribution from the perspective of efficiency.
1. Introduction
Greenhouse gas emission permits represent the right to use certain amounts of environmental resources and atmospheric capacity. Since 1992, when the Framework Convention on Climate Change was signed at the United Nations Conference on Environment and Development in Rio de Janeiro, Brazil, the issue of climate change has received international attention. In 2014, Intergovernmental Panel on Climate Change (IPCC) fifth assessment report showed that climate change would have serious widespread and irreversible impacts on humans and ecosystems. As early as 2009, limits on global average surface temperature increases to well below 2 °C above pre-industrial levels were written into the “Copenhagen Accord”. In 2015, the Paris Agreement proposed that “through the joint efforts of all countries in the world, the global average temperature increase is controlled within 2 °C compared with the pre-industrial period, and the temperature increase is limited to 1.5 °C” [1]. This agreement means that, in response to climate change, the total amount of global carbon emissions will be rigidly constrained, and countries will be obliged to take on international responsibilities for carbon reduction.
As a developing country, China has always attached great importance to its international responsibilities in climate change mitigation. At the Copenhagen Climate Change Conference (COP 15), China proposed to reduce its carbon intensity in 2020 by 40–50% compared with the 2005 level. In July of 2015, China officially announced the “Intended Nationally Determined Contributions” (INDC), which clarified China’s action target for climate change in 2030. According to its own national conditions, development stage, sustainable development strategy and international responsibility, China has determined its goal of independent action for 2030: CO2 emissions will peak in approximately the year 2030 and China will strive for peak arrival as soon as possible. Carbon dioxide emissions have been reduced by 60–65% since 2005 because non-fossil energy accounted for approximately 20% of the primary energy consumption, and the forest volume increased by 4.5 billion cubic meters in 2005 [2]. These actions have made an important contribution to the Paris Agreement. At the 19th National Congress of the Communist Party of China (CPC), it has been made clear that China will take a driving seat in international cooperation in climate change mitigation. China has become an important participant, contributor and torchbearer in the global endeavor for ecological civilization. Therefore, from an international perspective, China plays an active role in mitigating global climate change and reducing carbon emissions.
In China, the National Twelfth Five-Year Plan (2011–2015) proposed the gradual establishment of a nationwide cap-and-trade emission trading scheme (ETS). Subsequently, the National Development and Reform Commission (NDRC) of China launched a series of local carbon emissions trading pilots in seven provinces and cities, including Shenzhen, Beijing, Tianjin, Shanghai, Chongqing, Guangdong and Hubei between 2013 and 2014, to explore the correct path to establishing national ETS which will be launched by 2017 [3]. As of September 2017, the total volume of carbon quota in the seven pilot carbon markets reached 197 million tons, with a turnover of about 4.5 billion Yuan. Each carbon pilot market has accumulated rich experience in the process of operation, and also formed a relatively perfect market mechanism and trading system. Da Zhang et al., Xiu Jin-Feng et al., Cong Ren et al. and Ling Xiong et al. [4,5,6,7] have researched the carbon trading and quota allocation methods in the pilot areas. Jun Dong et al. [8] summarized China’s seven current ETS pilots with respect to coverage, allowance allocation, transactions, punitive mechanisms and especially market performance, and several recommendations for building a suitable and effective national ETS were proposed. The experience of the ETS pilot has a certain reference for quota allocation among provinces.
Without doubt, the EU ETS is the world’s first and largest multinational cap-and-trade program for greenhouse gases. The EU program covers approximately half of CO2 emissions in all EU member states, and 40% of total greenhouse emissions, and involves approximately 11,500 factory installations that together emit 2 billion tons of CO2 emissions annually [9]. Quota allocation is the key to carbon trading policy [10]. There is much research on quota allocation in the EU, Kettner et al., Burtraw [11,12], and Martin et al. [13] studied the setting of quota totals as well the impact of the cap. Bohringer and Lange, Palmer et al., Clo, Zetterberg et al., Zetterberg, Frank, and Nicola et al. [14,15,16,17,18,19,20] researched different allocation methods, such as grandfathering, benchmarking or auctioning, and the impact on carbon price, carbon market, social welfare loss and corporate investment. Ellerman and Buchner, Clo, Venmans, Jong et al., and Jing Hu et al. studied the issue of EU transitional distribution [21,22,23,24,25,26]. Viguier et al. established a two-level computable equilibrium model to assess the strategic allocation of emission allowances within the European Union [27]. The EU’s quota allocation in the first two phases is the decentralization governance model, whereby member states make national allocation plans (NAP) respectively based on the overall target and principle of emission reduction. Although this allocation can let members give full consideration to their own actual situation, the right of allocation between the commission and member states is still not clear. The European commission to refuse a National Allocation Plan (NAP) infringed on the freedom and autonomy of member countries to develop a NAP form tension. Moreover, member states make it easy to over allocate, which affects the implementation of market operation and emission reduction targets. Therefore, in the third phase of the EU ETS, National Allocation Plan (NAP) was terminated, replaced by the EU level for the unified allocation of quotas. This change in the distribution of quotas was informative. However, the difference between population and economy in Chinese provinces is far greater than that between EU member states. Therefore, we should study more suitable distribution methods for China.
Groenenberg et al. [28] established a test differentiation of CO2 emission reduction obligations for a selection of 48 countries based on the Triptych approach, which is a sector approach applied in the European Union in 1997 that accounts for differences in national circumstances such as population size and growth, standard of living, economic structure and fuel mix in power generation. Ding et al. [29] argued that per capita cumulative emissions provide the best representation of the principle of fairness and the rule of equity among different countries. Böhringer et al. [30] simulated international CO2 emission quota markets using marginal abatement cost functions to consider an international emissions trading scheme with partial sectoral and regional coverage. Wei et al. [31] argued that it is important to include national responsibility in the global distribution of carbon permits, and he proposed to distribute carbon allocations to 137 countries and regions based on the cumulative emission allocation method for different years. The sharing of emission reduction responsibilities should include longitudinal observations of the degree of industrialization in the developed countries, rather than only horizontal observations of the developed and developing countries. The many differences between different countries are similar to the differences among different provinces in China. Therefore, the methods of distributing carbon permits to different countries have more effect on our research. Additionally, our research will provide insights into the distribution of carbon permits globally and in countries that are comprised of many different regions.
Although experiences can be gained from existing ETSs, China still faces dire challenges in formulating its own carbon allowance allocation policy [32]. From a domestic point of view, all provinces will be included in a trading system to achieve the carbon reduction targets. China is faced with the question of how to ensure that its 30 provinces or regions (except Tibet, Hong Kong and Macau) respond appropriately to climate change, and how to use administrative means and market mechanisms to allocate the scarce resource of “carbon emission permits” based on scientific, reasonable and effective constraints among the provinces. The provinces of China differ in terms of their population, economic level, resource endowment, stage of development, energy structure and industrial structure. Therefore, the scientific, fair and effective initial inter-provincial allocation of carbon emission permits is an important institutional arrangement in the green, low-carbon development of China, and it contributes to an objective requirement of a unified domestic carbon emissions trading market. Liu and Lin [33] proposed a model that is applied to empirically investigate the optimal carbon emission quota allocation for China’s building construction industry among thirty-three provinces in three different regions. From the provincial value chain perspective, Xie et al. [34] used in-output tables from China in 2002, 2007, and 2010, and constructed models to calculate the CO2 emissions responsibility of each province under the production, consumption, value capture principles, respectively. Yang et al. [35] studied the issue of how to allocate the carbon emissions quotas among different industrial sectors fairly and effectively. Qin et al. [36] proposed a multi-criteria decision analysis model, which is based on the principles of efficiency and equity, to examine the quota allocation pertaining to China’s east coastal areas. Although the last two papers focus on efficiency and equity in allocating the carbon emissions quotas, the same as our study, the authors focus on certain sectors or regions rather than the whole country.
This paper focuses on the initial allocation of carbon emissions permits among the provinces of China. A model for the initial allocation of carbon emission permits is proposed from the perspective of fairness, and the results of the preliminary allocation are optimized using a data envelopment analysis (DEA) model with undesirable outputs that incorporates the objectives of economic development and environmental efficiency. The rest of this paper is organized as follows. Section 2 describes the factors that influence the fair inter-provincial allocation of carbon emission permits. In Section 3, the fair distribution model and a slacks-based measure-data envelopment analysis (SBM-DEA) model are introduced. Section 4 presents data describing the GDP of China, its historical emissions and the marginal cost of emissions for each province. The total national carbon emissions in 2020 are then calculated. Section 5 first calculates the results of the fair allocation model and performs an optimization using the DEA model with undesirable outputs before analyzing the results. The final section reports the conclusions of the study.
2. Factors that Influence the Initial Allocation of Carbon Emission Permits
The theory of fairness is an incentive theory put forward by American psychologists in 1965. The sense of fairness has an important influence on the enthusiasm of participants. Fairness means that all participants have equal rights. In the initial allocation of permits in emissions trading schemes proposed by scholars worldwide, fair distribution is the most widely distributed principle and the most direct manifestation of the principle of common but differentiated responsibilities. The equitable allocation of carbon emission permits is conducive to the orderly operation of carbon emissions trading markets and the realization of national emission reduction targets.
2.1. Population
According to the per capita equity principle, everyone has the same right to survive, develop, and use the atmosphere. The allocation of quotas according to the population has been agreed by the developing countries and some developed countries. The population of China is unevenly distributed; fewer people live in the western parts of China than in the eastern provinces. Therefore, population is an important factor in the allocation of emission reductions among the provinces (regions) of China. Baer et al. [37] quantitatively analyzed the costs of global emission reductions and calculated the emission reduction targets of different countries and regions according to the per capita cumulative CO2 emissions and the distribution of domestic income. According to Ding, emission permits represent the right to subsistence and development. Thus, they are an integral component of fundamental human rights [38]. Wan [39] employed per capita cumulative carbon emissions, information on the level of economic development and geographical location to systematically measure and decompose the inter-provincial fairness of carbon emissions. Pan [40] further proposed that the allocation of per capita emissions and future development needs should be taken as the standard of distribution. This method is conducive to the rational development of space. Demographic factors must be considered according to the principle of per capita equality to carry out the allocation of carbon emission permits and to attach importance to the emission rights of individuals so that everyone has the right to use atmospheric resources and its capacity.
2.2. Economic Scale
The level of economic development measures the degree of economic development and potential, which partly reflects the emission reduction potential and carbon emissions trends of different regions. The provinces of China differ substantially in terms of their economic development and therefore in their plans for future development, which greatly affect their demand for energy and carbon emissions. Deng employed Log Mean Divisia index (LMDI) research methods and found that per capita GDP has both positive and negative effects on carbon emissions. Economic development tends to cause carbon emissions to increase, whereas energy intensity has an inhibitory effect on carbon emissions [41]. Long argued that, for different provinces, annual and regional decompositions of GDP should be used to perform the initial allocation of carbon emissions to enable China to meet its emission reduction targets while maintaining economic growth [42]. Wen-Jing Yi examined per capita GDP, cumulative fossil fuel CO2 emissions, and energy consumption per unit of added industrial value as metrics of emission reduction capacity, responsibility and emission reduction potential. Based on these three indicators, a comprehensive index and an intensity distribution model were constructed [43]. Increased economic capacity corresponds to greater carbon emissions but also increased emission reduction capacity. The lower level of economic development should take full account of the plans for economic development, which are also needed to achieve the emission reduction targets.
2.3. Historical Emissions
Given the need to limit global warming, the ability of the atmosphere to take up greenhouse gas emissions is limited. Increased historical greenhouse gas emissions result in a smaller space for future generations. In a study of the cumulative carbon emissions of the provinces of China from 1995 to 2014, Shandong, Guangdong, Hebei and Jiangsu ranked at the forefront of the country, and the total GDPs of these provinces are also among the top ten in the country. In this sense, the regions that have taken the lead in developing the economy are crowding out the emission space for the less developed areas. Song et al. [44] also took this view. They found that the allocation of carbon emissions in China is relatively balanced, but the coefficient of variation indicates that the developed regions were using the emission space of the less developed areas. Pan employed the global warming intergenerational equity index (IGEI), took 10 years as a generation, calculated the increase in carbon emissions from 1980 to 2000, and indicated that the present-day carbon emissions are unfair to future generations [45]. Based on the research discussed above, Wang [46] carried out a study on the initial distribution of carbon emission permits in the industrial system of China based on the principles of responsibility and individual equality. Wang [47] further proposed that this scheme, which is based on the principles of interpersonal equality and historical responsibility, and programs based on the principles of economic development and historical responsibility comprehensively reflect the core view of fairness. Based on fairness and historical responsibility, the provinces that have produced larger amounts of cumulative historical carbon emissions should bear a greater responsibility for emission reductions.
2.4. Energy Consumption Levels and Technical Factors
Energy consumption levels and technical factors reflect the capacity and potential for emission reductions. The emission intensity and emission potential of provinces in China differ strongly; thus, the marginal cost of emission reductions also differs considerably among the provinces. At present, the energy consumption per unit GDP of Beijing, Shanghai, Jiangsu, Zhejiang, Guangdong and other regions is relatively low, and the level of development of clean production technology is relatively high. Thus, the marginal cost of emission reductions is relatively high in these regions. Li Tao et al. employed information on the carbon intensity of the provinces of China and a model to establish the estimated cost of emission reductions and found that considering the principle of minimizing the cost of emission reductions would reduce the cost to the less developed provinces (which have a high carbon intensity) to bear greater emission reductions [48]. Liu et al. [49] also noted that there are some differences in the marginal cost of CO2 reduction among the provinces of China, and areas with comparatively low carbon intensity should generally incur greater economic costs. The initial allocation of carbon emissions among the provinces should account for the actual situation in each province and incorporate the costs of emission reduction into a fair and reasonable initial allocation of emission permits.
2.5. Industrial Structure and Energy Structure
Industrial structure and energy structure are important factors that lead directly to the release of CO2. Regions with high rates of secondary production and large consumption of fossil fuels produce relatively large amounts of CO2. Hu [50] performed a quantitative analysis of the effects of economic scale, industrial structure and carbon emissions per unit of GDP in China from 1990 to 2005 on carbon emissions. The results of this study show that adjustments of industrial structure produce reductions in carbon emissions. According to the China Statistical Yearbooks, the industrialization of the provinces of China is at different stages, and the industrial structure clearly differs among the provinces. Wei et al. [51] argued that the differences in the potential CO2 emissions of the provinces are due to differences in their industrial structures, energy composition and degree of openness to trade. For example, Beijing and Shanghai account for more than 60% of the tertiary industries, and the carbon emissions in these areas are far lower than those in Hebei and Shandong. Li [52] applied the factor decomposition method to the total economy, industrial structure and carbon emissions per unit of GDP to examine their effects on total carbon emissions. The results show that changes in the industrial structure and the economy will lead to changes in carbon emissions. Wang [53] studied the inequity in CO2 emissions using Theil entropy and Kaya factor decomposition and explored the inequity in CO2 emissions within eastern, central and western China. The results of this study show that the inequity in the eastern region is due to economic conditions, the inequity in the central region is associated with energy intensity and the industrial structure, and the inequity in the western region is associated with economic conditions and the industrial structure.
The factors which influence the initial allocation of carbon emission permits are summarized in Table 1.
3. Model Construction
3.1. Construction of the Equitable Distribution Model
Based on an analysis of the factors that influence the fairness of the initial allocation of permits among the provinces, we perform a comprehensive analysis of the differences among the provinces in China. This paper proposes a model for the fair distribution of emission permits that accounts for multiple influencing factors, including population, GDP, historical emissions and current emissions, the cost of emission reductions and per capita GDP. Based on this allocation mechanism, the initial number of carbon emission permits in province i is Ci:
In the Formula (1), Pi is the population of region i; Pg is the total population of the country; Gi is the regional GDP of region i; Gg is the national gross domestic product; Ei is the carbon emissions in the past three years; Eg is the national carbon emissions in the past three years; Mi is the marginal cost reduction in region i; Mg is the national average marginal emission reduction costs; Ii represents the carbon intensity in region i; Ig represents the national average carbon intensity; and λ is the adjustment coefficient, which is chosen such that the final number of permits allocated to each region and the total amount of carbon emissions are the same. Moreover, A1, A2, A3, B1 and B2 represent weighting coefficients. In this paper, the A and B coefficients are assigned equal values of 1/3 and 1/2, respectively.
The initial allocation model contains population, GDP, historical emissions, marginal cost reductions and carbon intensity. Based on population, this model considers individual emission rights, which embodies fairness to individuals. As an influencing factor, GDP reflects the development rights of provinces and their ability to cut emissions; historical emissions focus on questions of equity related to historical responsibility and the continuity of historical development. The marginal cost of emission reduction is an indirect manifestation of economic development, and regions with low marginal emission reduction costs are responsible for relatively large emission reductions. The carbon intensity reflects the current emission level, and the areas with high emissions should bear greater responsibility for reducing emissions. The initial allocation of carbon emission permits among the provinces should account for multiple factors, as well as fairness.
3.2. Construction Efficiency Optimization Model
Given the constraints imposed by the total carbon emissions of the country and to produce an efficient allocation, a DEA model with undesirable outputs is selected to optimize the initial allocation scheme. Given that China is in a stage of economic development, the steady development of the economy should be ensured; however, green low-carbon development is needed. This paper considers both desirable and undesirable outputs, which are economic development Gi and the production of CO2 Ci, respectively. In the choice of input indicators, various factors are comprehensively considered. These factors take human, economic, and material resources as a starting point. The total population Pi is taken as the human input, energy consumption Ei represents the input of material resources, and the marginal cost of emission reductions Mi represents the financial input. Assuming that each region uses N inputs, let x = (x1, …, xn) ∈ Rm; desirable outputs Yg = (, …, ) ∈ Rsn; and undesirable outputs Yb = (, …, ) ∈ Rsm. The production possibility set can be expressed as T = {(x, yg, yb) : (x) produces (yg, yb)}.
According to the SBM-DEA model proposed by Tone [54], the SBM-DEA model with undesirable outputs is as follows.
where “s” represents the amount of slack in Pi, Ei, Mi and Gi; and λ is the weight vector. The object function ρ is about s−, sg, sb, which is strictly decreasing, and 0 ≤ ρ ≤ 1. For the specific evaluation unit, only when ρ = 1, s− = 0, and sg = 0, sb = 0 is effective. The difference between the SBM-DEA model and traditional DEA is that SBM-DEA can put directly into the slack variables in the objective function, which solves the problem of in-output relaxation. At the same time, it solves the problem of efficiency evaluation in the presence of undesirable outputs.
To better examine the initial distribution efficiency of CO2, the relevant indicators are dimensionally processed using the following functions: , Here, xi and yi represent the maximum and minimum values of the index value i of all of the decision units. The subscript j represents the decision unit of item j. Through non-dimensionalities, the corresponding value of zij is z’ij: z’ij = 0.1 + 0.9(zij − yi)/(xi − yi), z’ij ∈ [0.1,1]. Using the formula, the relevant indexes are treated in a dimensionless way, and the output-oriented model is then used to calculate the efficiency of the CO2 permits allocated to each province.
4. Data Sources and Calculations
4.1. GDP Development Indicators
According to the above theory and methods, the population in 2015 taken from the China Statistical Yearbook 2016 is assumed to be the population in 2020, and the GDP targets for the provinces and municipalities in 2020 from the Thirteenth Five-Year Plan are taken to represent the desired output GDP values (The results are shown in Table 2).
4.2. Carbon Emissions Accounting
Data obtained from the Energy Statistics Yearbook are used to determine the consumption of energy from different sources from 2013 to 2015. The emission factors reported by the IPCC (2006) are used to calculate the CO2 emissions. This paper considers nine sources of energy in the 30 regions of China (excluding Tibet) during 2013–2015: coal, coke, crude oil, gasoline, kerosene, diesel, fuel oil, liquefied petroleum gas and natural gas. According to the Formula (2), we calculated carbon emissions in the 30 regions from 2013 to 2015 (Table 3).
4.3. Marginal Abatement Costs
4.4. Calculation of Total Carbon Emissions in China
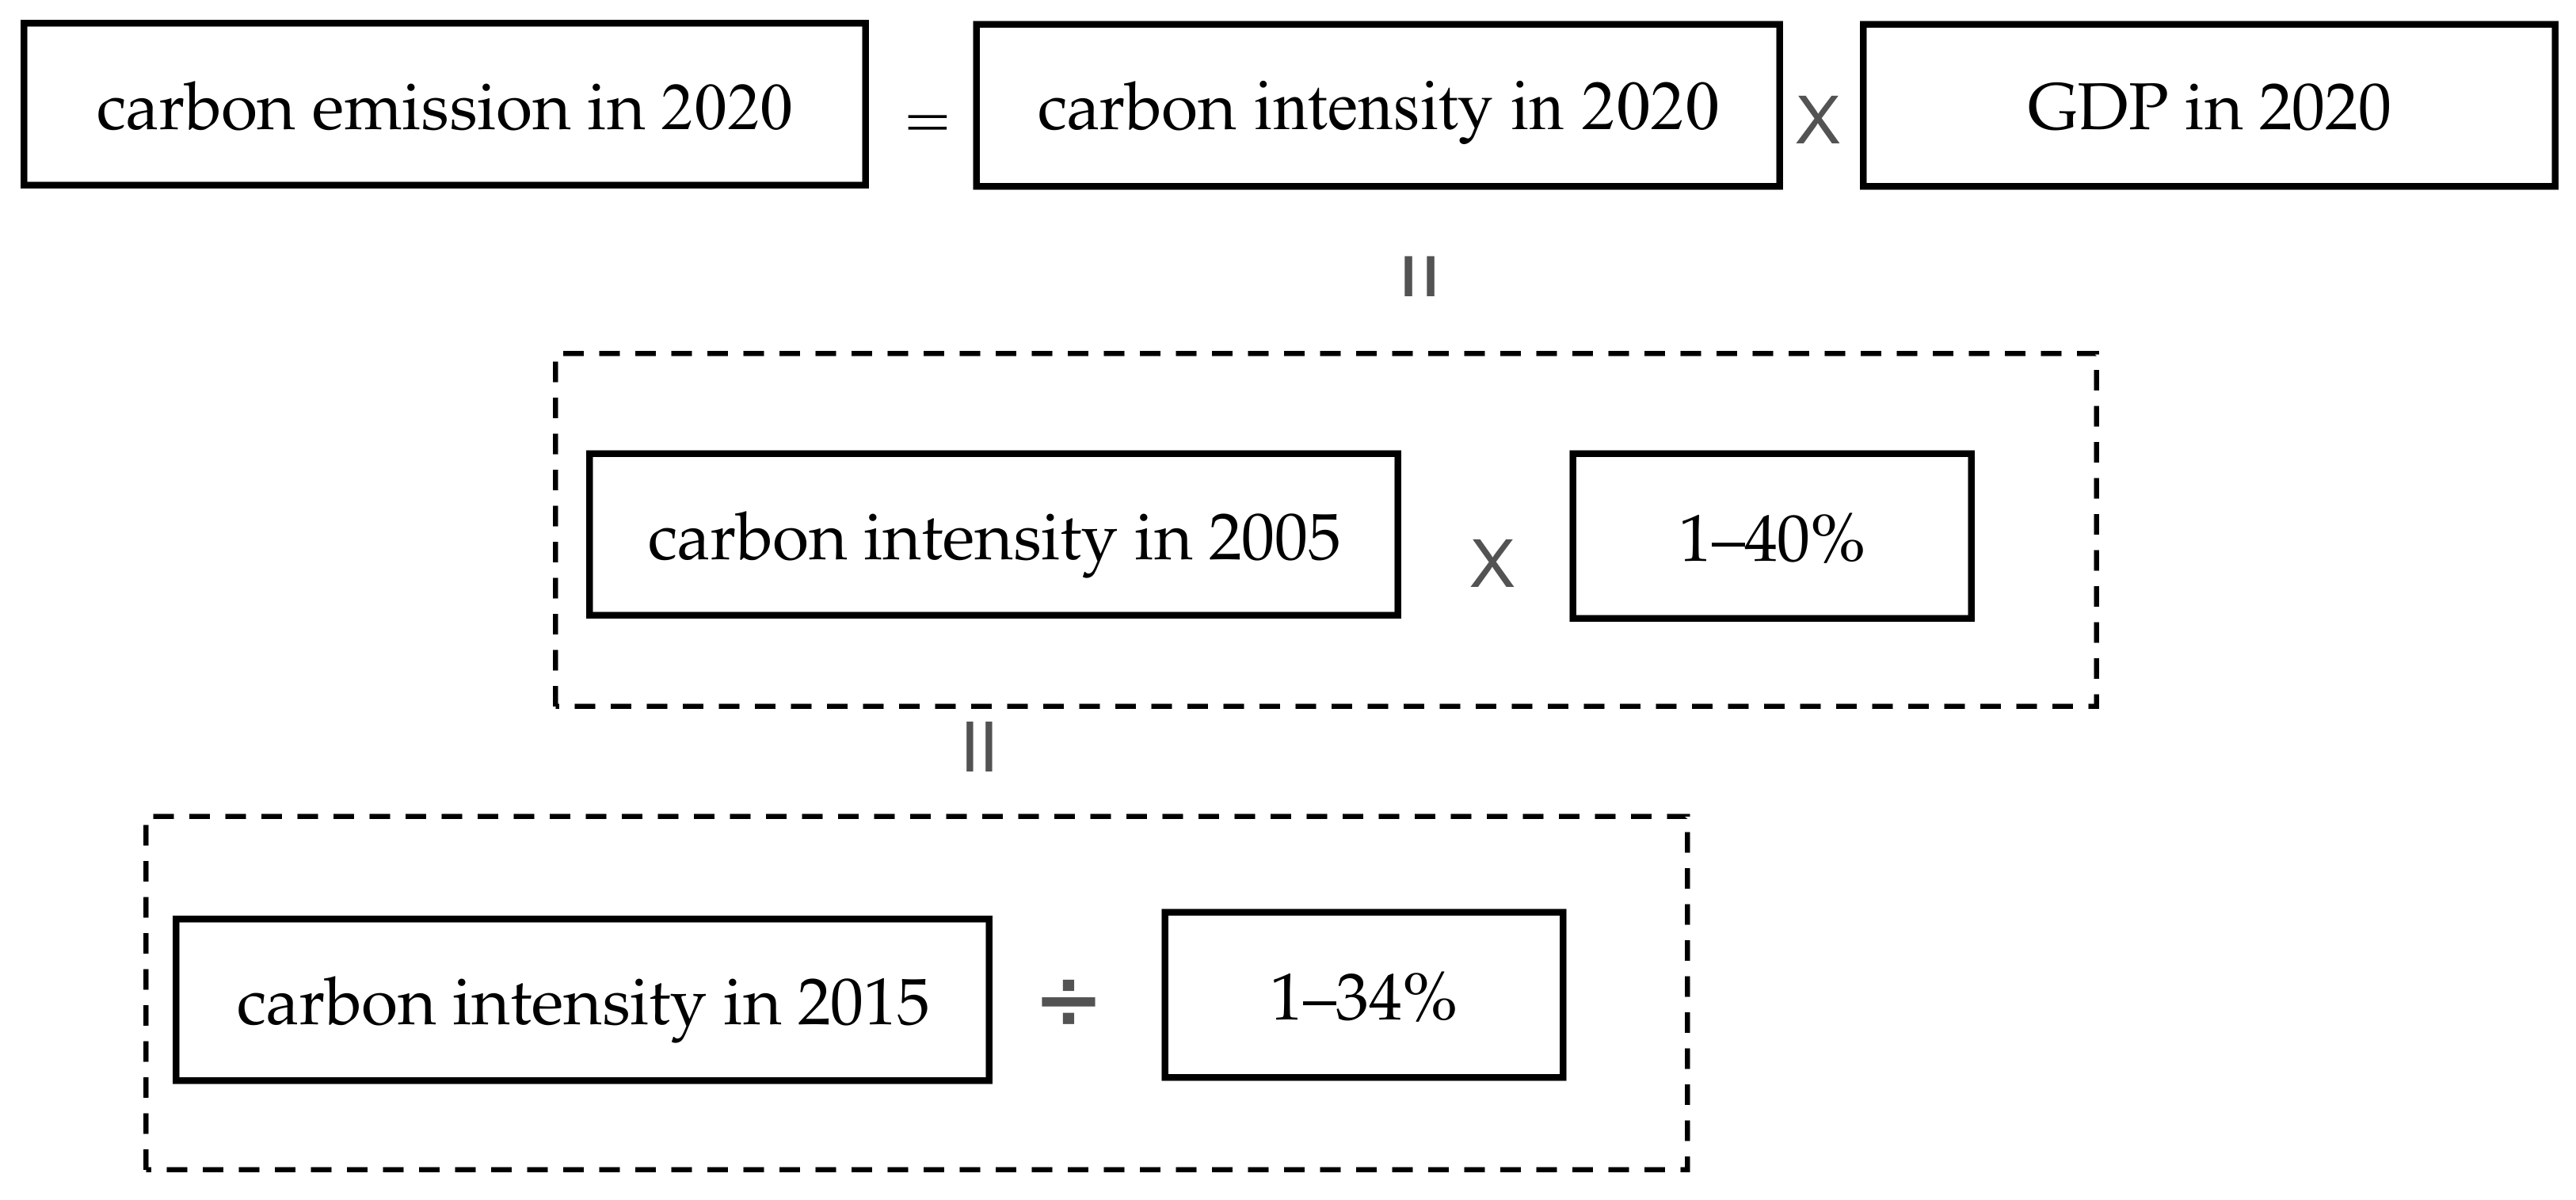
Before the meeting in Copenhagen, China proposed to reduce its CO2 emissions per unit GDP by 2020 to 40–45% lower than those in 2005. According to the target, 40% emission reduction target is set for 2020, and we calculate carbon emissions targets for 2020. In 2011, the State Council released its Twelfth Five-Year Plan for the Control of Greenhouse Gas Emissions, which made it clear that, by 2015, the national carbon intensity (using prices unchanged from those in 2005) is about 1.9 ton/10 thousand Yuan. This value represents a reduction of 17% from 2010, compared with an approximately 34% decrease relative to 2005. On this basis, we calculate the national carbon emissions in 2020. We first calculate the national carbon intensity in 2005. The 2005 national carbon intensity is then decreased by 34% to estimate the national carbon intensity in 2015. Subsequently, the emission reduction targets are used to calculate the national carbon intensity in 2020 and the national GDP in 2020, according to the estimates from the Thirteenth Five-Year Plan. The procedure used to carry out these calculations is shown in the Figure 1.
5. Empirical Analysis
5.1. Analysis the Results of the Fair Distribution Model
The calculations produced estimates of the total carbon emissions in 2020, and the GDP is forecast to be 64,050.92 billion (using prices unchanged from those in 2005).
According to Formula (1), considering the population, GDP, historical emissions and other equity factors, the demand for carbon emissions in the provinces is obtained, and the results are shown in Table 5. As seen in Table 5, the largest number of permits is allocated to Guangdong Province, and large amounts are also allocated to Jiangsu, Shandong, Shanxi, Zhejiang, Hebei, and Henan, which account for 48.92% of the total carbon emissions of China. Throughout the country, those areas with high GDP and large populations fall in the top 10. They also have some of the highest cumulative carbon emissions. Due to their small population sizes, lower levels of economic development and lower marginal costs of emission reductions, Qinghai, Hainan and Ningxia will have the smallest number of permits allocated in the country. In addition, they have low historical emissions, so the proportion of initial carbon emission permits is small.
Based on the comparison of the gross domestic product planned by the Thirteenth Five-Year Plan in the provinces, while maintaining steady economic growth, the level of economic development is quite different. The total economic volume tends to decrease in the eastern, central and western parts, as well as the eastern coastal areas. The level of economic development in the eastern coastal areas is generally higher than that of the central and western regions.
The population scale shows the population density in the developed areas, and the underdeveloped areas are sparsely populated.
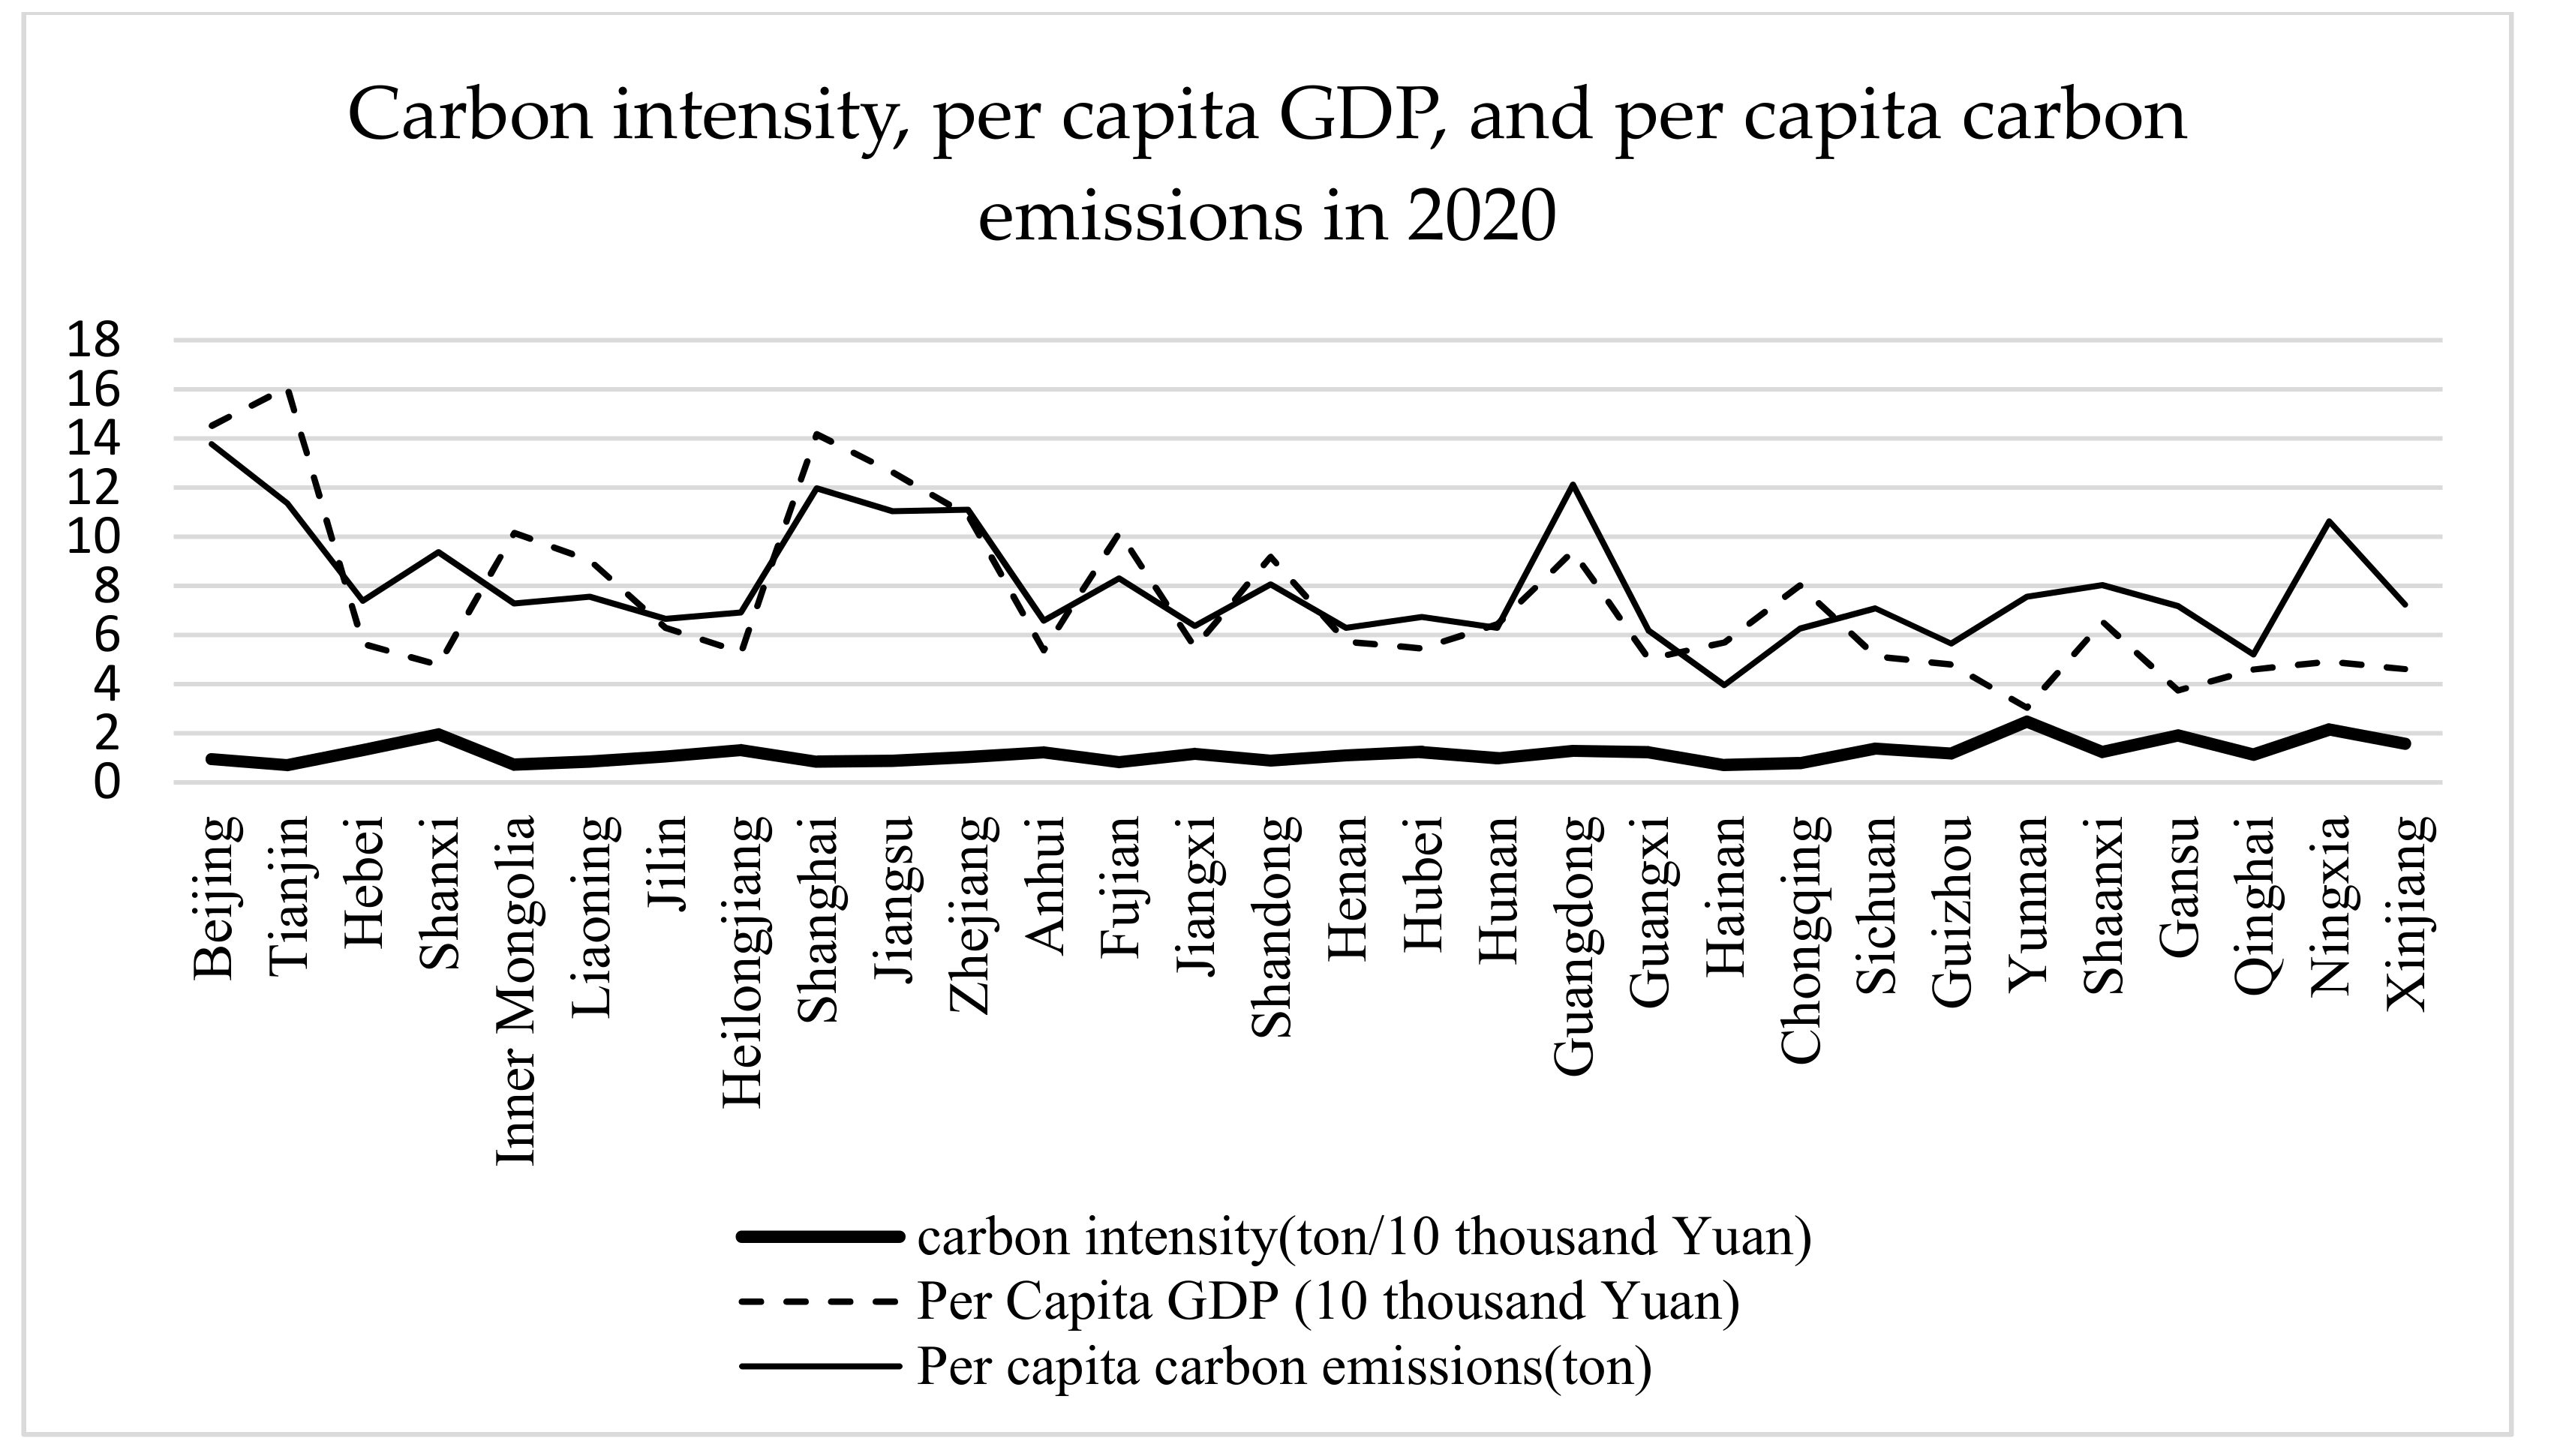
In 2015, the CO2 emission intensity of Beijing, Shanghai, Zhejiang and Guangdong is within 1.06 tons/ten thousand Yuan, those of Hebei, Inner Mongolia, Gansu, Shanxi, Xinjiang and other regions are 3 tons/ten thousand Yuan or above; and Ningxia has the highest CO2 emission intensity of 7.38 tons/ten thousand Yuan. The carbon emission intensity is an important indicator of low-carbon growth and green GDP. The data mentioned above reflect high CO2 emissions in these areas, which have low energy efficiency and are too dependent on natural resources and secondary industries for economic growth. Given the same GDP per capita, there are large differences in the amount of CO2 emissions per capita. In the northwestern region, the economic level is low, and the per capita carbon emissions are high. For example, the per capita CO2 emissions in Shanxi Province are more than four times those of Beijing in 2015. The elevated per capita CO2 emissions in Shanxi Province are closely related to its industrial structure and level of economic development. Shanxi is rich in natural resources, and coal production is its main industry. Beijing has a high level of economic development, and it relies primarily on high-tech industries with relatively low energy consumption. The initial allocation of carbon emissions in 30 regions of the country produced by the equity model is shown in Figure 2. The carbon intensity of the 30 regions is largely stable and remains within 2.5 tons/ten thousand Yuan. Economic growth is maintained, and green low-carbon development occurs at the same time. Given the same GDP per capita, the difference in CO2 emissions per person shrinks, and the values tend to become more similar.
5.2. Analysis of the Distribution Produced by the Efficiency Optimization Model
In this paper, the efficiency of the initial allocation of carbon emission permits among the provinces under the principle of fairness is calculated using the SBM-DEA model with undesirable outputs, and the efficiency values and the ranking of the regions are shown in Table 6. According to the data presented in this table, 13 regions, including Beijing and Tianjin, achieve the highest efficiency values of 1. The provinces with efficiency values of 0.9–0.99 are Liaoning, Jilin, Shanghai, Zhejiang, Anhui, Jiangxi, Hubei, Guangxi, Sichuan and Guizhou. The provinces with efficiency values of 0.8–0.9 include Hebei, Heilongjiang, Yunnan and Shaanxi. The provinces with low efficiency values (<0.9) are Shanxi, Gansu and Ningxia. The average efficiency of the 30 regions is 0.93. This result shows that the initial allocation model based on the principle of fairness is more realistic.
The introduction of relaxation variables is often used to solve problems over larger feasible regions. If the value of a relaxation variable is 0, then the problem converges to the original state, and when there is non-zero slack, the efficiency of the decision unit is overestimated. Table 6 shows that the slack variables of the cities in the eastern, central and southern regions are non-zero. To make the slack variables in these regions go to zero, their emissions permits need to be adjusted to achieve the optimal solution within the feasible range.
Judging from the permit adjustments in Table 7, 30% of the regions need to reduce the amounts of CO2 they are permitted to emit, on the basis of the initial distribution. Liaoning province needs to adjust its emissions by the largest degree (up to 16.09%). The corresponding percentages for some of the other provinces are Hebei, 3.93%; Shanxi, 4.32%; Jilin, 9.33%; Shanghai, 3.47%; Zhejiang, 12.03%; Anhui, 11.67%; Sichuan, 4.58%; Guizhou, 3.97% and Ningxia, 4.32%. Hebei, Jiangxi, Henan, Guangxi and other places can adjust their industrial structure, and reduce the proportion of secondary production to achieve their targets. Shanghai, Zhejiang and other places can encourage people to lead low-carbon lifestyles to promote low-carbon development. Shanxi, Liaoning and other places can improve their energy efficiency and reduce their emissions of CO2 and other greenhouse gases through technological inputs.
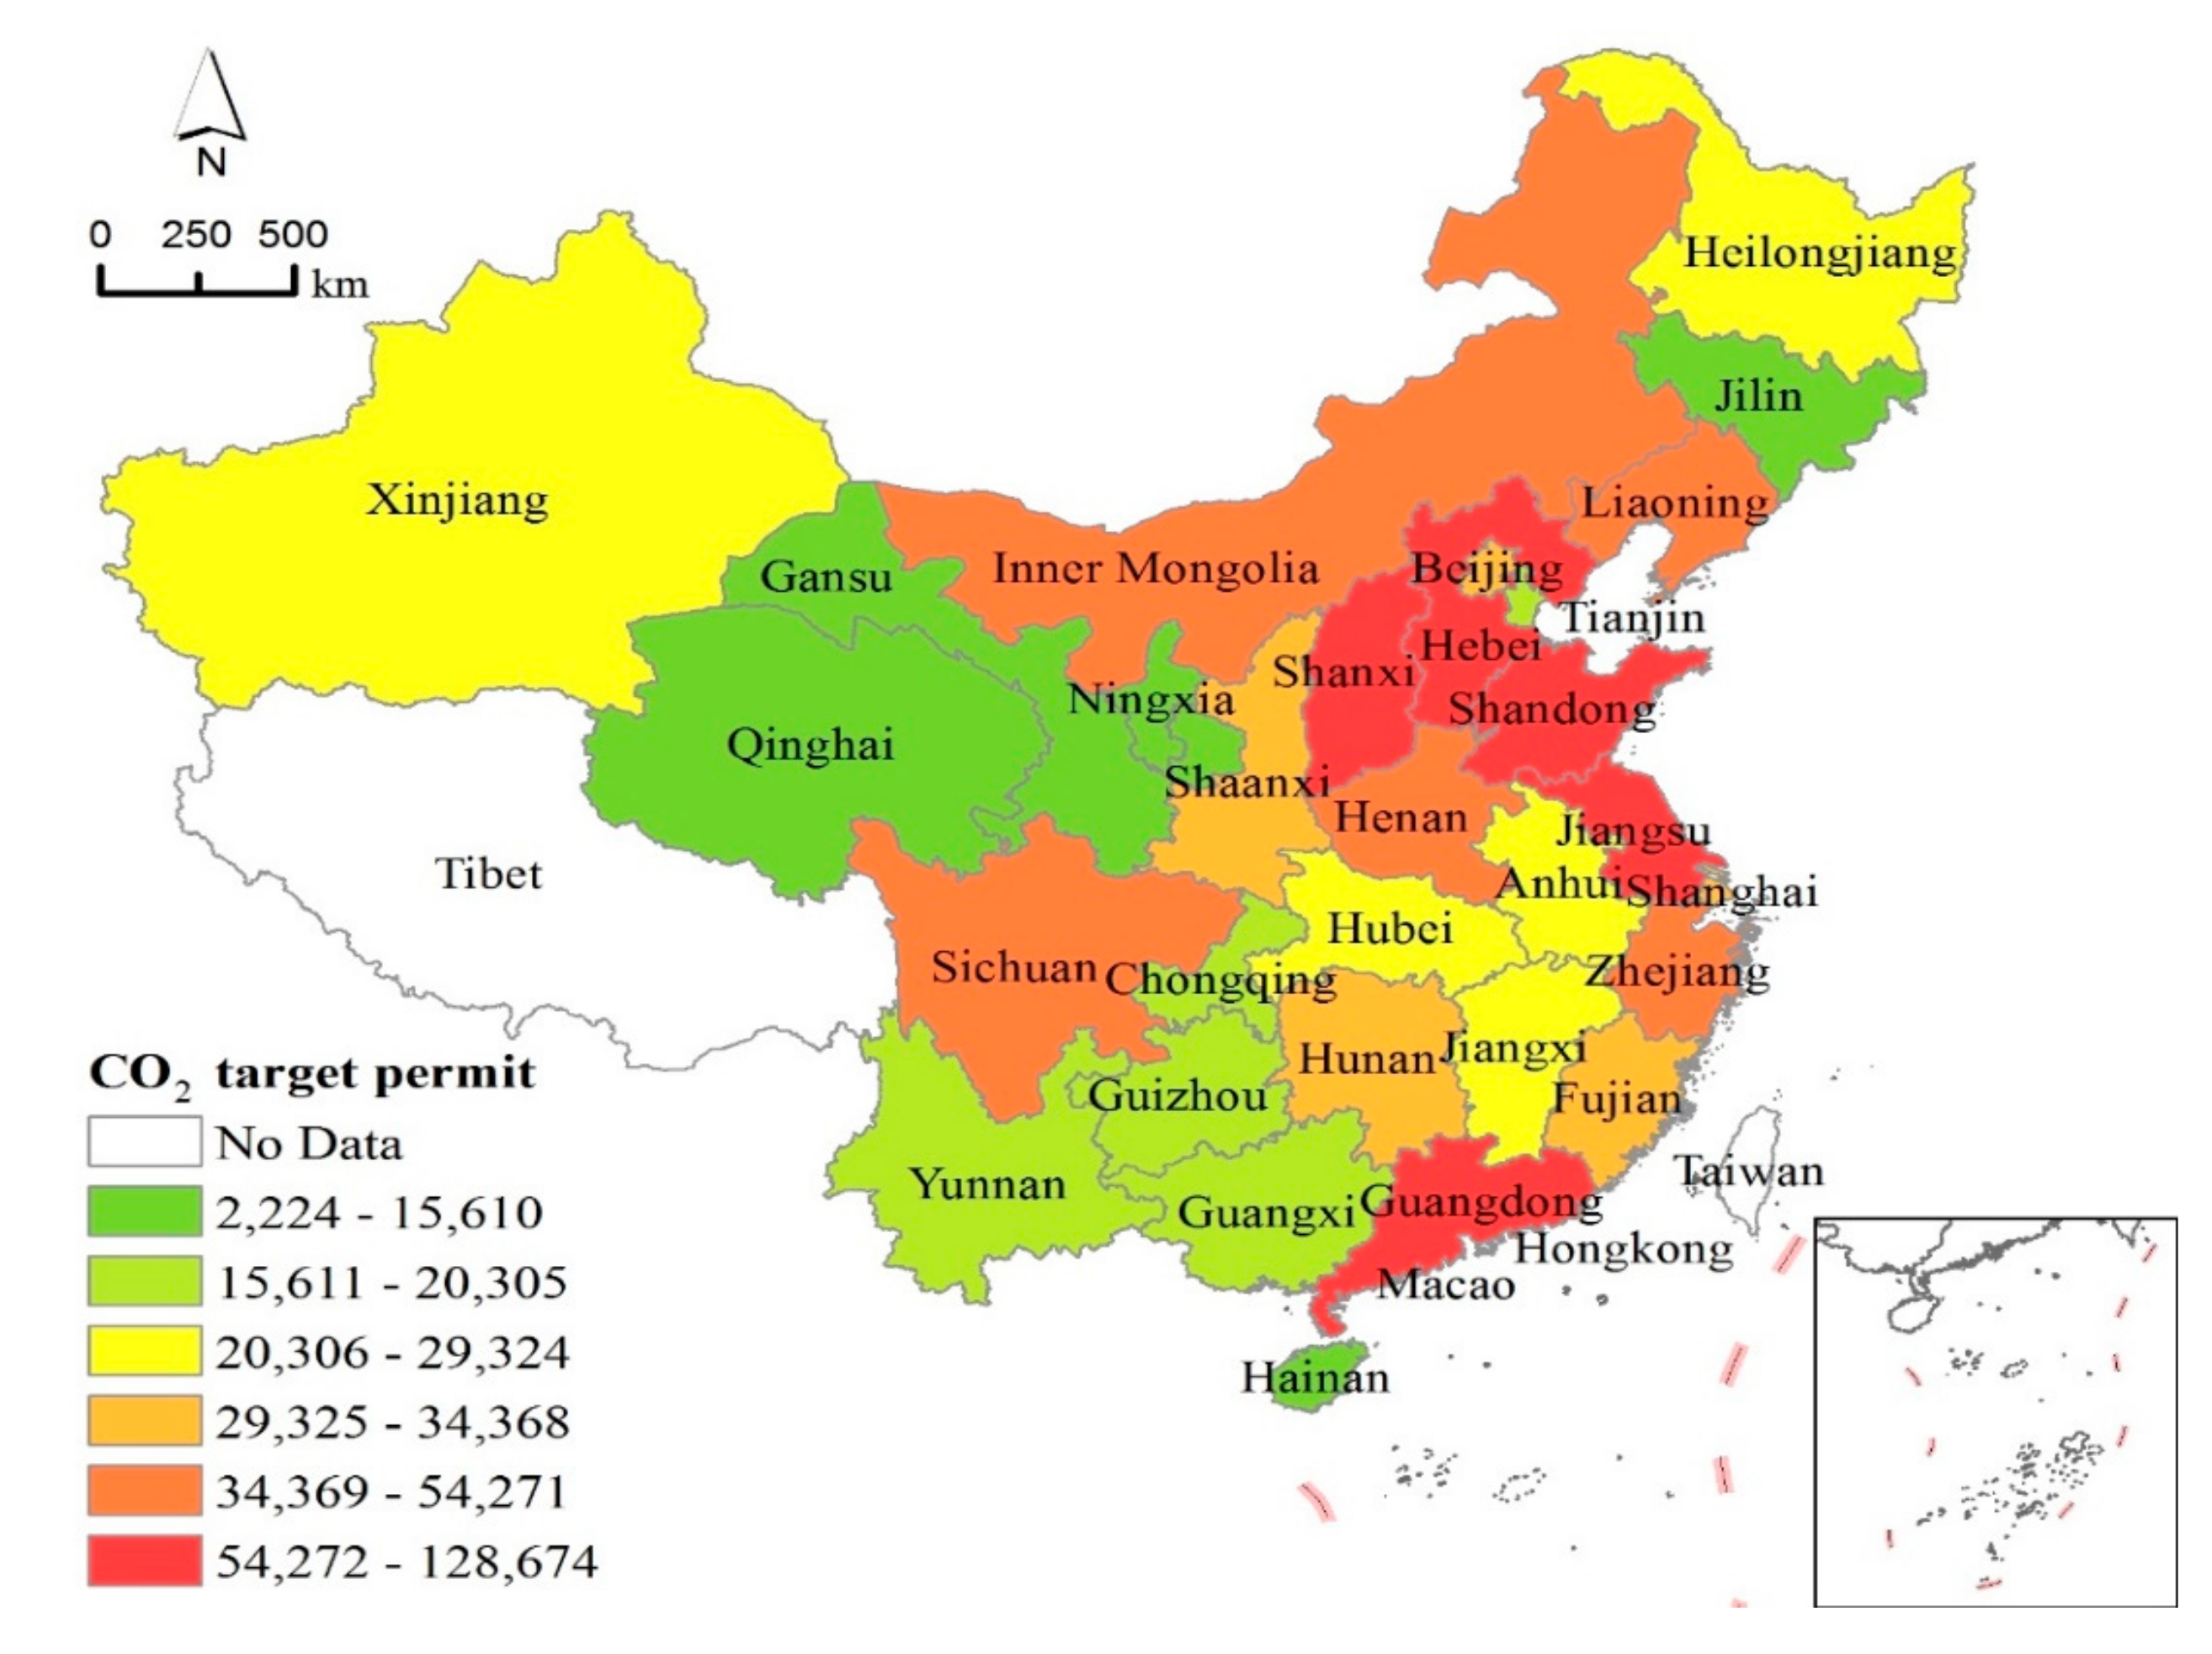
The provinces of China vary greatly in terms of their industrial structure, energy structure, population and stage of development, and each province has its own characteristics. As we can see in Figure 3, the carbon permits are mainly concentrated in Liaoning, Shandong and Inner Mongolia, as well as the southern Yangtze River Delta and the coastal cities, while the northwest and southwest regions receive the smallest quantities of carbon permits compared with the rest of the country. The reasons are as follows. (1) Economic aggregation: Table 2 shows that the GDPs of Guangdong, Jiangsu, Shandong, and Zhejiang rank in the top four in the country. (2) Energy structure: In Inner Mongolia, Shanxi, Henan and other places that are endowed with resources, coal is the main source of CO2 emissions. (3) The marginal cost of emission reduction: The emission reduction costs in Guangdong, Beijing, Zhejiang, and Shanghai are higher than those in other cities, such as those in Shanxi, Inner Mongolia, Ningxia, and Guizhou. The current technical level is relatively limited in the latter provinces, many of which produce large amounts of CO2. By comparison, in Guangdong, Beijing and other cities, the production technology has become very advanced, and the high energy efficiencies of these cities simplifies emission reductions, and less capital investment is needed to produce such reductions.
6. Conclusions
The emission intensity reduction target of China is essentially a total emission control and emission quota allocation problem. The allocation of carbon emission rights among the different regions will have significant effects in terms of financial allocation and structural adjustment. Thus, carbon permits represent a sensitive and controversial issue in the establishment of the carbon market. The different provinces in China display substantially different levels of development. The fair initial allocation of carbon emissions permits may narrow these gaps, but it will further widen the gap if it is not properly configured.
Based on the national carbon intensity target for 2020, which is 40% lower than that in 2005, and the population, GDP, marginal cost, and historical responsibility of the provinces, an equity allocation model was used to obtain a preliminary inter-provincial distribution of emission permits. On this basis, the carbon emission permits of each province are optimized using an SBM-DEA output-oriented model with undesirable outputs. According to the fair distribution model, it is not impossible for the provinces to meet the goals of economic growth and emission reductions by 2020. The results of the SBM-DEA efficiency model show that the initial allocation of permits is based on the principle of fairness results, which meets the standard of basic fairness. It is necessary to take into account factors such as the proportion of population, the proportion of GDP, the historical carbon emissions and the cost of marginal reduction in emission reduction.
Completion of the national emission reduction targets depends on the emission reductions of the provinces. From the results of the efficiency model, it can be seen that the state can over-complete the emission reduction task and form a “quota pool” for some of the extra carbon quotas. Through the development of carbon emission reduction incentives, these quotas can be awarded to the provinces with large contributions to reducing emissions. The 19th National Congress of the Communist Party of China points out that as socialism with Chinese characteristics has entered a new era, the principal contradiction facing Chinese society has evolved. What we now face is the contradiction between unbalanced and inadequate development and the people’s ever-growing needs for a better life. Thus, the quotas can be allocated to underdeveloped provinces freely as development resources. With economic development and technological progress, the regional emission reduction potential and emission reduction costs are also changing; therefore, the dynamic adjustment mechanism can avoid the situation of excess carbon on the market, so that the optimal allocation of environmental resources can allow for the coordinated development of the provinces and autonomous regions.
The provinces have both producer and consumer responsibility for carbon emissions, and “carbon transfer” plays an important role in the allocation of carbon emissions in the provinces. In recent years, due to the ecological quality requirements and environmental capacity constraints, the southeast coastal economically developed provinces input the energy from the undeveloped central and western regions which represent the national energy base. Thus, the energy is used by developed provinces, but the emissions remain in the undeveloped regions. Change in the regional energy cooperation mode, the formation of clean energy “positive output”, and sewage source “reverse migration” has obvious effects on emission reduction across provinces. In this paper, the initial allocation of carbon emissions in 30 regions of China is obtained with fairness as the starting point, and a preliminary distribution scheme is obtained. However, carbon emissions from the “reverse migration” of the carbon emissions via inter-provincial energy cooperation are not quantified, so a quantitative assessment and accounting for “reverse migration” will be the focus of future research.
Acknowledgments
The authors gratefully acknowledge support from the National Social Science Foundation of China (15BGL169) and the Natural Science Foundation of Zhejiang Province (Q15G030040).
Author Contributions
Huiqin Jiang and Jianqiang Bao conceived and designed the study. Xinxiao Shao and Xiao Zhang processed the data and performed the experiments. Huiqin Jiang and Xinxiao Shao reviewed and edited the manuscript. All authors read and approved the manuscript.
Conflicts of Interest
The authors declare no conflict of interest.
References
- Framework Convention on Climate Change. Paris Climate Change Agreement. In Proceedings of the United Nations Climate Change Conference, Paris, France, 30 November 2015. [Google Scholar]
- National Development and Reform Commission. Intended Nationally Determined Contributions (INDC). 2017. Available online: http://www.scio.gov.cn/xwfbh/xwbfbh/wqfbh/2015/20151119/xgbd33811/Document/1455864/1455864.htm (accessed on 12 April 2017).
- National Development and Reform Commission. Notice on Launching Pilots for Emissions Trading System. 2011. Available online: http://bgt.ndrc.gov.cn/zcfb/201201/t20120113_498705.html (accessed on 12 April 2017).
- Zhanga, D.; Karplusb, V.J.; Cassisaa, C.; Zhanga, X. Emissions trading in China: Progress and prospects. Energy Policy 2014, 75, 9–16. [Google Scholar] [CrossRef]
- Xiu, J.F.; Chou, J.M.; Dong, W.J.; Yang, Z.Y. Carbon Reduction Policies: A Regional Comparison of Their Contributions to CO2 Abatement in Six Carbon Trading Pilot Schemes in China. Atmos. Ocean. Sci. Lett. 2015, 8, 233–237. [Google Scholar]
- Ren, C.; Alex, Y.L. Emission trading and carbon market performance in Shenzhen, China. Appl. Energy 2017, 193, 414–425. [Google Scholar]
- Xiong, L.; Shen, B.; Qi, S.; Price, L.; Ye, B. The allowance mechanism of China’s carbon trading pilots: A comparative analysis with schemes in EU and California. Appl. Energy 2017, 185, 1849–1859. [Google Scholar] [CrossRef]
- Dong, X.; Ma, Y.; Sun, H.X. From Pilot to the National Emissions Trading Scheme in China: International Practice and Domestic Experiences. Sustainability 2016, 8, 522. [Google Scholar] [CrossRef]
- Oestreich, A.M.; Tsiakas, I. Carbon emissions and stock returns: Evidence from the EU Emissions Trading Scheme. J. Bank. Financ. 2015, 58, 294–308. [Google Scholar] [CrossRef]
- Convery, F.J. Origins and development of the EU ETS. Environ. Resour. Econ. 2009, 43, 391–412. [Google Scholar] [CrossRef]
- Kettner, C.; Koppl, A.; Schleicher, S.; Theninus, G. Stringency and distribution in the EU emissions trading Scheme: First evidence. Clim. Policy 2008, 1, 41–61. [Google Scholar] [CrossRef]
- Burtraw, D.; Evans, D.A. Tradable Rights to Emit Air Pollution. Aust. J. Agric. Resour. Econ. 2009, 1, 59–84. [Google Scholar] [CrossRef]
- Martin, R.; Muuls, M.; Wagner, U.J. The Impact of the European Union Emissions Trading Scheme on Regulated Firms: What Is the Evidence after Ten Years? Rev. Environ. Econ. Policy 2016, 10, 129–148. [Google Scholar] [CrossRef]
- Bohringer, C.; Lange, A. On the Design of Optimal Grandfathering Schemes for Emission Allowances. Eur. Econ. Rev. 2005, 8, 2041–2055. [Google Scholar] [CrossRef]
- Palmer, K.; Burtraw, D.; Kahn, D. Simple Rules for Targeting CO2 Allowance Allocations to Compensate Firms. Clim. Policy 2006, 4, 477–493. [Google Scholar] [CrossRef]
- Clo, S. Auctioning and Carbon Leakage: Assessing the Inconsistencies of the New ETS Directive. Energy Policy 2010, 5, 2420–2430. [Google Scholar] [CrossRef]
- Zetterberg, L.; Wrake, M.; Sterner, T.; Fischer, C.; Burtraw, D. Short-Run allocation of emissions allowances and long-term goals for Climate Policy. Ambio 2012, 41, 23–32. [Google Scholar] [CrossRef] [PubMed]
- Zetterberg, L. Benchmarking in the European Union Emissions Trading System: Abatement Incentives. Energy Econ. 2014, 43, 218–224. [Google Scholar] [CrossRef]
- Frank, M. The effect of allocation above emissions and price uncertainty on abatement investments under the EU ETS. J. Clean. Prod. 2016, 126, 595–606. [Google Scholar]
- Nicola, D.V.; Giovanni, M. How neutral is the choice of the allocation mechanism in cap-and-trade schemes? Evidence from the EU-ETS. Sustainability 2017, 4, 23. [Google Scholar]
- Ellerman, A.D.; Buchner, B.K. Over-Allocation or Abatement? A Preliminary Analysis of the EU ETS Based on the 2005-06 Emissions Data. Environ. Resour. Econ. 2008, 2, 267–287. [Google Scholar] [CrossRef]
- Ellerman, A.D.; Buchner, B.K. The European Union Emissions Trading Scheme: Origins, Allocation, and Early Results. Rev. Environ. Econ. Policy 2007, 1, 66–87. [Google Scholar] [CrossRef]
- Clo, S. The Effectiveness of the EU Emissions Trading Scheme. Clim. Policy 2009, 3, 227–241. [Google Scholar] [CrossRef]
- Venmans, F. A Literature-Based Multi-Criteria Evaluation of the EU ETS. Renew. Sustain. Energy Rev. 2012, 8, 5493–5510. [Google Scholar] [CrossRef]
- Jong, T.; Couwenberg, O.; Woerdman, E. Does EU Emissions Trading Bite? An Event Study. Energy Policy 2014, 69, 510–519. [Google Scholar] [CrossRef]
- Hu, J.; Crijns-Graus, W.; Lam, L.; Gilbert, A. Ex-ante evaluation of EU ETS during 2013–2030: EU-internal Abatement. Energy Policy 2015, 77, 152–163. [Google Scholar] [CrossRef]
- Viguier, L.; Vielle, M.; Haurie, A.; Bernard, A. A two-level computable equilibrium model to assess the strategic allocation of emission allowances within the European Union. Comput. Oper. Res. 2006, 33, 369–385. [Google Scholar] [CrossRef]
- Groenenberg, H.; Phylipsen, D.; Blok, K. Differentiating commitments worldwide: Global differentiation of GHG emissions reductions based on the Triptych approach preliminary assessment. Energy Policy 2001, 29, 1007–1030. [Google Scholar] [CrossRef]
- Ding, Z.L.; Duan, X.N.; Ge, Q.S.; Zhang, Z.Q. Control of atmospheric CO2 concentration by 2050: An allocation on the emission rights of different countries. Sci. China Ser. D Earth Sci. 2009, 39, 1448–1471. [Google Scholar] [CrossRef]
- Böhringera, C.; Dijkstra, B.; Rosendahlc, K.E. Sectoral and regional expansion of emissions trading. Resour. Energy Econ. 2014, 37, 201–225. [Google Scholar] [CrossRef]
- Wei, Y.M.; Wang, L.; Liao, H.; Wang, K.; Murty, T. Responsibility accounting in carbon allocation: A global perspective. Appl. Energy 2014, 130, 122–133. [Google Scholar] [CrossRef]
- Ye, B.; Jiang, J.; Miao, L.; Li, J.; Peng, Y. Innovative Carbon Allowance Allocation Policy for the Shenzhen Emission Trading Scheme in China. Sustainability 2016, 8, 3. [Google Scholar] [CrossRef]
- Liu, H.X.; Lin, B.Q. Cost-based modelling of optimal emission quota allocation. J. Clean. Prod. 2017, 149, 472–484. [Google Scholar] [CrossRef]
- Xie, R.; Gao, C.; Zhao, G.M.; Liu, Y.; Xu, S.C. Empirical Study of China’s Provincial Carbon Responsibility Sharing: Provincial Value Chain Perspective. Sustainability 2017, 9, 569. [Google Scholar] [CrossRef]
- Yang, B.C.; Liu, C.Z.; Su, Y.P.; Jing, X. The Allocation of Carbon Intensity Reduction Target by 2020 among Industrial Sectors in China. Sustainability 2017, 9, 148. [Google Scholar] [CrossRef]
- Qin, Q.; Liu, Y.; Li, X.; Li, H. A multi-criteria decision analysis model for carbon emission quota allocation in China’s east coastal areas: Efficiency and equity. J. Clean. Prod. 2017, 168, 410–419. [Google Scholar] [CrossRef]
- Baer, P.; Athanasiou, T.; Kartha, S.; Kemp-Benedict, E. The Greenhouse Development Rights Framework. Clim. Dev. 2008, 2, 147–165. [Google Scholar]
- Ding, Z.L. Allocation of carbon emissions should be allocated based on future emission quotas. Popular Tribune. 2010, 4, 20–23. [Google Scholar]
- Wan, L.L.; Sun, B.; Ren, X.P. The measure and decomposition of China’s provincial carbon emission fairness. Econ. Dyn. 2014, 12, 53–60. [Google Scholar]
- Pan, J.H.; Zheng, Y. Responsibility and individual equity for carbon emissions rights. World Econ. Politics 2009, 10, 6–16. [Google Scholar]
- Deng, J.X.; Liu, X.; Wang, Z. Characteristics analysis and factor decomposition based on the regional difference changes in China’s CO2 emission. J. Nat. Resour. 2014, 2, 189–200. [Google Scholar]
- Long, G. Research on the allocation and development model of China’s carbon trading system. J. Shanxi Univ. Financ. Econ. 2014, 34, 14–16. [Google Scholar]
- Yi, W.J.; Zou, L.L.; Guo, J.; Wang, K.; Wei, Y.M. How can china reach its CO2 intensity reduction targets by 2020? A regional allocation based on equity and development. Energy Policy 2011, 39, 2407–2415. [Google Scholar] [CrossRef]
- Song, D.Y.; Liu, X.P. Spatial distribution of provincial carbon emissions. China Popul. Resour. Environ. 2013, 5, 7–13. [Google Scholar]
- Pan, T.; Kao, J. Inter-generational equity index for assessing environmental sustainability: An example on global warming. Ecol. Indic. 2009, 4, 725–731. [Google Scholar] [CrossRef]
- Wang, W.J.; Lu, Z.N.; Zhu, D.D. The research on carbon quota of China’s industrial system under the perspective of fairness and efficiency. Stat. Decis. 2016, 23, 162–165. [Google Scholar]
- Wang, W.L.; Li, F. Research on the allocation of inter-provincial quotas in China’s unified carbon market. Qiushi J. 2015, 2, 44–51. [Google Scholar]
- Li, T. Empirical study for CO2 abatement allocation among provinces in China: Based on a nonlinear programming model. Manag. Rev. 2010, 6, 54–60. [Google Scholar]
- Liu, M.L.; Zhu, L.; Fan, Y. Evaluation of carbon emission performance and estimation of marginal CO2 abatement costs for provinces of China: A non-parametric distance function approach. China Soft Sci. 2011, 3, 106–114. [Google Scholar]
- Hu, C.Z.; Huang, X.J.; Zhong, T.Y. Analysis of China’s carbon emission characteristics and its dynamic evolution. China Popul. Resour. Environ. 2008, 3, 38–42. [Google Scholar]
- Wei, C.; Ni, J.L.; Du, L.M. Regional allocation of carbon dioxide abatement in China. China Econ. Rev. 2012, 23, 552–565. [Google Scholar] [CrossRef]
- Li, Y.M.; Zhang, L.; Cheng, X.L. Analysis of the factors of China’s carbon emission change and the way of emission reduction. Resour. Sci. 2010, 2, 218–222. [Google Scholar]
- Wang, D.; Nie, R.; Wang, S.Z. The measurement and decomposition of China’s carbon dioxide emission region: Based on the perspective of interpersonal fairness. Sci. Res. 2013, 11, 1661–1670. [Google Scholar]
- Tone, K. A Slacks-Based Measure of Efficiency in Data Envelopment Analysis. Eur. J. Oper. Res. 2001, 3, 498–509. [Google Scholar] [CrossRef]
- Fan, Y.; Mo, J.L.; Zhu, L. Carbon Trading in China Policy Design and School-Economic Impact; Science Press: Beijing, China, 2016. [Google Scholar]
Figure 1.
Flow chart describing the calculation of the national carbon emissions in 2020.

Figure 2.
Carbon intensity, per capita GDP, and per capita carbon emissions.

Figure 3.
Map showing the distribution of carbon emission permits for the 30 provinces in 2020.


Table 1.
Equitable distribution factors.
| Equitable Distribution Factor | Fairness Principle | Interpretation | Shared Responsibility |
|---|---|---|---|
| Population size | Principle of human fairness | Everyone has equal rights to use atmospheric resources | The population or per capita emissions is used to determine emission reduction responsibilities |
| Economic scale | Principle of economic development | The stronger the economy, the more responsibility it bears | The task of reducing emissions is shared according to per capita GDP |
| Historical emissions | Principle of historical responsibility | The proportion of historical emissions per country (region) | The proportional reduction in emissions for each country (region) is equal to the proportion of historical emissions |
| Energy consumption level and technological development | Principle of cost reduction | The same emission reduction costs have consistent emission rights and emission reduction responsibilities | The change in net welfare should be equal in all countries (regions); for example, the unit GDP emission reduction costs should be equal |
| Industrial and energy structure | Principle of current liability | The current level of emissions determines the responsibility for reducing emissions | The task of reducing emissions is shared according to the current level of emissions of each country (region) |
Table 2.
The target GDP growth values obtained from the Thirteenth Five-Year Plan.
| Region | Target GDP Growth from the Thirteenth Five-Year Plan | GDP in 2020 (100 Million Yuan) | Fraction of the Total for China as a Whole (%) | Region | Target GDP Growth from the Thirteenth Five-Year Plan | GDP in 2020 (100 Million Yuan) | Fraction of the Total for China as a Whole (%) |
|---|---|---|---|---|---|---|---|
| Beijing | 6.5% | 31,532.00 | 3.12 | Henan | 8% | 54,380.20 | 5.38 |
| Tianjin | 8.5% | 24,867.76 | 2.46 | Hubei | doubled in 2010 | 31,935.22 | 3.16 |
| Hebei | 7% | 41,804.46 | 4.13 | Hunan | 8.5% | 43,677.02 | 4.32 |
| Shanxi | 6.5% | 17,540.67 | 1.73 | Guangdong | 7% | 102,122.60 | 10.09 |
| Inner Mongolia | 7.5% | 25,511.41 | 2.52 | Guangxi | 7.5% | 24,123.05 | 2.38 |
| Liaoning | 6.6% | 39,566.18 | 3.91 | Hainan | 7% | 5193.31 | 0.51 |
| Jilin | doubled in 2010 | 17,334.00 | 1.71 | Chongqing | 9% | 24,182.97 | 2.39 |
| Heilongjiang | 6% | 20,185.39 | 2.00 | Sichuan | 7% | 42,150.89 | 4.17 |
| Shanghai | 6.5% | 34,204.20 | 3.38 | Guizhou | 10% | 16,914.48 | 1.67 |
| Jiangsu | 7.5% | 100,661.13 | 9.95 | Yunnan | doubled in 2010 | 14,440.28 | 1.43 |
| Zhejiang | 7% | 60,150.52 | 5.95 | Shaanxi | 6.6% | 24,806.47 | 2.45 |
| Anhui | 8.5% | 33,088.91 | 3.27 | Gansu | 7.5% | 9748.38 | 0.96 |
| Fujian | 8.5% | 39,064.73 | 3.86 | Qinghai | doubled in 2010 | 2700.86 | 0.27 |
| Jiangxi | 8.5% | 25,146.82 | 2.49 | Ningxia | doubled in 2010 | 3286.82 | 0.32 |
| Shandong | 7.5% | 90,447.99 | 8.94 | Xinjiang | doubled in 2010 | 10,874.00 | 1.07 |
Table 3.
Cumulative carbon emissions in the 30 regions from 2013 to 2015.
| Region | CO2 Emissions (10 kt CO2) | Rank | Fraction of the Total for China as a Whole (%) | Region | CO2 Emissions (10 kt CO2) | Rank | Fraction of the Total for China as a Whole (%) |
|---|---|---|---|---|---|---|---|
| Beijing | 36,337.96 | 28 | 0.95 | Henan | 194,487.99 | 7 | 5.08 |
| Tianjin | 62,345.36 | 26 | 1.63 | Hubei | 110,590.24 | 15 | 2.89 |
| Hebei | 280,552.36 | 2 | 7.32 | Hunan | 96,659.47 | 16 | 2.52 |
| Shanxi | 249,821.48 | 4 | 6.52 | Guangdong | 190,974.66 | 8 | 4.99 |
| Inner Mongolia | 242,559.89 | 5 | 6.33 | Guangxi | 70,855.60 | 22 | 1.85 |
| Liaoning | 217,354.33 | 6 | 5.67 | Hainan | 20,245.36 | 29 | 0.53 |
| Jilin | 82,379.75 | 19 | 2.15 | Chongqing | 49,127.28 | 27 | 1.28 |
| Heilongjiang | 112,943.04 | 14 | 2.95 | Sichuan | 113,804.83 | 13 | 2.97 |
| Shanghai | 79,095.71 | 20 | 2.07 | Guizhou | 88,736.86 | 17 | 2.32 |
| Jiangsu | 252,310.77 | 3 | 6.59 | Yunnan | 71,612.84 | 21 | 1.87 |
| Zhejiang | 136,645.59 | 11 | 3.57 | Shaanxi | 147,450.64 | 9 | 3.85 |
| Anhui | 121,621.98 | 12 | 3.18 | Gansu | 65,179.97 | 24 | 1.70 |
| Fujian | 82,417.76 | 18 | 2.15 | Qinghai | 18,083.52 | 30 | 0.47 |
| Jiangxi | 65,959.12 | 23 | 1.72 | Ningxia | 62,675.40 | 25 | 1.64 |
| Shandong | 364,166.48 | 1 | 9.51 | Xinjiang | 143,272.19 | 10 | 3.74 |
Table 4.
Marginal costs of emission reduction in the no carbon trading scenario (Unit: Yuan/ton).
| Region | Marginal Cost of Emission Reduction in 2020 | Region | Marginal Cost of Emission Reduction in 2020 |
|---|---|---|---|
| Beijing | 149.36 | Henan | 44.61 |
| Tianjin | 87.61 | Hubei | 53.97 |
| Hebei | 37.1 | Hunan | 58.44 |
| Shanxi | 20.93 | Guangdong | 148.37 |
| Inner Mongolia | 17.54 | Guangxi | 47.72 |
| Liaoning | 41.95 | Hainan | 0 |
| Jilin | 40.3 | Chongqing | 57.35 |
| Heilongjiang | 38.14 | Sichuan | 69.63 |
| Shanghai | 105.78 | Guizhou | 17.56 |
| Jiangsu | 99.8 | Yunnan | 30.27 |
| Zhejiang | 114.65 | Shaanxi | 50.68 |
| Anhui | 48.76 | Gansu | 29.31 |
| Fujian | 81.44 | Qinghai | 0 |
| Jiangxi | 55.88 | Ningxia | 15.05 |
| Shandong | 59.67 | Xinjiang | 0 |
Table 5.
Allocation of initial CO2 emission permits among the regions by 2020 (unit: 10 kt).
| Region | Allocation of Initial CO2 Emission Permits | Region | Allocation of Initial CO2 Emission Permits |
|---|---|---|---|
| Beijing | 29,784.71 | Henan | 48,525.15 |
| Tianjin | 19,705.61 | Hubei | 27,969.09 |
| Hebei | 59,198.97 | Hunan | 32,950.73 |
| Shanxi | 62,631.92 | Guangdong | 126,873.84 |
| Inner Mongolia | 44,249.94 | Guangxi | 20,304.23 |
| Liaoning | 42,120.59 | Hainan | 2862.20 |
| Jilin | 16,192.96 | Chongqing | 15,800.26 |
| Heilongjiang | 24,735.96 | Sichuan | 42,080.65 |
| Shanghai | 30,559.14 | Guizhou | 17,819.38 |
| Jiangsu | 93,499.04 | Yunnan | 16,210.92 |
| Zhejiang | 61,693.93 | Shanxi | 34,367.18 |
| Anhui | 33,199.48 | Gansu | 15,609.14 |
| Fujian | 30,681.44 | Qinghai | 2224.37 |
| Jiangxi | 21,587.18 | Ningxia | 15,348.51 |
| Shandong | 88,991.99 | Xinjiang | 29,021.38 |
Table 6.
Efficiency values and ranks and slack CO2 in the different regions.
| Region | Efficiency Value (Rank) | Slack CO2 | Region | Efficiency Value (Rank) | Slack CO2 |
|---|---|---|---|---|---|
| Beijing | 1 (1) | 0 | Henan | 1 (1) | 0 |
| Tianjin | 1 (1) | 0 | Hubei | 0.933223 (17) | 0 |
| Hebei | 0.845213 (26) | −0.02011 | Hunan | 1 (1) | 0 |
| Shanxi | 0.661597 (24) | −0.02321 | Guangdong | 1 (1) | 0 |
| Inner Mongolia | 1 (1) | 0 | Guangxi | 0.936166 (16) | 0 |
| Liaoning | 0.925532 (18) | −0.06245 | Hainan | 1 (1) | 0 |
| Jilin | 0.903914 (22) | −0.01875 | Chongqing | 1 (1) | 0 |
| Heilongjiang | 0.840171 (27) | 0 | Sichuan | 0.908951 (21) | −0.01777 |
| Shanghai | 0.982935 (14) | −0.01058 | Guizhou | 0.910123 (20) | −0.00845 |
| Jiangsu | 1 (1) | 0 | Yunnan | 0.84821 (25) | 0 |
| Zhejiang | 0.943255 (15) | −0.0637 | Shaanxi | 0.80969 (28) | 0 |
| Anhui | 0.901539 (23) | −0.03778 | Gansu | 0.764322(30) | 0 |
| Fujian | 1 (1) | 0 | Qinghai | 1 (1) | 0 |
| Jiangxi | 0.924447 (19) | 0 | Ningxia | 0.787069 (29) | −0.00842 |
| Shandong | 1 (1) | 0 | Xinjiang | 1 (1) | 0 |
Table 7.
CO2 permits after optimization using the SBM-DEA model (unit: 10 kt).
| Region | CO2 Target Permit | Reduction Proportion | Region | CO2 Target Permit | Reduction Proportion |
|---|---|---|---|---|---|
| Beijing | 29,784.71 | 0.00% | Henan | 48,525.15 | 0.00% |
| Tianjin | 19,705.61 | 0.00% | Hubei | 27,969.09 | 0.00% |
| Hebei | 56,870.81 | 3.93% | Hunan | 32,950.73 | 0.00% |
| Shanxi | 59,920.85 | 4.32% | Guangdong | 126,873.84 | 0.00% |
| Inner Mongolia | 44,249.94 | 0.00% | Guangxi | 20,304.23 | 0.00% |
| Liaoning | 35,342.51 | 16.09% | Hainan | 2862.20 | 0.00% |
| Jilin | 14,681.67 | 9.33% | Chongqing | 15,800.26 | 0.00% |
| Heilongjiang | 24,735.96 | 0.00% | Sichuan | 40,152.81 | 4.58% |
| Shanghai | 29,498.04 | 3.47% | Guizhou | 17,111.13 | 3.97% |
| Jiangsu | 93,499.04 | 0.00% | Yunnan | 16,210.92 | 0.00% |
| Zhejiang | 54,270.99 | 12.03% | Shaanxi | 34,367.18 | 0.00% |
| Anhui | 29,323.94 | 11.67% | Gansu | 15,609.14 | 0.00% |
| Fujian | 30,681.44 | 0.00% | Qinghai | 2224.37 | 0.00% |
| Jiangxi | 21,587.18 | 0.00% | Ningxia | 14,684.71 | 4.32% |
| Shandong | 88,991.99 | 0.00% | Xinjiang | 29,021.38 | 0.00% |
© 2017 by the authors. Licensee MDPI, Basel, Switzerland. This article is an open access article distributed under the terms and conditions of the Creative Commons Attribution (CC BY) license (http://creativecommons.org/licenses/by/4.0/).
Share and Cite
MDPI and ACS Style
Jiang, H.; Shao, X.; Zhang, X.; Bao, J. A Study of the Allocation of Carbon Emission Permits among the Provinces of China Based on Fairness and Efficiency. Sustainability 2017, 9, 2122. https://doi.org/10.3390/su9112122
AMA Style
Jiang H, Shao X, Zhang X, Bao J. A Study of the Allocation of Carbon Emission Permits among the Provinces of China Based on Fairness and Efficiency. Sustainability. 2017; 9(11):2122. https://doi.org/10.3390/su9112122
Chicago/Turabian StyleJiang, Huiqin, Xinxiao Shao, Xiao Zhang, and Jianqiang Bao. 2017. "A Study of the Allocation of Carbon Emission Permits among the Provinces of China Based on Fairness and Efficiency" Sustainability 9, no. 11: 2122. https://doi.org/10.3390/su9112122
Note that from the first issue of 2016, this journal uses article numbers instead of page numbers. See further details here.