Development of the CO2 Emission Evaluation Tool for the Life Cycle Assessment of Concrete

1
Building and Urban Research Institute, Korea Institute of Civil Engineering and Building Technology, Daehwa-dong 283, Goyandae-Ro, Ilsanseo-Gu, Goyang-Si, Gyeonggi-Do 10223, Korea
2
School of Architecture & Architectural Engineering, Hanyang University, Sa 3-dong, Sangrok-Gu, Ansan-Si 04763, Korea;[email protected]
3
Department of Architectural Engineering, Andong National University, 1375, Gyeongdong-Ro, Andong-Si 36729, Korea
*
Author to whom correspondence should be addressed.
Sustainability 2017, 9(11), 2116; https://doi.org/10.3390/su9112116
Submission received: 13 October 2017
/
Revised: 12 November 2017
/
Accepted: 15 November 2017
/
Published: 17 November 2017
(This article belongs to the Special Issue Sustainability in Construction Engineering)
Abstract
:With the goal of reducing greenhouse gas (GHG) emissions by 26.9% below business-as-usual by 2020, the construction industry is recognized as an environmentally harmful industry because of the large quantity of consumption and waste with which it is associated, and the industry has therefore been requested to become more environmentally friendly. Concrete, a common construction material, is known to emit large amounts of environmentally hazardous waste during the processes related to its production, construction, maintenance, and demolition. To aid the concrete industry’s efforts to reduce its GHG emissions, this study developed a software program that can assess GHG emissions incurred over the life cycle of a concrete product, and a case study was conducted to determine the impact of the proposed concrete assessment program on a construction project.
1. Introduction
As part of a policy system aiming to reduce GHG emissions in the industrial sector through quantitative assessment, the carbon labeling system was started in Europe and has spread and developed globally according to the situation in each country [1]. Through the implementation of a carbon labeling certification system in South Korea, various construction materials have been certified, and the use of such materials will increase in the future. Among construction materials, concrete is recognized as a material that emits a large quantity of greenhouse gases (GHG) across its lifecycle, from production, through construction, maintenance, and the dismantling and disposal processes, and environmental impact assessments of the material must therefore include diverse studies. Concrete emits a large amount of GHG from the production of its raw materials, including cement, aggregate, and admixture, to transportation and concrete production. However, research assessing the environmental impact of the concrete industry is at an early stage, and insufficient data is available to establish policies and support technologies that would increase the sustainability of the concrete industry. In the COOL software [2] that is currently used for carbon labeling certification, a life cycle index (LCI) database (DB) [3] has not yet been constructed for the admixture that is one of the concrete components, and thus the overseas LCI DB [4] must be directly examined and entered. In addition, although diversified impact assessment analysis techniques must be employed to effectively reduce GHG emissions over the concrete life cycle, the currently available assessment technologies are insufficient. Therefore, the purpose of this study was to develop a software program that will assess the GHG emissions associated with concrete in a manner that is consistent with the assessment method of the carbon labeling certification program, and in which data can easily be inputted, stored, calculated, and managed. For this purpose, the life cycle assessment (LCA) guideline ISO 14044 [5] was applied, and product category rules (PCRs) that are prescribed by the carbon labeling certification program to calculate a product’s life cycle GHG emission information were analyzed. The process flow and data collection characteristics of actual concrete production were analyzed to derive the GHG emission assessment factors for each stage [6,7]. A software program that can conduct inventory and comparative analyses of the assessment results by impact category was developed, and its reliability and applicability were examined through case analysis.
This program assesses greenhouse gas emissions using the amount of raw materials and energy inputted into concrete production in terms of LCA.
Also, this program has built raw material (cement, aggregate, admixture, etc.) and energy (electricity, diesel, kerosene, etc.) LCI (Life cycle Inventory) DB for users to assess the greenhouse gas emissions of concrete more easily.
This program is a concrete-specialized program, which is used to assess greenhouse gas emissions among LCA assessment programs for building materials that have been developed in Korea so far.
2. Previous Studies
The assessment factors and technologies used in existing domestic and overseas LCA software programs were analyzed. Representative domestic LCA software programs include TOTAL and COOL, which commonly perform assessments based on data from the national LCI DB information network. TOTAL [8] was developed by the Ministry of Environment (ME) in South Korea and can perform general LCA. Because this software supports the data format required by the life cycle environmental impact assessment certification system, as well as the domestic environmental labeling system, TOTAL can perform LCAs optimized for the appropriate environment labeling system. COOL [9] was developed by the Korean Environmental Industry & Technology Institute to provide convenience to companies applying for carbon labeling certification. This software includes a carbon labeling emission factor that is automatically displayed according to the material, and can be used to estimate the carbon emissions of a product.
Representative overseas LCA software programs include BEES, ATHENA, GaBi, ENVEST2, BECOST, and LISA, which commonly support LCAs for all industrial products. BEES [10] is currently the leading LCA tool in the United States (US). It was developed by the US National Institute of Standards and Technology in 1994 to assist with the selection of environmentally friendly construction materials. The program estimates the energy amount using an industry-related analysis of the construction industry, with a DB constructed using the integration method for construction materials including paper, pig iron, copper, and plywood. This technique was designed to consider both environmental and economic efficiencies, and its purpose was to develop tools with which building owners and the government can determine appropriate investment priorities. The program includes greenhouse effect, acidification, fossil fuel reduction, natural resources depletion, and air pollution standards as assessment items. Another program, ATHENA [11], was developed in Canada, and it provides detailed LCI DBs. Detailed LCI calculation results are summarized in graphic or tabular format. The program assesses the acquisition of ecological resources and intrinsic energy inputs by type, potential greenhouse effect, measurements of water and air toxicity, and solid waste. GaBi [12] was developed in Europe to manage sustainability through LCAs of organizations, plants, processes, or products. In addition to LCAs, GaBi can also assess life cycle engineering, environmental design, and energy efficiency, and materials and production processes are distinguished in detail. The LCA can be performed after the “GaBi DB manager” selects values for normalization and weighting, and the sensitivity analyses of various variables can be conducted.
Of particular relevance to this paper, Eco-Quanum [13] is the first building LCA software that assesses environmental impacts based on the energy consumption in a building. ENVEST2 [14] is another LCA software program, developed by Building Research Establishment, Ltd. (UK) for buildings. ENVEST2 supports the building assessment items stipulated by BREEAM, an eco-friendly building certification system used in the UK. ENVEST2 provides environmental and economic efficiency information through an environmental impact average value called Eco Point. In addition, ENVEST2 can be easily used at the initial stages of planning and designing a building. BECOST [15] is a building LCA software program developed by the VTT Technical Research Center of Finland, Ltd. BECOST uses environmental impact data derived from the LCA of a building, including design, construction, maintenance, and deconstruction, and the program is used to develop reduction technologies. LISA [16] is an LCA-building software program developed by Newcastle University and BHP Institute. LISA offers an impressive environmental factor analysis capability because of its built-in DB in various materials. In addition, because LISA’s interface consists of simple input and output formats, it can be easily used by the assessor.
Upon analyzing domestic and overseas LCA software programs, it was found that they have similar stepwise assessment methods, with material input by process flow and DB application, whereas they were found to be different in terms of data input, calculation system, and result analysis. In particular, a common problem was the lack of a standard data format that can be implemented to systematically manage the assessment factor DB. Therefore, even if the purposes of the software programs are the same, the data collected by each user and the assessment methods applied will be different. Therefore, the assessment results are not only inconsistent but are also limited to one-time assessments, and the different systems impose a limit on the ability to objectively compare and analyze their results. For these reasons, data entry and allocation technologies are required to support the universal use of concrete-specific LCA, and LCA software is required that simplifies the assessment process, including the establishment of a concrete LCA process and the automated determination of the input data items.
Marinković, S. reviews the research by Panesar et al. The research was an analysis of the impact of the selection of functional unit (FU) on the life cycle assessment of green concretes. The research presented the influence of six different FUs (which included volume, compressive strength, durability of concrete, binder intensity, and a combination of these) on several impact categories [17].
Mohammadi, J. et al. investigated the environmental impacts associated with the manufacture of fourteen benchmark concrete products in Australia. This research provides datasets for reference cementitious construction materials (including concrete, mortar, grout, and render), which aid the construction industry in evaluating its environmental impact [18].
Yazdanbakhsh, A. et al. compared the environmental impacts of using coarse natural aggregate (NA) and coarse recycled aggregate (RA) to produce concrete in the New York City area, by means of a unique LCA framework that incorporates comprehensive regional data [19].
Vieira, D. R. analyzed a literature review conducted to present the state-of-the-art of LCA methods applied to the manufacturing of common and ecological concrete. Concepts and tools are discussed [20].
This research presented relevant landmarks on sustainable development and materials efficiency on the assessment of the environmental impact of construction products. An overview on the European Construction Products Regulation (CPR) is given followed by an outline of the book [21].
3. GHG Emissions LCA of Concrete
3.1. Overview
To develop assessment software for concrete-specific life cycle GHG emissions, the LCA guideline ISO 14044 was applied to concrete.
3.2. Aim and Scope
(1) Function and Function Unit Setting
A general type of processed concrete was selected as the target product of the LCA in this study, and among the various functions of concrete, the formation of concrete structures and concrete products was selected as the main function on which the LCA was based. As shown in Table 1, the function unit was set at 1 m3 of concrete production, a value that is convenient for data management and utilization, based on the aforementioned main function.
(2) System Boundary Setting
The production stage (cradle to gate) shown in Figure 1 was selected as the LCA range for this study. The concrete production stage was subdivided into raw material acquisition, transportation, and manufacturing stages. The GHG emissions contribution of each stage to the atmosphere was assessed [17].
3.3. Inventory Analysis
The input and output factors, including energy, raw materials, products, and waste, were analyzed for the LCA range of concrete. The LCI DB for each of the materials and energy sources inputted to the concrete production was investigated, as shown in Table 2. The LCI DBs for the input materials and energy sources that were used in this GHG emissions LCA were obtained from by the Korea Ministry of Land, Infrastructure, and Transport, the Ministry of Knowledge Economy, and the Ministry of Environment in South Korea. Because LCI DBs differ by country, DBs provided by the relevant country must be used.
However, because the LCI data for recycled aggregate, Ground Granulated Blast Furnace Slag (GGBS), fly ash, and admixtures are not yet available in Korea, this study used foreign LCI data of Ecoinvent database.
Especially, LCI database of Ground Granulated Blast Furnace slag (GGBS) applies the process of industrial by-product recycling. Thus, it only assesses the environmental impact of processes after the blast furnace slag is discharged as a form of a by-product. The database is derived from the amount of energy used in cooling, crushing, and handling, after the slag is discharged from the blast furnace of a steel mill.
Swiss ecoinvent database is a reliable database utilized in life cycle assessments conducted in various fields in Korea. In the future, if a Korean database were developed, comparative analysis could be conducted with the ecoinvent database.
3.4. Impact Assessment
3.4.1. Raw Materials Stage
The GHG emissions of the concrete raw materials stage were calculated as the sum of the amount of each constituent material (kg) included in the 1-m3 concrete production multiplied by the corresponding GHG emission per unit, as follows [18]:
where GHGM represents the GHG emissions during the production of concrete raw materials [kg-CO2eq/m3]; M(i) is the amount of each raw material in 1 m3 of concrete production [kg], where i = 1, 2, 3, and 4, representing cement, aggregate, admixture, and water, respectively; and Unit MCO2eq is the GHG emission of each raw material per unit [kg-CO2eq/kg].
GHGM = ∑(M(i) × Unit MCO2eq)
3.4.2. Transportation Stage
In general, cement is transported by railway from a production plant to a shipment base near the demand site. The cement is then transported to a ready-mixed concrete plant using a bulk cement truck. To estimate GHG emissions during the transportation stage, the number of transportation equipment components required to transport each concrete constituent material was calculated using the total quantity of each material and the loading capacity of the relevant transportation means. Considering the calculated number of transportation equipment components, transportation distance, and fuel efficiency, GHG emissions during the transportation stage were assessed. The equation for calculating GHG emissions during the transportation stage is as shown in Equation (2) [19].
where GHGT represents the GHG emissions during the transportation of concrete raw materials [kg-CO2eq/m3]; M(i) is the amount of each raw material in 1 m3 of concrete production [ton], where i = 1, 2, and 3, representing cement, aggregate, and admixture, respectively; Lt is the loading capacity of the transportation equipment component for the relevant material [ton]; d is the transportation distance [km]; e is the fuel efficiency [km/L]; and Unit TCO2eq is the GHG emission of the transportation equipment per unit [kg-CO2eq/L].
GHGT = ∑(M(i)/Lt) × (d/e) × Unit TCO2eq
3.4.3. Manufacturing Stage
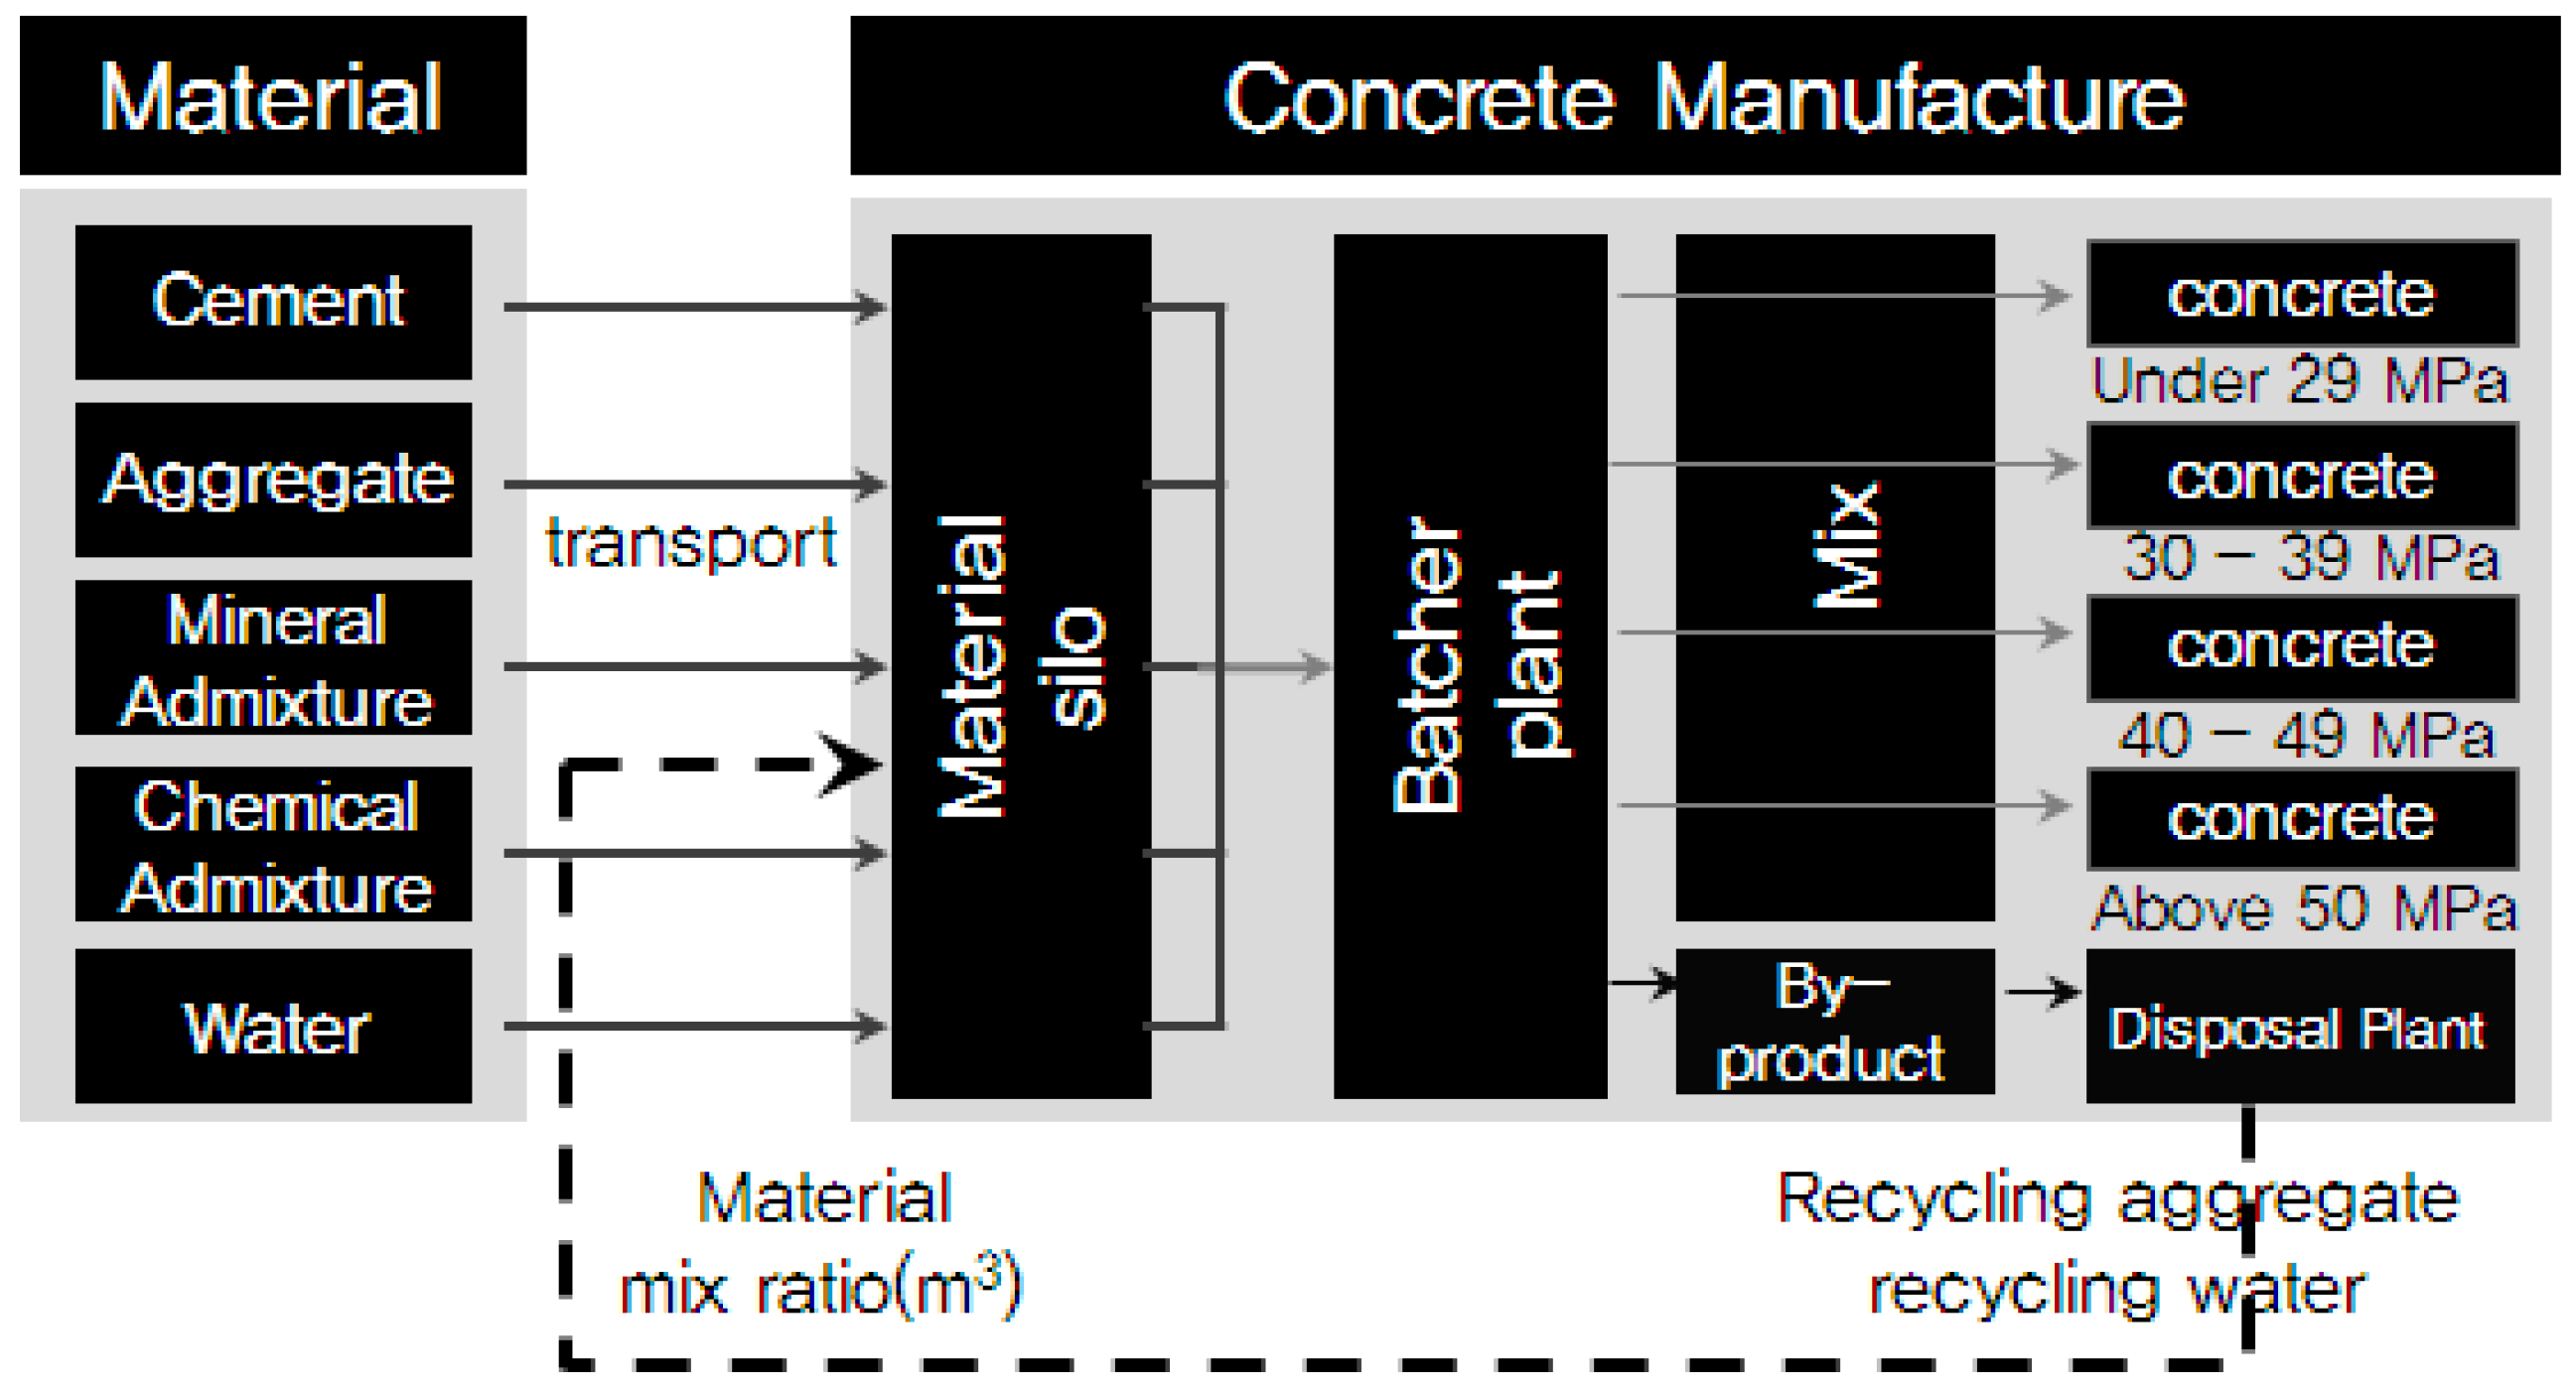
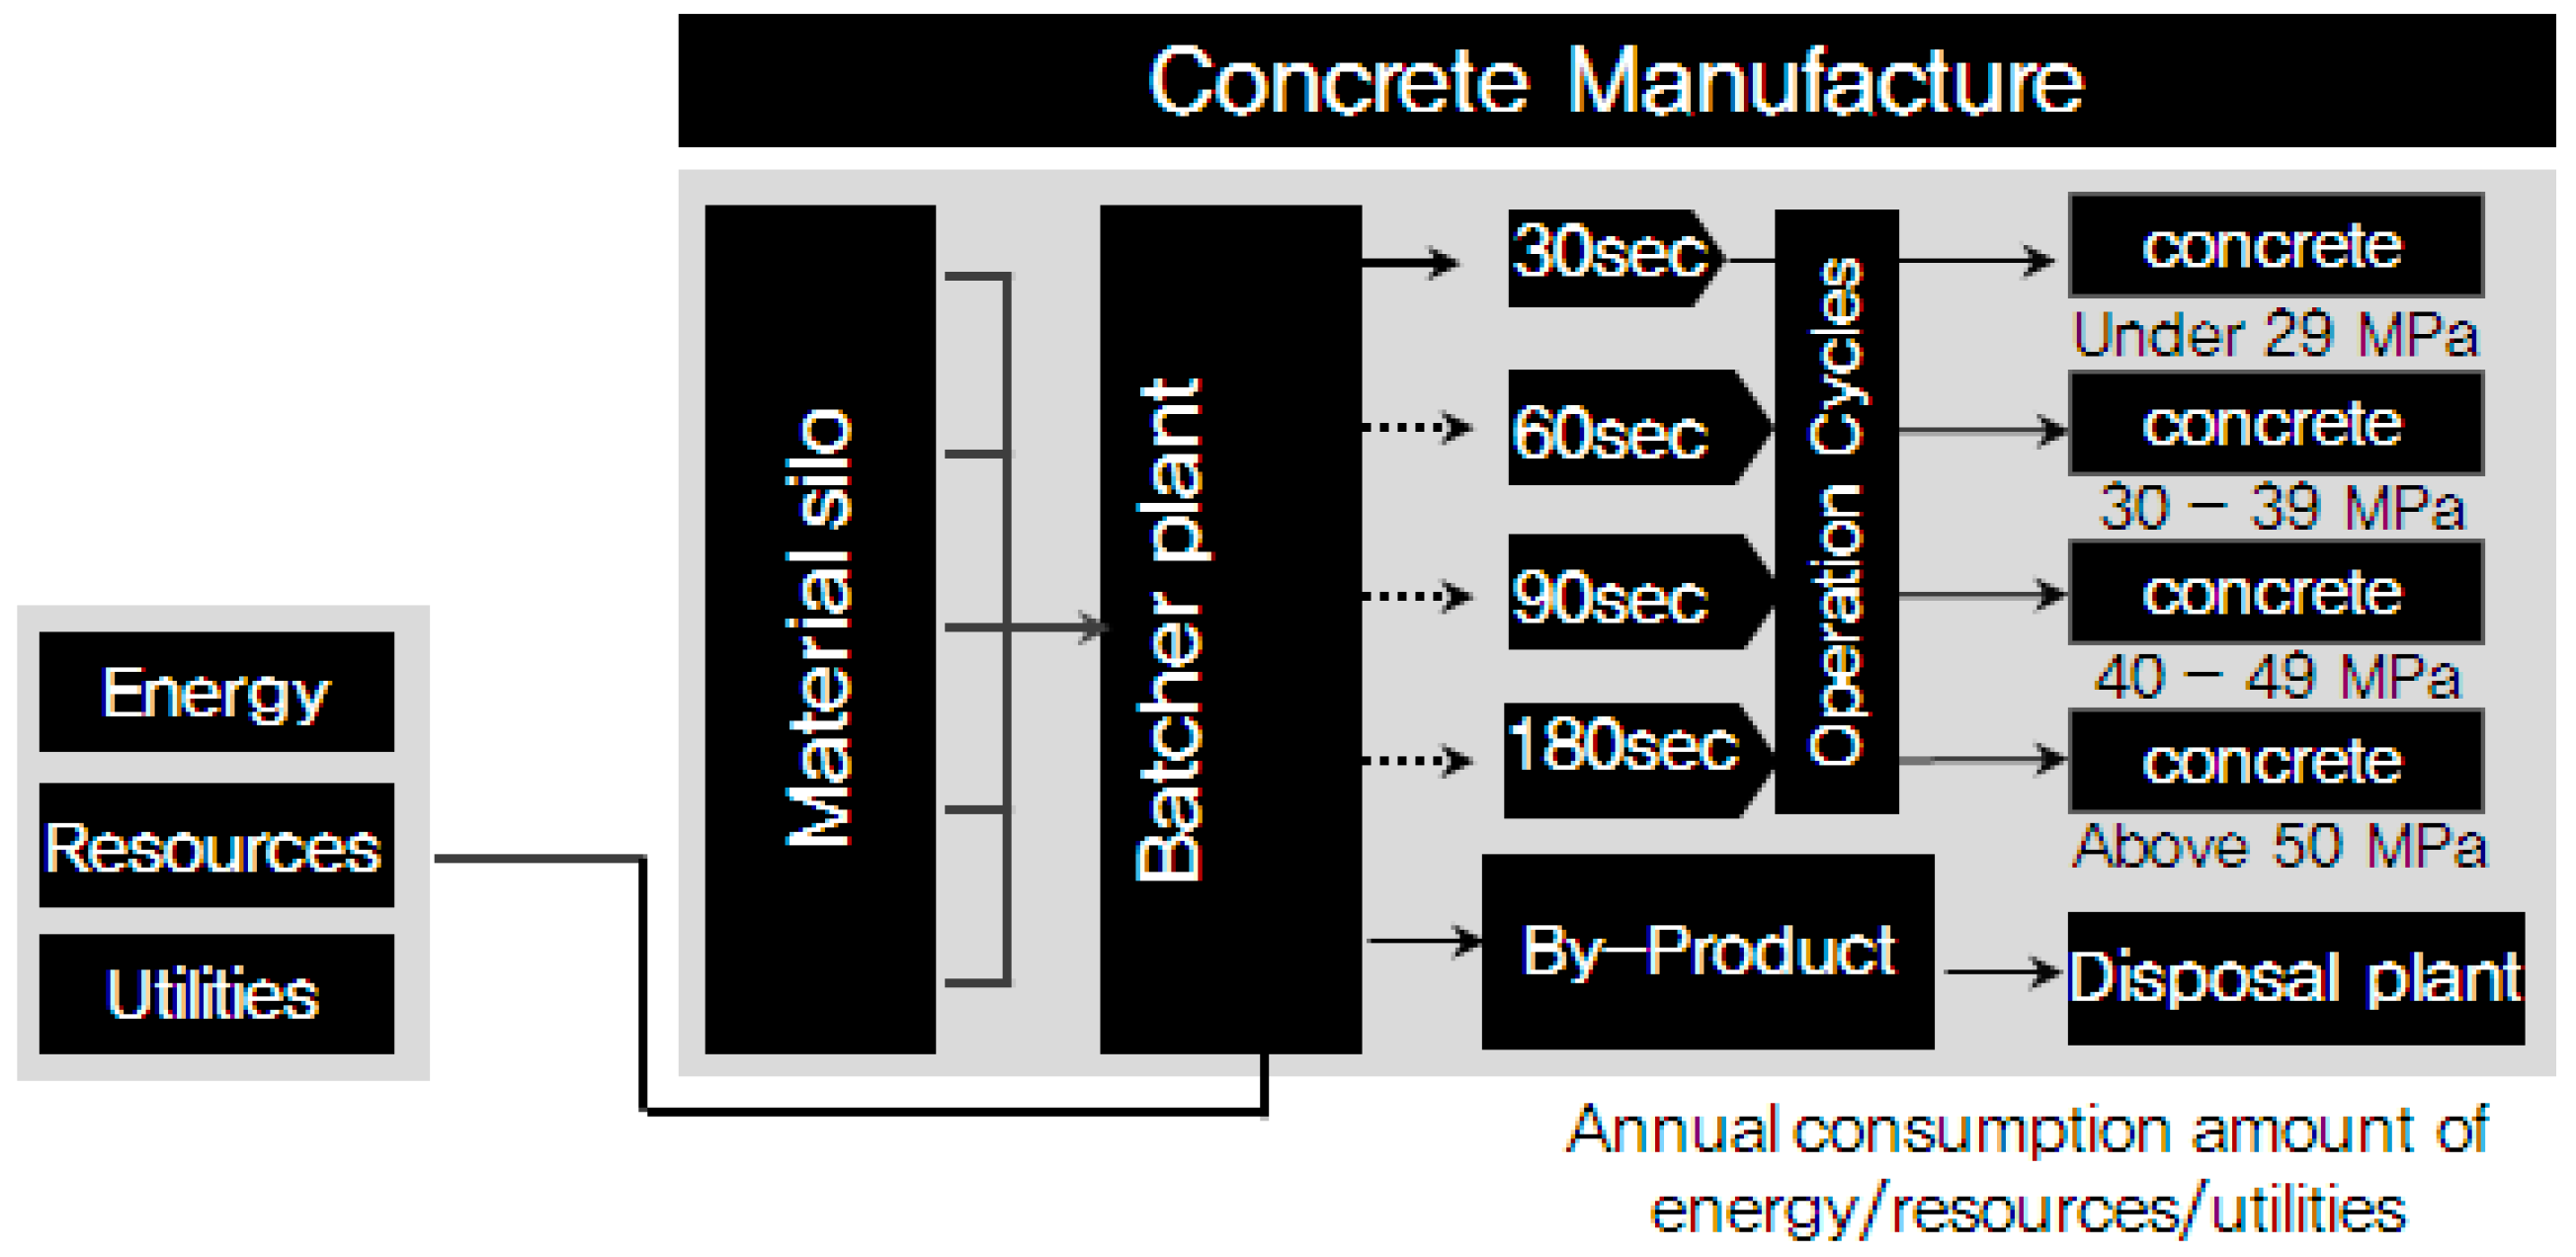
In this stage, GHG emissions can be derived using the energy consumption of the concrete manufacturing facilities as shown in Figure 2. The amount of energy (power and/or oil) used in the concrete batch plant must be derived. In this study, energy ratios were calculated by applying the differences in the operation time of the mixing equipment corresponding to different concrete strengths. In addition, because by-product and waste emissions data are annually collected, the values assigned according to the ratios of the production by concrete strength to the total concrete production were derived as shown in Figure 3. The equation for calculating GHG emissions during the manufacturing stage is as shown in Equation (3) [20].
where GHGF represents the GHG emissions during the unit concrete manufacturing stage [kg-CO2 eq/m3]; R is the annual concrete production [m3/year]; E(i) is the annual consumption of each energy source [unit/year], where i = 1, 2, and 3, representing power, oil, and water; and Unit FCO2eq is the GHG emission of each energy source per unit [kg-CO2eq/unit].
GHGF = ∑[(E(i)/R) × Unit FCO2eq]
4. Assessment Software Development
4.1. Overview
The concrete GHG emissions LCA software was developed based on the previously constructed assessment factor database and data allocation system. The assessment process consists of an information input process and an assessment analysis process. The information input process refers to the process of collecting and inputting concrete data, and inputs the project overview, combined materials, and manufacturing process. The assessment analysis process refers to the process of calculating the LCA and GHG emissions using the previous input information [21,22].
4.2. Concrete GHG Emissions LCA Software
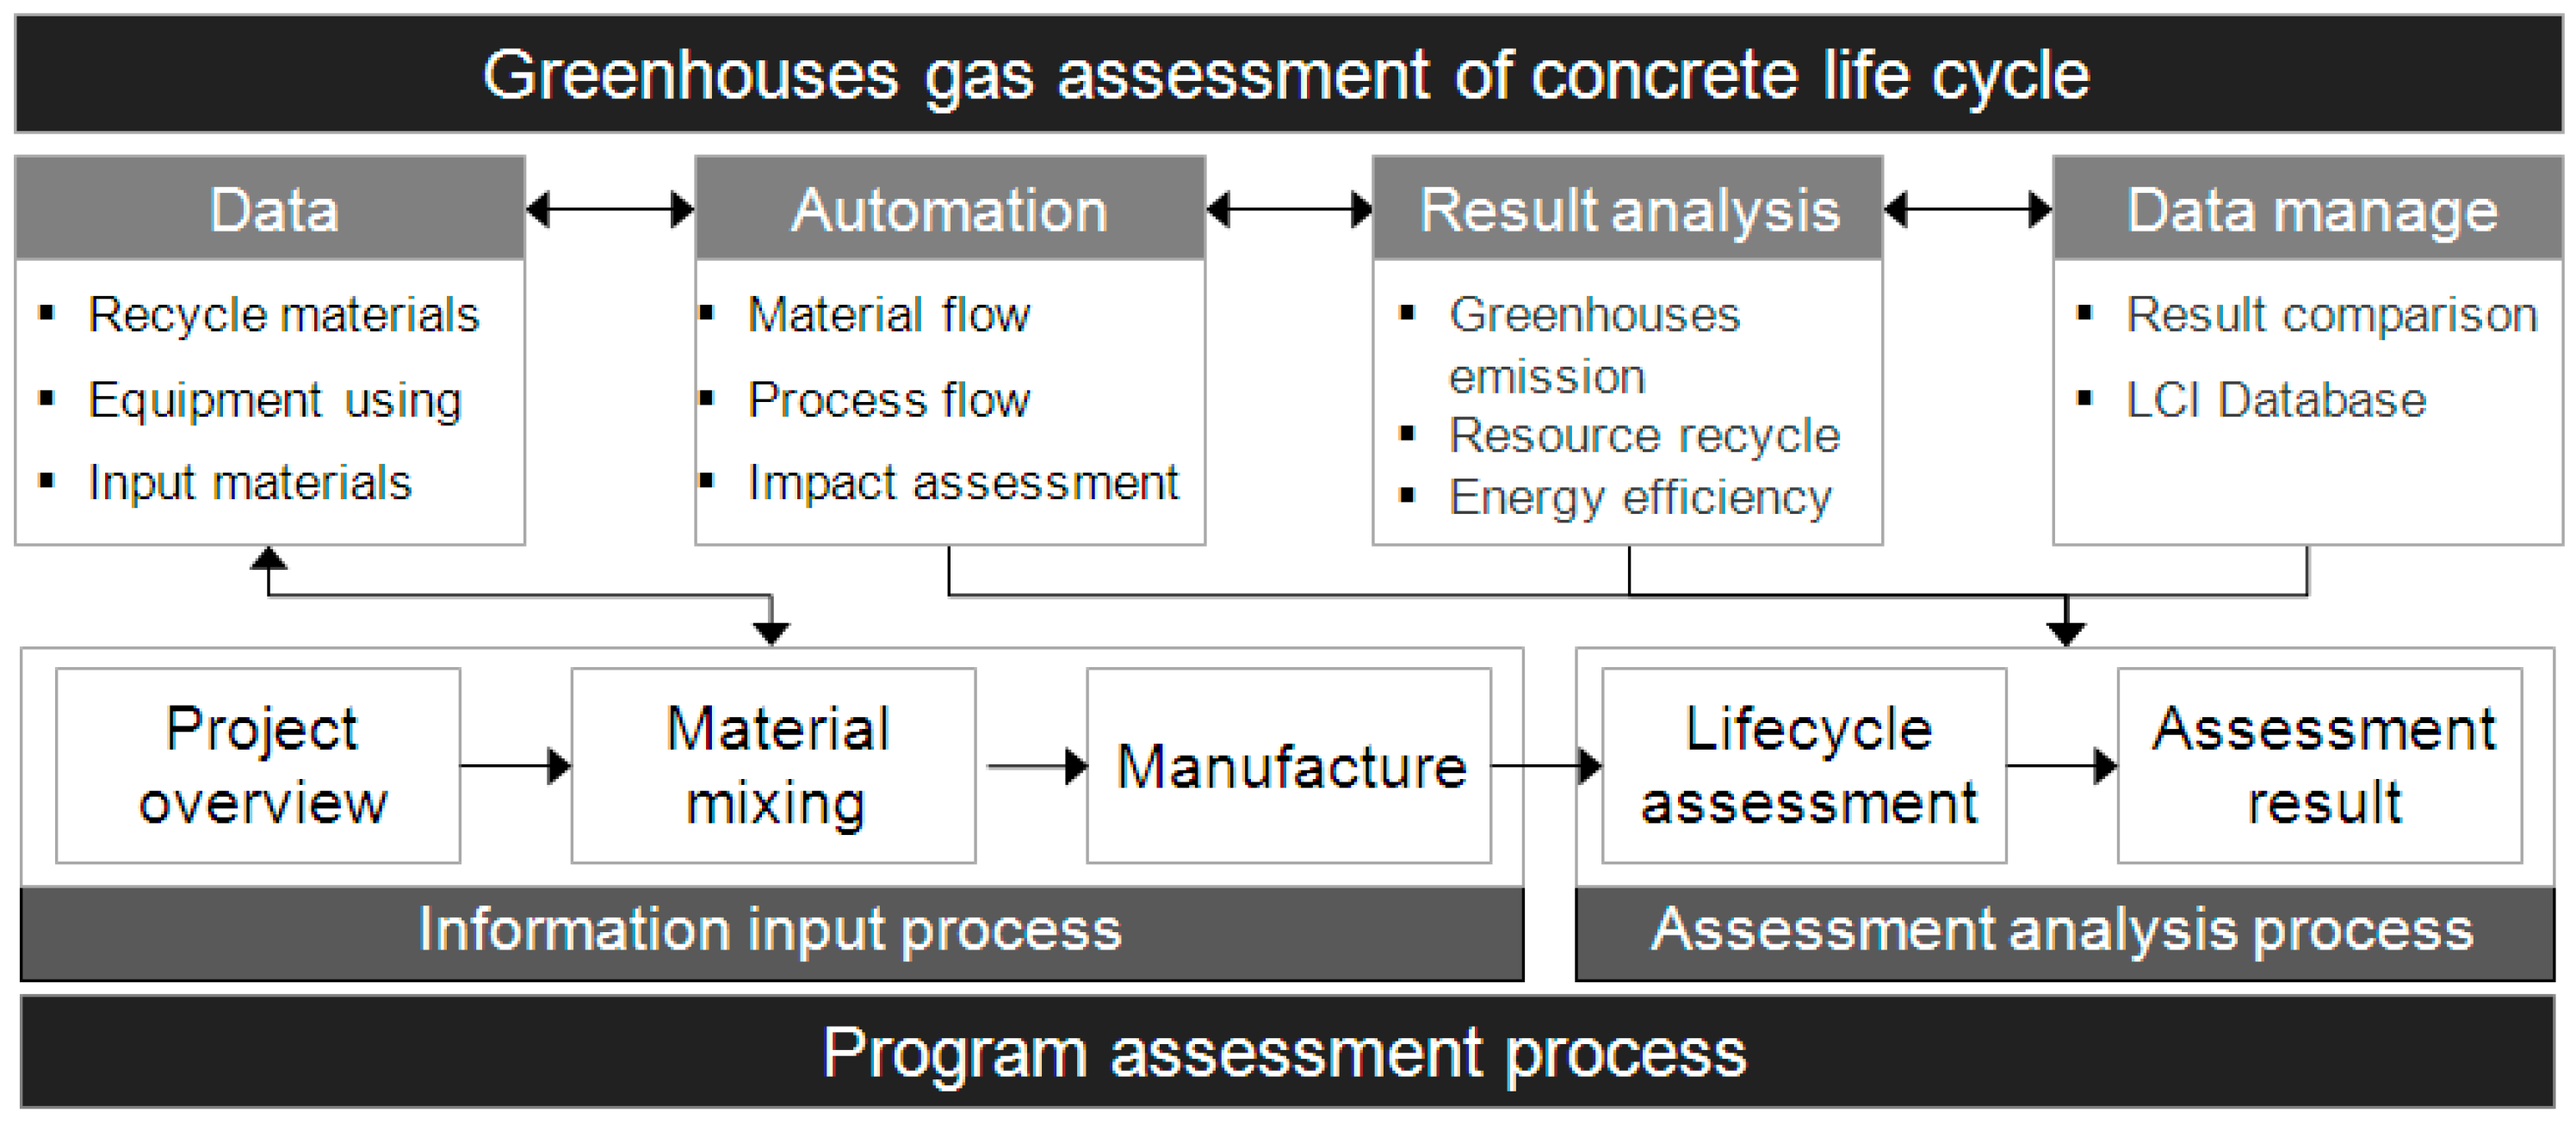
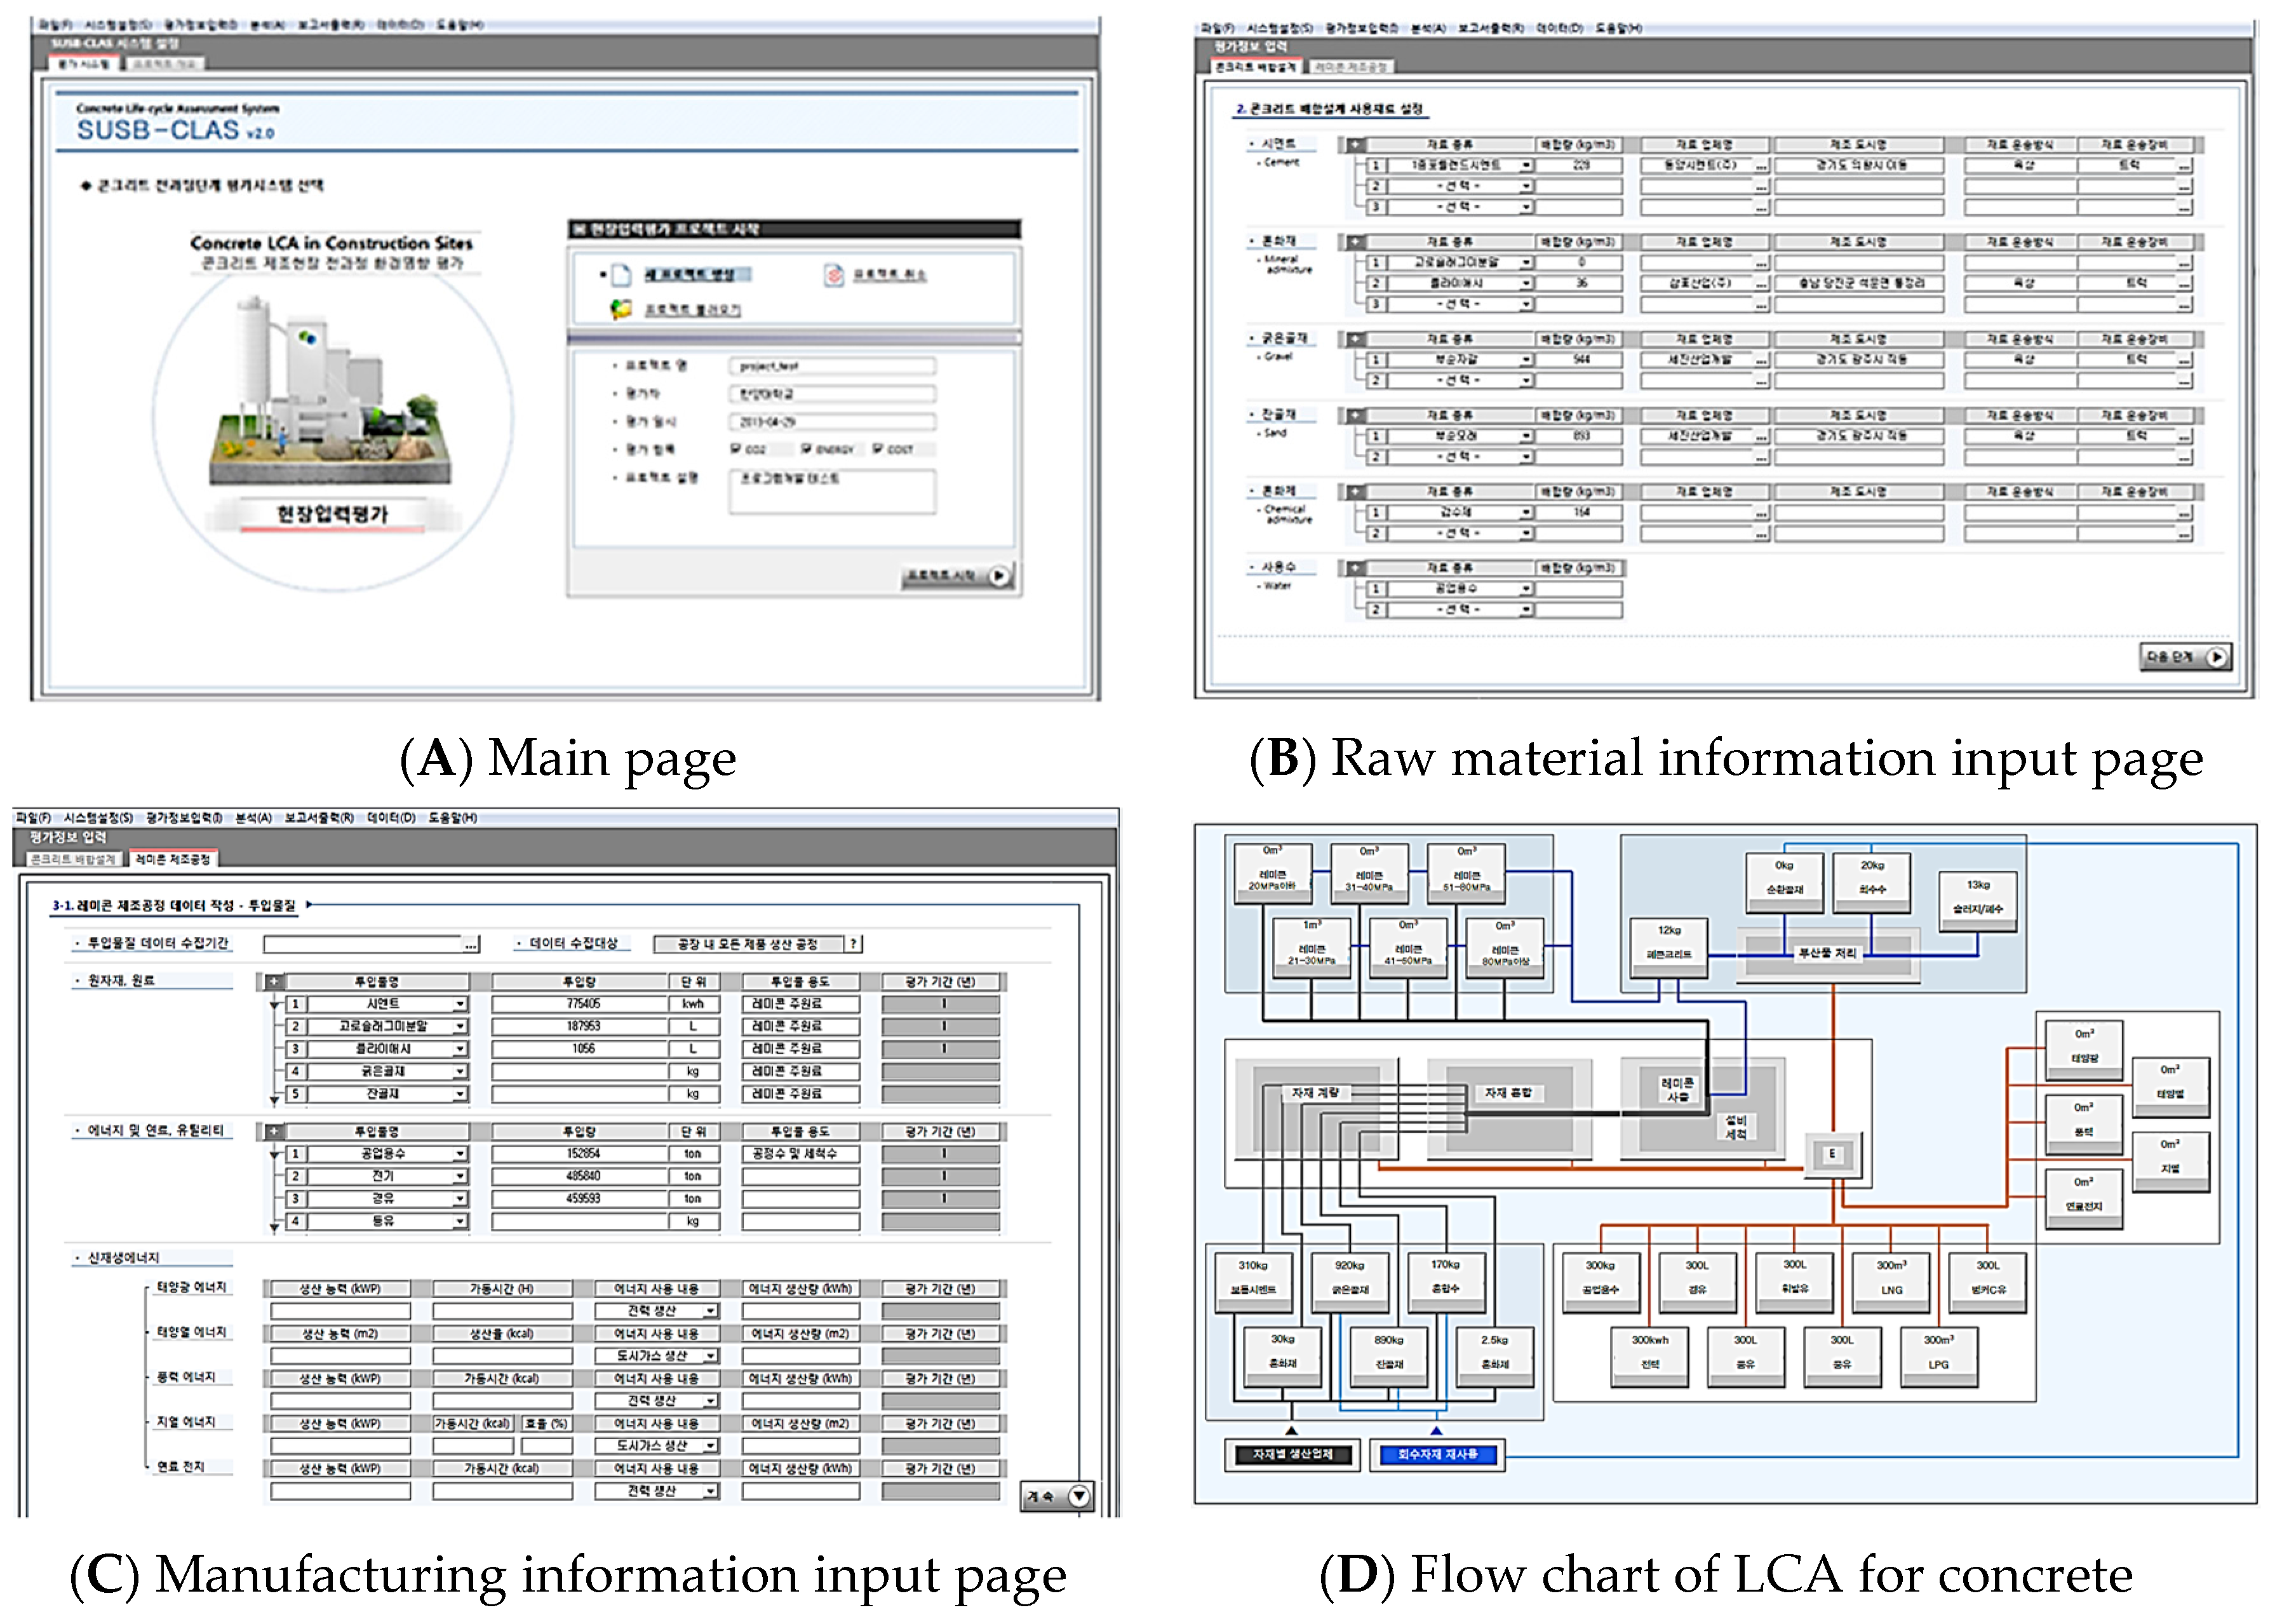
As shown in Figure 4, the concrete GHG emissions LCA software is executed in the following order: project overview input, combined material information input, manufacturing process information input, LCA stage, and project completion stage. The data allocation system refers to a system that properly distributes collected data for each stage and inputs the emission data. The assessment automation system refers to a system in which the procedures for the concrete GHG emissions LCA are automatically performed in the software’s assessment module by setting basic initial values. In the result analysis, the effects of GHG, resources, energy, and economic efficiency are analyzed based on the assessment results derived through inventory analysis and impact assessment, considering the special characteristics of each stage of the life cycle as shown in Table 3. The program’s management technology stores the database that is used for the assessment and the assessment results as data in the material list format, so that projects can be compared with one another.
4.2.1. Project Overview Input Stage
In the project overview input stage, the assessor, assessment purpose, and assessment scope are set, and basic information for assessing the GHG emissions of the project are entered. The basic information includes the manufacturer’s name and address, material specifications, and application period (winter or standard period) of the concrete [23,24].
4.2.2. Combined Material Information Input Stage
In the combined material information input stage, the types and quantities of cement, water, aggregate, and admixture are directly entered based on the mixing design of 1 m3 of concrete. In addition, the location information or transportation distance of each material company can be directly entered or automatically calculated, and the information on the transportation equipment used for each material is entered when the national LCI DB item is selected.
4.2.3. Manufacturing Process Information Input Stage
The manufacturing process information input stage establishes the data flow of all inputs and outputs during concrete production by applying a data allocation system. A period for collecting the data on various specifications of the concrete produced in the manufacturing process is set, and the data on the input and output materials collected during the period are entered. The allocation system is applied to the input data so that the data for the LCA can be created.
4.2.4. LCA Performance Stage
In the LCA performance stage, the LCA of concrete products is performed using the previously entered combined material information and manufacturing process information, GHG emissions are estimated, and the assessment results are compared and analyzed. The LCA was designed to perform goal and scope definition, life cycle inventory analysis, life cycle impact assessment, and life cycle result interpretation processes, and default values were established for each process so that the stepwise data flow could be consistently entered. In this way, the input data and the emissions data are allocated to conform to the concrete product function unit, and GHG emissions are calculated using the national LCI DBs. The LCA performance stage is divided into a process flow chart creation stage, a material list creation stage, an impact assessment stage, and a result analysis stage [25,26].
(1) Process Flow Chart Creation
The input data and the emissions data entered in the information input process are automatically placed in each unit process and in function unit levels corresponding to 1 m3 of concrete production. Thus, a process flow chart is created for concrete production. The types and quantities of material flows can be identified for each unit process, which include raw materials, resources and energy, renewable energy, products, by-products, and waste.
(2) Material List Creation
The material list is divided into data categories, material names, numerical values, and units. The data categories refer to the data types of the corresponding materials, and the flows and the purposes of the materials can be confirmed. In addition, a mass balance check is possible by comparing the weights of the items in the material list.
(3) Impact Assessment and Result Analysis
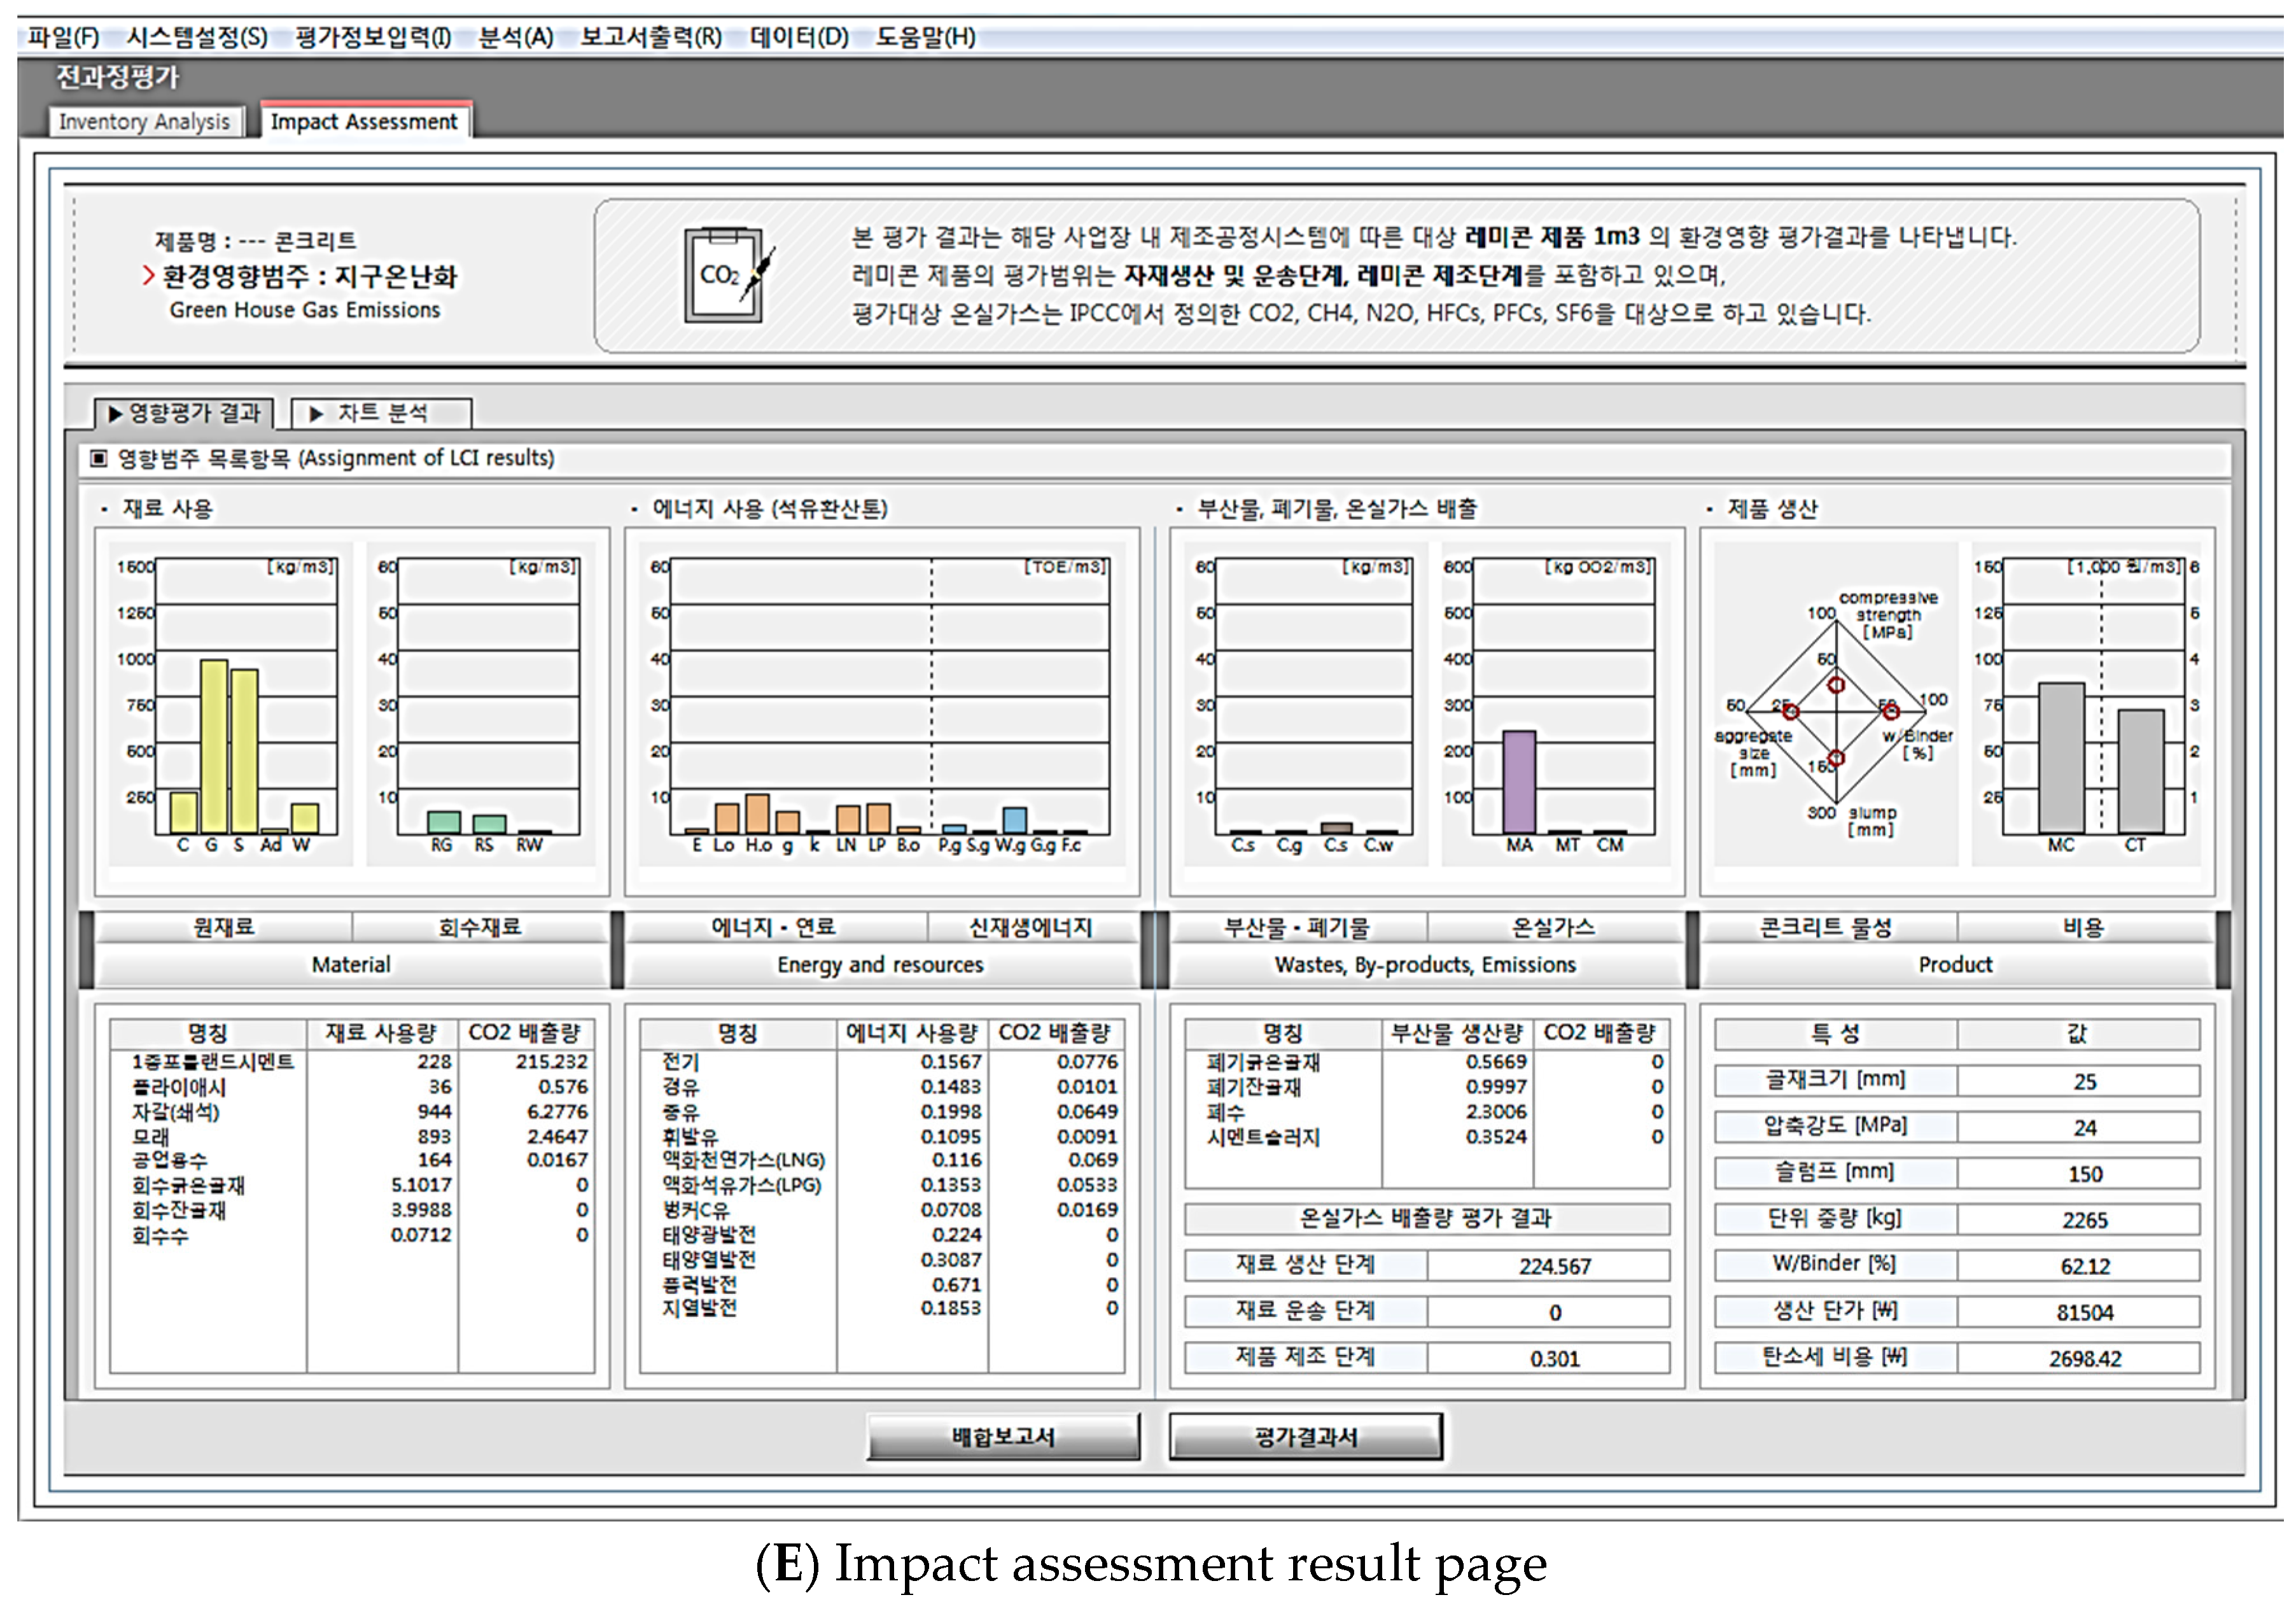
As shown in Figure 5D,E, GHG emissions can be estimated based on the material list. Detailed analysis functions include the material reuse rate and the energy reduction rate. The material reuse rate is a value in an index form obtained by analyzing the amount of raw material input and the recycled amount of the recovered material. The energy reduction rate is a value in an index form representing fuel consumption and renewable energy production in each process [27].
5. Case Analysis
5.1. Overview
To verify the reliability of the software developed in this study, a case analysis was conducted. The concrete procured at a domestic construction site was selected as the analysis target. In addition, the results of the proposed software were compared with those obtained using the COOL software to verify reliability.
5.2. Analysis Target
The concrete procured at a construction site in Seongnam City, Gyeonggi-do, was selected as the analysis target. As shown in Table 4 and Table 5, the mix report, energy consumption, and production information were collected for the procured concrete. For the raw material consumption, the mix design for each concrete strength was applied. For the energy consumption, the annual consumption of the concrete manufacturer was examined and applied. For the concrete production, production by concrete strength was examined and applied. Waste generation was set at 2% of material input based on waste disposal regulations for the ready-mixed concrete industry, and the recovery rate of the aggregate was set at 100%. For the water recovery and reuse rate, the use details of the mix report were applied. For the transportation of concrete combined materials, the origins of the materials listed in the mix report were examined, and the relevant distances were calculated [28,29].
5.3. Assessment Results
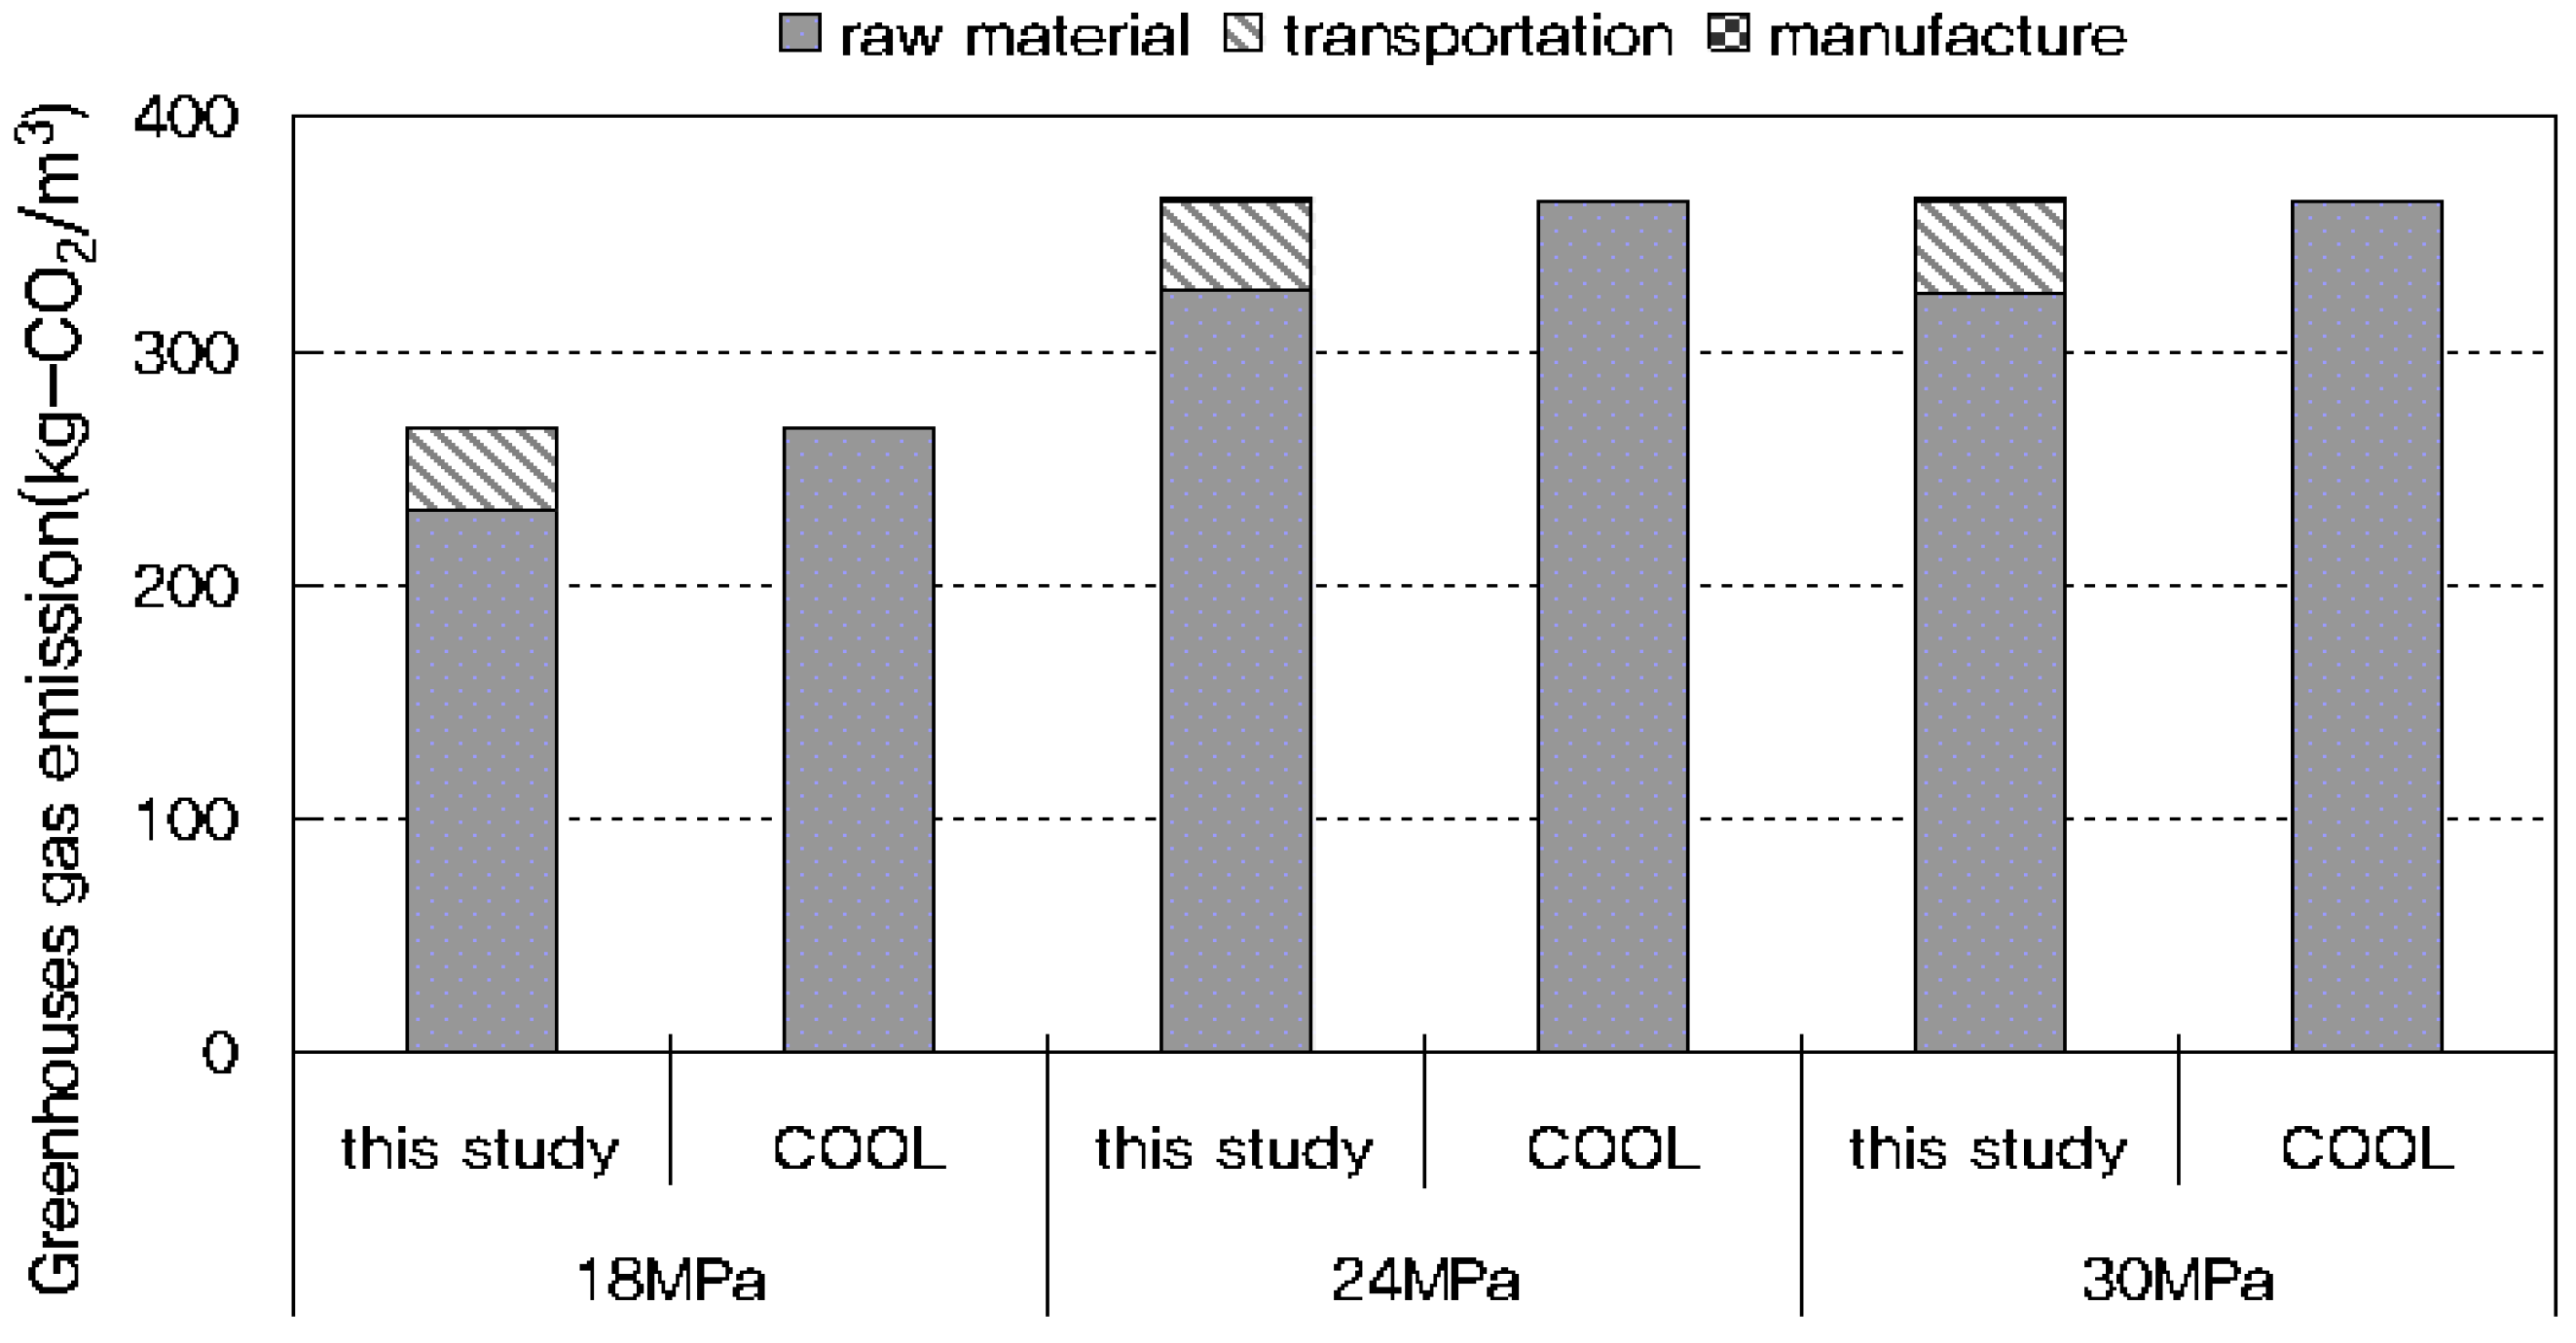
The LCAs of GHG emissions of the concrete products used at the target construction site, which had strengths of 18, 24, and 30 MPa, showed emissions of 267.5 kg-CO2 eq/m3, 364.9 kg-CO2 eq/m3, and 365.4 kg-CO2 eq/m3, respectively as shown in Figure 6. As the strength increased, the GHG emissions tended to rise. In addition, GHG emitted from the production of the concrete’s raw materials (including cement and aggregate) represented the majority of the total GHG emissions as shown in Table 6.
This is related with the sealing process in which the highest amount of energy input and greenhouse gas are emitted during the cement production. To increase the temperature of rotary kiln 1000~1450 °C for producing clinker, carbon dioxide (CO2) and methane (CH4) were emitted due to the input of fuels such as B.C. oil, waste tire, waste plastics, bituminous coal, etc. Comparing the above results with those obtained using the COOL software, the error rate was found to be 1–2%. Based on this result, the GHG emissions LCA produced by the developed software, which is specialized for concrete and easy to use, was considered to be suitable for analyses, without using the existing software (COOL) that requires more expertise.
6. Conclusions
This study was conducted to develop concrete-specific GHG emissions LCA software, with the following conclusions.
Because the developed software has built-in data allocation technology, LCA automation technology, and result analysis and management technology, the software showed improved usability for GHG emissions LCAs of concrete compared to existing software programs.
Using the developed software, GHG emissions of concrete with 18, 24, and 30 MPa strengths were determined to be 267.5 kg-CO2 eq/m3, 364.9 kg-CO2 eq/m3, and 365.4 kg-CO2 eq/m3, respectively. These results were similar to those obtained using the existing COOL software: 266.7 kg-CO2 eq/m3, 364.3 kg-CO2 eq/m3, and 363.9 kg-CO2 eq/m3, respectively.
The reliability of the developed software was verified by comparing the case analysis assessment results of the proposed software with those of the existing software.
The case analysis indicated that the raw material stage accounted for more than 90% of the total GHG emissions, and the emissions during the transportation and manufacturing stages were found to be insignificant. Considering that the basic unit of greenhouse gas is 944 kg-CO2 eq/ton from ordinary portland cement (OPC) among the raw materials of concrete, it is a greater influence than aggregate and admixture. Therefore, in order to decrease the greenhouse gas emissions of concrete, up to 60~80% of cement mixture amount (kg/m3) is replaced with Furnace Slag Powder and Fly Ash. Currently, research is being conducted on this, which is likely to improve durability and be more economical because the basic unit of greenhouse gas emissions of GGBS (41.8 kg-CO2 eq/ton) and F/A (15.3 kg-CO2 eq/ton) is smaller than OPC.
The limitations of this study are applied to domestic and overseas LCI DB in the developed program. Because LCI DBs differ by country, DBs provided by the relevant country must be used. However, because the LCI DB for the admixture is not established in South Korea, the overseas ecoinvent DB was applied.
Further studies on the assessment of various environmental impact categories are required, including the database supplementation of the developed software and various case analysis tests. In addition to CO2, substances such as NOx and SO2 are also emitted during the concrete production process, and these also affect the acidification and eutrophication of the ecosystem, as well as global warming.
Acknowledgments
This research was supported by Basic Science Research Program through the National Research Foundation of Korea (NRF) funded by the Ministry of Education (NRF-2015R1D1A1A01059286).
Author Contributions
All the authors contributed substantially to all aspects of this article.
Conflicts of Interest
The authors declare no conflict of interest.
References
- Leggett, J. A guide to the Kyoto protocol a treaty with potentially vital strategic implications for the renewables industry. Renew. Sustain. Energy Rev. 2008, 12, 345–351. [Google Scholar] [CrossRef]
- National Life Cycle Index Database Information Network. Available online: http://www.edp.or.kr (accessed on 15 October 2017).
- Ministry of Land, Transport and Maritime Affairs of the Korean Government. National Database for Environmental Information of Building Products; Ministry of Land, Transport and Maritime Affairs of the Korean Government: Sejong City, Korea, 2008.
- Ecoinvent, Swiss Centre for Life Cycle Inventories. Available online: http://www.ecoinvent.org/database (accessed on 15 October 2017).
- ISO 14044. Life Cycle Assessment (Requirements and Guidelines); International Organization for Standardization: Geneva, Switzerland, 2006. [Google Scholar]
- ISO/DIS 13315-2. Environmental Management for Concrete and Concrete Structures-Part 2: System Boundary and Inventory Data; International Organization for Standardization: Geneva, Switzerland, 2014. [Google Scholar]
- Korea Environmental Industry & Technology Institute. Carbon Labeling Guidelines; Korea Environmental Industry & Technology Institute: Seoul, Korea, 2009. [Google Scholar]
- Korea Environmental Industry & Technology Institute. Environmental Declaration of Product. Available online: http://www.edp.or.kr/edp/edp_intro.asp (accessed on 15 October 2017).
- Korea National Cleaner Production Center. Environmental Declaration of Product. Available online: http://www.kncpc.or.kr/main/main.asp (accessed on 15 October 2017).
- European thematic network on practical recommendations for sustainable construction (PRESCO WP2). Inter-Comparison and Benchmarking of LCA-Based Environmental Assessment and Design Tool, Final Report; PRESCO: Paris, France, 2005. [Google Scholar]
- Available online: http://www.athenasmi.org (accessed on 15 October 2017).
- Available online: http://www.gabi-software.com/ (accessed on 15 October 2017).
- Available online: http://ecoquantum.com.au/ (accessed on 15 October 2017).
- Available online: https://envest2.bre.co.uk/ (accessed on 15 October 2017).
- Available online: http://www.vtt.fi/vtt/index.jsp (accessed on 15 October 2017).
- Available online: http://www.lisa.au.com/ (accessed on 15 October 2017).
- Marinković, S. On the selection of the functional unit in LCA of structural concrete. Int. J. Life Cycle Assess. 2017, 22, 1634–1636. [Google Scholar] [CrossRef]
- Mohammadi, J.; South, W. Life cycle assessment (LCA) of benchmark concrete products in Australia. Int. J. Life Cycle Assess. 2017, 22, 1588–1608. [Google Scholar] [CrossRef]
- Yazdanbakhsh, A.; Bank, L.C.; Baez, T.; Wernick, I. Comparative LCA of concrete with natural and recycled coarse aggregate in the New York City area. Int. J. Life Cycle Assess. 2017, 1–11. [Google Scholar] [CrossRef]
- Vieira, D.R.; Calmon, J.L.; Coelho, F.Z. Life cycle assessment (LCA) applied to the manufacturing of common and ecological concrete: A review. Constr. Build. Mater. 2016, 124, 656–666. [Google Scholar] [CrossRef]
- Pacheco-Torgal, F.; Cabeza, L.F.; Labrincha, J.; De Magalhaes, A.G. Eco-Efficient Construction and Building Materials: Life Cycle Assessment (LCA), Eco-Labelling and Case Studies; Elsevier: Cambridge, MA, USA, 2014. [Google Scholar]
- ISO 21930. Environmental Declaration of Building Products; International Organization for Standardization: Geneva, Switzerland, 2007. [Google Scholar]
- Jung, J.S.; Lee, J.S.; An, Y.J.; Lee, K.H.; Bae, K.S.; Jun, M.H. Analysis of Emission of Carbon Dioxide from Recycling of Waste Concrete. Arch. Inst. Korea 2008, 24, 109–116. [Google Scholar]
- Van den Heede, P.; De Belie, N. Environmental impact and life cycle assessment (LCA) of traditional and “green” concretes: Literature review and theoretical calculations. Cem. Concr. Compos. 2012, 34, 431–442. [Google Scholar] [CrossRef]
- Kim, T.H.; Tae, S.H. Proposal of Environmental Impact Assessment Method for Concrete in South Korea: An Application in LCA (Life Cycle Assessment). Int. J. Environ. Res. Public Health 2016, 13, 1074. [Google Scholar] [CrossRef] [PubMed]
- Jesus, G.M.; Justo, G.N. Assessment of the decrease of CO2 emissions in the construction field through the selection of materials: Practical case study of three houses of low environmental impact. Build. Environ. 2006, 41, 902–909. [Google Scholar]
- Kim, T.H.; Tae, S.H.; Chae, C.U. Analysis of Environmental Impact for Concrete Using LCA by Varying the Recycling Components, the Compressive Strength and the Admixture Material Mixing. Sustainability 2016, 8, 389. [Google Scholar] [CrossRef]
- Kim, S.H.; Chae, C.W. LCA Study on Concrete and Environmental Evaluation Method by Concrete Strength; Korea Concrete Institute: Seoul, Korea, 2012. [Google Scholar]
- Korea Concrete Institute. Environmental Impact and CO2 Assessment of Concrete Structures; Korea Concrete Institute: Seoul, Korea, 2013. [Google Scholar]
Figure 1.
System boundary of concrete life cycle assessment (LCA).
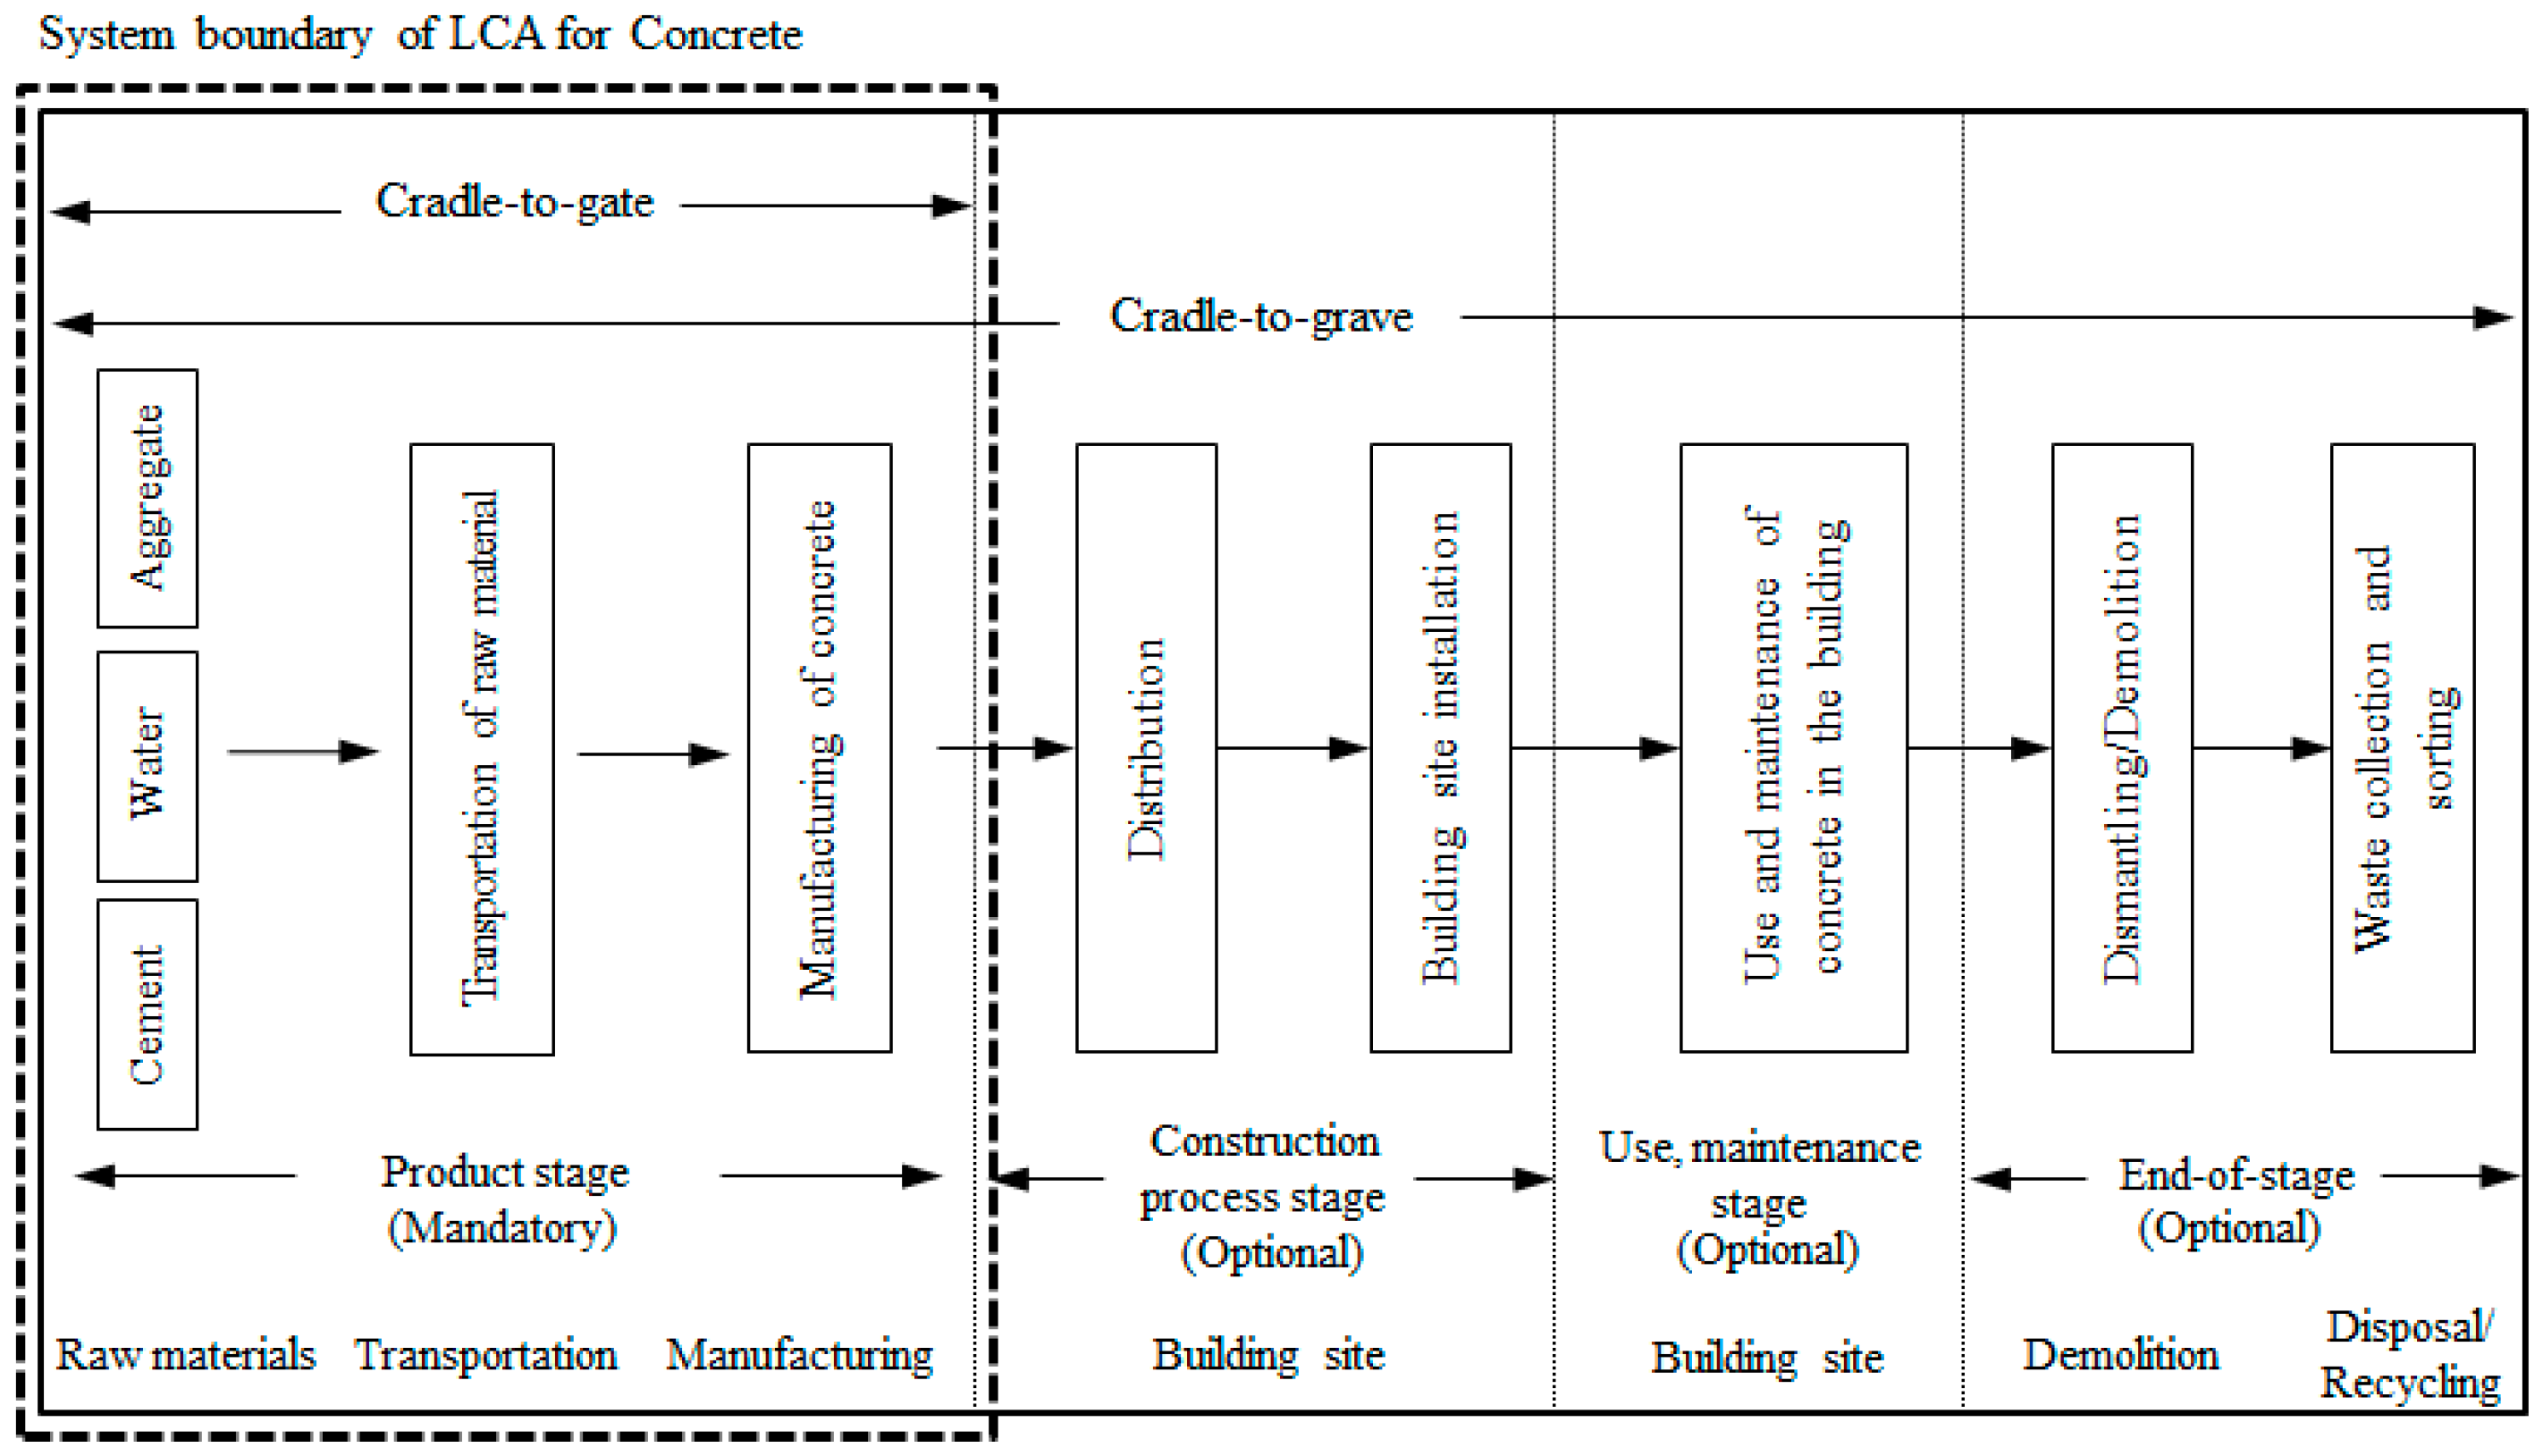
Figure 2.
By-product data flow diagram in concrete manufacturing stage.

Figure 3.
Energy data flow diagram in concrete manufacturing stage.

Figure 4.
Linkages of greenhouse gas (GHG) assessment techniques for concrete.

Figure 5.
GHG emissions LCA program for concrete.


Figure 6.
Assessment results and comparison of GHG emissions of different concrete strengths.

Table 1.
Function and function unit.
| Content | |
|---|---|
| Name | concrete |
| Function | concrete structures formation |
| Function unit | 1 m3 production of concrete |
Table 2.
Categories of life cycle index (LCI) database (DB) name and source.
| Division | Reference | Nation | |
|---|---|---|---|
| Raw material | Cement | National LCI | Korea |
| Coarse aggregate | National LCI | Korea | |
| Fine aggregate | National LCI | Korea | |
| recycled fine aggregate | Ecoinvent | Switzerland | |
| recycled coarse aggregate | Ecoinvent | Switzerland | |
| Blast furnace slag | Ecoinvent | Switzerland | |
| Fly ash | Ecoinvent | Switzerland | |
| Water | National LCI | Korea | |
| Chemical admixture | Ecoinvent | Switzerland | |
| Energy | Electric | National LCI | Korea |
| Diesel | National LCI | Korea | |
| Kerosene | National LCI | Korea | |
| Transportation | Truck | National LCI | Korea |
| Train | National LCI | Korea | |
Table 3.
LCA process for concrete GHG emissions.
| Detailed Assessment Items | |
|---|---|
| Project overview | - basic information: manufacturer, product specifications |
| Input of the combined material information | - material information: type of material, mix proportion, area of production, transport mode |
| - supplier information: material suppliers, location | |
| - transport details: material transport, transportation routes/destinations | |
| Input of manufacturing process information | - annual input material date: materials, energy, fuel, renewable energy |
| - annual output material date: concrete, by-product/waste, recycling materials | |
| LCA | - system boundaries, functional units - environmental impact categories: global warming |
| - material flow analysis and review
- applying assignment, material balance review - derived materials and resources list | |
| - applying emission factors of list items
- emission factors (classification, characterization) | |
| - GHG emissions, resource/energy usage | |
| Assessment result | - LCA results of GHG |
| - project assessment database storage |
Table 4.
Information on analysis target.
| Division | Contents | |
|---|---|---|
| Energy and resource consumption (per year) | electronic (kwh) | 1,708,481 |
| diesel (L) | 842,582 | |
| kerosene (L) | 57,475 | |
| water (L) | 93,274 | |
| Production (per year) | 1–20 MPa | 68,962 |
| 21–30 MPa | 490,041 | |
| 31–40 MPa | 20,542 | |
| By-products emissions and disposal | by-products | All material inputs 2% (assumed) |
| recycling rate (aggregate) | 100% recovery of aggregate remaining (assumed) | |
| recycling rate (water) | 60% | |
| Materials/products during transportation | utility | Truck (limited to the same fuel vehicles) |
| Distance (km) | Specific materials transport route | |
Table 5.
Concrete mix design for target building.
| Mix Design of Concrete (kg/m3) | ||||||||
|---|---|---|---|---|---|---|---|---|
| OPC | FA | G | S | R/S | AE | W | R/W | |
| 18 MPa | 236 | 35 | 958 | 454 | 455 | 1.22 | 97 | 64 |
| 24 MPa | 336 | 0 | 936 | 453 | 443 | 3.05 | 131 | 0 |
| 30 MPa | 334 | 59 | 954 | 393 | 394 | 2.95 | 103 | 68 |
OPC: ordinary portland cement, AE: chemical admixture, FA: fly ash, G: coarse aggregate, S: fine aggregate, R/S: recycled aggregate, R/W: recycled water, W: water.
Table 6.
Assessment results of GHG emissions of different concrete strengths.
| Division | Greenhouse Gas Emissions [kg-CO2 eq/m3] | |||
|---|---|---|---|---|
| Concrete Standard | Method | This Study | COOL Program | |
| Stage | ||||
| case 1 (18 MPa) | raw material | 232.18 | 266.62 | |
| transportation | 34.61 | |||
| manufacturing | 0.67 | 0.12 | ||
| total | 267.46 | 266.74 | ||
| case 2 (24 MPa) | raw material | 325.74 | 364.15 | |
| transportation | 38.57 | |||
| manufacturing | 0.67 | 0.12 | ||
| total | 364.99 | 364.27 | ||
| case 3 (30 MPa) | raw material | 324.81 | 363.85 | |
| transportation | 39.21 | |||
| manufacturing | 1.34 | 0.12 | ||
| total | 365.36 | 363.97 | ||
© 2017 by the authors. Licensee MDPI, Basel, Switzerland. This article is an open access article distributed under the terms and conditions of the Creative Commons Attribution (CC BY) license (http://creativecommons.org/licenses/by/4.0/).
Share and Cite
MDPI and ACS Style
Kim, T.; Lee, S.; Chae, C.U.; Jang, H.; Lee, K. Development of the CO2 Emission Evaluation Tool for the Life Cycle Assessment of Concrete. Sustainability 2017, 9, 2116. https://doi.org/10.3390/su9112116
AMA Style
Kim T, Lee S, Chae CU, Jang H, Lee K. Development of the CO2 Emission Evaluation Tool for the Life Cycle Assessment of Concrete. Sustainability. 2017; 9(11):2116. https://doi.org/10.3390/su9112116
Chicago/Turabian StyleKim, Taehyoung, Sanghyo Lee, Chang U. Chae, Hyoungjae Jang, and Kanghee Lee. 2017. "Development of the CO2 Emission Evaluation Tool for the Life Cycle Assessment of Concrete" Sustainability 9, no. 11: 2116. https://doi.org/10.3390/su9112116
Note that from the first issue of 2016, this journal uses article numbers instead of page numbers. See further details here.