Constraining Factors in Hungarian Carp Farming: An Econometric Perspective


1
National Agricultural Research and Innovation Centre, Research Institute for Fisheries and Aquaculture, 5540 Szarvas, Hungary
2
Institute of Applied Informatics and Logistics, Faculty of Economics and Business, University of Debrecen, 4032 Debrecen, Hungary
3
Research Institute for Agricultural Economics, 1093 Budapest, Hungary
4
Institute of Sectoral Economics and Methodology, Faculty of Economics and Business, University of Debrecen, 4032 Debrecen, Hungary
*
Author to whom correspondence should be addressed.
Sustainability 2017, 9(11), 2111; https://doi.org/10.3390/su9112111
Submission received: 16 October 2017
/
Revised: 13 November 2017
/
Accepted: 15 November 2017
/
Published: 17 November 2017
(This article belongs to the Section Environmental Sustainability and Applications)
Abstract
:Although carp farming had a key role in the Blue Revolution at a global level, European carp aquaculture has stagnated over the past 25 years without achieving any productivity gains. The objective of this study was to identify the factors and mechanisms constraining production and productivity growth in pond-based carp farming in Hungary, as the country is a good representative of the EU pond-based farming sector. By using data from 44 carp farms, different specifications of the Cobb-Douglas production function were parameterized to investigate the determinants of yields and to assess the extent of economies of scale. Descriptive statistics show that large differences exist in productivity between individual farms, meaning that it is hard to implement technical standards and to ensure repeatability in extensive carp farming technology. Econometric analysis demonstrates that economies of scale do not prevail in pond-based farming in Hungary, so a concentration of farms would not stimulate a growth in carp farming. This may explain the stagnation of carp aquaculture, as the only European aquaculture segments which can grow are those that can exploit economies of scale. Further analysis demonstrates that labour is an important factor of production, and a decreasing workforce may constrain the intensification process of production. On the other hand, mechanisation did not prove to be a significant contributing factor to yields, indicating that large investment in equipment has a limited role in carp farming.
1. Introduction
According to OECD/FAO, global fish production (capture and aquaculture) increased by 24% between 2006 and 2015 and reached 167 million tonnes on average over 2013–2015. The share of total fish production for human consumption was around 88%, or 147 million tonnes and aquaculture represented about 50% of the fish consumed. World fish production is projected to grow at 1.5% per annum between 2015 and 2025 compared to the 2.5% per annum of the previous decade. Further expansion in fish consumption will mainly originate from aquaculture production; however, the average annual growth rate of aquaculture will slow down from 5.4% per annum in the previous decade to 3.0% per annum in the period of 2015–2025. In 2025, fish originating from aquaculture is expected to represent 57% of the fish consumed. Overall, freshwater species, such as carp, catfish and tilapia, will account for most of the increase in aquaculture production and represent around 60% of total aquaculture production in 2025. Asian countries will account for about 90% of total aquaculture production in 2025 [1,2].
Between 1980 and 2015 aquaculture experienced a global boom, with a 16-fold increase in output. Although marine and freshwater production experienced a significant growth during this period, the bulk of the growth came from traditional pond-based farming. Carp production alone contributed 27.2 million tonnes to global growth (37.8% of growth in total aquaculture production over the last 35 years) [3]. As a result of intensification, average pond yields in Asian carp farming countries have increased 5–10-fold since the early 1990’s [4,5,6]. Although expansion of the aquaculture sector has been impressive at a global scale in the period analysed, geographically it has spread unevenly, and some regions have not profited from the Blue Revolution. In particular, European freshwater aquaculture has been stagnating since 1990. Its share in global freshwater aquaculture production dropped from 9.3% in 1990 to 1.0% in 2015 [3]. Pond-based carp aquaculture is one of the most important segments in EU aquaculture both in terms of production quantity and employment [7]. The output of carp farming in the EU has recently been levelled off at about 80,000–90,000 t/year [3]: neither fish pond areas nor yields have increased compared to their respective levels in the late 1980s. In major carp producing member states of the EU fish ponds are managed extensively and average gross yields fluctuate between 400 and 800 kg/ha, a fraction of those achieved by intensive pond technologies [8,9,10].
In 2012 in the EU aquaculture production shellfish comprised 45% by volume and 28% by value; marine fish 30% by volume and 53% by value; and freshwater fish 25% by volume and 19% by value. The total production volume has actually fallen slightly, whilst the value has increased significantly mainly due to a growth in Atlantic salmon production. The 60% share of imports in EU fish and seafood supply gives little prospect of increasing outputs from capture fisheries. Common carp production has decreased form 90,000 tonnes in the 1970s to 60,000–70,000 thousand tonnes in 2014. This reduction of production is attributed to different issues; predation from wild birds (cormorants, herons) and disease (koi herpes virus). Carp markets have remained traditional in the Central European States supermarkets have replaced traditional markets with other seafood and fish products [7,11].
Being the largest importer of seafood in the world, the EU has introduced several initiatives to increase fish production, both in marine and freshwater environments. Part of the production growth should be originated from pond-based aquaculture [7]. Identification of the barriers to growth and understanding constraining mechanisms are essential for the successful implementation of the development strategy. Although the major constraints facing pond-based aquaculture in EU are related to the post-harvest supply chain, import competition and regulatory environment, some bottlenecks were also identified in the pre-harvest stage, including obsolete infrastructure (i.e., silted up and overgrown ponds) and high mortality levels due to wildlife predation [8,12,13,14]. Desilting ponds requires large investments in mechanization, while predation mortalities can be somewhat reduced by increased spending on safeguarding. Specifically, in Hungary, the lack of a skilled workforce capable of managing water quality and controlling feeding efficiency is also a bottleneck in aquaculture [15].
The driving factors behind stagnating European aquaculture are the lack of farm concentration and the inability to exploit economies of scale. (Economies of scale is the cost advantage that arises with increased farm size, i.e., reduction in per-unit cost of a product.) The growth of a sector and increases in productivity are driven by increasing farm sizes induced by scale economies [16,17,18,19]. In general, labour-saving, capital-intensive, mechanized, standardized technologies benefit from larger scale operations [16,17,18,20]. Marine cage culture is widely supported by the use of economies of scale [17,21,22,23], but the same benefits have also been demonstrated for recirculating aquaculture systems [24]. Salmon farming, which is a highly concentrated industry, is the only sub-sector of European aquaculture experiencing high growth rates. In shrimp farming, it is also reported that there is a growing trend towards industrialization and consolidation of farms [25]. Several studies argue that there is a relationship between its structure, which is able to profit from economies of scale, and the massive growth of the sector [17,21,26]. On the other hand, the stagnation of European freshwater fish culture has recently been explained by the fragmented farm structure and its inability to benefit from economies of scale [19]. The dominance of small family-owned farms particularly characterises pond-based fish farming in the EU [27].
Diseconomies of scale can also occur when scaling up a business; this results in less efficient management, leading to increased average costs of production [28]. Extensive carp farming in ponds can be characterized as a management intensive technology for the following reasons: (i) its high labour intensity requires good management skills to organize labour adequately; (ii) its low level of mechanisation precludes the need for large capital investment and (iii) by relying strongly on aquatic ecological processes, exposure to climatic factors implies that the production process is difficult to standardize and requires site specific management. Considering these factors, pond-based farming is relatively exposed to drivers of diseconomies of scale. Therefore, concentration in pond-based aquaculture can have both efficiency and inefficiency effects. Although the issue of scale economies is generally related to industry prospects, no quantitative research has been focused on returns to scale of pond-based aquaculture in EU.
This study was primarily motivated by the desire to understand the background of stagnating carp aquaculture in the EU. We investigated factors constraining production and yields in pond-based farming from an econometric perspective, focusing on the aquaculture production of carp in Hungary. Although Hungary is only the 3rd largest producer of carp in the EU, it represents many of the problems and characteristics of carp farming in surrounding countries. Based on production and input use data obtained from 44 Hungarian carp farms, estimated production functions were analysed. The main objective was to investigate the potential for economies of scale to be realized in the pre-harvest stage of carp production, as well as concerns related to the scale of production, and hence to estimate the influence of production factors such as labour and large machinery on production performance.
Case Study of Hungarian Aquaculture
The technological processes of carp farming is described briefly below in order to support the selection of output variables in our model. Traditional Hungarian carp farming technology incorporates three sequential rearing stages lasting the entire production season, which runs from April to October of the given year. After harvesting is completed in autumn, the 1-summer old (reared over one production season) and the 2-summer old (reared over two production seasons) fish stock are placed in overwintering ponds and restocked for further on-growing next spring, while 3-summer old fish are marketed for human consumption. Most farms’ activity encompasses all the 3 life stages, while some farms specialize in only the first two seasons and market the 2-summer old stockers to other farms. There is no marked difference between the prices of stocking material and market-size fish: 1-summer old and 2-summer old carp are by 20–30% and 10–20% more expensive than market-size carp, respectively. Gross yields per unit area do not differ significantly between the subsequent rearing stages, either. Therefore, production values per hectare are similar among ponds specializing in different life stages.
Although common carp is the main target species in Hungarian pond-based aquaculture, most farms also stock non-fed Chinese carp (up to 20% of biomass) to improve water quality and exploit trophic niches not used by common carps, and also predatory species (1–3% of stocked biomass) to control the presence of small-size trash fish competing for feed with common carps. Filter feeder non-fed Chinese carps are of very low market value (farm gate prices reach just 30–40% of the price paid for common carps) and represent a very low share both in production value and production costs. Although predatory species are of high market value (2–3 times higher than the common carp), their proportion is marginal and the criterion for a good yield of predators is a high trash fish biomass, which is an undesirable phenomenon.
2. Materials and Methods
2.1. Data
Two datasets were used for the parametrization of the production functions:
The production and input statistics used are collected annually by the Research Institute for Agricultural Economics (AKI) from all Hungarian fish farms (376 pond-based farms and 16 farms practicing tank and cage culture). Although there are restrictions on the handling of farm-level data, aggregated data are published in annual reports [10]. The surveyed data includes harvested quantity, stocked biomass, feed use, pond area, and employment, all reported in biological-physical (not in monetary) units. We used the 2013–2014 averages of these data for the farms analysed. A machinery survey was conducted by the AKI in 2014 among 51 pond farms with the aim of assessing the use of machinery and durable equipment used in extensive carp farming. These data apply to the actual stock of different types of equipment in 2014.
By matching the two datasets we generated a secondary database containing 51 farms for which both types of data were available. Following a preliminary analysis, 7 farms were discarded from further research because the net Common carp yields were negative in their case, which implies that these farms are either affected by extreme mortality or specialize in the storage of biomass and market it in summer during the peak price period. In either case, data from these farms must not be taken into account in an econometric model which assumes typical farming technology. As a result, data from 44 farms were used for the quantitative analysis in this study. These farms accounted for 58% of the pond area in use and for 60% of common carp production in Hungary. The total pond area in use was 24,033 ha, while the gross Common carp production in Hungary in 2014 was 15,005 t. Although no information on the feed quality was available, an overwhelming majority of the pond-based carp farms used grains, namely corn and wheat kernel, which are of very similar market value and nutritional content, so in the econometric analysis we made the assumption that homogenous feed was used.
In order to calculate the marginal cost and marginal value products (MVP) of some inputs, unit values and unit costs were calculated based on available data sources and estimations. These are presented in Table 1.
2.2. Identification of Output and Input Variables for the Production Function
To select an output variable properly reflecting a farm’s performance, two attributes of the farming technology, namely the multi-year rearing requirement and the polyculture stocking, had to be considered. These considerations raise questions as regards what to include in the output variables; i.e., only the market-size fish production or the gross production; all cultured species or only the main target species, the common carp?
As it was stated above, production values per hectare are similar among ponds specialising in different life stages. This means that basic relationships between inputs and outputs are comparable between farms with different production structures with respect to the allocation of ponds to different life stages. Furthermore, taking into account the fact that the data available on the labour force, feed and machinery are not divided according to life stage, we decided to use gross fish production as an output variable in our model.
Taking into consideration that common carp is the main target species, and the rests of species are only to stock to boost common carp yields, the harvested quantity of common carp was selected for our model as an output variable, excluding other species. The selection of explanatory variables was largely driven by the availability of databases on inputs, as well as by practical concerns. It was not the intention of this paper to model pure biological interactions in the production process, rather our main focus was to demonstrate how major groups of production factors such as raw materials, fixed capital (machinery) and labour costs affect productivity. In addition to this, we tried to reduce the number of input variables in order to minimize parameter estimation problems due to multicollinearity. Due to these concerns we combined inputs representing raw materials, namely feed and stocking material, into one explanatory variable. Similarly, we created one explanatory variable for farm labour, combining data on full-time, part time and occasional employees. With large machinery equipment we created a combined variable representing four types of machines used for pond maintenance and/or the logistics of feeding and livestock. Considering pond area, we decided to include the pond area in use (and not calculate the unused pond area) as the fourth explanatory variable in the model. Table 2 provides a brief description on the units and calculation methods of the model variables described above.
2.3. Specification of Production Functions
The model relationships between output and inputs we selected is the most widely used functional form, known as the Cobb-Douglas type (C-D). C-D functions can be applied both (i) to relate production with inputs expressed in absolute quantities [31,32] and (ii) to capture the relationships between per hectare yields and per hectare input use [33,34]. The latter specification of C-D is more widely used because multicollinearity between explanatory variables inherently arises when absolute quantities are regressed, while this problem is often overcome by calculating on a per hectare basis. These two specifications are addressed to analyse different phenomena. Absolute C-D specifications are used to investigate the returns to scale prevalent in the industry; while per hectare specifications are applied to explore the sources of the yields. Since our interest encompasses several fields, we decided to estimate and analyse both types of C-D forms.
There are certain advantages inherent in the algebra surrounding the C-D functions that we exploited when we specified the variables. First, variables can be expressed both in monetary and biological-physical units because individual production elasticities of inputs do not change when changing units (only the constant term changes, but this is of minor importance). Second, the sum of individual production elasticities, which is a measure of economies of scale, is not disturbed by the combination of several inputs into one variable. For instance, in our case, assuming that the use of feed is proportional to the amount of stocking material, raw material (RM) will have a coefficient similar to what would be the sum of the individual coefficients of feed and stocking material if these were used as separate input variables in the model. (The RM variable is specified as the additive combination of feed and stocking material.) The production elasticity of an input is the percentage change in the production resulting from one percentage change in the quantity of input concerned. In the logarithmic form of C-D functions the production elasticities of inputs equal to their coefficients.
The C-D models specified with the variables outlined above can be expressed in logarithmic form as follows:
where Y is the gross production of Common carp per farm, RM is a combined variable for feed and Common carp stocking material inputs (used as a proxy for raw materials), L is the labour input, M represents the large machinery and P is the pond surface, while y, fs, l and m are their respective relative values calculated on a per hectare basis. The sum of individual production elasticities in Equation (1) is considered a measure of economies of scale: if it is less than 1 then diseconomies of scale will occur; if it is bigger than unity it implies the existence of economies of scale. In our study the null hypothesis means that there are constant returns to scale, i.e., the sum of production elasticities is one. In order to determine whether the result of our model is statistically significantly different from 1, a t-test is conducted using the delta method described by [35].
Ln Y = α0 + α1 Ln(RM) + α2 Ln(L) + α3 Ln(M) + α4 Ln(P) + εi
Ln y = β0 + β1 Ln(rm) + β2 Ln(l) + β3 Ln(m) + εi
As a preliminary analysis showed that farms operating on less than 50 ha had significantly higher yields than other size groups, we specified a 3rd model which was the extension of the 2nd model with a dummy variable for farms with less than 50 ha pond area. After parametrisation of the model, the dummy variable turned out to be not significant at the p = 0.10 level, so we decided not to discuss this model in detail.
Marginal Value Products (MVP) of inputs were calculated so that constraints and opportunities in pond farming can be analysed. The MVP of an input is the market value of the output resulting from one additional unit of input in question. The MVP was computed for each farm as the product of the market value of common carps and the partial derivate of Equation (1) with respect to the variable concerned.
Multicollinearity between explanatory variables was checked by computing Variance Inflation Factors (VIF) for explanatory variables. VIF value of a coefficient provides an index that measures how much the variance (the square of the estimate’s standard deviation) of an estimated regression coefficient is increased because of collinearity. The basic assumptions of linear modelling were tested statistically: Shapiro-Wilk test was used to test normal distribution of residuals. The homoscedasticity assumption of the models was checked by conducting a Breusch-Pagan test. Model fitting, diagnostics and testing were conducted with the miscTools, lmtest and perturb packages of R [36,37,38,39]. The econometric analysis is supplemented with descriptive statistical methods so that analysis of factor efficiencies can be made more accessible for readers.
3. Results
3.1. Descriptive Statistics
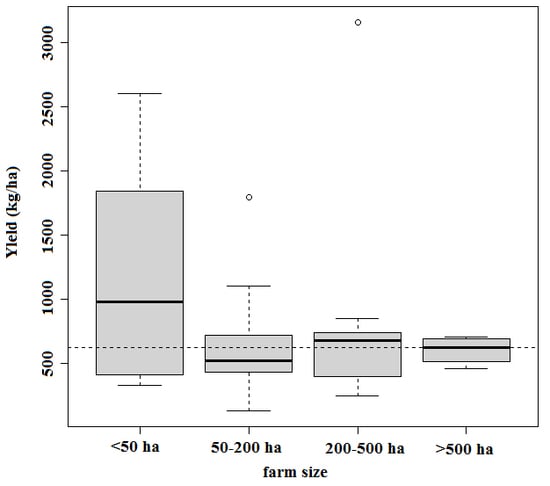
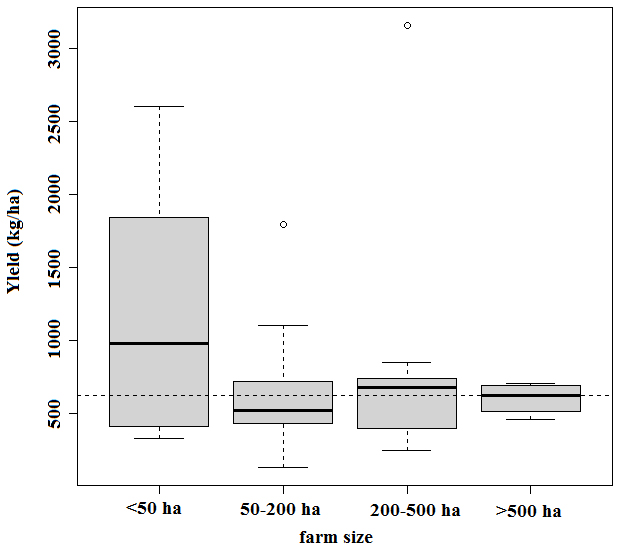
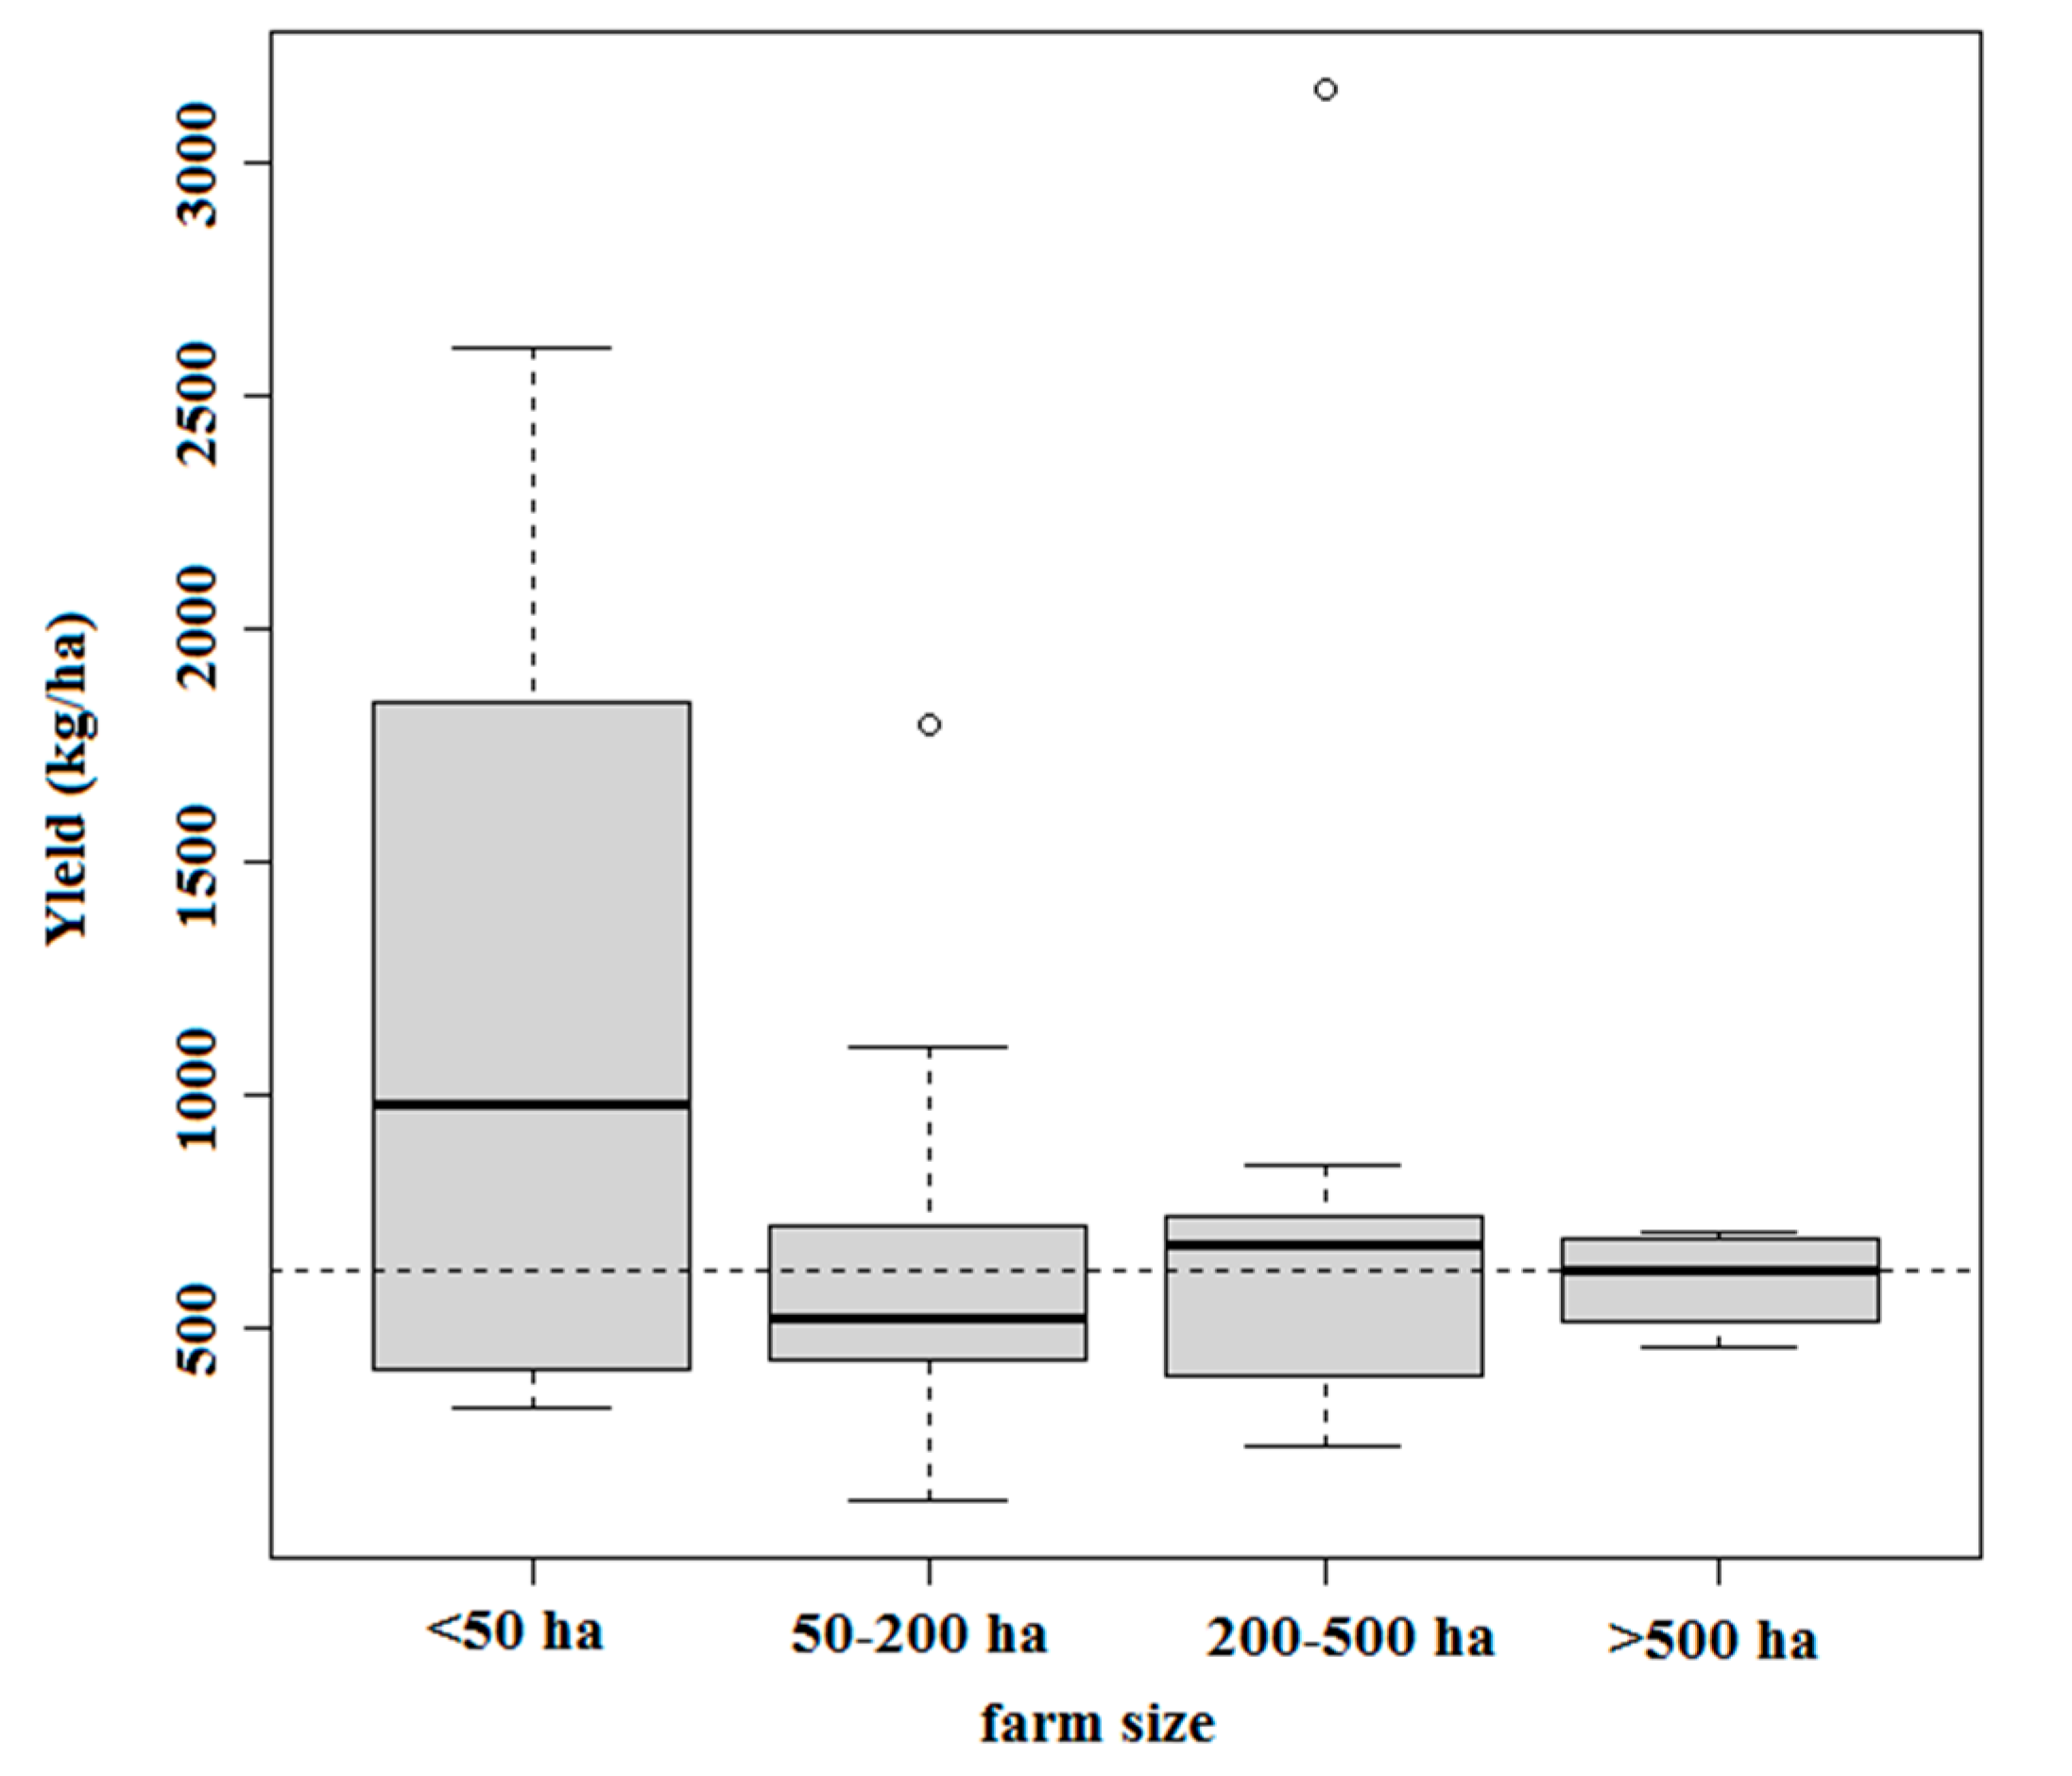
Table 3 presents the yields, the per-hectare input use and the production efficiency of the farms surveyed. These indicators provide an overview on the farming technology and production intensity used by different farm sizes. There are clear differences between farm size groupings and considerable variation within groups. Mean values of per hectare input use and yields are higher for smaller farms (<50 ha) and lower for larger farms (>500 ha). Standard deviation is relatively large in the group of the smallest farms, but there is little variation among the large farms. The national industry (including all fish ponds) averages for most indicators, representing the most conventional method of carp farming in Hungary, are very similar to those of large farms (>500 ha).
For the purpose of better visualization of the most important indicator, Figure 1 presents a boxplot depicting the range of gross yields, so that typical patterns in production intensities can be captured and less focus is placed on the extremes that distort mean values. Interquartile ranges reveal that many of the farms under 50 ha are managed more intensively than large and medium farms.
3.2. Econometric Model
The estimated coefficients of the production functions (described by Equations (1) and (2)) are presented in Table 4. The sum of individual production elasticities in Model 1 is 0.97. The delta method t-test shows that this value statistically is not significantly different from 1. Based on this, the null hypothesis of constant returns to scale cannot be rejected, so what we can conclude is that there are no economies of scale within the pre-harvest stage of carp farming.
The analysis of the production function described by Model 1 shows that for all the 44 farms the marginal value product (MVP) of $1 investment in raw materials is considerably higher than the MVP of $1 investment proportionally shared between all inputs, weighted according to their current share in total costs. (The MVP of raw material is used as a proxy for the profitability of intensification, while the MVP of $1 spent on the input bundle represents the profitability of extensive development.) The interpretation of this result is that intensification would be a more viable way to increase production than extensive development.
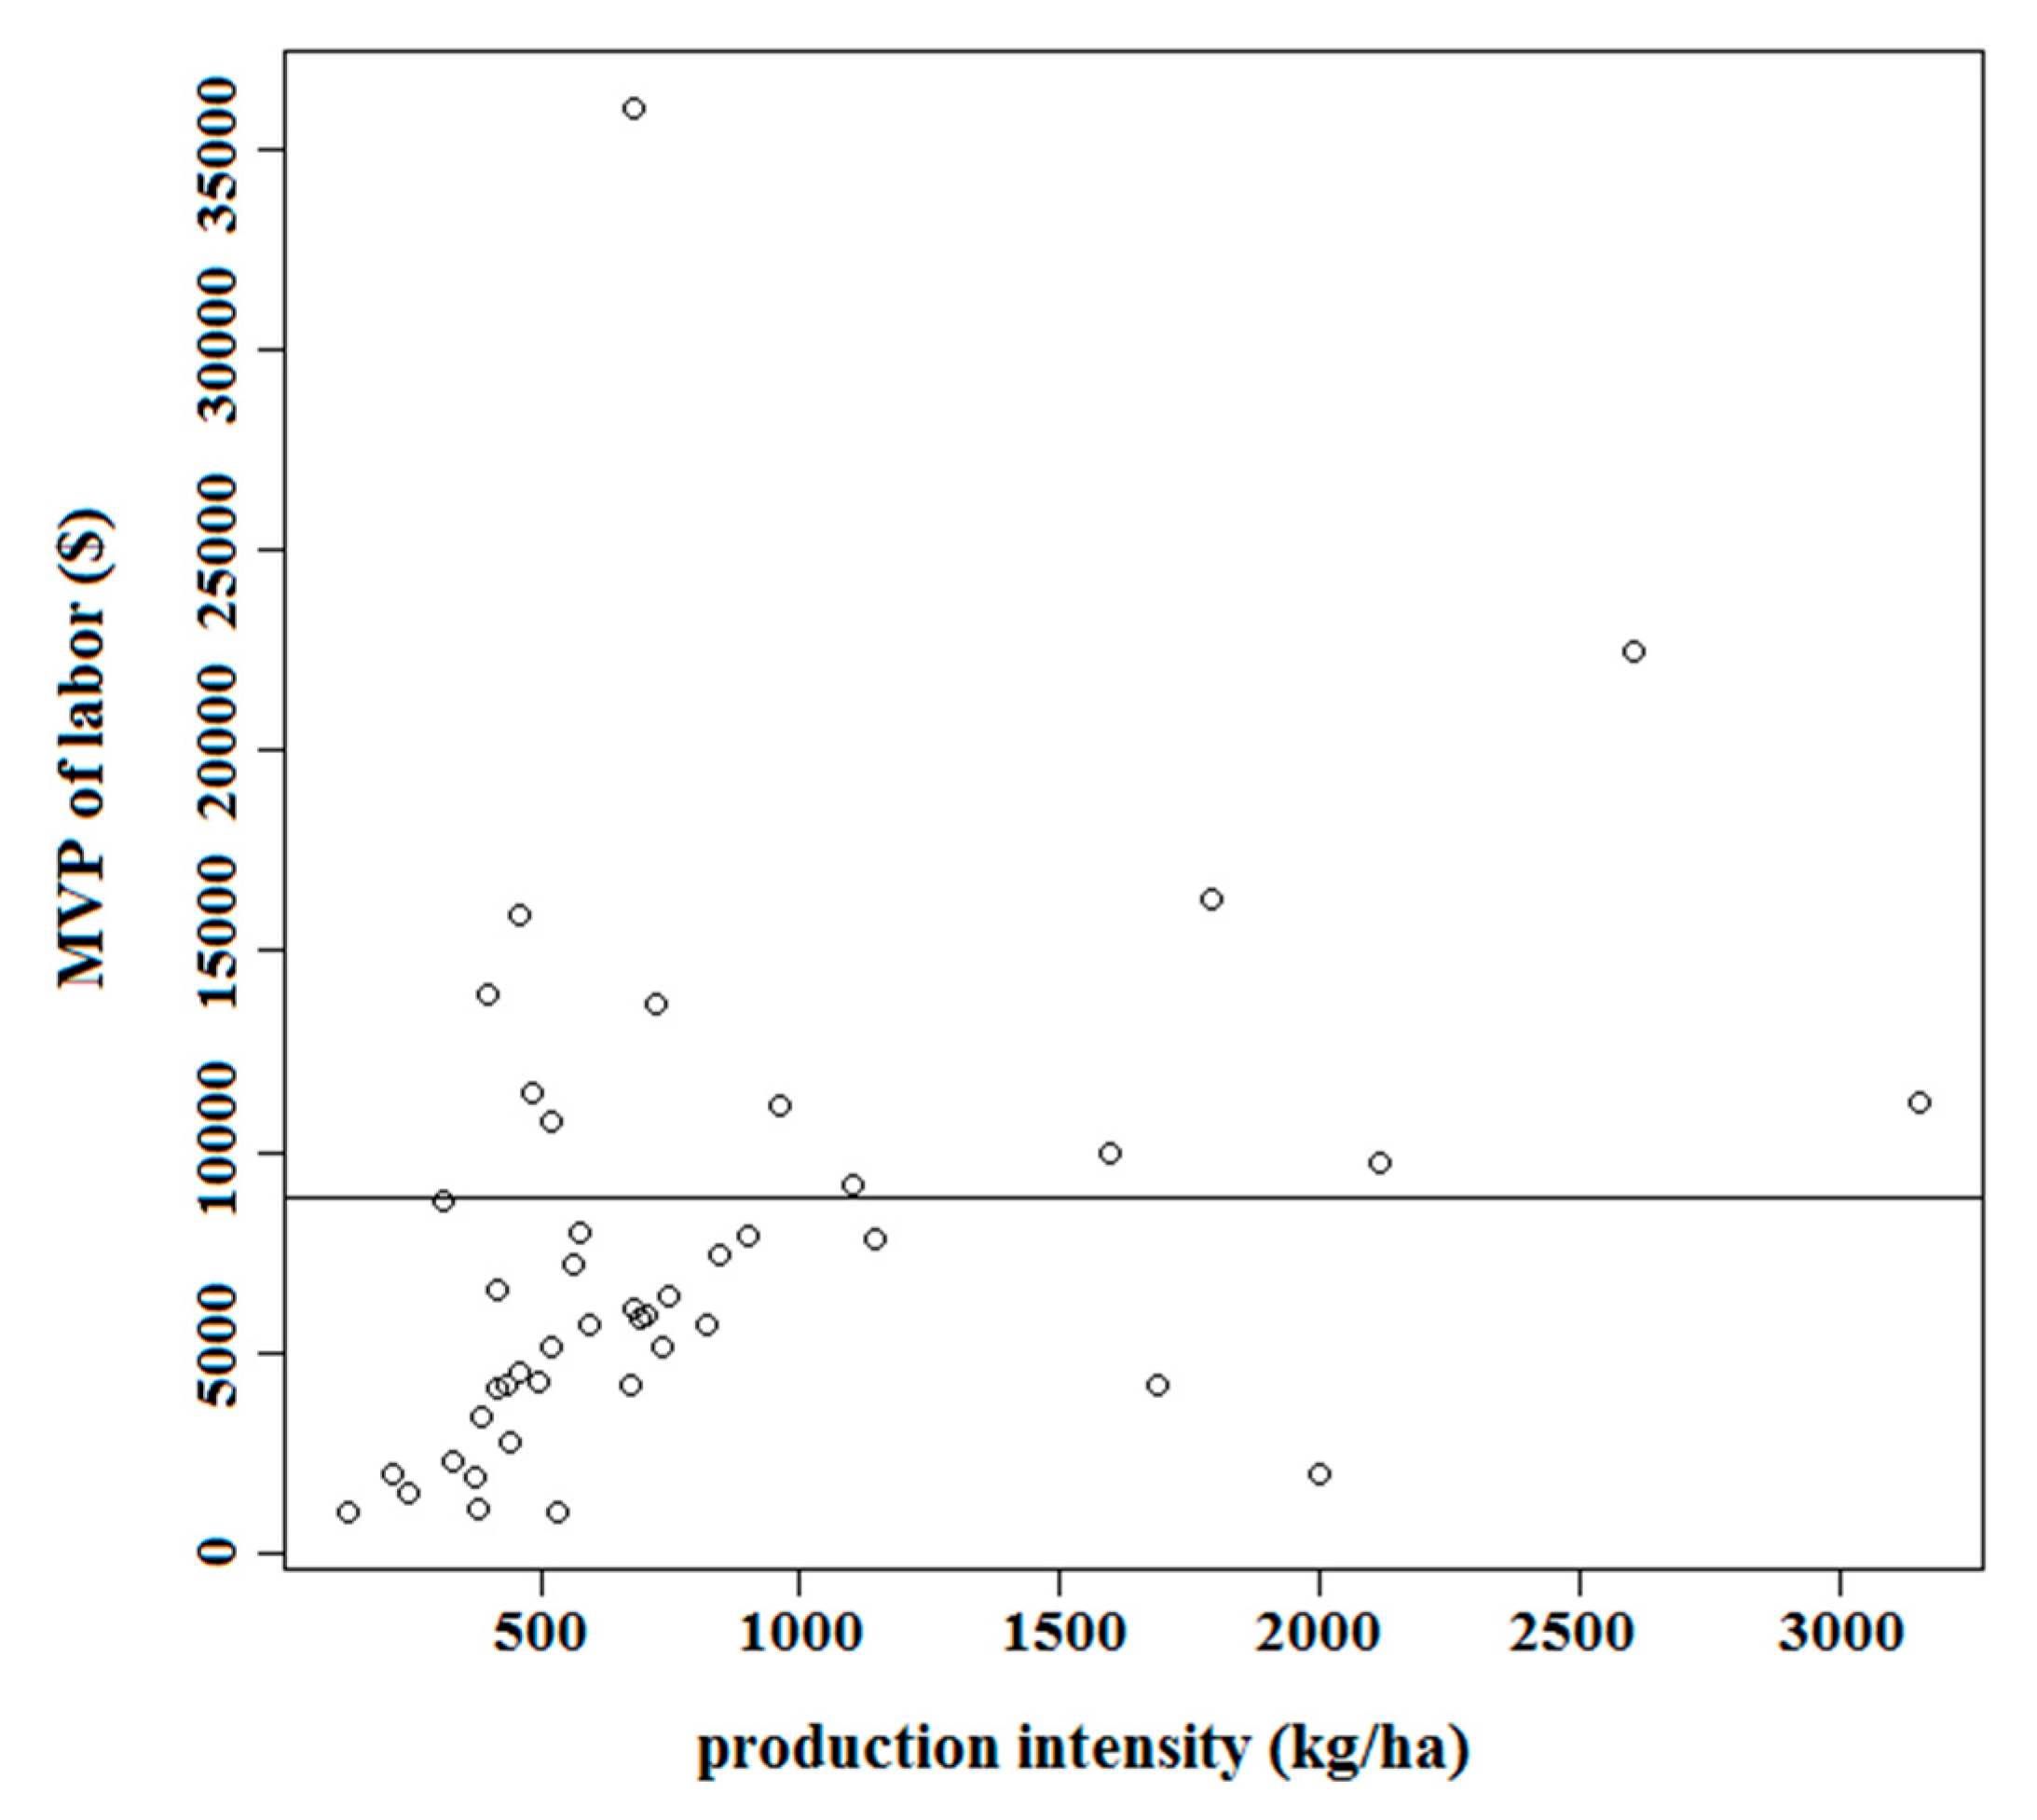
Further analysis shows that the availability of the workforce constrains the development of those farms that use more intensive technologies. The MVP of labour is higher than the cost of an additional FTE (Full Time Equivalent) in the case of the majority of farms with higher yields than the industry average (Figure 2). For the rest of the farms this is not the case.
The parameter estimates for Model 2 shed light on the main sources of production intensity (Table 4). These show that raw material and labour are significant determinants of carp yields. In Model 1 relatively high values of VIFs were associated with P and RM variables: 7.5 and 5.2, respectively. Various recommendations for acceptable levels of VIF have been published in the literature, but following [40], who indicates a VIF value of 10 to be the critical limit, we do not consider that our values indicate harmful collinearity which would make the model useless. In Model 2 calculated VIF values were below 1.02 for all explanatory variables, showing that ‘per hectare’ model specifications eliminated multicollinearity between variables. The validity of the basic assumptions of the linear regressions was tested for both models. Employing the Shapiro-Wilk and Breusch-Pagan (BP) tests we failed to reject the null hypothesis of normal distribution and homoscedasticity of residuals because corresponding p-values were higher than 0.05 in both cases, allowing us to conclude that the basic assumptions of linear regressions are valid for our logarithmic C-D models.
4. Discussion
Relatively low standard deviations of yields and input use in the largest farm category indicate that big farms are more homogeneous in terms of production technology than small and medium-sized farms. In contrast to large farms, several small and medium-sized farms follow alternative strategies and optimise their production technology by adapting a more extensive or a more intensive method of farm management, subject to their comparative advantages and/or the site-specific constraints which limit production intensity (e.g., the quality of road infrastructure, difficulties in guarding the biomass, etc.). This phenomenon is reflected in the relatively high standard deviations in most indicators in these categories. This heterogeneity in the production technologies followed by farmers means that pond farming processes cannot be easily standardised and repeated over several production units, which would be a prerequisite for the existence of economies of scale.
The fact that smaller farms use more intensive production technology is analogous to general agriculture farming patterns in developing countries [20]. The stocking rate of common carp is similar between smaller and larger farms, but there is a remarkable difference in the ratio of harvested to stocked quantity: the weight gain ratio of biomass in small farms are almost double those of other farms. This is partly explained by the increased feeding rate, but better management of water quality, improved fish welfare and more effective protection against predators in smaller farms might also contribute to better biomass growth. Although average feed efficiency is very similar across different farm sizes, a higher feeding rate should be associated with a worse feed conversion rate (FCR) all things being equal, given the law of diminishing marginal returns. In the light of this, similar levels of FCR also imply that feed management is better in smaller farms. Higher overall production efficiency of farms operating on less than 50 hectares is a driver of diseconomies of scale and it is an important phenomenon that helps to interpret the results of the econometric analysis.
Although the sum of production elasticities in Model 1 is not statistically significantly different from 1, there is some evidence in the econometric analysis that there are diseconomies of scale (i.e., larger farms are in the rising portion of the average cost curve). The coefficient of machinery is low (0.03) and not significant meaning that large capital equipment has a limited role in pond production. By comparing the coefficient of capital with the coefficient of labour (0.20) it can be concluded that technologies in carp aquaculture are rather labour-intensive and capital-saving. This supports the view that there are no economies of scale in this sector, as it was discussed earlier that scale economies can be exploited in those technologies that are capital intensive and labour-saving.
Another important signal of diseconomies of scale is the negative sign of the coefficient of the pond area (P). Although statistically not significant, this seems to contradict the monotonicity assumption (i.e., all production factors have positive powers). On the other side, efficient management on small farms (see above) accounts for the negative marginal product of the pond area. In econometric terms, this means that increasing the pond area without increasing the use of other inputs would reduce the overall production for an average farm, as the management effort would be spread over a greater area. It must be considered that separation of management and ownership is not common in Hungarian aquaculture. For this reason, management effort per unit area is inversely proportional to farm size. The management constraint in carp aquaculture follows from the high labour intensity of pond-based farming. In a technology which is characterised by unseen biomass, large areas and high occurrence of human theft (both fish and feed), it requires good organizing ability of the owner to get the employees motivated and engaged in the workplace. It is a perception shared by most of the stakeholders in Hungarian carp farming that if the demand for carp rose, intensification would be a more viable way to increase production than extensive development [15,41].
This perception was validated by the econometric analysis; however, it must be noticed that the lack of skilled workforce can limit the intensification of carp farming. Although the farms analysed in our study used cereal grains as feed, it must be noted that the use of compound pellets became widespread in some EU carp farming countries, and this is the main technological driver of intensification [41,42]. It is global trend that even herbivorous and omnivorous species that are traditionally considered to be relatively low-input species such as carps are increasingly being fed by compound feed [43]. Reference [44] estimate that the share of total carp production fed on commercial compound feeds increased from 37% in 2000 to 52% in 2012, and this trend is expected to continue. If the cost of water and land will increase relative to the cost of feed ingredients over the next years, this will act as an additional economic incentive for intensification: yields will need to be increased so that increased fixed costs are spread out over a larger production (the cost of land and water is irrespective of yields, so these can be considered as fixed costs).
Analysing the parameter estimates for Model 2, the coefficient of raw material (0.859) tells us that purely biological inputs cannot entirely explain yields; managerial interventions through labour and operation of machines are needed to make biological processes function efficiently. (The coefficients of the latter two inputs are 0.219 and 0.034, respectively.) Although the limitations of our datasets have to be considered (no data is available on the power/capacity of the machines), the lack of any statistical significance of large machinery implies that mechanisation has limited scope for improving productivity in pond aquaculture. Most technological processes in pond production such as feeding, stock management and pond maintenance are the hardest activities to automate contributing to the lack of economies of scale.
The results of this study are in line with the experience from other agriculture sectors of the Central and Eastern European region. Scientific findings imply that in most cases there are no economies of scale in the region [45]. The existence of an inverse relationship between farm size and output per unit of cultivated land (physical yield) has been observed for developing countries [46].
5. Conclusions
The longstanding stagnation in EU pond aquaculture remains a challenge. Although many of the constraints are considered to be an issue of product development, marketing, import competition and regulation, some elements of fish production technology can also be addressed in order to improve the profitability and input efficiency of carp farming. This paper analyses the pre-harvest technology of Hungarian pond aquaculture from an econometric perspective. Large differences exist in productivity between small and larger farms and among individual small farms, meaning that it is hard to implement technical standards and to ensure repeatability in extensive carp farming technology, which would create economies of scale for larger companies. The results of the production function analysis reveal that there is no technological driver toward concentration of farms because small farms can be managed more intensively than medium and large ones. The lack of economies of scale may be attributed to the management intensive nature of pond farming. Another important consideration is that labour is an important factor in production and more intensive farms need additional employees. If the labour supply in aquaculture continues to fall, the negative impact on farm productivity will be significant.
The results of the analysis conclude that policies designed to encourage the development of pond farming in Hungary should place an emphasis on improving farm and pond management skills and on mobilizing labour for the aquaculture industry.
Policies affecting the structure of the industry must consider that although increasing farm sizes can bring about more competitiveness in the post-harvest chain and more bargaining power against retailers, the efficiency of pre-harvest production will decline with farm concentration. Should the demand for carp increase (for instance as a result of product development), the payback of intensification with technology change would be higher than that of investment in further pond areas under business-as-usual condition. For this reason, the use of compound carp feeds need to be facilitated by research. If climate change will impact negatively the availability of water resources, this will give further impetus to intensification of production, as it will be crucial to maximize profit per unit of water withdrawn for aquaculture.
Further data collection and analysis are required to assess the contribution of skilled labour force to productivity because the current datasets do not allow to make a distinction between skilled and unskilled workers. Fish farmers reported skilled worker shortage problem due to the lack of appropriate fish pond management practices. In addition, more research is necessary to investigate further the relationship between the post-harvest performance of carp farms and the farm-size in order to draw conclusions about economies of scale in the Hungarian carp farming sector.
Acknowledgments
The authors wish to thank Laszló Váradi, president of the Network of Aquaculture Centres in Central and Eastern Europe (NACEE), for his helpful comments. Gabriella Kiss and Ágnes György from the Research Institute for Agricultural Economics (AKI) deserve special thanks for their efforts in compiling the secondary dataset used for this study.
![Sustainability 09 02111 i001]() Supported by EFOP3.6.3-VEKOP-16-2017-00007—“Young researchers for talent”—Supporting career in research activities in higher education and by EU Horizon 2020 FPR AQUASPACE project Grant No. 633476.
Supported by EFOP3.6.3-VEKOP-16-2017-00007—“Young researchers for talent”—Supporting career in research activities in higher education and by EU Horizon 2020 FPR AQUASPACE project Grant No. 633476.

Author Contributions
Authors contributed equally to this article.
Conflicts of Interest
The authors declare no conflict of interest.
References
- OECD (Organization for Economic Co-operation and Development); FAO (Food and Agriculture Organization of the United Nations). Agricultural Outlook 2017–2026; Organisation for Economic Co-operation and Development/Food and Agriculture Organisation of the United Nations: Paris, France, 2017. Available online: http://stats.oecd.org/Index.aspx?QueryId=76853 (accessed on 10 October 2017).
- OECD (Organization for Economic Co-operation and Development); FAO (Food and Agriculture Organization of the United Nations). Agricultural Outlook; Agriculture Statistics (Database); Organisation for Economic Co-operation and Development/Food and Agriculture Organisation of the United Nations: Rome, Italy, 2017. [Google Scholar]
- FAO (Food and Agriculture Organization of the United Nations). Fishery and Aquaculture Statistics. Global Aquaculture Production 1950–2015; Food and Agriculture Organisation of the United Nations, Fisheries and Aquaculture Department: Rome, Italy, 2017. Available online: www.fao.org/fishery/statistics/software/fishstatj/en (accessed on 10 October 2017).
- FAO (Food and Agriculture Organization of the United Nations). Regional Review on Aquaculture in the Asia-Pacific: Trends and Prospects—2010 FAO Fisheries and Aquaculture Circular; No. 1061/5. Food and Agriculture Organisation of the United Nations, Network of Aquaculture Centres in Asia-Pacific: Rome, Italy, 2011; p. 89. Available online: http://www.fao.org/docrep/014/i2311e/i2311e.pdf (accessed on 10 October 2017).
- Nandeesha, M.; Sentilkumar, V.; Antony Jesu Prabhu, P. Feed management of major carps in India, with special reference to practices adopted in Tamil Nadu. In On-Farm Feeding and Feed Management in Aquaculture; FAO Fisheries and Aquaculture Technical Paper No. 583; Hasan, M.R., New, M.B., Eds.; FAO: Rome, Italy, 2013; pp. 433–462. [Google Scholar]
- Wang, Q.; Cheng, L.; Liu, J.; Li, Z.; Xie, S.; De Silva, S.S. Freshwater aquaculture in PR China: Trends and prospects. Rev. Aquac. 2015, 7, 283–302. [Google Scholar] [CrossRef]
- Bostock, J.; Lane, A.; Hough, C.; Yamamoto, K. An assessment of the economic contribution of EU aquaculture production and the influence of policies for its sustainable development. Aquac. Int. 2016, 24, 699–733. [Google Scholar] [CrossRef]
- Adámek, Z.; Linhart, O.; Kratochvíl, M.; Flajšhans, M.; Randák, T.; Policar, T.; Kozák, P. Aquaculture in the Czech Republic in 2012: A prosperous and modern European sector based on a thousand-year history of pond culture. Aquac. Eur. 2012, 37, 5–14. [Google Scholar]
- Framian, N. Review of the EU Aquaculture Sector and Results of Costs and Earnings Survey, Part 1 of the Final Report on Definition of Data Collection Needs for Aquaculture. 2009. Available online: https://ec.europa.eu/fisheries/sites/fisheries/files/docs/body/aquadata_part1_en.pdf (accessed on 10 October 2017).
- Research Institute of Agricultural Economics. Report on the Fishery Sector; Research Institute for Agricultural Economics: Budapest, Hungary, 2016. Available online: https://www.aki.gov.hu/publikaciok/publikacio/a:116/Jelent%C3%A9s+a++hal%C3%A1szatr%C3%B3l (accessed on 10 October 2017).
- Mente, E.; Smaal, A. Introduction to the special issue on “European aquaculture development since 1993: The benefits of aquaculture to Europe and the perspectives of European aquaculture production”. Aquac. Int. 2016, 24, 693–698. [Google Scholar] [CrossRef]
- Edwards, P. Pilgrimage to traditional carp pond culture in Central Europe. Aquac. Asia 2007, 12, 28–34. [Google Scholar]
- Seiche, K.; Gerdeaux, D.; Gwiazda, R.; Levai, F.; Musil, P.; Nemenonck, O.; Strod, T.; Carss, D. Cormorant-Fisheries Conflicts at Carp Ponds in Europe and Israel—An INTERCAFE Overview; European Cooperation in Science and Technology: Wallingford, UK, 2012. Available online: http://www.intercafeproject.net/pdf/Carp_Ponds_Manual_FOR_WEB.pdf (accessed on 10 October 2017).
- Turkowski, K.; Lirski, A. The economics of carp farms in Poland. Acta Ichthyol. Piscat. 2010, 40, 137–144. [Google Scholar] [CrossRef]
- European Commission. Multiannual National Strategy Plan on Aquaculture of Hungary; European Commission: Brussels, Belgium, 2015. Available online: http://ec.europa.eu/fisheries/cfp/aquaculture/multiannual-national-plans_en (accessed on 10 October 2017).
- Asche, F. Farming the sea. Mar. Resour. Econ. 2008, 23, 527–547. [Google Scholar] [CrossRef]
- Asche, F.; Roll, K.H.; Sandvold, H.N.; Sørvig, A.; Zhang, D. Salmon aquaculture: Larger companies and increased production. Aquac. Econ. Manag. 2013, 17, 322–339. [Google Scholar] [CrossRef]
- Duffy, M. Economies of size in production agriculture. J. Hunger Environ. Nutr. 2009, 4, 375–392. [Google Scholar] [CrossRef] [PubMed]
- Nielsen, R.; Asche, F.; Nielsen, M. Restructuring European freshwater aquaculture from family-owned to large-scale firms—Lessons from Danish aquaculture. Aquac. Res. 2016, 47, 3852–3866. [Google Scholar] [CrossRef]
- Cornia, G.A. Farm size, land yields and the agricultural production function: An analysis for fifteen developing countries. World Dev. 1985, 13, 513–534. [Google Scholar] [CrossRef]
- Asche, F.; Roll, K.H.; Tveteras, R. Economic inefficiency and environmental impact: An application to aquaculture production. J. Environ. Econ. Manag. 2009, 58, 93–105. [Google Scholar] [CrossRef]
- Nilsen, O.B. Learning-by-doing or technological leapfrogging: Production frontiers and efficiency measurement in Norwegian salmon aquaculture. Aquac. Econ. Manag. 2010, 14, 97–119. [Google Scholar] [CrossRef]
- Salvanes, K.G. The structure of the Norwegian fish farming industry: An empirical analysis of economies of scale and substitution possibilities. Mar. Resour. Econ. 1989, 6, 349–373. [Google Scholar] [CrossRef]
- De Ionno, P.N.; Wines, G.L.; Jones, P.L.; Collins, R.O. A bioeconomic evaluation of a commercial scale recirculating finfish growout system—An Australian perspective. Aquaculture 2006, 259, 315–327. [Google Scholar] [CrossRef]
- Bondad-Reantaso, M.G.; Subasinghe, R.P.; Josupeit, H.; Cai, J.; Zhou, X. The role of crustacean fisheries and aquaculture in global food security: Past, present and future. J. Invertebr. Pathol. 2012, 110, 158–165. [Google Scholar] [CrossRef] [PubMed]
- Bjørndal, T.; Salvanes, K.G. Gains from deregulation? An empirical test for efficiency gains in the Norwegian fish farming industry. J. Agric. Econ. 1995, 46, 113–126. [Google Scholar] [CrossRef]
- Váradi, L.; Lane, A.; Harache, Y.; Gyalog, G.; Békefi, E.; Lengyel, P. Regional Review on Status and Trends in Aquaculture Development in Europe, 2010; Food and Agriculture Organisation of the United Nations: Rome, Italy, 2012; ISBN 9250068670. [Google Scholar]
- Engle, C.R. Aquaculture Economics and Financing: Management and Analysis; John Wiley & Sons: Ames, IA, USA, 2010; ISBN 978-0-8138-1301-1/2010. [Google Scholar]
- Hungarian Aquaculture and Fisheries Inter-Branch Organisation (MA-HAL). Annual Report 2014 of Hungarian Fish Farmers’ Association; Hungarian Aquaculture and Fisheries Inter-Branch Organisation (MA-HAL): Budapest, Hungary, 2015; p. 60. Available online: http://magyarhal.hu/eves-jelentes (accessed on 10 October 2017).
- Hungarian Central Statistical Office. Monthly Average Gross Wages of Physical Workers in the National Economy; Hungarian Central Statistical Office: Budapest, Hungary, 2017. Available online: http://www.ksh.hu/docs/hun/xstadat/xstadat_evkozi/e_qli008a.html (accessed on 10 October 2017).
- Lacewell, R.D.; Nichols, J.P.; Jambers, T.H. An analysis of pond raised catfish production in Texas. J. Agric. Appl. Econ. 1973, 5, 141–145. [Google Scholar] [CrossRef]
- Singh, K.; Dey, M.M.; Rabbani, A.G.; Sudhakaran, P.O.; Thapa, G. Technical Efficiency of Freshwater Aquaculture and its Determinants in Tripura, India. Agric. Econ. Res. Rev. 2009, 22, 185–195. [Google Scholar]
- Ali, H.; Murshed-e-Jahan, K.; Belton, B.; Dhar, G.C.; Rashid, H.O. Factors determining the productivity of mola carplet (Amblypharyngodon mola, Hamilton, 1822) in carp polyculture systems in Barisal district of Bangladesh. Aquaculture 2016, 465, 198–208. [Google Scholar] [CrossRef]
- Mohan Dey, M.; Javien Paraguas, F.; Srichantuk, N.; Xinhua, Y.; Bhatta, R.; Thi Chau Dung, L. Technical efficiency of freshwater pond polyculture production in selected Asian countries: Estimation and implication. Aquac. Econ. Manag. 2007, 9, 39–63. [Google Scholar] [CrossRef]
- Henningsen, A. Introduction to Econometric Production Analysis with R (Draft Version); Department of Food and Resource Economics, University of Copenhagen: Copenhagen, Denmark, 2014. [Google Scholar]
- Hendrickx, J. Perturb: Tools for Evaluating Collinearity, Software. Manual. 2015. Available online: https://cran.r-project.org/web/packages/perturb/perturb.pdf (accessed on 16 November 2017).
- Henningsen, A.; Toomet, T. miscTools: Miscellaneous Tools and Utilities. R Package Version 0.6-20. Manual. 2016. Available online: https://CRAN.R-project.org/package=miscTools (accessed on 16 November 2017).
- R Development Core Team. R: A Language and Environment for Statistical Computing; R Foundation for Statistical Computing: Vienna, Austria, 2011. [Google Scholar]
- Zeileis, A.; Hothorn, T. Diagnostic Checking in Regression Relationships. R News 2002, 2, 7–10. [Google Scholar]
- Kennedy, P. A Guide to Econometrics; Blackwell: Oxford, UK, 2008; ISBN 978-1-4051-8257-7. [Google Scholar]
- Gyalog, G.; Váradi, L.; Gál, D. Is intensification a viable way for pond culture in Central and Eastern Europe? AACL Bioflux 2011, 4, 584–589. [Google Scholar]
- Marković, Z.; Stanković, M.; Rašković, B.; Dulić, Z.; Živić, I.; Poleksić, V. Comparative analysis of using cereal grains and compound feed in semi-intensive common carp pond production. Aquac. Int. 2016, 24, 1699–1723. [Google Scholar] [CrossRef]
- Edwards, P. Aquaculture environment interactions: Past, present and likely future trends. Aquaculture 2015, 447, 2–14. [Google Scholar] [CrossRef]
- Tacon, A.G.; Metian, M. Feed matters: Satisfying the feed demand of aquaculture. Rev. Fish. Sci. Aquac. 2015, 23, 1–10. [Google Scholar] [CrossRef]
- Gorton, M.; Davidova, S. Farm productivity and efficiency in the CEE applicant countries: A synthesis of results. Agric. Econ. 2004, 30, 1–16. [Google Scholar] [CrossRef]
- Barrett, C.B. On price risk and the inverse farm size-productivity relationship. J. Dev. Econ. 1996, 51, 193–215. [Google Scholar] [CrossRef]
Figure 1.
Boxplot representing the distribution of Common carp yields in four farm size categories. Bold black horizontal bars are the medians of each group, outliers are plotted as individual points. The single horizontal bar is the national average for the year 2014 calculated from [10].
Figure 1.
Boxplot representing the distribution of Common carp yields in four farm size categories. Bold black horizontal bars are the medians of each group, outliers are plotted as individual points. The single horizontal bar is the national average for the year 2014 calculated from [10].

Figure 2.
Plot indicating the marginal value product (MVP) of labour for the 44 farms involved in the analysis. The x-axis represents Common carp yields. The horizontal line indicates the calculated marginal cost of labour (avg. yearly cost of an FTE).
Figure 2.
Plot indicating the marginal value product (MVP) of labour for the 44 farms involved in the analysis. The x-axis represents Common carp yields. The horizontal line indicates the calculated marginal cost of labour (avg. yearly cost of an FTE).

Table 1.
Brief descriptions and calculation methods of unit values and costs.
| Name of Variable | Calculated/Estimated Unit Value 1 | Calculation Method and Source of Information |
|---|---|---|
| Unit value of production | $2.3/kg | Average farm gate prices are reported by the [29]. Unit value of the overall output was calculated as the weighted average of farm gate values of different age classes of Common carp in 2014. |
| Unit cost of labour | $8877/Full-Time Equivalent | Unit cost of labour in pond-based carp farming was proxied by the average gross earnings of physical workers including social security taxes in the agricultural sector in 2014, as reported by the [30]. |
| Unit cost of feed | $0.174/kg | The average cost of feed (cereal grain) was estimated based on stock exchange prices prevailing in 2014. |
| Annual cost of capital investments in production infrastructure (ponds) | $424.5/hectare/year | The following assumptions were made based on expert estimations: (i) the average construction cost of ponds is $15,436/ha; (ii) there is a 50% investment subsidy rate available for pond construction; (iii) the Capital Recovery Factor is 5.5% (assuming a 5% interest rate and 50 years of useful life for ponds). To compute the annual cost of construction we multiplied these three items. |
1 Using the exchange rate prevalent at the end of the calendar year 2014 (1 $ = 259.1 HUF).
Table 2.
Brief descriptions and calculation methods of dependent and explanatory variables.
| Variables | Units | Brief Description and Calculation Method of Variable |
|---|---|---|
| Gross production of Common carp (Y) | Tonnes | Harvested quantity in live weight |
| Raw Material (RM) | Tonnes (expressed in feed equivalent) | Combined variable to represent the two major operating inputs: feed and stocking material. Calculated as the quantity of feed (in t) plus 15 times the quantity of stocking material (in t). The unit value of fish seed is approximately 15 times that of feed. |
| Machinery (M) | Number of Large Machines | This variable is calculated as the sum of the following machinery items: weed and reed cutting mower boats; mechanical loaders and tractors. |
| Labour (L) | Full-Time-Equivalent (FTE) 1 | Combined variable aggregating full-time employees (Lf), part-time employees (Lp) and days actually worked per occasional worker (Lo). The FTE was calculated as Lf + Lp*1/2 + Lo*1/200 |
| Pond area (P) | Hectares | Pond area in use |
1 One FTE is equivalent to one employee working full-time.
Table 3.
Yields, use of inputs and productivity indicators of surveyed farms.
| Items | Survey Data (Mean ± SD) | Average 4 | |||
|---|---|---|---|---|---|
| <50 ha | 50–200 ha | 200–500 ha | >500 ha | ||
| Number of farms | 12 | 19 | 9 | 4 | |
| Gross yield (t/ha) | |||||
| Common carp (C.c) | 1.17 ± 0.77 | 0.64 ± 0.37 | 0.86 ± 0.83 | 0.61 ± 0.11 | 0.62 |
| All species (including C.c) | 1.30 ± 0.77 | 0.83 ± 0.37 | 1.11 ± 0.97 | 0.77 ± 0.09 | 0.78 |
| Net yield (t/ha) | |||||
| Common carp | 0.88 ± 0.66 | 0.38 ± 0.27 | 0.48 ± 0.43 | 0.35 ± 0.06 | 0.38 |
| All species (incl. C.c) | 0.97 ± 0.67 | 0.51 ± 0.29 | 0.66 ± 0.55 | 0.45 ± 0.06 | 0.49 |
| Stocking density (t/ha) | |||||
| Common carp | 0.30 ± 0.18 | 0.26 ± 0.14 | 0.38 ± 0.42 | 0.26 ± 0.06 | 0.24 |
| All species (incl. C.c) | 0.32 ± 0.18 | 0.33 ± 0.15 | 0.45 ± 0.45 | 0.32 ± 0.05 | 0.29 |
| Labour (FTE/ha 1) | 0.12 ± 0.11 | 0.04 ± 0.05 | 0.05 ± 0.03 | 0.05 ± 0.01 | 0.05 |
| Feed (t/ha) | 3.35 ± 2.18 | 1.72 ± 1.09 | 2.29 ± 1.55 | 1.67 ± 0.61 | 1.72 |
| Machinery (LMU/ha 2) | 0.06 ± 0.10 | 0.03 ± 0.03 | 0.02 ± 0.01 | 0.01 ± 0.00 | n.a. |
| Efficiency indicators | |||||
| Feed Conversion Rate | 5.07 ± 5.08 | 5.38 ± 2.96 | 5.65 ± 2.25 | 4.72 ± 1.45 | 4.48 |
| Ratio of harvested to stocked quantity of C.c. | 4.29 ± 1.95 | 2.60 ± 0.88 | 2.57 ± 0.77 | 2.38 ± 0.25 | 2.61 |
| Labour efficiency (t/FTE) 3 | 14.0 ± 12.3 | 16.65 ± 9.38 | 23.56 ± 21.2 | 13.1 ± 2.5 | n.a. |
Table 4.
Estimated values of coefficients and related statistics of the Cobb-Douglas production functions.
Table 4.
Estimated values of coefficients and related statistics of the Cobb-Douglas production functions.
| Total Carp Production per Farm (Ln Y) | Carp Yields per Hectare (Ln y) | ||||
|---|---|---|---|---|---|
| Parameters | Model 1 | Parameters | Model 2 | ||
| Y-intercept | −0.011 | (0.666) | Y-intercept | −0.094 | (0.652) |
| RM | 0.857 | (0.069) *** | rm | 0.859 | (0.069) *** |
| L | 0.201 | (0.065) ** | l | 0.219 | (0.060) ** |
| M | 0.033 | (0.022) | m | 0.034 | (0.023) |
| P | −0.117 | (0.089) | |||
| R2 | 0.956 | R2 | 0.808 | ||
| F-value | 231.7 *** | F-value | 61.48 *** | ||
Figures within parentheses indicate standard error. Models 1 and 2 correspond to Equations (1) and (2), respectively. *** 1%, ** 5% and * 10% level of significance.
© 2017 by the authors. Licensee MDPI, Basel, Switzerland. This article is an open access article distributed under the terms and conditions of the Creative Commons Attribution (CC BY) license (http://creativecommons.org/licenses/by/4.0/).
Share and Cite
MDPI and ACS Style
Gyalog, G.; Oláh, J.; Békefi, E.; Lukácsik, M.; Popp, J. Constraining Factors in Hungarian Carp Farming: An Econometric Perspective. Sustainability 2017, 9, 2111. https://doi.org/10.3390/su9112111
AMA Style
Gyalog G, Oláh J, Békefi E, Lukácsik M, Popp J. Constraining Factors in Hungarian Carp Farming: An Econometric Perspective. Sustainability. 2017; 9(11):2111. https://doi.org/10.3390/su9112111
Chicago/Turabian StyleGyalog, Gergő, Judit Oláh, Emese Békefi, Mónika Lukácsik, and József Popp. 2017. "Constraining Factors in Hungarian Carp Farming: An Econometric Perspective" Sustainability 9, no. 11: 2111. https://doi.org/10.3390/su9112111
Note that from the first issue of 2016, this journal uses article numbers instead of page numbers. See further details here.