Retrofits for Energy Efficient Office Buildings: Integration of Optimized Photovoltaics in the Form of Responsive Shading Devices


1
Department of Architecture, Faculty of Architecture, Eastern Mediterranean University, Famagusta 99628, North Cyprus, via Mersin 10, Turkey
2
Department of Architecture, College of Engineering, Salahaddin University-Erbil, Erbil 44002, Kurdistan, Iraq
*
Authors to whom correspondence should be addressed.
Sustainability 2017, 9(11), 2096; https://doi.org/10.3390/su9112096
Submission received: 11 August 2017
/
Revised: 22 October 2017
/
Accepted: 9 November 2017
/
Published: 15 November 2017
(This article belongs to the Special Issue Achieving a Sustainable Future Using Renewable Materials in Buildings)
Abstract
:This study presents a retrofit strategy: integrating optimized photovoltaics (PV) in the form of responsive shading devices using a dual-axis solar tracking system. A prototype-based model was fabricated to compare the efficiency of PV in this implementation with the conventional fixed installation. The office building, T1 Empire World in Erbil, was selected as a retrofit case study and for the application of the proposed integration system. In order to assess the effectiveness of the proposed retrofit method, the energy performance of the base case is simulated to be compared later with the energy performance simulations after the integration technique. The amount of generated electricity from the PV surfaces of the integrated shading elements is calculated. The energy simulations were performed using OpenStudio® (NREL, Washington, DC, USA), EnergyPlusTM (NREL, Washington, DC, USA), and Grasshopper/ Ladybug tools in which the essential results were recorded for the baseline reference, as well as the energy performance of the retrofitted building. The results emphasize that the PV-integrated responsive shading devices can maximize the efficiency of PV cells by 36.8% in comparison to the fixed installation. The integrated system can provide approximately 15.39% of the electricity demand for operating the building. This retrofit method has reduced the total site energy consumption by 33.2% compared to the existing building performance. Total electricity end-use of the various utilities was lowered by 33.5%, and the total natural gas end-use of heating demand was reduced by 30.9%. Therefore, the percentage reduction in electricity cooling demand in July and August is 42.7% due to minimizing the heat gain in summer through blocking the sun’s harsh rays from penetrating into interior spaces of the building. In general, this system has multiple benefits, starting with being extremely efficient and viable in generating sustainable alternative energy—which is the global growing concern of today’s sustainable development—providing thermal comfort for occupants, and granting a dynamic appearance to the building when the PV-integrated elements rotate according to the sun’s position in the sky.
1. Introduction
Sustainability concerns and technological evolution are intent in creating energy-efficient buildings and generating electricity from solar energy through emergent photovoltaic (PV)-integrated techniques. Due to the large glazed façades and the nature of office activities [1], office buildings consume a greater amount of energy than other types of commercial buildings [2]. The glazed envelopes of existing office buildings result in glare, heat gains in summer, heat losses in winter, and increasing cooling and heating loads, specifically in hot and arid climates [3].
External shading devices are profitably used to overcome the shortfalls of glazed façades and enhance building performance. As a retrofit strategy, multiple requirements of buildings and occupants are achieved through the integration of shading devices with PV, such as promoting daylight, reducing glare, minimizing heat gain and cooling loads in summer, and generating electricity from PV cells. However, this implementation has not yet been fully optimized and the challenge to capture more solar radiation remains. There is a need to assess this integration on a whole model office building to examine the potential of this technique in reducing energy end-uses and producing electricity from PV cells.
The main aim of this study is to propose an energy-efficient retrofit strategy that profitably suits office buildings. This research attempts to maximize the efficiency of PV in a particular location (Erbil), and then integrate optimized PV in the form of exterior responsive shading devices. The potential benefits include maximizing the efficiency of PV cells, optimizing the effectiveness of shading devices, promoting sustainability by reducing materials and, when producing electricity from the renewable solar energy, decreasing cooling loads simultaneously by reducing heat gain via solar radiation in summer. By lowering total energy consumption and carbon dioxide emissions, this may result in a clean environment and less costly utility bills.
1.1. Retrofits for an Energy-Efficient Office Building
Retrofit involves modification to existing buildings, particularly commercial buildings, which improves energy efficiency and decreases energy demand through the addition of new technology. The application of retrofit is ultimately affected by consciousness and the behavior of occupants concerning energy saving strategies. Mentioned by the Energy Efficiency and Conversation Cleaning House (EECCHI) [4], various retrofit approaches have been implemented on different levels, such as architecture, structure, electrical and mechanical, interior design, and so forth. When retrofitting an office building, architectural aspects are substantially considered in modifications, predominantly the façade [5], as it is used for diverse technical installations [6].
Retrofits through the implementation of photovoltaics have grown rapidly in the digital innovation age due to the urgent demand of producing electricity from renewable energy sources [7]. However, utilizing the integration of PV solar-tracking technology in the form of responsive shading devices is recent, and it is not observed widely through the experiments of retrofitting. In the past, the majority of the photovoltaic implementations have generated low power due to using fixed installations; thus, photovoltaic cells cannot achieve optimal efficiency.
According to the U.S. Energy Information Administration (EIA), office buildings consume more energy than any other commercial building type, in which the energy use of offices is recorded as 17% [2]. Therefore, the application of retrofits can be profitably integrated into office buildings. The building façade is the main concern for architects to target in the retrofitting process due to the feasibility and capability of the façade in enhancing both aesthetic aspects and energy performance of buildings. Different forms of embedding façade-PV have been utilized, such as applying PV panels as cladding, the integration of PV panels into façade windows, and using PV as shading devices [8].
1.2. Integration of Photovoltaics as Responsive Shading Devices
Solar shading devices play a vital role in boosting the interior environment, providing better comfort for occupants and lowering heat gain in summer, which results in a decreasing cooling load and minimizing energy consumption [8]. According to previous research [9], the significant advantages of shading devices are:
- Thermal comfort (cooling loads and artificial light demand reduction);
- Visual comfort (reducing glare and productivity improvement);
- Daylight controlling (maintain adequate daylight level);
- Users’ interaction and more space use (improving the environment); and
- Environmental privacy (protecting internal spaces from the external environment).
The application of exterior shading devices integrated with PV has rapidly emerged in the past decade. This technique performs multiple tasks simultaneously, from controlling daylight to providing thermal and visual comfort and generating solar electricity. Studies encourage electricity production through shading devices integrated with PV [8,10,11,12,13,14,15,16,17]. In previous experiments, fixed shading devices integrated with PV were assessed [10,11], and the operation of controlling the tilt rotation by a computer based on measured environmental conditions was evaluated and optimized [12,13]. These studies report that PV-integrated shading devices generate a considerable amount of electricity and reduce cooling load through novel control of daylight, thereby lowering energy consumption.
Based on the above assumptions, PV-integrated shading devices can be further optimized when using a dual-axis tracking system to maximize the efficiency of PV in producing electricity and optimizing shading effects on thermal comfort.
1.3. Photovoltaic and Efficiency Optimization
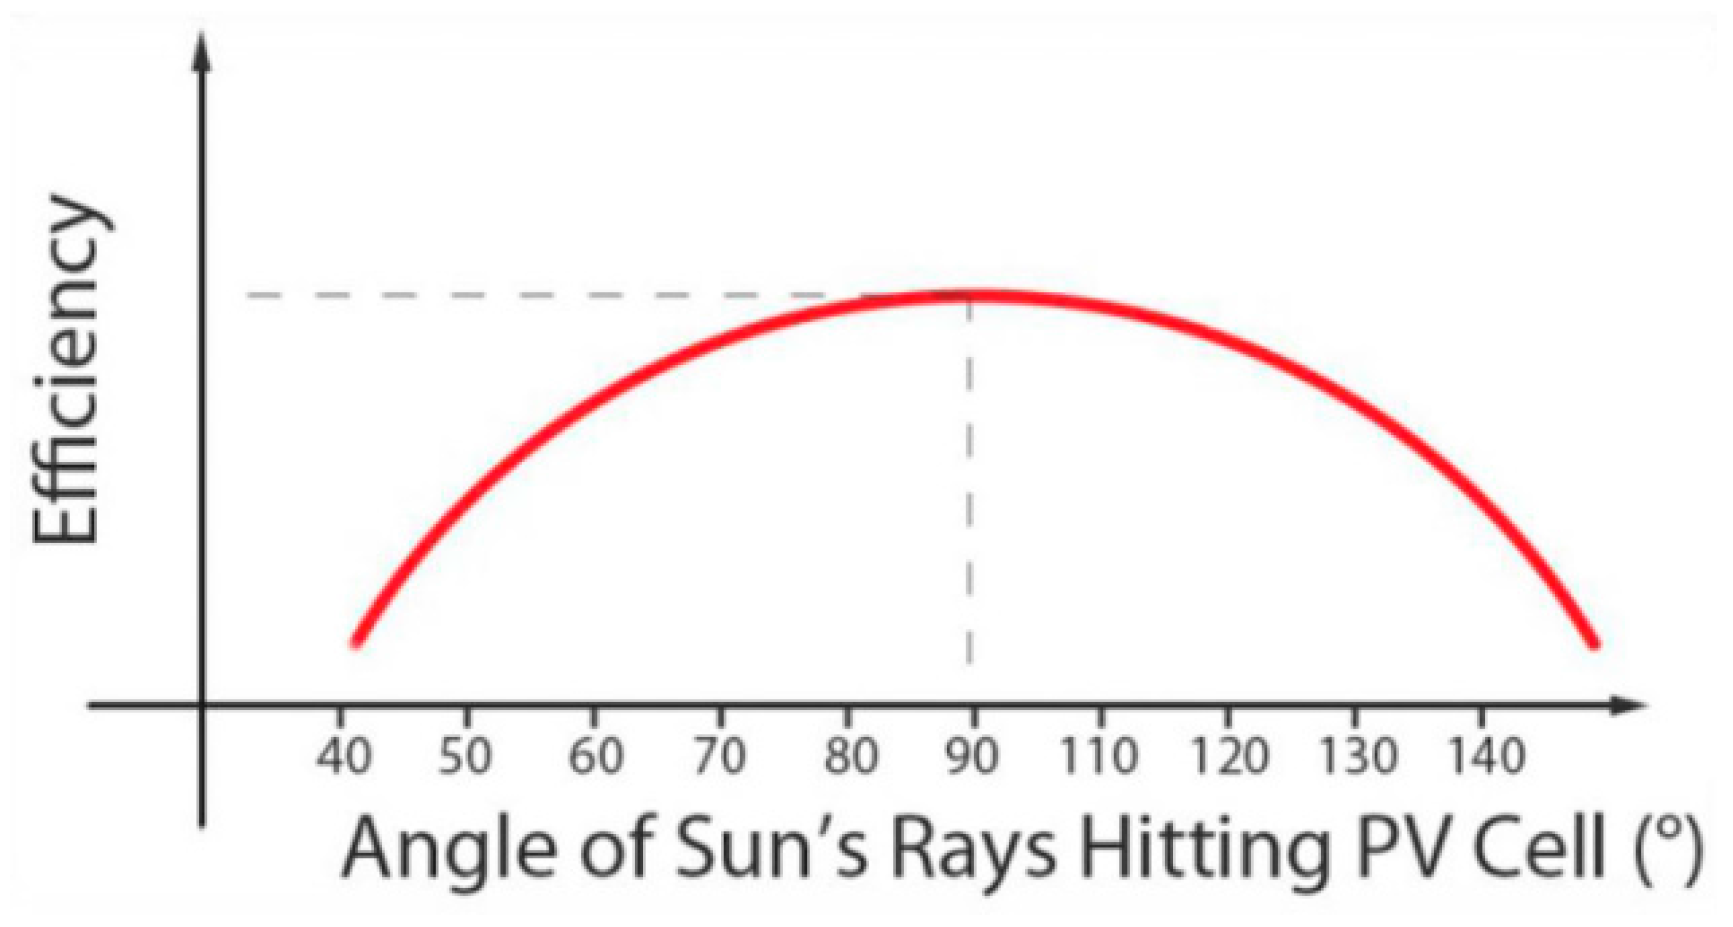
In order to maximize the use of renewable energy through retrofitting façades, utilizing photovoltaic panels is an efficient method to produce electricity from solar energy [14]. A semi-transparent photovoltaic panel has been widely used in re-skinning façades of various types of buildings, for instance, the Mataro Public Library in Spain and the De Kleine Aarde Boxtel in the Netherlands. This kind of photovoltaic panel is used as a re-skinning solution for an office building in Shanghai. The problem was that the building had a glazed façade and the climate of Shanghai city is hot in summer and cold in winter; therefore, the facade was re-skinned utilizing semi-transparent photovoltaic panels to reduce the heat gain and produce electricity. Thus, they found that this system can produce 7% of the building’s energy consumption per year [15]. The same solution used on the campus of the Norwegian University of Science and Technology (NTNU) in Trondheim to cover glazed façades and maximize the use of renewable energy [16]. However, in both above cases, they failed to raise the energy efficiency of photovoltaic panels because fixed system installations were used. Simply placing a large number of PV panels on a building may only keep the PV cells perpendicular to the sun’s rays for 10–15% of the day’s sunlight hours. Figure 1 shows how the efficiency decreases when the angle of sun’s rays hitting the PV cell falls away from 90°.
Considering that sufficient amounts of the solar radiation reach our planet, Taylor [17] states that “It has been calculated that the solar radiation falling on the earth’s atmosphere every hour could, if fully exploited, meet the annual energy needs of the world”. To achieve this goal an intelligent solar tracking system is needed so that photovoltaic cells can convert the maximum amount of solar energy to electricity. An intelligent solar tracker has been invented and proposed; however, it has not been implemented as a retrofit strategy of re-skinning façades yet, and all previous experiments of solar tracking systems were installed for testing purpose or individual use. For instance, a single prototype dual-axis solar tracker was used in a pilot project that is located in Sarawak, Malaysia, to produce more electricity from photovoltaic cells [7].
From the above literature review, it can be merely observed that there is an obvious gap in the system of photovoltaic implementation: that is, using a fixed method. This system requires less cost and low energy production compared to a dual-axis solar tracker. As the demand for maximizing the use of renewable energy, more specifically solar energy, increases, the need to utilize dual-axis tracking systems for photovoltaic panels will increase. Hence, answers for serious questions will be needed, such as how much extra energy can be produced via using such tracking technology instead of a fixed implementation. How much extra efficiency can the photovoltaic panels acquire by using this technology?
2. Materials and Methods
To address the research objectives, this study employs an empirical methodology through different approaches. Firstly, to maximize the efficiency of photovoltaics, a prototype-based experiment was implemented aiming at collecting real-time data. Then, an office building in Erbil was selected as a case study to apply the proposed integration system and evaluate the energy performance of the building before and after the system integration. Finally, computer modelling and simulations were performed to investigate the energy performance of the base case building and the situation after the integration of photovoltaic integrated responsive shading devices. Therefore, the amount of generated electricity through this application, as well as the reduction amount in the energy demand, were calculated and recorded.
2.1. A Prototype-Based Experiment
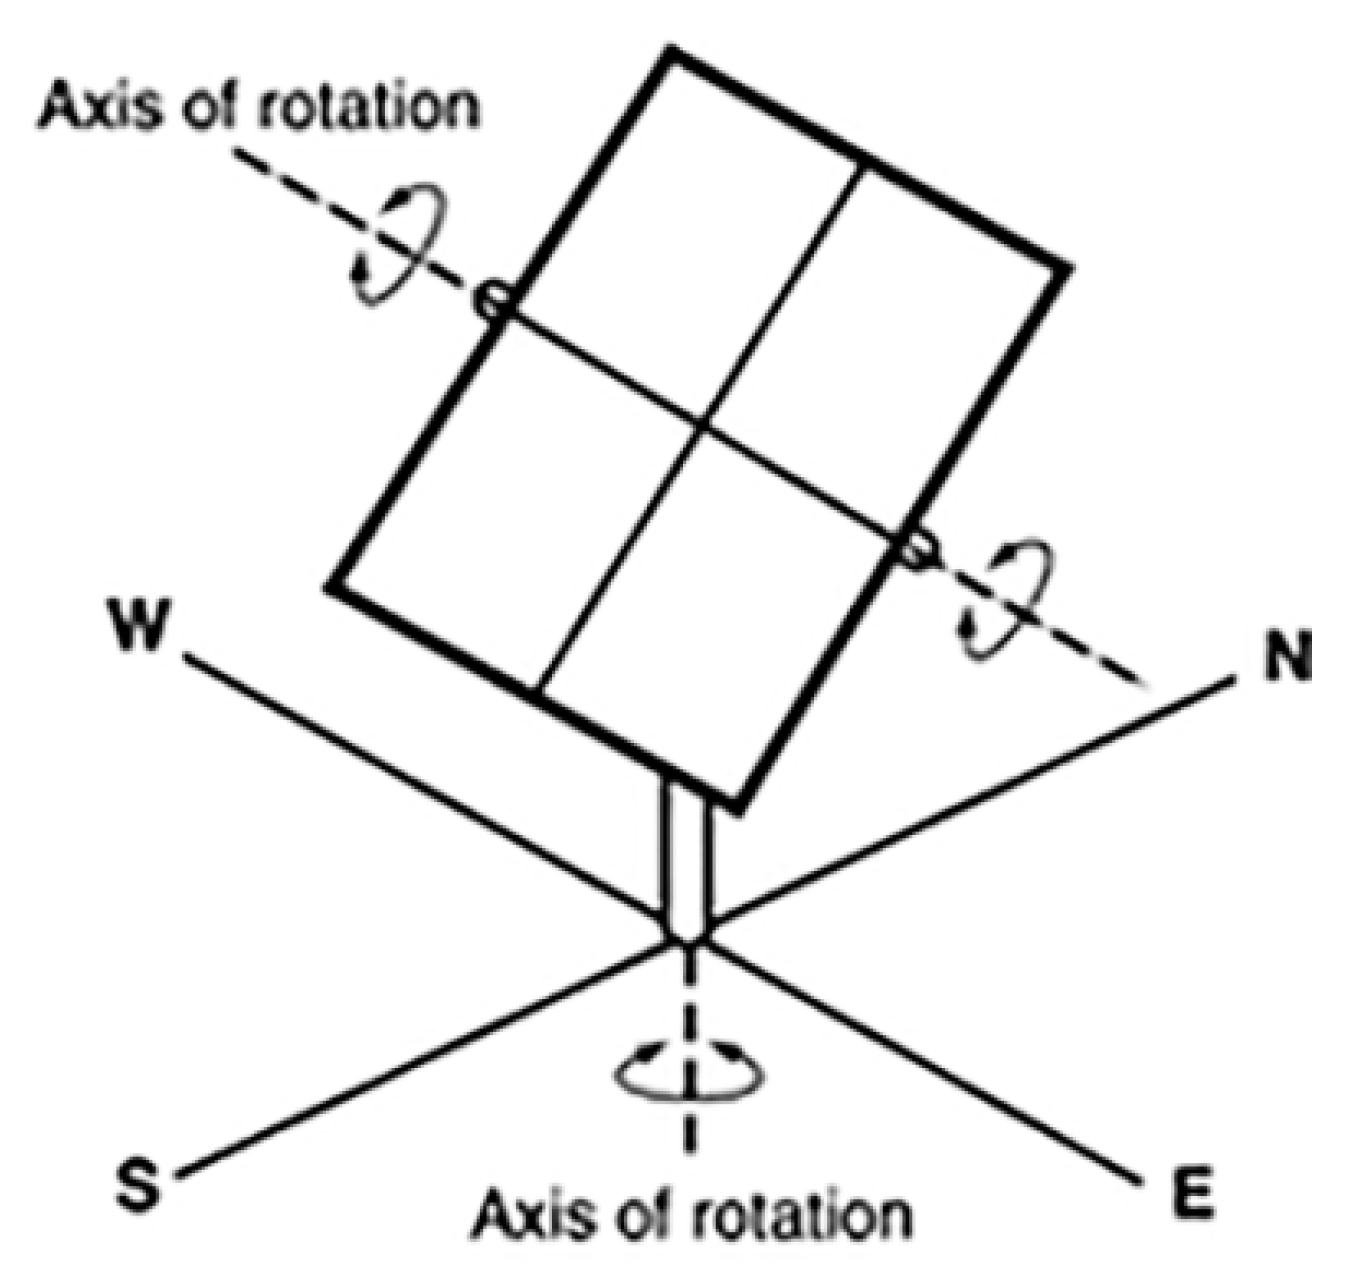
A physical prototype of the PV-integrated responsive shading device was made to test the amount of efficiency optimization compared to the conventional (fixed) installation system. This automated system is characterized by a dual-axis solar tracking ability, by moving the two rotating axes simultaneously, which leads the PV panel to track the sun. Hence, the shading element automatically rotates to stay at 90° to the sun’s rays for maintaining maximum efficiency of the PV in Figure 2.
The research experiment needed a digital model to validate the physical model that was designed in Grasshopper 3D (Robert McNeel & Associates, Washington, DC, USA) [18] (an algorithmic and generative modelling plugin for Rhino 3D [19] application software), which allows the digital model to be connected to the physical prototype through a special scripting Grasshopper 3D plug-in and an open-source electronics platform. The prototype consists of a 125 mm × 125 mm monocrystalline silicon (also called single-crystalline silicon) PV cell, two micro servos 9 g each, 4 × 10,000 LDR (light-dependent resistor) sensors, 4 × 10,000 Ω resistors, jumper wires, breadboard, DC voltmeter/ammeter, and utility parts. A laser cutter was used to digitally fabricate the utility parts and some soldering was applied to attach LDR sensors with the jumper wires. Two LDR sensors were positioned on the top and bottom of the shading element controlling tilt rotations, while the other two LDR sensors were placed on the right and left to control azimuth rotations. This prototype is powered by a laptop via USB and an Arduino Uno [20] (an open-source electronics prototyping platform). In order to test the viability of the prototype, the Arduino microcontroller allows real-time data flow between the digital and physical models through Firefly [21] (a set of comprehensive software tools dedicated to bridging the gap between Grasshopper 3D, the Arduino microcontroller, and input/output devices) scripts and, thus, real-time data can be read from the LDR sensors in Firefly.
The prototype was fabricated to collect real-time data and compare the efficiency of both the automated (responsive) and fixed systems. Both physical and digital models have been calibrated using the real-time data that comes from the LDR sensors. These values coming from the light sensors were read through the UNO Read component in Firefly. After the processes of constraining, remapping, and smoothing, the same data can be used to feed the UNO Write component to control the rotations of the servos in the physical model and to feed the digital model simultaneously. Therefore, both models are interacting together while responding to the real-time data values coming from the four light sensors, as shown in Figure 3. In order to determine the produced power (P) of both the responsive and fixed systems, and to calculate any efficiency optimization (%) through the automated method, the same PV type and size was installed in a fixed manner. Next, the generated power from both photovoltaic installation methods (i.e., responsive and fixed) was recorded through reading the voltage (V) and current (I). Then, the PV cell efficiency optimization of the responsive installation system was calculated.
2.2. Case Study
The case study (Empire World T1) is an office building located in Erbil, Northern Iraq, between latitudes 35°30′ and 37°15′ N and longitudes 43°22′ and 45°05′ E. The climate of Erbil is characterized as semi-arid with long, hot, dry summers and short, cool winters [9]. The temperature exceeds 43 °C in the hottest months in summer, while it drops to 2 °C during the coldest months in winter. The average hours of the sunshine per day are about nine hours, as shown in Table 1.
The Empire World T1 office building [22] (latitude 36°19′ N, longitude 43°97′ E) is a concrete structure with glass (outer to inner: 8 mm thick blue-green tempered and heat-soaked, 12 mm airspace, and 6 mm thick clear tempered low-E) and composite aluminum (4 mm thickness) cladding for external finishing materials. The building has 27 floors in which the first four floors serve as information, office services, a business center, a conference hall, meeting rooms, and a café, while the upper floors constitute offices. The height of each floor is 4 m with a total construction area of 24,000 m2. The total gross area of each office floors varies between 750 m2 and 1035 m2, as shown in Figure 4.
Erbil’s extreme conditions in summer and winter require careful considerations when designing this type of building; however, this tower has a large glazed facade in all orientations without having any external shading systems. Due to the excessive solar gain in summer and heat loss in winter, this office building consumes a very large amount of electricity for indoor air conditioning, which is the main energy source of the project. Consequently, carbon dioxide emissions dramatically increase, which severely affects the city’s environment, and makes the building inefficient in terms of energy performance, thermal comfort, and sustainability standards.
2.3. Computer Modelling and Simulations of Energy Performance and Electricity Generation
Studies on computer modelling and simulations declare that computer simulations play vital roles in building design of resident comfort and energy performance through contributing to solving building performance issues [23,24]. Hence, the present study uses OpenStudio® software (NREL, Washington, DC, USA) [25], which supports complete building energy modelling using EnergyPlus™ (NREL, Washington, DC, USA) [26]. Developed by National Renewable Energy Laboratory (NREL) of the U.S. Department of Energy (DoE), OpenStudio®, along with EnergyPlus™, is a vigorous energy simulation tool that enables energy performance analysis of low-energy technologies in residential and commercial buildings [27,28].
Computer simulation of energy modelling needs substantial knowledge associated with the physical and operational characteristics of the building, as well as precise input data of the building and climate [24,29]. In order to investigate the impact of the proposed integration system, the base-case energy simulations were accomplished to serve as a baseline reference for comparative energy performance. Based on the above assumptions, the general features of the computerized model of the T1 building were established for energy performance simulations, as shown in Table 2 and Table 3. The computer modelling was performed only for the floors that are dedicated to serving as offices. Each floor is divided into two different thermal zones: one for the office areas and the other for central service and the circulation core. The office floors are assigned heating, ventilation, and air conditioning (HVAC)-packaged rooftop of a direct expansion (DX) variable air volume (VAV) units with reheats, office equipment loads, and interior lighting loads. Figure 5 illustrates the modelling and simulation stages with the details and attributes of each stage.
The integrated responsive shading device is a photovoltaic tracking system that responds to the sun’s movement to maximize the PV efficiency. The side length of the glass envelope on each floor is 22.0 m. The study examines the south, east, and west orientations and excludes the north facade, due to its minimum solar radiation in the study location. The two-axis tracking shading devices are integrated with PV cells of monocrystalline silicon type that is characterized by 15% module efficiency and a −0.47%/°C temperature coefficient of power, as presented in Table 4. The dimensions of one module are set to be a standard 1.64 m (l) × 0.99 m (w) and, for the purposes of minimizing mechanical and technical requirements, two PV modules are merged to construct one automated shading element. A gap of 1.08 m is left between two responsive shading devices, thereby minimizing the risk of self-shadings between elements. Figure 6 manifests the PV opaque area and glass area of each floor on the studied orientations. Therefore, the total PV area for all 23 office floors is calculated as 1568.4 m2, as shown in Figure 7.
Utilizing the EnergyPlus™ energy management system (EMS), multiple overlapping surfaces are defined (Shading: Building: Detailed) in the same location, but with different tilt and azimuth angles (Figure 8 and Figure 9). EMS (Surface Ext Solar Beam Cosine of Incidence Angle) indicates the most perpendicular surface to the sun and through overriding their transparency schedule, the most perpendicular surface can be set as fully opaque and the rest as fully transparent at the moment. This simulates the influence of the automated shading devices on lowering the cooling loads of the building in the summer season.
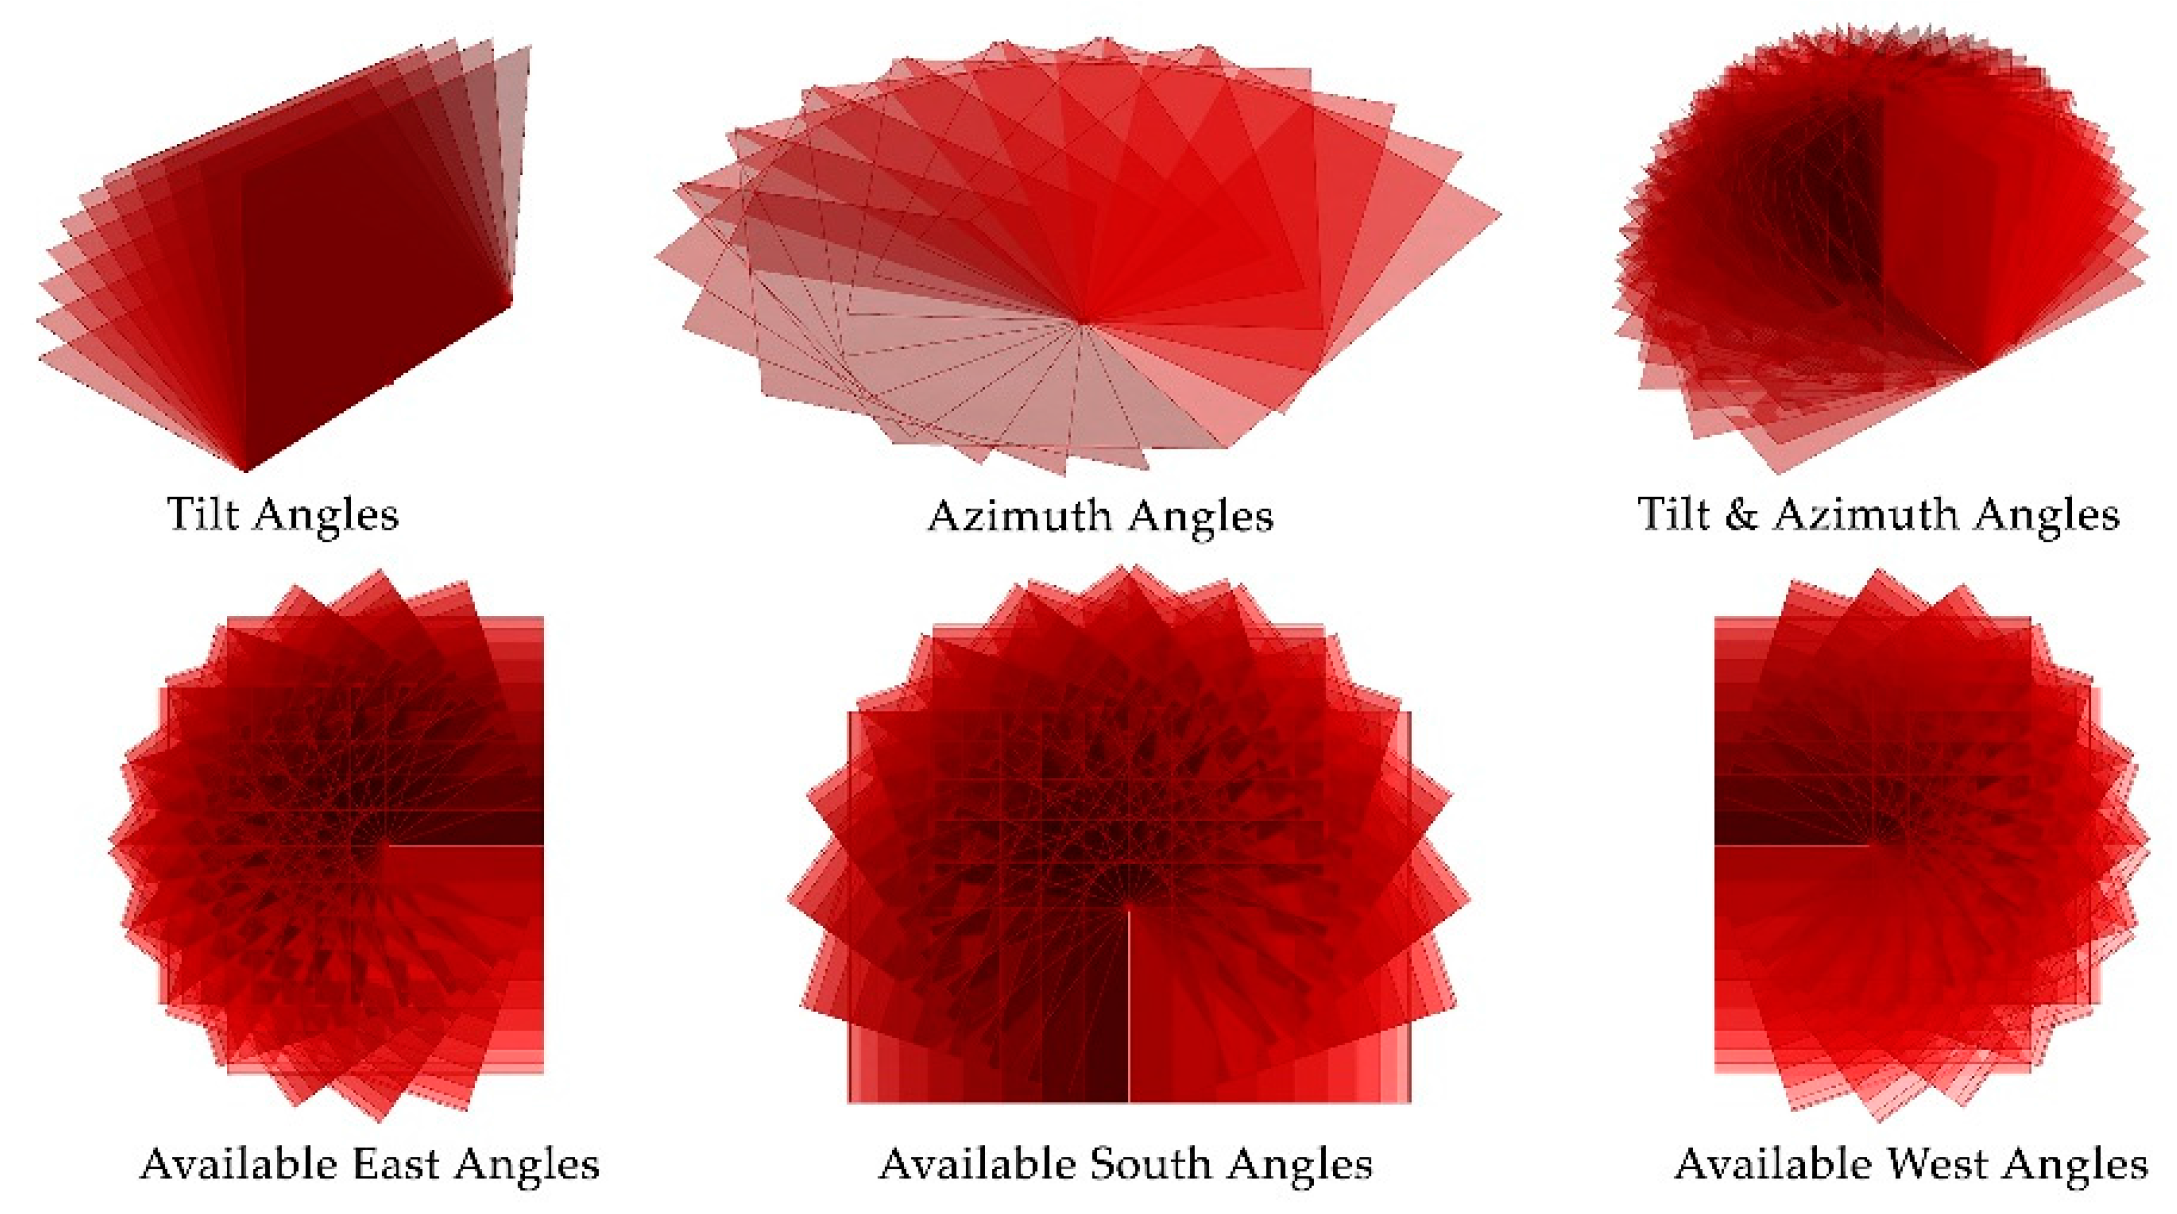
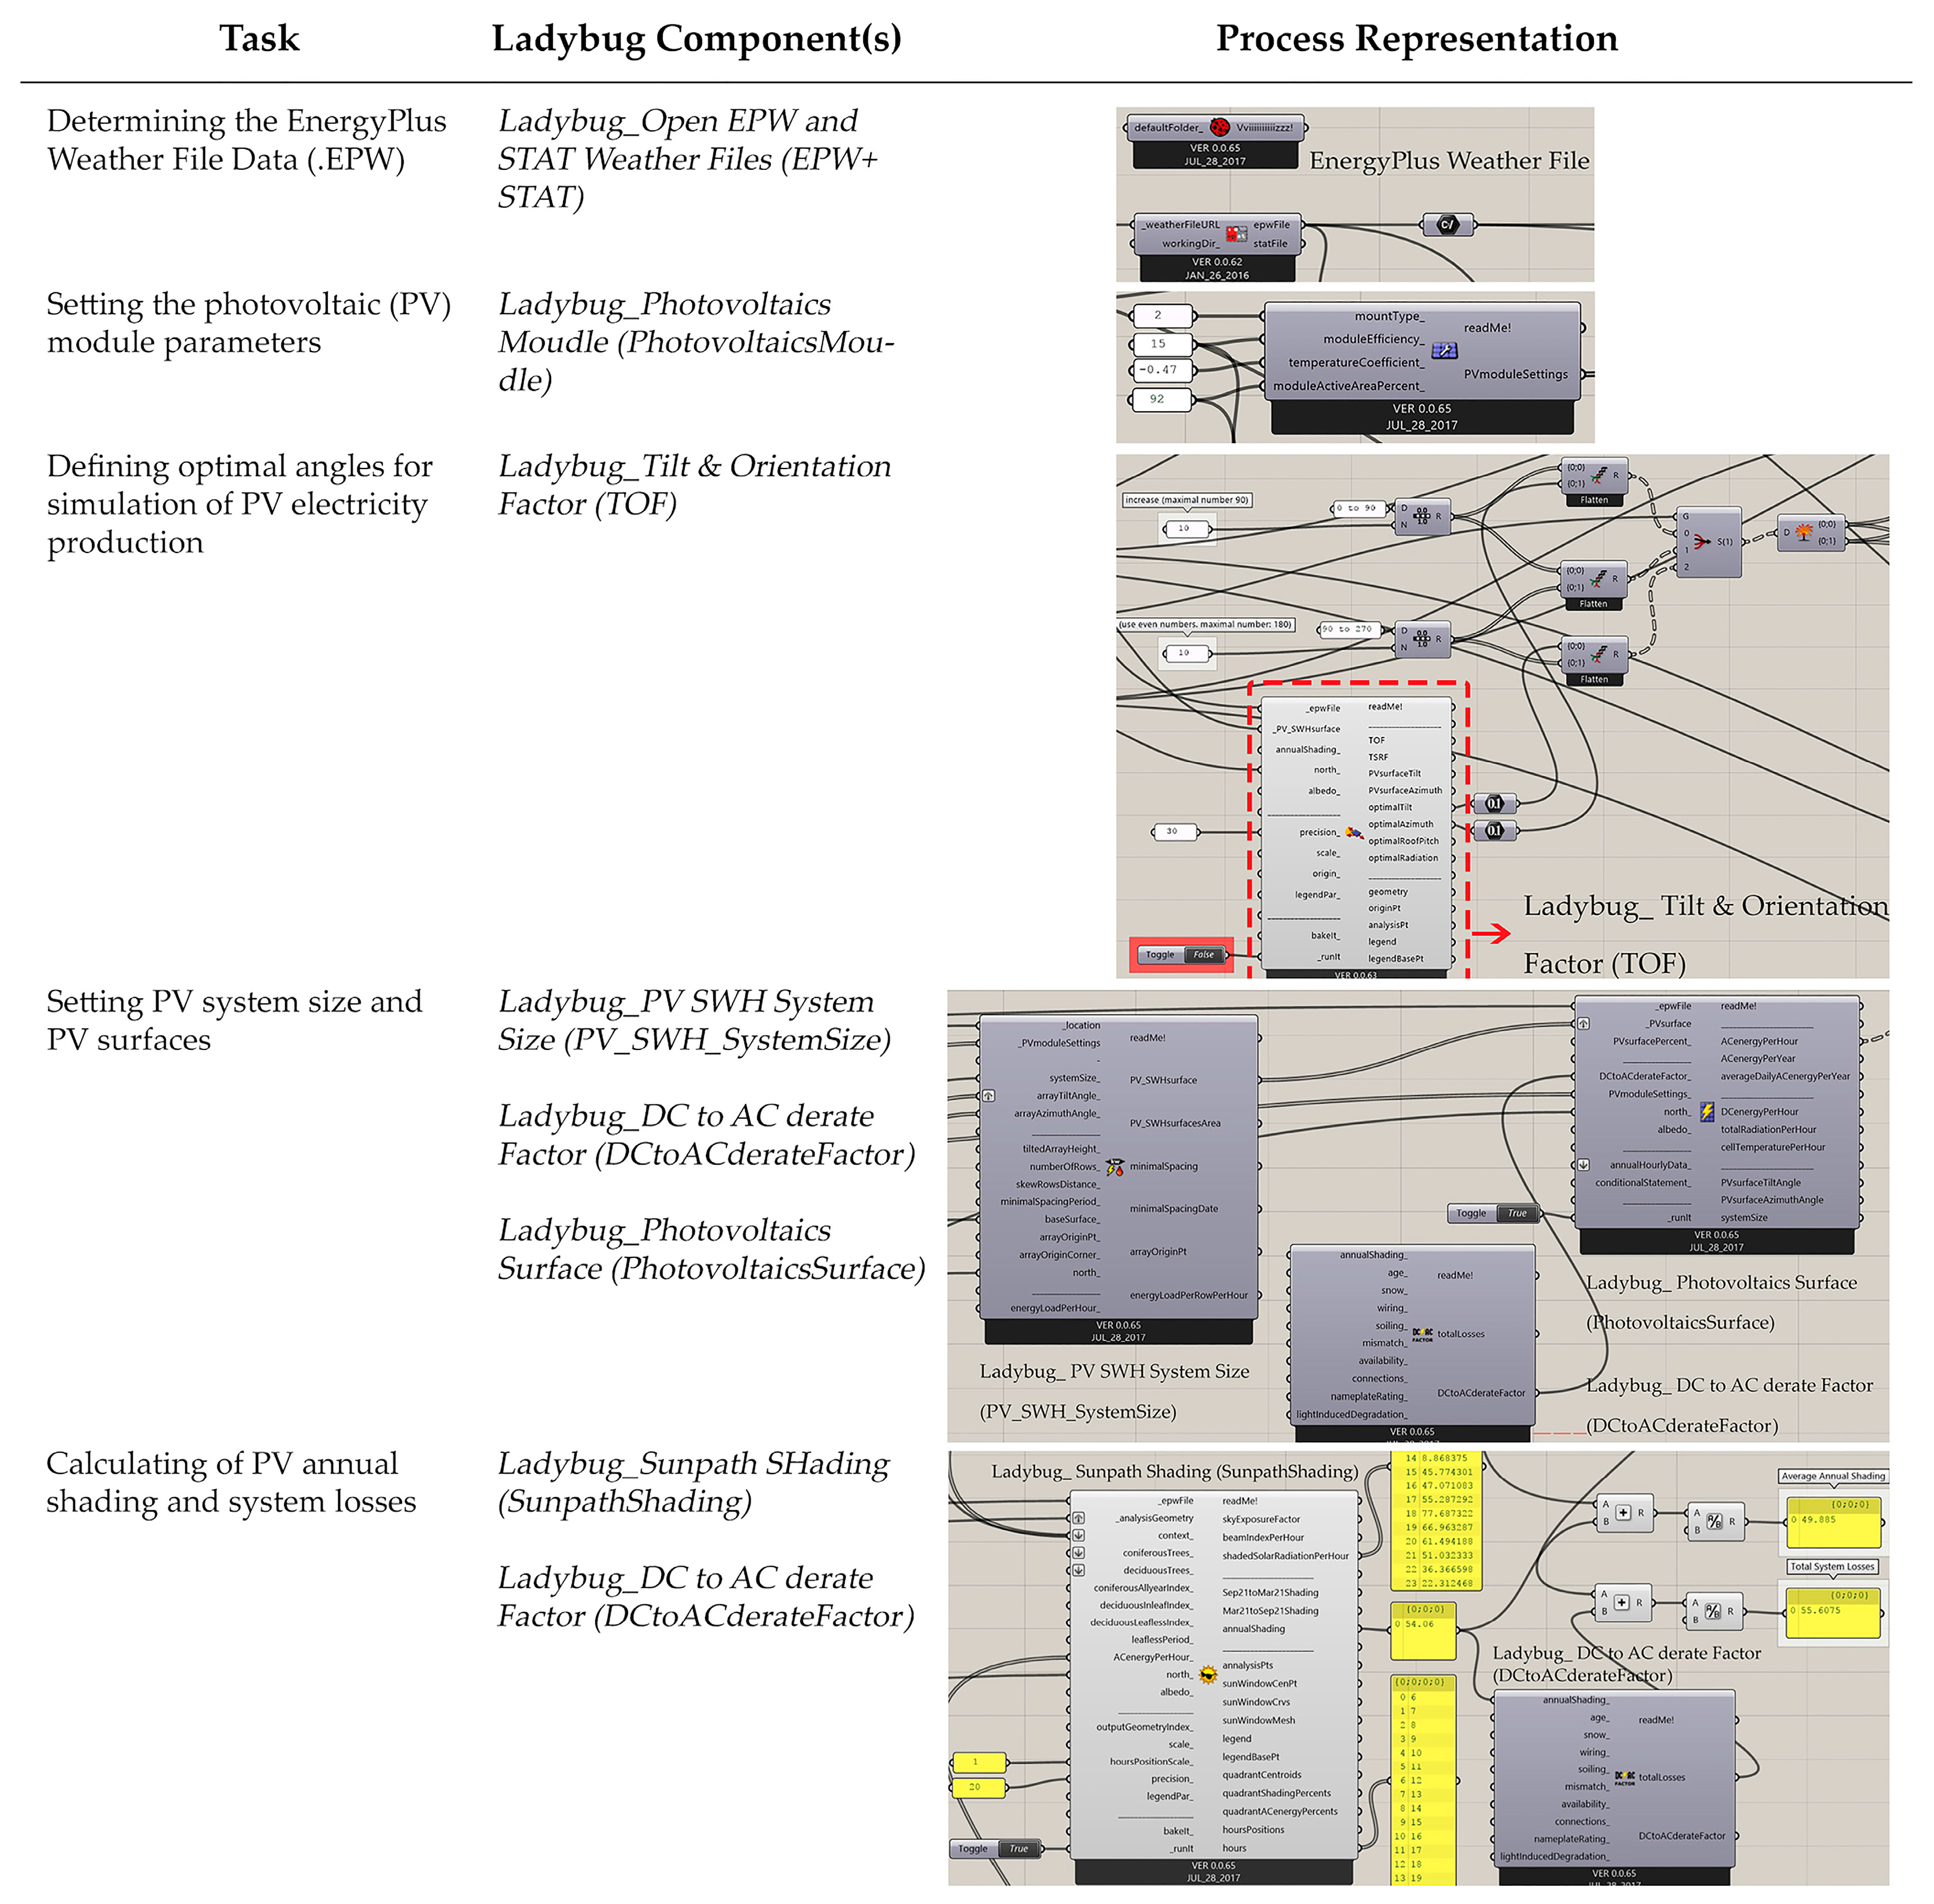
To avoid complicated EMS scripting for calculating the generated electricity from the PV-integrated two-axis tracking elements, Ladybug [31] (open-source environmental plugins for Grasshopper 3D) is used. The modelling of automated panels was conducted using Grasshopper 3D and, through employing Ladybug Renewables, the amount of generated electricity from each orientation can be perceived. In each orientation, 10 different optimal angles were realized for both tilt (between 0° and 90°) and azimuth (east: between 0° and 180°; south: between 90° and 270°; and west: between 180° and 360°) angles using Ladybug_Tilt and Orientation Factor (TOF), as demonstrated in Figure 8 and Figure 9. Figure 10 manifests the process of defining the optimal angles and the simulated angles for each orientation. Using the Laybug_Photovoltaics Module (PhotovoltaicsModule), the module settings were decided to be a normal crystalline silicon with 15% module efficiency and −0.47%/°C temperature coefficient (Table 4). Then, the system size was defined through feeding EnergyPlus Weather Files data (Tabriz.epw is utilized as the closest available weather station to Erbil), the intended orientation, the PV surface, the available optimal tilt and azimuth angles, and the PV module to the Ladybug_PV SWH System Size (PV_SWH_SystemSize). The Ladybug_Sunpath Shading (SunpathShading) component calculates the annual shading of PV modules due to the building and shading devices. This component takes .epwFile, analysisGeometry, context, and ACenergyPerHour as inputs and offers several critical outputs such as ShadedSolarRadiationPerHour, Sep21toMar21Shading, Mar21toSep21Shading, annualShading, hours, and so on. Therefore, the building geometry and all shading elements were fed to the Context input to define any obstacles that may cause shadings. To calculate total losses of the system and DC to AC derate factor, the annualShading output of the Sunpath Shading (SunpathShading) component was fed to the annualShading_ input of Ladybug_DCtoACderateFactor (Figure 10). Then the DCtoACderateFactor output was fed to Photovoltaics Surface (Photovoltaics Surface) component to calculate amount of electrical energy (kWh/year) that can be produced by the PV surfaces of each façade. Figure 11 manifests the Sunpath Shading diagram of, respectively, south, east, and west orientations and their annual shading status.
3. Results and Discussions
The findings of this research were obtained from four sequencing study phases. Accordingly, the results are presented and discussed. The first stage involved maximizing the efficiency of PV through the integration method. In the second stage, the base case building was modelled and simulated to be used as reference data. Then, the building performance simulation was repeated after the system integration of PV-integrated responsive shading devices to explore the impact of this integration system on energy consumption. Finally, the amount of produced electricity from the application of the PV-integrated system on the case study building was calculated.
3.1. Calculation of the PV Efficiency
The initial objective of this study was to maximize the output efficiency of photovoltaic cells. A prototype-based model was developed to address this intention. In order to compare the output power (P) produced from both the dual-axis tracking (responsive) technique and the fixed system (non-adjustable), both methods were tested with real-time data. Using the same PV type (monocrystalline silicon) and size (125 mm × 125 mm) as the automated method, the south-facing fixed installation was tilted at 54° as an optimum annual average tilt angle for the experiment location [32]. This experiment was conducted in the specific climatic conditions of Erbil from the time period between 07:00 and 18:00 on 16 July 2016. The current (I) and voltage (V) produced by both methods were measured through the DC ammeter/voltmeter. Then the power (P) is calculated and recorded for both installation systems in Table 5.
A comparative graph was designed to show the difference in efficiency between the responsive and fixed systems, as shown in Figure 12. Using the relative difference equation (Equation (2)), the calculation results of the total produced power (P) from both installation methods indicate that the responsive tracking system is more efficient by approximately 36.8% in comparison to the fixed installation, considering the location of the experiment (Erbil). The graph manifests that the fixed installation is only efficient at noontime when the sun is perpendicular to the panel. Conversely, the tracking system is efficient during nearly the whole day as it keeps the panel perpendicular to the sun at all times.
where E is the PV efficiency and P is the different amount of power generated from both fixed and responsive installation systems.
3.2. Energy Performance Simulations of the Base Case
In order to compare the effectiveness of the proposed integration system, the energy performance of the base case is simulated to compare later with the energy performance simulations after the integration technique. The energy simulations were performed using OpenStudio® [25] in which the essential results were recorded for the baseline reference. Results demonstrate that the total site energy consumption of the existing office building is approximately 11,910.18 GJ and energy per total building area is 661.10 MJ/m2, as shown in Table 6.
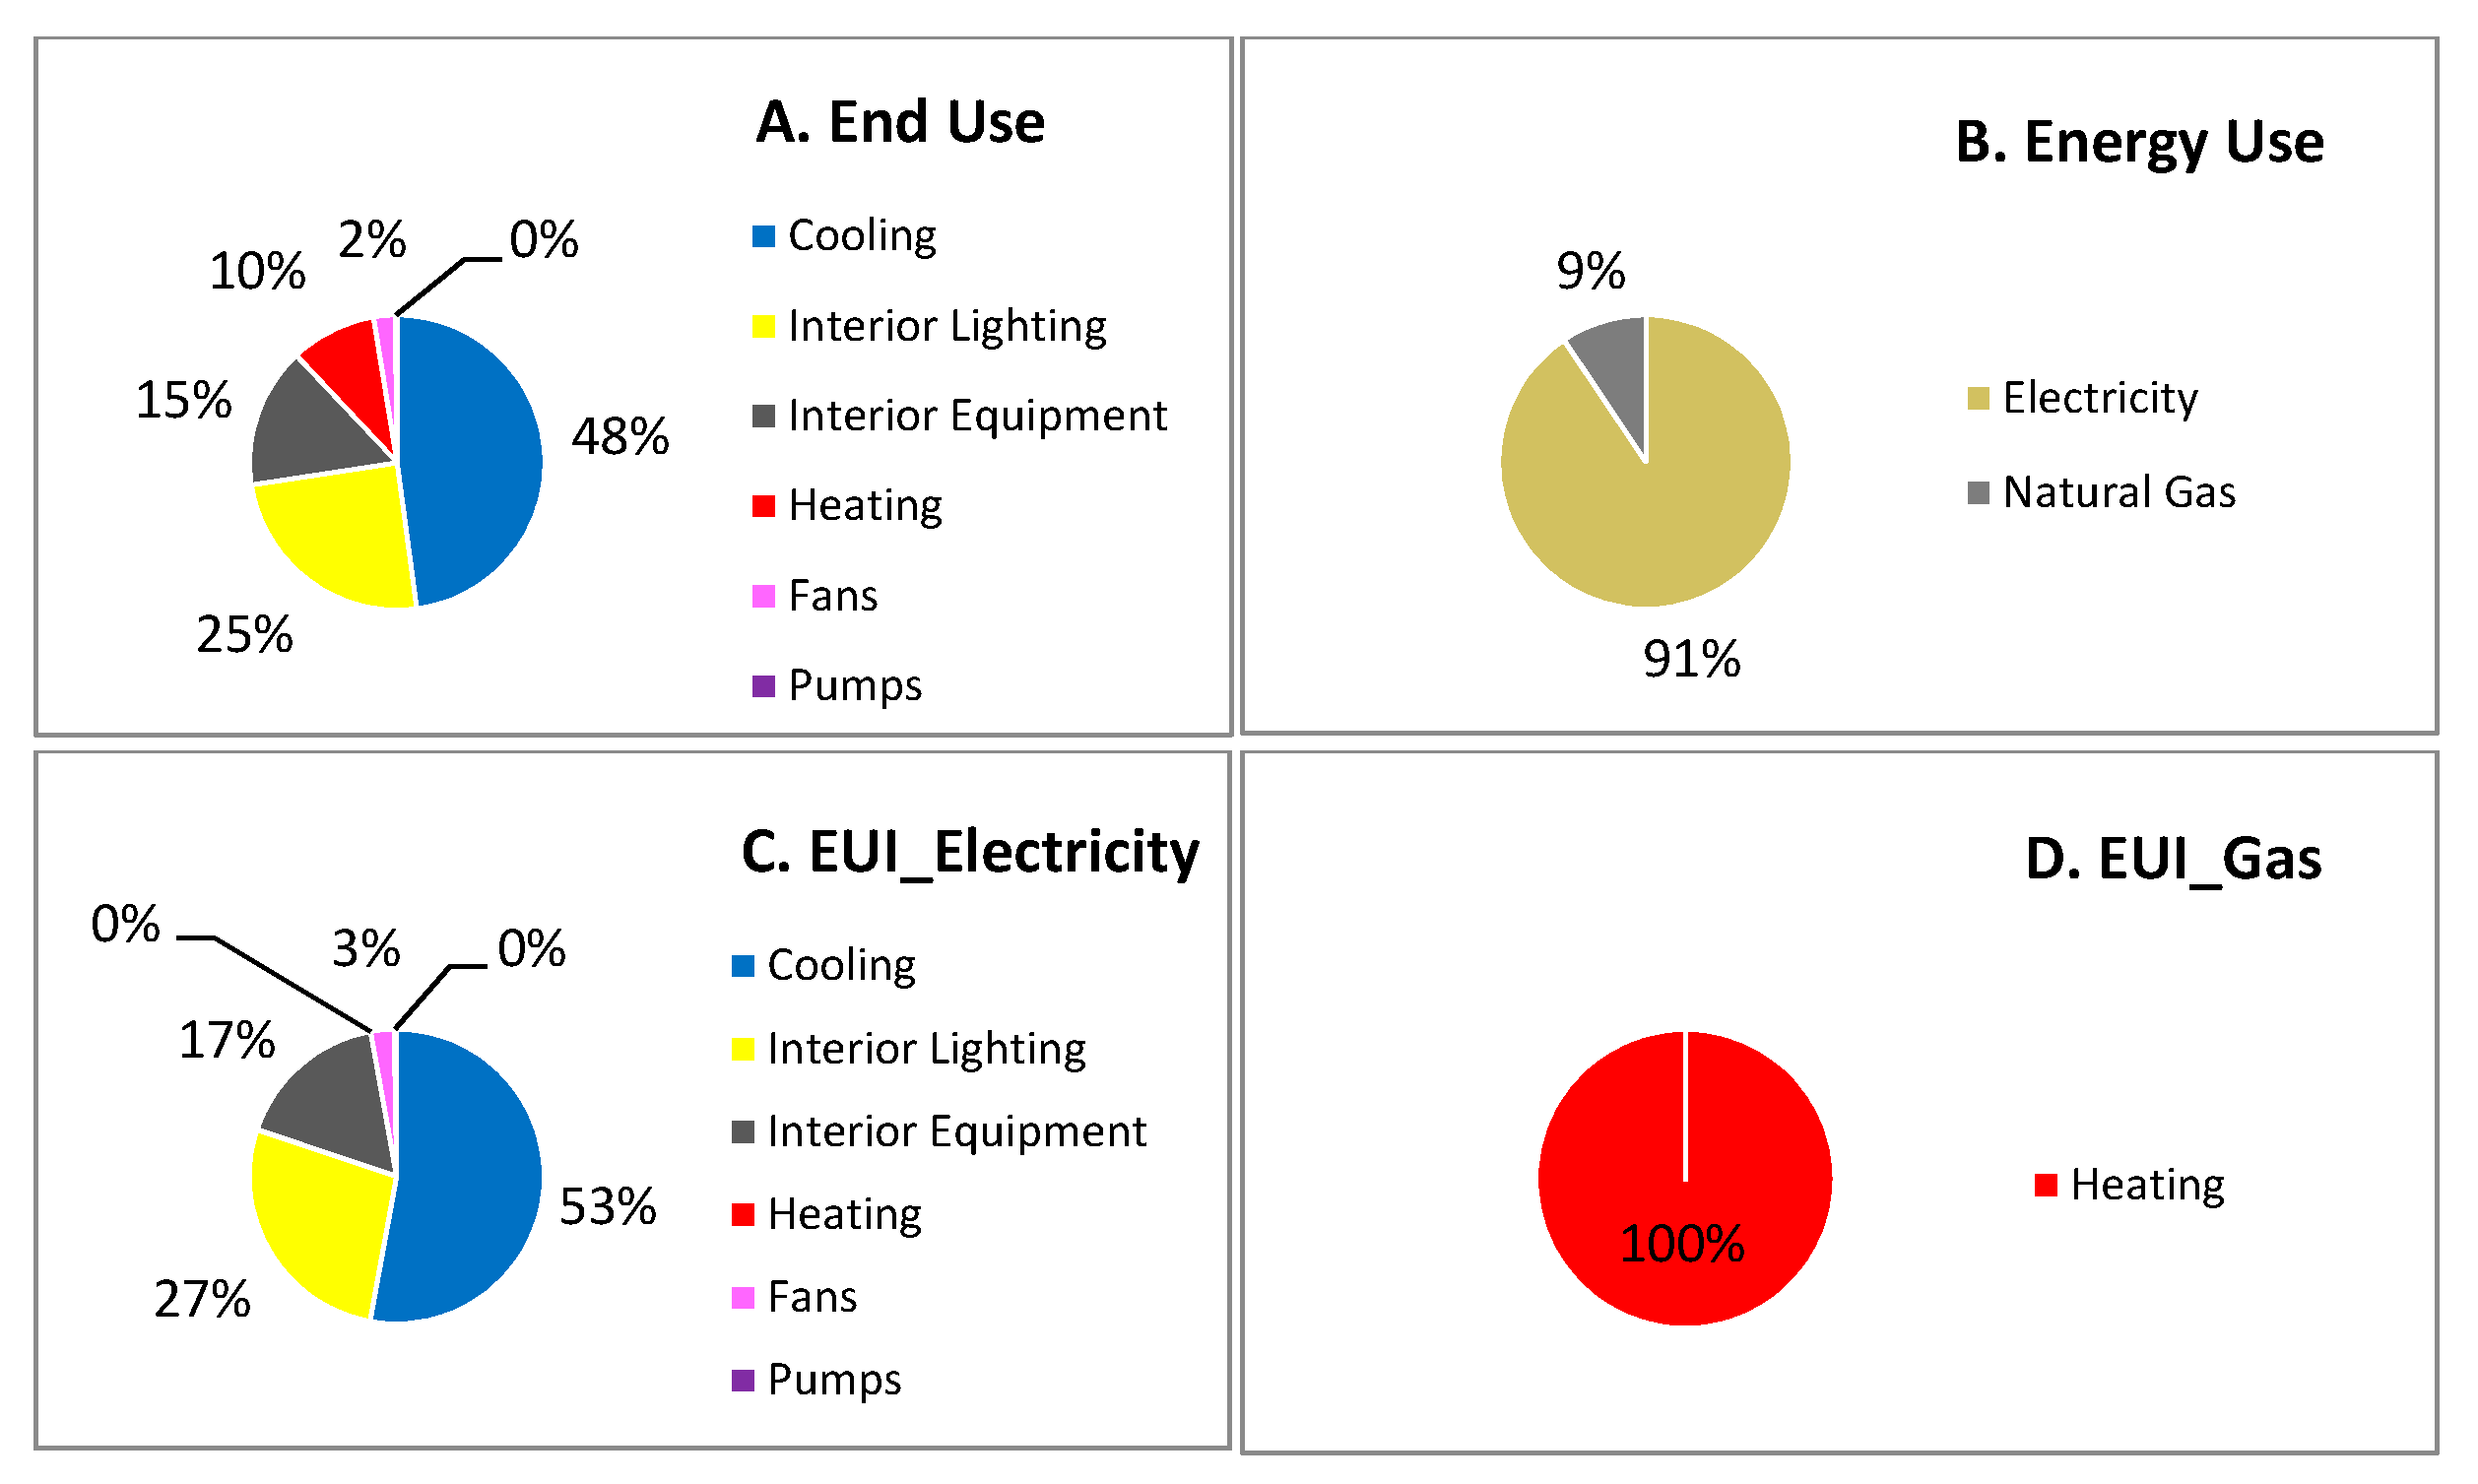
The building uses electricity and natural gas as main energy sources for operating different utilities. Considering the annual overview as in Figure 13, the electrical energy use is 91%, which is used for cooling, interior lighting, interior equipment, fans, and pumps, while the natural gas energy use is 9%, which is only used for heating. In general, cooling consumes far more energy than other utilities, comprising 57.04%, followed by interior lighting at 18.32%, and then comes interior equipment, comprising 11.81% of the energy consumption. Total electricity end-use of the various utilities is 10,814.29 GJ and natural gas end-use of heating is 1095.89 GJ. The end-use amount of subcategories for both electricity and natural gas is stated in Table 7.
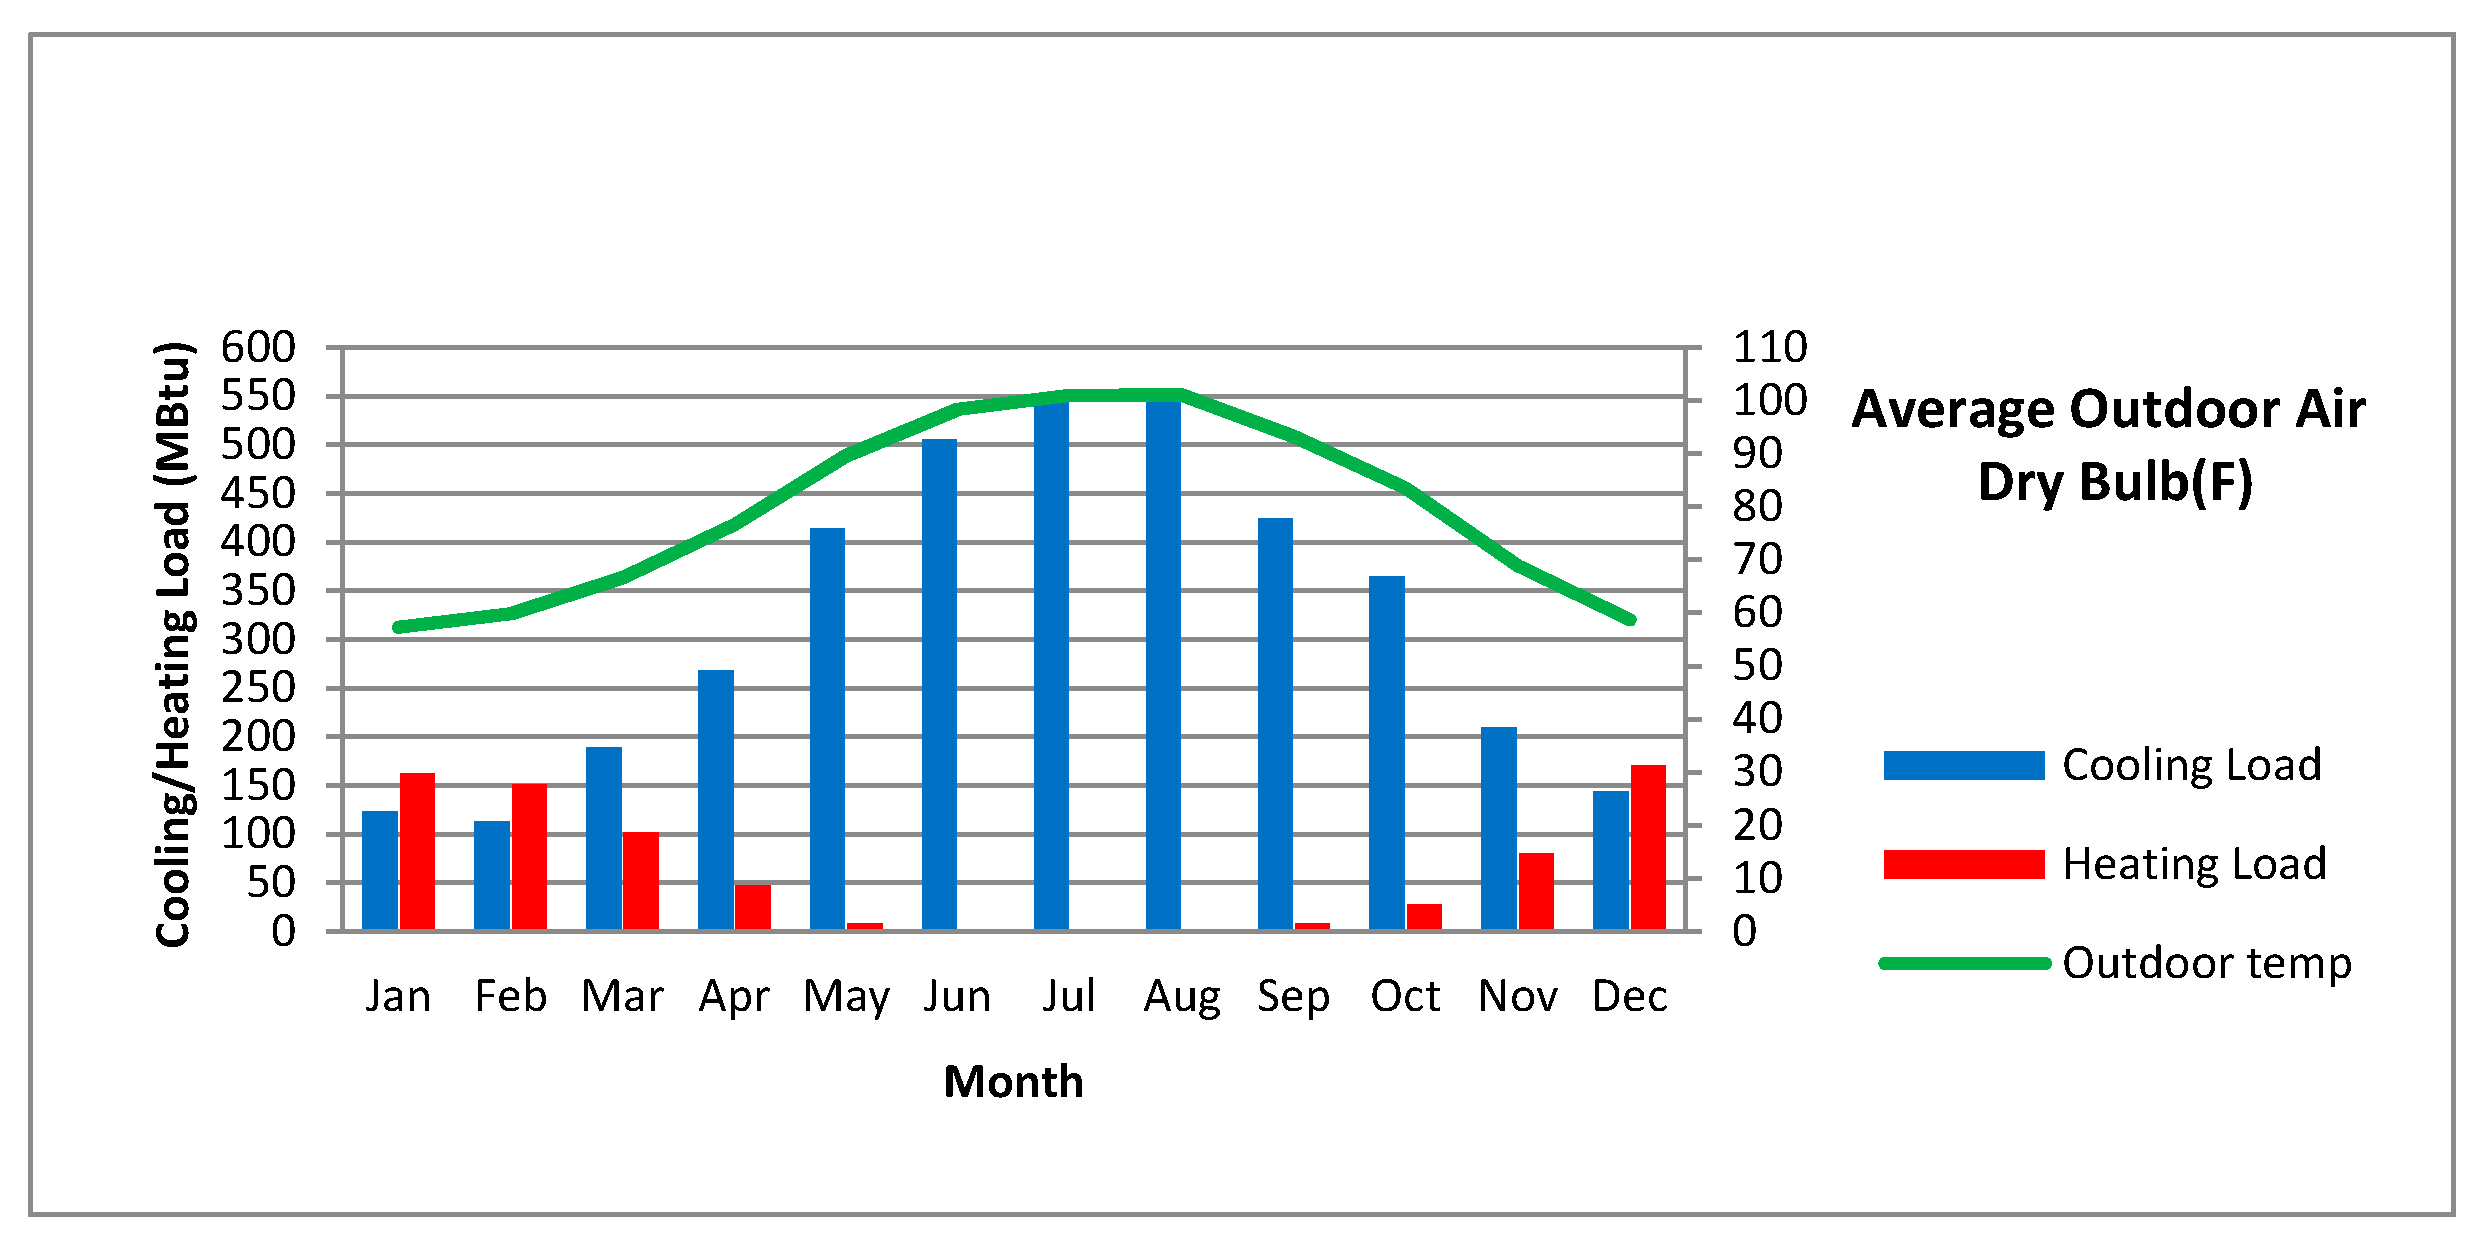
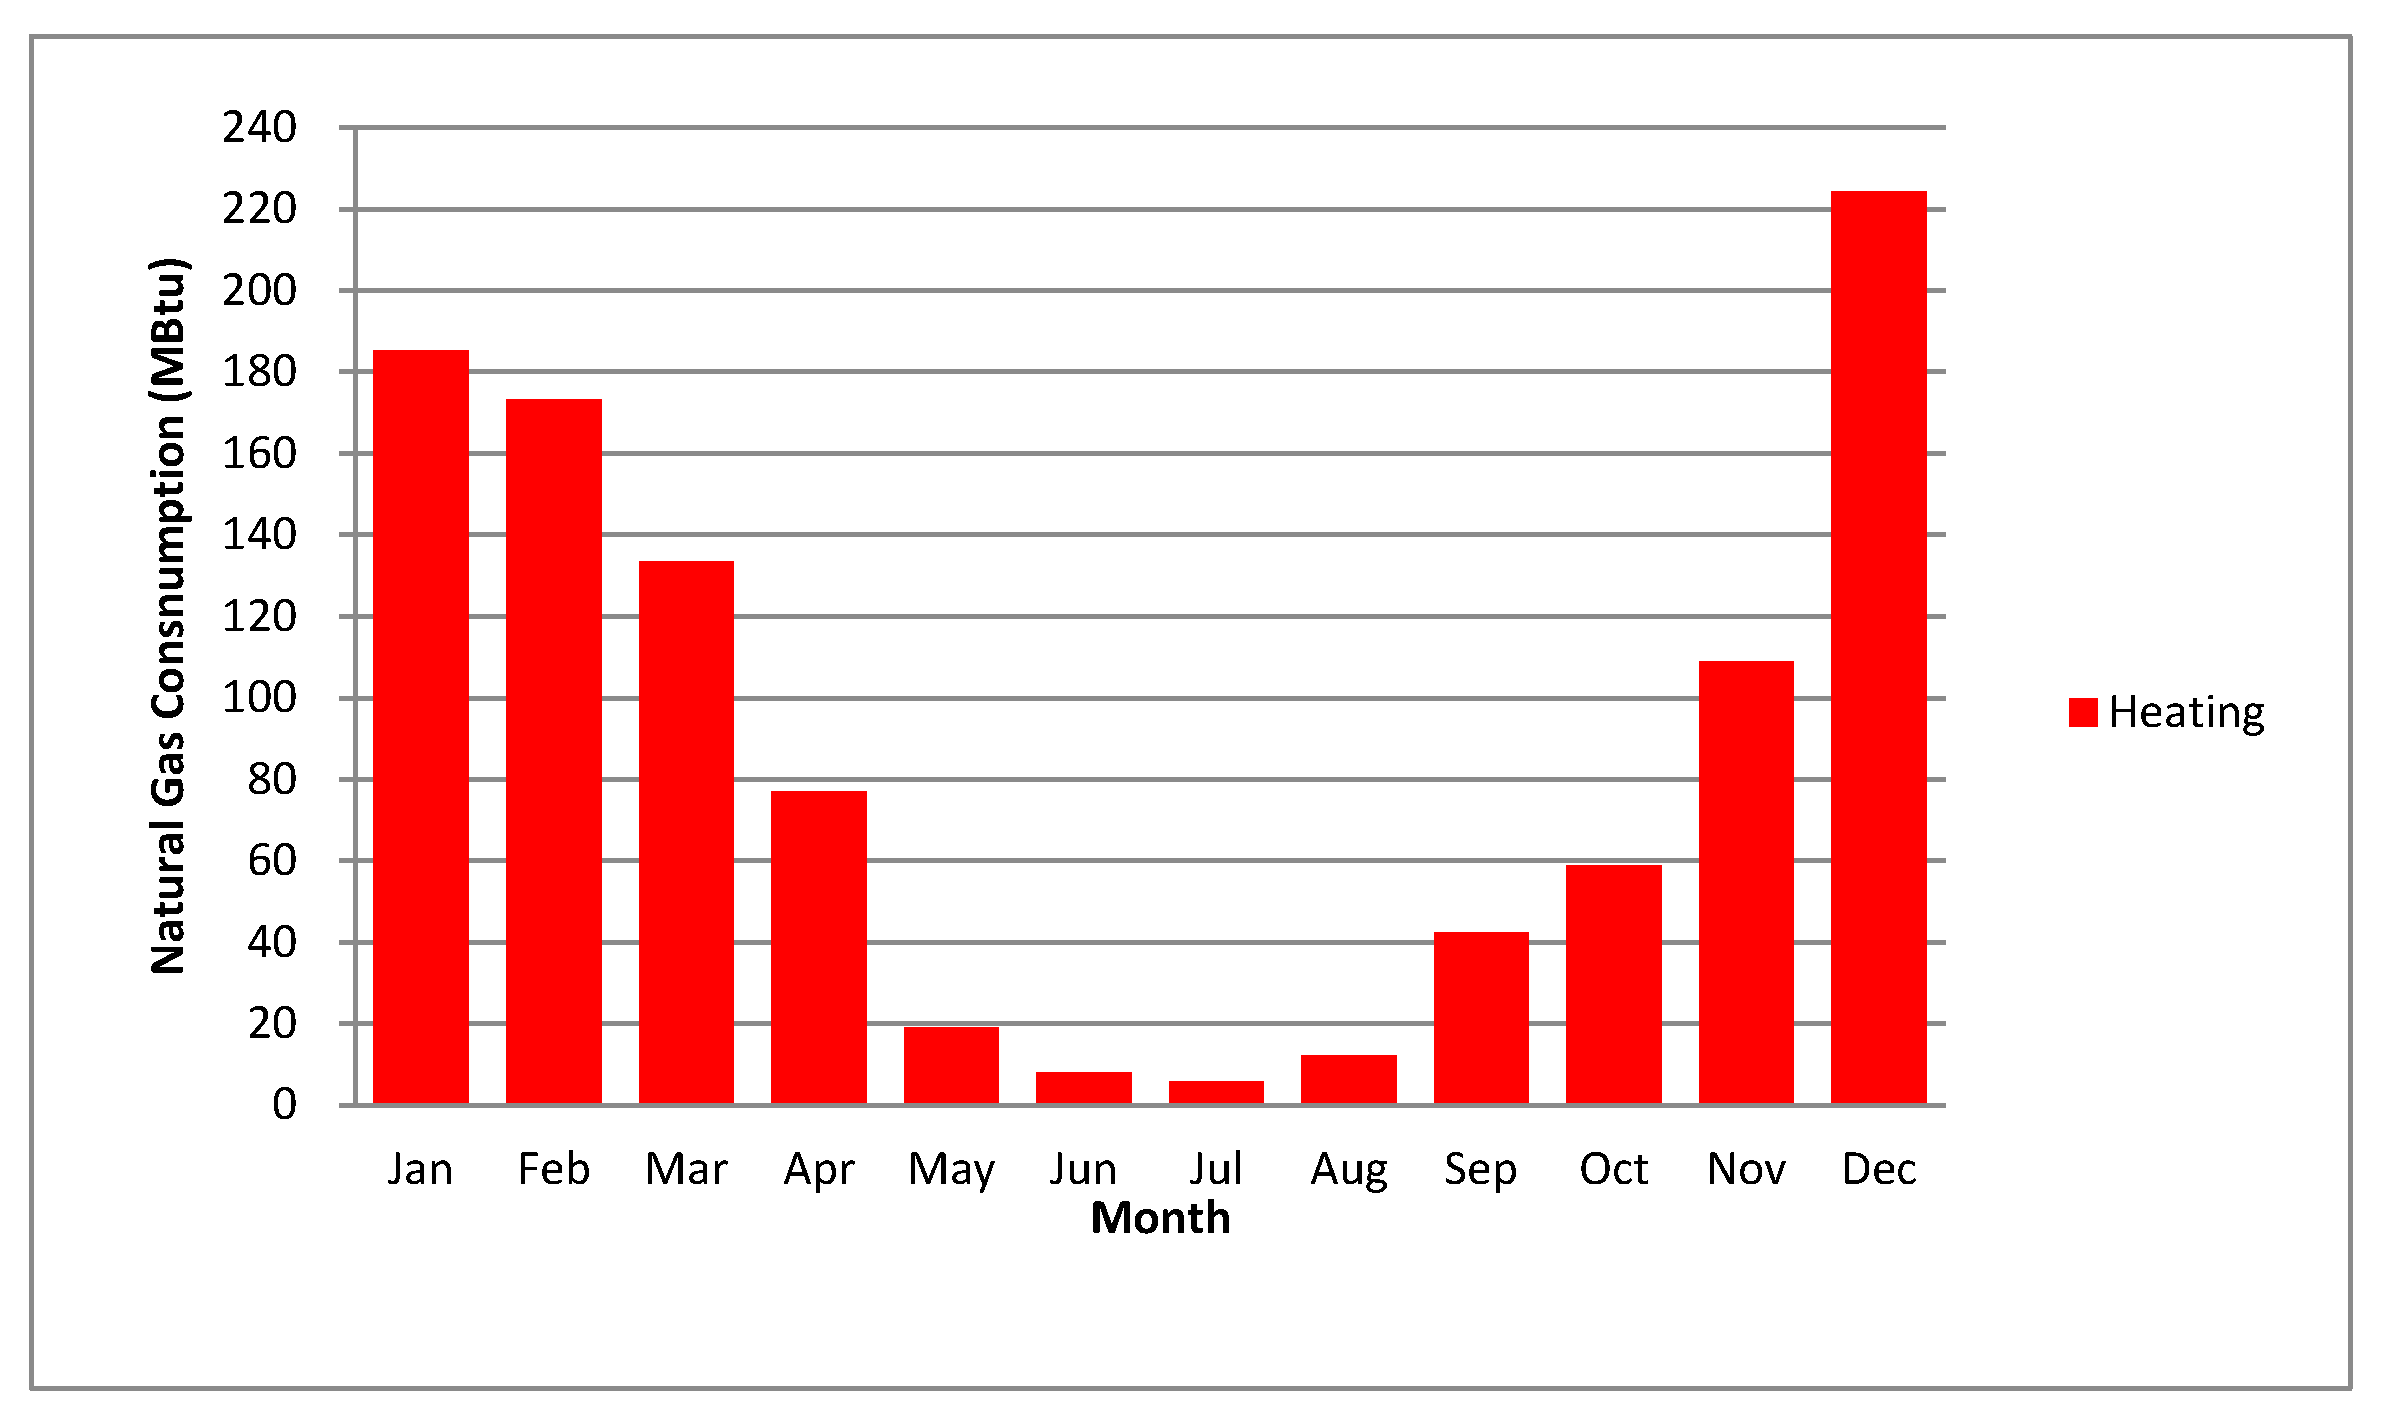
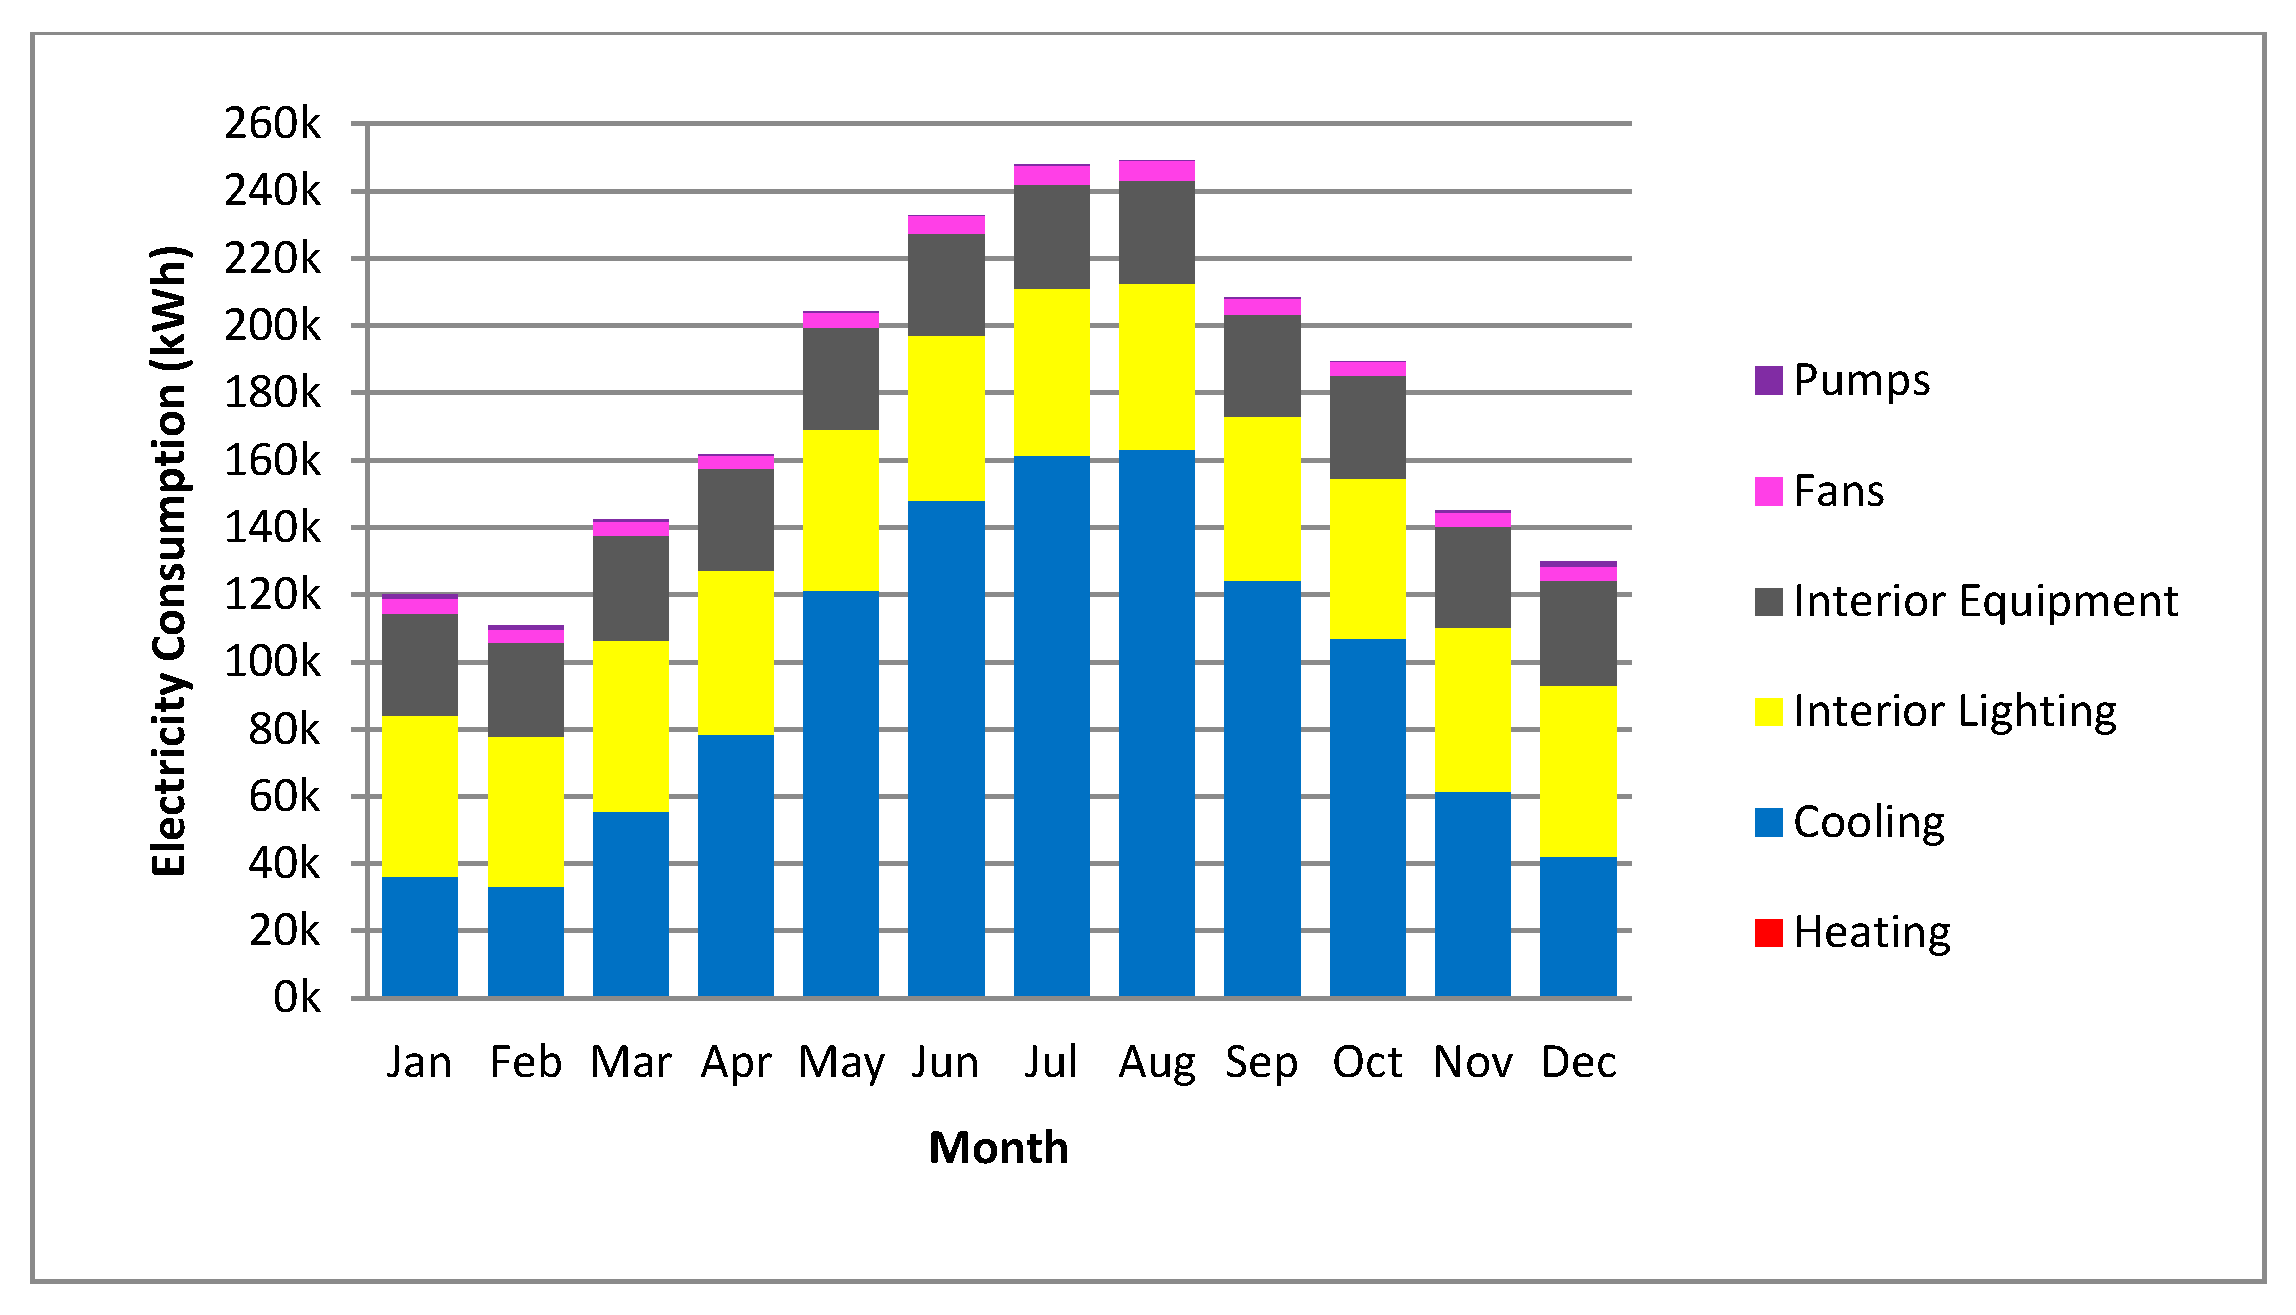
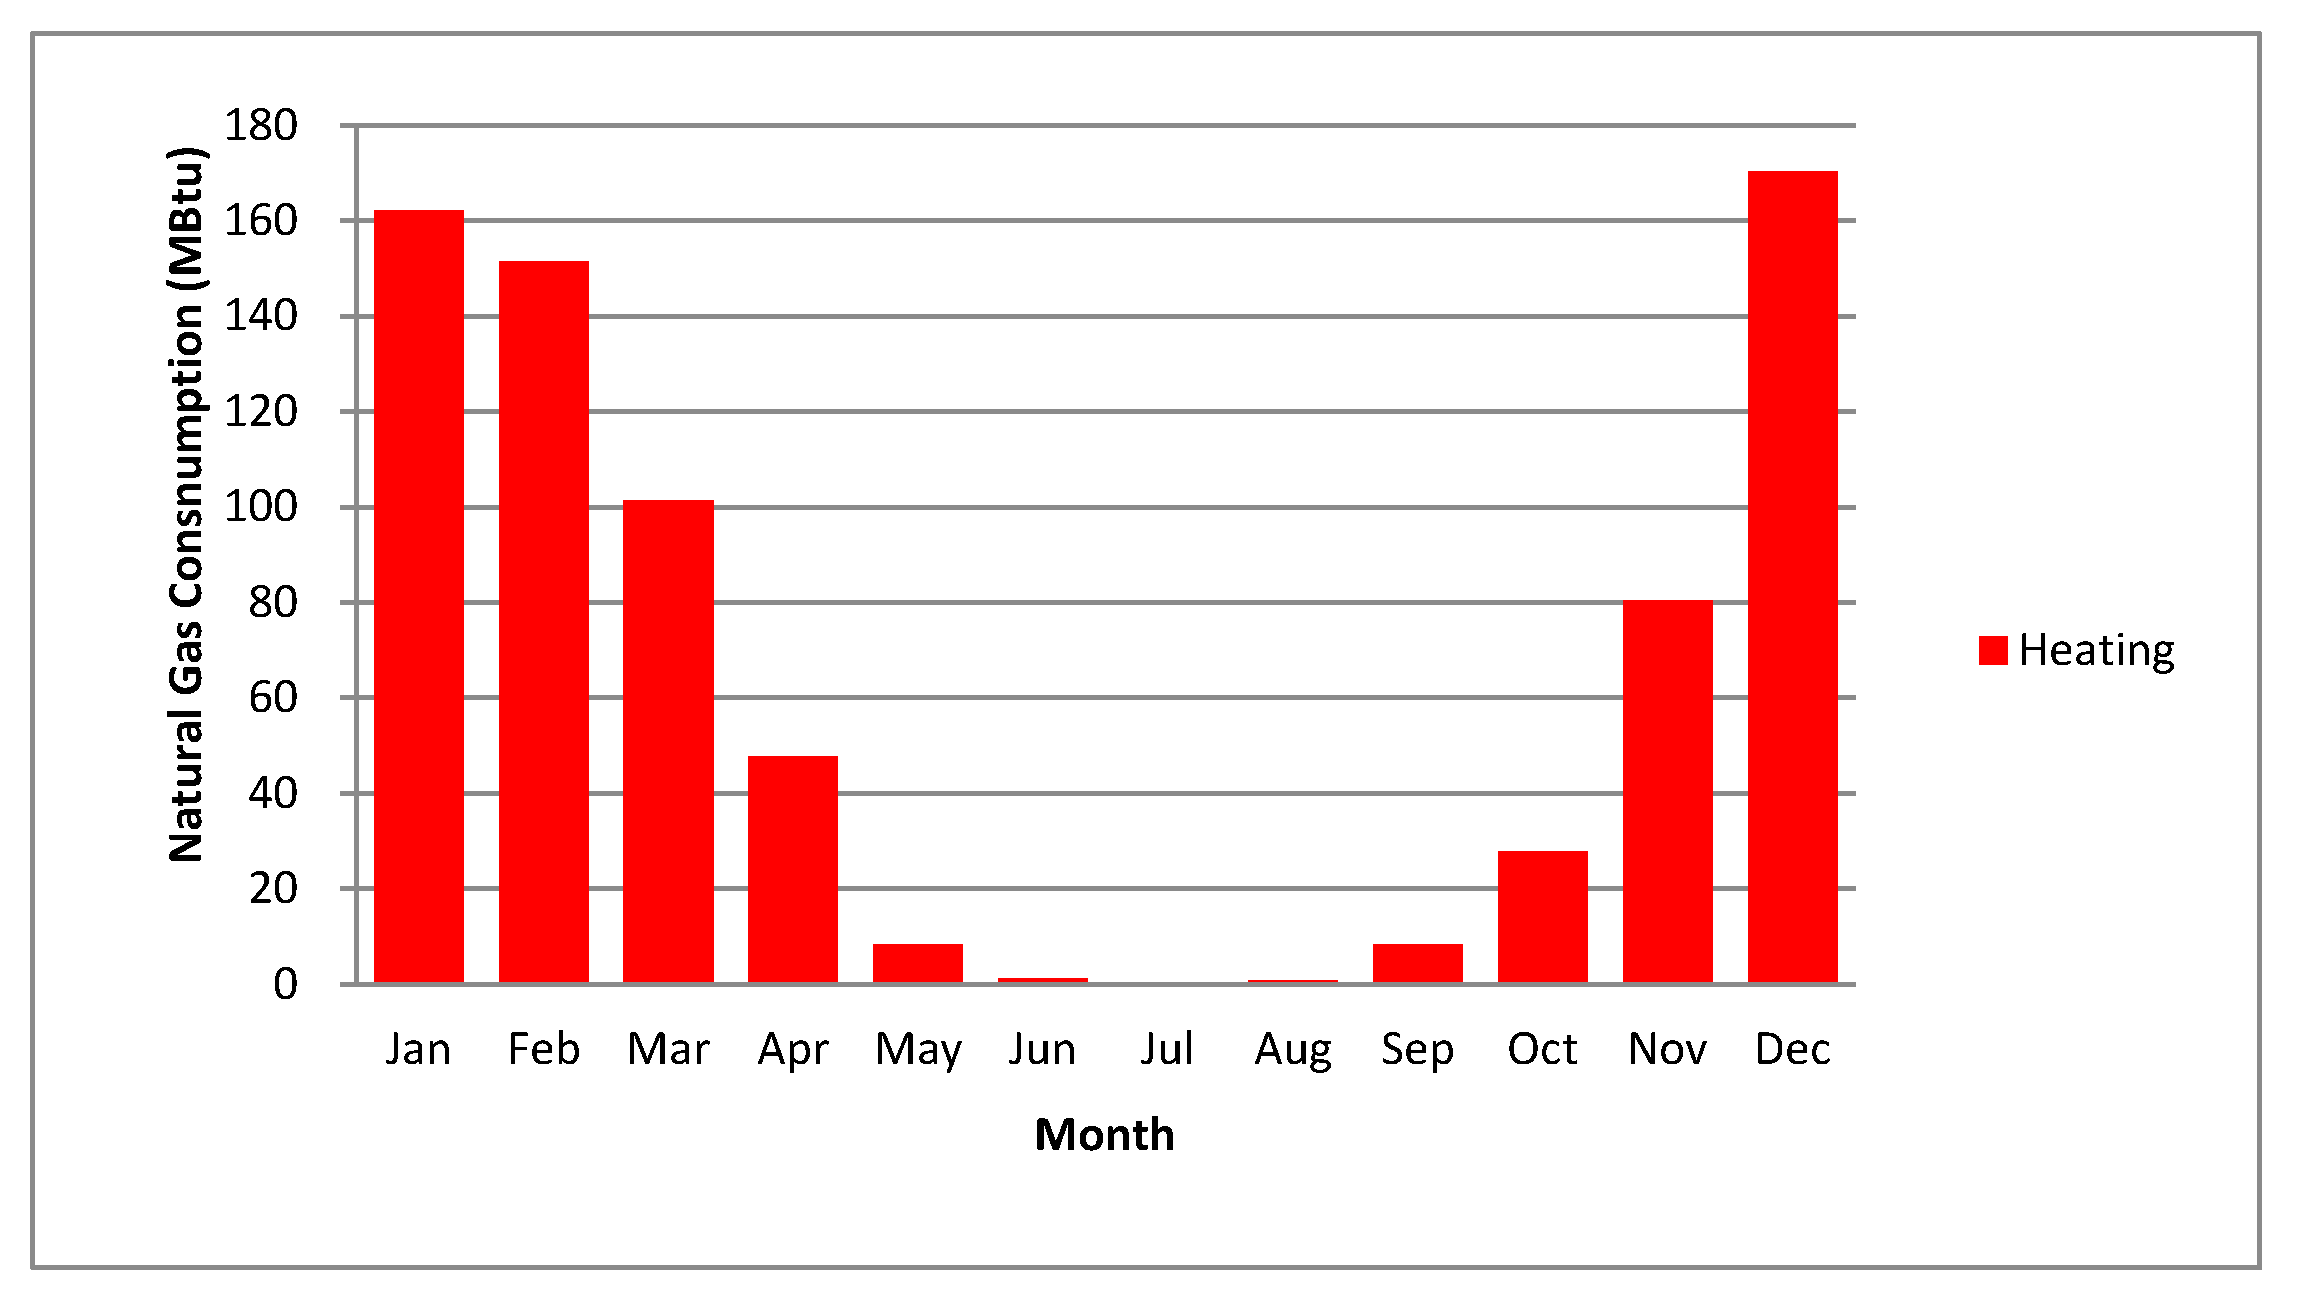
Figure 14, shows the electricity consumption per month for each particular utility. Cooling loads reach to the highest amount of consumption during the summer season, especially in July and August, which exceeds 250,000.0 kWh. In the winter season, the amount decreases to 80,000.0 kWh and below, particularly in January, February, and December. However, the amount of electricity consumption of other utilities stays nearly constant throughout the whole year. Natural gas consumption used for heating spaces exceeds 220.0 MBtu in December and 180.0 MBtu in January and February. The average natural gas consumption in March, April, October, and November is about 85.0 MBtu, as shown in Figure 15.
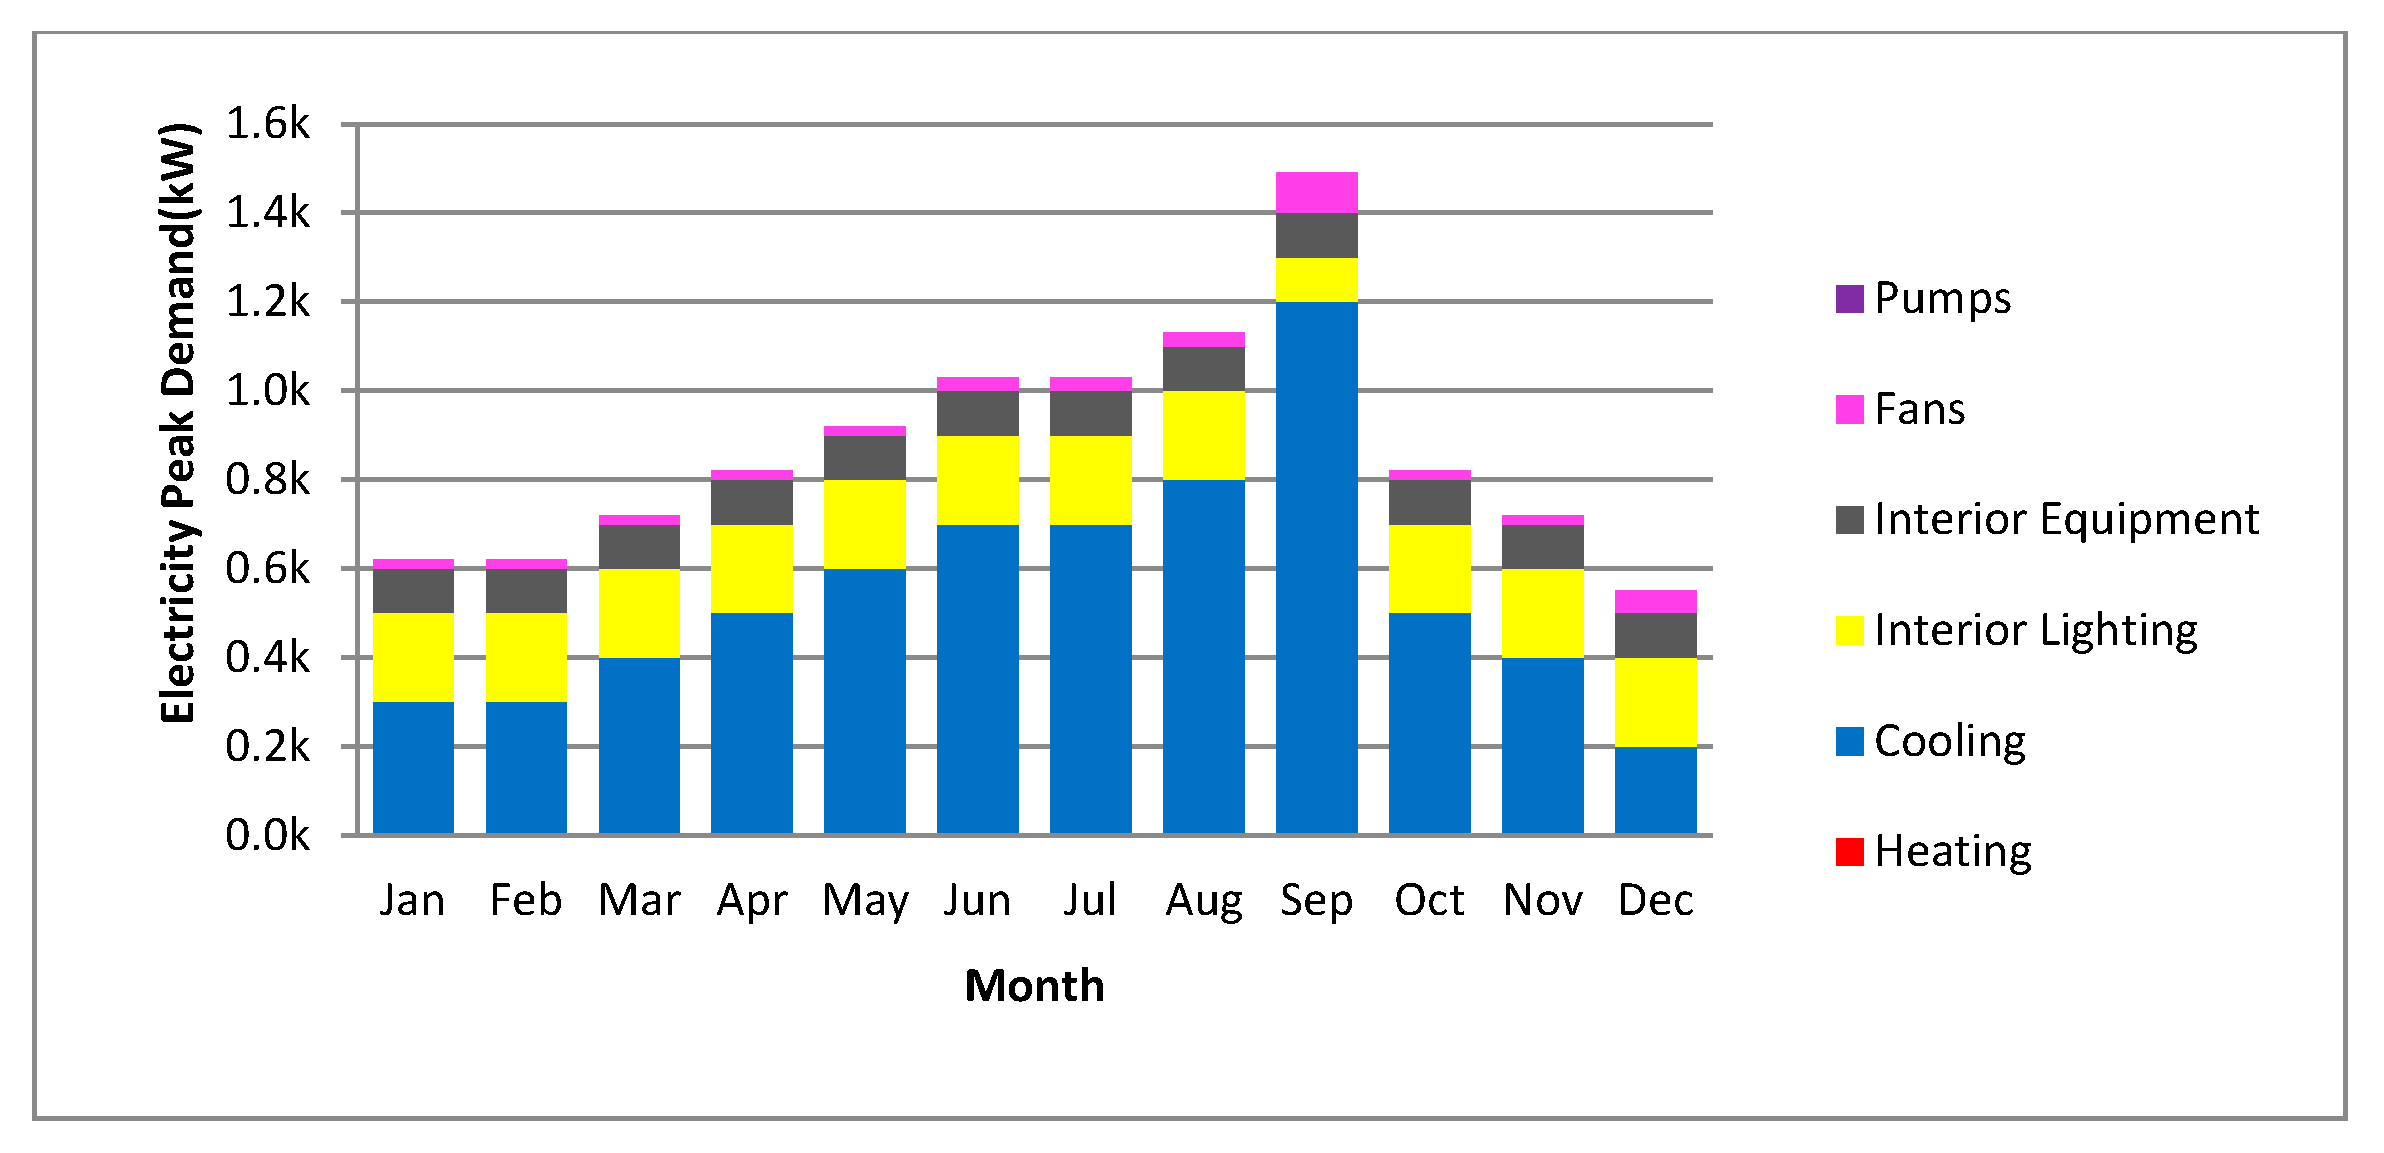
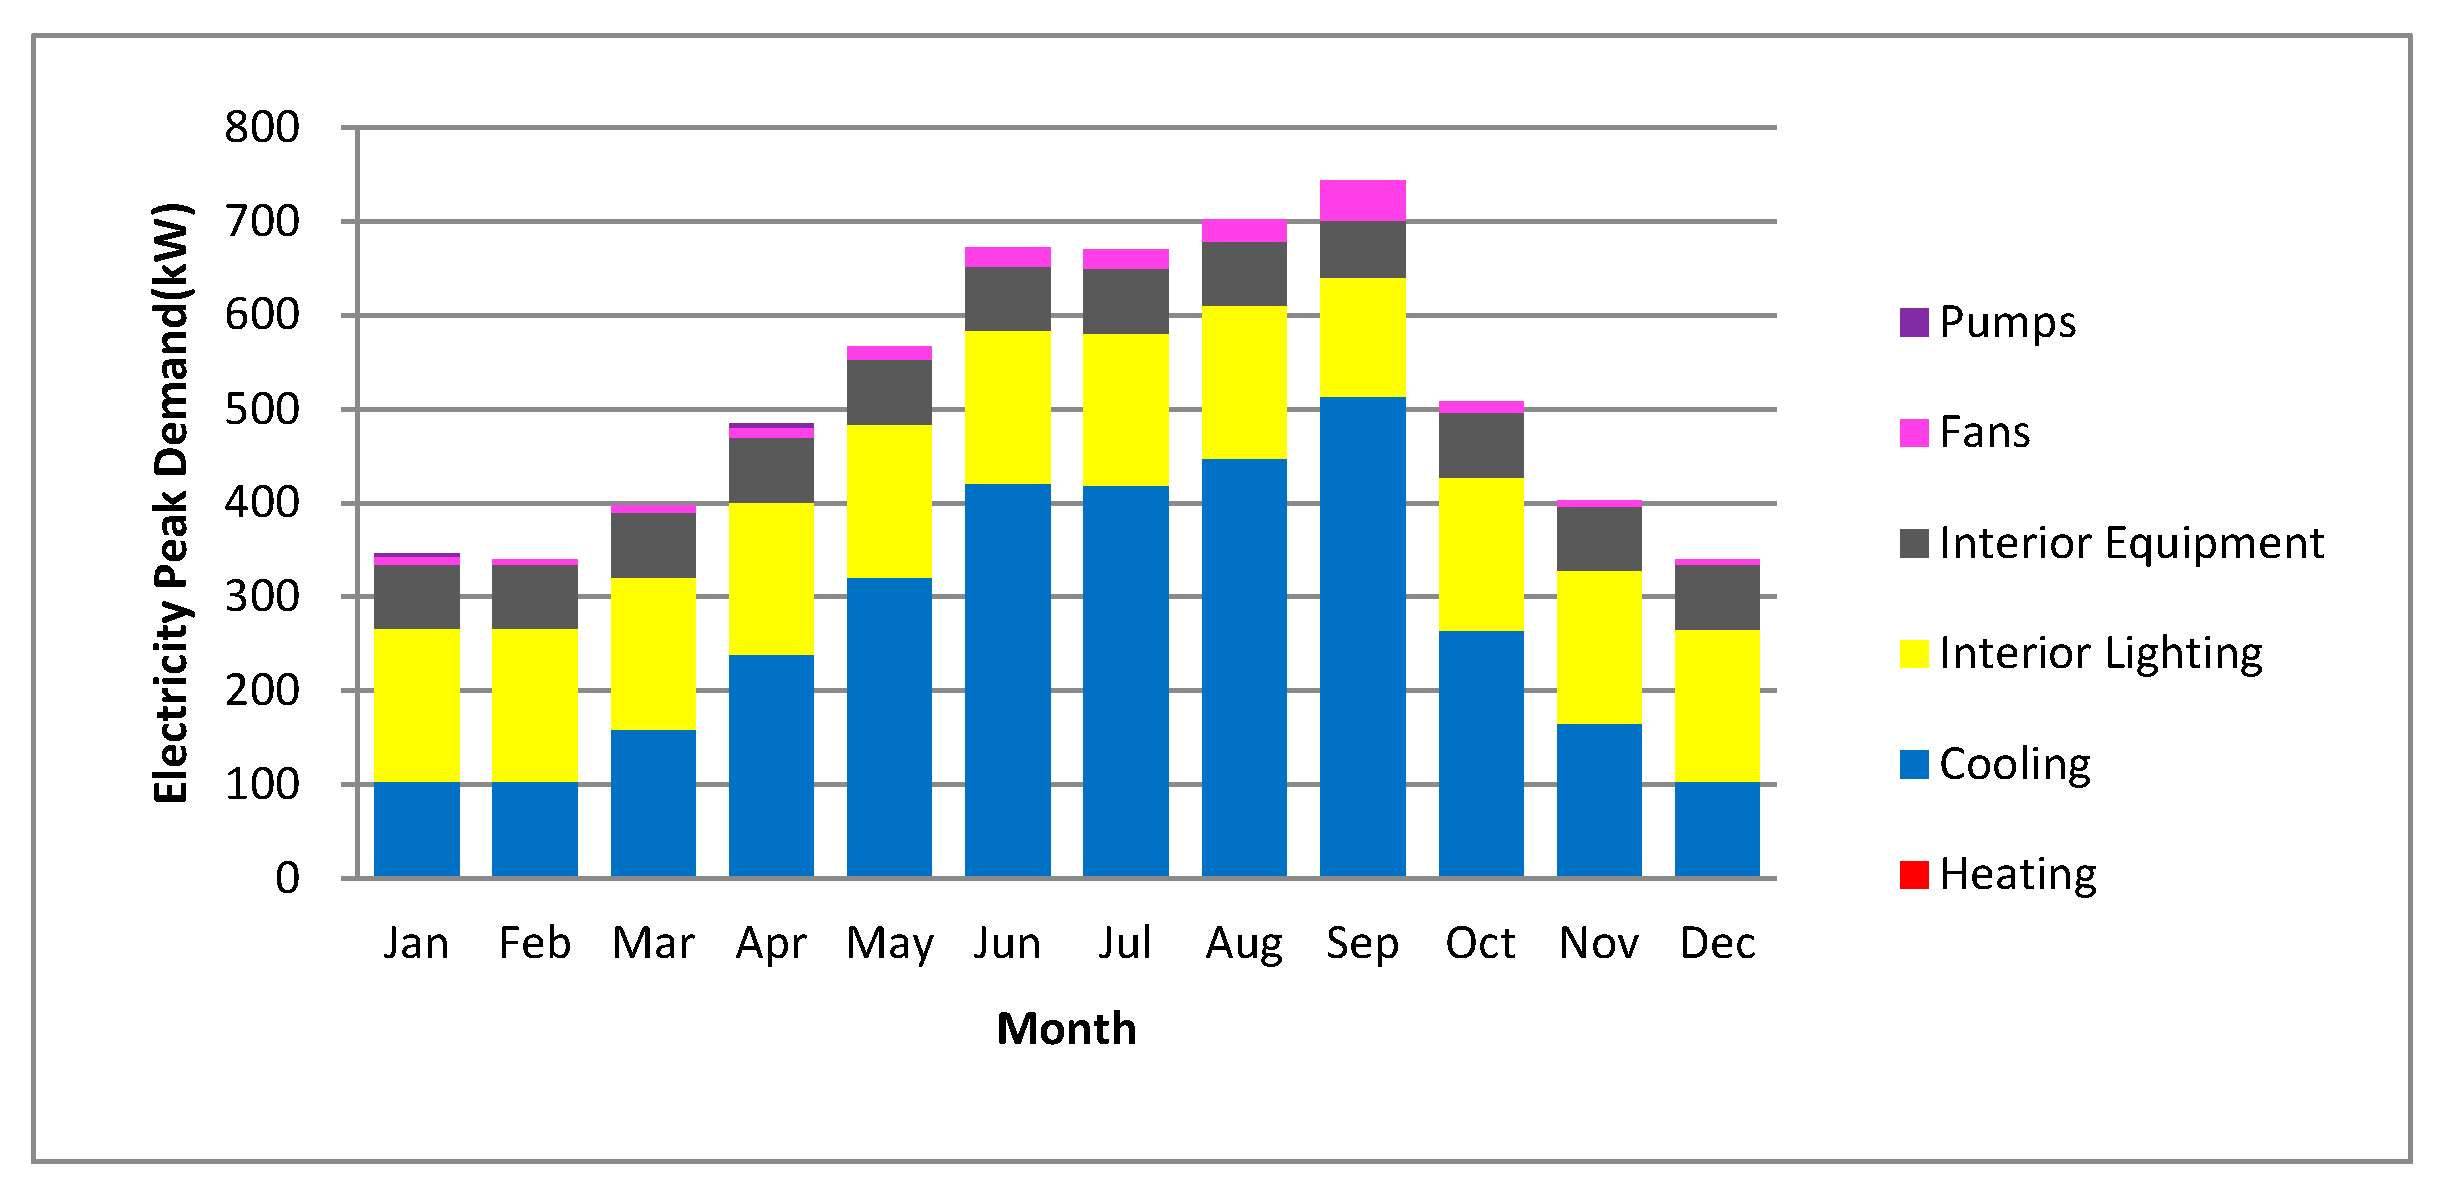
Figure 16 demonstrates monthly electricity peak demand of different energy consumption sources. The maximum cooling peak demand can be seen in September at 1150.0 kW. On the other hand, natural gas peak demands are comparable in January, February, March, November, and December, around 1700.0 kBtu/h, as presented in Figure 17.
In the summer season, cooling loads dramatically increase (800.0–900.0 MBtu) due to the very large amount of heat gain caused by the large glass envelope of the case study office building, as shown in Figure 18. Likewise, a high amount of heat losses through the glazed façade in the winter season demands a considerable amount of energy consumption (190.0–240.0 MBtu) for heating spaces. The electricity intensity of lighting is 121.15 MJ/m2, HVAC is 401.07 MJ/m2, and the natural gas HVAC intensity is 60.83 MJ/m2. The total intensity of electricity and natural gas intensities of different utilities are also presented in Table 8. The base-case energy simulation statistics emphasize the inefficiency of the design in terms of sustainability and energy-efficient criteria.
3.3. Integration of Optimized Photovoltaics in the Form of Responsive Shading Devices
The energy simulations are performed once again after the integration of the proposed technique into the case study building model using OpenStudio®. On one hand, the implementation of utilizing photovoltaics as responsive exterior shading devices can enhance the efficiency of photovoltaic cells through the intelligent system when tracking the sun’s rays. On the other hand, boosting the building’s energy efficiency and thermal comfort when shading devices profitably work as preferable solutions (i.e., they change from horizontal to vertical according to the sun’s position) for each specified orientation.
Results show that total site energy consumption after the integration method onto the office building reaches 8512.17 GJ and the energy per total building area is 493.70 MJ/m2, as shown in Table 9. Therefore, integration of the responsive shading devices saves 3398.01 MJ/m2 in total site energy consumption and 10,149.57 site energy in total source energy. This retrofit technique can turn the case study office building into an energy efficient building and reinforce the visual and thermal comfort for occupants.
The annual overview a shown in Figure 19 shows that cooling consumption shifted to 48%, interior lighting, to 25%, and interior equipment, to 15%. Thus, cooling demand decreased by 9% due to preventing sun’s harsh rays from penetrating into the building, resulting in a reduction of heat gain in summer. Total electricity end-use of the various utilities is reduced to 7710.06 GJ and natural gas end-use for heating is 802.11 GJ. The reduction in electricity end-use is 3104.23 GJ and in natural gas end-use is 293.78 GJ. The amount of total and subcategory end-uses for both electricity and natural gas is presented in Table 10, in which the major electricity amount is consumed by cooling loads (4076.73 GJ), followed by interior lighting (2102.39 GJ).
Figure 20 shows the electricity consumption per month for each particular utility. Cooling loads during July and August lowered to 162,000.0 kWh. Thence, the integration technique reduced cooling load demand by 88,000.0 kWh. In the winter season, the amount decreases to 37,000.0 kWh as an average of January, February, and December. Therefore, the reduction amount of cooling loads in winter months is 43,000.0 kWh compared to the base case results. While the amounts of the electricity demand of other utilities almost remain constant throughout the whole year. Heating loads through natural gas demand an average of 161,000.0 MBtu in January, February, and December, which means that the responsive shading devices save up to 39,000.0 MBtu in comparison with the existing building energy performances, as shown in Figure 21. Using this integration strategy, heat gain in the summer period and heat loss in the winter period are minimized, which results in very large amounts of energy saving in the base case building operations.
Figure 22 demonstrates that the maximum cooling peak demand in September decreased dramatically from 1150.0 kW in the base case simulation to 513.0 kW after the integration method, which is more than a 50% reduction in the demand. In contrast, natural gas peak demands increased from 1700.0 kBtu/h to 2600.0 kBtu/h as an average of the winter season. Additionally, it decreased from an average of 600.0 kBtu/h in the summer season of the base case to 133.3 kBtu/h in the simulation of the building after the implementation of integration, as shown in Figure 23. The statistics indicate that, due to minimizing the glazed façade exposed to the direct sunlight, which reduces the heating of interior spaces through sunlight penetration, the peak demand of the heating load increased. Moreover, profitably controlling the sunshine via the responsive shading devices reduces the peak demand in the summer period.
Integrated responsive shading devices can control solar radiation, thereby lowering the massive heat gain in summer. Looking at Figure 24, which shows the HVAC performance after the office building retrofitting, the cooling demands in summer months dramatically decreased to an average of 538.3 MBtu. Therefore, the reduction amount in cooling demand is 311.7 MBtu compared to the base case cooling demands. Additionally, these shading devices have a significant impact in reducing heat loss in the wintertime. In winter, heating demands lowered to an average of 161.0 MBtu, while an average of 215.0 MBtu in the base case HVAC performance was recorded.
Electricity intensity of lighting approximately stayed at the same amount of 121.94 MJ/m2, whereas, HVAC electricity intensity reduced to 249.20 MJ/m2 and natural gas intensity to 46.52 MJ/m2. The reduction of the HVAC electricity intensity is 151.87 MJ/m2 and that of natural gas is 14.31 MJ/m2. Total intensity of electricity and natural gas intensities of different utilities are also stated in Table 11. The simulation statistics of the retrofitted office building emphasize that there is a considerable amount of energy savings and endeavours toward energy efficiency. In the long term, this retrofit strategy can be extremely beneficial in reducing utility bills and GHG (greenhouse gas) emissions.
3.4. The Amount of Generated Electricity from PV Surfaces
The percentages of photovoltaic annual shadings and total system losses were calculated using Ladybug_Sunpath Shading (SunpathShading) and Ladybug_DC to AC derate factor (DCtoACderateFactor). Table 12 statistics articulate that more annual shadings (approximately 37%) occur at the east and west façades as a reason for the huge shading amount of the building, as well as self-shadings among shading elements. Conversely, less annual shading (approximately 11%) appear at the south façade due to less context shading. The amount of generated electricity (kWh/year) was recorded for each orientation (east, south, and west) through employing Ladybug renewables. Table 13 interprets that the south façade produces more electricity (160,304.2698 kWh/year) compared to east (101,483.6381 kWh/year) and west (102,065.8843 kWh/year) orientations due to the intensity of solar radiation during noontime, and less annual shadings caused by the context; thus, there are fewer photovoltaic system losses. The whole PV system integration, with a total PV surface area of 1568.4 m2, produces 363,853.7922 (kWh/year) equal to 1309.8736 GJ. The annual site energy use of the office building after the integration of responsive shading devices was lowered to 8512.17 GJ; this means that this system can provide around 15.39% of the electricity demand for operating the building. Fully producing electricity demand from solar renewable energy can be achieved through installing more arrays on the roof or site, or through implementing other renewable energy sources. Moreover, this integration system saves up to $43,662.4550 (US Dollar) annually through generating electricity from free solar energy considering that the cost of electricity ($/kWh) is $0.12.
Validation of Photovoltaic-Generated Electricity
In order to examine the accuracy of the amount of PV generated electricity through the Ladybug simulation and based on the PV total area (1568.4 m2), the output calculations are executed using NREL’s PVWatts® Calculator [30]. Offered by the National Renewable Energy Laboratory, the PV Watts® Calculator estimates the energy production of photovoltaic energy systems around the globe. Firstly, the system needs the location of the installation to find a suitable weather file data; next, the system size (kW) is required, which can be calculated through the equation below according to NREL. The module type indicates the approximate module efficiency to be used in the equation of the system size and standard crystalline silicon with 15% efficiency chosen for estimations, as it is cheaper than the premium one, as shown in Table 4. Therefore, utilizing Equation (3), the photovoltaic system size is calculated as 235.26 kW.
where S is the PV system size in , A is the array area , and E is the module efficiency .
Having all the parameters required by the system, the inputs were added into the calculator to discover the annual electricity produced by the PV integration system through the responsive shading devices (Table 14). Table 15 shows the monthly solar radiation per day and monthly AC energy produced. The total annual AC energy generated through the system is approximately 529,896.0 (kWh/year), while the amount was recorded as 363,853.7922 (kWh/year) in the simulation of the Ladybug model. The difference refers to the fact that the PV Watts® Calculator calculates the generated amount of all three orientations simultaneously, whereas only two orientations of the case study building receive direct solar radiation at one time. Therefore, the simulation results of Ladybug renewables are more accurate than the PV Watts® Calculator in which the building’s shading, self-shading among the components and other context obstacles that prevent direct solar radiation onto the panels are considered.
4. Conclusions
This study presented an integration of photovoltaics as responsive shading devices as a retrofit strategy for an energy efficient office building. The intended objectives were progressed through four phases of empirical studies. Firstly, a prototype-based experiment was conducted to explore the percentages increase of efficiency due to using two-axis tracking PV system compared to the fixed installation. Next, a computer simulation was performed to measure the energy performance of the base case of a selected case study, the T1 Empire World office building in Erbil. Then the same method was used to observe the demand reduction after the integration of this technique onto the base case. Finally, Ladybug simulation was performed to expose the amount of electricity production through the PV-integrated system.
The statistics proved that this retrofit method has reduced total site energy consumption by 33.2% compared to the existing building performance. Total electricity end-use of the various utilities was lowered by 33.5%, and the total natural gas end-use of heating demand was reduced by 30.9%. Therefore, the percentage reduction in electricity cooling demand in July and August was 42.7% due to minimizing heat gain in summer through blocking the sun’s harsh rays from penetrating into the interior spaces of the building. Due to minimizing the heating loss in winter, natural gas demand consumed for heating spaces decreased by 21.6%. In the summer season, HVAC electricity cooling load demand was lowered by 44.9%, and in the winter season HVAC natural gas heating load was reduced by 28.7%.
The responsive shading device technique can maximize the efficiency of PV cells by 36.8% compared to the fixed installation. Thus, the proposed number and area of the integrated PV for responsive shading devices in this retrofit experiment can provide up to 15.39% of the electricity demand for the building operation. By increasing the PV area on the building’s façade, roof, or site, the full electricity demand can be generated. Alternatively, other retrofit strategies can be applied to the building to transform it into an energy-efficient office building.
In general, integrating PV in the form of responsive shading devices has multiple benefits. Starting from being extremely efficient and viable in generating sustainable alternative energy, which is the global growing concern of today’s sustainable development, it makes office buildings energy-efficient via minimizing operational demand and, through decreasing total energy consumption, a significant amount of the carbon footprint can be reduced. Moreover, architects and designers can deal with these integrated responsive PV shading devices as building elements to enhance the aesthetic of buildings within the responsive façade design and dynamic architecture framework.
Further research is needed to investigate the impact of this retrofit technique on the building’s daylight performance and calculate the reduction of greenhouse gas (GHG) emissions through producing electricity from solar power as a green and renewable energy source. Authors suggest an economic feasibility study to explore the validation of this proposed system compared to the fixed installation system or one-axis (tilt or azimuth) tracking system.
Author Contributions
Hardi K. Abdullah and Halil Z. Alibaba conceived and designed the concept and outline for the article; Hardi K. Abdullah performed the experiments, simulations, and wrote the manuscript; Halil Z. Alibaba supervised, provided sources, comments, and suggestions for the paper.
Conflicts of Interest
The authors declare no conflict of interest.
References
- Alibaba, H.Z. Determination of Optimum Window to External Wall Ratio for Offices in a Hot and Humid Climate. Sustainability 2016, 8, 187. [Google Scholar] [CrossRef]
- Energy Information Administration (EIA). The Annual Energy Review 2006; EIA: Washington, DC, USA, 2006.
- Lotfabadi, P.; Alibaba, H.Z.; Arfaei, A. Sustainability as a Combination of Parametric Patterns and Bionic Strategies. Renew. Sustain. Energy Rev. 2016, 57, 1337–1346. [Google Scholar] [CrossRef]
- Energy Efficiency and Conversation Cleaning House (EECCHI). Kantor Hemat Energi, DirektoratJenderal Energi Baru Terbarukan dan Konservasi Energi; EECCHI: Jakarta, India, 2011. [Google Scholar]
- AbuGrain, M.Y.; Alibaba, H.Z. Optimizing Existing Multistory Building Designs towards Net-Zero Energy. Sustainability 2017, 9, 399. [Google Scholar] [CrossRef]
- Rey, E. Office building retrofitting strategies: Multicriteria approach of an architectural and technical issue. Energy Build. 2004, 34, 367–372. [Google Scholar] [CrossRef]
- Barsoum, N. Implementation of a Prototype for a Traditional Solar Tracker System. Glob. J. Technol. Opt. 2011, 2, 49–56. [Google Scholar]
- Bahr, W. Integration of Shading Devices and Photovoltaic Panels into Existing Building Facades. In Proceedings of the Green Retrofit Conference, Knowledge Village, Dubai, UAE, 15–16 December 2009. [Google Scholar]
- Miran, F.D.; Abdullah, H.K. Evaluation of the Optimal Solar Shading Devices for Enhancing Daylight Performance of School Building. (A case study of semi-arid climate–Erbil city). ZANCO J. Pure Appl. Sci. 2016, 28, 580–598. [Google Scholar]
- Mandalaki, M.; Konstantinos, Z.; Theocharis, T.; Alexandros, V. Assessment of fixed shading devices with integrated PV for efficient energy use. Sol. Energy 2012, 86, 2561–2575. [Google Scholar] [CrossRef]
- Ji, J.; Luo, C.; He, W.; Yi, H.; Pei, G. A Study of Pv-Shading Combined with Building. In Proceedings of the ISES World Congress 2007 (Vol. I–Vol. V); Goswami, D.Y., Zhao, Y., Eds.; Springer: Berlin/Heidelberg, Germany, 2009. [Google Scholar]
- Kim, J.-J.; Sung, K.J.; Yoon, S.C.; Jeong, T.K. Optimization of Photovoltaic Integrated Shading Devices. Ind. Built Environ. 2010, 19, 114–122. [Google Scholar] [CrossRef]
- Jung, S.K. Optimal Control Methods for PV-integrated Shading Devices. Ph.D. Thesis, University of Michigan, Ann Arbor, MI, USA, 2014. [Google Scholar]
- Turner, J.A. A realizable renewable energy future. Science 1999, 285, 687–689. [Google Scholar] [CrossRef] [PubMed]
- Qiu, Z.; Chow, T.; Li, P.; Li, C.; Ren, J.; Wang, W. Performance evaluation of the photovoltaic double-skin façade. In Proceedings of the 11th International IBPSA Conference (BS’2009), Glasgow, UK, 27–30 July 2009. [Google Scholar]
- Aschehoug, Ø.; Hestnes, A.G.; Matusiak, B.; Lien, A.G.; Stang, J.; Bell, D. BP Amoco Solar Skin—A Double Façade with PV. In Proceedings of the ISES EuroSun, Copenhagen, Denmark, 19–22 June 2000. [Google Scholar]
- Taylor, R.H. Alternative Energy Sources for the Centralized Generation of Electricity; Adam Hilga Ltd.: Bristol, UK, 1983. [Google Scholar]
- Davidson, S. Grasshopper 3D 0.9.76.0 Release. Algorithmic Modelling for Rhino. Available online: http://www.grasshopper3d.com/ (accessed on 15 June 2016).
- McNeel, R. Rhinoceros 4.0 SR9 Release. Design, Model, Present, Analyze, Realize. Available online: https://www.rhino3d.com/ (accessed on 15 June 2016).
- Arduino Software (IDE). Arduino Uno. A Microcontroller Board Based on the ATmega328P (Datasheet). Available online: https://www.arduino.cc/ (accessed on 03 July 2016).
- Payne, A. Firefly 1.0.0.70 Release. Visual Programming Language. Available online: http://www.fireflyexperiments.com/ (accessed on 25 June 2016).
- Empire World-Erbil. Building the Future. Available online: http://empireiraq.com/new/ (accessed on 7 August 2016).
- Nimlyat, P.S.; Dassah, E.; Allu, E.L.A. Computer Simulations In Buildings: Implications For Building Energy Performance. Computer 2014, 4, 56–62. [Google Scholar]
- Lam, J.C.; Hui, S.C. Computer simulation of energy performance of commercial buildings in Hong Kong. In Proceedings of the Third International Conference of the International Building Performance Simulation Association, Adelaide, Australia, 16–18 August 1993. [Google Scholar]
- National Laboratory of the U.S. Department of Energy, Office of Energy Efficiency and Renewable Energy (NREL). Operated by the Alliance for Sustainable Energy, LLC. OpenStudio 2.0.0 Release. Available online: https://www.openstudio.net/ (accessed on 22 December 2016).
- National Laboratory of the U.S. Department of Energy, Office of Energy Efficiency and Renewable Energy (NREL). Operated by the Alliance for Sustainable Energy, LLC. EnergyPlus v8.6.0 Release. Available online: https://energyplus.net/ (accessed on 27 September 2016).
- Weaver, E.; Long, N.; Fleming, K.; Schott, M.; Benne, K.; Hale, E. Rapid Application Development with OpenStudio. In Proceedings of the 17th biennial ACEEE Conference on Energy Efficiency in Buildings, Pacific Grove, CA, USA, 12–17 August 2012. [Google Scholar]
- Guglielmetti, R.; Macumber, D.; Long, N. OpenStudio: An open source integrated analysis platform. In Proceedings of the 12th Conference of International Building Performance Simulation Association, Sydney, Australia, 14–16 November 2011. [Google Scholar]
- Guan, L.-S. The Implication of Global Warming on the Energy Performance and Indoor Thermal Environment of Air-Conditioned Office Buildings in Australia. Ph.D. Thesis, Queensland University of Technology, Brisbane, Australia, 2006. [Google Scholar]
- National Laboratory of the U.S. Department of Energy, Office of Energy Efficiency and Renewable Energy(NREL). Operated by the Alliance for Sustainable Energy, LLC. PVWatts Calculator. Available online: http://pvwatts.nrel.gov/ (accessed on 28 December 2016).
- Roudsari, M.S. Ladybug 0.0.65 Release. Open-Source Environmental Plugin for Grasshopper 3D. Available online: http://www.grasshopper3d.com/group/ladybug (accessed on 31 July 2017).
- Boxwell, M. Solar Electricity Handbook: A Simple, Practical Guide to Solar Energy—Designing and Installing Solar PV Systems, 4th ed.; Greenstream Publishing: Coventry, UK, 2011. [Google Scholar]
Figure 1.
The relation between photovoltaic (PV) cell efficiency and angle of the sun’s rays [2].
Figure 1.
The relation between photovoltaic (PV) cell efficiency and angle of the sun’s rays [2].

Figure 2.
PV-integrated responsive shading device with the dual-axis solar tracking system [18].
Figure 2.
PV-integrated responsive shading device with the dual-axis solar tracking system [18].

Figure 3.
The prototype calibration procedure and real-time data collection.
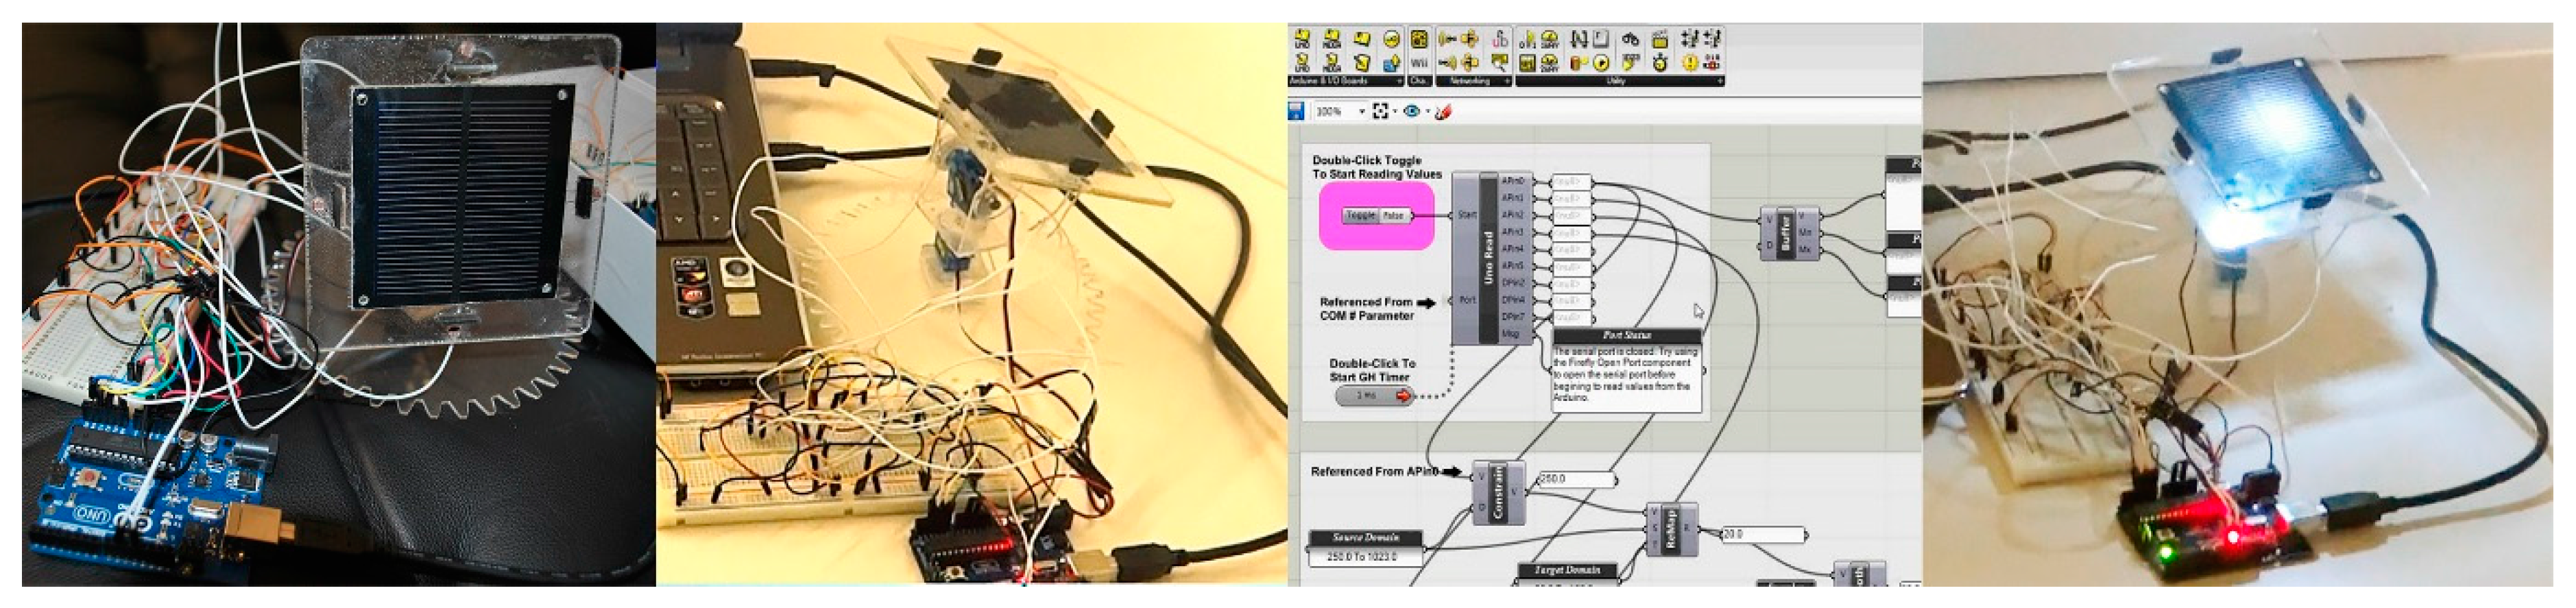
Figure 4.
Empire World T1 elevation and the plan of office floors [20].
Figure 4.
Empire World T1 elevation and the plan of office floors [20].
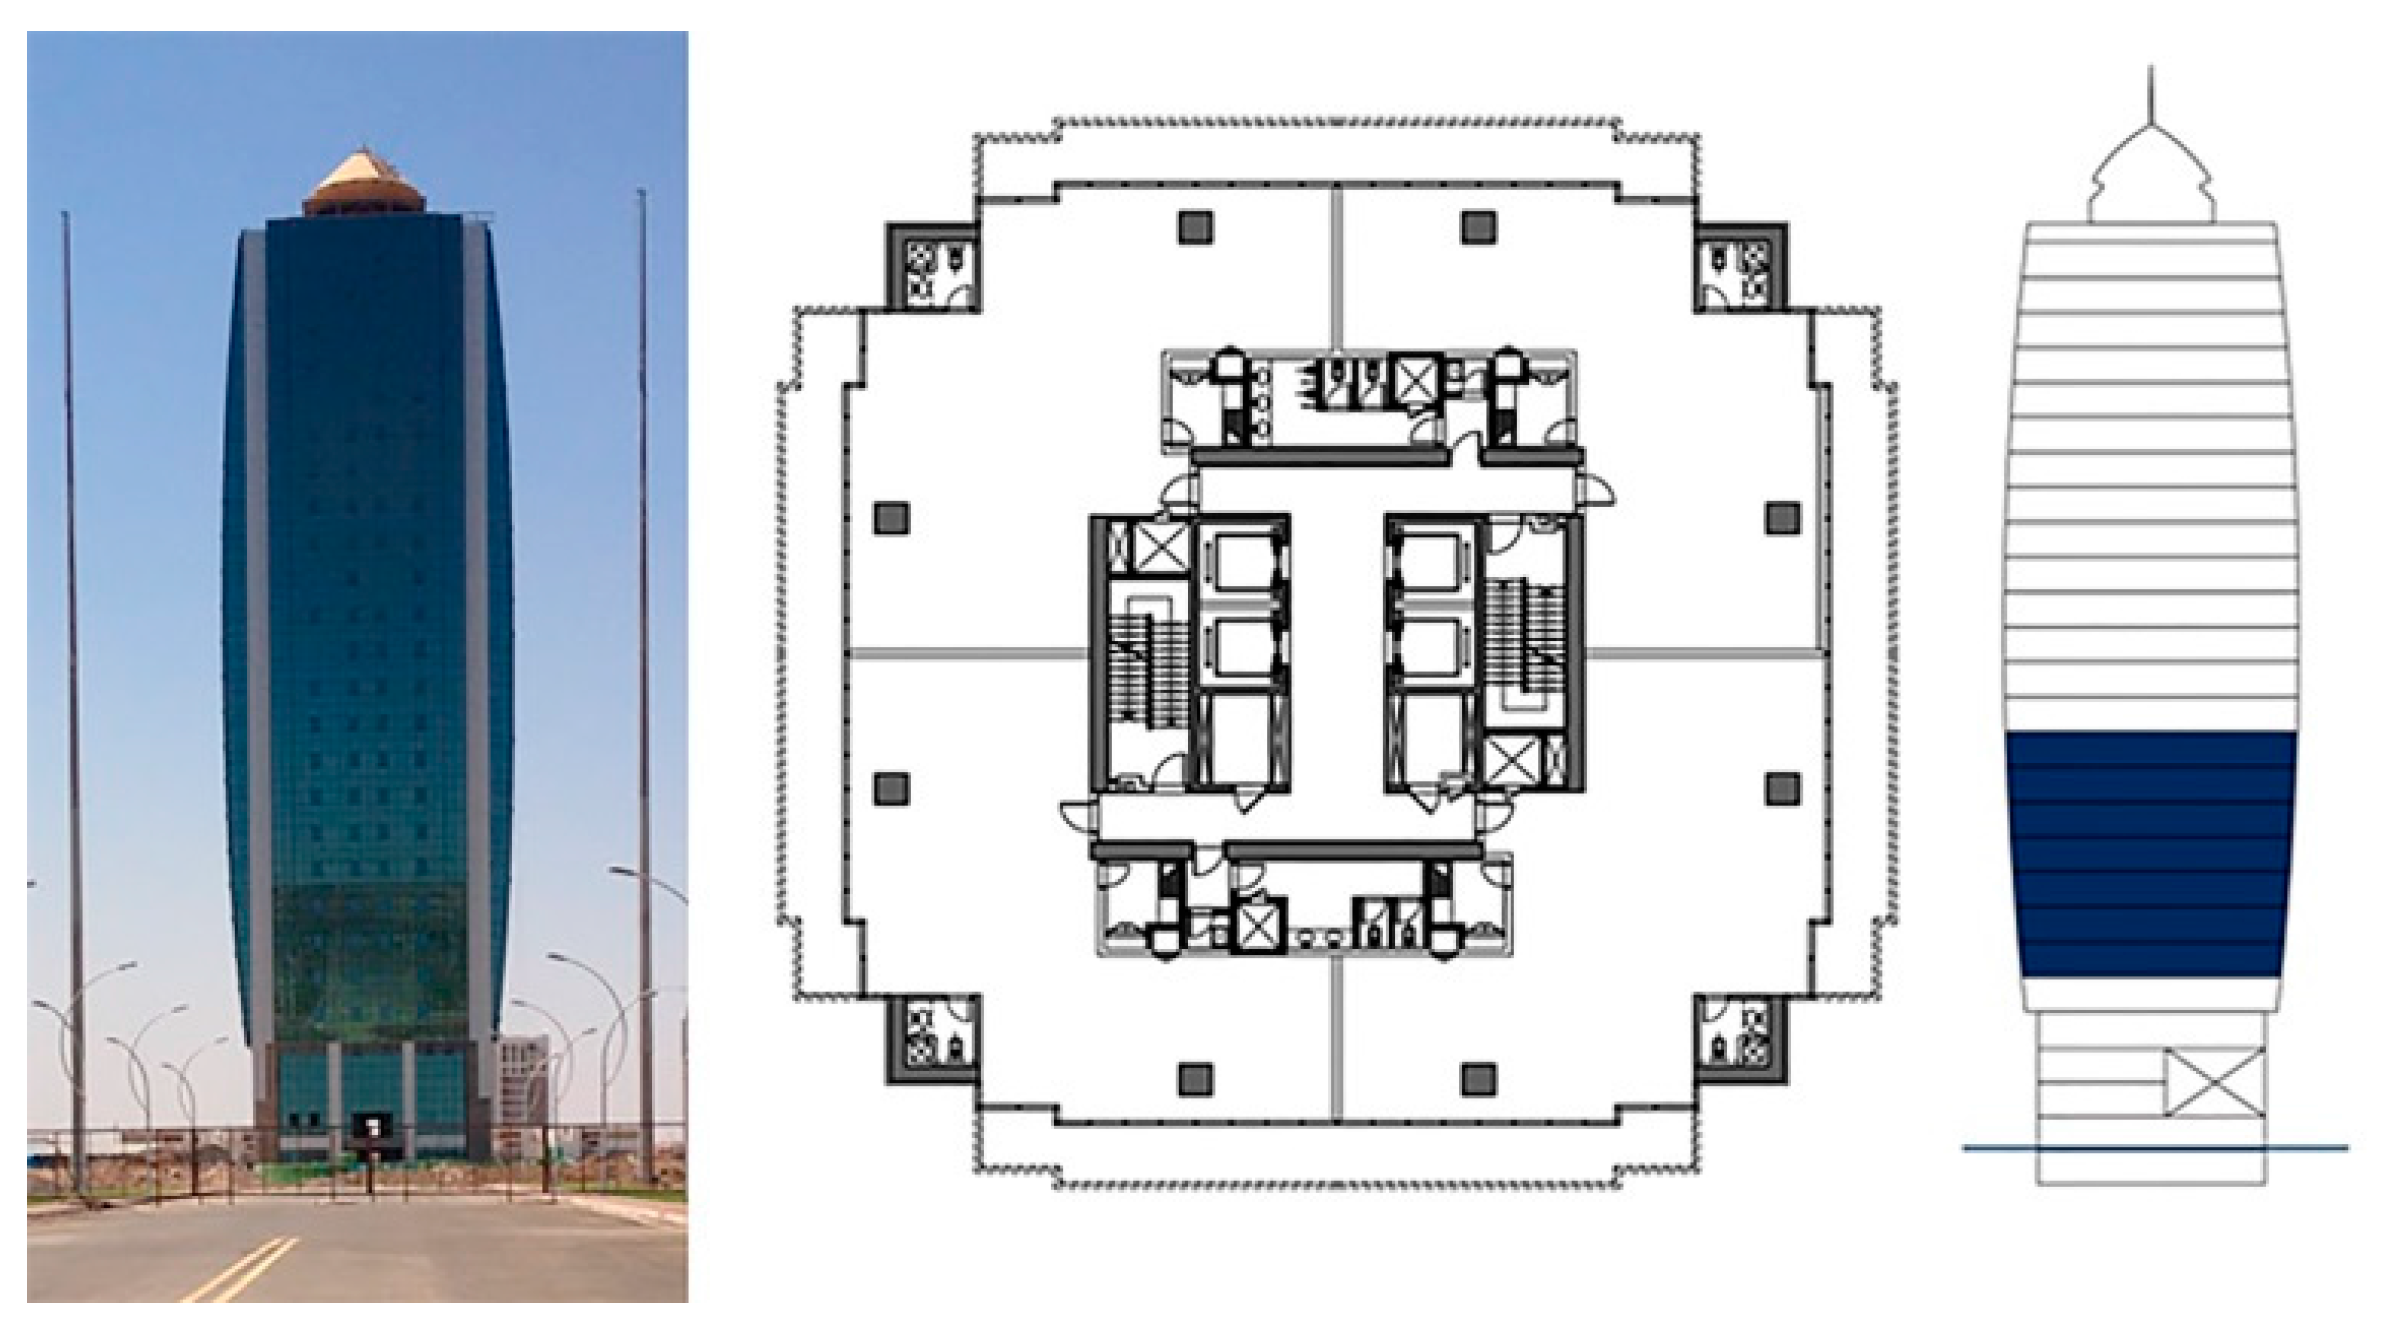
Figure 5.
The structure of the modelling and simulation process.
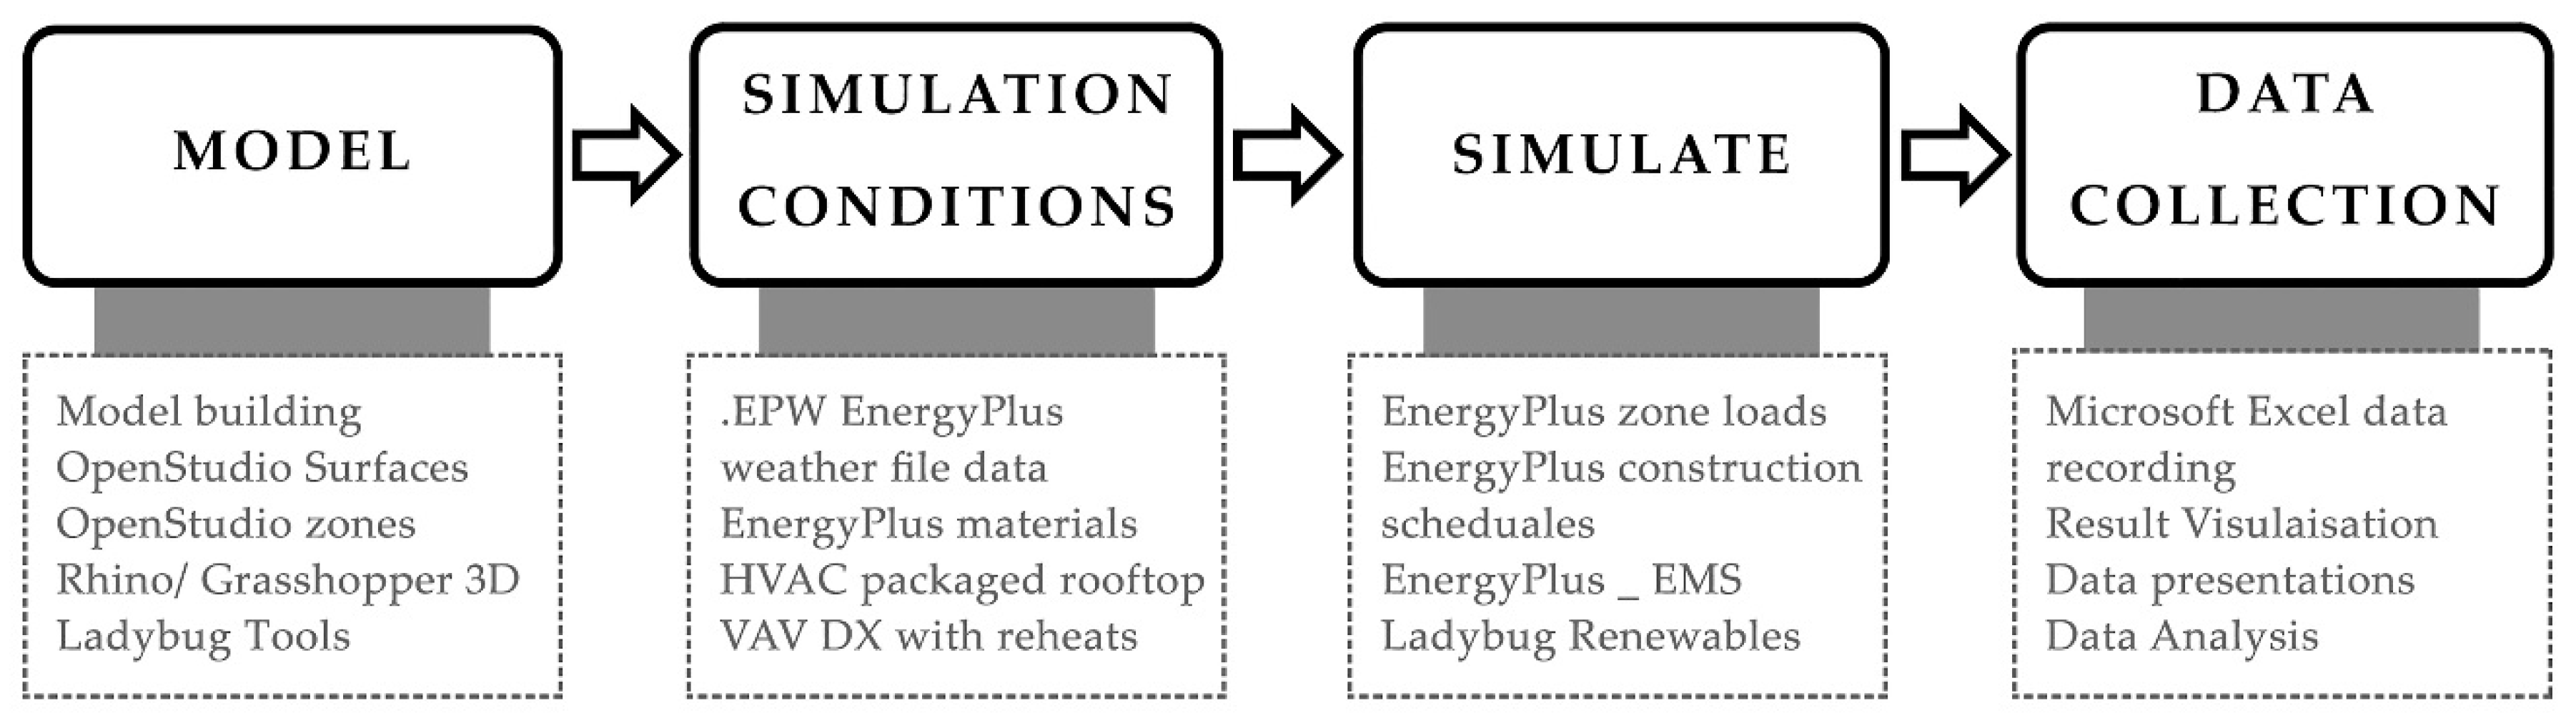
Figure 6.
Photovoltaic opaque area of each floor on the south, east, and west orientations.
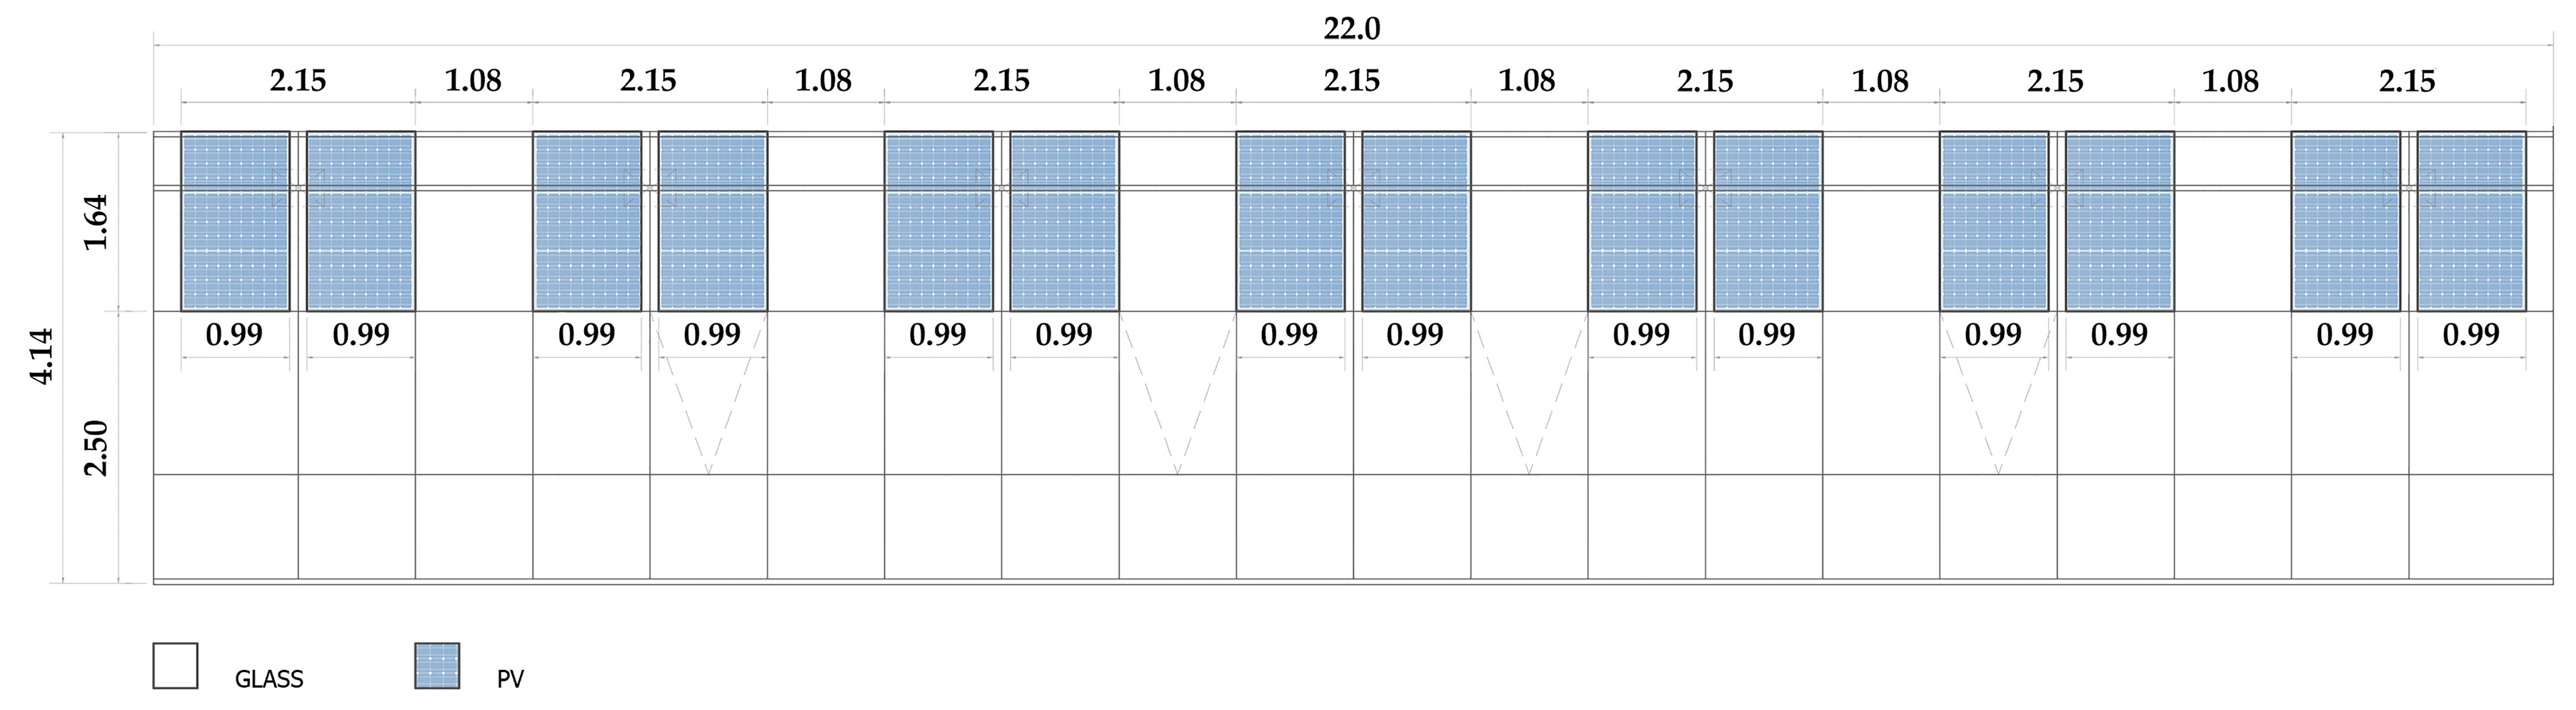
Figure 7.
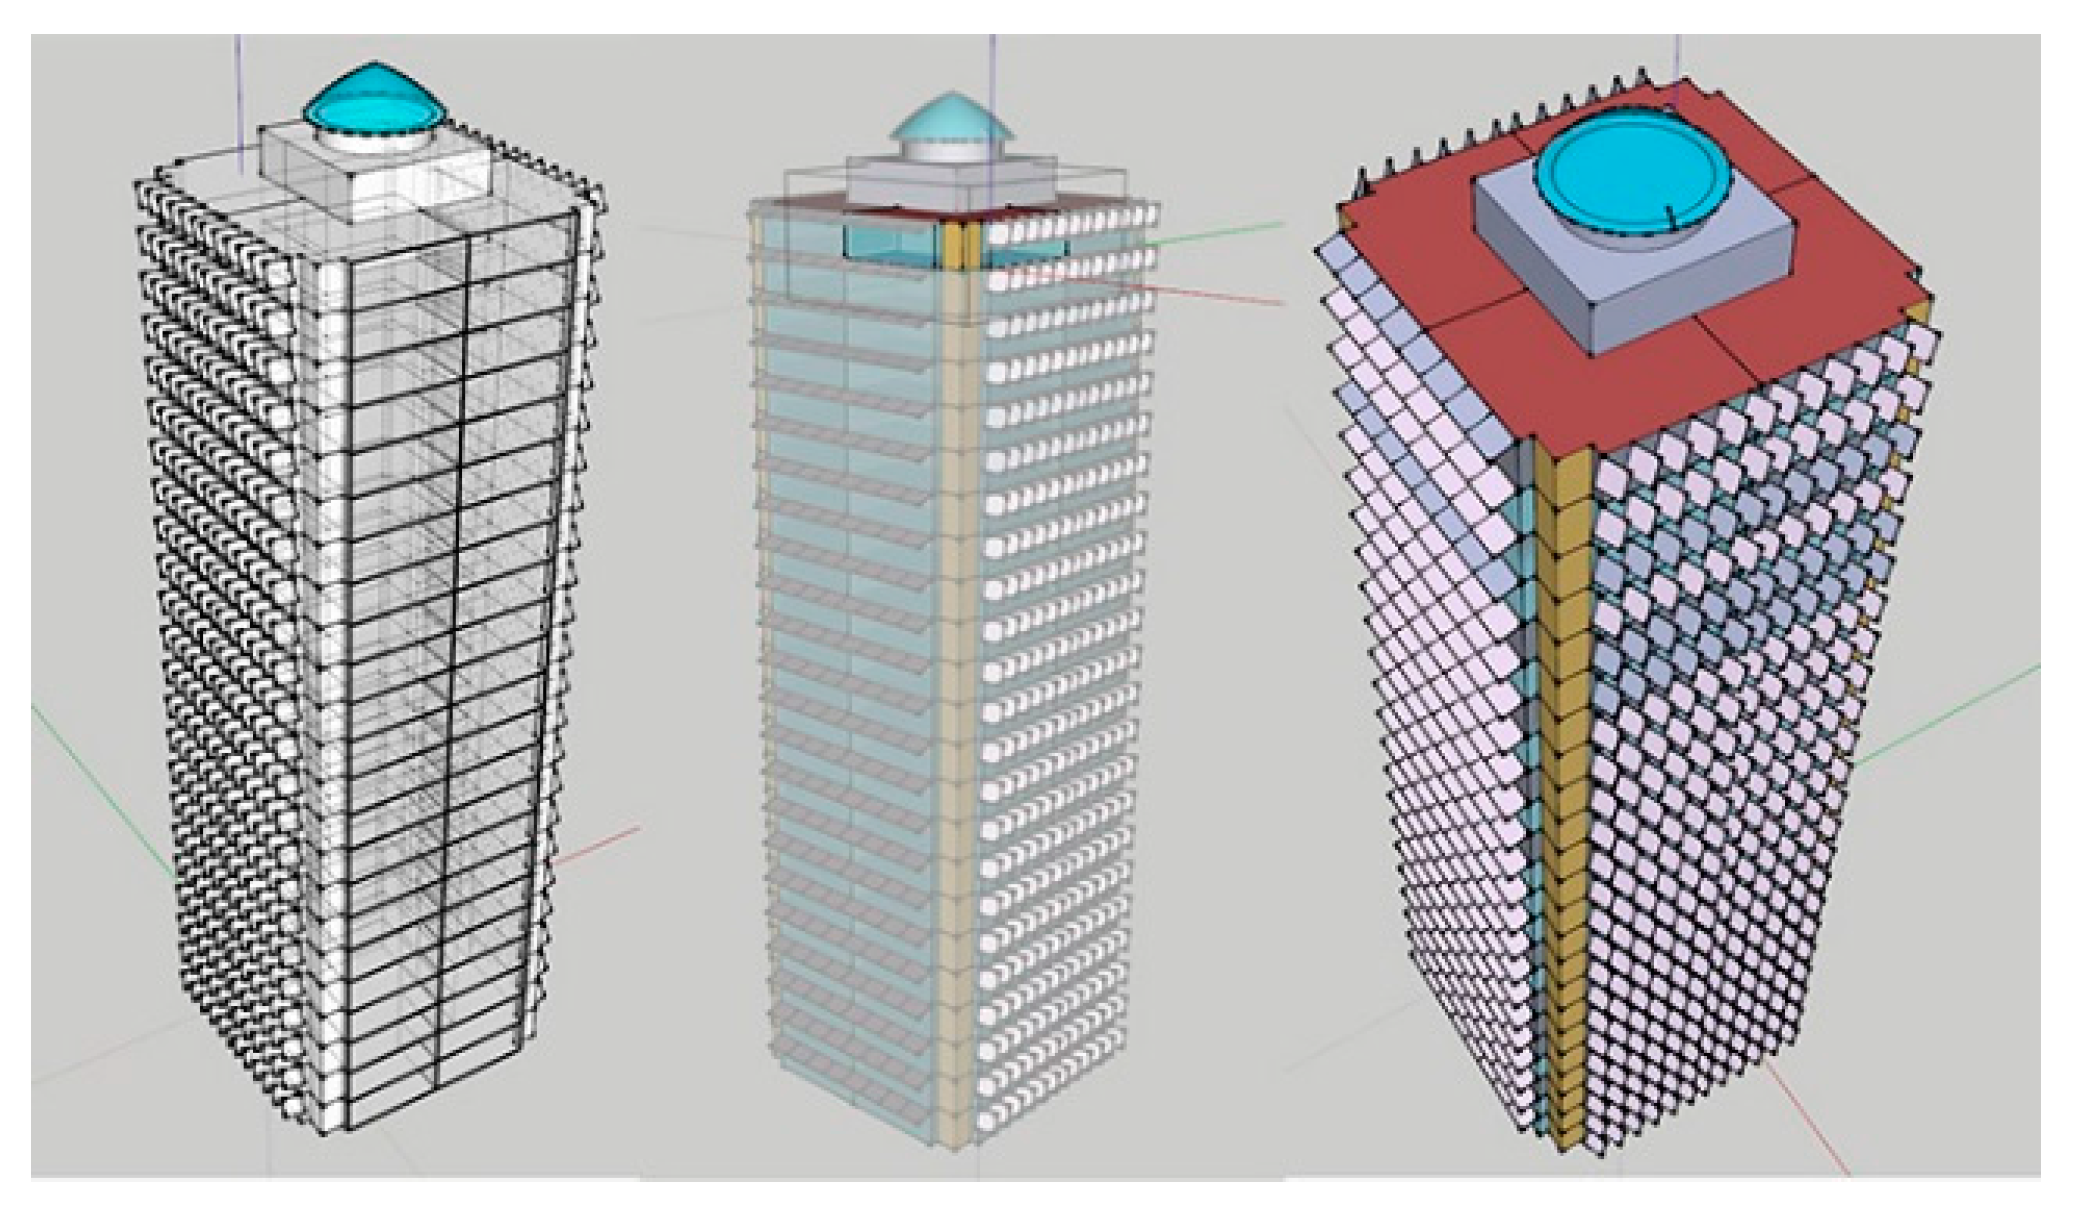
Schematic view of the case-study building with PV-integrated responsive shading devices.

Figure 8.
Defined tilt and azimuth angles for each orientation.

Figure 9.
Simulated optimal tilt and azimuth angles for the south, east, and west façades.
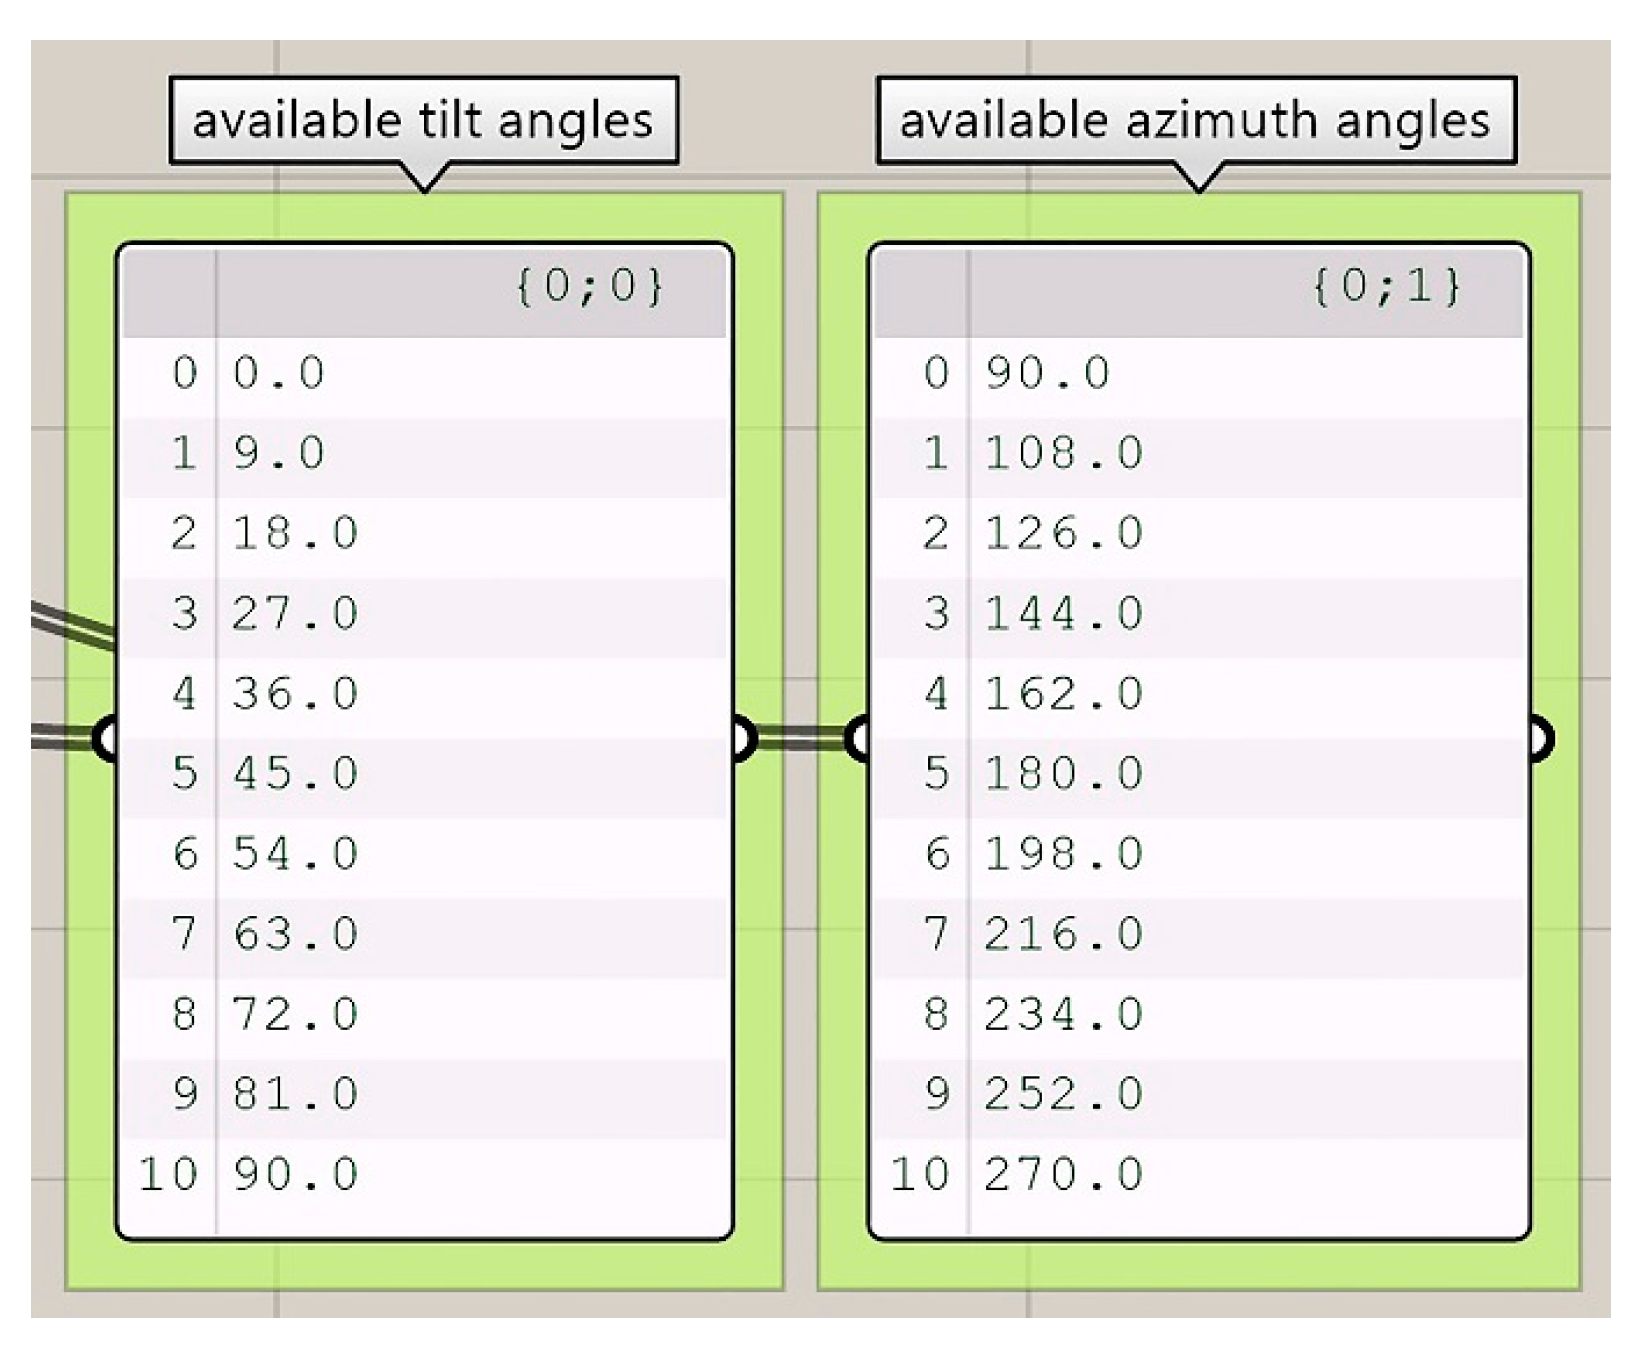
Figure 10.
Grasshopper and Ladybug definition of the PV-integrated shading devices.

Figure 11.
Ladybug_Sunpath Shading diagram for the (a) south, (b) east, and (c) west façades.
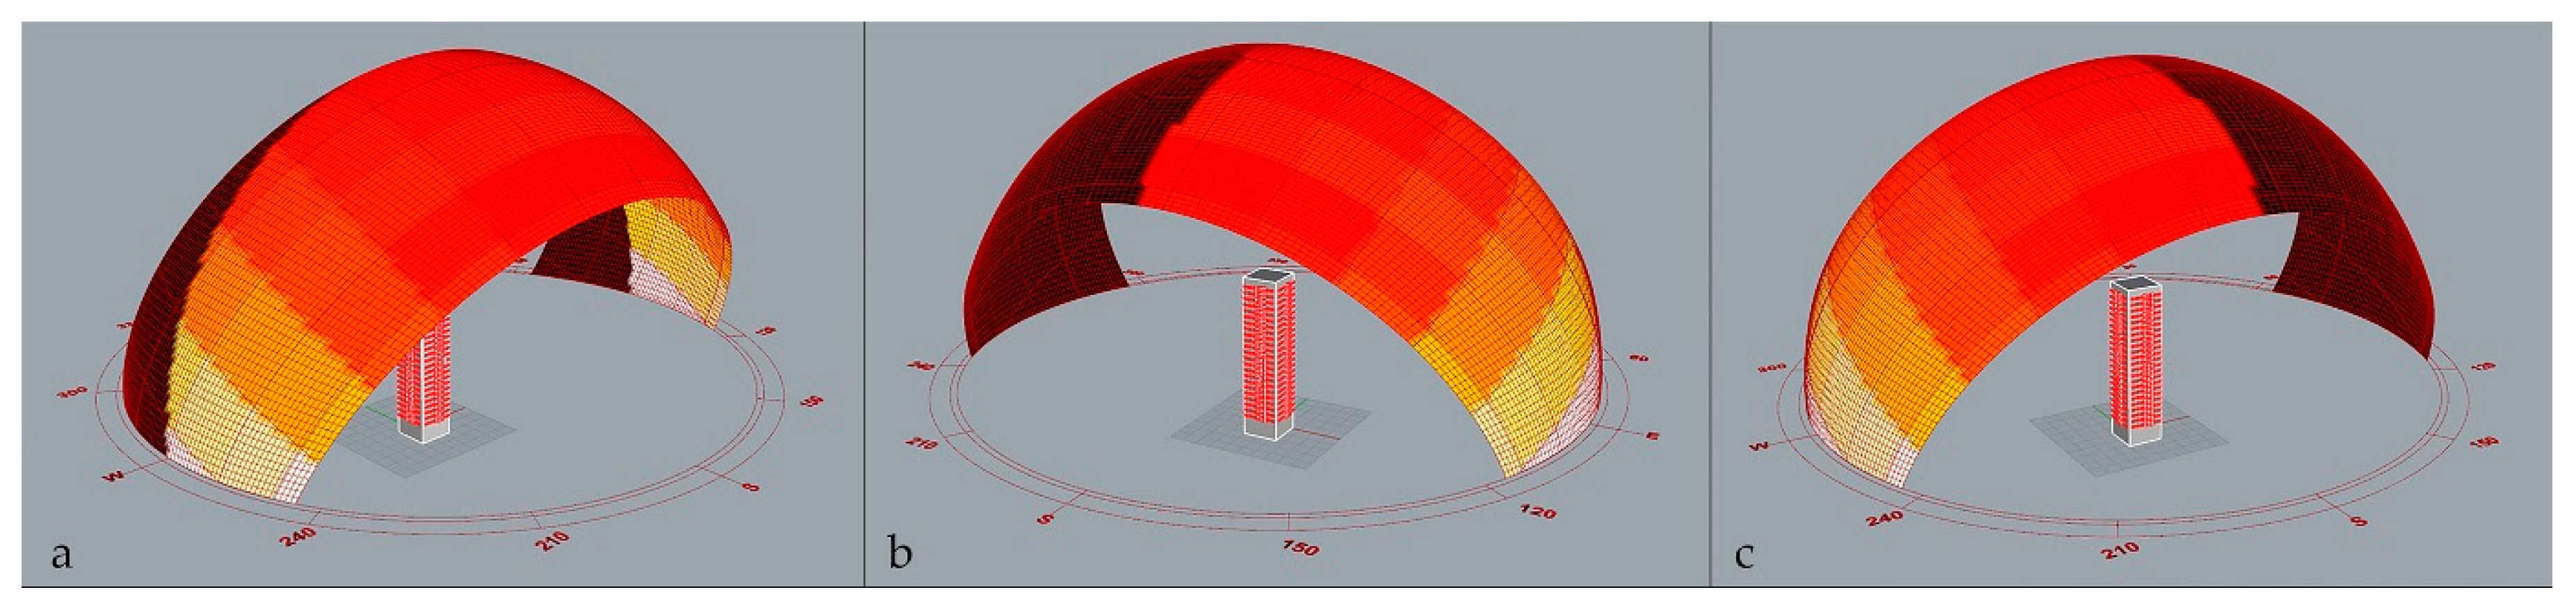
Figure 12.
Power producing differences between both PV systems.
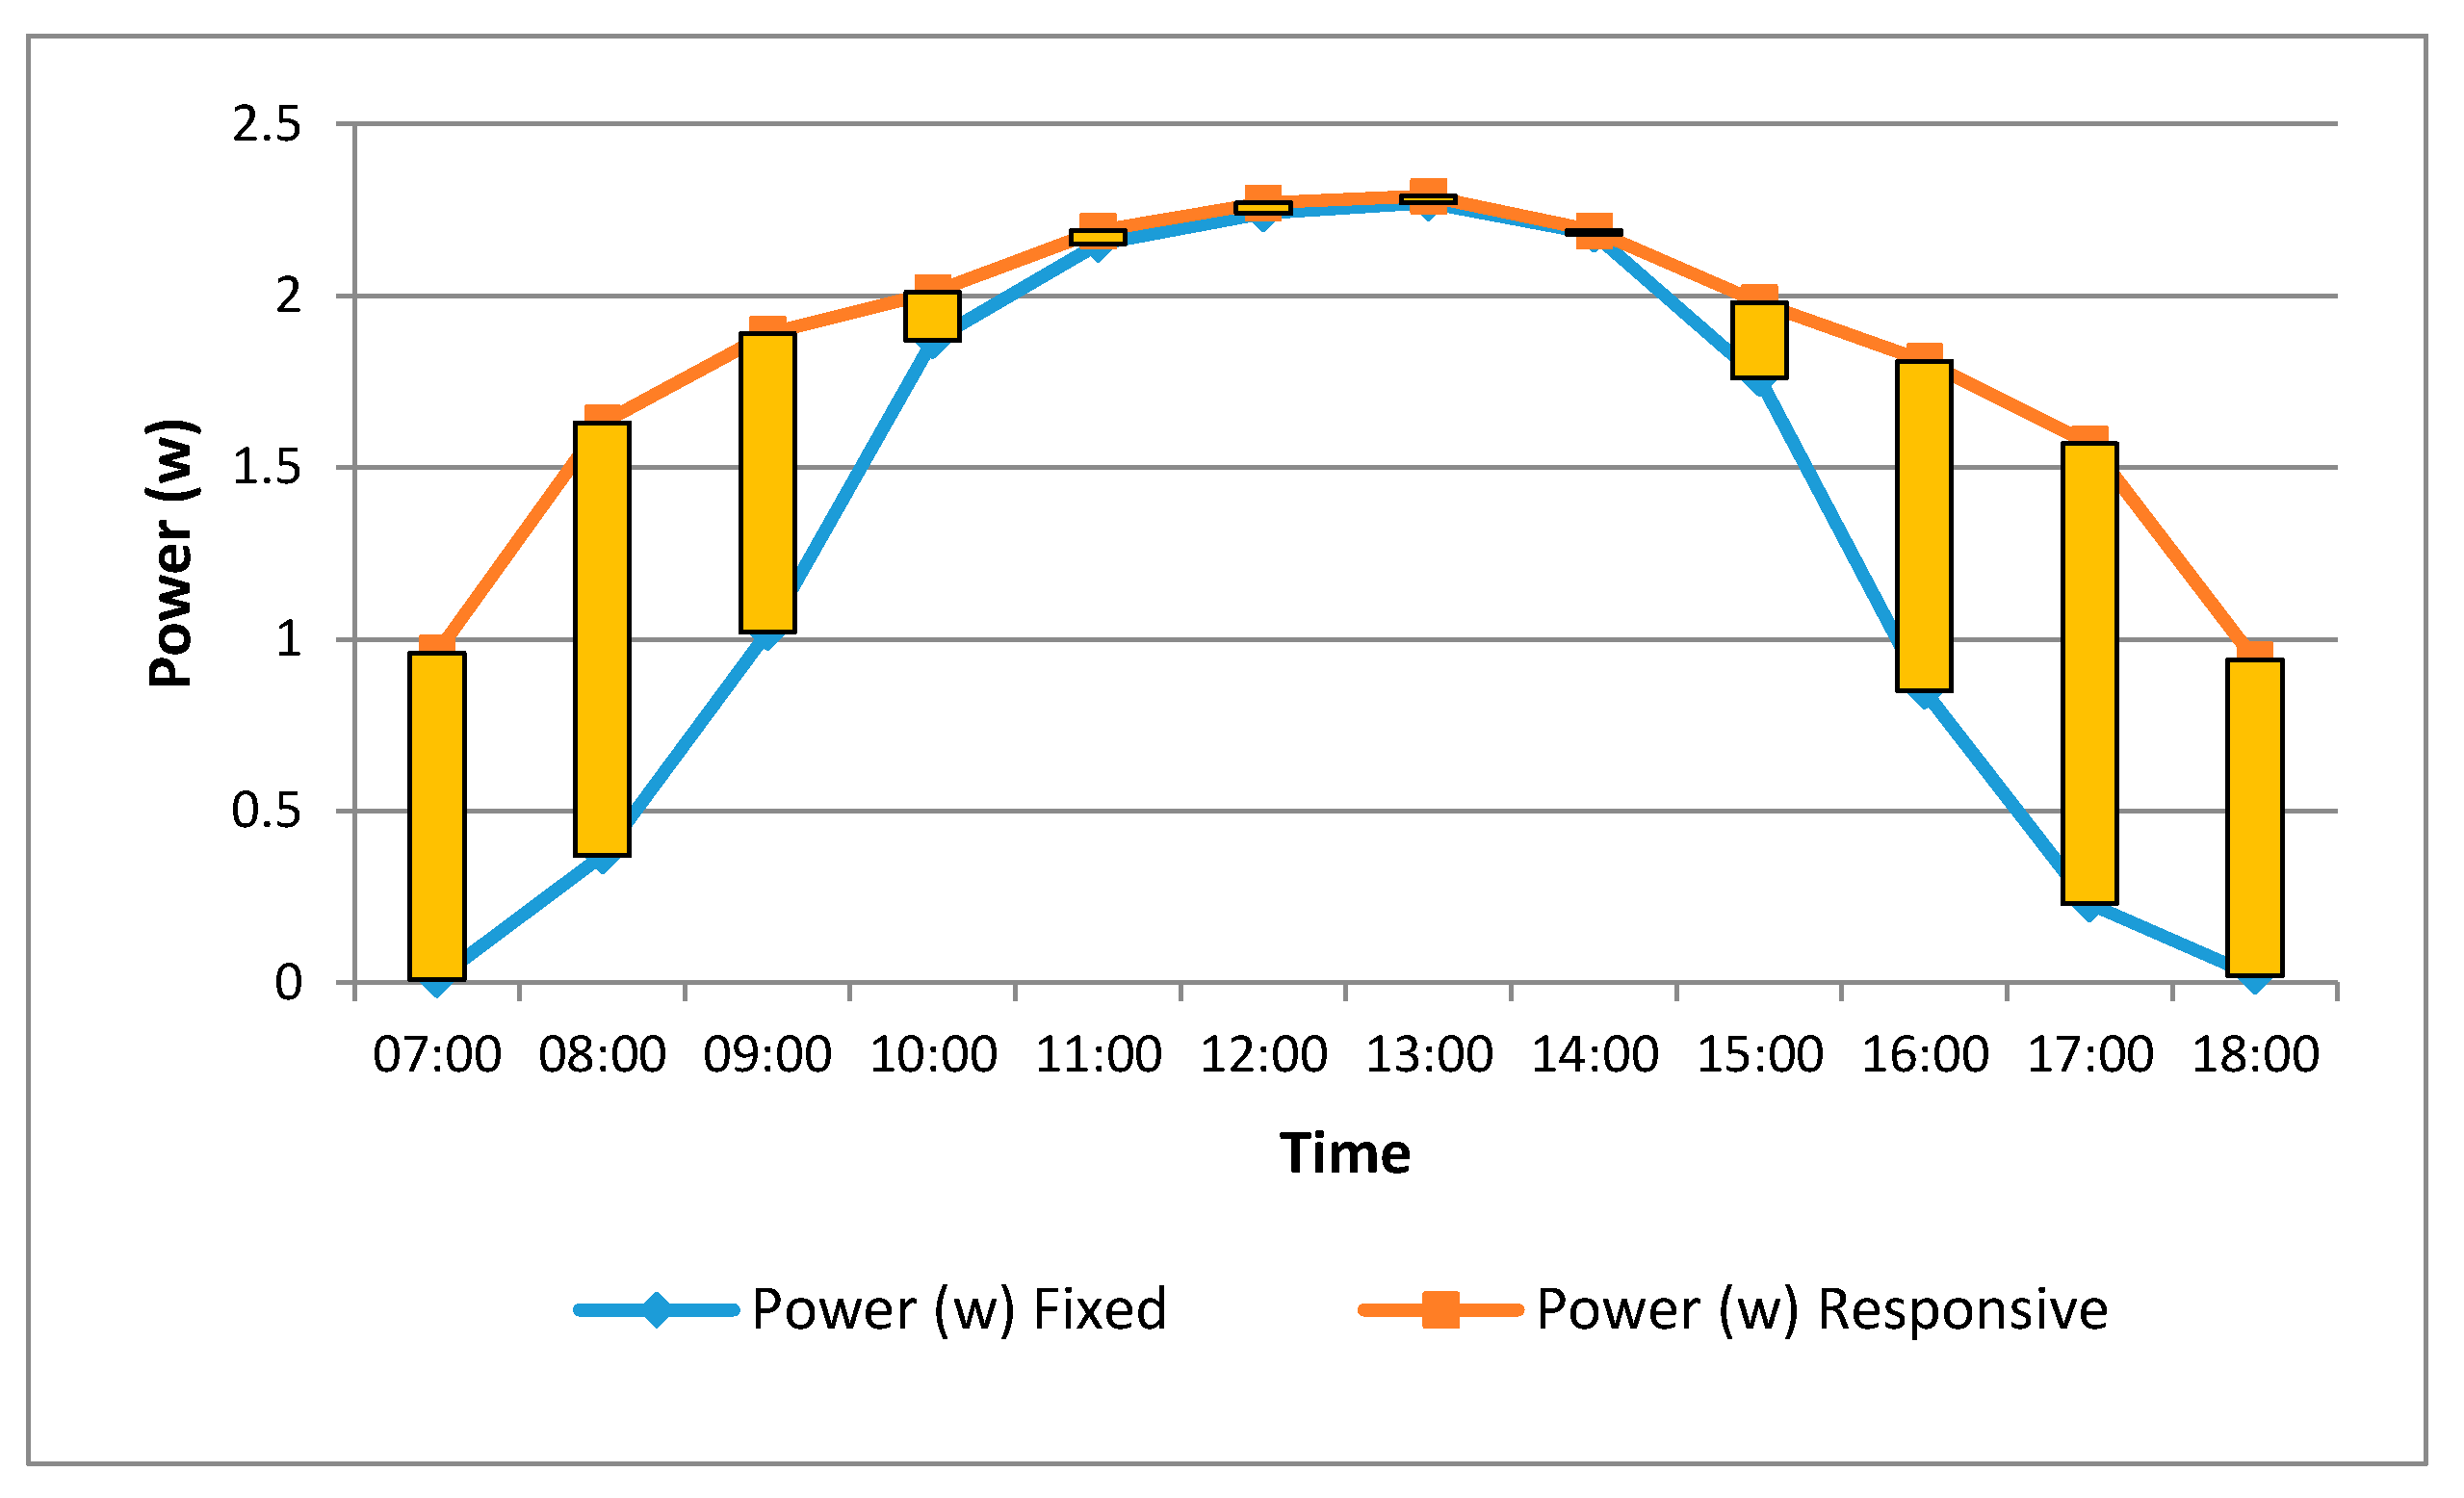
Figure 13.
(A–D) An overview of annual energy use and end-use per category.
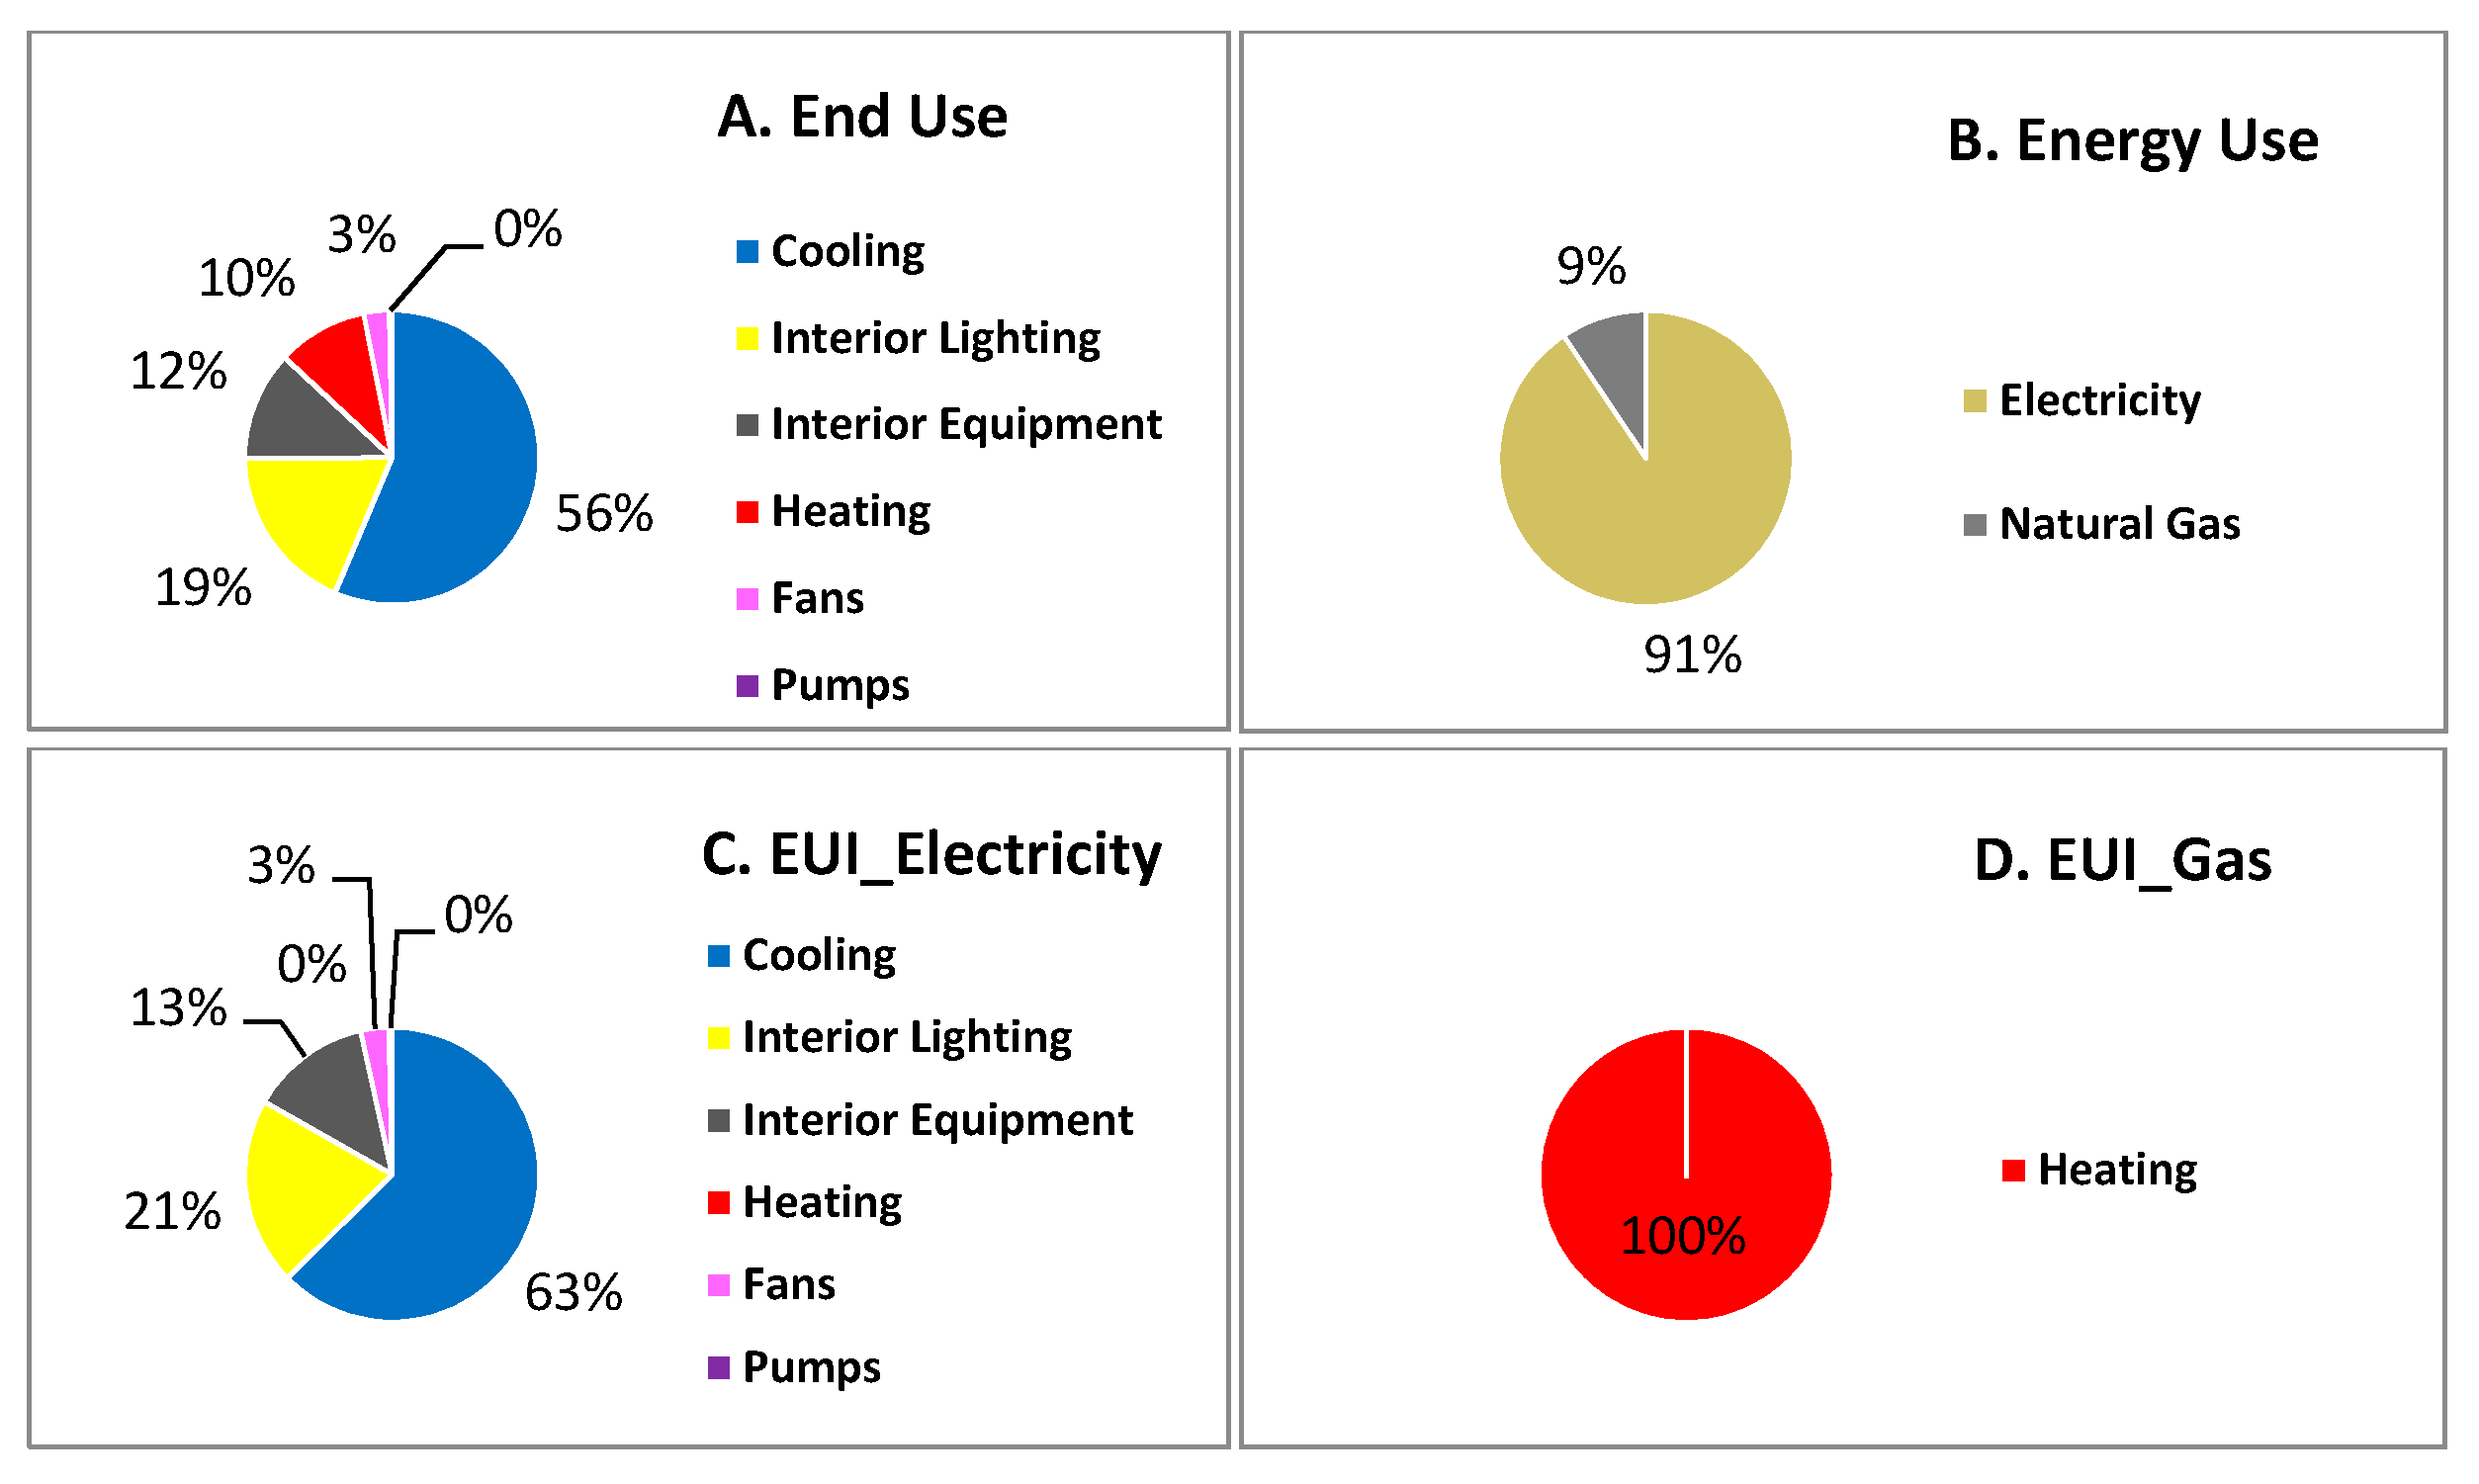
Figure 14.
An overview of monthly electricity consumption.
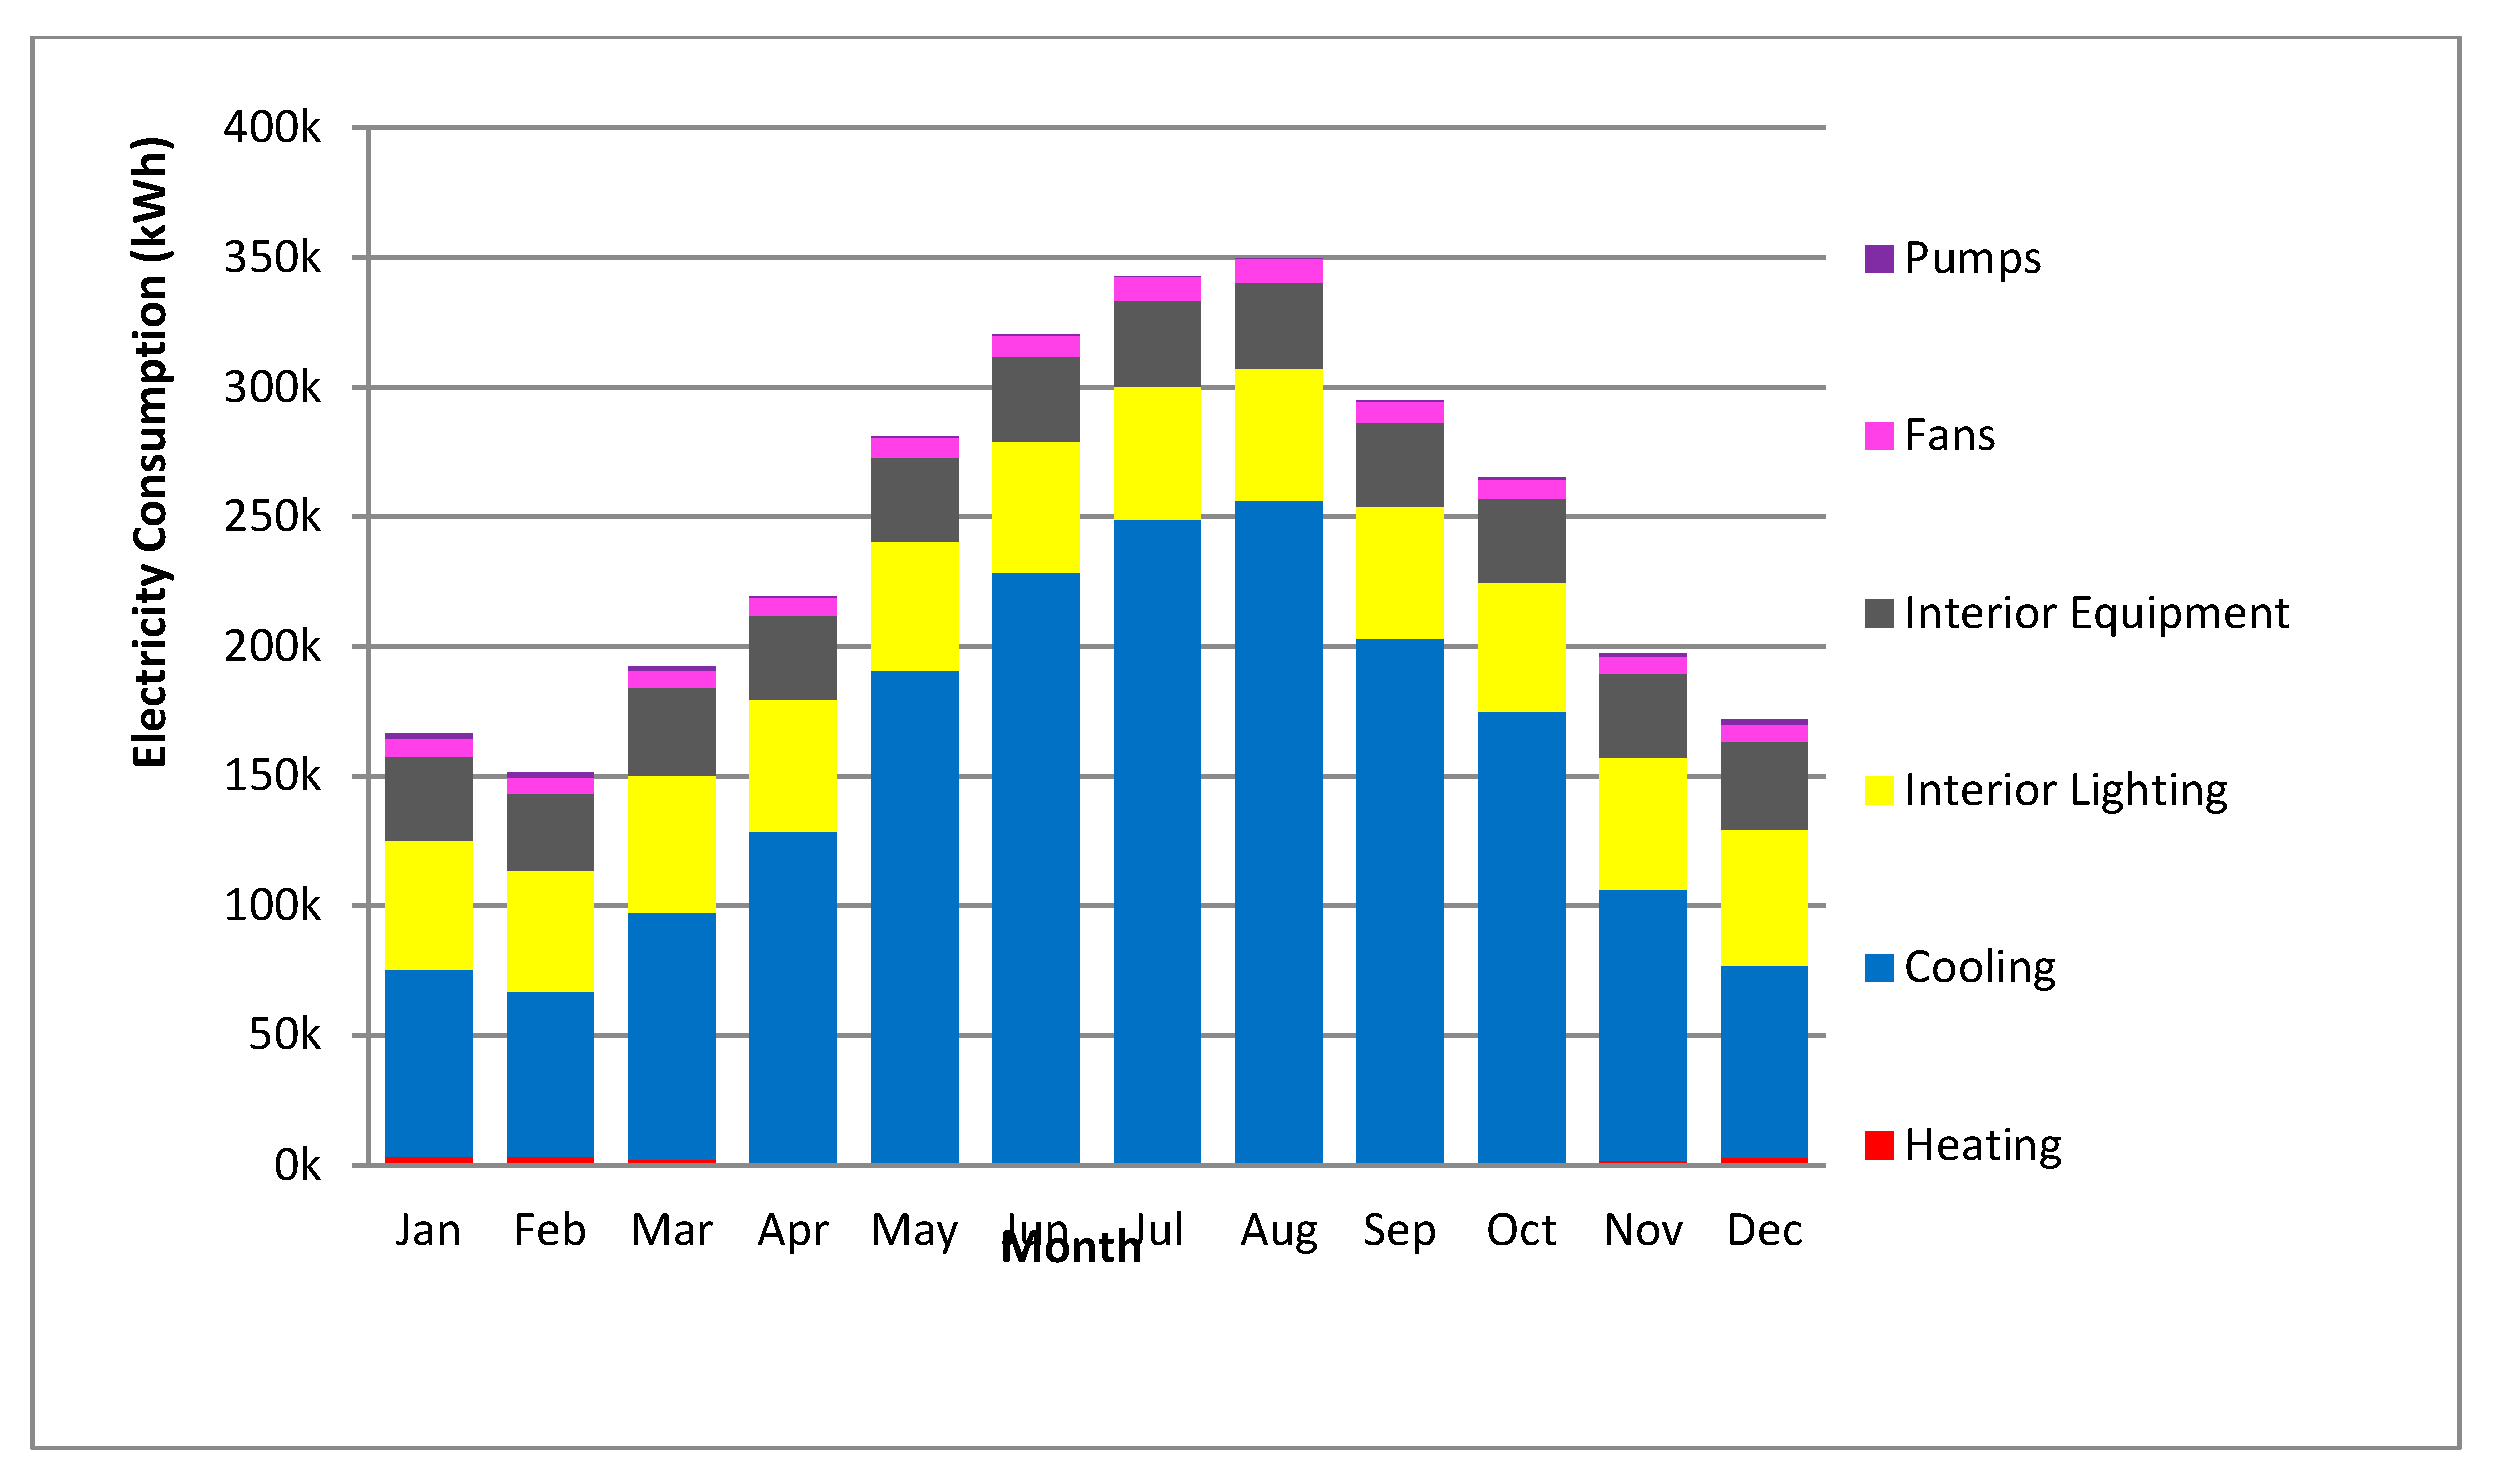
Figure 15.
An overview of monthly natural gas consumption.

Figure 16.
An overview of monthly electricity peak demand.

Figure 17.
An overview of monthly natural gas peak demand.
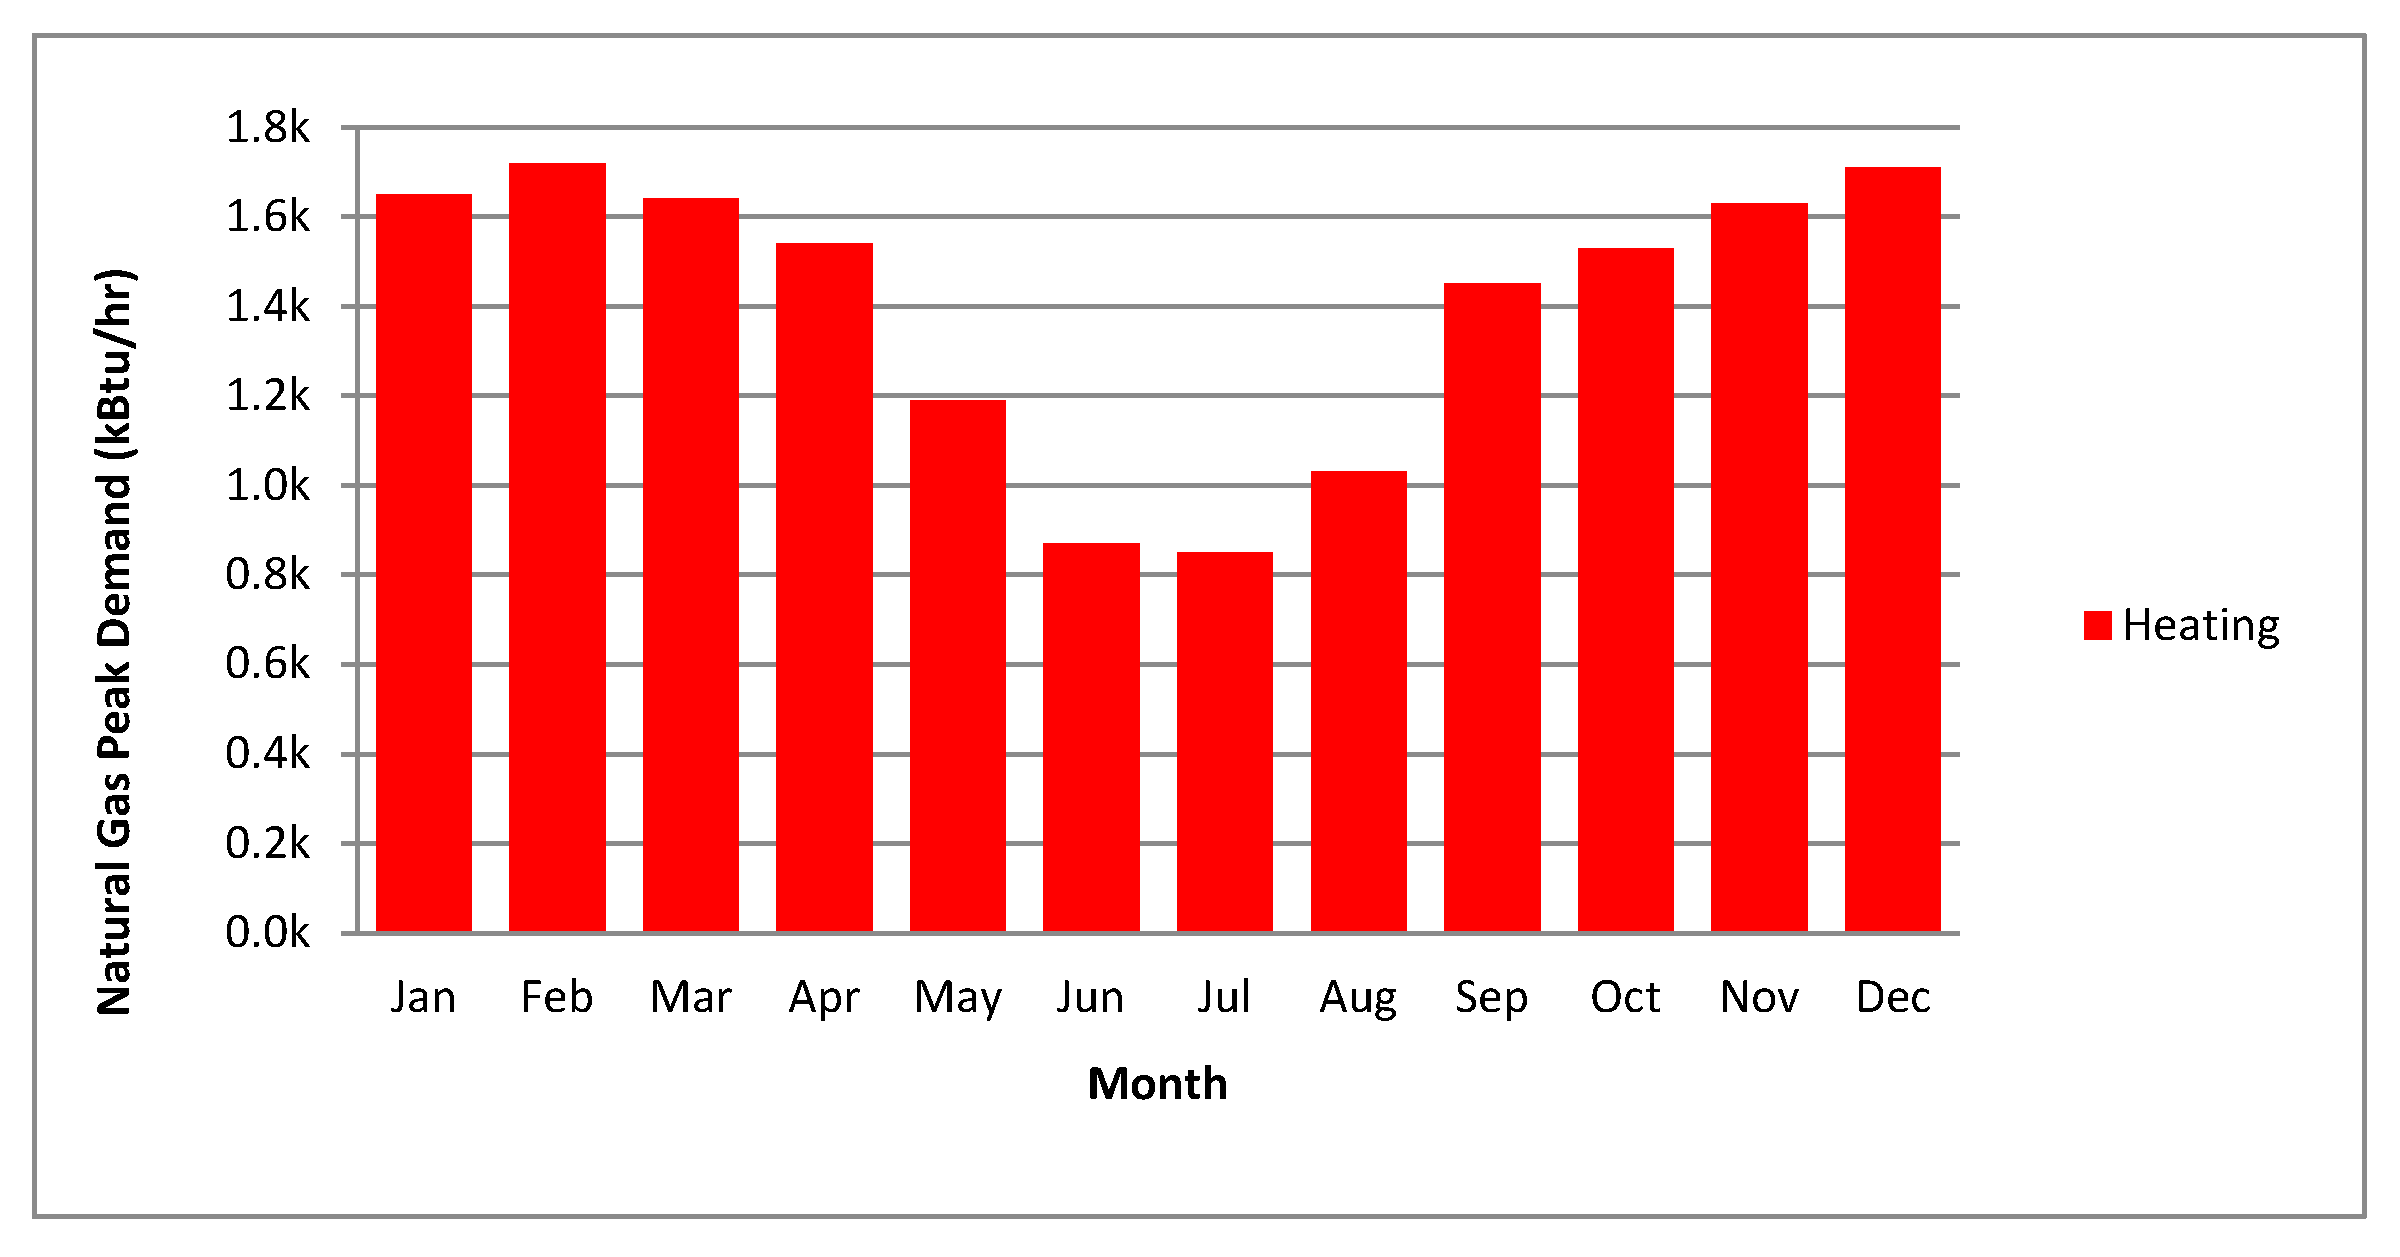
Figure 18.
Monthly heating, ventilation, and air conditioning (HVAC) load profiles.
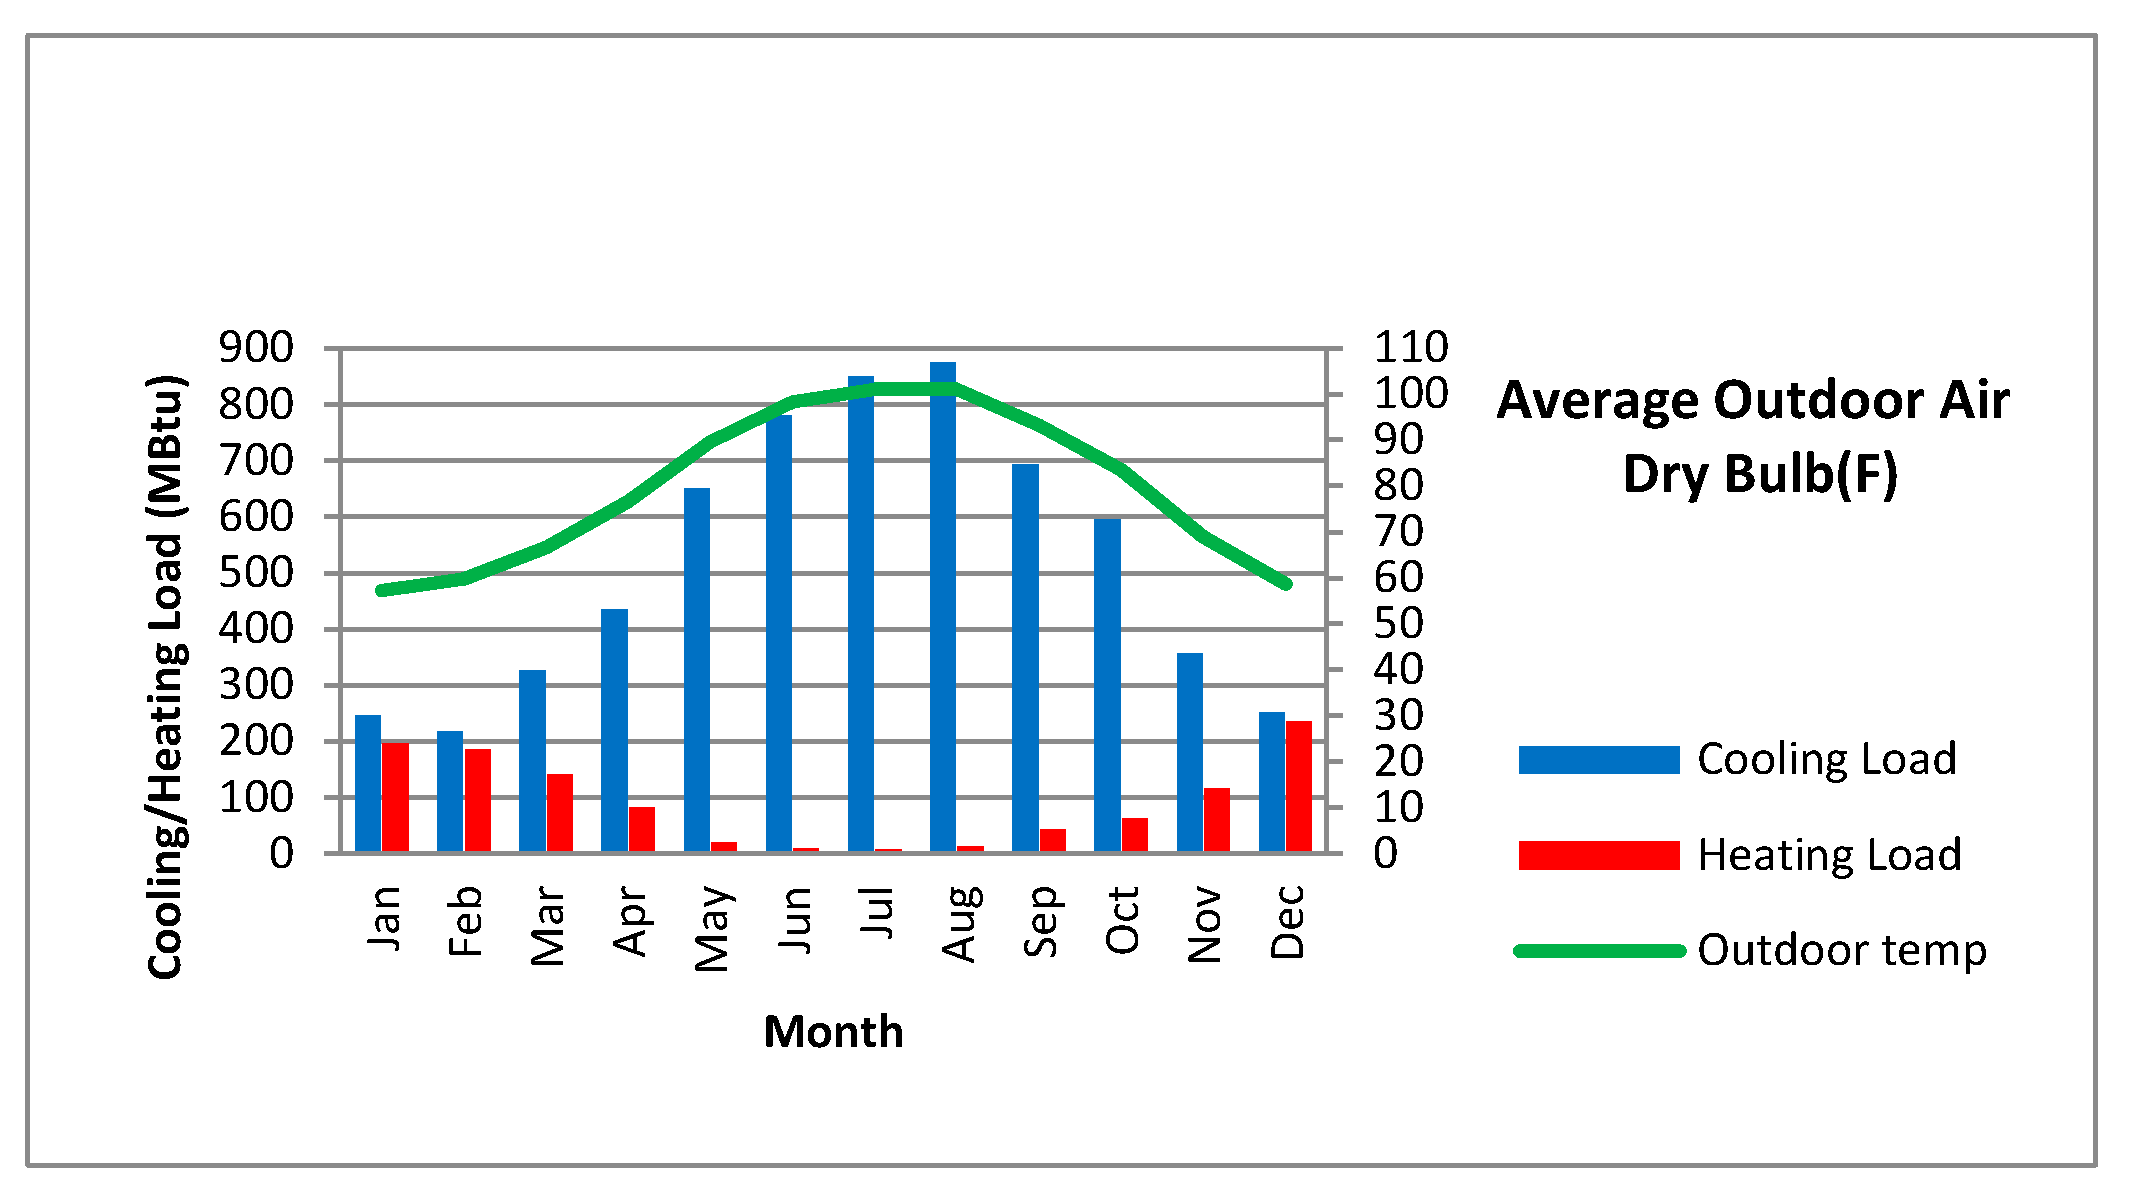
Figure 19.
(A–D) An overview of annual energy use and end-use per category.

Figure 20.
An overview of monthly electricity consumption.

Figure 21.
An overview of monthly natural gas consumption.

Figure 22.
An overview of monthly electricity peak demand.

Figure 23.
An overview of monthly natural gas peak demand.
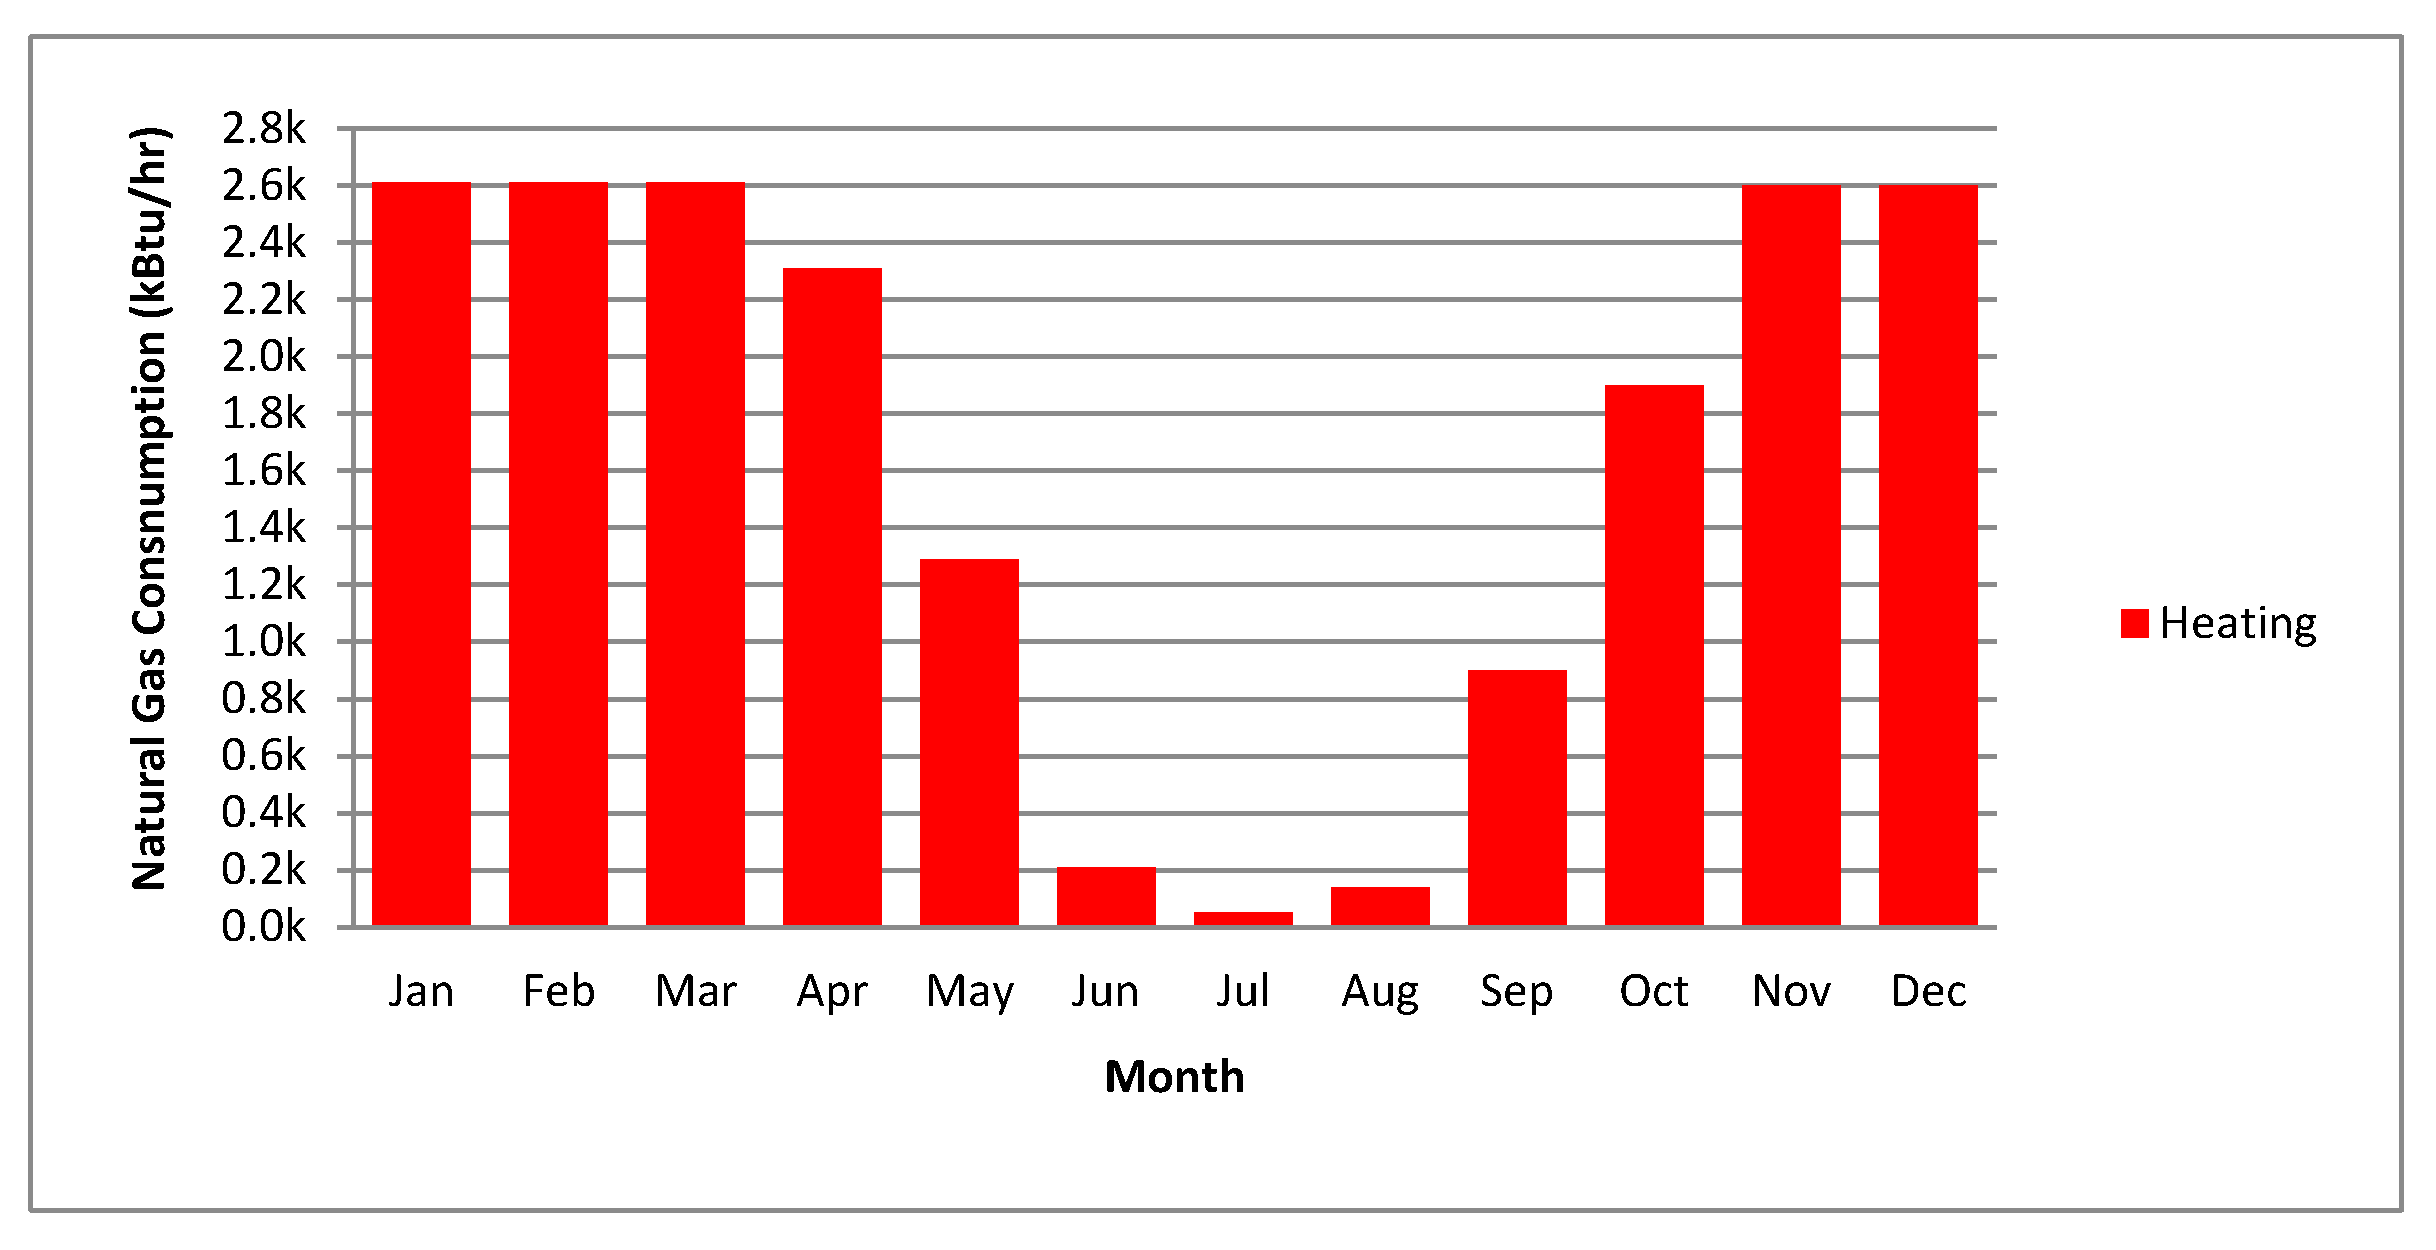
Figure 24.
Monthly HVAC load profiles.

Table 1.
Average annual temperatures and sunshine hours in Erbil [9].
Table 1.
Average annual temperatures and sunshine hours in Erbil [9].
| MONTH | Jan | Feb | Mar | Apr | May | Jun | Jul | Aug | Sep | Oct | Nov | Dec |
|---|---|---|---|---|---|---|---|---|---|---|---|---|
| AVG MAX TEMP | 12 | 15 | 19 | 25 | 32 | 39 | 43 | 42 | 38 | 29 | 21 | 14 |
| AVG MIN TEMP | 2 | 3 | 7 | 11 | 16 | 21 | 25 | 24 | 19 | 14 | 8 | 4 |
| Cold period | Moderate | Hot period | Moderate | Cold | ||||||||
| AVG HRS SUNSHINE/DAY | 5 | 6 | 7 | 8 | 10 | 14 | 14 | 13 | 11 | 8 | 6 | 5 |
Table 2.
ASHRAE (American Society of Heating, Refrigerating and Air-Conditioning Engineers)-based assigned features to the model.
Table 2.
ASHRAE (American Society of Heating, Refrigerating and Air-Conditioning Engineers)-based assigned features to the model.
| Building Type | Space Type | Construction Set | Schedule Set |
|---|---|---|---|
| Office Bldg | 189.1-2009-Office-OpenOffice-CZ1-3 | 189.1-2009-CZ2-Office | 189.1-2009-Office-WholeBuilding-Lg Office-CZ1-3 Schedule set |
Table 3.
ASHRAE-based building component features of the model and actual features.
| Component Name | Construction Name | Actual Features |
|---|---|---|
| Fixed and operable windows | ASHRAE 189.1-2009 Ext. Window Climate Zone 2 | Glass with aluminum frame (8 mm thick blue-green tempered + 12 mm air vacuum + 6 mm low-E tempered clear) |
| Walls | ASHRAE 189.1-2009 Ext. Wall Mass Climate Zone 2 | Composite aluminum cladding (4 mm thick) |
| Roof ceiling | ASHRAE 189.1-2009 Ext. Roof IEAD Climate Zone 2 | Reinforced concrete without insulation (200 mm thick) |
| Floor | ExtSlabCarpet 101.6 mm ClimateZone 1–8 | Reinforced concrete (200 mm thick) and marble tiles (20 mm thick) |
Table 4.
Module type options and features [30].
Table 4.
Module type options and features [30].
| Type | Approx. Efficiency | Module Cover | Temperature Coefficient of Power |
|---|---|---|---|
| Standard (crystalline silicon) | 15% | Glass | −0.47%/°C |
| Premium (crystalline silicon) | 19% | Anti-reflective | −0.35%/°C |
Table 5.
Power (W) produced from both PV installation methods.
| Time (h) | Power (W) (Fixed) | Power (W) (Responsive) |
|---|---|---|
| 07:00 | 0.01 | 0.96 |
| 08:00 | 0.37 | 1.63 |
| 09:00 | 1.02 | 1.89 |
| 10:00 | 1.87 | 2.01 |
| 11:00 | 2.15 | 2.19 |
| 12:00 | 2.24 | 2.27 |
| 13:00 | 2.27 | 2.29 |
| 14:00 | 2.18 | 2.19 |
| 15:00 | 1.76 | 1.98 |
| 16:00 | 0.85 | 1.81 |
| 17:00 | 0.23 | 1.57 |
| 18:00 | 0.02 | 0.94 |
| ∑ (W) | 14.97 | 21.73 |
Table 6.
Annual total site and source energy summary.
| Total Energy (GJ) | Energy Per Total Building Area (MJ/m2) | |
|---|---|---|
| Site Energy | 11,910.18 | 661.10 |
| Source Energy | 35,436.81 | 1967.00 |
Table 7.
Annual building end-uses.
| Electricity (GJ) | Natural Gas (GJ) | |
|---|---|---|
| Heating | 58.37 | 1095.89 |
| Cooling | 6793.30 | 0.00 |
| Interior Lighting | 2182.53 | 0.00 |
| Interior Equipment | 1406.15 | 0.00 |
| Fans | 336.76 | 0.00 |
| Pumps | 37.19 | 0.00 |
| Total End-Uses | 10,814.29 | 1095.89 |
Table 8.
The utility uses per total floor area.
| Electricity Intensity (MJ/m2) | Natural Gas Intensity (MJ/m2) | |
|---|---|---|
| Lighting | 121.15 | 0.00 |
| HVAC | 401.07 | 60.83 |
| Other | 78.05 | 0.00 |
| Total | 600.27 | 60.83 |
Table 9.
Annual total site and source energy summary.
| Total Energy (GJ) | Energy Per Total Building Area (MJ/m) | |
|---|---|---|
| Site Energy | 8512.17 | 493.70 |
| Source Energy | 25,287.24 | 1466.63 |
Table 10.
Annual building end-uses.
| Electricity (GJ) | Natural Gas (GJ) | |
|---|---|---|
| Heating | 0.00 | 802.11 |
| Cooling | 4076.73 | 0.00 |
| Interior Lighting | 2102.39 | 0.00 |
| Interior Equipment | 1310.97 | 0.00 |
| Fans | 198.08 | 0.00 |
| Pumps | 21.88 | 0.00 |
| Total End-Uses | 7710.06 | 802.11 |
Table 11.
The utility uses per total floor area.
| Electricity Intensity (MJ/m2) | Natural Gas Intensity (MJ/m2) | |
|---|---|---|
| Lighting | 121.94 | 0.00 |
| HVAC | 249.20 | 46.52 |
| Other | 76.03 | 0.00 |
| Total | 447.17 | 46.52 |
Table 12.
Photovoltaic annual shadings and total system losses.
| Orientation | Average Annual Shading (%) | Total System Losses (%) |
|---|---|---|
| East | 37.43 | 44.57 |
| South | 11.22 | 21.35 |
| West | 37.57 | 44.69 |
| Total Average | 28.74 | 36.87 |
Table 13.
The amount of photovoltaic electricity produced from each orientation.
| Orientation | Generated Electricity (kWh/Year) |
|---|---|
| East | 101,483.6381 |
| South | 160,304.2698 |
| West | 102,065.8843 |
| Total Amount | 363,853.7922 |
Table 14.
PV Watts® Calculator (NREL, Washington, DC, USA) system information.
| Parameters | Inputs |
|---|---|
| DC System Size (kW) | 235.26 |
| Module Type | Standard (crystalline silicon) |
| Array Type | Two-Axis Tracking |
| System Losses (%) | 14 |
| Tilt (deg) | 0 |
| Azimuth (deg) | 180 |
| Dc to Ac Size Ratio | 1.1 |
| Inverter Efficiency (%) | 96 |
| Ground Coverage Ratio | 0.4 |
| System Type | Commercial |
| Cost of Electricity ($/kWh) | 0.12 |
Table 15.
PV Watts® Calculator results.
| Solar Radiation (kWh/m2/Day) | AC Energy (kWh) | Energy Value ($) | |
|---|---|---|---|
| Annual | 8.50 | 529,896 | $63,588 |
© 2017 by the authors. Licensee MDPI, Basel, Switzerland. This article is an open access article distributed under the terms and conditions of the Creative Commons Attribution (CC BY) license (http://creativecommons.org/licenses/by/4.0/).
Share and Cite
MDPI and ACS Style
Abdullah, H.K.; Alibaba, H.Z. Retrofits for Energy Efficient Office Buildings: Integration of Optimized Photovoltaics in the Form of Responsive Shading Devices. Sustainability 2017, 9, 2096. https://doi.org/10.3390/su9112096
AMA Style
Abdullah HK, Alibaba HZ. Retrofits for Energy Efficient Office Buildings: Integration of Optimized Photovoltaics in the Form of Responsive Shading Devices. Sustainability. 2017; 9(11):2096. https://doi.org/10.3390/su9112096
Chicago/Turabian StyleAbdullah, Hardi K., and Halil Z. Alibaba. 2017. "Retrofits for Energy Efficient Office Buildings: Integration of Optimized Photovoltaics in the Form of Responsive Shading Devices" Sustainability 9, no. 11: 2096. https://doi.org/10.3390/su9112096
Note that from the first issue of 2016, this journal uses article numbers instead of page numbers. See further details here.