1. Introduction
Societies concerned about energy issues and global warming advocate for the sustainable use of renewable natural resources, including timber. Forest management practices and expectations for forest ecosystems now weigh biodiversity and carbon fixation alongside timber production [
1,
2]. Recently, the use of partial harvesting systems has been raising attention on managing forests to harmonize timber production and other goals, because it engenders stands with complex structures and compositions [
3,
4,
5]. Retaining a desired quantity of trees and biological legacies preserves biodiversity and the ecosystem functions of the original ecosystem, and reduces the negative impacts of logging [
6,
7,
8].
In this context, silvicultural regimes seek to moderate the disturbances brought about by human activity, and imitate those that occur naturally [
3,
9,
10,
11]. For instance, in cases of forests under a disturbance regime dominated by windthrow, selection cutting can emulate the consequences of strong winds to preserve the ecosystem while producing timber [
12,
13,
14]. Although silvicultural regimes using selection cutting have been investigated and implemented for decades, it often appears to produce certain negative changes in the features of the ecosystem, including timber volume, stand structure, species composition, and biodiversity measures [
15,
16,
17,
18,
19]. The effects of the management of the multiple ecosystem functions depend on the amount of trees to be retained, but many other factors seem to be responsible as well [
20,
21]. We therefore need more case studies for generalization.
The management of natural mixed conifer–broadleaf forests in Hokkaido, Japan, has involved a single-tree selection regime since the early 20th century. In practice, however, forest management had favored economic output; in effect, “selective cutting” entailed harvesting large-diameter live trees [
22] together with intense logging, and considerably degraded stand structures [
23,
24]. Recently, an alternative managed regime of selection cutting has been proposed on the basis of retrospective studies regarding the long-term dynamics of managed stands [
25]. However, our understanding on how to create a balance among multiple functions of the forest ecosystem is still lacking.
This study proposes an alternative regime of selection cutting after a long-term comparison of managed and unmanaged stands of natural mixed forest in Hokkaido. We focused on biodiversity and carbon stock, along with timber production, among ecosystem functions. We compare indexes representing complex stand structures and several indicators of biodiversity [
26] between these stands, and discuss the effects of the practices involved in the management. Stand structural attributes include the quantity of large-diameter live trees, dead trees, layered canopy, and understory vegetation. These measures capture the resources and habitats available to forest-dwelling organisms. The more complex the stand structure, the more diverse the biota [
27,
28]. Next, we focus on understory plants, trunk-dwelling plants, avian species, and cavities (hollows) in trees as indicator elements. Since flora and fauna have disparate habitat preferences, tree harvesting influences their number and composition.
Specifically, we clarify how the application of single-tree selection cutting over 30 years that nominally had favored sustainable timber yields affected stand structural attributes, indicator elements, carbon stock, and timber production. We examine implications for improving the current regime of selection cutting to balance use of the region’s timber resources.
2. Materials and Methods
2.1. Study Site
The study was conducted in the Nakagawa Experimental Forest at Hokkaido University (44°48′N, 142°15′E, and 150 m above sea level). The mean annual temperature is 5 °C, the mean annual precipitation is 1300 mm, and the mean maximum snow depth is 200 cm. The dominant stand type in the forest is a mixed conifer–broadleaved stand, which is distributed widely in northeastern Asia as representative natural vegetation [
29]. Since 1967, a long-term study has been conducted at a 110 ha experimental site [
24] in the forest. The experimental site consists of 10 managed blocks, with one unmanaged (control) block. In the managed blocks, single-tree selection cuttings have continued for decades. We targeted a 6.7-ha managed block and a 5.9-ha unmanaged block, in which detailed data are available, in this study. The trees in these blocks have been monitored at approximately 10-year intervals [
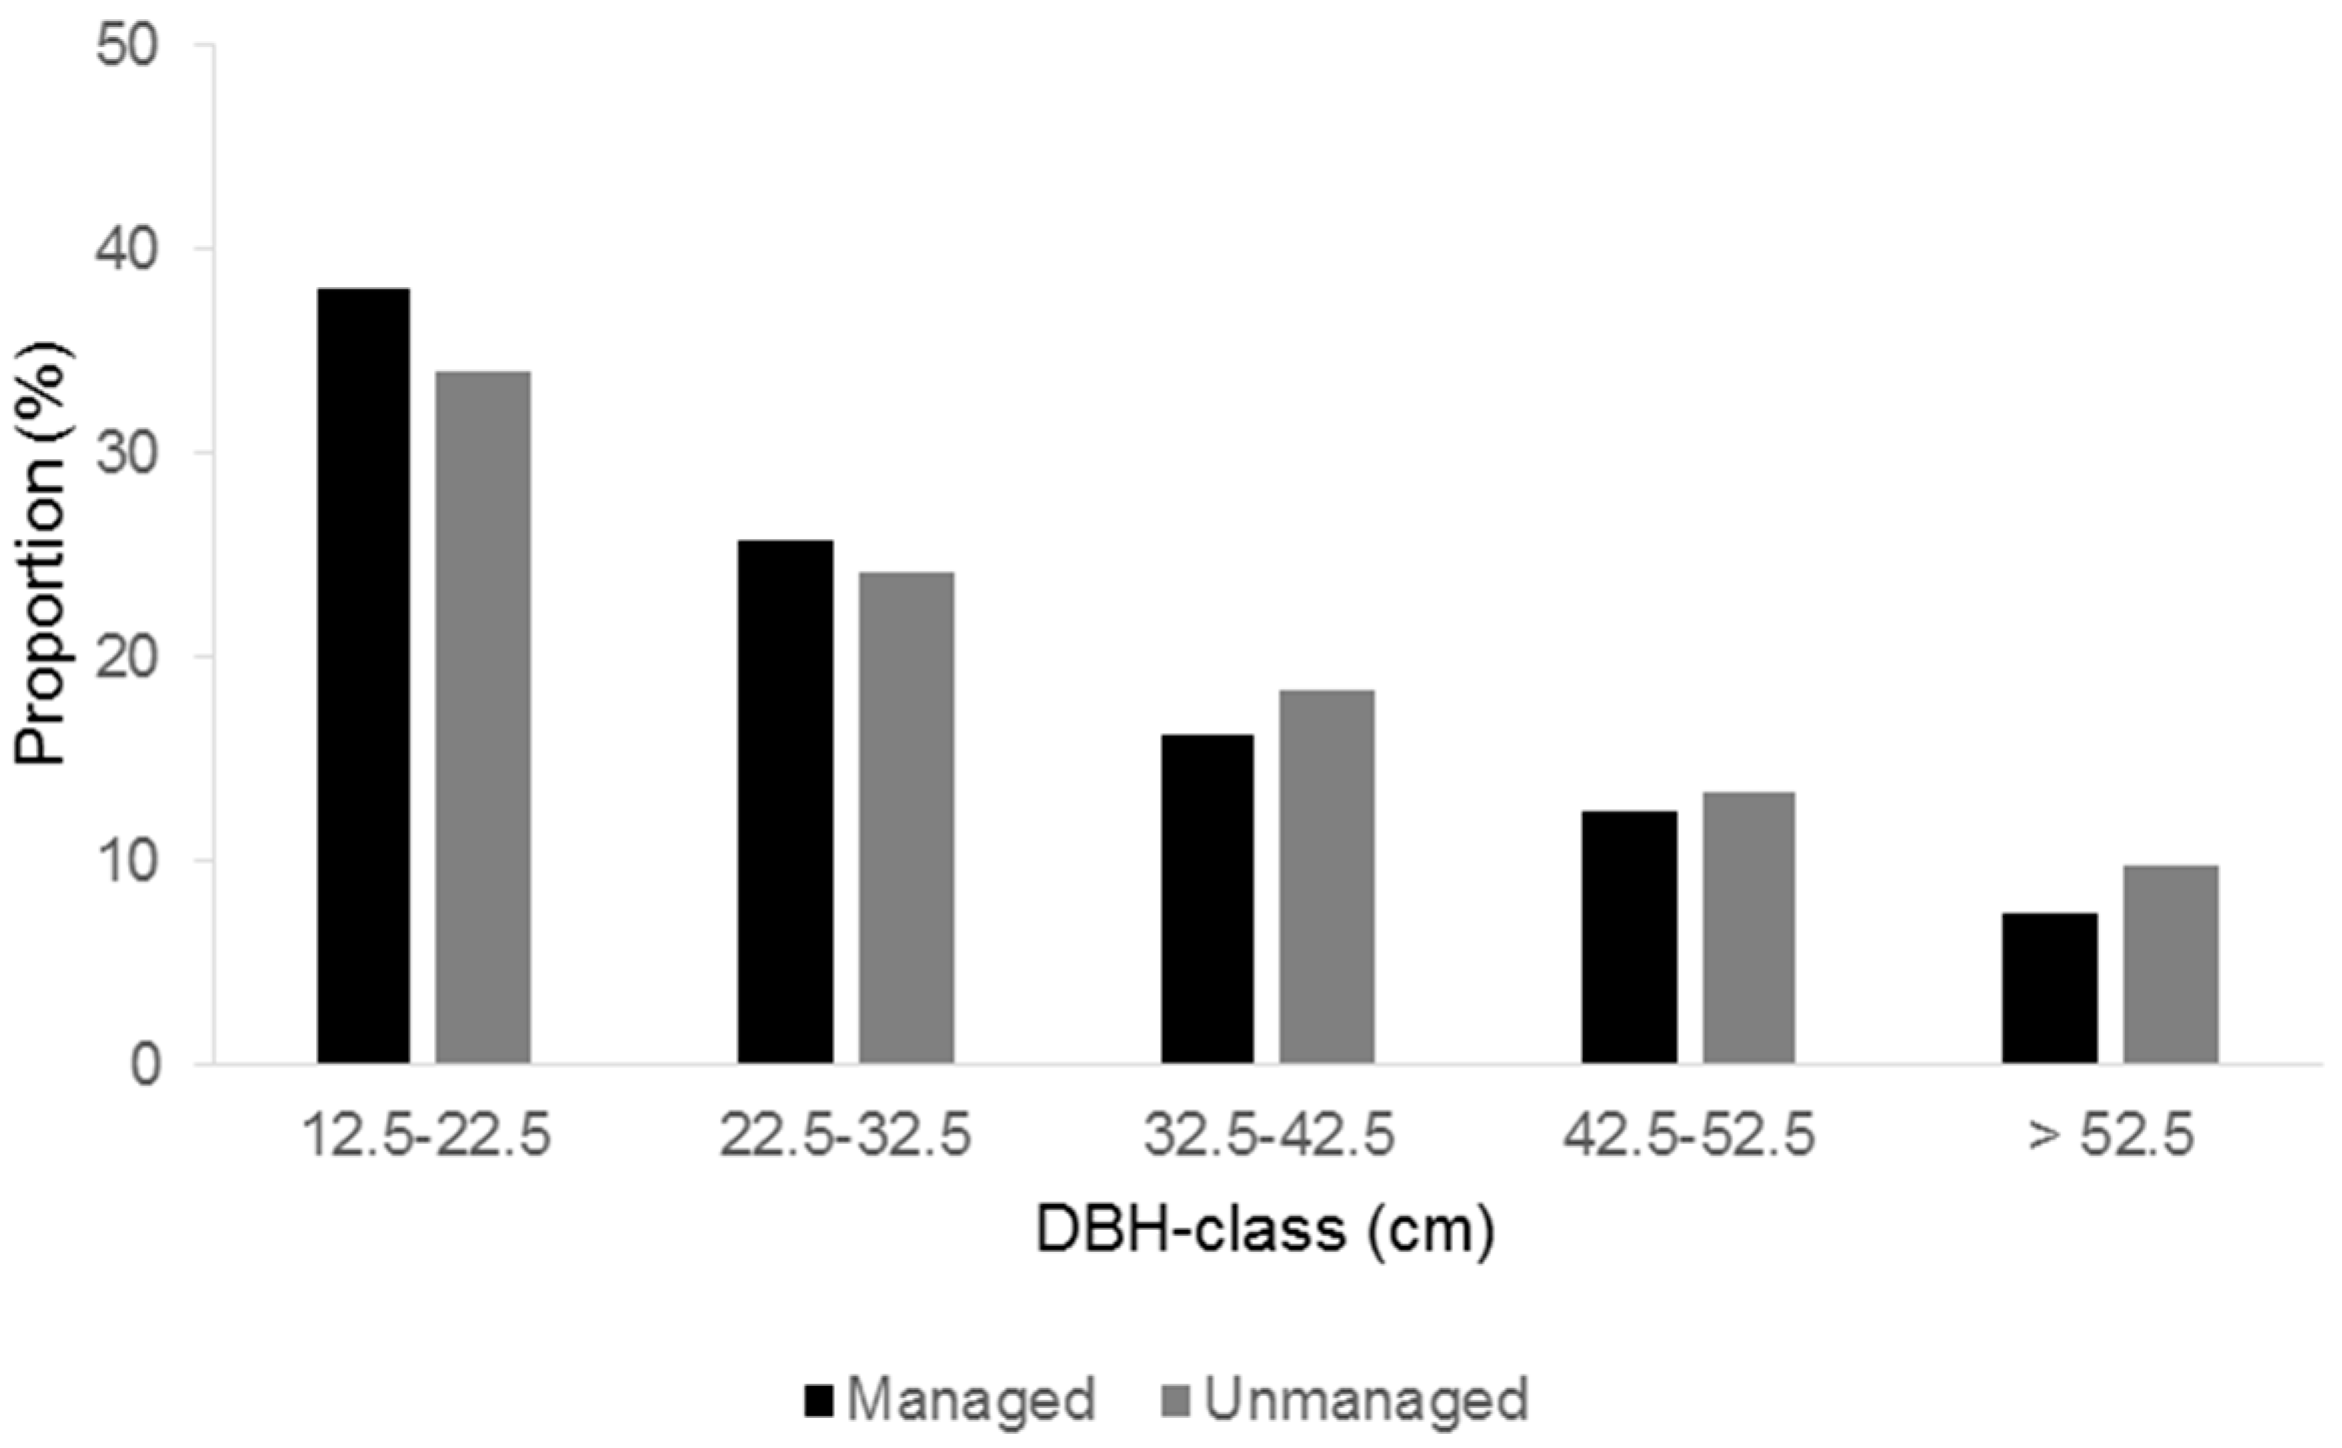
24]. The stand structure and volumes of overstory trees at the beginning of the study were similar between the two blocks (
Figure 1: 260.6 ± 70.0 m
3/ha in the managed block and 268.8 ± 75.6 m
3/ha in the unmanaged block). Tree species composition was also similar (the similarity index based on sum of basal area was 0.70), although the proportion of the most dominant conifer species,
Abies sachalinensis (Fr. Schm.) Masters, was somewhat less in the managed block (
Table S1). The forest floor was widely and densely covered with dwarf bamboos,
Sasa senanensis (Franchet et Savatier) Rehder, and
S. kurilensis (Ruprecht) Makino et Shibata [
30], with shrubs and forbs (such as
Viburnum furcatum Blume and
Cimicifuga simplex (DC.) Wormsk. ex Turcz.) as occasional associates. Soil type was classified as inceptisol (acidic brown forest soil), and the predominant bedrock was Cretaceous sedimentary rock [
29].
The selection cuttings were conducted at 1975, 1985, 1995, and 2005 (the next year of the monitoring; see below) in the managed block, with respective logging intensities of 12%, 17%, 8%, and 11%, which were determined to be equivalent to the monitored volume increment [
31]. Logging was conducted in winter, with a chainsaw for cutting down and heavy machinery for skidding out. The logged trees were selected in a single-tree manner so that a large gap would not be opened up. Although conifer species showed a slightly higher proportion in the total harvesting volume, the strong bias toward a particular tree species was avoided. In terms of tree size, the proportion of logged trees tended to be high in large trees and low in small trees (
Figure 1).
2.2. Field Methods
We examined three attributes of vegetation: (1) overstory trees, (2) dead trees, and (3) understory plants. In addition, as indicators of biodiversity, (4) some elements associated with overstory trees and (5) avian species were subjected. Furthermore, (6) litter and soil were also measured for evaluating carbon stock. The overstory trees and dead trees (except for some elements) were investigated throughout the managed and the unmanaged blocks (12.6 ha area in total). For the other attributes and elements, 10 study stands with an area of 0.16 ha (40 m square) were installed on a uniform gentle slope in the managed and the unmanaged block.
2.2.1. Overstory Trees
Tree individuals with diameter at breast height (DBH) of 12.5 cm or greater were defined as overstory trees, and surveyed for around 30 years in the whole study blocks. Tree censuses were conducted in the spring of 1974, 1983, 1993, and 2003 for the managed block, and 1979, 1990, 2004, and 2010 for the unmanaged block. All of the trees have been identified with numbered tags and their species name and DBH were then recorded. The x-y coordinates of these trees were also determined. For the managed block, we referred to the first census data as representing the state before the management, and used the last census data, which represented the state affected by the management.
2.2.2. Dead Trees
In the second and subsequent rounds of tree census, we also checked the death of trees. We then calculated the total volume of dead trees supplied during the entire study period. In addition, to evaluate the existing volume of dead trees, we quantified standing dead trees and fallen dead trees separately. The standing dead tree is defined as a dead tree whose height is 200 cm or taller. We recorded all of the standing dead trees in the blocks in terms of DBH, height, and a decay class (five classes [
32]). On the other hand, a fallen dead tree is defined as the fallen debris of a tree with a diameter of 12.5 cm or more. We recorded all of the target debris in terms of diameter, length, and the decay class within the study stands.
2.2.3. Understory Trees and Vegetation
A survey was conducted for trees with DBH less than 12.5 cm (understory tree) and other understory plants in the study stands. The understory trees were further classified into small trees (tree height of 200 cm or taller), saplings (tree height of 50 cm or taller, and smaller than 200 cm) and seedlings (tree height smaller than 50 cm, not including current year seedlings). For nine cross-section points (20 m interval) in the study stand, we set a circular plot with a radius of 1.78 m (10 m2 area) for each, and measured the DBH for small trees and height for saplings and seedlings. Also, the coverage and average height of all the other vascular plant species that occurred in the plots were recorded.
2.2.4. Litter and Soil
In the 10 m2 plots, we set three rectangular frames of 50 × 50 cm on the forest floor, and collected all litters, including twigs with a diameter smaller than 12.5 cm. Also, at these points, we collected soil samples (three repetitions for each) from three depths (0–10, 10–20 and 20–30 cm), by using an auger.
2.2.5. Indicator Elements Associated with Overstory Trees
We examined epiphytic bryophytes and lichens on the trunk of overstory trees in the study stands; their coverage on the fixed part (130–330 cm height with 20 cm width in the southern-faced part) of the trunk was recorded for all of the overstory trees. On the other hand, the presence of a cavity (hollow), which was classified into those produced by woodpecker (excavated) and those generated by other natural processes (such as a branch dropping: non-excavated), with a diameter of 5 cm or greater, was also recorded for all of the overstory trees in the study stands.
2.2.6. Avian Species
The appearance of avian species was examined by voice recording using a recorder. It was set at the center of each study stand, and data was acquired in the spring (May), which is a major breeding season for many species. Two hours of sound, including the sunrise time, was recorded, and among the acquired sound data, the data collected over five days of fine and windless weather was used for analysis. In the laboratory, we listened to the recorded data 20 min per day (before and after the sunrise), and recorded the names of the species that we could identify.
2.3. Analyses
We compared the managed and unmanaged blocks for various attributes of stand structures, indicator elements, and carbon stock. First, as the index showing the existing quantity of overstory trees, the volume of a tree was estimated from a volume equation (based on DBH [
33]) adapted to the study site. Next, the number of trees with DBH 42.5 cm or more was counted as an index of large-diameter live trees, which are more likely to generate resources and habitats for many biota. Also, the standard deviation (SD) of DBH was compared, because it has a significant correlation with the three-dimensional structural complexity of the stand [
34]. The averages of these indexes calculated in units of 0.16 ha (40 m square) were compared. The tree species composition was evaluated by the Shannon-Wiener diversity index and the Bray–Curtis similarity index, which were calculated based on the volume of each tree species.
Dead trees, which provide important habitats for many biota [
32], were evaluated by the supplied volume throughout the study period (around 30 years), and the existing volume of standing and fallen dead trees. Understory trees, which are important for regeneration, were counted by the three size classes (small tree, sapling, and seedling). Understory vegetation was evaluated as a total volume (coverage multiplied by mean height of each species), and mean coverage by the eight species groups (i.e., tall tree, dwarf bamboo, shrub, forb, grass, fern, sedge, and wine). In addition, the Shannon–Wiener diversity index based on the number of stems or coverage of species was compared.
The carbon and nitrogen concentrations were determined from the collected soil samples. The quantity of litter was represented by the dry weight. We investigated the carbon stock in the six basic components (overstory tree, understory tree, understory vegetation, dead tree, litter, and mineral soil up to 30 cm depth) according to the following procedures. For overstory and understory trees, we estimated biomass (stem, branch, leaf and root, separately) by allometric equations [
35]. Then, the carbon stock was calculated with reference to the published carbon concentrations [
35]. For understory vegetation, we estimated the biomass of the eight species groups using an allometric equation developed for each, and their products with the carbon concentrations (determined using a CN (carbon and nitrogen) analyzer; NC-900 (SHIMADZU Co., Kyoto, Japan)) are multiplied. The carbon stock in dead trees was evaluated from the existing volume; the specific gravity and carbon concentration for each decay class and species groups [
35] was used to estimate the carbon stock. Regarding the belowground part of dead trees, we used the allometric equations for the root system [
36] together with the average rate of decay measured in this study site [
35]. For the collected litters, after measuring the dry mass, a part of each sample was analyzed with the CN analyzer. The carbon stock was calculated by multiplying dry mass by carbon concentration.
Avian species were grouped by three habitat guilds (i.e., cavity user, trunk user, and understory user), and the frequency of appearance of each in five observations for 10 stands was calculated. In addition, the Shannon–Weiner diversity index based on the appearance frequencies of species was compared.
In order to clarify whether there is a difference in the indexes between the managed and unmanaged stands, we used a generalized linear model in which the explanatory variable was represented by a category (managed = 1 and unmanaged = 0). In the models, we assumed Poisson distribution (with log link function) for discrete variables, and Gaussian distribution (with identity link function) for continuous variables. For some attributes of overstory trees, the value at the beginning of the study was considered as an offset term. If the coefficient was statistically significant (Wald test), it was inferred that the management had a significant influence. On the other hand, for the indicator elements associated with overstory trees (bryophyte, lichen, and cavity), we analyzed them with a generalized linear mixed model in order to refer to the effect of the management, together with the effect of the characteristics of the individual trees. We incorporated the ID of the study stands as a random effect, and assumed binomial distribution (with logit link function) for the presence of a cavity, and Gaussian distribution (with identity function) for the coverage of bryophytes and lichens. In these models, the explanatory variables were the presence or absence of the management (category variable), species group (conifer or broadleaved species: category variable), and tree size (DBH).
Furthermore, to examine a difference in the spatial distribution of trees between managed and unmanaged blocks, we used Ripley’s L-function, which is a refinement of the K-function [
37]. We obtained the 95% confidence interval of a random distribution by using random points; if the calculated L-function exceeded and fell below the interval, the spatial distribution was judged as aggregated and uniform, respectively.
All of the statistical analyses were performed within the software package R [
38].
3. Results
There was no significant difference in the total volume of overstory trees between the managed and unmanaged stands (
Table 1). Regarding the managed stands, the difference was not significant, even when compared it with the value before the management (beginning of the study;
Table S1). The number of large-diameter live trees defined as having DBH of 42.5 cm or greater remained at about three quarters of the unmanaged stands (
Table 1;
Figure 2). There was no significant difference in the standard deviation of DBH between the stands. Similarly, there was no significant difference in the species diversity index of the overstory trees (
Table 1). The similarity of the overstory tree species composition between stands reached a value of 0.89 (
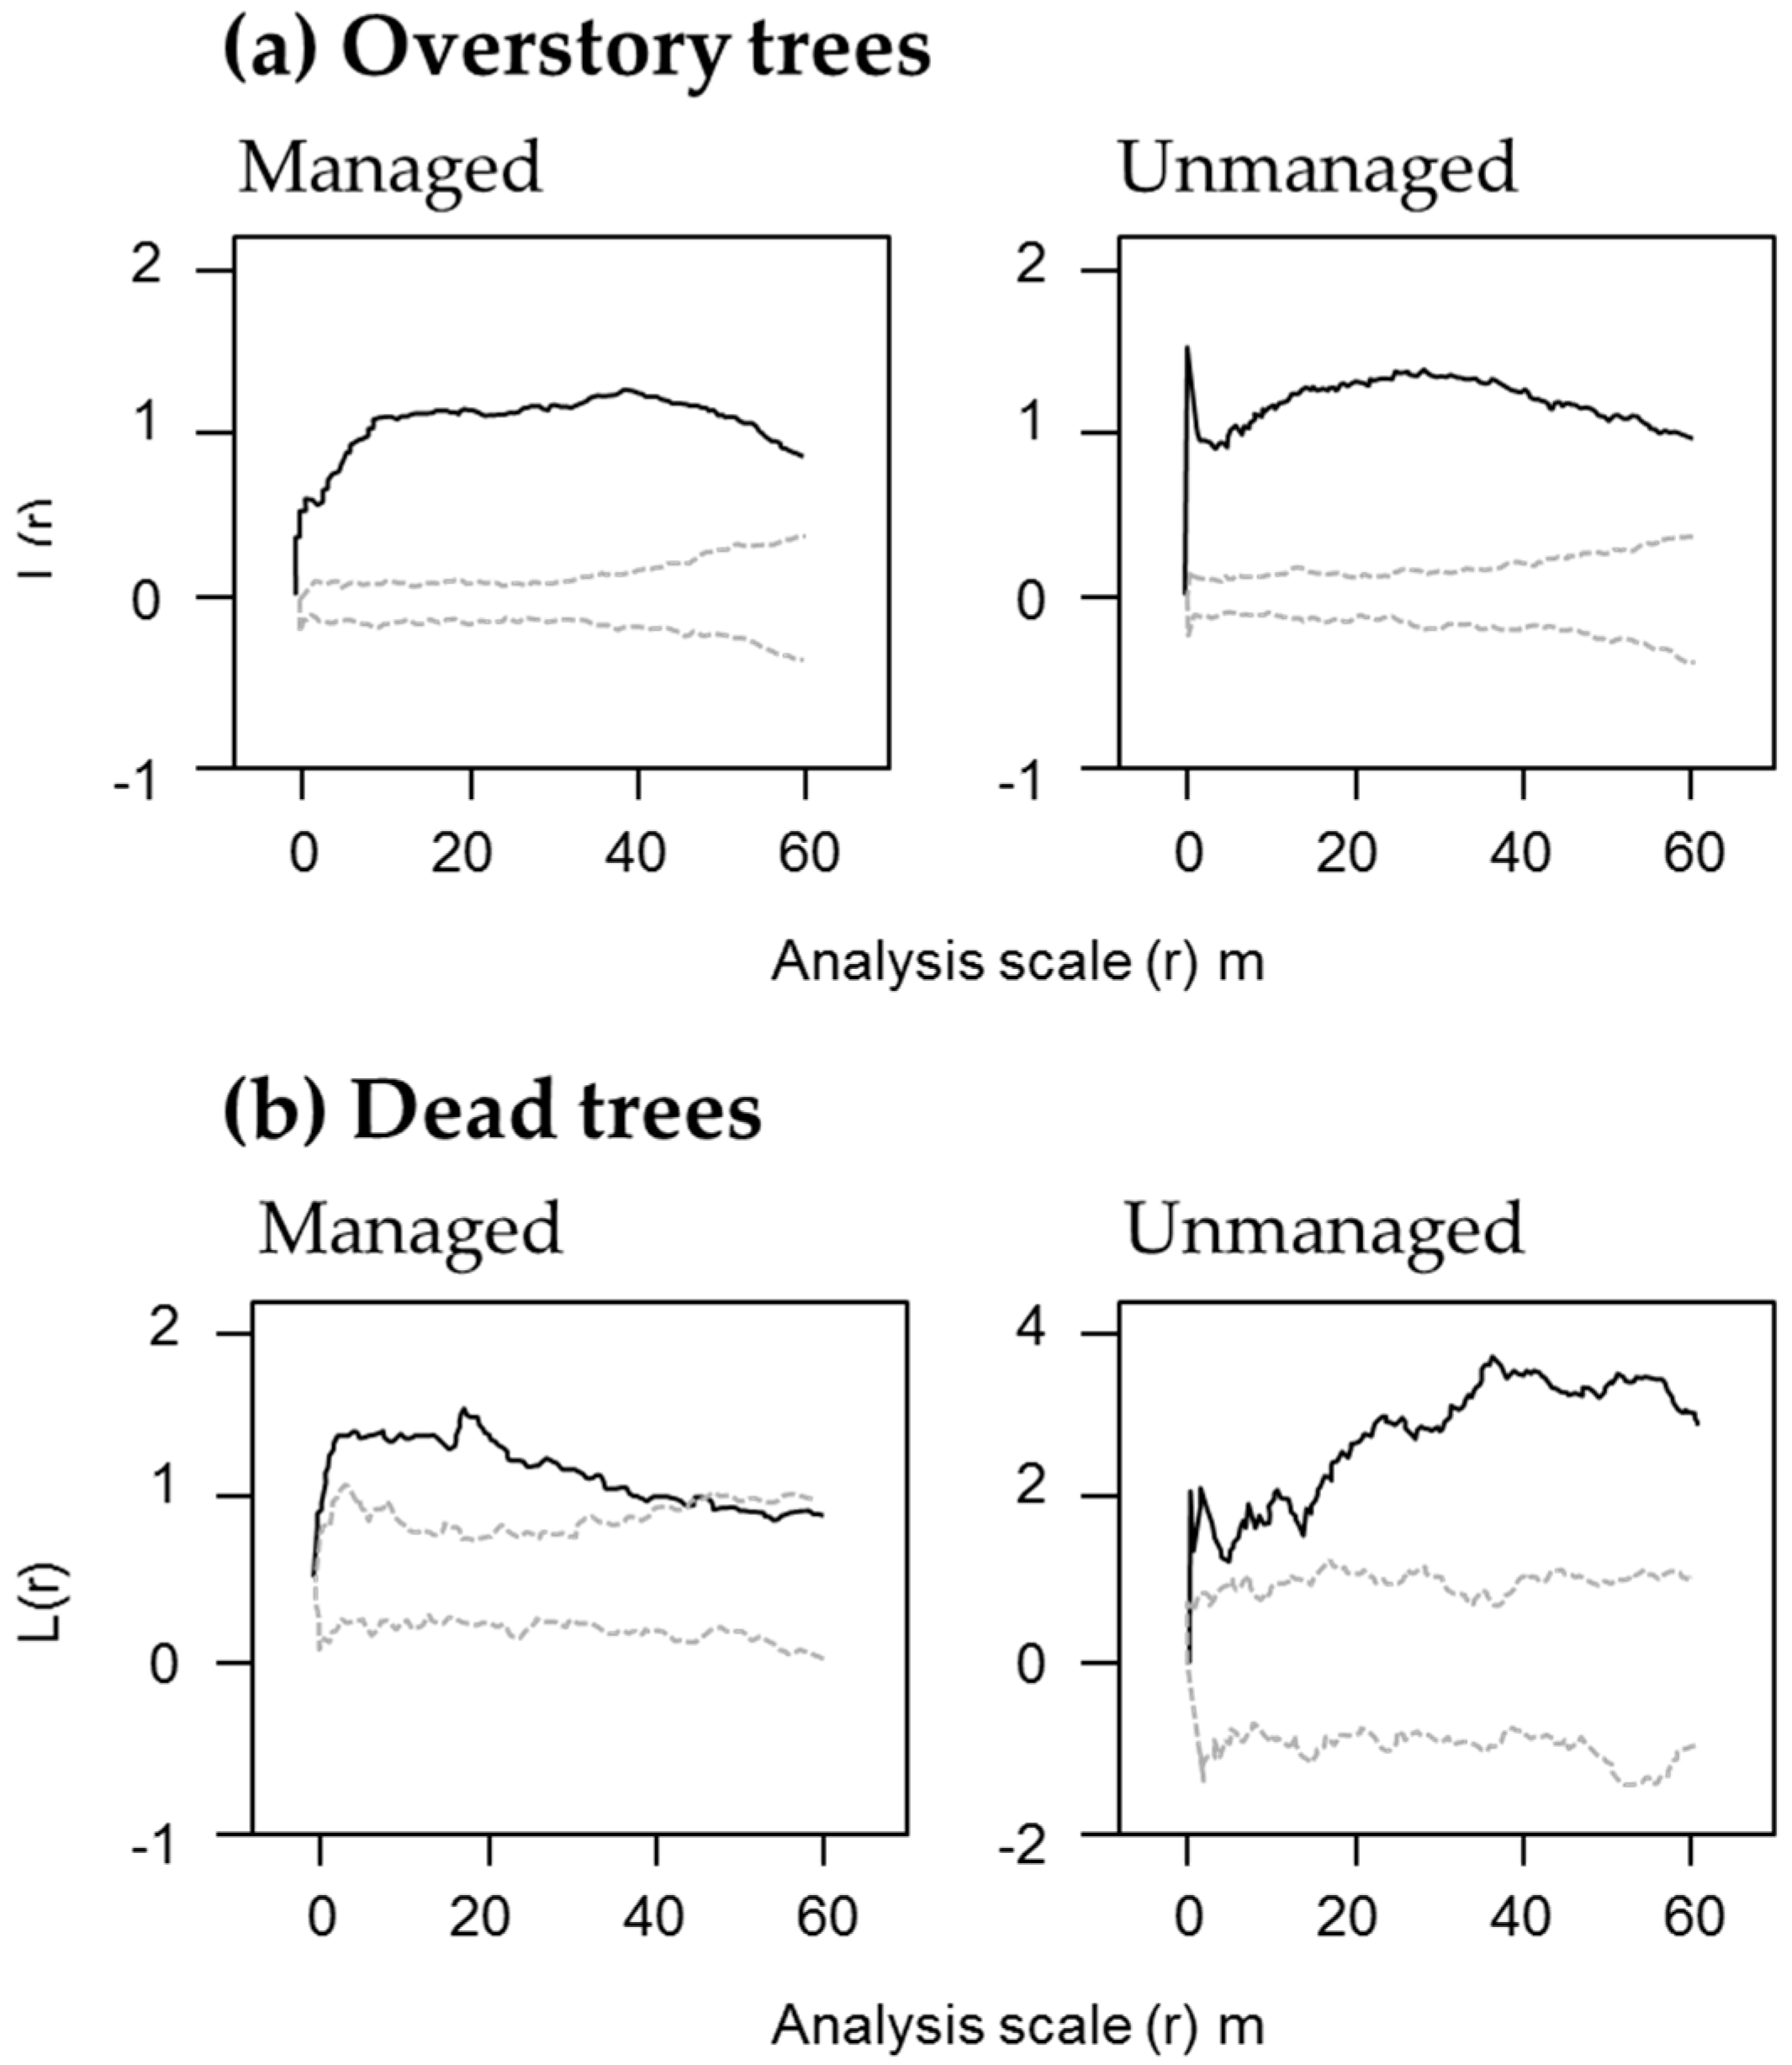
Table S1). The spatial distribution pattern of the overstory trees showed a tendency to aggregation, and there was no clear difference between the managed and unmanaged blocks (
Figure 3a).
The total volume of deaths of trees during the study period (around 30 years) was about half in the managed stands (
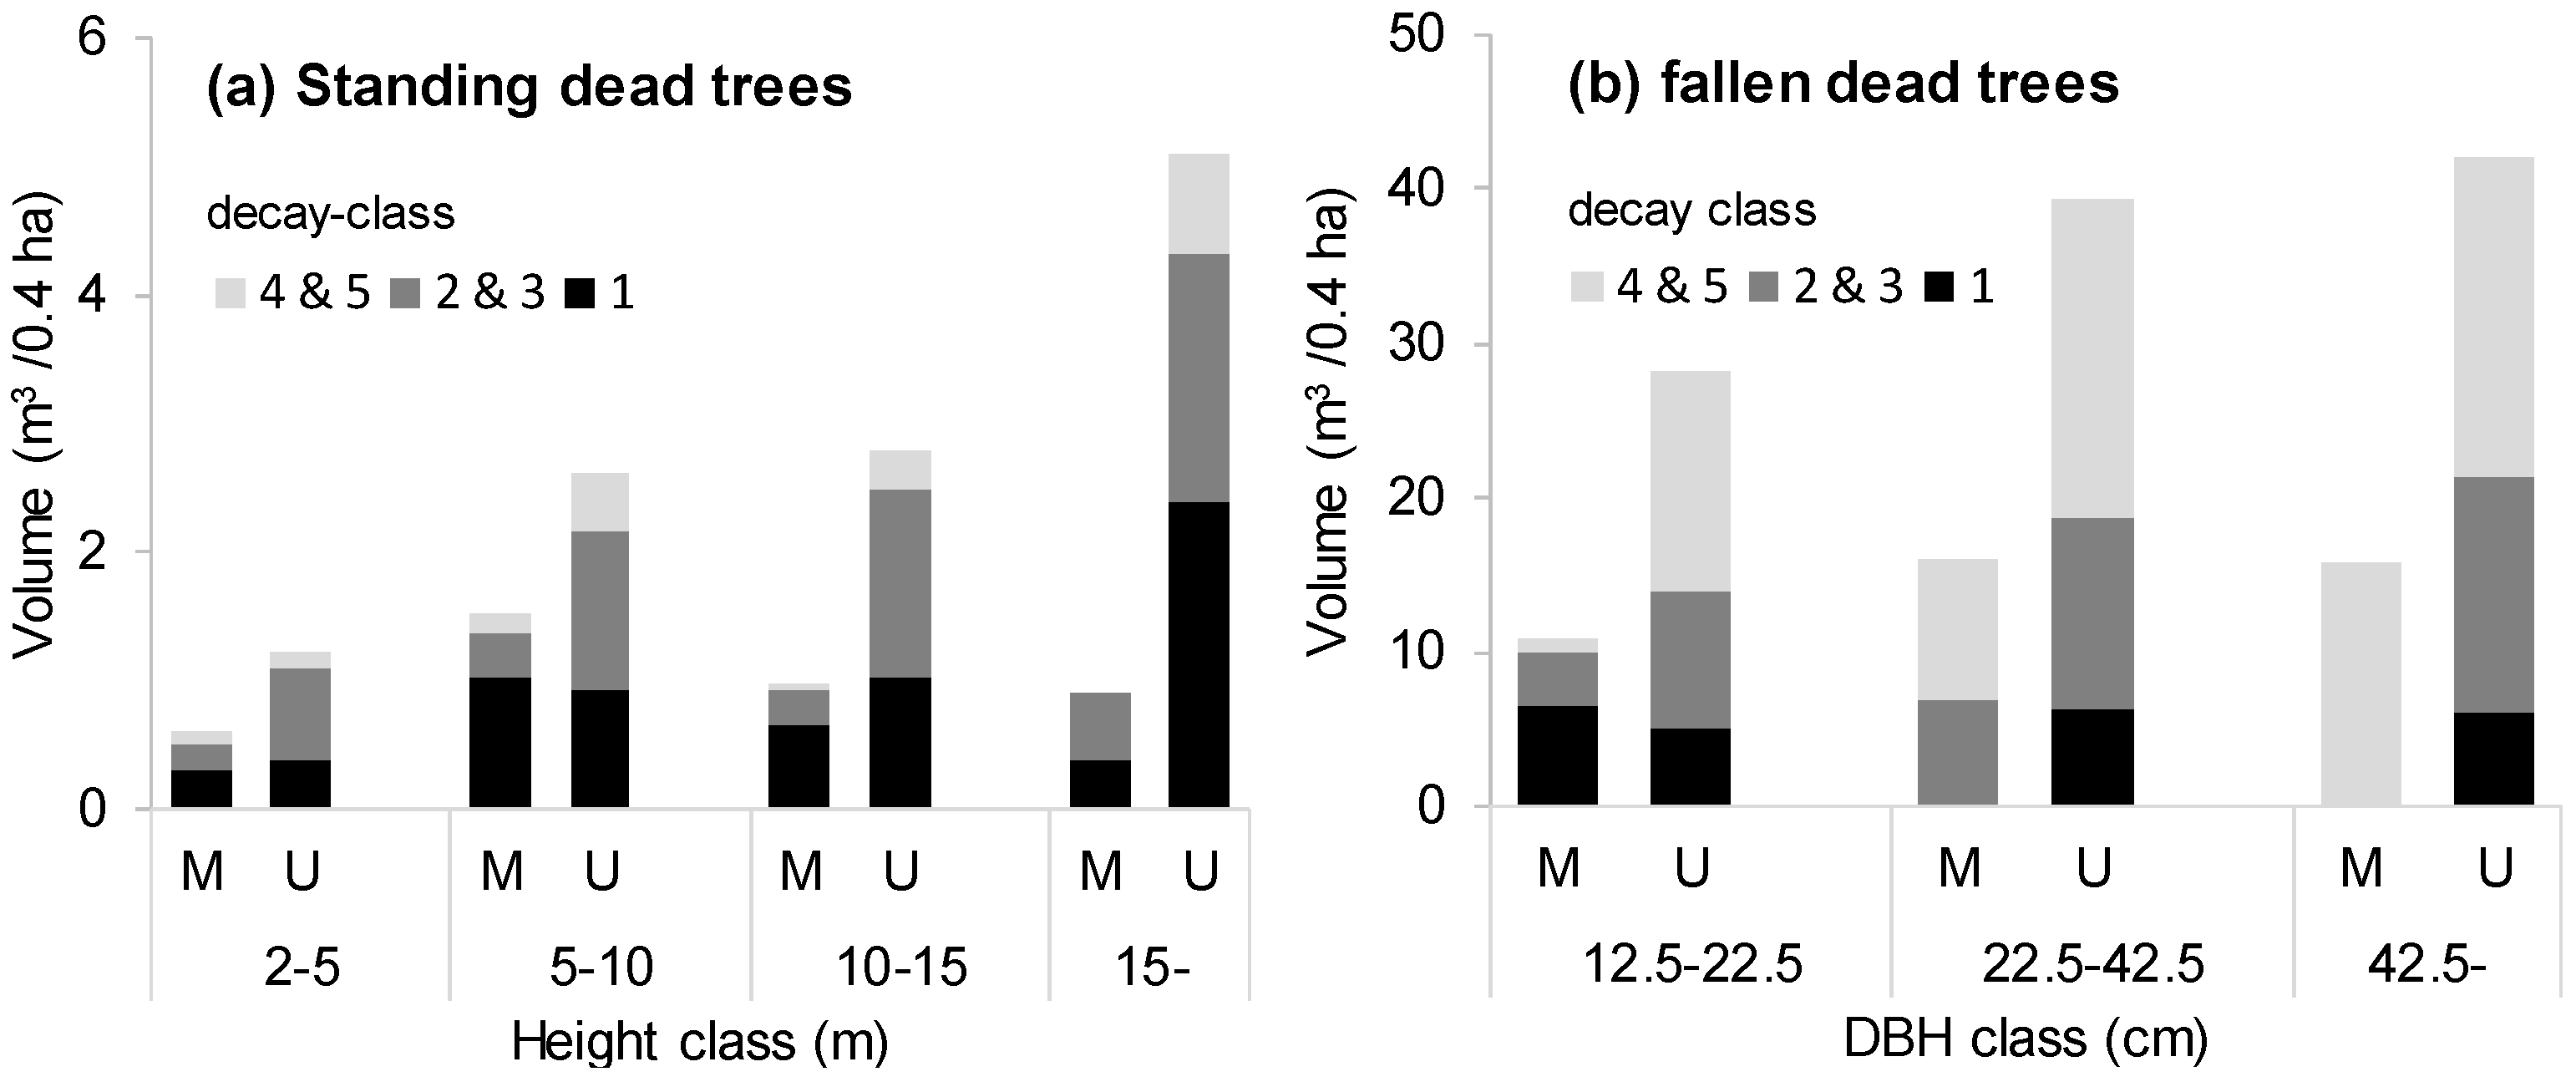
Table 2). There was a large difference (less than half) in the case of standing dead trees. Also, the difference in the volume of fallen dead trees was large, although no significant difference was observed due to the large variation. In particular, the quantity of large dead trees was particularly small (
Figure 4); standing dead trees with a height exceeding 15 m were less than one fifth, and fallen dead trees exceeding 42.5 cm in diameter were less than one third in the managed stands. There were no advance-decayed standing dead trees in the managed stands. The spatial distribution of the dead trees showed an aggregated pattern regardless of the scale in the unmanaged stands, whereas the managed stands showed a random distribution in the large spatial scale (
Figure 3).
The numbers of small trees, saplings, and seedlings were significantly more abundant in the managed stands (
Table 3). The volume of understory vegetation was also greater (marginally significant) in the managed stands. On the other hand, there was no significant difference in the mean coverage between the stands in any plant group. Also, there were no significant differences in the species diversity index of the understory vegetation (
Table 3); the similarity index was 0.75 between the stands (
Table S2).
There was no significant difference between the stands in the carbon and nitrogen concentration in the soil (in any depth class), or the quantity of litter on the forest floor (
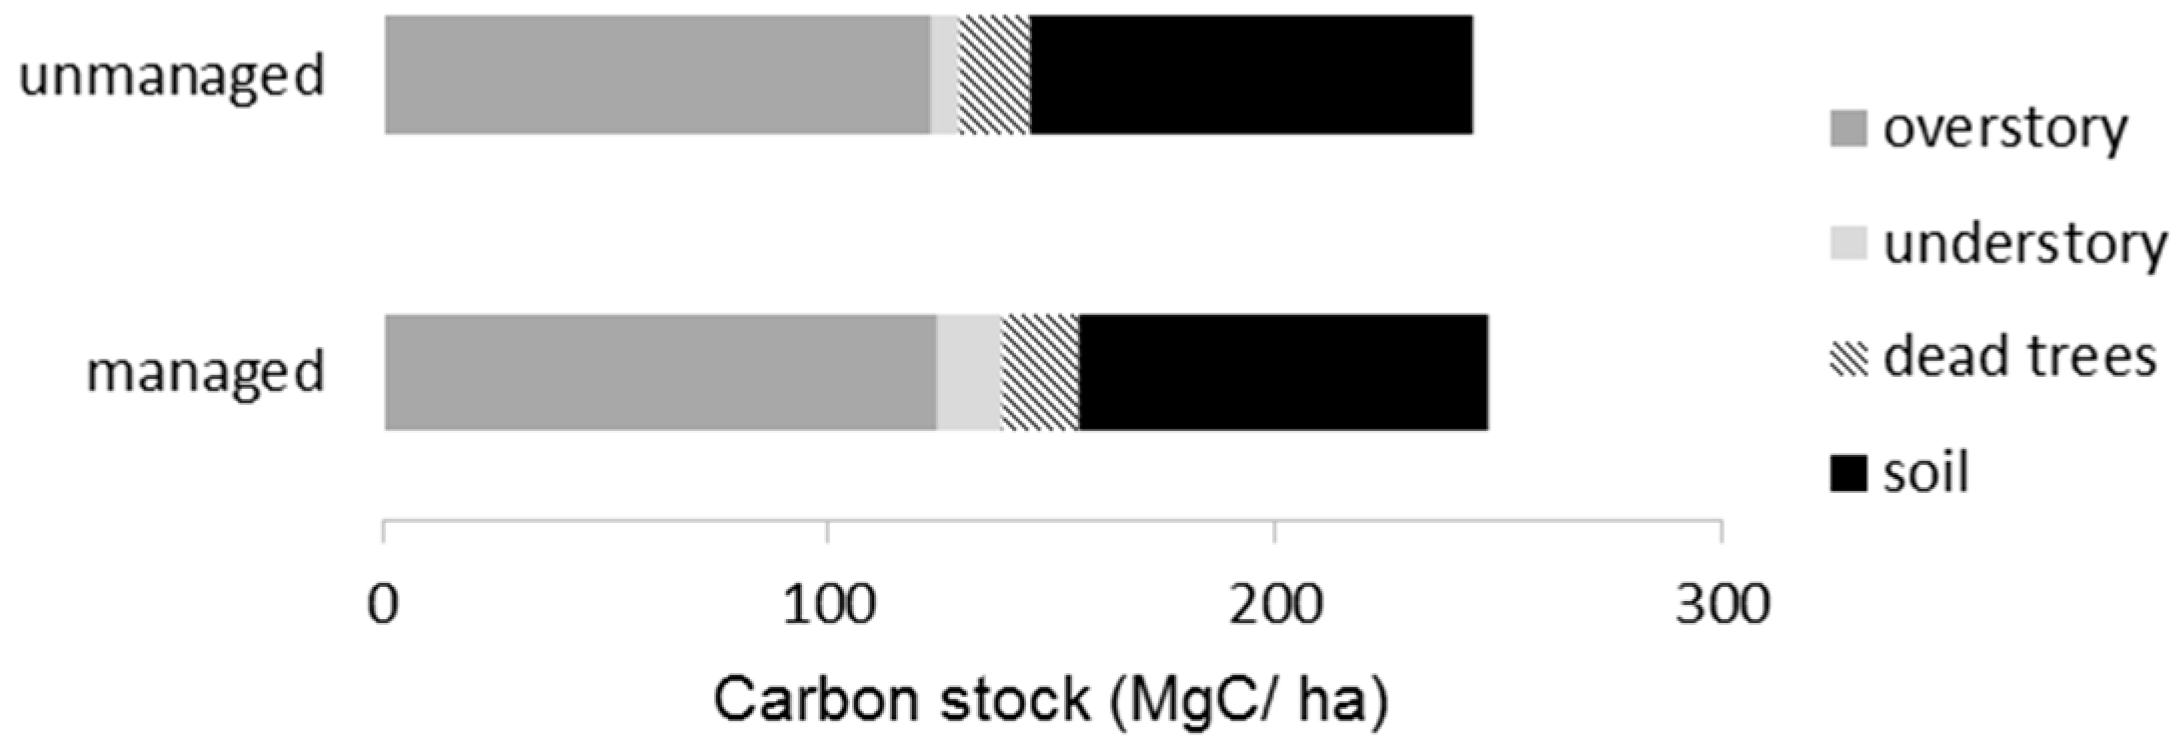
Table 4). The total carbon stock in the managed stands was estimated to be 247.9 MgC/ha, which was almost equal to that of the unmanaged stands (244.6 MgC/ha). The carbon stock in overstory trees reached about 50% among the six ecosystem components (
Figure 5). The soil carbon (up to 30 cm depth) shared 33%, followed by dead trees (10%) and understory vegetation (7%).
Regarding the indicator elements associated with overstory trees (
Table 5), it was revealed that the proportion of trees having a non-excavated cavity and the mean bryophyte coverage were significantly smaller in the managed stands. On the other hand, no significant difference was found in the proportion of those having an excavated cavity and the mean lichen coverage. The probability of individual trees having a cavity (both excavated and non-excavated) was higher in broadleaved species, and depended positively on the tree size (own basal area) (
Table 6). The mean coverages of lichen and bryophyte were less abundant in managed stands, although their dependencies to the species group were different.
The appearance frequencies of avian species groups using tree cavities or trunks were about half in the managed stands (
Table 6). On the other hand, no significant difference was found in the species groups using understory vegetation. There was no significant difference in species diversity of the avian species; the similarity of the species composition was 0.71 between the stands (
Table S3).
4. Discussion
Thirty years of single-tree selection cutting affected neither the volume, size structure, species diversity, nor the spatial distribution of overstory trees in the managed stands (
Table 1,
Figure 2 and
Figure 3). These measures mirror those for the unmanaged stands, suggesting that single-tree selection with a logging intensity corresponded to the volume increment maintained stand attributes long-term [
16,
21].
Carbon stocks in the managed and unmanaged stands were nearly identical (
Table 4,
Figure 5), suggesting that the forest management did not reduce carbon accumulations in the ecosystem [
39,
40]. This finding is attributable to maintaining the volume of overstory trees, which account for about half the total carbon accumulations (
Figure 5). In addition, forest management apparently conserved soil properties (
Table 4), which account for one-third of the total carbon accumulations [
41,
42]. In the site studied, selection cutting occurred during the snowy season, which is a common practice in Hokkaido, and disturbance to the soil seems minimal. The less intensive disturbance to canopy and soil may have reduced the impacts on the biogeochemical cycle, including the supply and decomposition of organic matter. That contrasts with clear-cutting and intensive site preparation, which have been shown to impair soil and retard the recovery of carbon accumulations over time [
43]. In this study, we disregarded whether forest management influenced the quality of stream water, because a previous study showed that its influence is small, given the rich vegetation on the region’s forest floor [
44].
However, forest management significantly influenced the quantity of large-diameter live trees and dead trees. Generally, large-diameter trees are preferentially harvested [
13], because they offer more economic value, and yield as much timber as harvesting a greater number of smaller trees. Also, large trees grow more slowly than smaller trees and aid less in replenishing forests [
45]. As a result, logging was biased toward large trees in the study site (
Figure 1), where the silvicultural regime emphasized maintaining the volume of trees.
The number of dead trees in the managed stands was about half that of the unmanaged stands (
Table 2), probably because the cuttings target trees expected to die during the next rotation period [
46,
47]. Volumes of standing and fallen dead trees were also reduced by half via the management. The lesser abundance of larger dead trees may relate to the harvesting of large live trees (
Figure 1). It may also be that large standing dead trees are more likely to be destroyed by logging and skidding [
48]. The managed stands especially evidenced no standing dead tree with advanced decay, although there was no constant trend in the existing volume by category of decay (
Figure 4). Decay is a lengthy process [
32], and it may take time for the effects of management to appear. Dead trees accounted for 9.6% of total ecosystem carbon accumulations, confirming their importance as a component of carbon accumulations [
49,
50].
In the managed block, dead trees show random spatial distribution on a larger spatial scale (
Figure 3). This differs from the inherent pattern of natural forests. Dead trees in natural mixed forests generally are spatially aggregated [
51,
52], as was the case in the unmanaged block we examined. This is probably related to “gap expansion”, which shows an accelerated mortality of live trees located near dead trees [
53,
54,
55,
56,
57]. We suppose that the random distribution might be caused by the installation of many canopy gaps by selection cutting, which triggers subsequent natural deaths of trees throughout the forest [
58]. Homogenized spatial distributions are reported in selection cut stands in forests in other regions [
12].
The managed stands evidenced substantially more understory trees, suggesting advanced regeneration versus the unmanaged stands (
Table 3). The volume of understory vegetation was also more abundant in the managed stands. The quantity of dwarf bamboo, a dominant understory species in the study site, often correlates negatively with the volume of overstory trees [
30], and rises after disturbance. Nonetheless, the overall difference between stands was small, and there was no significant difference in species diversity among understory vegetation (
Table 3). Similar results are reported in stands under single-tree selection cutting [
47,
59,
60]. Understory vegetation accounted for 6% of total carbon accumulations in this forest (
Figure 5).
Compared with the unmanaged stands, trees in the managed stands had about two-thirds the number of non-excavated cavities [
17] (
Table 5). However, incidence among individual trees depended on their size and species group [
61], with no evident influence from forest management (
Table 6), indicating that the average per tree is higher in the unmanaged stands because large trees were abundant. On the other hand, bryophyte coverage was negatively affected by management regardless of tree size (
Table 6). This may result from increased light and/or reduced humidity due to gap formation [
62].
Birds that nest in cavities are generally attracted to large and dead trees [
63,
64,
65]. Perhaps their lesser number in the managed stands reduced their occurrence frequency (
Table 7). Overstory trees with epiphytic bryophytes and lichens also are avian feeding sites because they attract invertebrates [
66], and the lesser bryophytes in the managed stands may reduce the frequency of trunk-user species there. No significant difference was observed among birds attracted to understory vegetation. The managed stands had slightly richer understory vegetation, but mean coverage did not differ between the managed and unmanaged stands. The habitat may be of sufficient quality for avian species even in the unmanaged stands, because the coverage of dwarf bamboo exceeded 70% there.
5. Conclusions: Implications for Forest Management
Single-tree selection cutting, which tries to create a balance between volume increments and logging intensity, helped somewhat in maintaining the complex stand structures related to overstory trees. Forest management also seems to have restricted impacts on carbon accumulations (including soil components) in the long term. We conclude it can be an alternative to clear-cutting in the region.
However, selection cutting was limited in maintaining some biodiversity elements in the managed stands. It affected the quantity of some structural attributes and indicator elements. Habitats important for the nesting and foraging of diverse species were significantly less abundant in the managed stands. Perhaps the harvesting of large-diameter live trees caused a cascading decline in cavities and the avian species that rely on them. Moreover, the numbers of birds that feed on epiphytic bryophytes declined, perhaps through microclimatic change associated with gap formation.
Conserving the structures and indicators measured here make it necessary to revise the selection of cut trees and consciously leave ecologically important structural attributes unaffected [
67]. Instead of harvesting large-diameter live trees and removing dead trees, forest management should seek to retain a percentage of them. The exact percentage needed to be retained depends on the stand conditions and the specific forest management goals, and it is ideal to reference previously commonly used approaches (such as keeping of five to 10 old trees with hollows per hectare for nesting wildlife [
68]). The recommendation may involve reducing the intensity of logging, because these remaining components do not contribute largely to volume increment. Therefore, for adopting this concept, an economic compensation system for the maintenance of multiple functions of forests is required.
An adequate volume of overstory trees is found to be a prerequisite for many ecosystem functions, but the volume of trees had declined considerably in many managed stands under the selection cutting regime in Hokkaido. An earlier simulation [
25] forecasted that the current selection cutting regime will reduce the volume of trees by 50% in 100 years, largely by inhibiting natural regeneration [
58,
69]. Studies endorse several remedies (e.g., site preparation), and future evaluations should include their effects.
This is the first Japanese study to evaluate how selection cutting affects multiple ecosystem functions, but overall evaluations of the functions remain for future study. It is important not only to simply compare managed stands with unmanaged stands, but also to clarify causal relationships of ecosystem functions with stand structures and selected indicator elements. In addition, possible differences of the effects due to forest type, topography and geology, equipment to be used, etc. must also be verified in the future. Moreover, our conclusions about avian species were spatially and seasonally limited; multi-seasonal data covering larger areas are needed. In addition, to clarify how the random spatial distribution of dead trees influences biodiversity merits future investigation. It is also necessary to pay attention to the possibility that the influence of forest management will become obvious in the long term [
18,
19,
70,
71].
Logging intensity and retention will vary case by case with the particular ecosystem functions desired. Plans for ecologically and economically sustainable forest management should include a range of logging intensity and retention goals, as demonstrated in variable retention [
3,
6] and free-style silviculture [
72]. It is desirable to develop simulations that offer long-term predictions of stand structures, and indicators that are extensible on a large scale and take into account the relevant economic considerations.


