Application of Fuzzy DEMATEL Method for Analyzing Occupational Risks on Construction Sites


1
Department of Industrial Engineering, Yildiz Technical University, 34349 Besiktas, Turkey
2
Faculty of Civil Engineering, Vilnius Gediminas Technical University, LT-10223 Vilnius, Lithuania
*
Author to whom correspondence should be addressed.
Sustainability 2017, 9(11), 2083; https://doi.org/10.3390/su9112083
Submission received: 7 September 2017
/
Revised: 9 November 2017
/
Accepted: 9 November 2017
/
Published: 13 November 2017
(This article belongs to the Special Issue Sustainability in Construction Engineering)
Abstract
:The construction industry is known as a hazardous industry because of its complexity and strategic nature. Therefore, it is important to know the main causes of occupational accidents to prevent fatal occupational accidents in construction industry. At building construction sites, workers performing tasks are continuously exposed to risks, not only emerging from their own mistakes but also from the mistakes of their co-workers. A great deal of studies investigating risks and preventing occupational hazards for the construction industry has been carried out in the literature. The quantitative conventional methods mostly use either probabilistic techniques or statistics, or both, but they have limitations dealing with the ambiguity and fuzziness in information. In this study, to overcome these limitations, an applicable and improved approach, which helps construction managers to propose preventive measures for accidents on construction sites, is proposed to simplify the risk assessment. It is shown that the Fuzzy Decision Making Trial and Evaluation Laboratory (DEMATEL) method can evaluate causal factors of occupational hazards by a cause–effect diagram and improve certain safety measures on construction sites. In addition, sensitivity analysis is conducted to verify the robustness of the results.
1. Introduction
The construction industry is infamous for the highest accident rates compared to any other industry in many parts of the world [1]. The amount of work accidents and injuries has been increasing drastically for years in construction industry. This occurs because the construction industry comprises higher percentage of self-employed workers, and large number of seasonal and migrant workers [2]. Hence, the importance of accident and injury prevention, which requires a knowledge of accidents’ causal factors and how the factors increase the probability of risks that can cause accidents, has arisen [3,4].
The literature on occupational risk assessment reveals that accidents are caused from a wide range of factors such as unsafe tools, conditions related with the work site, the industry specific problems, unsafe methods related with the work, human factors and management issues [5]. Physical hazards on construction sites occur because of continuing exposure to mechanical process or work activity. As a result, physical hazards can cause various types of injuries, from minor and requiring first aid only, to disabling and/or fatal.
Physical hazards involve conditions such as working at height, falling objects, exposure to electricity, etc. Falls from height have been regarded as the most frequent cause of injury or death among the accidents on construction sites [6]. Slips and trips that cause fall are also assumed as the most prevalent occupational hazards and lead to one third of all serious injuries. Being struck and crushed by equipment, fires and explosions related with the ignition of flammable materials are other common occupational risks on construction sites. For example, Pipitsupaphol and Watanabe [7] represented that falling, workers being struck by falling objects, stepping on or striking against objects are the three most frequently occurring type of accidents in Thailand. In addition, OSHA (Occupational Safety and Health Administration) and Huang and Hinze [8] informed that falls and struck by falling objects also have been the cause of the highest number of injuries and fatalities in the U.S. construction industry.
As for occupation type, particularly, falling off machines and machines overturning when travelling up or down slopes are commonly encountered major hazards for construction site workers [9]. In addition, electrical devices such as cables, circuit breaker panels and cords present a high risk for workers in areas exposed to electricity. Common sources of these physical injuries on construction sites occur due to technical or human errors [10]. Dumrak and Mostafa [11] and Jackson and Loomis [12] claimed that truck drivers, plant operators, electricians are highly susceptible to fatal accidents.
These may arise from lack of safety knowledge, training, supervision, uncontrolled working environment, inability to carry out a task safely, and error of judgments, carelessness, apathy or reckless operations. Unsafe behaviors, which are the results of a poor safety culture, are other significant factors in the cause of site accidents [13]. In addition, safety is considered as part of Total Quality Management (TQM); poor safety practices are also accepted as the cause of accidents and subsequent injuries [2].
According to Toole’s [14] study in the USA, the causes of accidents include: unsafe methods or sequencing; deficient enforcement of safety; lack of proper training; safety equipment not provided; unsafe site conditions; poor attitude toward safety; not using provided safety equipment; and remote and deviation from regular behavior. Similarly, in their study, Tam et al. [15] addressed that the main factors affecting safety performance are reckless operations, lack of training, and poor safety awareness of supervisors and top management.
Tam et al. [15] represented that trained or skilled workers ensure improvement of the site safety. However, high mobility of workers on construction sites and frequent move from one construction site to another makes it difficult to train workers. Dester and Blockley [16] and Zhou et al. [17] pointed that the poor safety in the construction industry occurs because of poor safety culture rather than the inherent (nature) hazards of the industry. In addition, Agvu and Olele [18] represented that poor safety culture cause increased rate of unsafe acts/fatalities in the Nigerian construction industry. Barofsky and Legro [19] and Folkard and Tucker [20] concluded that fatigue is a versatile and complex occurrence, including physical, mental and emotional stress and other behavioral points, all of which require additional examination. The importance of management commitment to safety and safety regulations, which influence organizational safety performance in a good way, are indicated by Ismail et al. [21]. In addition, they represented that there is a relationship between safe behavior, safety rules, and legalization, and management commitment.
Causes of accidents in construction industry are obtained in many ways using variety of ORA (Occupational Risk Assessment) methods.
In this study, a better and more practical approach is recommended to simplify the risk assessment process for construction industry. The DEMATEL method is commonly used to obtain a cause–effect diagram of interdependent factors. This method is superior to conventional techniques due to exposing the relationships between criteria, ranking the criteria relating to the type of relationships and revealing intensity of their effects on each criterion. Since a single method is not sufficient to identify occupational risks under uncertainty and vagueness, there exists a need to apply an integrated approach to solve the problem considered. Therefore, fuzzy linguistic modeling is utilized to represent and handle flexible information [22].
Accordingly, the DEMATEL method is used to reveal the effect and cause criteria, and to increase the model applicability in terms of linguistic variables combined with triangular fuzzy numbers. As a multi criteria decision making method, DEMATEL contributes to risk assessment literature a different point of view by providing an evaluation that enables modeling cause and effect relationships among the risk factors and exposing the degree of relation or the strength of influence analytically [23].
The proposed approach presents the following advantages compared to traditional methods for ORA:
- (1)
- The proposed method illustrates the interrelationships among critical occupational hazards by constructing causal relationship among construction activities.
- (2)
- Identifying each hazard using triangular fuzzy numbers gives better and more reliable results, as the uncertainty and vagueness of the data can be managed with a fuzzy approach.
- (3)
- The proposed method offers highly accurate and effective material to support the risk assessment procedure because occupational hazards can be better ranked and well evaluated to prevent critical hazards in construction industry.
The remainder of the paper is organized as follows: Section 2 discusses the limitations of traditional methods for ORA in construction industry and common Multi Criteria Decision Making (MCDM) methods used for risk assessment under fuzzy environment. Section 3 formally describes proposed framework steps and applied techniques, and presents the analysis of the proposed approach for risk assessment on construction sites. Section 4 reports the results of aspects, criteria and data analysis, which are based on the proposed steps. In addition, a sensitivity analysis has been carried out to indicate the verification of the results. Finally, Section 5 concludes the paper by summarizing obtained results and discussing strategic decisions.
2. Literature Review: Risk Analysis on Construction Sites
There is comprehensive literature about occupational risk assessment in the construction industry. In addition, there are many approaches for risk analysis in construction industry and other operating facilities [24,25,26,27]. In common, the application procedure is presented as follows:
- (1)
- Project managers prepare a corporate safety program, which includes performance standards in a number of classes, and then they compare these classes due to their importance and propose a new safety profile [28].
- (2)
- Decision is made about the strengths and weaknesses of a recent safety program using a safety audit, which is part of the company’s safety program [29].
- (3)
However, many authors [32,33,34,35,36,37] presented the shortcomings of traditional methods for ORA because these methods are formed from incomplete information, which is based on uncertainty, vagueness and imprecision. On the other hand, sources of imprecision usually require data obtained from expert judgment, which cannot be evaluated easily by traditional (probabilistic) methods [38]. In addition, Pinto et al. [39] investigated traditional methods for occupational risk assessment in the construction industry pointing out limitations and benefits of using fuzzy sets approaches to cope with imprecise situations. Thus, several methods have been presented using fuzzy principles for analyzing risks [40,41,42,43,44].
However, in recent years, numerous studies have been carried out using MCDM methods to analyze risks in construction industry [45]. Dejus and Antucheviciene [46] proposed MCDM technique for assessment and selection of appropriate solutions for occupational safety. Furthermore, in construction industry, Efe et al. [47] suggested an integrated intuitionistic fuzzy multi-criteria decision making method and a linear programming for risk evaluation in three firms. The paper aimed to overcome the limitations of traditional Failure Mode and Effects Analysis (FMEA) for risk evaluation. Tamošaitienė and Zavadskas [41] proposed risk assessment method using the Technique for Order of Preference by Similarity to Ideal Solution with fuzzy information (TOPSIS-F) method for project of commercial center. Basahel and Taylan [48] suggested a model that can be used to evaluate the most important factors of SMS (safety management system). The significance of these factors and their sub-factors was obtained using the fuzzy Analytic Hierarchy Process (AHP) technique, and the effectiveness of the four construction companies’ SMSs was obtained using fuzzy TOPSIS. Liu and Tsai [49] proposed a fuzzy risk assessment method to decrease or prevent occupational hazards. The method includes two-stage quality function deployment (QFD) tables to represent the relationships among construction items, hazard types and causes and a fuzzy Analytic Network Process (ANP) method to classify important hazard types and hazard causes and Failure Modes and Effect Analysis (FMEA) to evaluate the risk value of hazard causes based on the fuzzy inference approach. Janackovic et al. [50] proposed the expert evaluation method and the fuzzy AHP to represent the factors, performance, and indicators of occupational safety with ranking at a Serbian road construction company in Serbia. Kim et al. [51] presented a decision support model, which is based on fuzzy AHP, to quantify the failure risk and to show experts’ and practitioners’ subjectivities. Using results as an input for fuzzy comprehensive operations, the quantitative failure risks were found. Wu and Shen [52] suggested an assessment model based on the fuzzy grey relational analysis theory for the factors influencing highway construction safety. In addition, the construction safety evaluation index system was built and the weight of each index was found using AHP. Li et al. [53] proposed an improved AHP Method (IAHP) for risk identification. It was conducted to open-cut subway construction to show performance of the proposed approach. The application results show that IAHP is predominant to AHP in terms of comparison matrix (CM) consistency. Yuan et al. [54] improved and employed an effective method to evaluate safety risks on construction projects using the Fuzzy Analytic Network Process (FANP). Zamri et al. [55] proposed a Fuzzy TOPSIS (FTOPSIS) with Z-numbers to handle uncertainty in the construction problems. The proposed approach was used to determine the causes of workers’ accident at the construction sites.
In addition, Leonavičiūtė and Dėjus [56] introduced a new MCDM method of the Weighted Aggregated Sum Product Assessment with Grey numbers (WASPAS-G) to determine the best alternative in safety measures to prevent accidents on construction sites. Mohsen and Fereshteh [57] used Z numbers to overcome uncertainty in the experts’ judgments for risk assessment in a geothermal power plant. In addition, they used the fuzzy VIseKriterijumska Optimizacija I Kompromisno Resenje (VIKOR) technique to rank and prioritize the failure modes based on the minimum individual regret and the maxi group utility.
The goal of this paper is to depict how Fuzzy DEMATEL can be used as a valuable managerial tool for managers of construction sites to develop effective precautions strategies to avoid construction accidents, and to evaluate causal factors of accidents for construction site of buildings.
3. Fuzzy DEMATEL Approach
Although conventional quantification methods present exact solutions, they are not useful to resolve people-centered problems due to the complexities arising from human factors [58]. Therefore, the concepts of fuzzy set theory introduced by Zadeh [59] who is commonly used in these types of real-world problems where there is uncertainty and fuzziness related with the environment. In real world applications, decision making problems need to be carried out under uncertainty because goals, constraints and possible actions are ambiguous [58].
DEMATEL method is a well-known and comprehensive method to obtain a structural model that provides casual relationships between complex real-world factors. The DEMATEL method is superior to other techniques such as Analytic Hierarchy Process (AHP) since it accounts for the interdependence among the factors of a system via causal diagram, which is overlooked in traditional techniques [60]. The basis of the DEMATEL method comprises the following steps [58,61]:
- (1)
- In this step, the elements related to the problem and degree of influence between elements is formed. The influential factors of the complex system are defined based on data from literature reviews, brainstorming, or expert opinions.
- (2)
- A direct relation matrix is constructed. Then, a questionnaire survey method is carried out after the importance of the measurement scales is defined.
- (3)
- A normalized direct relation matrix is built on the basis of direct relation matrix using Equation (2).
- (4)
- The total relation matrix (T) is obtained through Formula (3).
- (5)
- In this step, the sum of the values in each column and each row is calculated in the total relation matrix. Thus, Di shows the sum of the ith row and Rj shows the sum of the jth column. The direct and indirect influences between factors are shown with Di and Rj, respectively.
- (6)
- In this stage, cause and effect diagram is built. Horizontal axis (D + R) is made summing R and D, the vertical axis (D − R) is made subtracting R from D. While (D + R) is defined as “prominence”, which shows the importance degree of the criterion, (D − R) is defined as “relation”, which shows the extent of the influence. If the (D − R) is negative, the criterion is grouped into the effect group. It means that it is influenced by other criteria. If (D − R) is positive, it means that it has a significant impact. It should be improved first.
In this study, Fuzzy DEMATEL method is used to assess causal relations of accidents for construction processes. This combination is used for the imprecise and subjective nature of human judgments. Interval sets are used rather than real numbers in fuzzy set theory. Linguistics terms are converted to fuzzy numbers. The proposed method is favorable to reveal the relationships among factors and ranking the criteria related to the type of relationships and the impact of severe degree on each criterion.
- Step 1.
- Define the evaluation criteria.
- Step 2.
- Select a group of experts who have knowledge and experience about problem to evaluate the effect between factors using pairwise comparison.
- Step 3.
- Define the fuzzy linguistic scale for dealing with the vagueness of human assessments, the linguistic variable “influence” is used with a five-level scale containing the following scale items in the group decision-making proposed by Li [63]: No influence, Very low influence, Low influence, High influence, and Very high influence. The fuzzy numbers for these linguistic terms are given in Table 1.
- Step 4.
- Obtain an initial direct relation matrix with pair wise comparison. Develop the initial fuzzy direct-relation matrix Zk by having evaluators introduce the fuzzy pair-wise influence relationships between the components in a n × n matrix where k is the number of experts. Accordingly, the direct-relation matrix is established as Zk = [zkij] where Z is a n × n non-negative matrix; zij represents the direct impact of factor i on factor j; and, when i = j, the diagonal elements zij = 0.
For simplicity, denote Zk as
- Step 5.
- Obtain the normalized fuzzy direct-relation matrix “D” using Expressions (7) related to the overall fuzzy direct-relation matrix Z.
- Step 6.
- Compute the total-relation matrix T using Expression (8), where n × n identity matrix is represented with I. Upper and lower values are calculated separately.where .
- Step 7.
- Determine row (ri) and column (cj) sums for each row i and column j from the T matrix, respectively, with following equations.
- Step 8.
- The causal diagram is built with the horizontal axis (ri + cj) and the vertical axis (ri − cj). The horizontal axis “Prominence” refers the importance degree of the factor, whereas the vertical axis “Relation” shows the extent of the influence. If the (ri − cj) axis is positive, the factor is in the cause group. Otherwise, if the (ri − cj) axis is negative, the factor is in the effect group. Causal diagrams can convert complex relationships of factors into an easy to understand structural model, providing awareness for problem solving.
The Application Procedures of Fuzzy DEMATEL for Construction Sites—Analysis of the Proposed Approach
Based on risk assessment standard process, this study utilizes the Fuzzy DEMATEL approach to identify risk assessment elements and evaluate comprehensive influence relations for construction sites. Implementation of Fuzzy DEMATEL approach for critical occupational hazards on construction sites is introduced as follows (see Figure 1).
- Step 1.
- Determine risk factors: In risk identification, 14 safety causal factors related to occupational hazards were constructed using an extensive literature review and witnesses of evaluators.
- Step 2.
- Before the implementation of this approach, five evaluators, who actively work on construction sites, evaluated the causal factors of accidents. Evaluators with varying ages (30–50 years) and career lengths (5–30 years), as an indicator of their level of experience, were selected. The characteristics of the five decision-making evaluators are given in Table 2.
The evaluators expressed their thoughts relating to their knowledge, experience and expertise. In this step, significant causal factors of accidents in construction sites and potential occupational hazards are identified in Table 3. The experience and the knowledge level of the evaluators were different. However, their understanding of the causes of accidents in construction industry was adequate to be selected for this study.
- Step 3.
- Evaluators used five level scales containing the following scale item factor influence relationships: Very low, Low, Medium, High, and Very high (see Table 1).
- Step 4.
- Step 5.
- Using presence of the initial direct relation matrix, the normalized fuzzy direct-relation matrix “N” was built. The normalized fuzzy direct-relation matrix can be calculated using Expressions (7) (see Table 5).
- Step 6.
- Total-relation fuzzy matrix was derived, after having obtained normalized direct-relation fuzzy matrix. This can be obtained by using Expression (8), where it is represented an n × n identity matrix. Total relation fuzzy matrix was shown in Table 6.
- Step 7.
- The structural model was established. After having built matrix T, ri + cj and ri − cj were determined. In Expressions (9)–(11), ri and cj are obtained with the sum of the rows and columns of matrix T. While ri + cj donates the importance of factor I, ri − cj indicates the net effect of factor i. Results were presented in Table 7.
- Step 8.
- Using Centre of Area (COA) defuzzification technique, ri + cj and ri − cj were defuzzified and obtained Best Non-fuzzy Performance (BNP) values [64]. In the COA process, the defuzzified factor of risk is represented by the geometric center of the area limited by the curve that represents its membership function. Crisp values of ri, cj, ri + cj and ri − cj are shown in Table 8.
The cause–effect diagram was drawn after obtaining horizontal axis (ri + cj) and vertical axis (ri − cj). While (ri + cj) refers to the strength of influence among criteria, (ri − cj) refers to the influence relation among criteria. The cause–effect diagram is shown in Figure 2.
4. Results
This study combines Fuzzy System Theory and DEMATEL method to develop a systematic risk assessment methodology for potential occupational hazards on construction sites. The results are summarized based on the causal diagram as follows. The assessment criteria Worker capabilities (knowledge, skills) (T2), Site conditions (excluding equipment, weather, materials) (T5), Work scheduling (T6), Unsuitability of materials (T7) Safety culture (T9), Shortage of safety management (T11), Poor safety conscientiousness of laborers (T13), and Poor site management (T14) are classified into the cause criteria group, while effect criteria group includes Worker actions/behavior (T1), Communication (T3), Worker health/fatigue (T4), Unsuitability of equipment (T8), Construction process (T10), and Poor of education of laborers (T12) , which need to be improved. Since cause factors influence the effect group criteria, they should be the focus. The cause group criteria refer to the implication of the influencing criteria, while the effect group criteria refer to the implication of the influenced criteria. Considering the interdependence among factors, much attention should be paid to the cause group criteria related to their influence on the effect group criteria [65]. Therefore, by improving cause factors, effect factors are developed simultaneously. Therefore, T9, T11, T14, T12 and T10 are critical occupational factors of accidents to be considered in construction industry based on evaluators’ wide experiences and knowledge.
The most significant causal factor of occupational hazards that cause accident is “Safety culture (T9)” has the highest (ri − cj) value with 2.25, which means (T9) should be given more consideration on the overall system of critical occupational hazards on construction sites. Besides, Table 7 shows that influential impact degree of (T9) is 4.83, which is ranked the third highest degree among all causal factors. In common, (T9) is a main factor that requires more consideration in the construction industry process. “Shortage of safety management (T11)” has significant impact on other cause group factors with the second highest (ri − cj) degree. Furthermore, (T11) has the second highest ri value (5.13) among the causal factors in terms of prominent impact degree. Likewise, “Poor site management (T14)” is another significant factor because the ri − cj value is in the third place (1.75). Besides, T14 has the highest ri value (5.27).
If the value of (ri − cj) is negative, such perspective is classified in the effect group (hazards), and is largely influenced by others. In this study, “Poor education of laborers (T12)” has the highest (ri + cj) value among the whole process. However, their (ri − cj) values are very high when compared to other factors in effect group (−6.18). This means that it has a significant impact on the other factors. However, its (ri + cj) score is the second highest in the other effect group criteria. “Construction process (T10)” has impact to improve the system as its ri − cj value is very low (−0.45). It is easily affected by the other factors. “Worker health/fatigue (T4)” has the third highest (ri + cj) in the whole process. The remaining factors have moderate (ri + cj) values. Their (ri − cj) values are comparatively low, which point as a strong influenced degree.
Considering the results, managers are able to define regular precautions that must be taken for critical causal factors of occupational hazards. The precautions against the most critical causal factors in construction industry are given in Table 9.
Sensitivity Analysis of Results
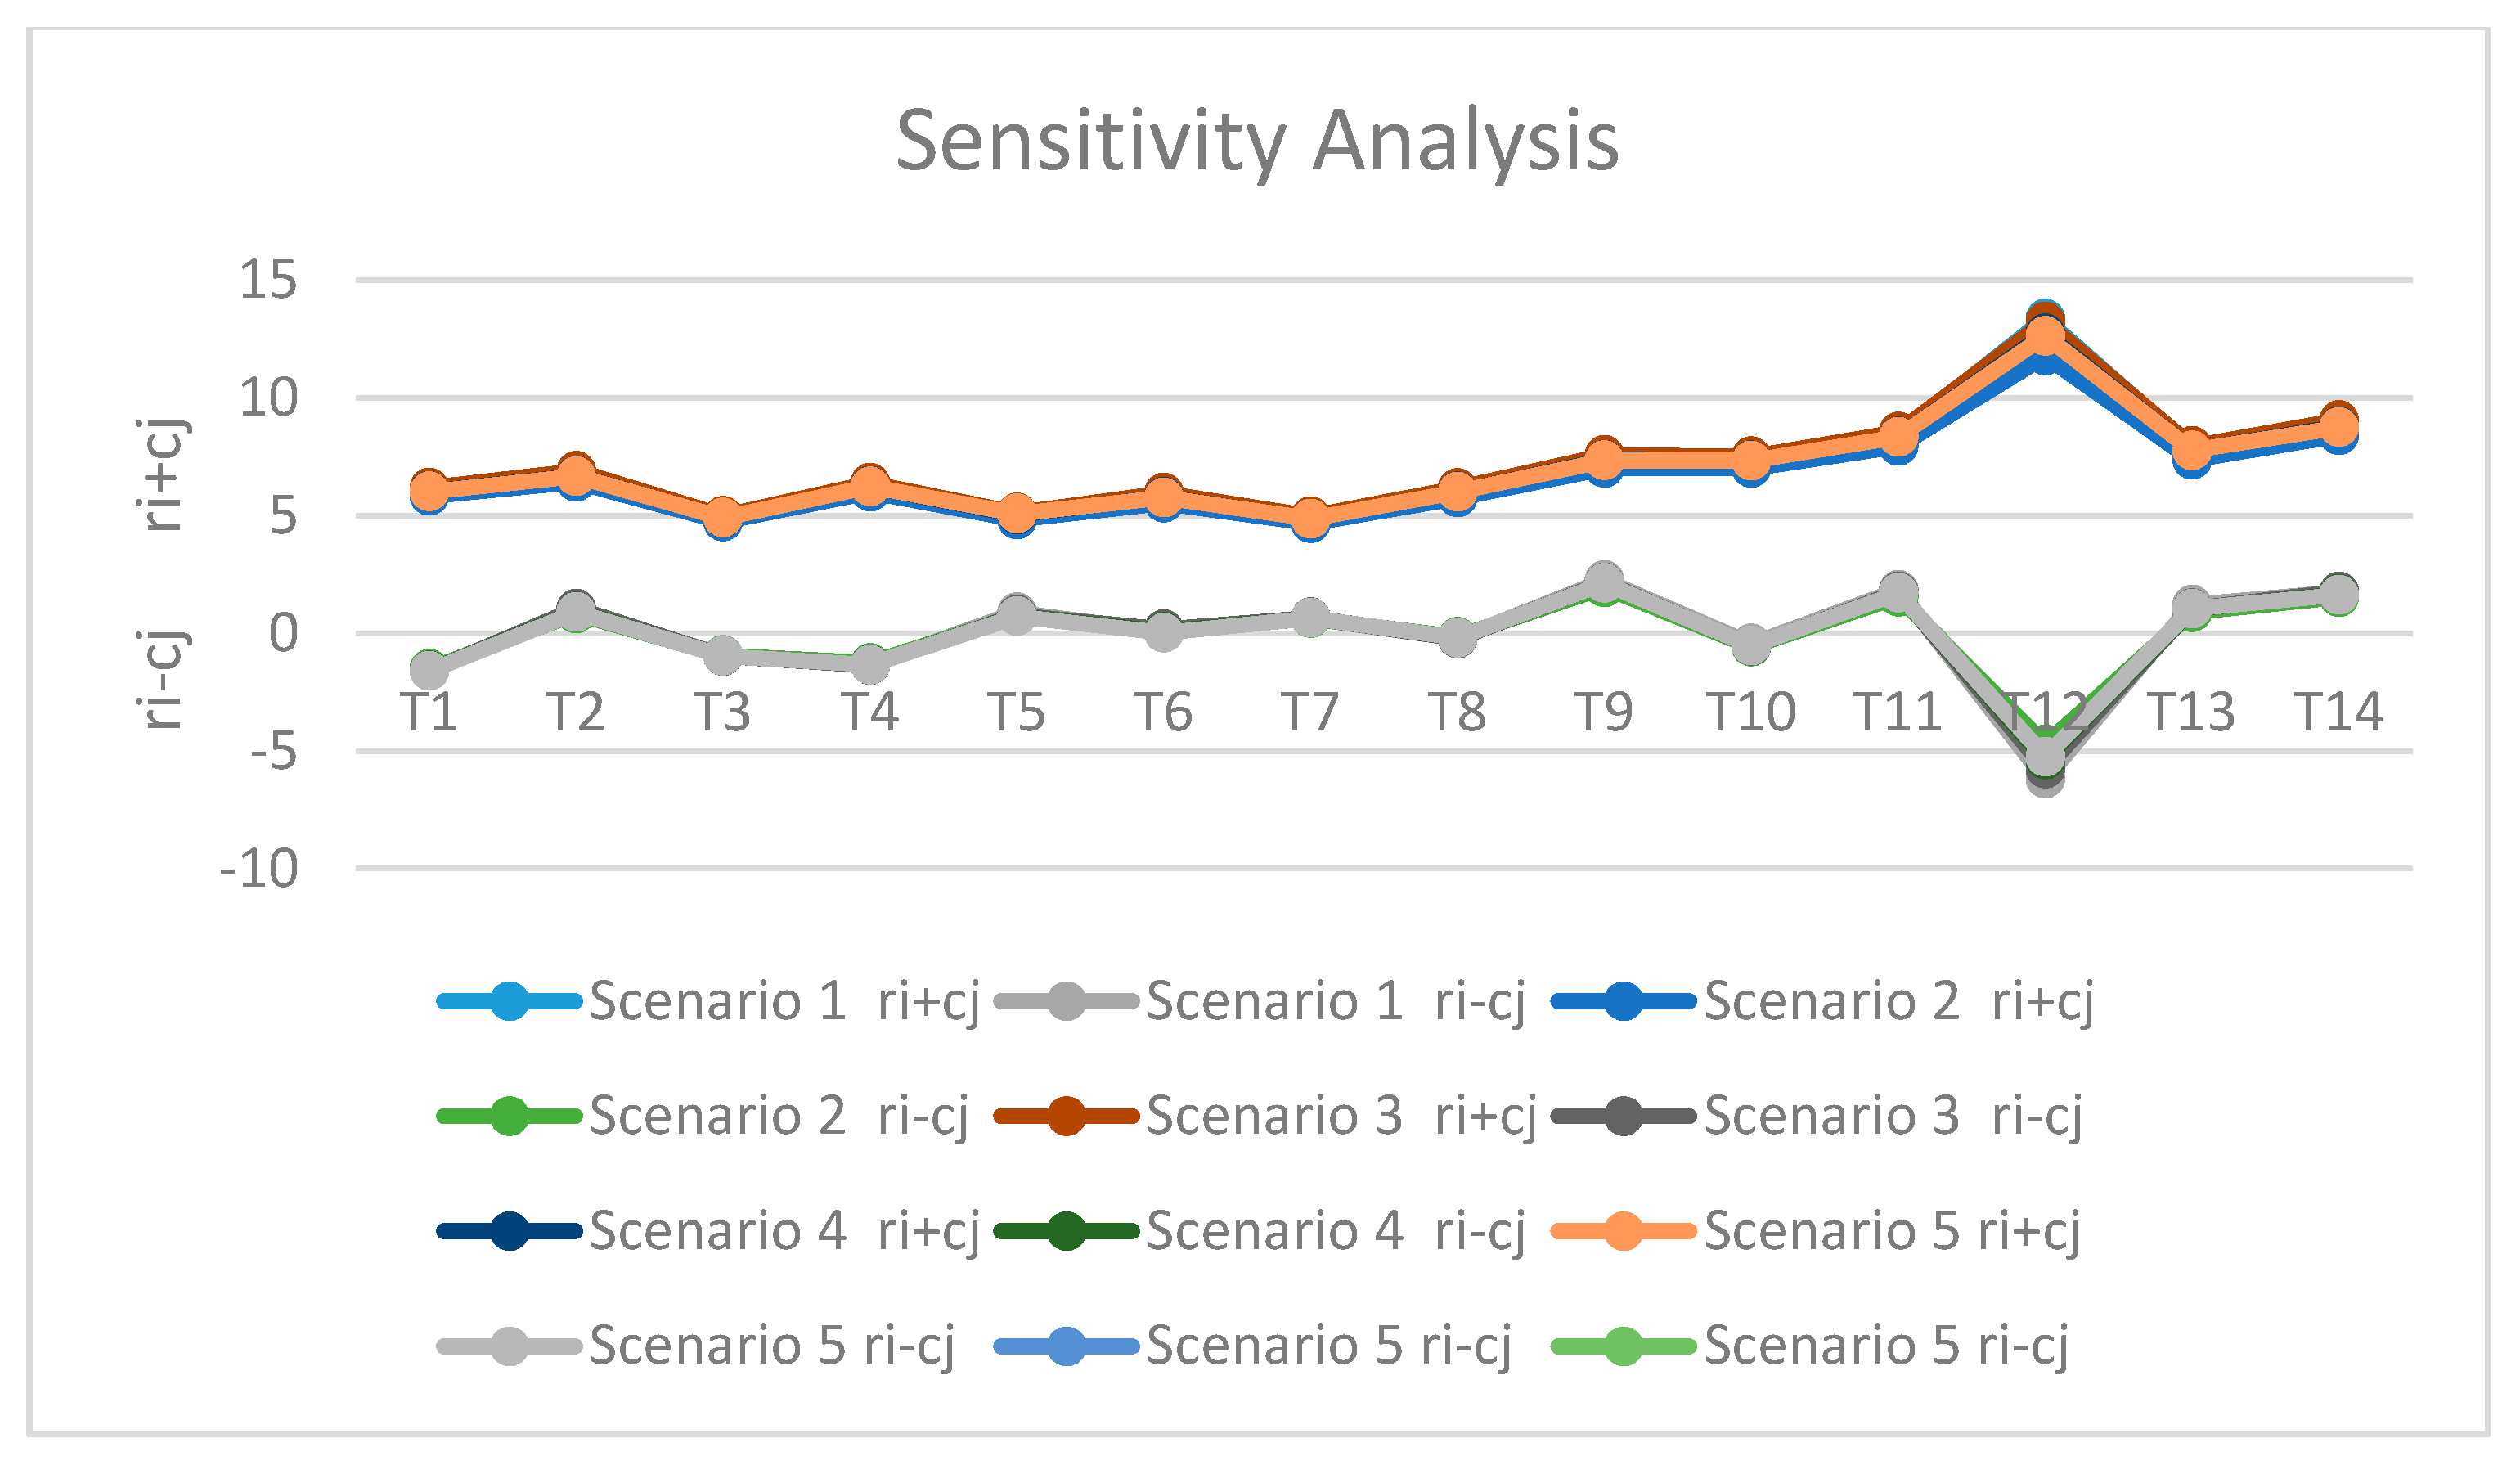
Sensitivity analysis is performed to test the reliability of decisions made by evaluators. To understand the effects of using various combinations of decision criteria weight (keeping equal weightings and adjust more weight to any evaluator), sensitivity analysis is conducted [66]. To verify the results, sensitivity analysis is presented in this study. Initially, equal weights are assigned to each evaluator (Scenario 1). Then, weights of each evaluator are changed according to their years of experience and job responsibilities to analyze how much the cause–effect relations vary. Accordingly, considering that Evaluator 2, Evaluator 3 and Evaluator 1, respectively, faced more occupational accidents during their job experiences, their weights are assigned higher than other evaluators. Scenarios based on evaluator weights are given in Table 10.
The results show that the ranking of cause and effect factors remain unchanged in all scenarios. The sensitivity analysis has shown robust and valid results that are close to real preferences of the consulted evaluators. As a result, the understanding of evaluators about the causes of accidents in construction industry is adequate for this study.
5. Conclusions
This study aims to improve Fuzzy DEMATEL approach to causal factors of critical occupational hazards, which are implemented through 14 criteria, for construction industry. Thus, this study presents a novel occupational risk assessment approach for evaluating critical casual factors of accidents for construction industry, which can help managers of construction industry to make proper precautionary strategies for accidents. The proposed method is superior to conventional techniques because of exposing the relationships between factors and ranking the criteria relating to the type of relationships and intensity of their effects on each criterion. In addition, by using fuzzy linguistic scale, imprecise and inaccurate information has been handled. Due to these advantages, DEMATEL is used to reveal a better knowledge of the influences of the analysis of cause and effect criteria, and to increase the model applicability. Thus, the proposed method has capability to represent the causal relationship of criteria and is favorable to handle group decision making in fuzzy environment.
According to the findings, several precautions can be suggested for potential occupational hazards. Firstly, it can be proposed to concentrate on the cause group criteria because of their influences on the effect group criteria. Arrangement of cause group criteria are much more difficult than the effect group criteria.
Moreover, managers should focus on critical causal factors in construction industry, which are Worker capabilities (knowledge, skills) (T2), Site conditions (excluding equipment, weather, materials) (T5), Work scheduling (T6), Unsuitability of materials (T7) Safety culture (T9), Shortage of safety management (T11), Poor safety conscientiousness of laborers (T13), Poor site management (T14). Worker actions/behavior (T1), Communication (T3), Worker health/fatigue (T4), Unsuitability of equipment (T8), Construction process (T10), and Poor of education of laborers (T12).
The sensitivity analysis is also introduced to reveal robust and valid results that are close to real preferences of evaluators. The Fuzzy DEMATEL method is a useful tool and widely used in all industry sectors to handle problems that need group decision-making in a fuzzy environment. Therefore, the proposed framework can be enhanced in further studies to test the research findings presented in this study by applying them to a real construction site. In addition, in future research, more evaluator opinions can be evaluated.
Author Contributions
Authors have worked together on this manuscript.
Conflicts of Interest
The authors declare no conflicts of interest.
References
- Solomon, O.; Lijian, N.; Eucharia, E. Hazards in Building Construction Sites and Safety Precautions in Enugu Metropolis, Enugu State, Nigeria. Imp. J. Interdiscip. Res. 2016, 2, 282–289. [Google Scholar]
- Vitharana, V.H.P.; De Silva, S.; De Silva, S. Health Hazards, Risk and Safety Practices in Construction Sites—A Review Study. Engineer 2015, 48, 35–44. [Google Scholar] [CrossRef]
- Manu, P.A.; Ankrah, A.; Proverbs, D.G.; Suresh, S. Investigating the multi-causal and complex nature of the accident causal influence of construction project features. Accid. Anal. Prev. 2012, 48, 126–133. [Google Scholar] [CrossRef] [PubMed]
- Li, R.Y.M.; Poon, S.W. A Literature Review on the Causes of Construction Accidents. Constr. Saf. Risk Eng. 2013. [Google Scholar] [CrossRef]
- Hamid, A.; Majid, M.; Singh, B. Causes of accidents at construction Sites. Malays. J. Civ. Eng. 2008, 20, 242–259. [Google Scholar]
- Occupational Health and Safety APRIL 30. Environmental, Health, and Safety (EHS) Guidelines. General EHS Guidelines: Occupational Health and Safety. 2007. Available online: https://www.ifc.org/wps/wcm/connect/554e8d80488658e4b76af76a6515bb18/Final+General+EHS+Guidelines.pdf?MOD=AJPERES (accessed on 20 July 2017).
- Pipitsupaphol, T.; Watanabe, T. Identification of Root Causes of Labor Accidents in the Thai Construction Industry. In Proceedings of the 4th Asia Pacific Structural Engineering and Construction Conference (APSEC 2000), Kuala Lumpur, Malaysia, 13–25 September 2000; pp. 193–202. [Google Scholar]
- Huang, X.; Hinze, J. Analysis of Construction Worker Fall Accidents. J. Constr. Eng. Manag. 2003, 262–271. [Google Scholar] [CrossRef]
- Health and Safety Executive (HSE). Health and Safety Executive: Improving Health and Safety in the Construction Industry: House of Commons Committee of Public Accounts, Fifty-Second Report of Session. 2004. Available online: https://publications.parliament.uk/pa/cm200304/cmselect/cmpubacc/627/627.pdf (accessed on 9 November 2017).
- Phoya, S. Health and Safety Risk Management in Building Construction Sites in Tanzania: The Practice of Risk Assessment, Communication and Control. Master’s Thesis, Department of Architecture, Chalmers Unıversıty of Technology Gothenburg, Göteborg, Sweden, 2012. [Google Scholar]
- Dumrak, J.; Mostafa, S.; Kamardeen, I.; Rameezdeen, R. Factors associated with the severity of construction accidents: The case of South Australia. Australas. J. Constr. Econ. Build. 2013. [Google Scholar] [CrossRef]
- Jackson, S.A.; Loomis, D. Fatal occupational injuries in the North Carolina construction industry, 1978–1994. Appl. Occup. Environ. Hyg. 2002, 17, 27–33. [Google Scholar] [CrossRef] [PubMed]
- Saiman, B.T. Managing Physical Hazards on Construction Site Sıtı Norlizah. Bachelor’s Thesis, Faculty of Civil Engineering & Earth Resources, Universiti Malaysia Pahang, Pekan, Malaysia, 2010. [Google Scholar]
- Toole, T.M. Construction Site Safety Roles. J. Constr. Eng. Manag. 2002, 12, 203–210. [Google Scholar] [CrossRef]
- Tam, C.M.; Zeng, S.X.; Deng, Z.M. Identifying elements of poor construction safety management in China. Saf. Sci. 2004, 42, 569–586. [Google Scholar] [CrossRef]
- Dester, W.S.; Blockley, D.I. Safety behavior and culture in construction. Engineering. Constr. Archit. Manag. 1995, 2, 17–26. [Google Scholar] [CrossRef]
- Zhou, Z.; Goh, Y.M.; Li, Q. Overview and analysis of safety management studies in the construction industry. Saf. Sci. 2015, 72, 337–350. [Google Scholar] [CrossRef]
- Agvu, O.; Olele, H. Fatalities in the Nigerian Construction Industry: A Case of Poor Safety Culture. Br. J. Econ. Manag. Trade 2014, 4, 431–452. [Google Scholar]
- Barofsky, I.; Legro, M. Definition and measurement of fatigue. Rev. Infect. Dis. 1991, 13, 94–97. [Google Scholar] [CrossRef]
- Folkard, S.; Tucker, P. Shift work, safety productivity. Occup. Med. 2003, 53, 95–101. [Google Scholar] [CrossRef]
- Ismail, Z.; Doostdar, S.; Harun, Z. Factors influencing the implementation of a safety management system for construction sites. Saf. Sci. 2012, 50, 418–423. [Google Scholar] [CrossRef]
- Wu, W.W. Choosing knowledge management strategies by using a combined ANP and DEMATEL approach. Expert Syst. Appl. 2008, 35, 828–835. [Google Scholar] [CrossRef]
- Mentes, A.; Akyildiz, H.; Yetkin, M.; Türkoğlu, N. A FSA based fuzzy DEMATEL approach for risk assessment of cargo ships at coasts and open seas of Turkey. Saf. Sci. 2015, 79, 1–10. [Google Scholar] [CrossRef]
- Aneziris, O.N.; Topali, E.; Papazoglou, I.A. Occupational risk of building construction. Reliab. Eng. Syst. Saf. 2012, 105, 36–46. [Google Scholar] [CrossRef]
- Parida, R.; Ray, P. Study and analysis of occupational risk factors for ergonomic design of construction worksystems. Work 2012, 41, 3788–3794. [Google Scholar] [PubMed]
- Dabrowski, A. An investigation and analysis of safety issues in Polish small construction plants. Int. J. Occup. Saf. Ergon. 2015, 21, 498–511. [Google Scholar] [CrossRef] [PubMed]
- Zavadskas, E.K.; Vaidogas, E.R. Bayesian reasoning in managerial decisions on the choice of equipment for the prevention of industrial accidents. Inz. Ekon. Eng. Econ. 2008, 60, 32–40. [Google Scholar]
- Fletcher, J. The Industrial Environment; National Profile Ltd.: Willowdale, ON, Canada, 1972. [Google Scholar]
- Kavianian, H.R.; Wentz, C.A. Occupational and Environmental Safety Engineering and Management; Van Nostrand Reinhold: New York, NY, USA, 1990; ISBN 978-0-471-28912-8. [Google Scholar]
- Jannadi, M.O.; Al-Sudairi, A. Safety management in the construction industry in Saudi Arabia. Build. Res. Inf. 1995, 29, 15–24. [Google Scholar] [CrossRef]
- Priyadarshani, K.; Karunasena, G.; Jayasuriya, S. Construction Safety Assessment Framework for Developing Countries: A Case Study of Sri Lanka. J. Constr. Dev. Ctries. 2013, 18, 33–51. [Google Scholar]
- Pender, S. Managing incomplete knowledge: Why risk management is not sufficient. Int. J. Proj. Manag. 2001, 19, 79–87. [Google Scholar] [CrossRef]
- Sii, H.S.; Wang, J.; Ruxton, T. Novel risk assessment techniques for maritime safety management system. Int. J. Qual. Reliab. Manag. 2001, 18, 982–999. [Google Scholar]
- Tixier, J.; Dusserre, G.; Salvi, O.; Gaston, D. Review of 62 risk analysis methodologies of industrial plants. J. Loss Prev. Process Ind. 2002, 15, 291–303. [Google Scholar] [CrossRef] [Green Version]
- Faber, M.H.; Stewart, M.G. Risk assessment for civil engineering facilities: Critical overview and discussion. Reliab. Eng. Syst. Saf. 2003, 80, 173–184. [Google Scholar] [CrossRef]
- Nilsen, T.; Aven, T. Models and model uncertainty in the context of risk analysis. Reliab. Eng. Syst. Saf. 2003, 79, 309–317. [Google Scholar] [CrossRef]
- Kentel, E.; Aral, M.M. Probabilistic-fuzzy health risk modeling. Stoch. Environ. Res. Risk Assess. 2004, 18, 324–338. [Google Scholar] [CrossRef]
- Pinto, A.; Ribeiro, R.; Isabel, L. Qualitative Occupational Risk Assessment model—An introduction. In Proceedings of the World Congress on Risk 2012: Risk and Development in a Changing World, Sydney, Australia, 17–20 July 2012. [Google Scholar]
- Pinto, A.; Nunes, I.L.; Ribeiro, R.A. Occupational risk assessment in construction industry-overview and reflection. Saf. Sci. 2011, 49, 616–624. [Google Scholar] [CrossRef]
- Zavadskas, E.; Turkis, Z.; Tamošaitiene, J. Risk assessment of construction projects. J. Civ. Eng. Manag. 2010, 16, 33–46. [Google Scholar] [CrossRef]
- Tamošaitienė, J.; Zavadskas, E.; Turskis, Z. Multi-criteria Risk Assessment of a Construction Project. Procedia Comput. Sci. 2013, 17, 129–133. [Google Scholar] [CrossRef]
- Azadeh, A.; Fam, I.M.; Khoshnoud, M.; Nikafrouz, M. Design and implementation of fuzzy expert system for performance assessment of an integrated health, safety, environment (HSE) and ergonomics system: The case of a gas refinery. Inf. Sci. 2008, 178, 4280–4300. [Google Scholar] [CrossRef]
- Cuny, X.; Lejeune, M. Occupational risks and the value and modelling of a measurement of severity. Saf. Sci. 1999, 31, 213–229. [Google Scholar] [CrossRef]
- Rafat, H. Machinery Safety: The Risk Based Approach; Technical Communications (Publishing) Ltd.: Hertfordshire, UK, 1995. [Google Scholar]
- Mardani, A.; Jusoh, A.; Nor, K.; Khalifah, Z.; Zakwan, N.; Valipour, A. Multiple criteria decision-making techniques and their applications—A review of the literature from 2000 to 2014. Econ. Res. Ekon. Istraž. 2015. [Google Scholar] [CrossRef]
- Dejus, T.; Antucheviciene, J. Assessment of health and safety solutions at a construction site. J. Civ. Eng. Manag. 2013, 19, 728–737. [Google Scholar] [CrossRef]
- Efe, B.; Kurt, M.; Efe, Ö. An integrated intuitionistic fuzzy set and mathematical programming approach for an occupational health and safety polic. Gazi Univ. J. Sci. 2017, 30, 73–95. [Google Scholar]
- Basahel, A.; Taylan, O. Usıng Fuzzy Ahp And Fuzzy Topsıs Approaches For Assessıng Safety Condıtıons At Worksıtes In Constructıon Industry. Int. J. Saf. Secur. Eng. 2016, 6, 728–745. [Google Scholar]
- Liu, H.; Tsai, Y. A fuzzy risk assessment approach for occupational hazards in the construction industry. Saf. Sci. 2012, 50, 41067–41078. [Google Scholar] [CrossRef]
- Janackovic, G.L.; Savic, S.M.; Stankovic, M.S. Selection and Ranking of Occupational Safety Indicators Based on Fuzzy-AHP: A Case Study in Road Construction Companies. S. Afr. J. Ind. Eng. 2013, 24, 175–189. [Google Scholar] [CrossRef]
- Kim, D.I.; Yoo, W.S.; Cho, H.; Kang, K.I. A Fuzzy AHP-Based Decision Support Model for Quantifying Failure Risk of Excavation Work. KSCE J. Civ. Eng. 2014, 18, 1966–1976. [Google Scholar] [CrossRef]
- Wu, Z.; Shen, R. Safety Evaluation Model of Highway Construction based on Fuzzy Grey Theory. Procedia Eng. 2012, 45, 64–69. [Google Scholar] [CrossRef]
- Li, F.; Phoon, K.; Du, X.; Zhang, M. Improved AHP Method and Its Application in Risk Identification. J. Constr. Eng. Manag. ASCE 2013, 139, 312–320. [Google Scholar] [CrossRef]
- Yuan, P.; Patrick, Z.; Jimmie, H.; Rinker, M. Assessıng Safety Rısks On Constructıon Projects Usıng Fuzzy Analytıc Network Process (Anp): A Proposed Model. In International Conference Evolution of and Direction in Construction Safety and Health—Gainesville, United States; In House Publishing: Rotterdam, The Netherlands, 2008; pp. 599–610. [Google Scholar]
- Zamri, N.; Ahmad, F.; Rose, A.; Makhtar, M. Fuzzy TOPSIS with Z-Numbers Approach for Evaluation on Accident at the Construction Site. Int. Conf. Soft Comput. Data Min. 2016, 549, 41–50. [Google Scholar]
- Leonavičiūtė, G.; Dėjus, T.; Antuchevičienė, J. Analysis and prevention of construction site accidents. Građevinar 2016. [Google Scholar] [CrossRef]
- Mohsen, O.; Fereshteh, N. An extended VIKOR method based on entropy measure for the failure modes risk assessment – A case study of the geothermal power plant (GPP). Saf. Sci. 2017, 92, 160–172. [Google Scholar] [CrossRef]
- Tsai, S.; Chien, M.; Xue, Y.; Li, L.; Jiang, X.; Chen, Q.; Zhou, J.; Wang, L. Using the Fuzzy DEMATEL to Determine Environmental Performance: A Case of Printed Circuit Board Industry in Taiwan. PLoS ONE 2015, 10, e0129153. [Google Scholar] [CrossRef] [PubMed]
- Zadeh, L. Fuzzy Sets. Inf. Control 1965, 8, 338–353. [Google Scholar] [CrossRef]
- Mentes, A.; Akyildiz, H.; Helvacioğlu, I. A Grey Based Dematel Technıque for Rısk Assessment of Cargo Shıps. In Proceedings of the 7th International Conference on Model Transformation ICMT 2014, Glasgow, UK, 7–9 July 2014. [Google Scholar]
- Akyuz, E.; Celik, E. A fuzzy DEMATEL method to evaluate critical operational hazards during gas freeing process in crude oil tankers. J. Loss Prev. Process Ind. 2015, 38, 243–253. [Google Scholar] [CrossRef]
- Lin, R. Using fuzzy DEMATEL to evaluate the green supply chain management practices. J. Clean. Prod. 2013, 40, 32–39. [Google Scholar] [CrossRef]
- Li, R.J. Fuzzy Method in Group Decision Making. Comput. Math. Appl. 1999, 38, 91–101. [Google Scholar] [CrossRef]
- Ross, T.J. Fuzzy Logic with Engineering Applications; McGraw-Hill, Inc.: New York, NY, USA, 1995. [Google Scholar]
- Fontela, E.; Gabus, A. The Dematel Observer, Dematel 1976 Report; Battelle Geneva Research Center: Geneva, Switzerland, 1976. [Google Scholar]
- Emovon, I.; Norman, R.; Murphy, A. An integration of multi-criteria decision making techniques with a delay time model for determination of inspection intervals for marine machinery systems. Appl. Ocean Res. 2016, 59, 65–82. [Google Scholar] [CrossRef]
Figure 1.
Implementation of a Fuzzy DEMATEL approach.
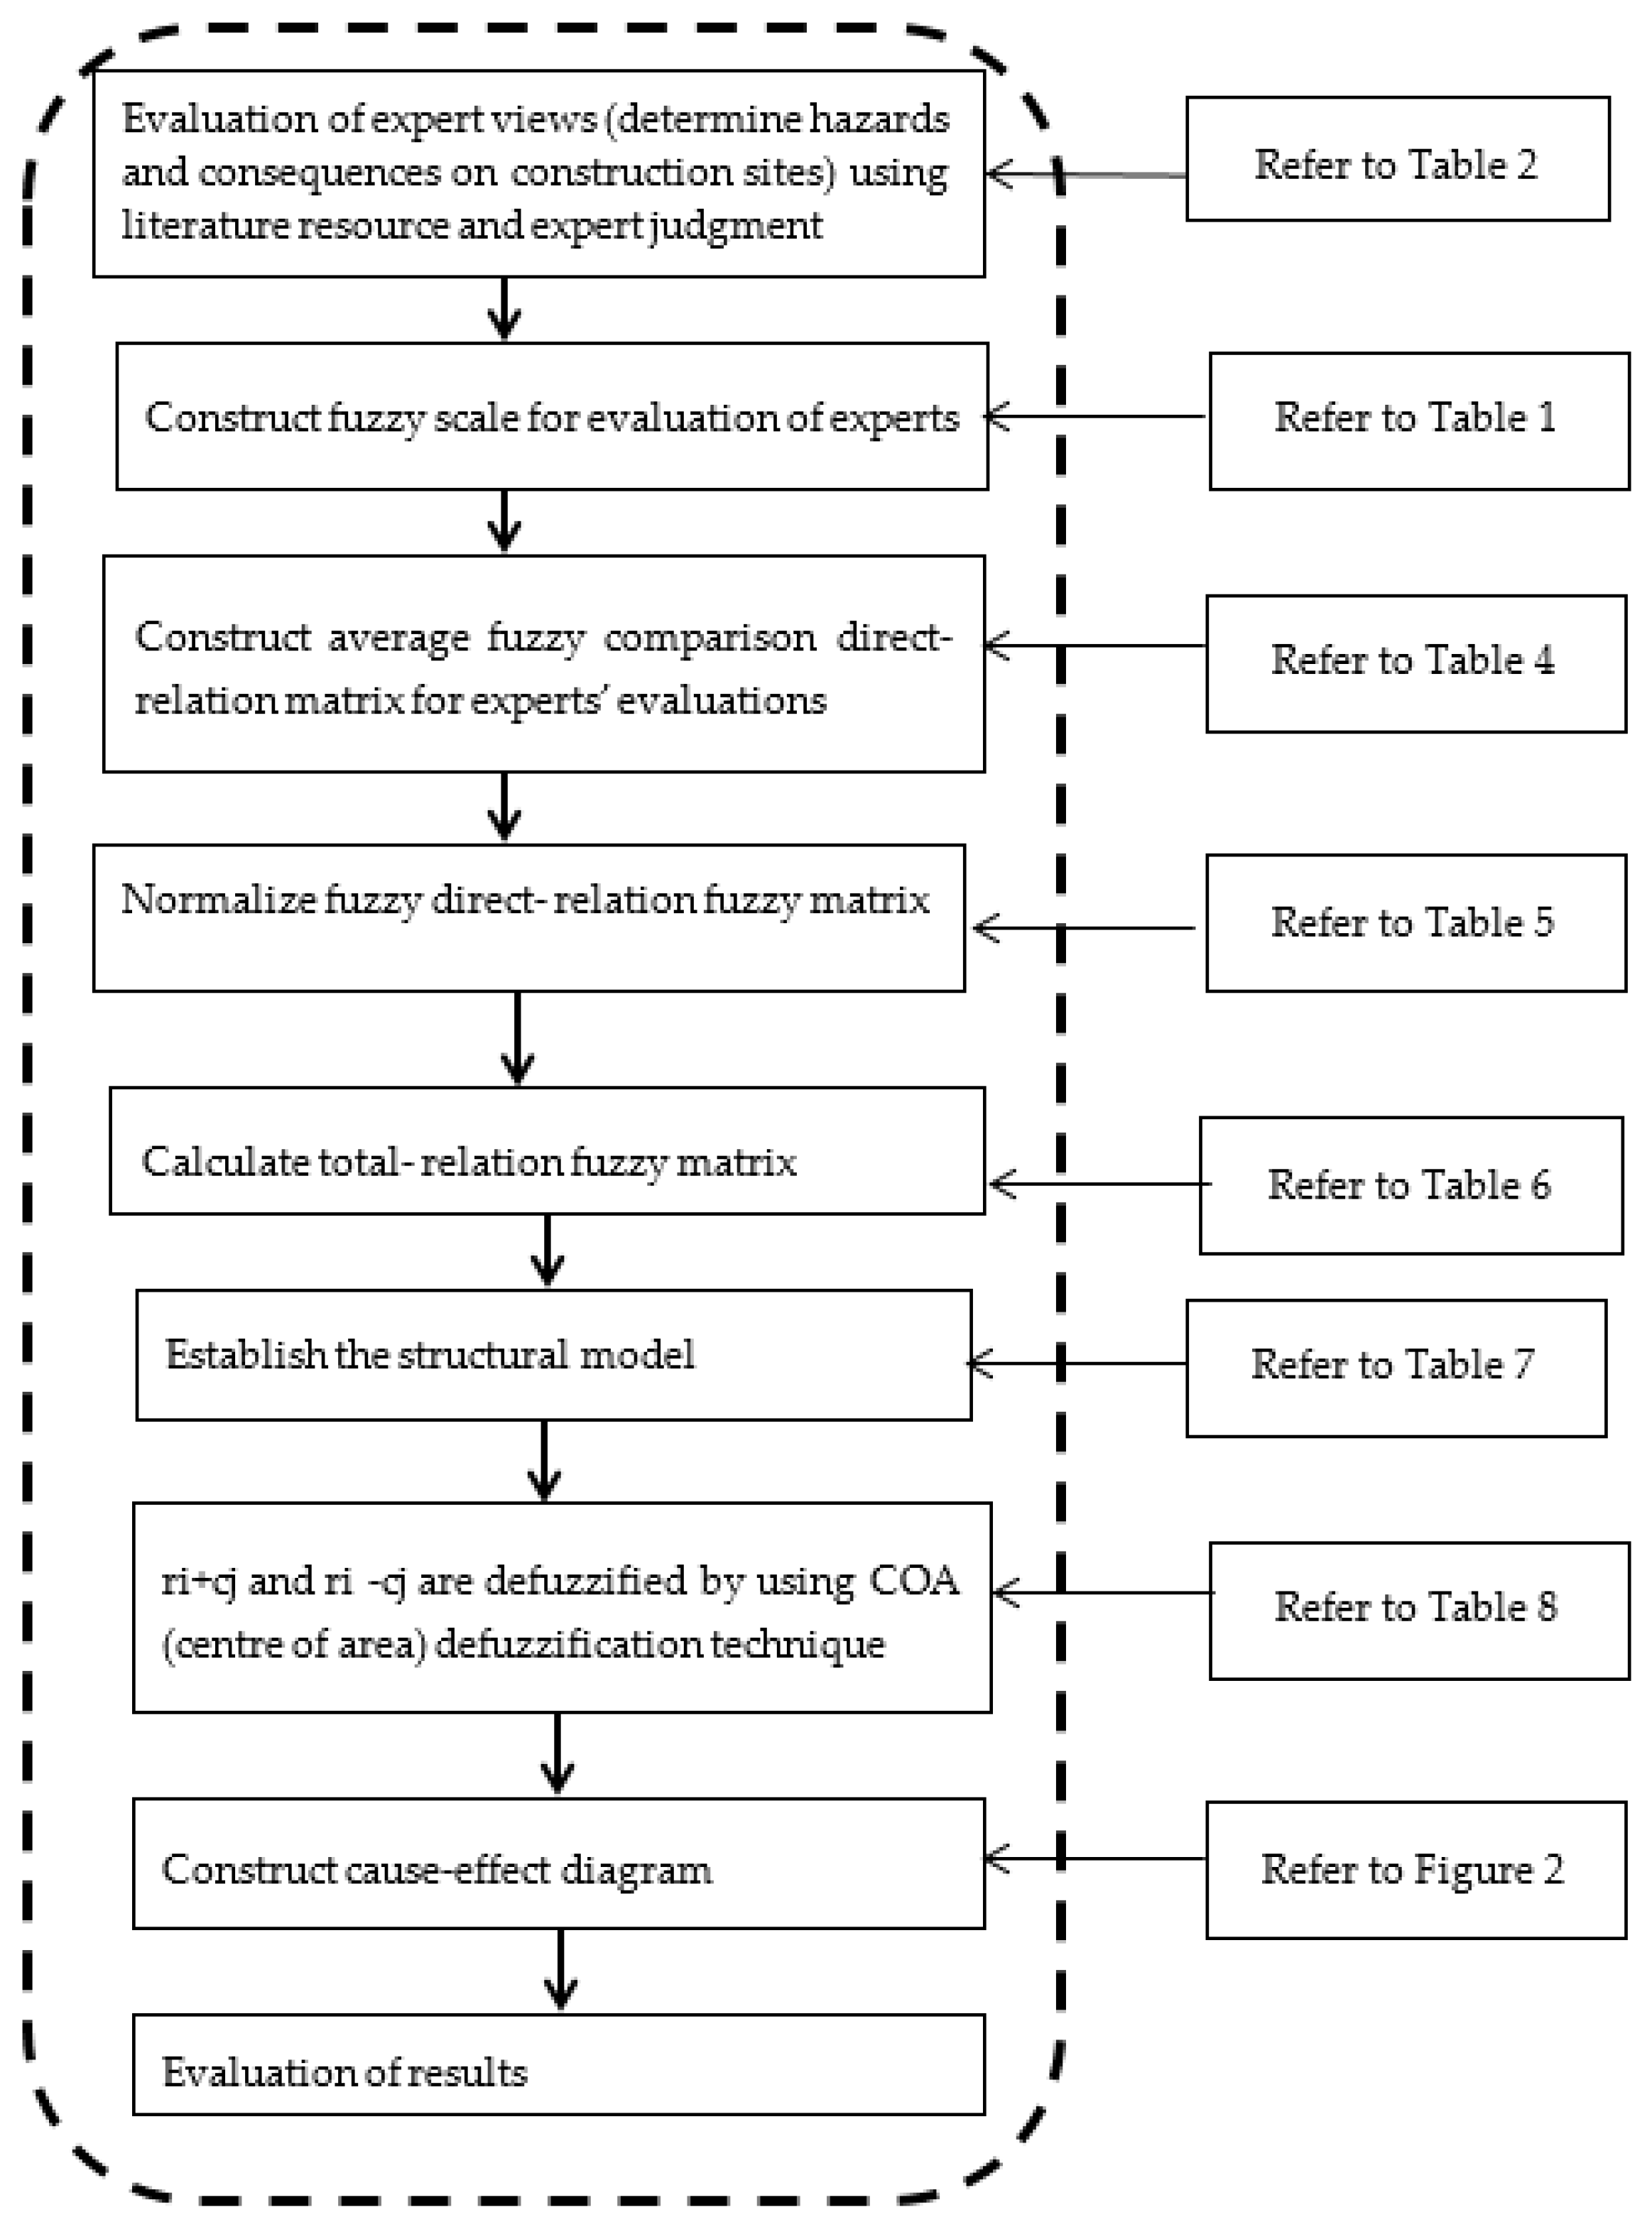
Figure 2.
Cause and effect diagram.
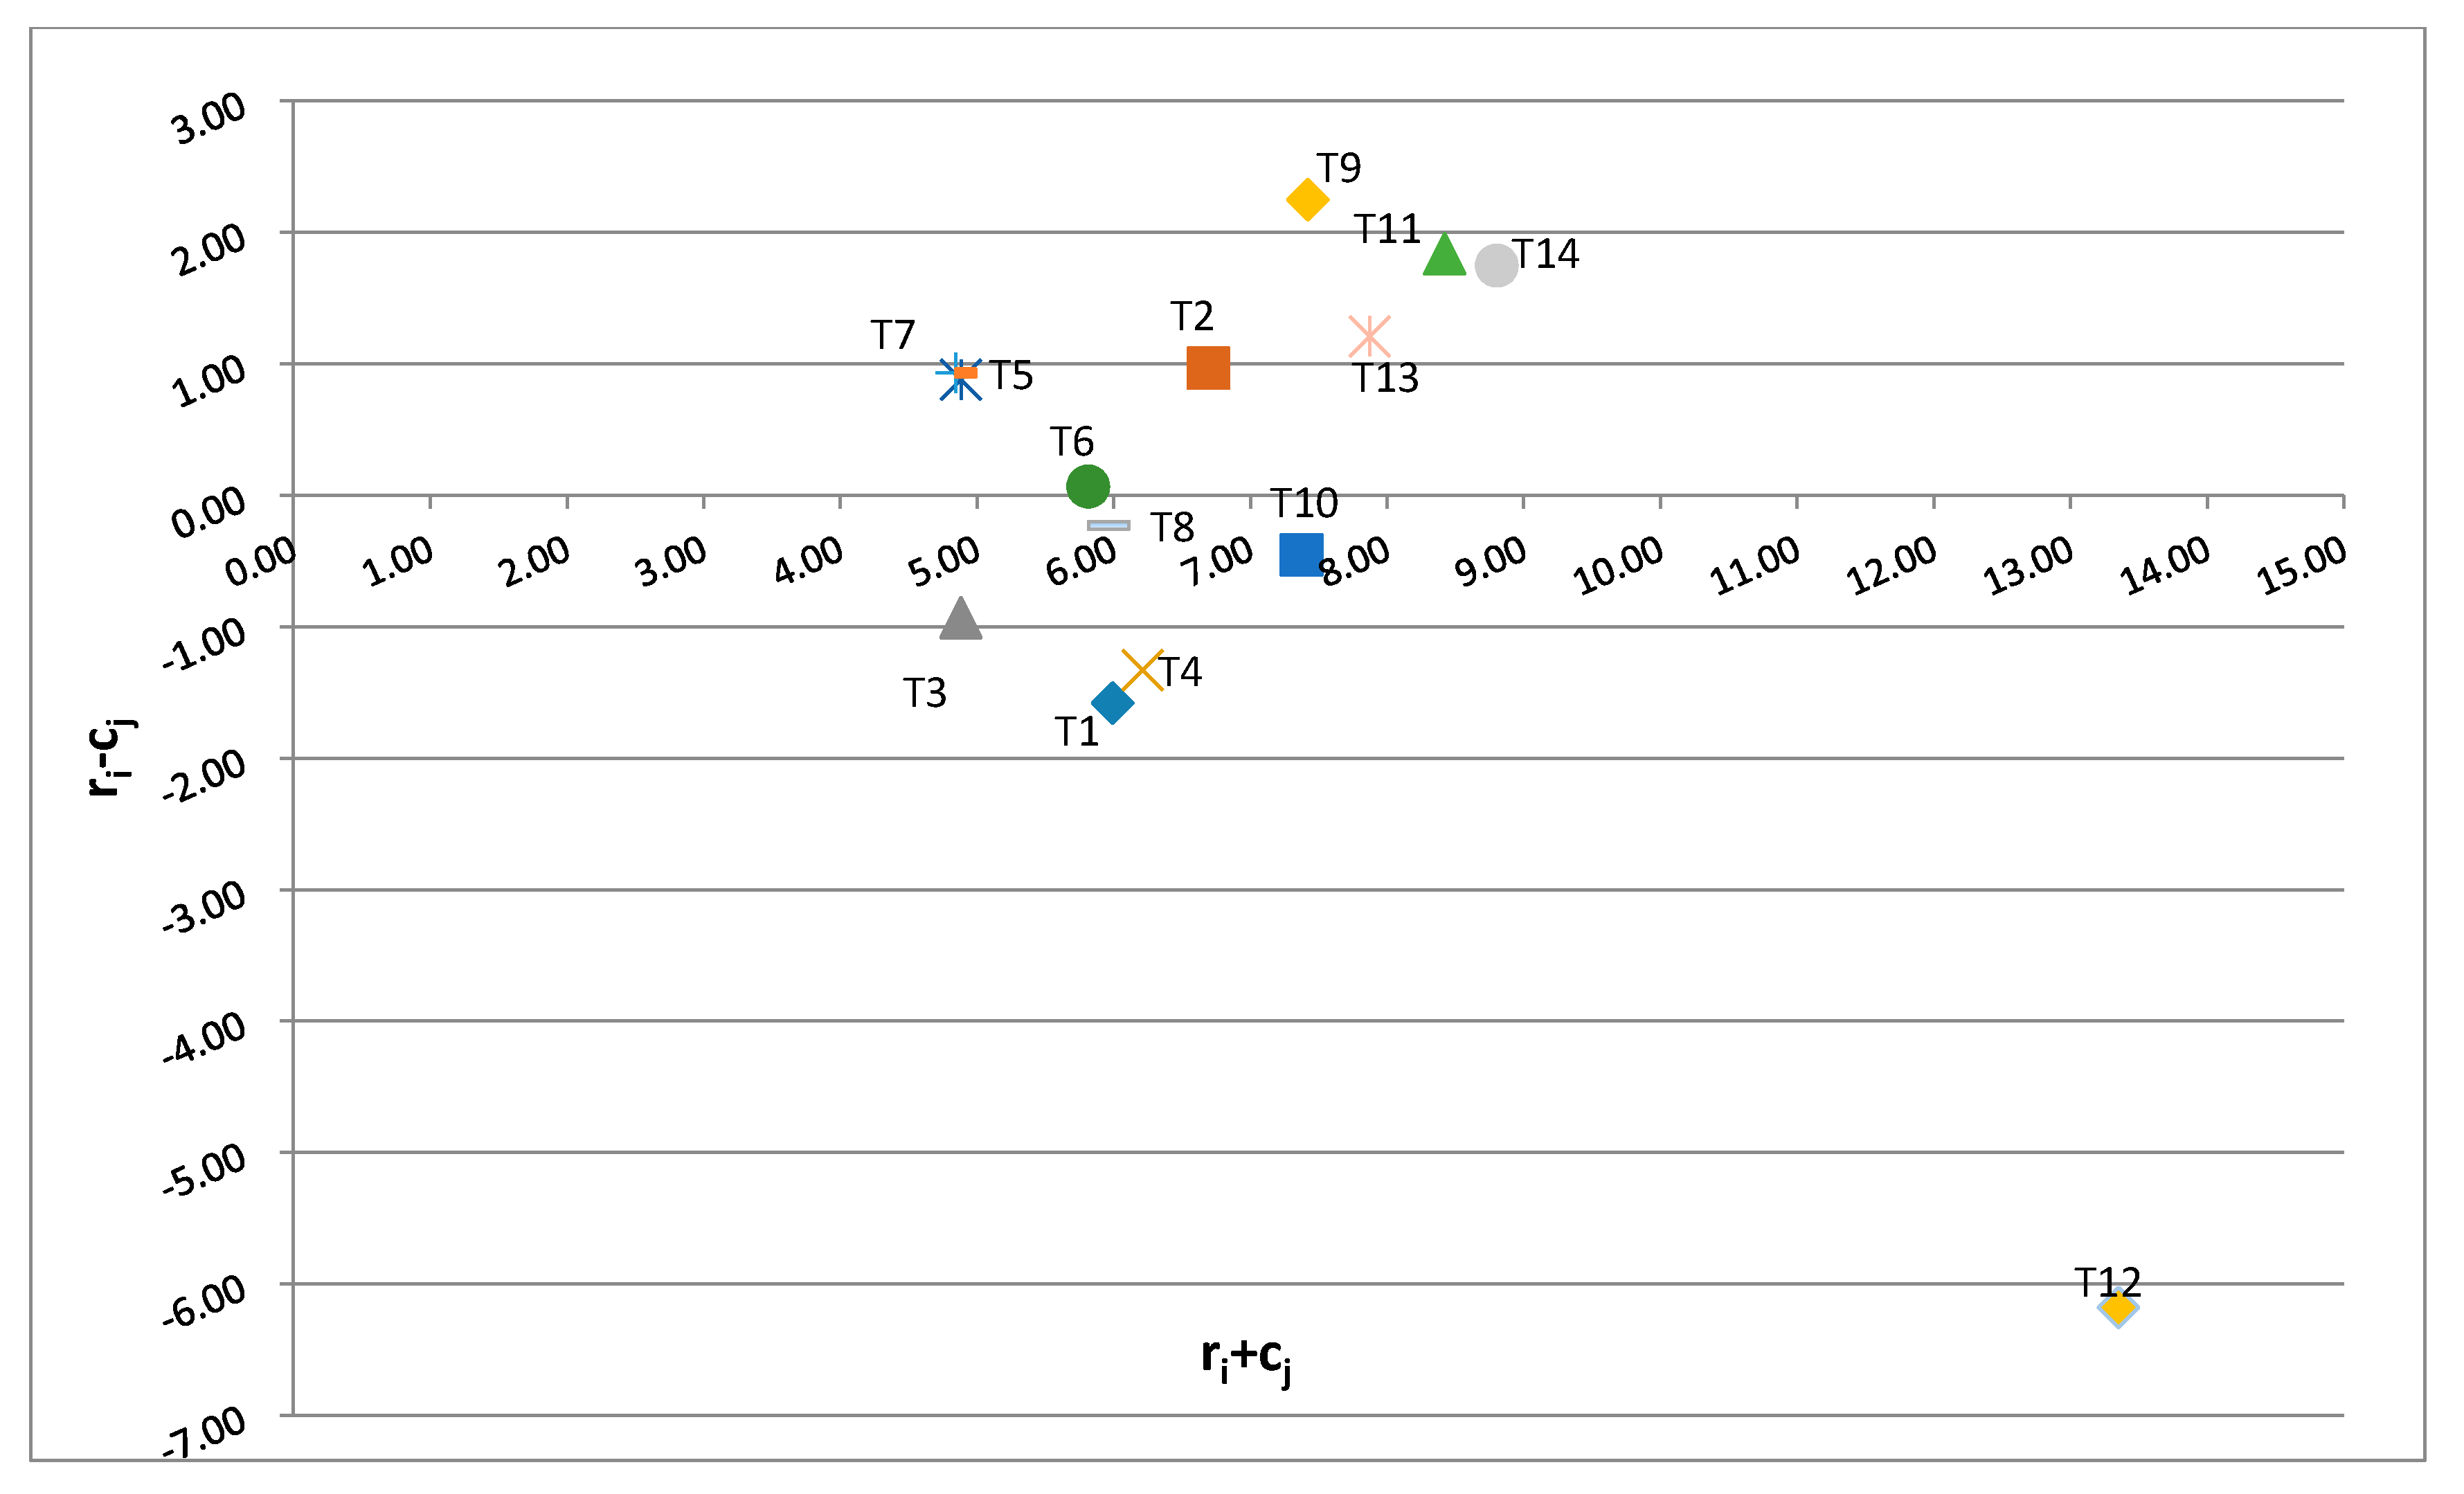
Figure 3.
Causal diagram of sensitivity analysis.

Table 1.
The fuzzy linguistic scale for the respondents’ evaluations [63].
Table 1.
The fuzzy linguistic scale for the respondents’ evaluations [63].
| Linguistic Terms | Corresponding Triangular Fuzzy Numbers (TFNs) |
|---|---|
| No influence (NO) | (0, 0, 0.25) |
| Very low influence (VL) | (0, 0.25, 0.5) |
| Low influence (L) | (0.25, 0.5, 0.75) |
| High influence (H) | (0.5, 0.75, 1) |
| Very high influence (VH) | (0.75, 1, 1) |
Table 2.
The characteristics of the five decision-making evaluators.
| Age | Education Level | Experience (Years) | Job Title | Job Responsibility | |
|---|---|---|---|---|---|
| Evaluator 1 | 35 | Bachelor in Civil Engineering and a getting certificate in occupational health and safety | >10 | Construction manager | directing construction projects, planning site investigations, conducting feasibility studies, providing construction safety |
| Evaluator 2 | 50 | Bachelor in Civil Engineering and a getting certificate in occupational health and safety | >25 | Construction Manager and Construction Safety Expert | directing construction projects, planning site investigations, conducting feasibility studies, providing construction safety |
| Evaluator 3 | 40 | Bachelor in Civil Engineering and PhD in occupational health and safety | >15 | Construction Safety Expert | providing a safe working environment for workers, preparing safety procedures, training of workers on safety topics. |
| Evaluator 4 | 30 | Bachelor in Civil Engineering and a getting certificate in occupational health and safety | >5 | Construction Safety Expert | providing a safe working environment for workers, preparing safety procedures, training of workers on safety topics. |
| Evaluator 5 | 30 | Bachelor in Civil Engineering and a getting certificate in occupational health and safety | >5 | Construction Safety Expert | providing a safe working environment for workers, preparing safety procedures, training of workers on safety topics. |
Table 3.
Significant causal factors of accidents and Potential critical occupational hazards on construction sites.
Table 3.
Significant causal factors of accidents and Potential critical occupational hazards on construction sites.
| Code | Causal Factors of Accidents | Potential Critical Occupational Hazards |
|---|---|---|
| T1 | Worker actions/behavior | Improper positioning and posture while working, not wearing personal protective equipment (PPE) provided, falling from height, getting foreign objects into the eye such as during welding, cutting, grinding, etc. |
| T2 | Worker capabilities (knowledge, skills, experience) | Exceeding the operator’s lifting capacity, lack of experience of using vehicles bulldozers, diggers, excavator, etc., lack of experience on operations welding, cutting, etc., cave-ins (while or after excavation), transport accidents, exposure to fumes, gases, fire and explosions, etc. |
| T3 | The lack of proper communication among workers or between workers and employees. | Confusion because of the physical distance between workers or high levels of background noise or poor line of communication among safety officer and employees, heavy equipment accidents, exposure to electricity, etc. |
| T4 | Worker health/fatigue | Unsafe behavior due to fatigue, falls from vehicles (bulldozers, diggers, excavator), transport accidents on site, loss of balance (while working on the scaffold), etc. |
| T5 | Site conditions | Working at crowded space, poor warning signage, working at high level (expose to high level), tripping over cables or falling into holes, crushed, jammed or pinched in or between objects, caught between machinery part, etc. |
| T6 | Work scheduling | Irregular work schedules of workers (extended work hours), bad planning between tasks and workers, and using the wrong equipment, power tool and machinery accidents, cave-ins (while or after excavation), etc. |
| T7 | Unsuitability of materials | Not meeting specification requirements of materials, not disposing all surplus and unsuitable materials; such as brush, grass, weeds, tripped on rubble, exposure to gases, fumes, smoke, fire, etc. |
| T8 | Unsuitability of equipment | Shortcomings of equipment, including PPE, etc.; inappropriate use of equipment for the tasks such as carrying, lifting heavy equipment accidents, crushed, jammed or pinched in or between objects, etc. |
| T9 | Safety culture | Not making safety an integral part of the job, not having pre-qualified of contractors for safety, not training workers on use of safety equipment, safety expectations, and any safety risks and precautions relevant to their job duties, falls, tripped on brick on scaffold, struck scaffold, etc. |
| T10 | Construction process | Manual handling, exposure to hazardous materials, scaffolding, ground working, struck by formwork on crane, building/structure collapse, etc. |
| T11 | Shortage of safety management | Lack of personal protection equipment, regular safety meetings, and safety training, fall accidents, struck by lorry platform whilst attaching it, struck by scaffold, etc. |
| T12 | Poor education of laborers, inadequate safety training | Lack of proper education, not receiving proper safety training and, lack of understanding of the job, not training on the accident prevention, risk and work hazard identification, reporting near-miss falls from height, falling objects, unsafe lifting, unsafe carrying, unsafe placing, etc. |
| T13 | Poor safety conscientiousness of laborers | Lack of safety awareness and conscious of construction workers on the job-related safety and health issues, lack of conscious on the wearing of personal protective equipment, lack of enforcement of safety regulations, exposure to electricity, caught between machinery parts, etc. |
| T14 | Poor site management | Not providing sufficient PPE and safety equipment of management, lack of education (safety training and orientation), fall accidents (fall from height and falling objects), crushed by plasterboard whilst removing from trolley, exposure to high level vibration, etc. |
Table 4.
Linguistic assessment of the evaluators’ opinion (average).
| Code | T1 | T2 | T3 | T4 | T5 | T6 | T7 | T8 | T9 | T10 | T11 | T12 | T13 | T14 |
|---|---|---|---|---|---|---|---|---|---|---|---|---|---|---|
| T1 | NO | L | H | VH | NO | NO | NO | NO | H | H | H | NO | NO | H |
| T2 | VH | NO | VH | H | L | VH | NO | NO | H | VH | L | L | L | L |
| T3 | H | NO | NO | NO | L | NO | NO | NO | NO | H | H | NO | H | H |
| T4 | H | VH | H | NO | NO | L | NO | NO | NO | H | H | NO | H | H |
| T5 | H | VH | H | H | NO | L | L | L | L | H | H | NO | L | L |
| T6 | H | L | NO | H | NO | NO | NO | NO | NO | VH | NO | L | L | H |
| T7 | VH | L | NO | VH | NO | H | NO | NO | L | VH | H | NO | H | H |
| T8 | VH | L | NO | VH | L | H | NO | NO | L | VH | H | NO | H | H |
| T9 | VH | L | H | VH | L | NO | H | H | NO | H | VH | H | VH | H |
| T10 | H | NO | NO | H | L | H | H | H | NO | NO | L | L | L | H |
| T11 | VH | L | L | VH | H | H | H | H | VH | H | NO | H | VH | VH |
| T12 | H | L | H | VH | L | H | H | H | H | VH | H | NO | VH | H |
| T13 | H | L | VH | H | NO | H | NO | NO | H | VH | VH | H | NO | VH |
| T14 | VH | L | H | VH | VH | VH | VH | VH | VH | H | H | H | VH | NO |
Table 5.
Normalized initial direct-relation fuzzy matrix.
| Code | T1 | T2 | T3 | T4 | T5 | T13 | T14 | |||||||||||||||
|---|---|---|---|---|---|---|---|---|---|---|---|---|---|---|---|---|---|---|---|---|---|---|
| T1 | (0.00 | 0.00 | 0.02) | (0.02 | 0.04 | 0.06) | (0.04 | 0.06 | 0.08) | (0.06 | 0.08 | 0.08) | 0.00 | (0.00 | 0.02) | ... | (0.00 | 0.00 | 0.02) | (0.04 | 0.06 | 0.08) |
| T2 | (0.00 | 0.00 | 0.02) | (0.00 | 0.00 | 0.02) | (0.06 | 0.08 | 0.08) | (0.04 | 0.06 | 0.08) | 0.02 | (0.04 | 0.06) | ... | (0.02 | 0.04 | 0.06) | (0.02 | 0.04 | 0.06) |
| T3 | (0.00 | 0.00 | 0.02) | (0.00 | 0.00 | 0.02) | (0.00 | 0.00 | 0.02 | (0.00 | 0.00 | 0.02) | 0.02 | (0.04 | 0.06) | ... | (0.04 | 0.06 | 0.08) | (0.04 | 0.06 | 0.08) |
| T4 | (0.00 | 0.00 | 0.02) | (0.06 | 0.08 | 0.08) | (0.04 | (0.06 | 0.08) | (0.00 | 0.00 | 0.02) | 0.00 | 0.00 | 0.02) | ... | (0.04 | 0.06 | 0.08) | (0.04 | 0.06 | 0.08) |
| T5 | (0.00 | 0.00 | 0.02) | (0.06 | 0.08 | 0.08) | (0.04 | 0.06 | 0.08) | (0.04 | 0.06 | 0.08) | 0.00 | 0.00 | 0.02) | ... | (0.02 | 0.04 | 0.06) | (0.02 | 0.04 | 0.06) |
| … | … | |||||||||||||||||||||
| T13 | (0.04 | 0.06 | 0.08) | (0.02 | 0.04 | 0.06) | (0.06 | 0.08 | 0.08) | (0.04 | 0.06 | 0.08) | (0.00 | 0.00 | 0.02) | ... | (0.00 | 0.00 | 0.02) | (0.06 | 0.08 | 0.08) |
| T14 | (0.06 | 0.08 | 0.08) | (0.02 | 0.04 | 0.06) | (0.04 | 0.06 | 0.08) | (0.06 | 0.08 | 0.08) | (0.06 | 0.08 | 0.08) | ... | (0.06 | 0.08 | 0.08) | (0.00 | 0.00 | 0.02) |
Table 6.
Total-relation fuzzy matrix.
| Code | T1 | T2 | T3 | T4 | T5 | T13 | T14 | |||||||||||||||
|---|---|---|---|---|---|---|---|---|---|---|---|---|---|---|---|---|---|---|---|---|---|---|
| T1 | (0.02 | 0.18 | 0.24) | (0.03 | 0.15 | 0.24) | (0.05 | 0.19 | 0.24) | (0.07 | 0.26 | 0.28) | (0.01 | 0.09 | 0.16) | ... | (0.02 | 0.17 | 0.21) | (0.05 | 0.22 | 0.28) |
| T2 | (0.08 | 0.48 | 0.33) | (0.01 | 0.25 | 0.33) | (0.07 | 0.38 | 0.28) | (0.06 | 0.49 | 0.32) | (0.03 | 0.24 | 0.22) | ... | (0.04 | 0.42 | 0.28) | (0.04 | 0.42 | 0.31) |
| T3 | (0.05 | 0.21 | 0.27) | (0.01 | 0.09 | 0.27) | (0.01 | 0.12 | 0.17) | (0.02 | 0.16 | 0.21) | (0.03 | 0.12 | 0.18) | ... | (0.05 | 0.20 | 0.24) | (0.05 | 0.20 | 0.27) |
| T4 | (0.06 | 0.26 | 0.30) | (0.06 | 0.19 | 0.30) | (0.05 | 0.21 | 0.25) | (0.02 | 0.21 | 0.24) | (0.01 | 0.10 | 0.16) | ... | (0.05 | 0.24 | 0.27) | (0.05 | 0.25 | 0.30) |
| T5 | (0.06 | 0.30 | 0.35) | (0.07 | 0.22 | 0.35) | (0.05 | 0.23 | 0.28) | (0.06 | 0.31 | 0.33) | (0.01 | 0.12 | 0.19) | ... | (0.04 | 0.26 | 0.29) | (0.04 | 0.26 | 0.32) |
| … | … | |||||||||||||||||||||
| T13 | (0.07 | 0.58 | 0.34) | (0.03 | 0.36 | 0.34) | (0.07 | 0.47 | 0.28) | (0.07 | 0.61 | 0.33) | (0.01 | 0.27 | 0.19) | ... | (0.02 | 0.50 | 0.25) | (0.08 | 0.56 | 0.34) |
| T14 | (0.10 | 0.67 | 0.40) | (0.04 | 0.40 | 0.40) | (0.06 | 0.50 | 0.32) | (0.10 | 0.70 | 0.38) | (0.07 | 0.37 | 0.27) | ... | (0.09 | 0.63 | 0.35) | (0.04 | 0.55 | 0.33) |
Table 7.
Fuzzy values of ri, cj, ri + cj and ri − cj.
| Code | ri | cj | ri + cj | ri − ci |
|---|---|---|---|---|
| T1 | (0.436, 3.097, 3.076) | (0.957, 5.753, 4.635) | (1.393, 8.85, 7.712) | (−0.521, −2.656, −1.559) |
| T2 | (0.613, 7.058, 3.81) | (0.458, 3.487, 4.635) | (1.07, 10.545, 8.445) | (0.155, 3.571, −0.826) |
| T3 | (0.351, 2.653, 2.913) | (0.586, 3.487, 4.635) | (0.937, 6.14, 7.549) | (−0.235, −0.834, −1.722) |
| T4 | (0.489, 3.52, 3.313) | (0.933, 5.998, 4.39) | (1.422, 9.518, 7.703) | (−0.444, −2.478, −1.077) |
| T5 | (0.57, 4.157, 3.91) | (0.341, 2.806, 2.848) | (0.911, 6.963, 6.758) | (0.228, 1.351, 1.062) |
| T6 | (0.367, 5.535, 2.917) | (0.605, 4.316, 3.69) | (0.971, 9.851, 6.607) | (−0.238, 1.219, −0.773) |
| T7 | (0.577, 4.078, 3.54) | (0.374, 3.164, 2.776) | (0.951, 7.242, 6.316) | (0.202, 0.914, 0.763) |
| T8 | (0.606, 4.272, 3.725) | (0.374, 6.137, 2.776) | (0.981, 10.409, 6.501) | (0.232, −1.865, 0.949) |
| T9 | (0.8, 9.342, 4.362) | (0.522, 3.9, 3.344) | (1.322, 13.242, 7.707) | (0.279, 5.442, 1.018) |
| T10 | (0.489, 6.246, 3.652) | (0.95, 6.137, 4.635) | (1.439, 12.383, 8.288) | (−0.462, 0.109, −0.983) |
| T11 | (0.888, 9.908, 4.59) | (0.728, 4.926, 4.206) | (1.616, 14.834, 8.796) | (0.161, 4.982, 0.384) |
| T12 | (0.816, 5.372, 4.572) | (0.35, 26.012, 2.927) | (1.166, 31.384, 7.499) | (0.466, −20.64, 1.646) |
| T13 | (0.709, 9.015, 3.901) | (0.719, 5.275, 4.003) | (1.428, 14.289, 7.903) | (−0.01, 3.74, −0.102) |
| T14 | (0.988, 10.167, 4.66) | (0.801, 5.289, 4.489) | (1.789, 15.456, 9.149) | (0.187, 4.879, 0.171) |
Table 8.
Crisp values of ri, cj, ri + cj and ri − cj.
| Code | ri | cj | ri + cj | ri − cj |
|---|---|---|---|---|
| T1 | 2.20 | 3.78 | 5.99 | −1.58 |
| T2 | 3.83 | 2.86 | 6.69 | 0.97 |
| T3 | 1.97 | 2.90 | 4.88 | −0.93 |
| T4 | 2.44 | 3.77 | 6.21 | −1.33 |
| T5 | 2.88 | 2.00 | 4.88 | 0.88 |
| T6 | 2.94 | 2.87 | 5.81 | 0.07 |
| T7 | 2.73 | 2.10 | 4.84 | 0.63 |
| T8 | 2.87 | 3.10 | 5.96 | −0.23 |
| T9 | 4.83 | 2.59 | 7.42 | 2.25 |
| T10 | 3.46 | 3.91 | 7.37 | −0.45 |
| T11 | 5.13 | 3.29 | 8.42 | 1.84 |
| T12 | 3.59 | 9.76 | 13.35 | −6.18 |
| T13 | 4.54 | 3.33 | 7.87 | 1.21 |
| T14 | 5.27 | 3.53 | 8.80 | 1.75 |
Table 9.
The precautions against the most critical causal factors on construction sites.
| Code | Critical Causal Factors | Safety Precautions |
|---|---|---|
| T9 | Safety culture |
|
| T11 | Shortage of safety management |
|
| T14 | Poor site management |
|
| T12 | Poor of education of laborers |
|
| T10 | Construction process |
|
Table 10.
Different important weights of evaluators in sensitivity analysis.
| Scenario 1 | Scenario 2 | Scenario 3 | Scenario 4 | Scenario 5 | |
|---|---|---|---|---|---|
| Evaluator 1 | 0.2 | 0.15 | 0.15 | 0.2 | 0.25 |
| Evaluator 2 | 0.2 | 0.4 | 0.4 | 0.4 | 0.35 |
| Evaluator 3 | 0.2 | 0.3 | 0.35 | 0.3 | 0.3 |
| Evaluator 4 | 0.2 | 0.05 | 0.05 | 0.05 | 0.05 |
| Evaluator 5 | 0.2 | 0.1 | 0.05 | 0.05 | 0.05 |
Table 11.
Cause and effect parameters obtained in sensitivity analysis.
| Scenario 1 | Scenario 2 | Scenario 3 | Scenario 4 | Scenario 5 | |||||
|---|---|---|---|---|---|---|---|---|---|
| ri + cj | ri − cj | ri + cj | ri − cj | ri + cj | ri − cj | ri + cj | ri − cj | ri + cj | ri − cj |
| 5.99 | −1.58 | 5.83 | −1.51 | 6.19 | −1.60 | 6.03 | −1.58 | 6.02 | −1.60 |
| 6.69 | 0.97 | 6.42 | 0.83 | 6.90 | 1.03 | 6.69 | 0.92 | 6.67 | 0.89 |
| 4.88 | −0.93 | 4.74 | −0.95 | 4.98 | −0.98 | 4.90 | −0.97 | 4.90 | −0.97 |
| 6.21 | −1.33 | 6.00 | −1.27 | 6.38 | −1.37 | 6.24 | −1.33 | 6.24 | −1.34 |
| 4.88 | 0.88 | 4.82 | 0.73 | 5.11 | 0.77 | 5.04 | 0.73 | 5.08 | 0.71 |
| 5.81 | 0.07 | 5.53 | 0.06 | 5.97 | 0.171 | 5.79 | 0.069 | 5.77 | 0.016 |
| 4.84 | 0.63 | 4.67 | 0.63 | 4.96 | 0.66 | 4.86 | 0.65 | 4.86 | 0.65 |
| 5.96 | −0.23 | 5.76 | −0.16 | 6.16 | −0.23 | 6.01 | −0.20 | 6.01 | −0.19 |
| 7.42 | 2.25 | 7.01 | 1.94 | 7.57 | 2.15 | 7.36 | 2.12 | 7.34 | 2.12 |
| 7.37 | −0.45 | 7.01 | −0.57 | 7.51 | −0.55 | 7.34 | −0.54 | 7.33 | −0.53 |
| 8.42 | 1.84 | 7.95 | 1.55 | 8.55 | 1.76 | 8.35 | 1.71 | 8.34 | 1.70 |
| 13.35 | −6.18 | 11.79 | −4.73 | 13.23 | −5.75 | 12.72 | −5.37 | 12.63 | −5.25 |
| 7.87 | 1.21 | 7.36 | 0.89 | 7.94 | 1.05 | 7.76 | 1.03 | 7.76 | 1.04 |
| 8.8 | 1.75 | 8.39 | 1.53 | 9.05 | 1.77 | 8.79 | 1.66 | 8.75 | 1.63 |
© 2017 by the authors. Licensee MDPI, Basel, Switzerland. This article is an open access article distributed under the terms and conditions of the Creative Commons Attribution (CC BY) license (http://creativecommons.org/licenses/by/4.0/).
Share and Cite
MDPI and ACS Style
Seker, S.; Zavadskas, E.K. Application of Fuzzy DEMATEL Method for Analyzing Occupational Risks on Construction Sites. Sustainability 2017, 9, 2083. https://doi.org/10.3390/su9112083
AMA Style
Seker S, Zavadskas EK. Application of Fuzzy DEMATEL Method for Analyzing Occupational Risks on Construction Sites. Sustainability. 2017; 9(11):2083. https://doi.org/10.3390/su9112083
Chicago/Turabian StyleSeker, Sukran, and Edmundas Kazimieras Zavadskas. 2017. "Application of Fuzzy DEMATEL Method for Analyzing Occupational Risks on Construction Sites" Sustainability 9, no. 11: 2083. https://doi.org/10.3390/su9112083
Note that from the first issue of 2016, this journal uses article numbers instead of page numbers. See further details here.