Social Vulnerability to Natural Hazards in Urban Systems. An Application in Santo Domingo (Dominican Republic)


1
Institute for Research on Innovation and Services for Development, National Research Council, via Guglielmo Sanfelice 8, 80134 Napoli, Italy
2
Department of Urbanism, Faculty of Architecture and the Built Environment, TU Delft, 2628 BL Delft, The Netherlands
*
Author to whom correspondence should be addressed.
Sustainability 2017, 9(11), 2043; https://doi.org/10.3390/su9112043
Submission received: 25 September 2017
/
Revised: 30 October 2017
/
Accepted: 31 October 2017
/
Published: 7 November 2017
(This article belongs to the Special Issue Sustainability in an Urbanizing World: The Role of People)
Abstract
:The concept of risk has become increasingly complex, and has been used not only in relation to the natural features of a region, but also to its socio-economic context. In this conceptualization, the latter directly influences the capacity of a community to cope with, recover from, and adapt to natural hazards. Conceiving vulnerability as a measure of a socio-ecological system’s resilience, and at the same time, as a multidimensional variable that changes in space and time, makes the study of the different ways in which natural hazards impact on society all the more urgent. This is particularly true for developing countries, where risk related to natural hazards affects populations and areas that must deal with stress conditions, such as humanitarian, social and military emergencies. This article presents a methodology for the analysis of social vulnerability, defined and experimented in the context of the international cooperation project “Estudio de la amenaza sísmica y vulnerabilidad física del Gran Santo Domingo”. The methodology, implemented through the employment of a Geographic Information System, led to the elaboration of a “Social Vulnerability Index” and a “Social Vulnerability Map”. These seek to describe the current condition of vulnerability of the city of Santo Domingo de Guzmán (Distrito Nacional) in the Dominican Republic (DR), and are used to define context-related vulnerability scenarios, as well as to indicate the adequate set of mitigation objectives and actions. The results highlight the importance of using social vulnerability study as the point of departure for defining seismic-risk mitigation policies, emergency management, and territorial planning in order to reduce the impacts of disasters.
1. Introduction
In recent decades, there has been an exponential growth in the physical impacts and losses caused by earthquakes throughout the world (e.g., Great Wenchuan Earthquake in 2008s, Haitian Earthquake in 2010s, Great East Japan Earthquake in 2011s, etc.). These natural hazards provide reminders of the susceptibility of communities to devastating loss of lives, livelihoods, and property from damaging seismic events and illustrate how earthquakes adversely impact people and the communities in which they live, and how the impacts of such events occur across geographic boundaries and at multiple scales affecting governments, institutions, economic sectors, livelihoods, and people [1]. Vulnerability reduction is a core element of managing or reducing disaster-related risk and it has been identified as the most significant prerequisite for resilience of disaster-prone areas.
Vulnerability is defined as the condition determined by physical, social, economic, and environmental factors or processes, which increase the susceptibility of a community to the impact of hazards [2].
Literature on vulnerability suggests three different usages of the concept [3]: the first is a model of the exposure to risk that highlights the geographic location of people and tangible human assets with regard to hazard-prone areas [4,5,6,7]. The second is a measure of the social resistance and the social resilience to risk. Such a conception fosters the understanding of vulnerability as social attribute [8,9]. The third and final usage considers potential exposure and social resilience simultaneously, with a specific attention to specific places or regions [3,10].
The current debate on natural hazards has increasingly focused on the implementation and the experimentation of multi-disciplinary approaches, which are deemed able to merge social and physical sciences [11]. Furthermore, the primary [9,12] or secondary role [13] that geophysical events can play compared to the inadequacy of the social sphere, and how the latter can be key to mitigation, have gained increasing attention. This is probably explained by the fact that, if physical events are generally predictable [14] and recurring—and are consequently considered as “normal” risks—the vulnerability of social systems then becomes the most significant variable that influences the impacts of natural hazards. The damages inflicted by such disasters, then, can be related to the inability of a community to mitigate, or even perceive risks [15].
In this context, there has been growing attention to the social dimension of vulnerability in disaster management, resulting in a progressive integration of social vulnerability (SV) in more traditional approaches to, and studies of, the physical and the exposure to natural hazards of an area [2,4,16,17,18,19,20,21]. Therefore, to reduce the damage caused by earthquake disasters, the study and the assessment of social vulnerability is of particular importance.
The investigation of SV is closely related to the identification of the socio-economic, demographic and the built environment contexts, as well as those associated to institutional, political and cultural aspects that can affect (positively or negatively) the capacity of a community to respond to, cope with, recover from, and adapt to catastrophic events.
Taking into account this wide set of variables, social vulnerability is to all effects a blurred condition, which is not easy to define. The reason lies in the fact that it is not related to a single category of individuals. Rather, SV pertains to whole communities and to a high number of citizens. As such, SV does not correspond solely to economic and income-related parameters, despite their relevance. As a multidimensional phenomenon, SV appears to be connoted by the constant and dynamic interplay of economic, social, and relational factors.
Upon closer inspection, the vulnerable segments of society are more exposed to risks. For instance, poverty and old age [3,22,23,24] can contribute to the increase in vulnerability. This is not only because these groups can be less prepared to cope with an emergency, but also because they often live in the most dangerous areas within the city tissue, and/or in less safe settlements. More in general, the poor and the elderly have restricted access to resources, and their condition is characterized by a lack of knowledge, which directly reduces their chances to receive help and recovery [25].
The level of risk related to natural hazards and the strategies employed to cope with them in developing countries [8,26,27,28] differ widely from the ones in developed countries. In the former, natural hazards can generate major impacts on populations and territories that often are characterized by extremely vulnerable conditions, due for instance to humanitarian, social and/or military emergencies [10,29].
Therefore, the strategies employed to cope with a natural disaster change according to the degree of development of each country. The industrialized world has invested in technological solutions to counteract the effects of catastrophes, e.g., by employing innovative monitoring and alert systems, adjusting and retrofitting buildings according to ever more stringent safety regulations and by defining more efficient evacuation procedures. These sets of measures have produced a progressive reduction of disaster-related mortality. On the contrary, developing countries depend more heavily on human resources management, often in relation to complex conditions deriving from political, social, military and environmental instability [30]. In line with this trend, economic loss is more concentrated in developed countries, while the impact of catastrophic events on human life is much greater in developing countries [15].
In these countries, earthquake disasters have very strong destructive power, thus representing a severe threat to human life. Furthermore, it is very difficult to predict earthquakes accurately with the currently available technologies. Therefore, to reduce the damage caused by earthquakes, it is particularly important to assess the social vulnerability of a community to earthquake disasters [31,32,33,34].
Social Vulnerability Analysis (SVA) can play a fundamental role in understanding the dynamics that contribute to make an urban area vulnerable, as it describes the relationship between social characteristics and vulnerability to hazards (better documenting who is at risk) and the distribution of tangible and intangible hazard effects (primarily focusing on impacts described in the other social effects account) [35] (p. 2).
Within the social science community, there is a general consensus on the main factors that influence a community’s social vulnerability to natural hazards. These include: the lack of access to resources (information, knowledge and technology); the limited access to political power and delegation; social capital, social networks and links; belief and habits; the building stock and its age; vulnerable and/or physically limited individuals; the typology and the density of infrastructures [19,36,37,38].
Consequently, these factors reverberate on the degree of complexity of SV, making it a dynamic measurement that changes and evolves in space and time [3], having a higher rate of pace than physical vulnerability, which derives from the geo-morphological conditions of a specific territory.
In this context, the studies conducted by Cutter on Social Vulnerability Index (SoVI) [3,39] are of particular interest. Through the elaboration of indexes and maps, the SoVI tracks the variations of SV in space and time by employing a set of variables and by providing a numeric estimate of such changes. Furthermore, SoVI may be a useful means to support decision-making, since it helps identify and quantify those factors that influence the degree of resilience of a community and its capacity to recover, and consequently to set risk mitigation and adaptation measures [23].
This approach has been found particularly useful to define SV in the Dominican Republic (DR). DR is a developing country [40,41,42,43] and is ranked 27th out of 171 countries in the United Nations World Risk Index 2016 [44].
The DR is situated on the island of Hispaniola, in the Caribbean Sea, and it is vulnerable to a wide range of natural hazards such as hurricanes, floods, droughts, landslides and, in particular, earthquakes. Moreover, the share of Dominicans living in poverty (about 3.20 USD a day) was 30.5 percent in 2016, according to official estimates [45]. In recent years, the main cities in the DR have experienced an accelerated and uncontrollable urban growth, together with a tendency to construct buildings without adequate technical standards.
This article presents the results of a research conducted in the framework of the international cooperation project “Estudio de la amenaza sísmica y vulnerabilidad física del Gran Santo Domingo” [46,47]. The project was developed by the United Nations Development Program (UNDP), in collaboration with the Consiglio Nazionale delle Ricerche, Istituto di Ricerca su Innovazione e Servizi per lo Sviluppo (CNR IRISS) (Italy), the Instituto Geológico y Minero de España (IGME) (Spain), the Bureau de Recherches Géologiques et Minières (BRGM) (France), and the Servicio Geológico Nacional (SGN) of DR.
The cooperation project is part of the “Plan Nacional para la Reducción del Riesgo Sísmico”, referring to the strategic lines of the “Desarrollo sostenible y gestión de riesgos” plans. The aim of the project was to contribute to the reduction of the seismic risk through the study on seismic hazard and the physical, urban, and social vulnerability of the Gran Santo Domingo region, with an application in the city of Santo Domingo de Guzman (Distrito Nacional) (SD).
The main outcome expected from the project was the enhancement of both the physical and social resilience, with the linked goals to minimize human, material and economic resource losses in case of seismic events through the strengthening of institutions’ capacity to regulate the building sector, risk management and response to disasters.
Among its overall contribution to the project, the CNR IRISS carried out the analysis on urban vulnerability. This analysis was made through the study of three different but complementary intervention domains: the morphological vulnerability (namely, how the urban form affects the vulnerability to seismic hazards of the city) the social vulnerability, and the vulnerability of goods exposed to risk. In order to assess these three domains we identified the most vulnerable areas within the city of SD, and, in a second phase, the research group developed site-specific guidelines and recommendations, with particular attention to those vulnerable groups and areas that required priority and measures.
This article describes the methodology developed to evaluate the SV in the Dominican context and the application of such methodology in the city of SD.
Starting from the review of related literature on SV and natural hazard risk reduction, and the studies on SoVI conducted by Cutter, the research has implemented a methodology for SVA in the Dominican context (Figure 1), by also defining the systemic components that allow the interpretation of the social dynamics of the context and elaborate the Social Vulnerability Index (SVI) and the Social Vulnerability Map (SVM) through the implementation of a Geographic Information System (GIS).
The results of SVA, represented trough the SVM, allowed us to identify the areas within the city of SD that are characterized by a greater concentration of vulnerable population.
2. Materials and Methods
The SVA first identified the systemic components in order to understand and describe the social dynamics and consequently to elaborate the SVI and the SVM.
Hence, the research work started from the reinterpretation of Cutter’s SoVI, applied to the Dominican context. Cutter’s model has first been used for the US counties, and has been refined through a series of applications in the United States [3,23]. This resulted in an updated version of the index (2010–2014) which employed a set of socio-economic variables describing the conditions which contribute to the reduction in a community’s ability to prepare for, respond to, and recover from hazards [48] (p. 24).
In addition, SoVI has been adapted to and applied in other contexts: Huang, Su, and Zhang in Beijing-Tianjin Hebei Region, China [49]; Frigerio and De Amicis in Italy [50]; Solangaarachchi, Griffin and Doherty in Australia [51]; Prior, Roth, Maduz, and Scafetti in Switzerland [52]; Cutter in the Yangtze River in China [53], Brazil [54] and Lisbon [55].
The index is therefore a comparative metric that facilitates the examination of social vulnerability in different contexts.
A similar approach has been developed for the Caribbean countries. This was done in order to implement a tailor-made inventory of variables to describe the conditions and the dynamics that determine SV in this particular context [40,41,42,43]. The aim was to build an analytical framework to be tested for the city of SD and potentially replicable in other Dominican cities.
For this reason, in a first step, three main systems have been established to categorize and synthetize the retrieved information to define the multi-dimensionality of social vulnerability in the DR. In a second step, a set of components has been identified and ranked for each of the mentioned systems and a set of indicators, elaborated starting from the gathered data has been developed for each component.
The ranking of the components has been employed to organize the model’s structure for the calculation of SVI, and at the same time, this level played a role as a set of categories to describe the Caribbean community. The selection and the elaboration of indicators had to take into account the specificity of the contextual dynamics, as well as the spatial coverage and the level of aggregation of the retrieved data.
For this reason, indicators were selected according to two different factors: the availability of data and the need of an adequate spatial and representational scale. Concerning the former, and in order to build a durable and updatable monitoring system, the data were gathered, selected and elaborated starting from the “IX Censo Nacional de Poblacion y Vivienda”—the national census—provided by the Oficina Nacionàl de Estatidistica (ONE) of the Dominican Republic [56]. The available data from the census were been aggregated at the neighborhood scale, which was considered adequate for the elaboration of SVI and SVM at a city level.
In order to develop the SVI and SVM, open source GIS software (QGIS) has been employed to collect and analyze data as well as to build the set of indicators. QGIS was used together with ILWIS 3.8 for the elaboration of the hierarchical model and for the implementation of a Multi-Criteria Decision Analysis (MCDA).
2.1. Study Area
DR is located on the island of Hispaniola and it is characterized by the presence of two major faults lines—the left-lateral North American plate and the Caribbean plate.
Global Positioning System (GPS) studies have shown that the Caribbean plate is moving east-northeastward at a rate of 18–20 ± 3 mm/yr relative to North America [57]. Consequently, earthquakes in the Caribbean area are extremely frequent, especially in the Puerto Rican area and in the eastern part of Hispaniola, where the DR is located [58,59] (Figure 2).
DR’s history is characterized by major earthquakes, which affected the population several times (in 1562, 1615, 1673, 1691, 1775, 1842, 1843, 1887, 1946, 1953 and 2003). The most disruptive event occurred in 1946. This earthquake, whose magnitude was 8.1 degrees, generated a tsunami with waves up to 5 meters high. The tsunami spread from east to west, affecting the entire northern coast and causing about 500 deaths.
Extending over 2/3 of Hispaniola, DR was shocked by the earthquake that destroyed Haiti in 2010. Subsequently, DR has suffered illegal immigration from Haitians in search of better living conditions. In recent years, the main DR cities have grown in an accelerated and uncontrolled fashion, with buildings often constructed without regard to technical and safety standards. This is more evident in the poorest districts, where the construction of new buildings and the expansion of the existing ones have occurred without any concern for anti-seismic standards.
The population is characterized by strong inequalities of income and access to resources and services. In addition, the most vulnerable people live in degraded areas and at environmental risks. These conditions make the reduction of social vulnerability all the more necessary to reduce the population’s overall exposure to death risk.
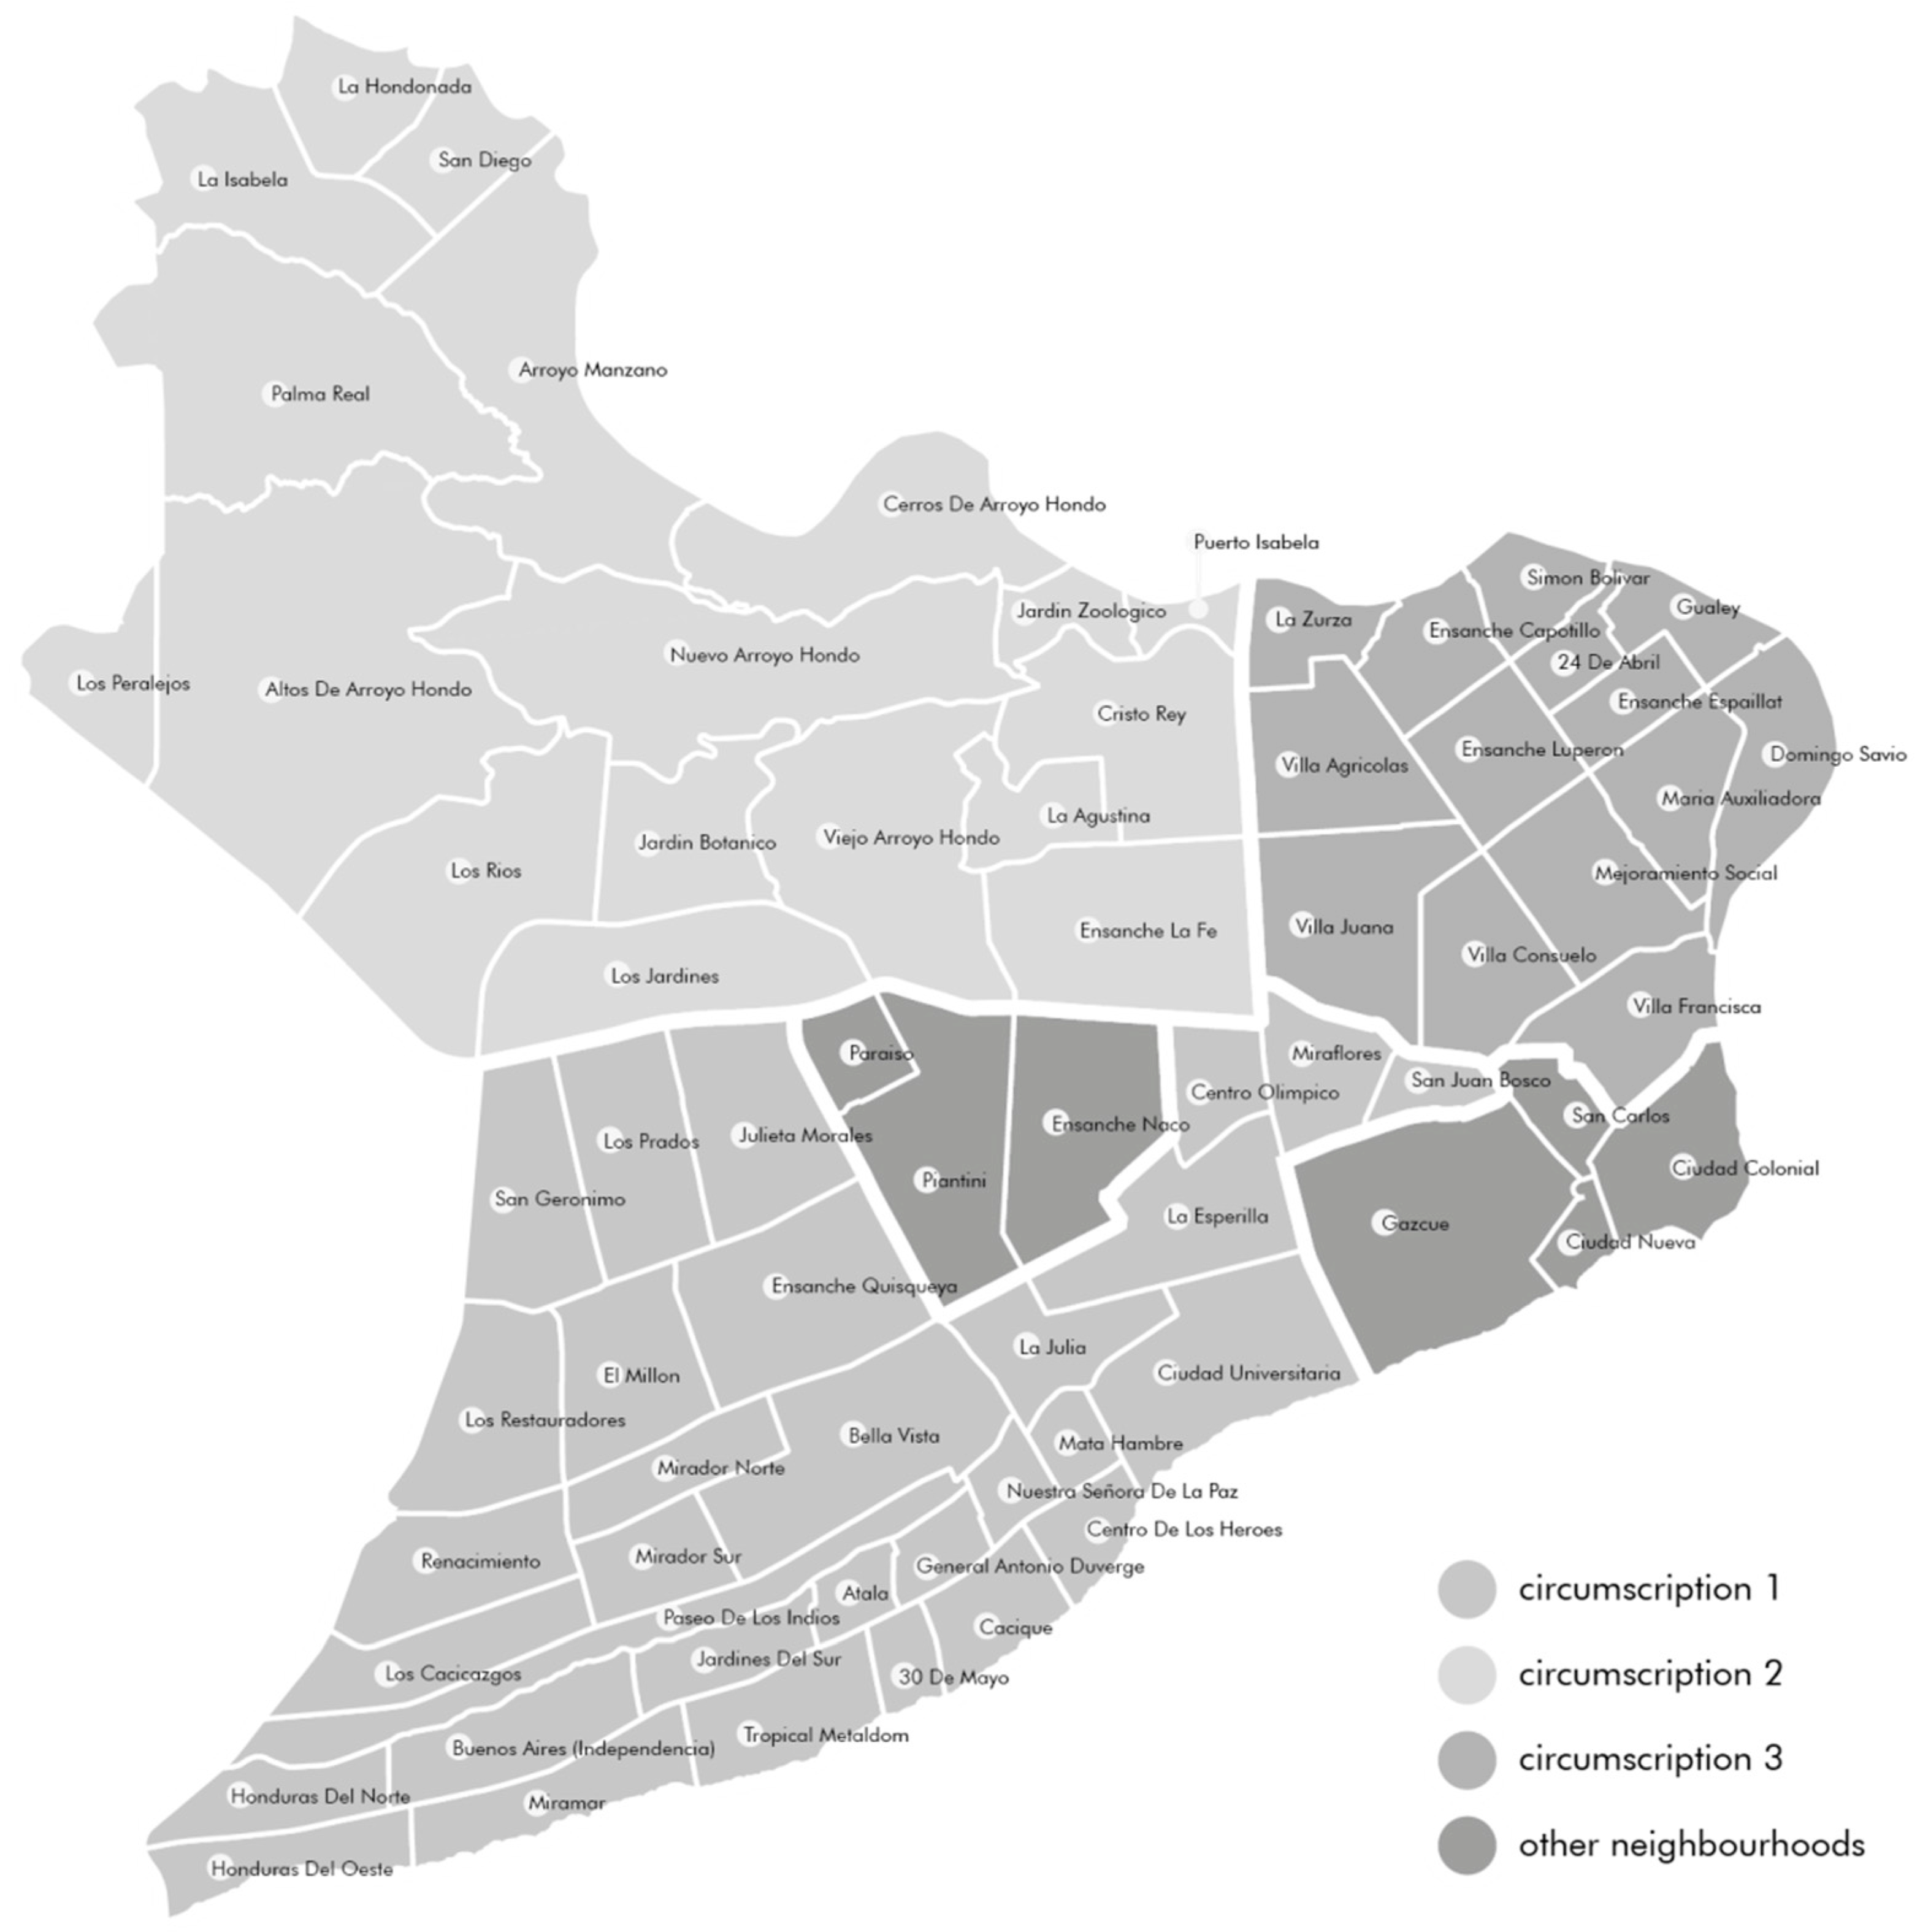
SD, whose administrative boundaries match those of the Distrito Nacional, is the largest of the entire DR: in 2010, 965,040 habitants lived there, which makes 10.2% of the entire national population [56], in an area that extends for little more than 104 km2, that is to say the 0.2% of the entire DR.
SD is divided into 70 neighborhoods (barrios), which are in turn grouped in 3 larger entities, called circumscriptions (Figure 3). These are characterized by a high level of risk resulting from the morphology of the area and the building stock, but also from a high population density that presents diverse conditions of vulnerability, related to low income, lack of resources, and generally unsafe areas and buildings.
SD hosts the government and the majority of the country’s financial activities, as well as the buildings of the Supreme Court. Furthermore, the historical center of the capital—the Ciudad Colonial—is the most ancient colonial settlement of the Americas, founded by Bartholomew Columbus at the beginning of the XVI century, and a UNESCO World Heritage Site.
2.2. A Hierarchical Model for Social Vulnerability: Systems, Components, Indicators
As already introduced in the previous paragraphs, the method presented in this paper had been applied at the city scale, and it consists in a hierarchical-structure model that has been built to describe and measure social vulnerability in its multidimensionality. It seeks to do so by first identifying three systems: the Social System, the Economic System and the Environmental System. The first two systems are closely related to socio-economic dynamics and provide information on the population and its structure at the individuals’ level. The latter focuses instead on the functioning of the built environment, on the services and on the networks in relation to the society.
Within the hierarchical structure, each system is made up of several components. The components highlight those factors belonging to domains ranging from demographic, socio-economic, housing, to cultural dimensions that influence the capacity of a community to cope with and/or recover from natural hazards. Each component, in turn, is made up of a set of indicators.
The method presented here builds on spatial analysis through GIS, as well as statistical modeling.
The SVA unfolded along four main steps (Figure 1):
- (1)
- data gathering and selection;
- (2)
- construction of social vulnerability indicators;
- (3)
- elaboration of the SVI;
- (4)
- elaboration of the SVM.
In order to carry out a SVA in the Dominican context, the selection of variables has been customized. The availability of open-source data has been the main factor behind the choice of the indicators, paying attention to the types of socioeconomic data produced in such context, as this diversity of the data is due to different historical background, as well as social and economic conditions [60]. Indicators were selected through both desk-research (analysis of national and municipal documents on socio-economic status) and on-field analyses (interviews and workshops with local stakeholders and technicians). This process helped to identify those factors, which related to natural hazards, that cause major repercussion on social vulnerability in the municipality of SD. Alongside age, gender, ethnicity, socio-economic status and household composition, the analysis identified factors that are related to the needs people without any access to the social protection networks and resources (e.g., immigrants and homeless). In addition, the characteristics of the built environment and the quality of human settlements (e.g., housing typology and infrastructure) have been considered, since they influence potential human life and economic loss in case of natural disaster.
The hierarchical model implemented for the elaboration of the SVI (Figure 4) then defined in a second step the main systems through which it describes and measures the degree of social vulnerability, as well as its components and indicators.
Concerning the Social System, the components identified here refer mainly to demographic and social factors. In particular, this was true for all the information describing individuals and their interactions that directly influence the capacity of a community to face natural hazards. These components are: population, household structure, age and population with special needs.
The Economic System encompasses components related to the socio-economic status, the employment, and the level of education of individuals. These components are considered in order to measure, among other things, their degree of inclusion.
Lastly, the components of the Environmental System relate to physical factors that influence or are influenced by a community, as well as the presence or absence of services within the city. These are: quality of the dwelling, activities and services, medical care facilities, usage of and access to information and communication technology.
For the study case of the Gran Santo Domingo, 30 indicators were selected in order to (a) build a robust set of significant and non-redundant variables and (b) set the basis for the monitoring phase based on available data, to facilitate the updating of each indicator.
Specifically, the choice and the implementation of the components and the related indicators have been driven by different needs and restrictions:
- (1)
- availability of input data and existence of indicators that are already employed in the Dominican context;
- (2)
- spatial representability of the data, so that different degrees of vulnerability can be mapped for the whole metropolitan area;
- (3)
- replicability of the proposed methodology in other cities and/or regions of the DR;
- (4)
- possibility to update and apply the indicators in different timeframes;
- (5)
- dissemination of the final results to local stakeholders and decision-makers.
For these reasons, indicators have been developed by using the data provided in the “IX Censo Nacional de Poblacion y Vivienda” [56] neighborhood available at the neighborhood level.
For each indicator, a description, the spatialization criteria, the bibliographic reference, the coordination system, the unit of measurement and the direction (i.e., whether it influences social vulnerability positively or negatively) have been indicated (Table 1).
The creation of a hierarchical model to analyze a complex issue such as social vulnerability helped synthetize information for each system, and consequently to estimate to what extent each of them influences the overall vulnerability of a community. Hence, a hierarchical structure allows representing a problem and developing a set of priorities that can be presented to local stakeholders in a clear and efficient way during the design phase.
2.3. Social Vulnerability Index and Social Vulnerability Map
Social Vulnerability Analysis has been carried out employing Quantum GIS for the elaboration of a geodatabase, fed by spatial data elaborated through ILWIS 3.8.3, a platform for the implementation of multi-criteria support system that allows data classification, normalization and weight assignment.
For each level (systems, component, indicators) of the model, data have been normalized through a linear cost-benefit function, into values ranging from 0 to 1. Whenever the direction of an indicator is found to be positive, the linear function is ascending (benefit), thus increasing the value of the overall vulnerability. On the contrary, whenever the direction of an indicator is deemed negative, the linear function is descending (cost). Consequently, increasing the latter type of value decreases the vulnerability.
In a second step, data have been clustered according to the Jenks natural breaks optimization. Such a method allows reducing the variance within each class, while at the same time maximizing the variance between classes. The use of Jenks natural breaks optimization is useful when it is necessary to better represent non-linear distribution of values, while gives similar results compared to other methods (e.g., quantiles, or equal intervals) when dealing with linear distribution of values.
Finally, the values of the indexes for each system have been combined to obtain the SVI for each neighborhoods of the city of SD. In this step, indicators were not weighed.
In order to obtain the final classes of vulnerability, the calculated SVIs have been classified using standard deviation methods, with a mean of 0 and a standard deviation of 0.5. Hence, five categories of vulnerability have been defined (Table 2) (Figure 5):
- (1)
- Low vulnerability (values lower than 0.33)
- (2)
- Medium vulnerability (values from 0.33 to 0.37)
- (3)
- High vulnerability (values from 0.37 to 0.46)
- (4)
- Very high vulnerability (values from 0.46 to 0.50)
- (5)
- Maximum vulnerability (values higher than 0.50)
The comparison of the final SVIs, and the subsequent classification according to the standard deviation provided a relative ranking of the Dominican capital’s neighborhoods. However, according to the values of the single indicators, it has been considered appropriate to classify the average condition as a high vulnerability level.
The final step consisted of the elaboration of the Social Vulnerability Map (SVM), which represents each index spatially. The map helps visualize where, and to which extent, each system influenced the overall vulnerability. For this step, a S-MCDA was adopted [61,62,63,64]. This method was adopted for its ability to integrate GIS features with the MCDA [65,66,67]. This enabled to draw a landscape complexity map of each considered component according to a layer representation [68]. This visualization served as a tool to support decision-making as well as to identify, locate and select mitigation actions to be implemented within the study case.
Furthermore, by overlaying the spatial distribution of vulnerability resulted from the SVM on the risk maps related to earthquakes (which was developed by the others partner of the international cooperation project), it was possible to highlight the hot spots, or areas characterized by greater potential risk and exposure.
3. Results
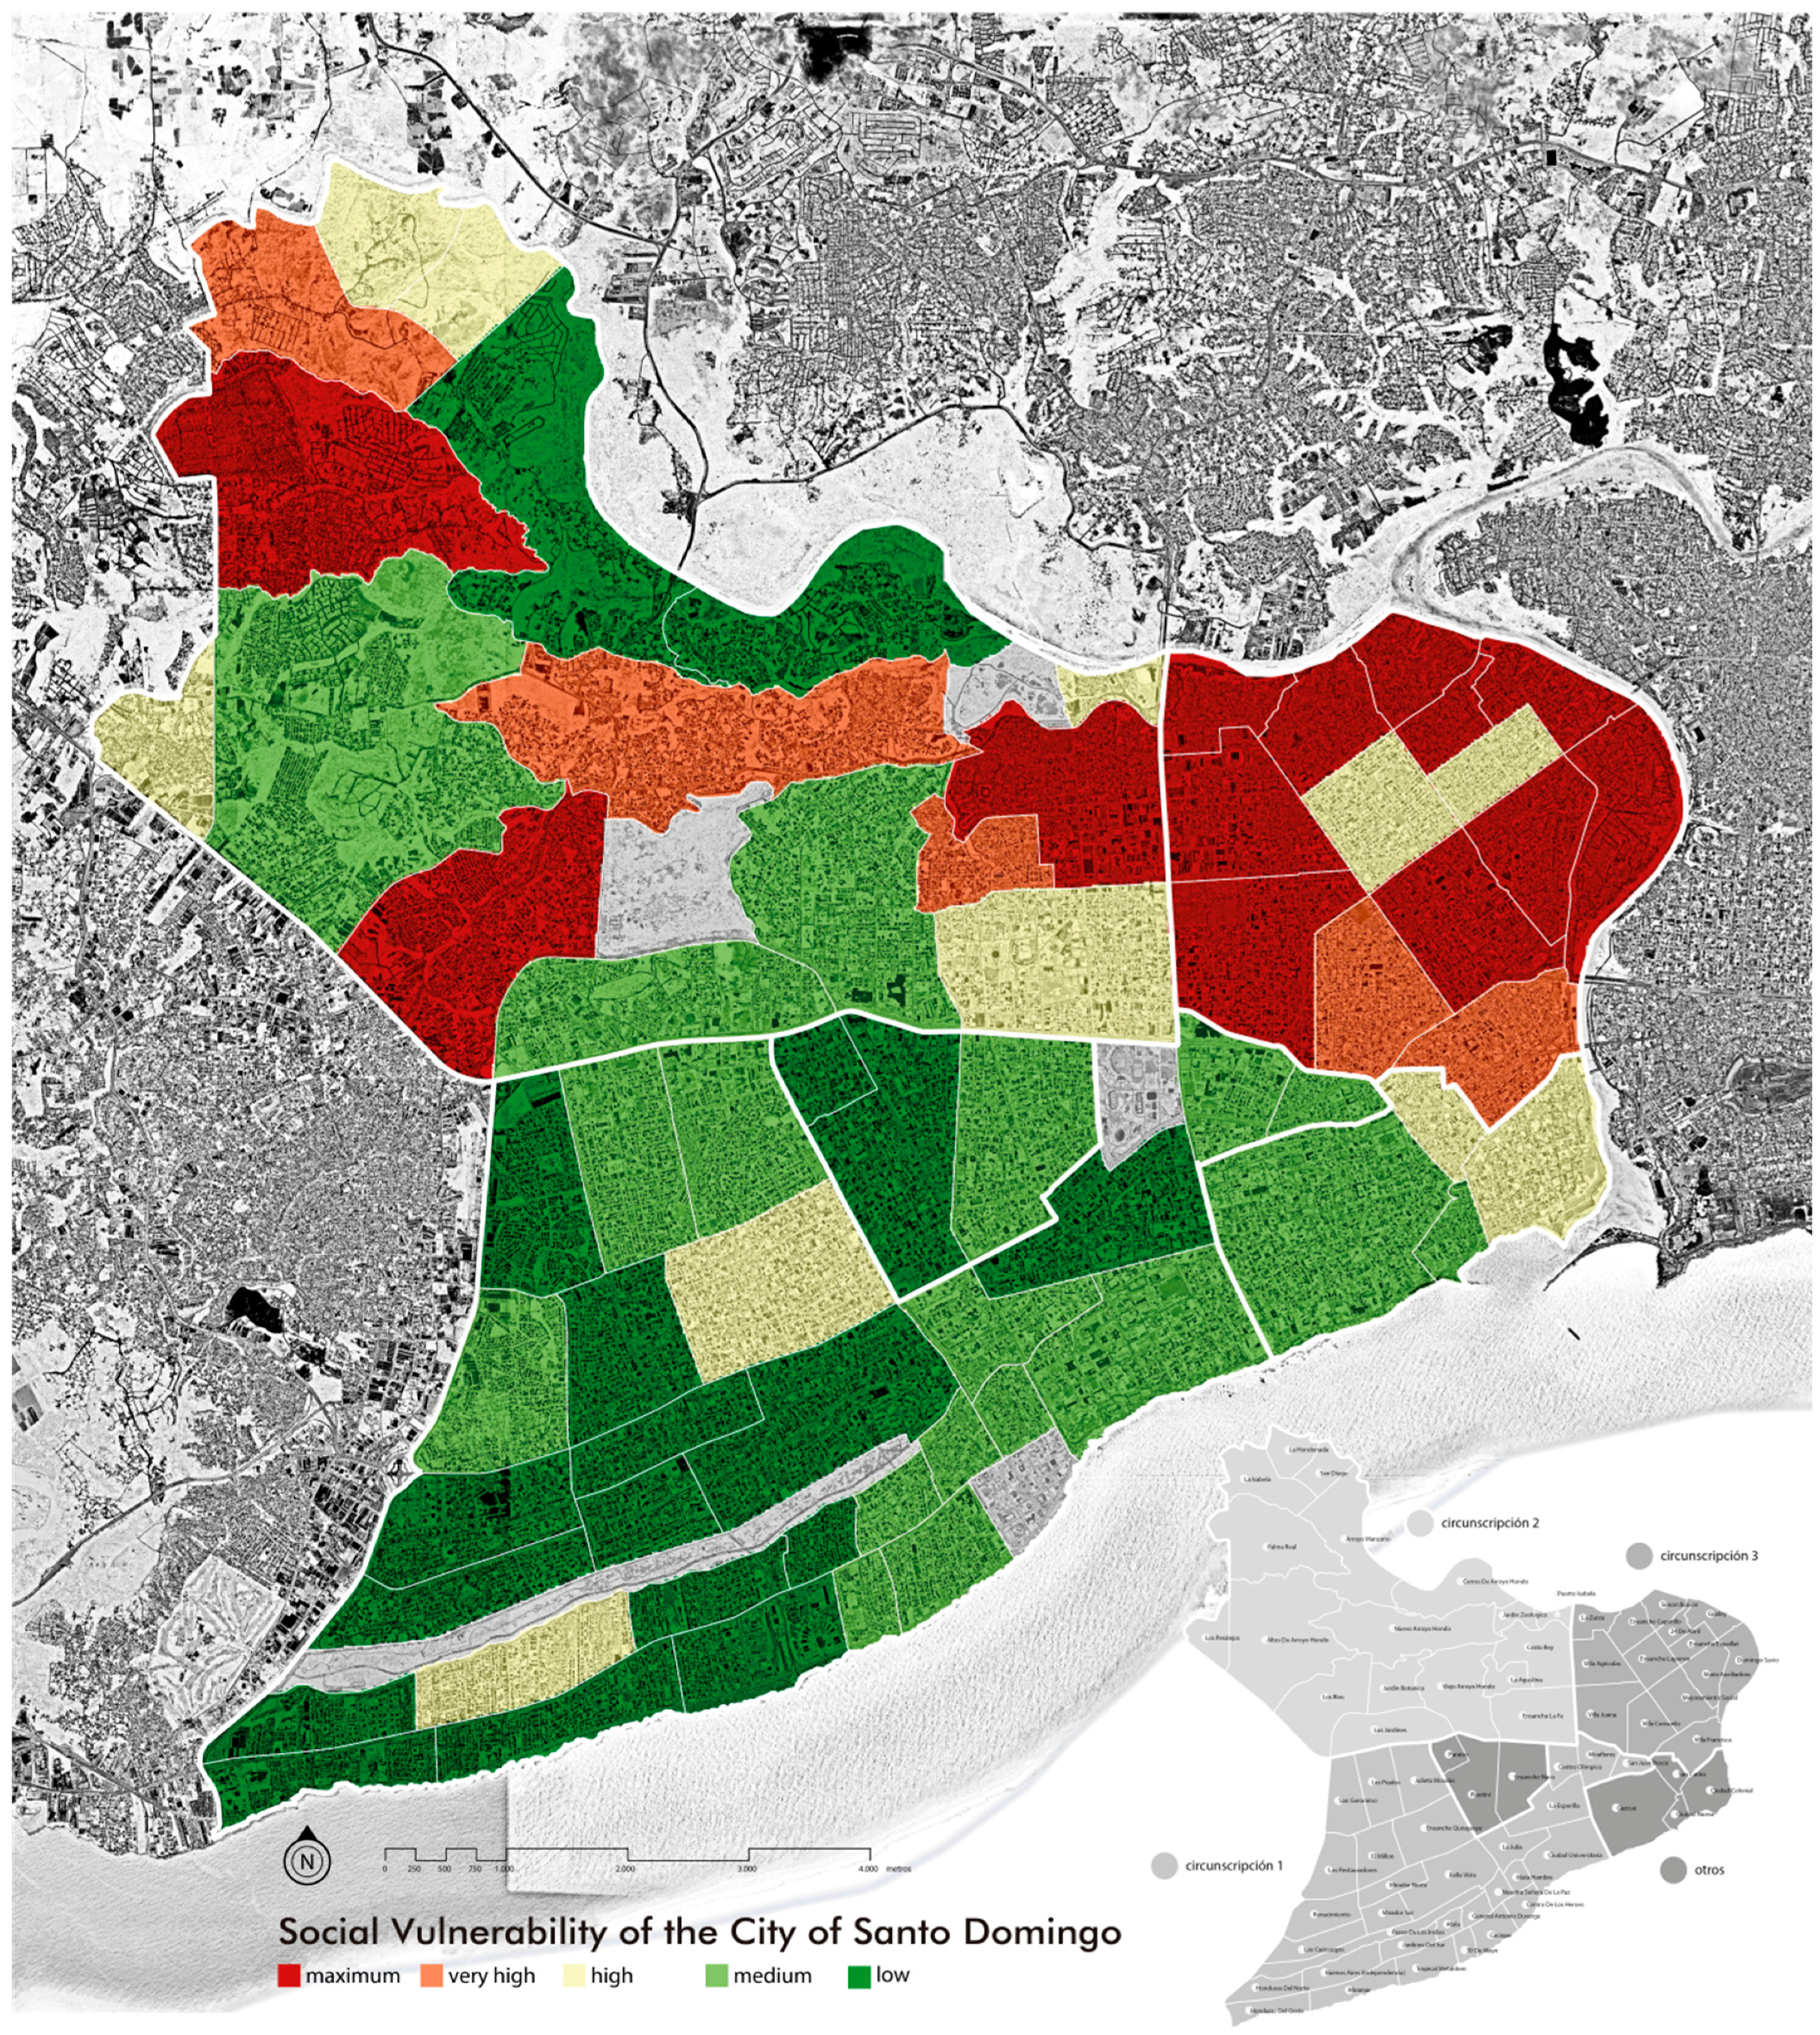
The final output of the SD is the Social Vulnerability Map (SVM) (Figure 5), in which the degree of social vulnerability for each neighborhood, ranked according the classification presented in Section 2.1, is represented with a color scale from red (most vulnerable areas) to green (less vulnerable areas).
The spatial unit employed for the representation of the indicators and the SVI corresponded to the boundaries of the city’s administrative neighborhoods. In turn, the 70 neighborhoods are grouped in 3 circumscriptions (Figure 6).
In particular, the overall SV in Santo Domingo presents non-homogenous values in space:
- (1)
- Low vulnerability (with an SVI smaller than 0.33), in the neighborhoods presented low indexes in at least two systems, and a medium value for the third. Such neighborhoods can be considered to be less exposed and to have a greater recovery capacity than the others. Medium vulnerability (with an SVI comprised between 0.33 and 0.37) characterized the neighborhoods in which the indexes of at least two systems are nearer to the total mean value and the remaining system deviates from the mean, either positively or negatively. High vulnerability (SVI comprised between 0.37 and 0.46) is visible in the neighborhoods where the indexes of at least two systems are high, while the third system presents a medium or very high index. This category encompasses the neighborhoods with a high exposure, and that consequently can have difficulties during the recovery phase. The Ciudad Colonial falls within this category.
- (2)
- Very high vulnerability is detected in neighborhoods where the indexes of at least two systems are very high, and the third system is characterized by a high index.
- (3)
- Maximum vulnerability (SVI greater than 0.54) describes the neighborhoods that have the greatest values in at least two systems. These neighborhoods are the most exposed and are likely to face more difficulties in the recovery phase, compared to the others.
Overlaying the SVI of each neighborhood to the circumscriptions’ boundaries, a more uniform distribution of the SV emerges out from the map. In fact, the spatial outcome of the SVI shows that such administrative subdivision in SD can help to better understand and synthetize the general characteristics of the city in relation to social vulnerability, and which are the systems that have a major role in the different areas of the city.
Since the SVM results from the overlay of the spatialized index of each neighborhood, their extrapolation helps locating them and to understand which system influences more the overall social vulnerability, both at the neighborhood and at the circumscription level (Figure 7).
- (1)
- Circumscription 1 and the surrounding neighborhoods (Poligono Central, Poligono Gazcue and Ciudad Nueva) are generally characterized by overall low and medium social vulnerability. The system that most influences the SVI is the Social one.
- (2)
- Circumscription 2 presents a less homogeneous condition, in which the neighborhoods closer to the Circumscription 3, as well as its northwestern areas, have a greater vulnerability (maximum, very high and high vulnerability). Here, the systems contribute equally to the overall social vulnerability.
The neighborhoods of the Circumscription 3 are the most vulnerable. In this Circumscription, the indexes of Economic and the Environmental Systems are higher than for the Social System. In general, the Social System affects more often the overall SVI of each neighborhood. In fact, in one neighborhood out of three its incidence is more than the 50%. The Economic System’s incidence is higher than the 50% in one case out of four, while the incidence of the Environmental system is never greater than 50%.
These results point to the heterogeneous spatiality distribution of SV, which affects in different ways and with different intensities the overall vulnerability of the city. This suggests the need to intervene on all the systems to enhance the overall city’s resilience. On the other hand, interventions in Circumscription 3, which presents a higher SVI, can be considered as a priority in order to reduce Santo Domingo’s social vulnerability to earthquakes.
4. Discussion and Conclusions
The methodology showed in this article has been developed in the framework of the project “Estudio de la amenaza sísmica y vulnerabilidad física del Gran Santo Domingo”, starting from the studies made by Cutter [3,48], by entering into the studies that have experienced the SoVI applied in other contexts. The elaboration of SVI and SVM helped identify social vulnerability, and visualize how it spreads spatially in Santo Domingo.
As a developing country, social vulnerability in the DR plays a major role in the overall vulnerability to natural hazards than elsewhere [4,5,6,7].
Consequently, in order to reduce vulnerability, risk-reduction strategies must consider as much as possible the population’s characteristics and ensure that the population knows how to act in emergency situations. Similarly, institutions must have a clear picture of what preventive measures can be employed, both at the individual and the community level, to reduce the risk for individuals, households and communities. As it has been observed, supporting the local community’s involvement is crucial for implementing strategies that will lead to a culture of safety [69] (p. 4).
By doing so, it becomes possible to build that “social capital” that Blaike, Cannon, Davis and Wisner [8] consider fundamental, that is to say the set of rules of conduct founded on reciprocity and mutual trust, relationships and institutions that shape the quality and the quantity of a society’s interaction [70,71].
The elaboration of SVA was based on the analysis of economic, demographic and housing characteristics of the community, with the aim of identifying the most vulnerable urban areas to seismic events. Such analysis seeks to provide a tool for the assessment and the identification of the spatial distribution of social vulnerability in the Dominican capital, highlighting the main aspects (social, economic and environmental) that contribute to SV.
The spatial representation proposed through the employment of the SVM provided a basis to understand the spatial implications of social vulnerability. In the second phase of the project, the SVM served as an additional information layer for the selection of a sample neighborhood, for which a set of adaptation and mitigation measures was tested to be replicated at the city scale.
The construction of the SVI inventory proved that the number and the type of chosen indicators turned out to be fundamental. Within this research, the total number of indicators has been limited to 30, in order to make the model both easily updatable by local technicians and administrations and replicable in other Dominican cities without losing relevance and effectiveness. If, on the one hand, some of the selected indicators are intrinsically related to people more exposed to natural hazards, other indicators express an overall condition of social inequality and unequal access to resources that goes beyond the mere notion of risk.
The identification of a hierarchical structure allowed understanding of how each system influences—either positively and negatively—the overall social vulnerability. It did so by highlighting, through the overlay of the spatialized index in the SVM, the areas characterized by a greater potential risk and the concentration of vulnerable populations.
This model may be a useful tool for decision makers seeking to fine-tune strategies and measures to mitigate and adapt to seismic risk. In particular, it may help them rank the single most relevant factors behind social and spatial inequality, reverberating in an uneven distribution of social vulnerability.
This study is the first attempt of its kind to investigate the relationship between the spatial implication of social vulnerability and seismic risk in DR seismic implications.
The SVM, overlapping with the morphological vulnerability, vulnerability of goods exposed to risk, and geological maps, has allowed more accurate definition of SD’s exposure to risk. By recognizing the most vulnerable urban areas, the SVM identified the most vulnerable groups and areas that require priority interventions and measures.
The SVA methodology may be a useful tool to develop a monitoring system and to assess social vulnerability at different points in time. It may also serve as a decision-making system to define intervention priorities aiming at enhancing a society’s response capacity.
Furthermore, the SVA methodology may be a useful tool both in the planning and in the implementation of lifesaving and rescue activities and civil protection, as well as a basis for the integration of these challenges in urban and regional planning and the definition of economic and social policies.
In addition, SVA can play a role in helping humanitarian organizations that work on population support before, during, and after a catastrophic event, and for those that focus on development workers.
However, the application of the proposed methodology in SD has some limitations.
The first limitation is related to the availability of data, a factor that inevitably influences the variable selection process and the overall structure of the model. The indicators have been implemented in order to guarantee comparability among all the city’s neighborhoods. For this reason, missing data and data that did not cover the entire the city has been discarded.
As the methodology was intended to be a decision-making tool to be used by local stakeholders, the variables that concurred to the elaboration of the SVI were not weighed.
The identified and developed path within the experimentation of the cooperation project in the Dominican Republic provides some positive indications from which the following research activities may be carried out.
Future developments of the research should aim at evaluating the spatial relationship between social vulnerability and different Dominican environmental hazards through a GIS-based approach. In particular, since the areas with a high SVI are placed near the river, it might be interesting to overlap the SVM with a flood map.
Furthermore, the future developments of the methodology are related to the SVA applicability to the other municipalities of the Gran Santo Domingo, and subsequently to other DR cities.
Also, the project seeks to better understand how to transform the information provided by the SVA in a set of measures and recommendations for the preparedness and responding ability that are needed to selectively tackle vulnerability in areas with a high SVI. Defining the risk values at neighborhood and circumscription levels will allow the creation of a planning and first response system. This might be done by adopting strategies that instruct the population on how to behave in emergency situations and inform them about how it can, both individually and collectively, organize itself preemptively to reduce the risk that disasters pose to individuals, families, and communities [69].
Acknowledgments
The study has been developed starting from the results of the research project of the interdisciplinary working group of CNR IRISS (National Research Council, Institute for Research on Innovation and Services for Development) (coordinated by Massimo Clemente in the first phase and Marina Rigillo in the second phase) for the “Estudio de la Amenaza Sísmica y Vulnerabilidad Física del Gran Santo Domingo”, implemented in the framework of the initiatives of the UNDP (United Nations Development Programme) with the Instituto Geológico y Minero de España (IGME), Bureau de Recherches Géologiques et Minières (BRGM) and Servicio Geológico Nacional (SGN). The authors would like to thank Alfonso Morvillo and Massimo Clemente from the CNR IRISS, and Maria Cerreta and Giuliano Poli, from the University of Studies of Naples Federico II Department of Architecture, for their helpful suggestions.
Authors Contributions
The authors jointly conceived and developed the methodological process, decided on the overall objective and structure of the article and elaborated the analysis. Both authors contributed to the writing of the paper: Eleonora Giovene di Girasole wrote Section 1 and Section 2.2 and the introduction of Section 2; Daniele Cannatella wrote Section 2.1, Section 2.3 and Section 3. The authors wrote Section 4 in cooperation, and have read and approved the final version of the article.
Conflicts of Interest
The authors declare no conflict of interest.
References
- Burton, C.G.; Khazai, B.; Silva, V. Social Vulnerability and Integrated Risk Assessment within the Global Earthquake Model. In Proceedings of the 10th National Conference in Earthquake Engineering, Anchorage, AK, USA, 21–25 July 2014; Earthquake Engineering Research Institute: Anchorage, AK, USA, 2014. [Google Scholar]
- UNISDR. Terminology on Disaster Risk Reduction, Geneva. 2009. Available online: http://www.unisdr.org/we/inform/terminology (accessed on 6 June 2017).
- Cutter, S.L.; Mitchell, J.T.; Scott, M.S. Revealing the Vulnerability of People and Places: A Case Study of Georgetown County, South Carolina. Ann. Assoc. Am. Geogr. 2000, 90, 713–737. Available online: http://www.geo.mtu.edu/volcanoes/06upgrade/Social-KateG/Attachments%20Used/SpatialDimensionVulnerability.pdf (accessed on 10 July 2017). [CrossRef]
- UNISDR. Hyogo Framework for Action 2005–2015: Building the Resilience of Nations and Communities to Disasters, Geneva. 2007. Available online: https://www.unisdr.org/we/inform/publications/1037 (accessed on 10 July 2017).
- Levin, S.A. Ecosystems and the biosphere as complex adaptive systems. Ecosystems 1998, 1, 431–436. [Google Scholar] [CrossRef]
- Burton, I.; Kates, R.W.; White, G.F. The Environment as Hazard, 2nd ed.; Guildford: New York, NY, USA, 1993. [Google Scholar]
- Anderson, M.B. Vulnerability to Disaster and Sustainable Development: A General Framework for Assessing Vulnerability. In Disaster Prevention for Sustainable Developmen: Economic and Policy Issue; Munasinghe, M., Clarke, C., Eds.; The International Decade for Natural Disaster Reduction (IDNDR) and The World Bank: Washington, DC, USA, 1995; pp. 41–60. [Google Scholar]
- Blaikie, P.; Cannon, T.; Davis, I.; Wisner, B. At Risk: Natural Hazards, People’s Vulnerability, and Disasters, 2nd ed.; Routledge: London, UK, 1994. [Google Scholar]
- Hewitt, K. Excluded perspectives in the social construction of disaster. Int. J. Mass Emerg. Disasters 1995, 13, 317–339. [Google Scholar]
- Kasperson, J.X.; Kasperson, R.E.; Turner, B.L. (Eds.) Regions at Risk: Comparisons of Threatened Environments; United Nations University Press: Tokyo, Japan, 1995. [Google Scholar]
- Nemec, J.M.; Nigg, F.S.; Siccardi, F. (Eds.) Prediction and Perception of Natural Hazards; Springer: Berlin, Germany, 1993. [Google Scholar]
- Hewitt, K. The idea of calamity in a technocratic age. In Interpretations of Calamity from the Viewpoint of Human Ecology; Hewitt, K., Ed.; Allen & Unwin: London, UK, 1983; pp. 3–32. [Google Scholar]
- Kreps, G.A. Disaster as systemic event and social catalyst: A clarification of subject matter. Int. J. Mass Emerg. Disasters 1995, 13, 255–284. [Google Scholar]
- Smith, K. Environmental Hazards: Assessing Risk and Reducing Disaster, 6th ed.; Routledge: London, UK, 2013. [Google Scholar]
- Protezione Civile. Vulnerabilità alle Calamità Naturali e Mitigazione del Rischio: Le Lezioni del Passato e la via del Futuro. 2008. Available online: http://protezione-civile-italia.blogspot.it/2008/04/vulnerabilit-alle-calamit-naturali-e.html (accessed on 10 July 2017).
- Aroca-Jimenez, E.; Bodoque, J.M.; Garcia, J.A.; Diez-Herrero, A. Construction of an integrated social vulnerability index in urban areas prone to flash flooding. Nat. Hazards Earth Syst. Sci. 2017, 17, 1541–1557. [Google Scholar] [CrossRef]
- Frigerio, I.; Ventura, S.; Strigaro, D.; Mattavelli, M.; De Amicis, M.; Mugnano, S.; Boffi, M. A GIS-based approach to identify the spatial variability of social vulnerability to seismic hazard in Italy. Appl. Geogr. 2016, 74, 12–22. [Google Scholar] [CrossRef]
- Carnelli, F.; Frigerio, I. A socio-spatial vulnerability assessment for disaster management: Insights from the 2012 Emilia earthquake (Italy). Sociol. Urbana Rural. 2016, 111, 22–44. [Google Scholar] [CrossRef]
- Welle, T.; Birkmann, J. The World Risk Index—An Approach to Assess Risk and Vulnerability on a Global Scale. 2015. Available online: https://doi.org/10.1142/S2345737615500037 (accessed on 7 October 2017).
- Nelson, K.S.; Abkowitz, M.D.; Camp, J.V. A method for creating high resolution maps of social vulnerability in the context of environmental hazards. Appl. Geogr. 2015, 63, 89–100. [Google Scholar] [CrossRef]
- Birkmann, J.; Cardona, O.D.; Carreno, M.L.; Barbat, A.H.; Pelling, M.; Schneiderbauer, S.; Kienberger, S.; Keiler, M.; Alexander, D.; Zeil, P.; et al. Framing vulnerability, risk and societal responses: The MOVE framework. Nat. Hazards 2013, 67, 193–211. [Google Scholar] [CrossRef]
- The H. John Heinz III Center for Science, Economics and the Environment. The Hidden Costs of Coastal Hazards: Implications for Risk Assessment and Mitigation; Island Press: Washington, DC, USA, 2000. [Google Scholar]
- Cutter, S.L.; Finch, C. Temporal and spatial changes in social vulnerability to natural hazards. Proc. Natl. Acad. Sci. USA 2008, 105, 2301–2306. [Google Scholar] [CrossRef] [PubMed]
- Warner, K. Perspectives on social vulnerability: Introduction. In Perspectives on Social Vulnerability; Warner, K., Ed.; Selected Papers from the First Summer Academy on Social Vulnerability; UNU-EHS: Bonn, Germany, 2006. [Google Scholar]
- National Research Council. Facing Hazards and Disasters: Understanding Human Dimensions. Committee on Disaster Research in the Social Sciences: Future Challenges and Opportunities; The National Academy Press: Washington, DC, USA, 2006. [Google Scholar]
- Toya, H.; Skidmore, M. Economic development and the impacts of natural disasters. Econ. Lett. 2007, 94, 20–25. [Google Scholar] [CrossRef]
- World Bank & United Nations. Natural Hazards, Unnatural Disasters: The Economics of Effective Prevention; The International Bank for Reconstruction and Development/The World Bank: Washington, DC, USA, 2010. [Google Scholar]
- Sanford, J.E. Developing Countries: Definitions, Concepts and Comparisons; Hardcover; Nova Science Publisher: Hauppauge, NY, USA, 2003. [Google Scholar]
- Corendea, C.; Warner, K.; Yuzva, K. Social Vulnerability and Adaptation in Fragile States. 2012. Available online: http://www.munichre-foundation.org/dms/MRS/Documents/InterSecTions2012_Corendea_FragileStates.pdf (accessed on 10 July 2017).
- Varley, A. Disasters, Development and Environment; Wiley: New York, NY, USA, 1993. [Google Scholar]
- Yucel, G.; Arun, G. Earthquake and Physical and Social Vulnerability Assessment for Settlements: Case Study Avcilar District; World Conference on Earthquake Engineering; WCEE: Lisbon, Portugal, 2012. [Google Scholar]
- Rahman, N.; Ansary, M.A.; Islam, I. GIS based mapping of vulnerability to earthquake and fire hazard in Dhaka city, Bangladesh. Int. J. Disaster Risk Reduct. 2015, 13, 291–300. [Google Scholar] [CrossRef]
- Martins, V.N.; e Silva, D.S.; Cabral, P. Social vulnerability assessment to seismic risk using multicriteria analysis: The case study of Vila Franca do Campo (São Miguel Island, Azores, Portugal). Nat. Hazards 2012, 62, 385–404. [Google Scholar] [CrossRef]
- Zhang, W.; Xu, X.; Chen, X. Social vulnerability assessment of earthquake disaster based on the catastrophe progression method: A Sichuan Province case study. Int. J. Disaster Risk Reduct. 2017, 24, 361–372. [Google Scholar] [CrossRef]
- Dunning, C.M.; Durden, S. Social Vulnerability Analysis Methods for Corps Planning; Report 2011-R-07; U.S. Army Corps of Engineers, Institute for Water Resources: Alexandria, VA, USA, 2011.
- Cutter, S.L.; Boruff, B.J.; Shirley, W.L. Social vulnerability to environmental hazards. Soc. Sci. Q. 2003, 84, 242–261. [Google Scholar] [CrossRef]
- Tierney, K.J.; Lindell, M.K.; Perry, R.W. Facing the Unexpected: Disaster Preparedness and Response; Joseph Henry Press: Washington, DC, USA, 2001. [Google Scholar]
- Putnam, R.D. Bowling Alone: Colapse and Revival of the American Community; Simon & Schuster: New York, NY, USA, 2000. [Google Scholar]
- Cutter, S.L.; Morath, D.P. The evolution of the Social Vulnerability Index. In Measuring Vulnerability to Natural Hazards, 2nd ed.; Birkmann, J., Ed.; United Nations University Press: Bonn, Germany, 2013; pp. 304–321. [Google Scholar]
- The Carribean Development Portal. Available online: http://caribbean.cepal.org/t/developing-countries (accessed on 7 October 2017).
- UNDP. Human Development Report 2013; United Nations Development Programme: New York, NY, USA, 2013. [Google Scholar]
- IMUNA. Available online: http://www.imuna.org/resources/country-profiles/dominican-republic (accessed on 7 October 2017).
- United States Agency for International Development. Dominican Republic Country Development Cooperation Strategy. FY 2014–2018. 2013. Available online: https://www.unpei.org/sites/default/files/e_library_documents/Dominican-Republic%20Country%20Development%20Cooperation%20Strategy_FY14_FY18.pdf (accessed on 7 October 2017).
- UNU HES. World Risk Report, 2016. Available online: http://weltrisikobericht.de/wp-content/uploads/2016/08/WorldRiskReport2016.pdf (accessed on 6 June 2017).
- The World Bank, Dominican Republic. Available online: http://www.worldbank.org/en/country/dominicanrepublic/overview#1 (accessed on 6 June 2017).
- Estudio de la Amenaza Sísmica y Vulnerabilidad Física del Gran Santo Domingo. Available online: http://www.do.undp.org/content/dominican_republic/es/home/operations/projects/crisis_prevention_and_recovery/estudio-de-la-amenaza-sismica-y-vulnerabilidad-fisica-del-gran-s.html (accessed on 10 July 2017).
- Rigillo, M.; Cervelli, E. Mapping Urban Vulnerability: The Case Study of Gran Santo Domingo, Dominican Republic. Adv. Eng. Forum 2014, 11, 142–148. [Google Scholar] [CrossRef]
- Cutter, S.L. (Ed.) American Hazardscapes: The Regionalization of Hazards and Disasters; Joseph Henry Press: Washington, DC, USA, 2001. [Google Scholar]
- Huang, J.; Su, F.; Zhang, P. Measuring Social Vulnerability to Natural Hazards in Beijing-Tianjin Hebei Region, China. Chin. Geogr. Sci. 2015, 25, 472–485. [Google Scholar] [CrossRef]
- Frigerio, I.; De Amicis, M. Mapping social vulnerability to natural hazards in Italy: A suitable tool for risk mitigation strategies. Environ. Sci. Policy 2016, 63, 187–196. [Google Scholar] [CrossRef]
- Solangaarachchi, D.; Griffin, A.L.; Doherty, M.D. Social vulnerability in the context of bushfire risk at the urban-bush interface in Sydney: A case study of the Blue Mountains and Ku-ring-gai local council areas. Nat. Hazards 2012, 64, 1873–1898. [Google Scholar] [CrossRef]
- Prior, T.; Roth, F.; Maduz, L.; Scafetti, F. Mapping Social Vulnerability in Switzerland; ETH: Zurich, Switzerland, 2017. [Google Scholar]
- Chen, W.; Cutter, S.L.; Emrich, C.T.; Shi, P. Measuring social vulnerability to natural hazards in the Yangtze River Delta region, China. Int. J. Disaster Risk Sci. 2013, 4, 169–181. [Google Scholar] [CrossRef]
- De Loyola Hummell, B.M.; Cutter, S.L.; Emrich, C.T. Social vulnerability to natural hazards in Brazil. Int. J. Disaster Risk Sci. 2016, 7, 111–122. [Google Scholar] [CrossRef]
- Guillard-Gonçalves, C.; Cutter, S.L.; Emrich, C.T.; Zêzere, J.L. Application of Social Vulnerability Index (SoVI) and delineation of natural risk zones in Greater Lisbon, Portugal. J. Risk Res. 2015, 18, 651–674. [Google Scholar] [CrossRef]
- Oficina Nacional de Estadistica (ONE). Available online: http://www.one.gov.do/ (accessed on 10 July 2017).
- Mann, P.; Calais, E.; Huerfano, V. Earthquake shakes “Big Bend” Region of North America-Caribbean Boundary Zone. Eos Trans. Am. Geophys. Union 2004, 85, 77–83. [Google Scholar] [CrossRef]
- Ten Brink, U.S.; Bakun, W.H.; Flores, C.H. Historical perspective on seismic hazard to Hispaniola and the northeast Caribbean region. J. Geophys. Res. 2011, 116. [Google Scholar] [CrossRef]
- Mann, P. Global catalogue, classification and tectonic origins of restraining- and releasing bends on active and ancient strike-slip fault systems. In Tectonics of Strike-Slip Restraining and Releasing Bends; Cunningham, W.D., Mann, P., Eds.; The Geological Society: London, UK, 2007; pp. 13–142. [Google Scholar]
- Oficina Nacional De Estadistica (ONE). IX Censo de Población y Vivienda 2010—República Dominicana Sobre población. Available online: http://redatam.one.gob.do/cgibin/RpWebEngine.exe/PortalAction?&MODE=MAIN&BASE=CPV2010&MAIN=WebServerMain.inl (accessed on 10 July 2017).
- Saaty, T.L. Decision Making for Leaders: The Analytic Hierarchy Process for Decisions in a Complex World, 3rd ed.; RWS Publications: Pittsburgh, PA, USA, 2012. [Google Scholar]
- Saaty, T.L.; Vargas, L.G. Models, Methods, Concepts and Applications of the Analytic Hierarchy Process; Springer: New York, NY, USA, 2001. [Google Scholar]
- Saaty, T.L. The Analytical Hierarchy Process; McGraw Hill: New York, NY, USA, 1980. [Google Scholar]
- Cerreta, M.; De Toro, P. Integrated spatial assessment for a creative decision-making process: A combined methodological approach to strategic environmental assessment. Int. J. Sustain. Dev. 2010, 13, 17–30. [Google Scholar] [CrossRef]
- Malczewski, J. GIS and Multicriteria Decision Analysis; John Wiley & Sons Inc.: New York, NY, USA, 1999. [Google Scholar]
- Malczewski, J. GIS-based multicriteria decision analysis: A survey of the literature. Int. J. Geogr. Inf. Sci. 2006, 7, 703–726. [Google Scholar] [CrossRef]
- Campagna, M. (Ed.) GIS for Sustainable Development; Taylor & Francis Group, CRC Press: Boca Raton, FL, USA, 2006. [Google Scholar]
- Cerreta, M.; De Toro, P. Integrated spatial assessment (ISA): A multi-methodological approach for planning choices. In Advances in Spatial Planning; Burian, J., Ed.; InTech: Rijeka, Croatia, 2012; pp. 78–108. [Google Scholar]
- UNISDR. Disaster Risk Reduction Tools and Methods for Climate Change Adaptation. 2004. Available online: http://www.unisdr.org/files/5654_DRRtoolsCCAUNFCC.pdf (accessed on 10 July 2017).
- Breton, M. Neighborhood resiliency. J. Community Pract. 2001, 9, 21–36. [Google Scholar] [CrossRef]
- Putnam, R.D. Making Democracy Work. Civic Tradition in Modern Italy; Princeton University Press: Princeton, NJ, USA, 1993. [Google Scholar]
Figure 1.
The methodology adopted for the SVA in DR.
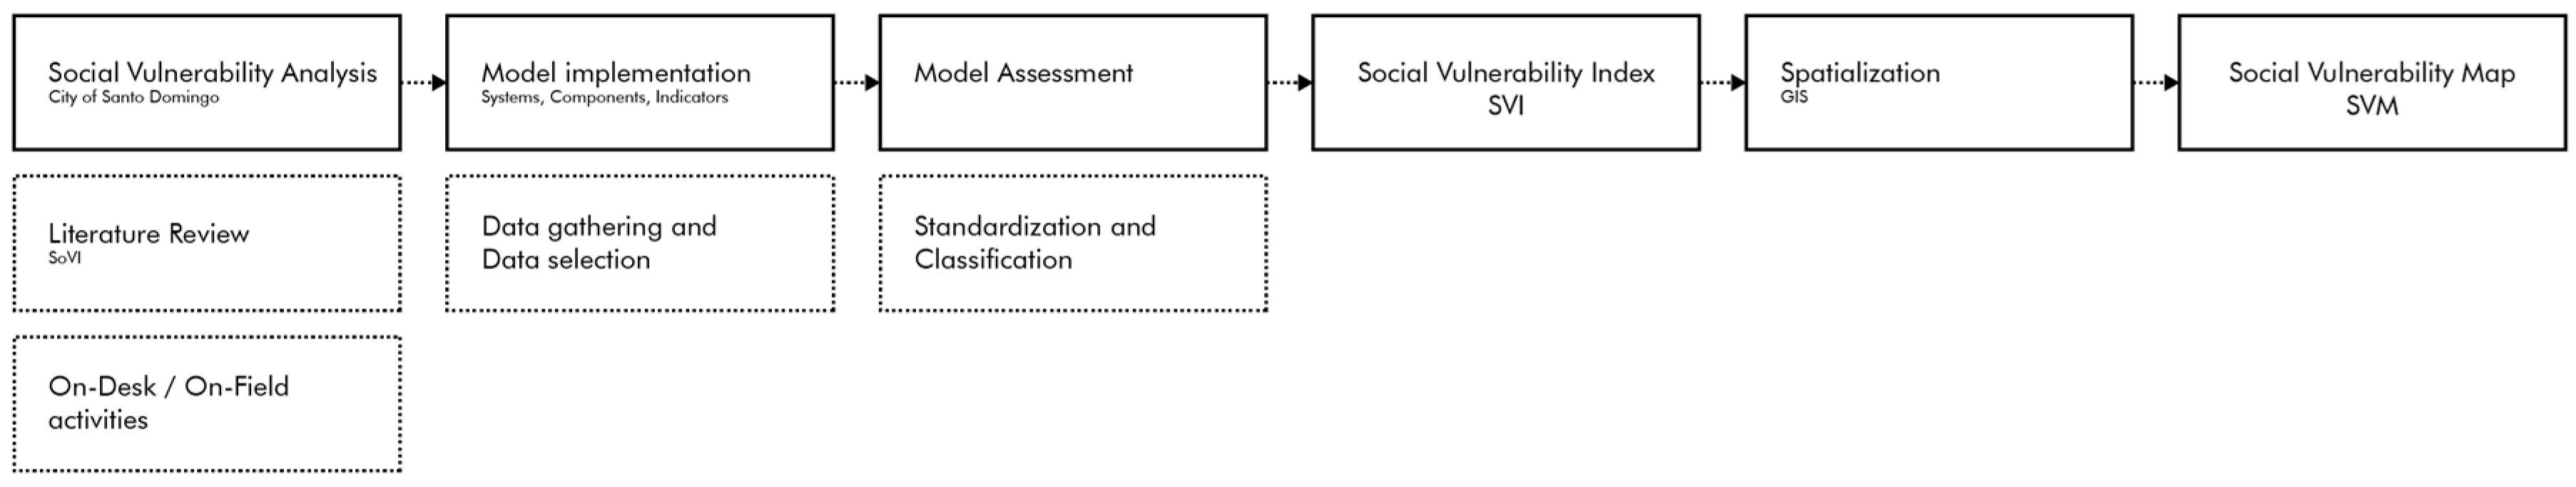
Figure 2.
Major earthquakes in the surroundings of the island of Hispaniola. Image elaborated by the authors from the source: https://earthquaketrack.com (accessed on 10 October 2017).
Figure 2.
Major earthquakes in the surroundings of the island of Hispaniola. Image elaborated by the authors from the source: https://earthquaketrack.com (accessed on 10 October 2017).
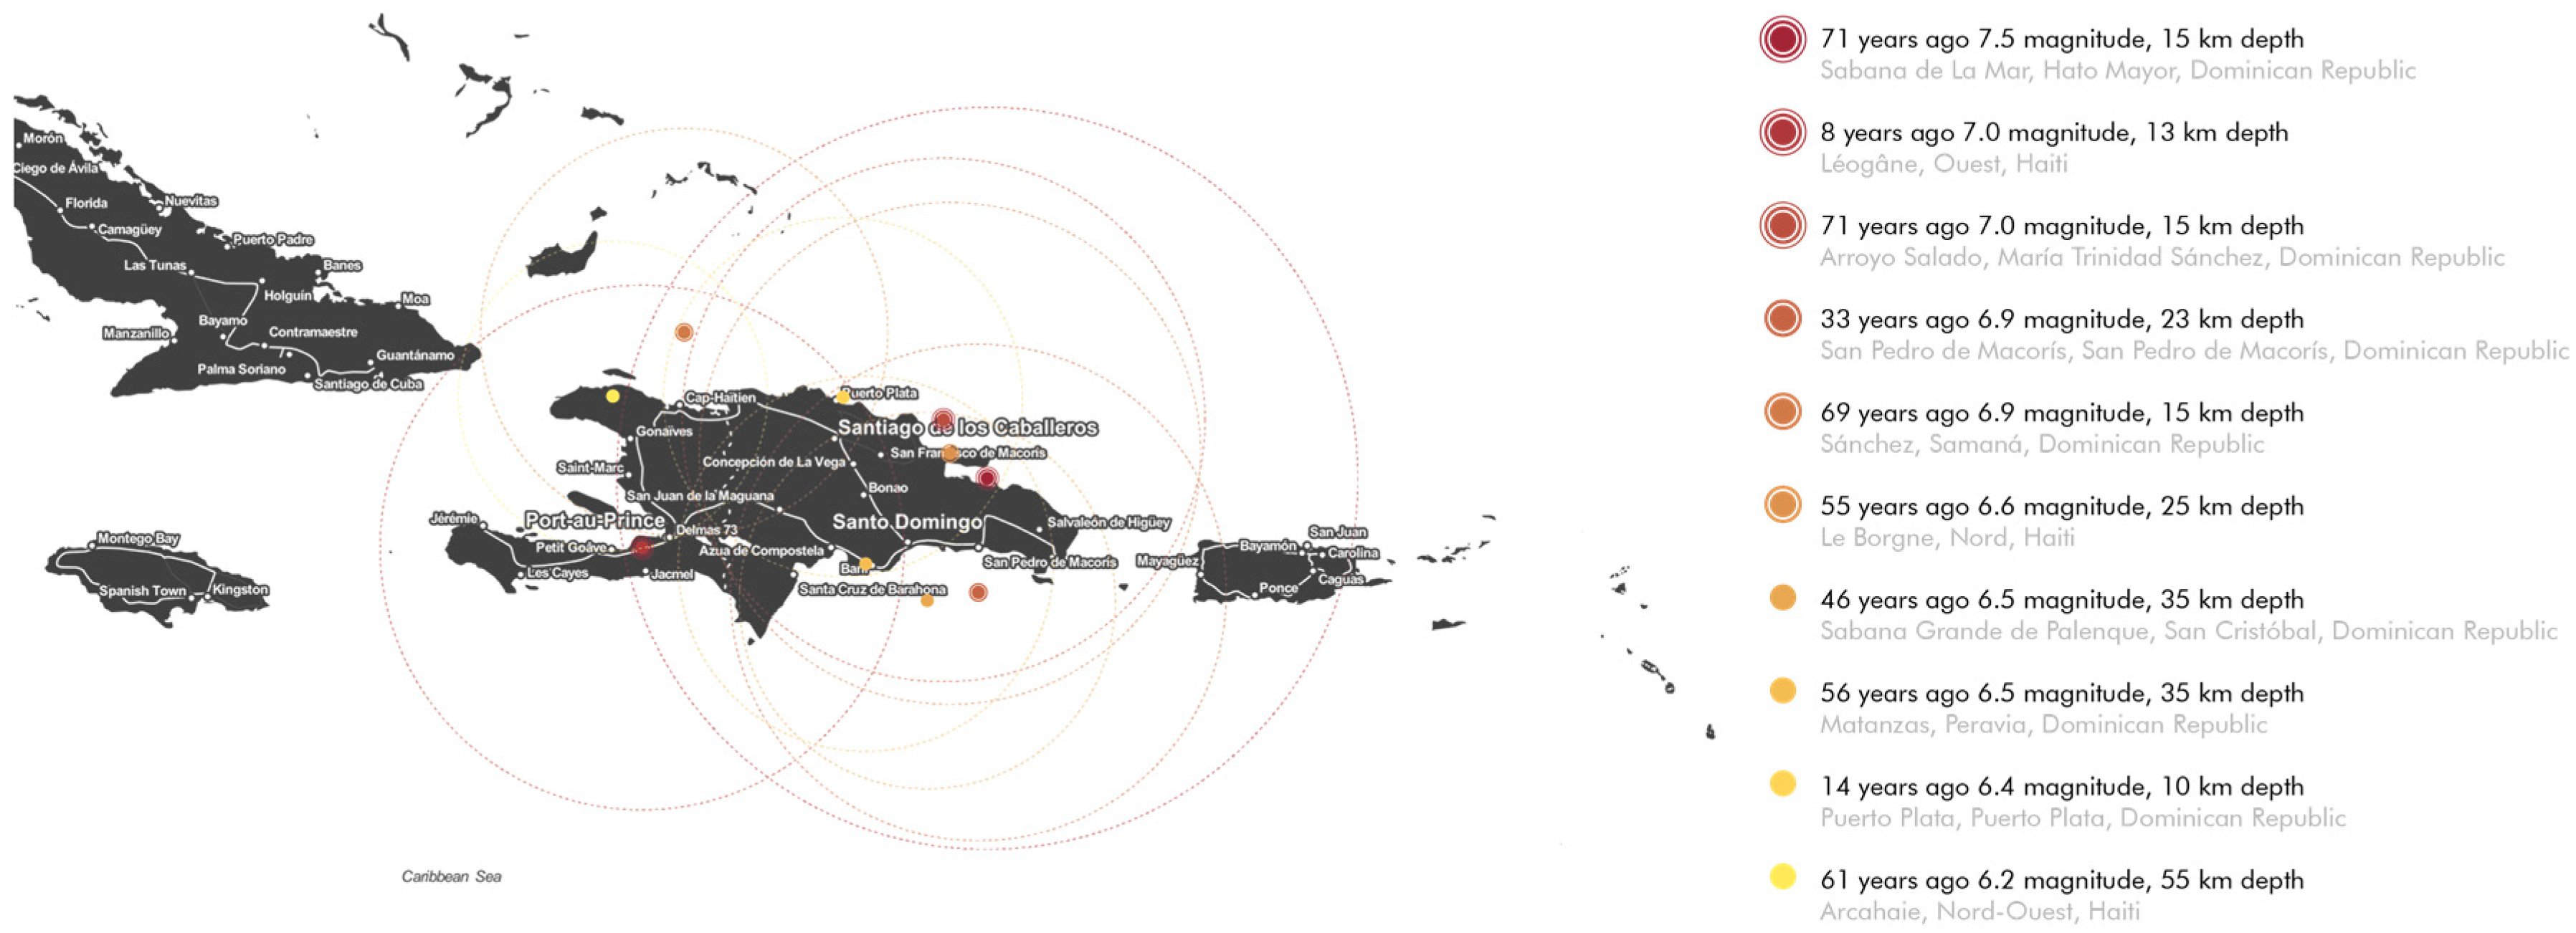
Figure 3.
The administrative boundaries of the city of Santo Domingo.

Figure 4.
The hierarchical structure of the model proposed for the elaboration of SVI. The three-level structure distinguishes between systems, components and indicators.
Figure 4.
The hierarchical structure of the model proposed for the elaboration of SVI. The three-level structure distinguishes between systems, components and indicators.
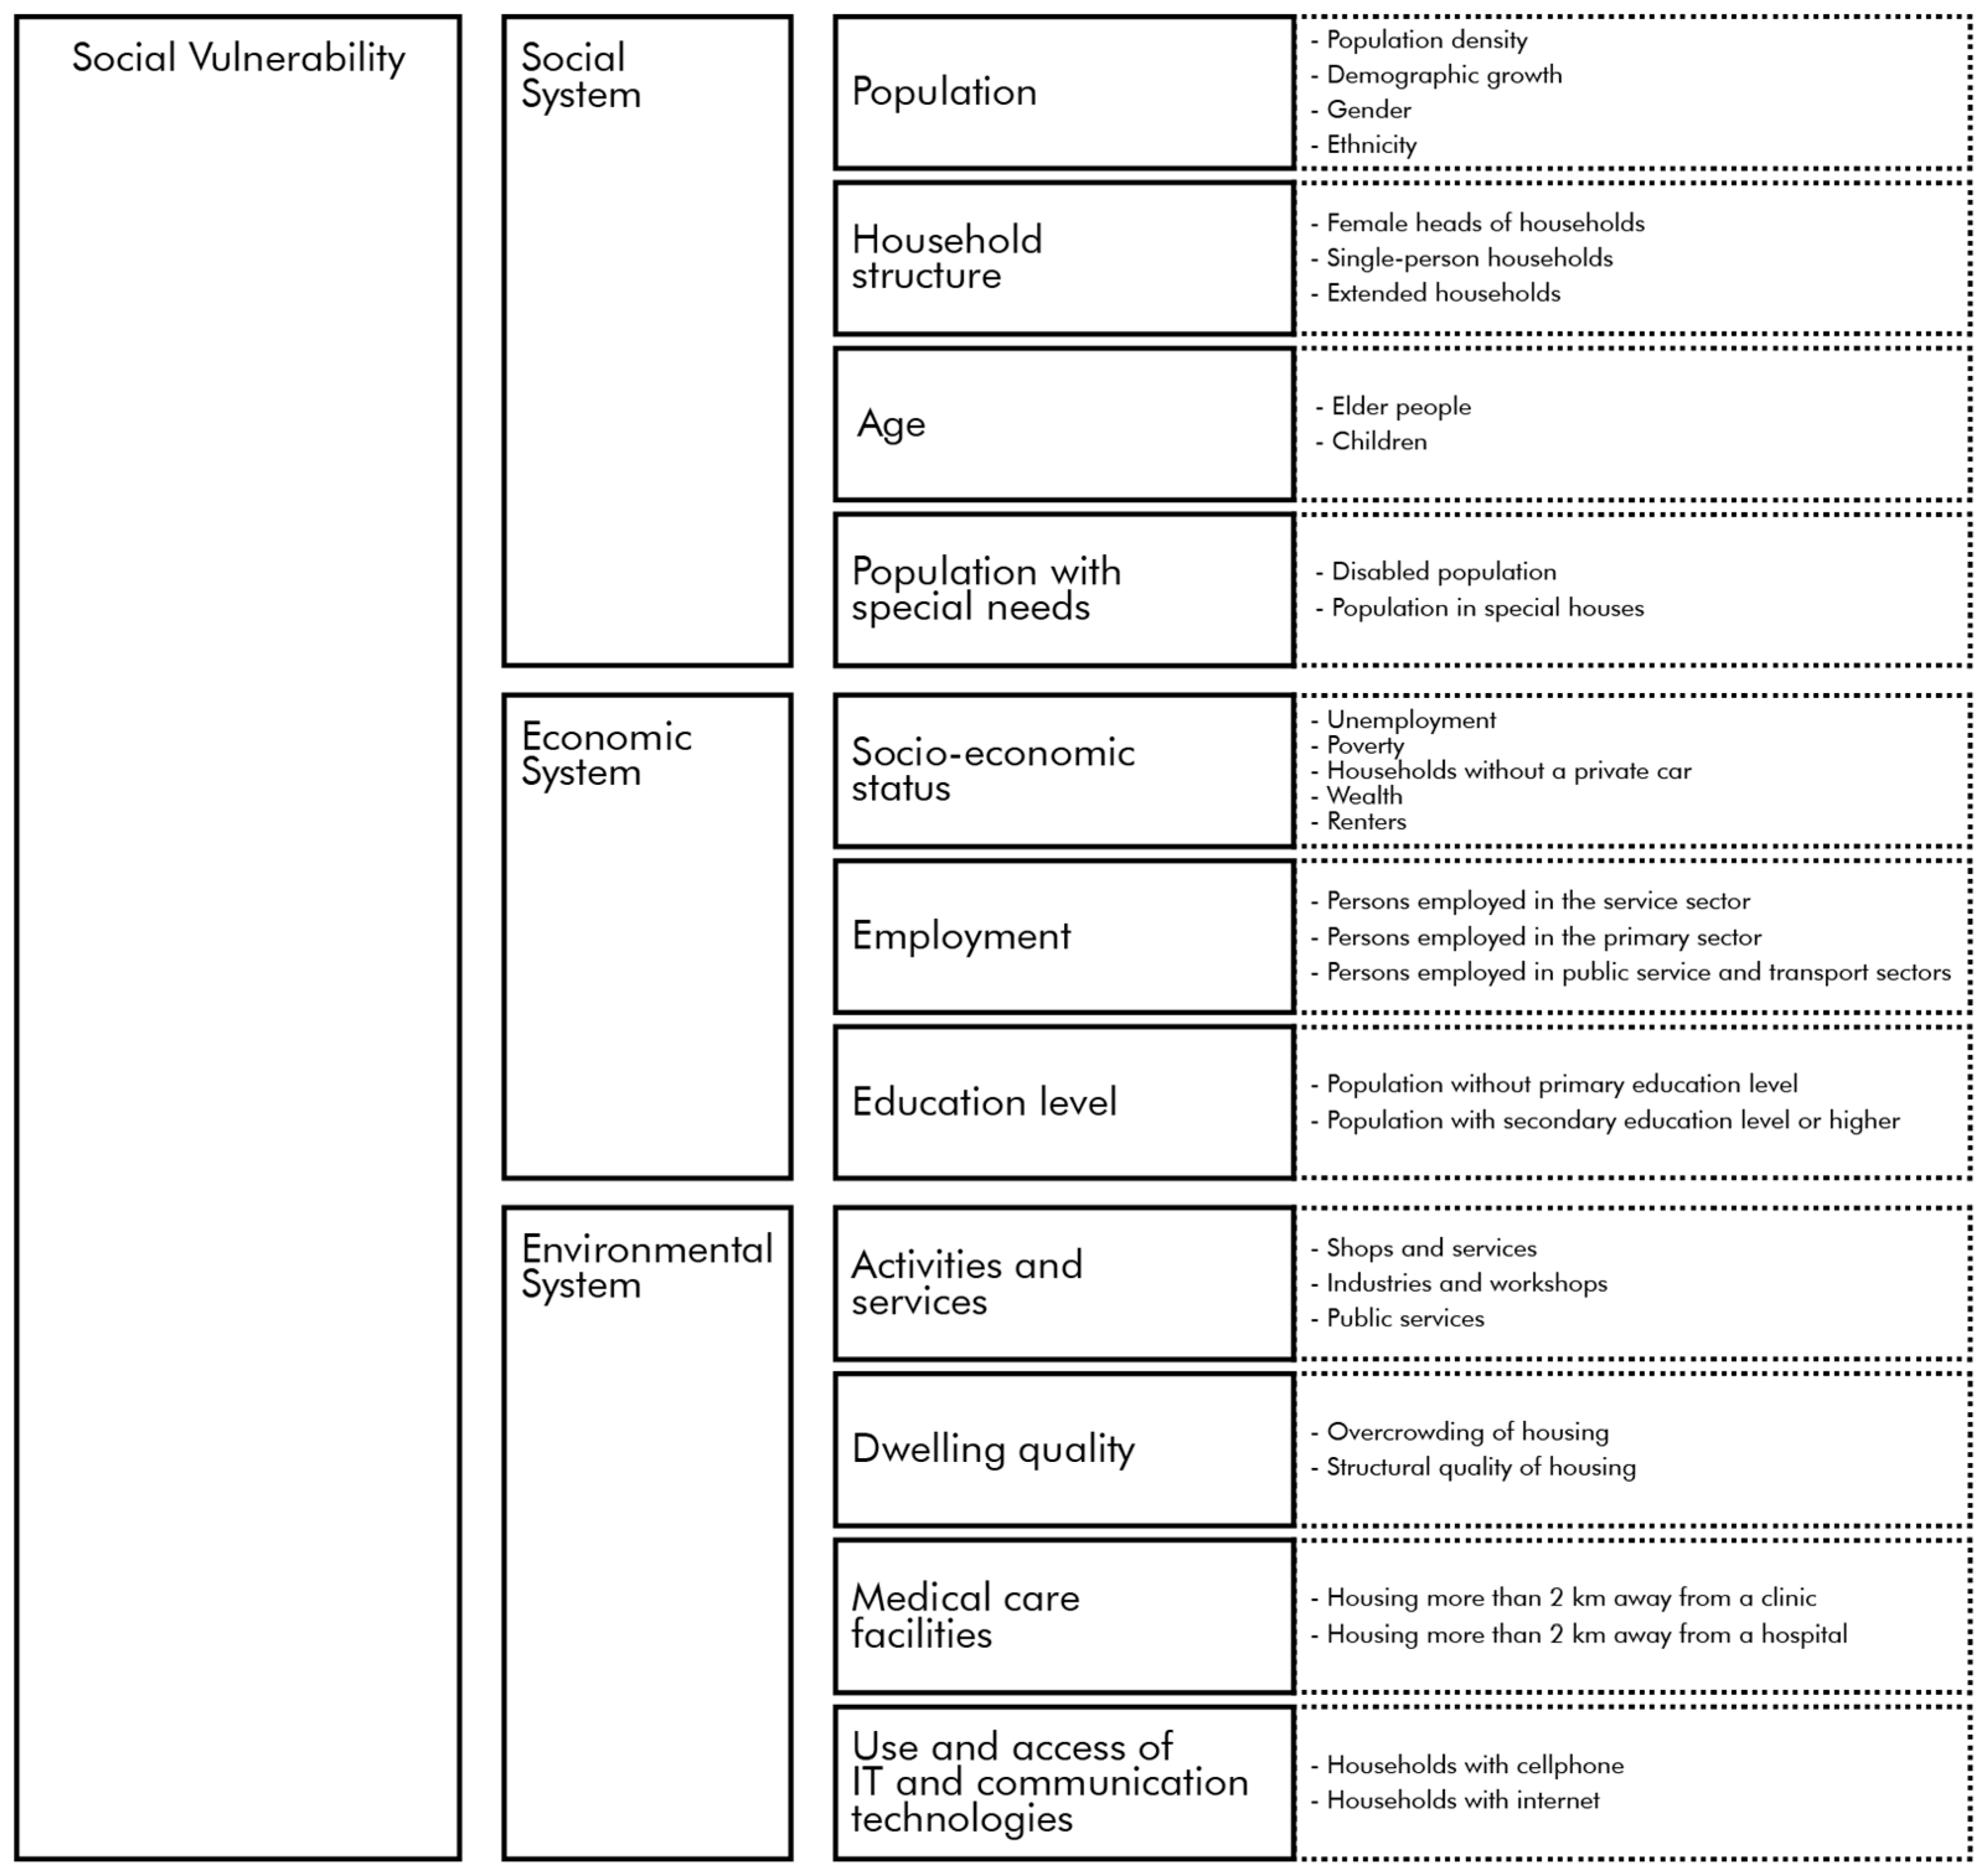
Figure 5.
The number of neighborhoods for each vulnerability class.

Figure 6.
Social Vulnerability Map of the city of Santo Domingo.

Figure 7.
Average values of the indexes for the single most significant system affecting SVI in SD.


Table 1.
Data sheet, example of the characteristics of indicators.
| Population Density | |
|---|---|
| Description | The indicator shows the population density value (men and women) of resident in each neighborhood (population/hectare) in order to show its distribution in the different urban areas |
| Spatialization Criteria | The classification has been visualized using 5 dimensional classes, according to the Natural Breaks (Jeanks) function |
| Data Source | ONE, IX Censo de Población y Vivienda 2010—Dominican Republic (Processed by Redatam+SP CEPAL/CELADE). Overpopulation [60]. Map database: ONE, shape file: Barrios, Vias, Province |
| Coord. System | WGS84_UTM_Zone 19 |
| Evaluation Direction | + |
| Normalization | In order to allow the comparison between non-homogeneous data at subsequent stages, data have been converted to a values scale between 0 and 1. Higher values of the indicator indicate higher values in standardized elaboration, according to a linear function/benefit |
Table 2.
Break values of the SVI.
| Classes | Min Value | Max Value |
|---|---|---|
| <−1 × Std. Dv. | 0 | 0.33 |
| −1 × Std. Dv.; −0.5 × Std. Dv. | 0.33 | 0.37 |
| −0.5 × Std. Dv.; 0.5 × Std. Dv. | 0.37 | 0.46 |
| 0.5 ×Std. Dv.; 1 × Std. Dv. | 0.46 | 0.50 |
| >1 × Std. Dv. | 0.50 | 1 |
© 2017 by the authors. Licensee MDPI, Basel, Switzerland. This article is an open access article distributed under the terms and conditions of the Creative Commons Attribution (CC BY) license (http://creativecommons.org/licenses/by/4.0/).
Share and Cite
MDPI and ACS Style
Giovene di Girasole, E.; Cannatella, D. Social Vulnerability to Natural Hazards in Urban Systems. An Application in Santo Domingo (Dominican Republic). Sustainability 2017, 9, 2043. https://doi.org/10.3390/su9112043
AMA Style
Giovene di Girasole E, Cannatella D. Social Vulnerability to Natural Hazards in Urban Systems. An Application in Santo Domingo (Dominican Republic). Sustainability. 2017; 9(11):2043. https://doi.org/10.3390/su9112043
Chicago/Turabian StyleGiovene di Girasole, Eleonora, and Daniele Cannatella. 2017. "Social Vulnerability to Natural Hazards in Urban Systems. An Application in Santo Domingo (Dominican Republic)" Sustainability 9, no. 11: 2043. https://doi.org/10.3390/su9112043
Note that from the first issue of 2016, this journal uses article numbers instead of page numbers. See further details here.