A New Strategy for the Prevention and Control of Eupatorium adenophorum under Climate Change in China


1
Chinese Center for Strategic Research of Grassland Agriculture Development, State Key Laboratory of Grassland Agro-Ecosystems, Key Laboratory of Grassland Livestock Industry Innovation, College of Pastoral Agriculture Science and Technology, Lanzhou University, Lanzhou 730020, China
2
Institute of Plant Protection, Chinese Academy of Agricultural Sciences, Beijing 100193, China
3
National Institutes for Food and Drug Control, Beijing 100050, China
*
Author to whom correspondence should be addressed.
Sustainability 2017, 9(11), 2037; https://doi.org/10.3390/su9112037
Submission received: 14 September 2017
/
Revised: 21 October 2017
/
Accepted: 31 October 2017
/
Published: 7 November 2017
Abstract
:Eupatorium adenophorum has caused tremendous ecological and economic losses in China since the 1940s. Although a great deal of money has been expended on the prevention and control of the weed, the situation is still deteriorating. To identify its crucial environmental constraints, an ecological niche factor analysis was employed. The distribution of the weed was predicted by the maximum entropy model. The results indicate that the temperature in winter is more influential than that in other quarters of a year, and the maximum temperature in March restricts the spread of E. adenophorum most. Currently, the weed is mainly distributed in four provinces of southwest China. From the present to the 2080s, the center of L3, which has a potential distribution probability of 0.7 to 1.0, will move 53 km to the southwest. Accordingly, the area of L3 will expand by 16.04%. To prevent its further expansion, we suggest differentiating the prevention and control measures according to the potential distribution levels predicted. Meanwhile, the integration of various means of removal and comprehensive utilization of E. adenophorum is highly encouraged. Additionally, precautions should be taken in regions that have not yet, or have been only slightly, invaded by the E. adenophorum.
1. Introduction
Eupatorium adenophorum is an endemic plant species in Central America (mainly Mexico). It has invaded more than 30 countries, including India, Thailand, New Zealand, Australia, America and China [1,2]. In China, the total invaded area has exceeded 30 million hectares [3]. Since invading the Yunnan province in southwest China from Burma in the 1940s, E. adenophorum has spread rapidly to adjacent regions, and even to some distant regions (e.g., Taiwan). Yu et al. [4] reported that this exotic weed causes a drastic decline in the biomass of other plant species by changing the soil microbial community in the invaded sites. Additionally, the invasion of E. adenophorum to grassland has indirectly contributed to the decline in the numbers of grazing animals and indigenous plants, and has resulted in a loss of biodiversity [5,6,7]. Furthermore, E. adenophorum is noxious, and is known to cause acute asthma, diarrhea, depilation, and even death of livestock [7]. Thus, the economic losses to animal husbandry and grassland ecosystem services caused by the weed has been estimated at RMB 0.99 (US$0.15) billion and RMB 2.63 (US$0.40) billion per year, respectively [8]. Owing to the damages caused, E. adenophorum was ranked first on the list of the first batch of alien invasive species in China [9]. At present, the weed is spreading north and west to drier, colder, higher regions, and has adapted to lower soil pH [3,10]. Former studies have focused on the factors that influence the spread of E. adenophorum, including environmental factors (e.g., elevation, temperature, precipitation, illumination and soil pH) [3,5,10,11,12,13], biological factors (e.g., biomass of invaded areas, allelopathy, and competitive relationship) [4,5,7], genetic characteristics (e.g., rapid evolution and phenotypic plasticity) [8,14], and impact of human activities (e.g., land use patterns and road distribution) [3,5,7]. In regard to environmental factors, relatively high light intensity and high temperature in winter can contribute to the overwintering of E. adenophorum and help the weed to gain an advantage in competition with other species [15]. Besides, He et al. [16] reports that by increasing the growth and stress-tolerance of E. adenophorum, climate warming may enhance its invasions. Although various prevention and control measures have been applied and some measures indeed stop its invasion locally or temporarily, the invasion of the weed has not been effectively stopped in the whole China so far [17]. This can be attributed to inadequate understanding of its invasion mechanism and undifferentiated prevention and control measures regard to the extent of invasion. Furthermore, precautions cannot be taken without the prediction of the invasion by E. adenophorum. Therefore, in this study we proposed a new strategy for the prevention and control of E. adenophorum by grading its potential distribution probabilities and predicting the invasive route. The objectives are to (1) identify the crucial environment constraints for the spreading of E. adenophorum; (2) predict the distribution of E. adenophorum in China in response to climate change; and (3) predict the invasive routes from the present to the 2080s.
2. Materials and Methods
2.1. Species Records
A total of 106 occurrence records of E. adenophorum were collected (Figure 1). Eight of them were derived from the Global Biodiversity Information Facility (GBIF) [18], and the others were collected from the published literature [19,20,21,22,23,24,25,26,27,28,29]. Three-quarters of the records were randomly selected to compose the training set, while the rest of the records composed the test set. The selection of training and test records was processed in DIVA-GIS [30].
2.2. Environmental Input Variables
The present climate data set (1961–1990) and the future climate data set (2010–2099) were used in this study with a spatial resolution of 30 arc seconds (i.e., ~1 km). The future climate data set was generated by the third version of the Canadian Centre for Climate Modelling and Analysis (CCCma) Coupled Global Climate Model (CGCM3) [31] and projected to the A1b scenario. The detailed description of A1b scenario can be found in Jones et al. [32]. Both of the two climate data sets and the altitude information were derived from the WorldClim [33] and processed in ArcGIS [34]. A description of the environment variables is presented in Table 1.
2.3. Environment Variables Analysis and MaxEnt Modelling
Phillips et al. [35] proposed the maximum entropy (MaxEnt) on the basis of the maximum entropy principle theory. Put simply and in the context of the present study, MaxEnt allows the user to predict the distribution of a species in terms of probability of occurrence. This is done by finding the distribution that agrees with everything known about the distribution of the species (given the environmental variables that have been provided to the model), without making any assumptions about what is not known [36,37,38,39]. To reduce time consumption and remove redundant variables in MaxEnt, environment variables were selected, and the relationship between the distribution of E. adenophorum and eco-geographical variables (EGV) was analyzed; hence, the ecological niche factor analysis (ENFA) was employed. The principle of ENFA is to compare the distributions of EGV between the occurrence data set and the study area. Similar to Principal Component Analysis (PCA), ENFA summarizes many EGVs into a few uncorrelated factors, while retaining most of the information. In contrast to PCA, however, the factors have an ecological meaning [40]. In this study, 70 environment variables under the current scenario were processed by ENFA and implemented in the Biomapper [41]. Ten variables with higher values in first column of the score matrix (also called “the marginality factor”) of ENFA were selected as the environmental constraints in MaxEnt to predict the potential distribution of E. adenophorum. There are two means in MaxEnt to reflect the variables contribution to the prediction of occurrence of the weed, which are the relative contributions of the environmental variables to the MaxEnt model and the results of the jackknife test of variable importance. In this study, the crucial factors that influence the distribution of E. adenophorum were identified by the weighted average of the ranks of variables of score matrix in ENFA, the variable contribution analysis, and the result of the jackknife test in MaxEnt. In the prediction of the weed distribution by MaxEnt, the logistic output format was checked, the test data set was chosen in “test sample file” and 3 replicates were set. The prediction maps present the potential probability of distribution, ranging from 0 to 1, and the performance of prediction was assessed by the receiver operating characteristic curve (ROC) with the area under curve (AUC) value. The AUC value ranges from 0 to 1, where 0.5 represents a random prediction and a higher value indicates a more accurate prediction [42,43]. In order to distinguish the potential distribution regions in the prevention of E. adenophorum, the probability was divided into 4 levels (L0 to L3), with the probability of 0–0.3 (least potential), 0.3–0.5 (moderate potential), 0.5–0.7 (good potential), and 0.7–1.0 (high potential), respectively.
2.4. Depicting the Invasive Route of E. adenophorum
The invasive route is depicted by linking up centers of potential distribution probability levels from the present to the 2080s. The center of each level in each period is identified referred to the former approaches [44,45,46], and the center’s coordinate is formulated as
where t is the variable of time, representing a certain period; Ij(t) is the patch number of level j; sij(t) is the area of the ith patch of level j; Sj(t) is the total area of level j; (Xij(t), Yij(t)) is the longitude and latitude of the geometric center of the ith patch of level j; (xj(t), yj(t)) is the mean center of the level j. Shift distance and direction of level j from the period t to the period (t + 1) are formulated as
where Dj is the displacement distance of level j from the period t to the period (t + 1); θj is the displacement direction of level j, whose due east is 0°, due north is 90°, due west is 180° and due south is 270°; (xj(t), yj(t)) and (xj(t + 1), yj(t + 1)) are the coordinate of the mean center of level j in the periods t and (t + 1) respectively [45].
3. Results
3.1. Selection of Environment Variables
In the variable analysis of ENFA, the top 10 variables in the score matrix were selected (Table 2). They were all related to the temperature in winter, and Tmax2 had the highest score. While the relative contribution of each variable in MaxEnt, which refers to the “percent contribution” column in Table 2, showed the environmental variables used in the model and the percentage of their predictive contribution for each variable. The higher the contribution, the more impact that particular variable had on predicting the occurrence of that species. In this study, Tmax1 had the highest contribution. There are three jackknife analysis results generated by the model. The “jackknife” column refers to the results based on the training dataset. It shows the training gain of each variable if the model was run in isolation, and compares it to the training gain with all the variables. Through the jackknife analysis, users are able to identify which variables contribute the most, individually, and here Tmax3 had the most information. The weighted average of ENFA, percent contribution and jackknife analysis was calculated in the “Weighted average” column, and the “Rank” column is sorted from the lowest to the highest values of weighted average. The weighted average in Table 2 indicates that Tmax3 is the most influential factor for the distribution of E. adenophorum.
3.2. The Potential Distribution of E. adenophorum in China
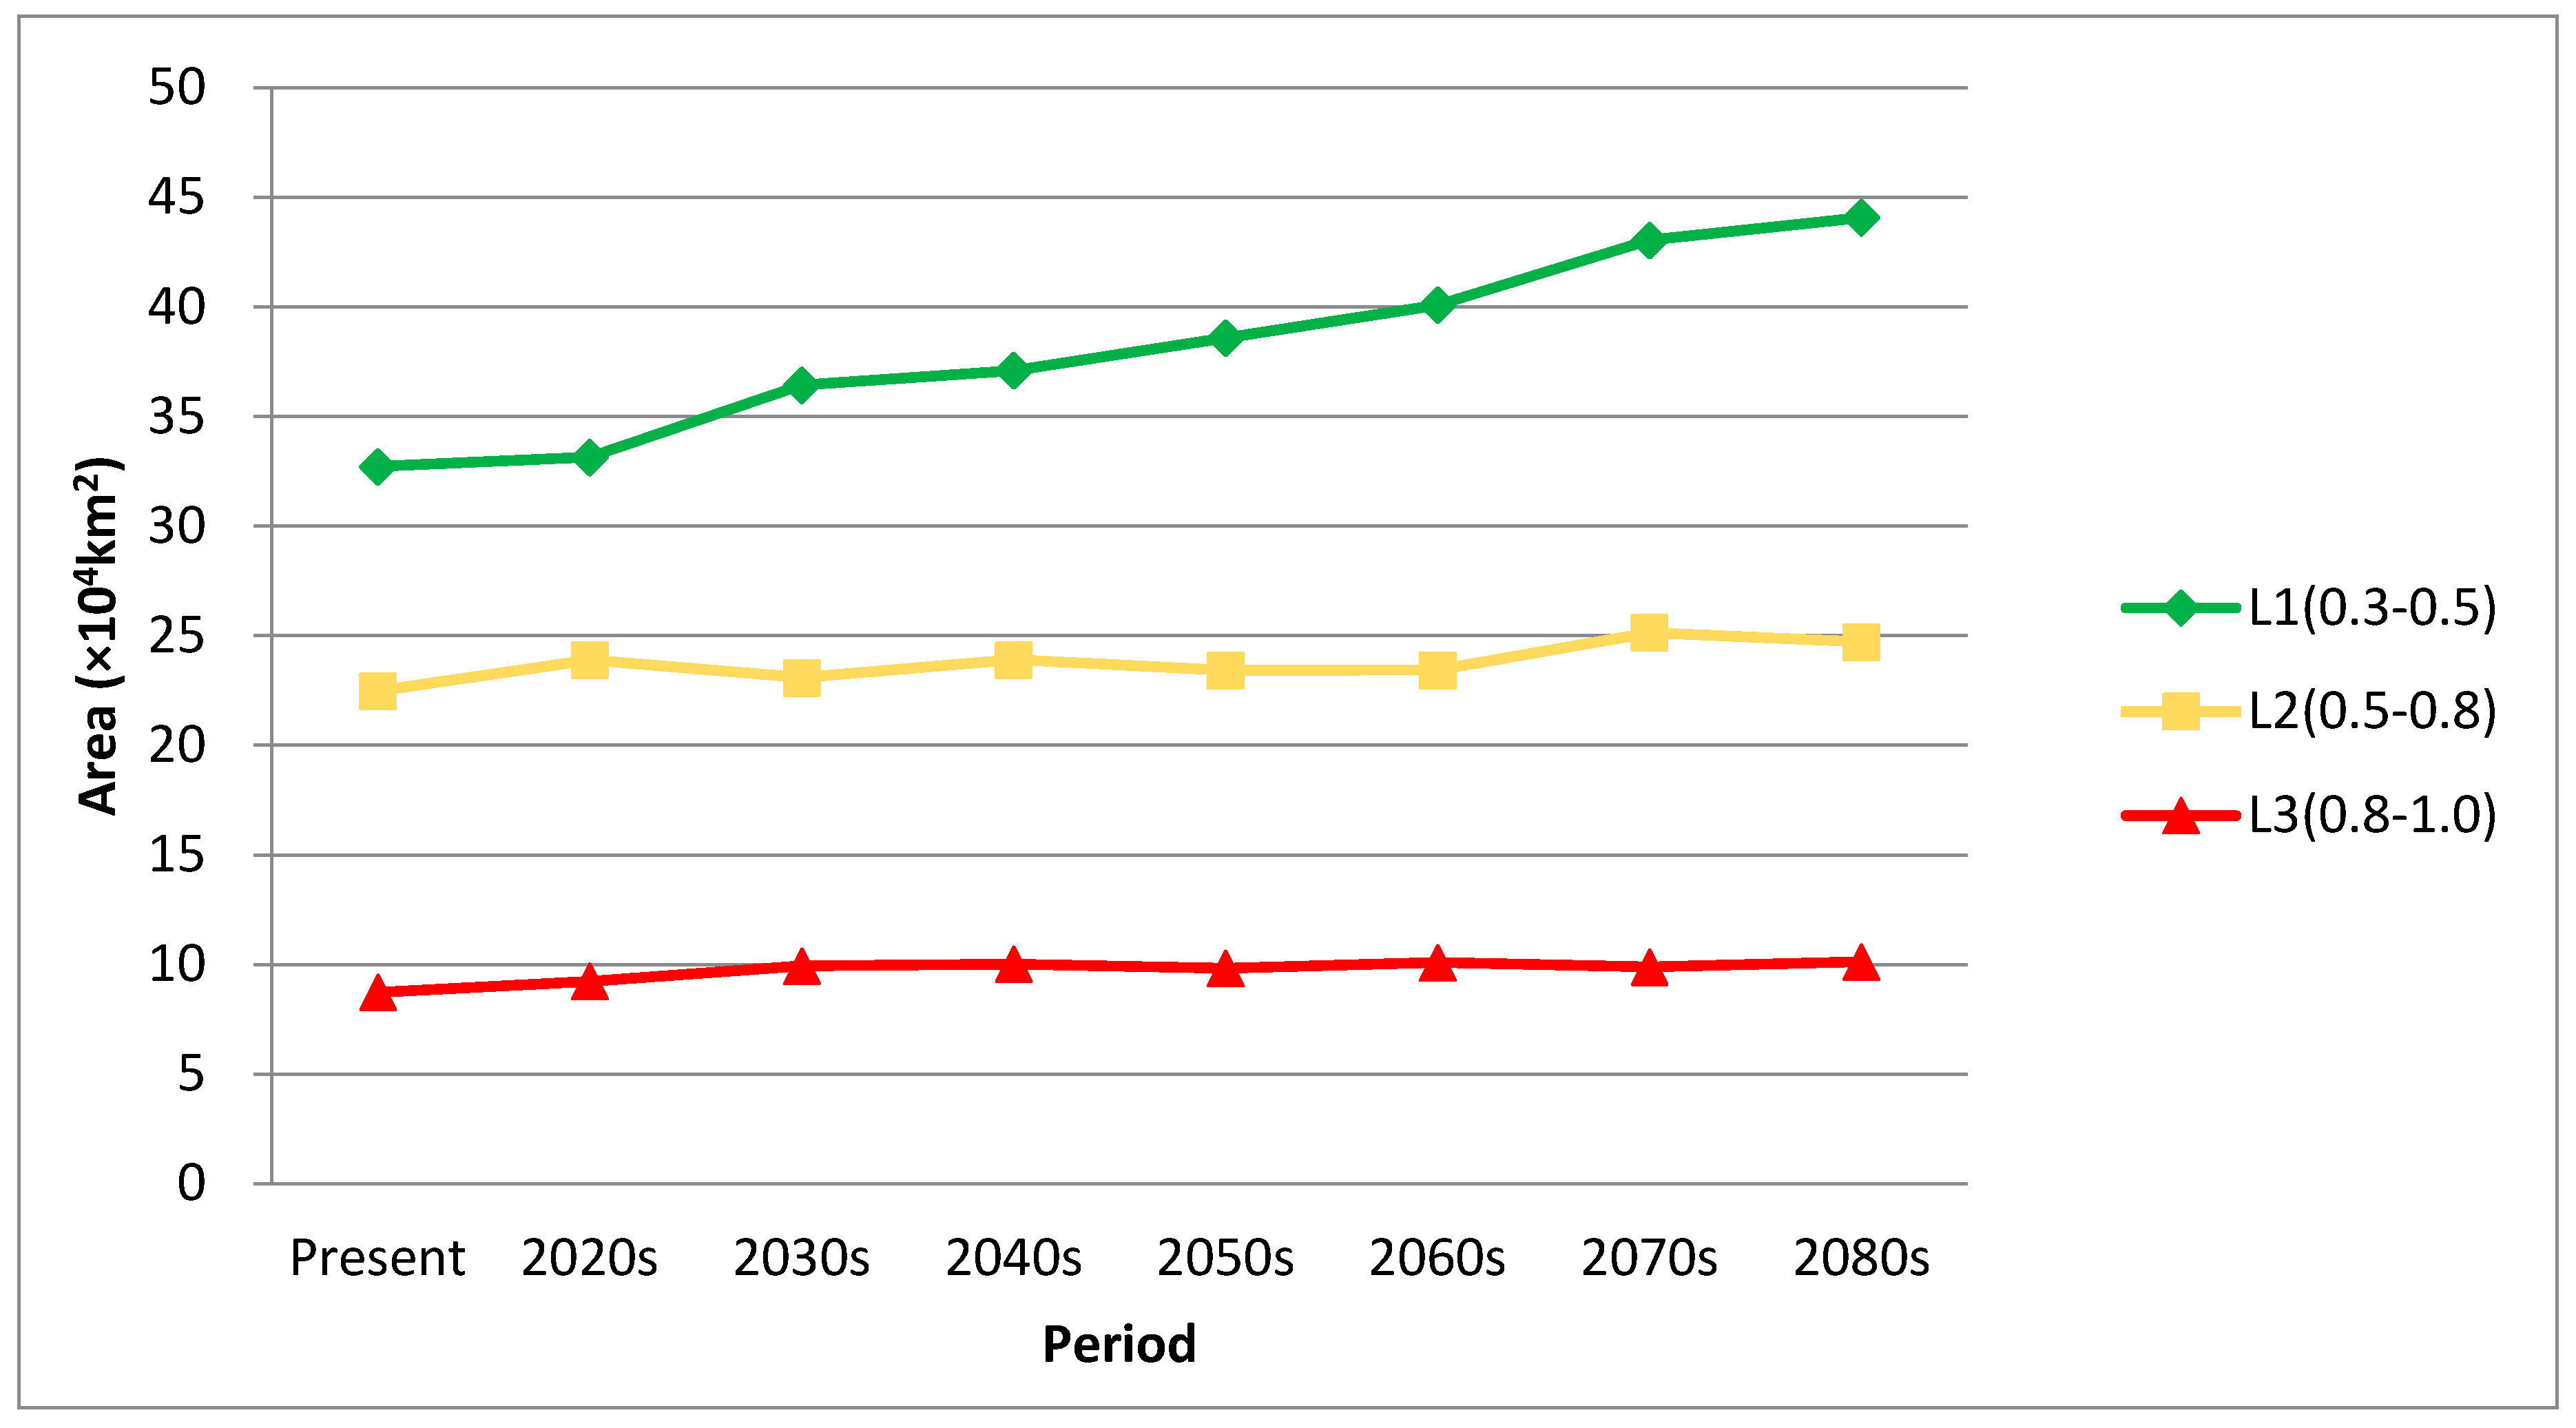
Southwest China is where E. adenophorum mainly distributes, as presented in Figure 2. Based on the prediction by MaxEnt, from the present to the 2080s, the areas of L1, L2 and L3 will expand by 34.69%, 9.96% and 16.04%, respectively (Figure 3). In the four main invaded provinces of China, the area of L3 will increase fluctuatingly in the Guangxi, Guizhou and Yunnan provinces by 13.1 × 10³ km2, 1.1 × 10³ km2 and 0.4 × 10³ km2, respectively, while it will decrease by 2.2 × 10³ km2 in Sichuan province. The AUC for three replicate runs (Figure 4) ranges from 0.952 to 0.959 and the standard deviation is 0.003, indicating that MaxEnt combined with ENFA could satisfactorily predict the potential distribution of E. adenophorum.
3.3. Center Displacement of Different Distribution Levels
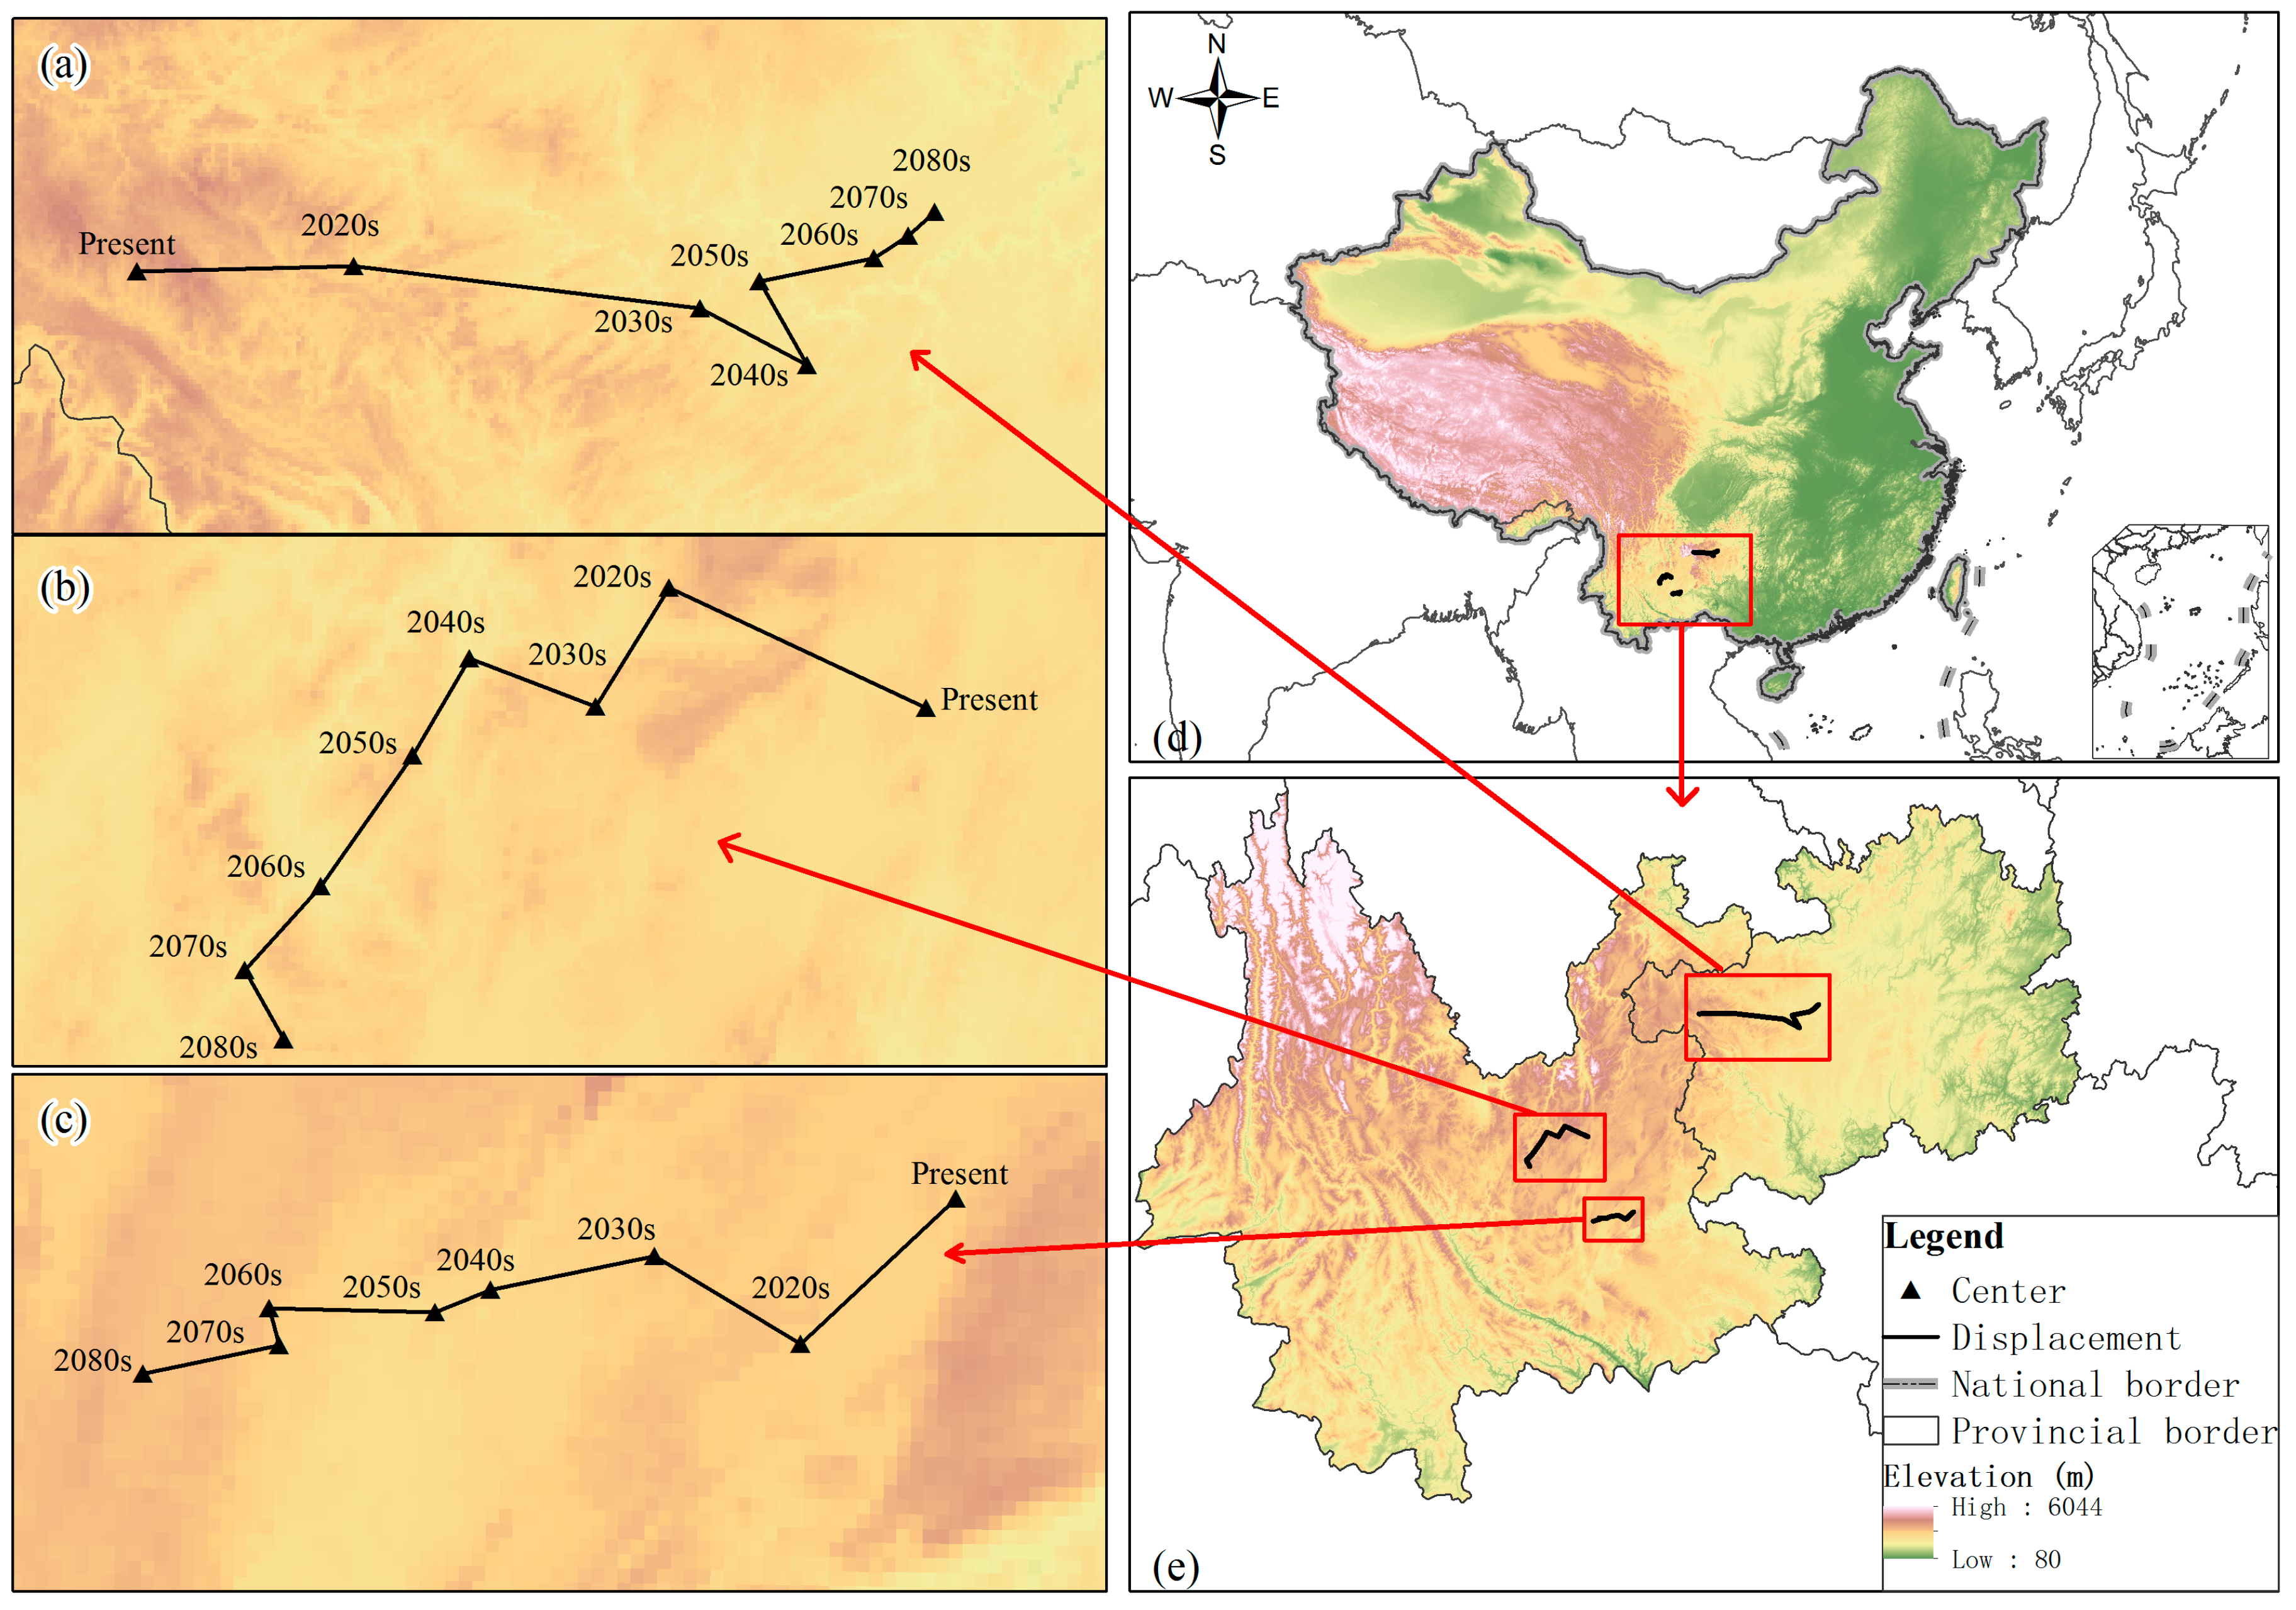
The centers of L1, L2 and L3 in the current and future scenarios are located in different provinces in China (Figure 5). The center of L1 is located in Guizhou Province, while the centers of L2 and L3 are in Yunnan Province, which is southwest of Guizhou. Additionally, from the present to the 2080s, the centers’ displacement of potential distribution levels are different. The center of L1 will move 153.54 km to the northeast, while the centers of L2 and L3 will move 83.33 km and 53.22 km, respectively, to the southwest.
4. Discussion
4.1. Selection of Environment Variables and Prediction of Potential Distribution
In former research, the factors constraining the spread of E. adenophorum included temperature, precipitation, illumination, elevation, slope [5,47], biomass allocation [7], land use, and the distribution of railways, roads, streams and rivers [5]. In this study, to predict the distribution of the weed under a future climate change scenario, we focused on 70 environment factors of topography, temperature and precipitation. The factor analysis of ENFA denotes that temperature is more influential than precipitation and topography, and the temperature in winter is more influential than that in other quarters of the year, which is consistent with the report of Li et al. [48]. In this study, the application of variables selected by ENFA shortens the time consumption for data processing by MaxEnt. According to the evaluation of ROC, the prediction by MaxEnt can credibly predict the potential distribution and can successfully achieve the objects of this study.
E. adenophorum adapts to invade places with lower temperatures and precipitation, and also to regions with higher elevations and lower soil pH since its first invasion in southwest China [3]. Former studies present different conclusions on the expansion of the weed. With GARP (Genetic Algorithm for Rule-set Production), Papes and Peterson [47] reported that the weed was spreading north, which appeared to be directly vulnerable. Sun [5] suggested that it was expanding to eastern and northern China. While according to Wang and Wang [12], the weed spread with different speeds to regions, among which south and south-central China were more vulnerable. Tracing the center movement of each distribution level in this study, the center of L1 will move northeast from present to 2080s, while the centers of L2 and L3 will move southwest. The expanding tendency indicates that, although the former invaded regions share geographic or climatic similarities with its original place [49], E. adenophorum has adapted to new habitats since its invasion in China [14,48].
4.2. Prevention and Controlling Strategies
As former research has reported, major control measures applied in China can be divided into physical control, chemical control, biotic control and comprehensive control [17]. To our knowledge, none of these control measures can be individually applied to prevent the invasion effectively in all invaded regions alone. The physical control measures cannot remove the weed completely in areas with complex topography, and may even cause soil erosion instead. 2,4-d(2,4-dichlorophenoxyacetic acid) has been commonly used in its chemical control [50]. To effectively control the spread of the weed, the extensive usage of chemicals can be costly, contaminate the environment and damage the plants nearby. The biotic control measures are time-consuming and possibly cause biological contamination; thus, caution should be taken in application. Biological replacement was firstly proposed by Robert and Eubanks [51]. It takes advantage of competition among species by planting one or several other species that grow faster than E. adenophorum [52]. Considering the characteristics of E. adenophorum, Lu [53] suggested the alternative plants should fulfill some requirements, such as being resistant to the allelopathy of E. adenophorum, being more competitive than E. adenophorum, growing with high coverage, having strong stress resistance, and being perennial and economic. According to former research, the alternative species can be Setaria anceps [54], Amorpha fruticosa [53], etc. Additionally, multiple, rather than single, species should be used in replacement control to prevent the reiterative invasion of E. adenophorum. A comprehensive control would integrate multiple measures mentioned above.
Setting aside the control measures mentioned above, we also notice that many utilizations of E. adenophorum have been reported. For example, Li et al. [55] reported that E. adenophorum is a good material for organic fertilizer, due to its abundant nitrogen, phosphorus, potassium and micronutrient content. The crude protein in seedlings takes about 20% of dry matter and more than sixteen types of amino acid, so the weed can be applied as forage. Sang et al. [3] indicated that, after the detoxication process, E. adenophorum can produce 180 m3/t TS under 30 °C and the rate of fuel transformation is 12.37%, which means that it can be applied as energy material. The weed also has pharmacological efficacy when applied in the treatment of Sarcoptes scabiei [56]. Moreover, the extract of the weed showed significant antimicrobial activity to some fungi and bacteria [57]. It is effective in killing armyworm and Myzus persicae. The endophytic fungi of the weed have strong herbicidal activity [54]. Thus, it can be developed as a pesticide or herbicide. Additionally, E. adenophorum can be utilized in the production of activated charcoal filter for water purification.
Since the invaded regions in China are discrepant in their native plants, topography, the influence of human activities, etc., and none of the control measures mentioned above can be applied in all of the invaded regions, on the basis of former research, we suggest adjusting the control measures to local conditions. Furthermore, the potential distribution regions and the invasive route should also be taken into consideration. The L3 regions should take the priority in control and removal of the weed by integrating multiple control measures together with the utilization of the weed, while precautions should be taken in L1 regions to prevent the further invasion of E. adenophorum. Treatment funds can be allocated based on the potential invasive level (L1 to L3). The prevention and control of the weed should result in a recovery of local species, while preventing further damage to the biotopes caused by inappropriate measures.
Acknowledgments
We sincerely thank George R. Lebo for his assistance in the revision of this manuscript. We are grateful to anonymous reviewers for their valuable comments on an earlier draft of the manuscript. This work is financially supported by the key consulting project “Research on the Development Strategy of China’s Prataculture” by Chinese Academy of Engineering (2016-XZ-38), the Fundamental Research Funds for the Central Universities (lzuzbky-2017-k01) and Program for Changjiang Scholars and Innovative Research Team in University (IRT_17R50).
Author Contributions
Chong Wang, Huilong Lin, Aocheng Cao and Lan He conceived and designed this study. Chong Wang and Qisheng Feng processed data. Chong Wang and Cangyu Jin wrote the papaer.
Conflicts of Interest
The authors declare no conflict of interest.
References
- Liu, J.; Dong, M.; Miao, S.L.; Li, Z.Y.; Song, M.H.; Wang, R.Q. Invasive alien plants in China: Role of clonality and geographical origin. Biol. Invasions 2006, 8, 1461–1470. [Google Scholar] [CrossRef]
- Li, Y.; Feng, Y. Differences in Seed Morphometric and Germination Traits of Crofton Weed (Eupatorium adenophorum) from Different Elevations. Weed Sci. 2009, 57, 26–30. [Google Scholar] [CrossRef]
- Sang, W.; Zhu, L.; Axmacher, J.C. Invasion pattern of Eupatorium adenophorum Spreng in southern China. Biol. Invasions 2010, 12, 1721–1730. [Google Scholar] [CrossRef]
- Yu, X.; Yu, D.; Lu, Z.; Ma, K. A new mechanism of invader success: Exotic plant inhibits natural vegetation restoration by changing soil microbe com-munity. Chin. Sci. Bull. 2005, 50, 1105. [Google Scholar] [CrossRef]
- Sun, X.; Lu, Z.; Sang, W. Review on studies of Eupatorium adenophorum an important invasive species in China. J. For. Res. 2004, 15, 319–322. [Google Scholar] [CrossRef]
- Shen, J.; Li, X.; Wang, D.; Lu, H. In Vitro Culture of Croftonweed (Ageratina Adenophora): Considerable Potential for Fast and Convenient Plantlet Production. Weed Technol. 2007, 21, 445–452. [Google Scholar] [CrossRef]
- Zhu, L.; Sun, O.J.; Sang, W.; Li, Z.; Ma, K. Predicting the spatial distribution of an invasive plant species (Eupatorium adenophorum) in China. Landsc. Ecol. 2007, 22, 1143–1154. [Google Scholar] [CrossRef]
- Weber, E.; Sun, S.S.-G.; Li, B. Invasive alien plants in China: Diversity and ecological insights. Biol. Invasions 2008, 10, 1411–1429. [Google Scholar] [CrossRef]
- Ministry of Environmental Protection of the People’s Republic of China List of the First Batch of Alien Invasive Species in China. Available online: http://www.mep.gov.cn/gkml/zj/wj/200910/t20091022_172155.htm (accessed on 30 August 2017).
- Khonglam, A.; Singh, A. Cytogenetic studies on the weed species of Eupatorium found in Meghalaya, India. Proc. Plant Sci. 1980, 89, 237–241. [Google Scholar] [CrossRef]
- Wang, Y.; Fu, B.; Lü, Y.; Chen, L. Effects of vegetation restoration on soil organic carbon sequestration at multiple scales in semi-arid Loess Plateau, China. Catena 2011, 85, 58–66. [Google Scholar] [CrossRef]
- Wang, R.; Wang, Y.; King, S.R.; Eupatorium, H.R. Invasion dynamics and potential spread of the invasive alien plant species Ageratina adenophora (Asteraceae) in China. Divers. Distrib. 2006, 12, 397–408. [Google Scholar] [CrossRef]
- Zheng, Y.; Feng, Y.; Liu, W.; Liao, Z. Growth, biomass allocation, morphology, and photosynthesis of invasive Eupatorium adenophorum and its native congeners grown at four irradiances. Plant Ecol. 2009, 203, 263–271. [Google Scholar] [CrossRef]
- Zhao, Y.; Yang, X.; Xi, X.; Gao, X.; Sun, S. Phenotypic Plasticity in the Invasion of Crofton Weed (Eupatorium adenophorum) in China. Weed Sci. 2012, 60, 431–439. [Google Scholar] [CrossRef]
- Tian, M. Photosynthetic Ecophysiology of Crofton Weed During the Dry Season in the Dry Valley of Jinsha River and its Invasion Risks to Sichuan Basin. J. China West Norm. Univ. (Nat. Sci.) 2010, 31, 364–371. (In Chinese) [Google Scholar] [CrossRef]
- He, W.-M.; Li, J.-J.; Peng, P.-H. A Congeneric Comparison Shows that Experimental Warming Enhances the Growth of Invasive Eupatorium adenophorum. PLoS ONE 2012, 7, e35681. [Google Scholar] [CrossRef] [PubMed]
- Wang, F.; Summerell, B.A.; Marshall, D.R.; Auld, B.A. Inoculum production of Phaeoramularia, a potential mycoherbicide for crofton weed. Australas. Plant Pathol. 1997, 26, 173–178. [Google Scholar] [CrossRef]
- Global Biodiversity Information Facility (GBIF). Available online: https://www.gbif.org/ (accessed on 30 August 2017).
- Ni, W. Influences of Environmental Factors on the Seed Germination of Eupatorium adenophorum. Ecol. Sin. 1983, 3, 327–331. (In Chinese) [Google Scholar]
- Chang, Q.; Zou, R.; Fan, W.; Deng, Z.; Yi, M.; Hu, Y. An Exploratory Study on the Damage and Prevention Countermeasures of Eupatorium adenophorum. Guizhou For. Sci. Technol. 2005, 33, 47–49. (In Chinese) [Google Scholar]
- He, Y.; Nie, L.; Lu, D.; Ye, Z. Research Status of Controlling Eupatorium adenophorum. Guizhou Agric. Sci. 2005, 3, 50–52. (In Chinese) [Google Scholar]
- Lu, P.; Sang, W.; Ma, K. Progress and Prospects in Research of an Exotic Invasive Species, Eupatorium adenophorum. Chin. J. Plant Ecol. 2005, 29, 1029–1037. (In Chinese) [Google Scholar] [CrossRef]
- Wang, Y.; Zhao, B.; Fan, Z.; Fan, Y.; Tan, C. The Advance in Eupatorium adenophorum Spreng and Its Damage. Progress Vet. Med. 2005, 26, 45–48. (In Chinese) [Google Scholar] [CrossRef]
- Yin, J.; Ma, X.; Deng, J. Investigation on Harmful Bio-organisms of Grassland in Yunnan. J. Sichuan Grassl. 2005, 121, 19–23. (In Chinese) [Google Scholar] [CrossRef]
- Yin, J. The current status and outlook of Eupatorium adenophorum control in southwest China. Pratacult. Sci. 2006, 23, 82–85. (In Chinese) [Google Scholar] [CrossRef]
- Huang, W.; Guo, J.; Wan, F.; Gao, B.; Xie, B. AFLP analyses on genetic diversity and structure of Eupatorium adenophorum populations in China. Chin. J. Agric. Biotechnol. 2007, 15, 992–1000. (In Chinese) [Google Scholar] [CrossRef]
- Zhou, S.; Tang, C.; Zhang, X. The damage situation and control countermeasures for Eupatorium adenophorum in Sichuan province. Pratacult. Sci. 2010, 21, 24–26. (In Chinese) [Google Scholar] [CrossRef]
- Zhou, Z.X.; Jiang, H.; Yang, C.; Yang, M.Z.; Zhang, H.B. Microbial community on healthy and diseased leaves of an invasive plant Eupatorium adenophorum in Southwest China. J. Microbiol. 2010, 48, 139–145. [Google Scholar] [CrossRef] [PubMed]
- Yin, F.; Huang, M.; Xu, R.; Liu, S.; Li, J.; Chen, Y.; Zhang, W. Analysis on Eupatorium Hazards and Development in Its Comprehensive Utilization. J. Catastrophol. 2009, 24, 63–67. (In Chinese) [Google Scholar]
- Hijmans, R. J.; Guarino, L.; Mathur, P. DIVA-GIS Manual, version 7.5; LizardTech, Inc.: Portland, OR, USA, 2012. [Google Scholar]
- Flato, G.M.; Boer, G.J. Warming asymmetry in climate change simulations. Geophys. Res. Lett. 2001, 28, 195–198. [Google Scholar] [CrossRef]
- Jones, P.G.; Thornton, P.K.; Heinke, J. Generating Characteristic Daily Weather Data Using Downscaled Climate Model Data from the IPCC’s Fourth Assessment; Project Report; International Livestock Research Institute: Nairobi, Kenya, 2009. [Google Scholar]
- WorldClim—Global Climate Data: Free Climate Data for Ecological Modeling and GIS. Available online: http://www.worldclim.org/ (accessed on 30 August 2017).
- ESRI. ArcGIS Desktop: Release 10; Environmental Systems Research Institute: Redlands, CA, USA, 2011. [Google Scholar]
- Phillips, S.J.; Anderson, R.P.; Schapire, R.E. Maximum entropy modeling of species geographic distributions. Ecol. Model. 2006, 190, 231–259. [Google Scholar] [CrossRef]
- Dudík, M.; Phillips, S.J.; Schapire, R.E. Performance Guarantees for Regularized Maximum Entropy Density Estimation. In Lecture Notes in Computer Science; Springer: Berlin, Germany, 2004; Volume 3120, pp. 472–486. [Google Scholar]
- Elith, J.; Graham, C.; Anderson, R.P.; Dudík, M.; Ferrier, S.; Guisan, A.; Hijmans, R.J.; Huettmann, F.; Leathwick, J.R.; Lehmann, A.; et al. Novel methods improve prediction of species’ distributions from occurrence data. Ecography 2006, 29, 129–151. [Google Scholar] [CrossRef]
- Giovanelli, J.G.R.; Haddad, C.F.B.; Alexandrino, J. Predicting the potential distribution of the alien invasive American bullfrog (Lithobates catesbeianus) in Brazil. Biol. Invasions 2008, 10, 585–590. [Google Scholar] [CrossRef]
- Howell, K.L.; Holt, R.; Endrino, I.P.; Stewart, H. When the species is also a habitat: Comparing the predictively modelled distributions of Lophelia pertusa and the reef habitat it forms. Biol. Conserv. 2011, 144, 2656–2665. [Google Scholar] [CrossRef] [Green Version]
- Hirzel, A.H.; Hausser, J.; Chessel, D.; Perrin, N. Ecological-niche factor analysis: How to compute habitat-suitability maps without absence data? Ecology 2002, 83, 2027–2036. [Google Scholar] [CrossRef]
- Hirzel, A.; Hausser, J.; Perrin, N. Biomapper 3.1; Lab. for Conservation Biology: Lausanne, Switzerland, 2002. [Google Scholar]
- Wang, Y.; Xie, B.; Wan, F.; Xiao, Q.; Dai, L. Application of ROC curve analysis in evaluating the performance of alien species’ potential distribution models. Biodivers. Sci. 2007, 15, 365. [Google Scholar] [CrossRef]
- Fielding, A.H.; Bell, J.F. A review of methods for the assessment of prediction errors in conservation presence/absence models. Environ. Conserv. 1997, 24, 38–49. [Google Scholar] [CrossRef]
- Hart, J.F. Central Tendency in Areal Distributions. Econ. Geogr. 1954, 30, 48. [Google Scholar] [CrossRef]
- Yue, T.; Fan, Z.; Chen, C.; Sun, X.; Li, B. Surface modelling of global terrestrial ecosystems under three climate change scenarios. Ecol. Model. 2011, 222, 2342–2361. [Google Scholar] [CrossRef]
- Feng, Q.; Liang, T.; Huang, X.; Lin, H.; Xie, H.; Ren, J. Characteristics of global potential natural vegetation distribution from 1911 to 2000 based on comprehensive sequential classification system approach. Grassl. Sci. 2013, 59, 87–99. [Google Scholar] [CrossRef]
- Papes, M.; Peterson, A.T. Predicting the Potential Invasive Distribution for Eupatorium adenophorum Spreng. in China. Plant Sci. J. 2003, 21, 137–142. [Google Scholar]
- Li, H.; Qiang, S.; Qian, Y. Physiological Response of Different Croftonweed (Eupatorium adenophorum) Populations to Low Temperature. Weed Sci. 2008, 56, 196–202. [Google Scholar] [CrossRef]
- Lu, P.; Sang, W.; Ma, K. Effects of environmental factors on germination and emergence of Crofton weed (Eupatorium adenophorum). Weed Sci. 2006, 54, 452–457. [Google Scholar] [CrossRef]
- Auld, B.A. Chemical control of Eupatorium adenophorum, crofton weed. Trop. Grassl. 1972, 6, 55–60. [Google Scholar]
- Piemeisel, R.L.; Carsner, E. Replacement Control and Biological Control. Science 1951, 113, 14–15. [Google Scholar] [CrossRef] [PubMed]
- Li, H. Biological Replacement Control of “Crofton Weed”. Rangelands 1987, 9, 180. [Google Scholar]
- Lu, X. Replacement Plant Selection Cultivation and Sustainable Control of Eupatorium adenophorum. Weed Sci. 2014, 32, 69–74. (In Chinese) [Google Scholar] [CrossRef]
- Tian, Y.; Feng, Y.; Liu, C. Effects of nitrogen fertilization and planting density on Ageratina adenophora growth and its competitive traits. Chin. J. Ecol. 2009, 28, 577–588. (In Chinese) [Google Scholar]
- Li, P.; Chang, Q.; Wang, C.; Cao, J.; Zheng, W. Composting of Aerial Parts of Crofton Weed (Eupatorium adenophorum Spreng), the Top Invasive Plant in Southwest China. Compost. Sci. Util. 2014, 22, 132–137. [Google Scholar] [CrossRef]
- Nong, X.; Ren, Y.; Wang, J.; Xie, Y.; Fang, C.; Yang, D.; Liu, T.; Zhang, R.; Chen, L.; Gu, X.; et al. Clinical efficacy of botanical extracts from Eupatorium adenophorum against the Sarcoptes scabiei (Sarcoptidae: Sarcoptes) in rabbits. Vet. Parasitol. 2013, 195, 157–164. [Google Scholar] [CrossRef] [PubMed]
- Negi, A.; Semwal, A. Antimicrobial Potential of Eupatorium adenophorum Spreng. Pharmacogn. J. 2011, 2, 61–64. [Google Scholar] [CrossRef]
Figure 1.
The distribution of occurrence records of Eupatorium adenophorum in China.
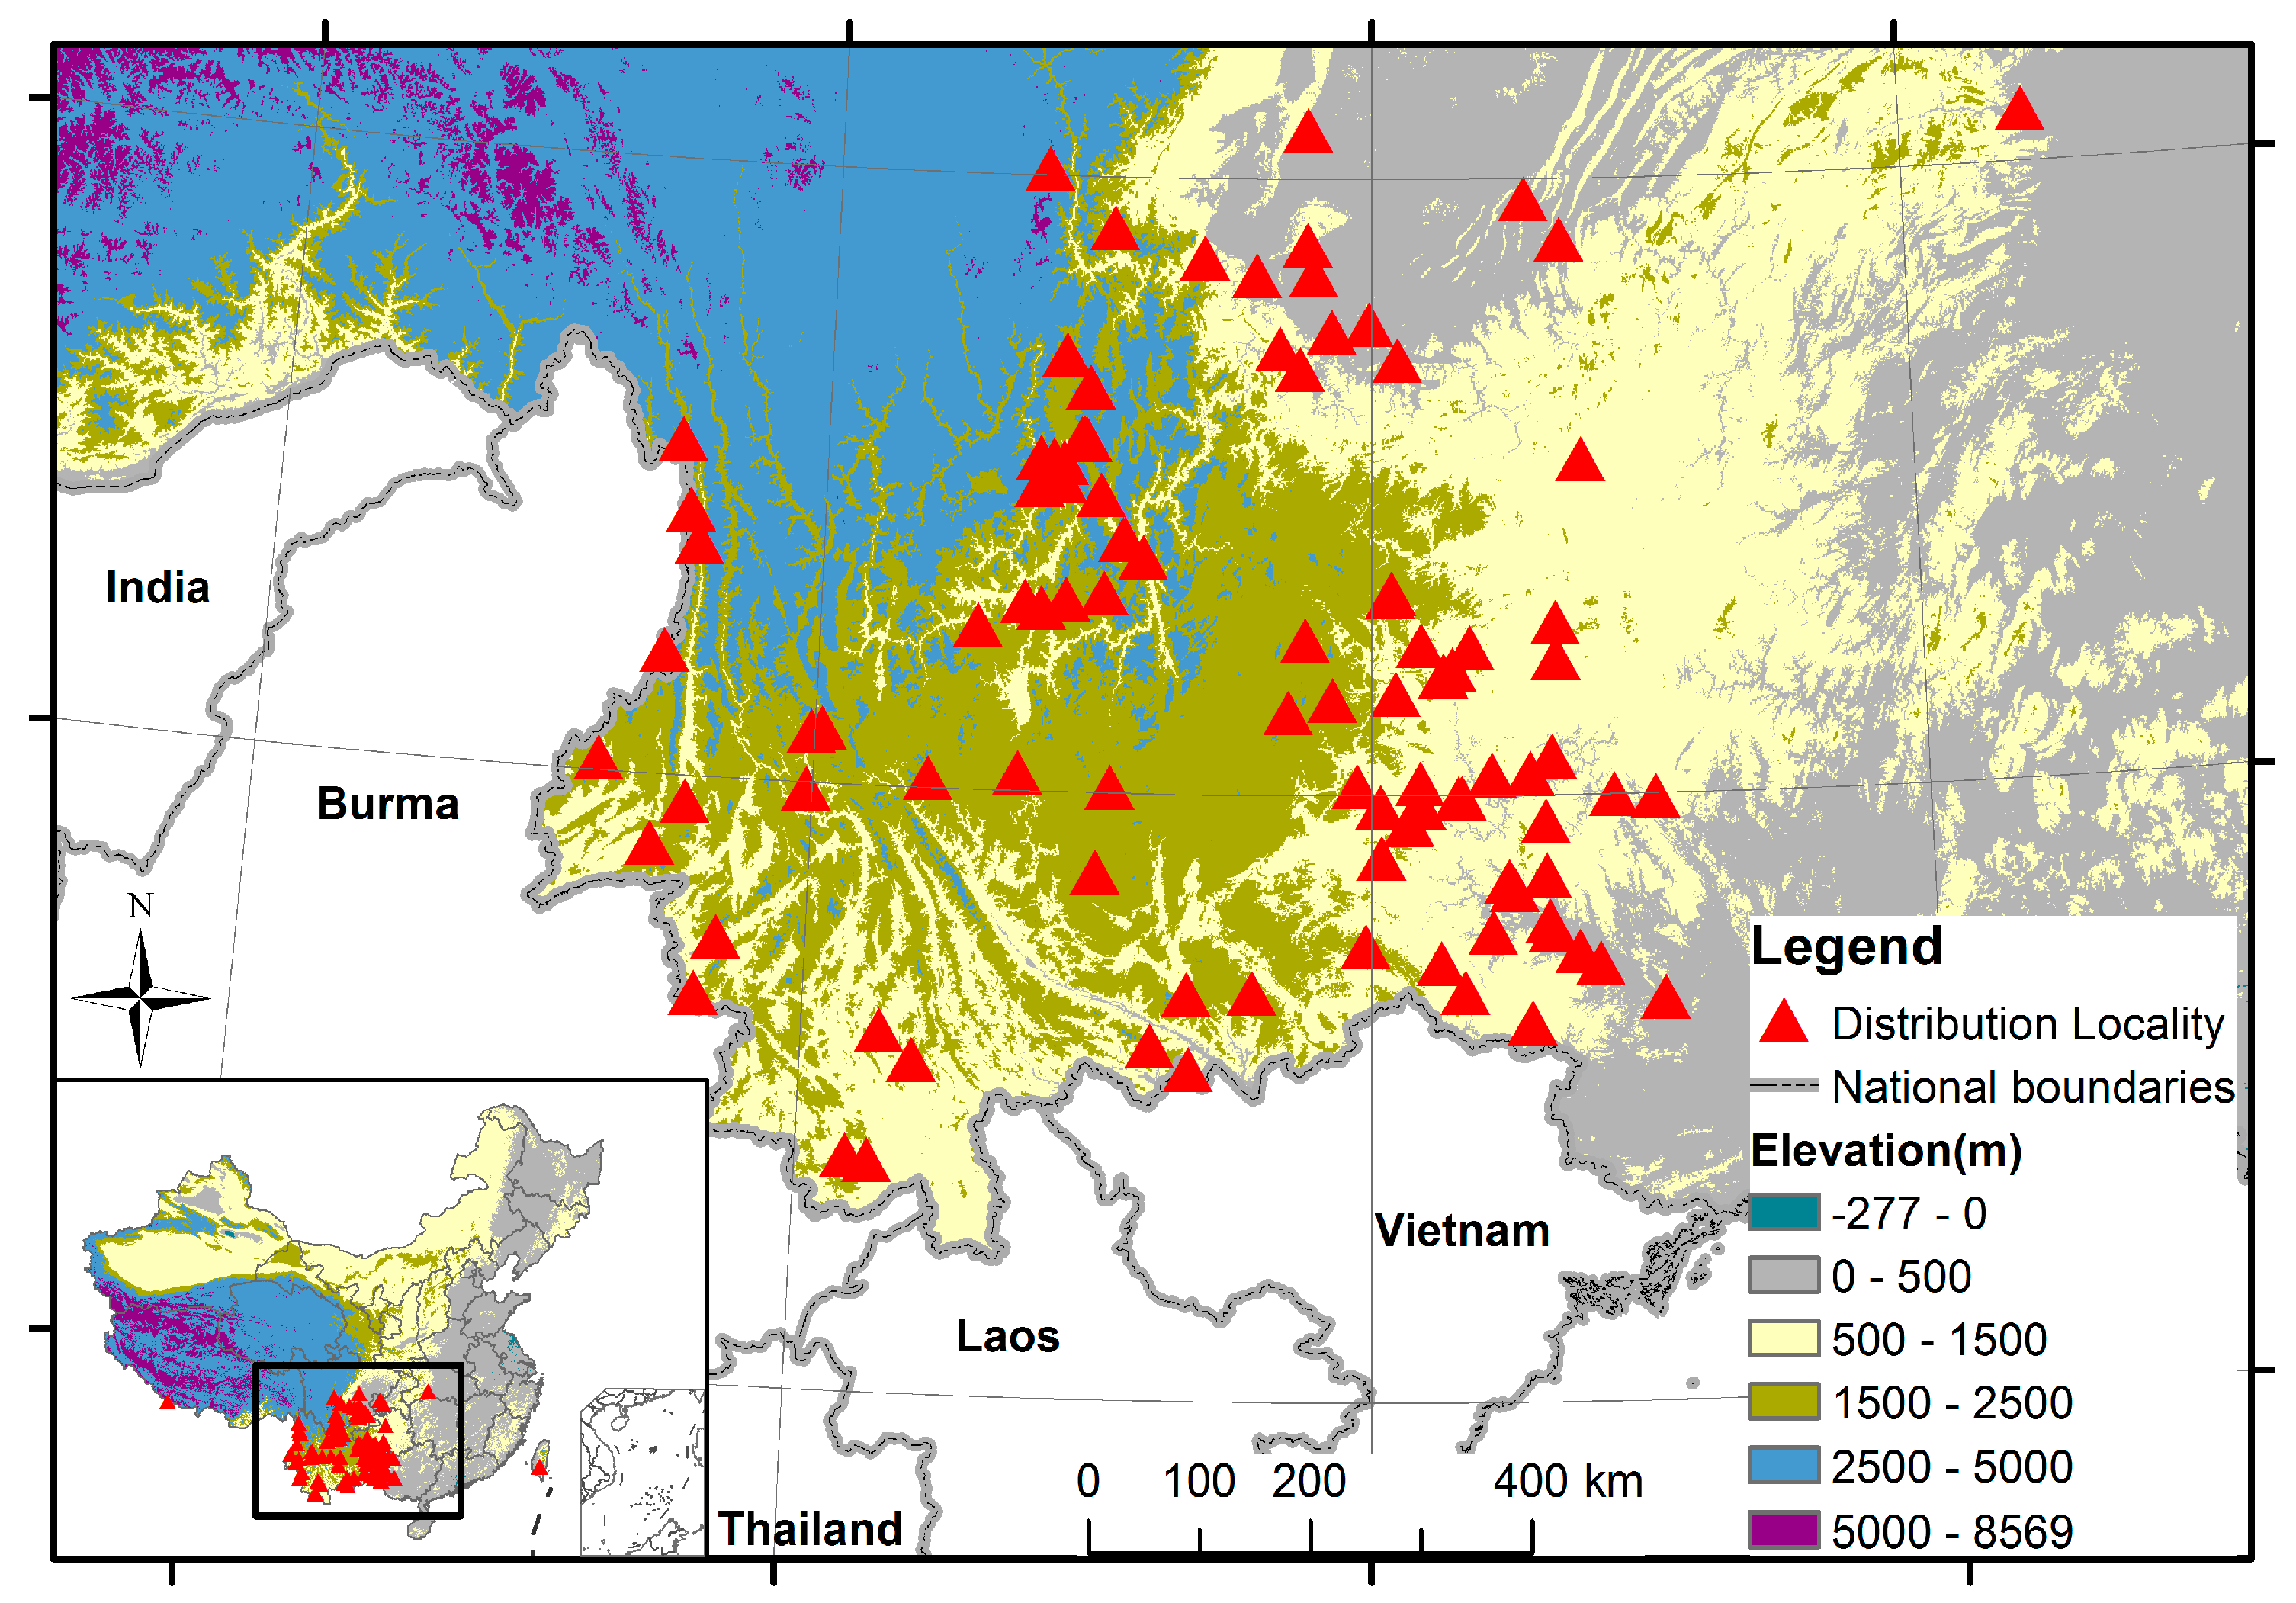
Figure 2.
The distribution of Eupatorium adenophorum at present and in the future (2020s–2080s). The future projections were based on the CCCma-CGCM3 (third version of Canadian Centre for Climate Modelling and Analysis Coupled Global Climate Model) under the A1b scenario. L0–L3 stand for the potential distribution probability of 0–0.3 (least potential), 0.3–0.5 (moderate potential), 0.5–0.7 (good potential), and 0.7–1.0 (high potential), respectively.
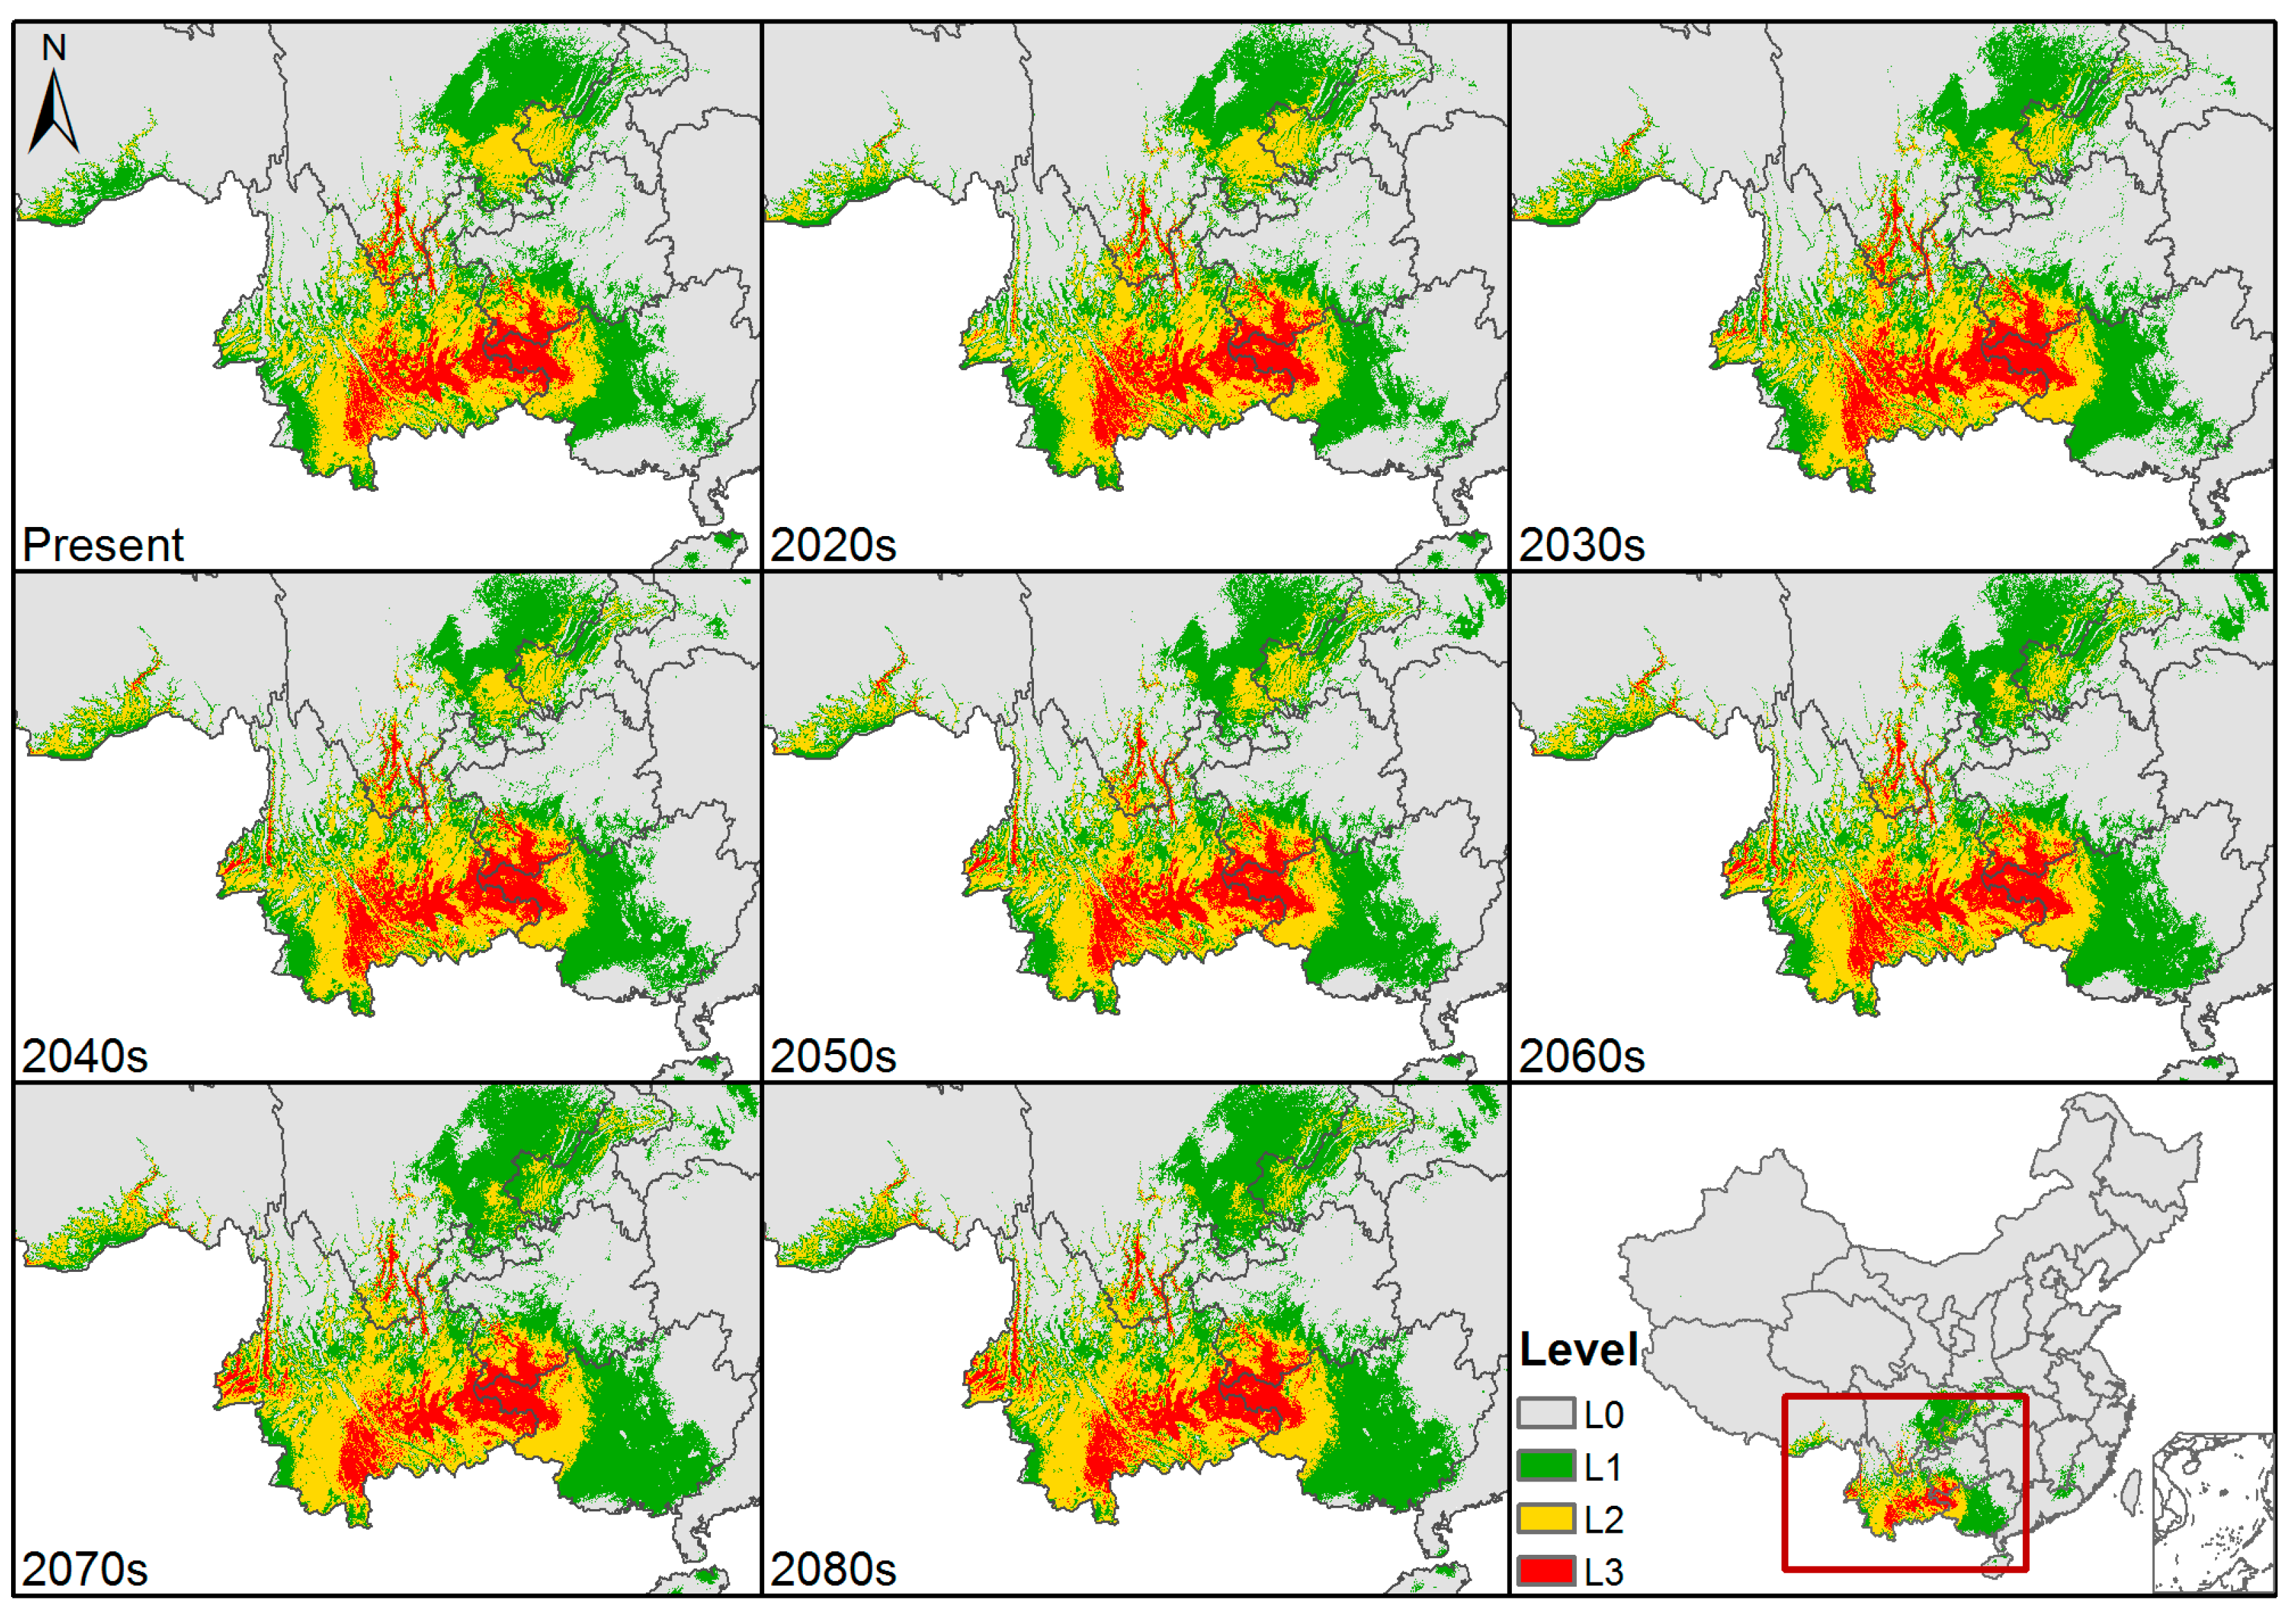
Figure 3.
Area variation of L1–L3 from the present to the 2080s in China (L1, L2, L3 represent a potential distribution probability of 0.3–0.5 (moderate potential), 0.5–0.7 (good potential), and 0.7–1.0 (high potential), respectively).
Figure 3.
Area variation of L1–L3 from the present to the 2080s in China (L1, L2, L3 represent a potential distribution probability of 0.3–0.5 (moderate potential), 0.5–0.7 (good potential), and 0.7–1.0 (high potential), respectively).

Figure 4.
The receiver operating characteristic (ROC) curve for Eupatorium adenophorum averaged over three replicates. AUC stands for the area under the curve.
Figure 4.
The receiver operating characteristic (ROC) curve for Eupatorium adenophorum averaged over three replicates. AUC stands for the area under the curve.
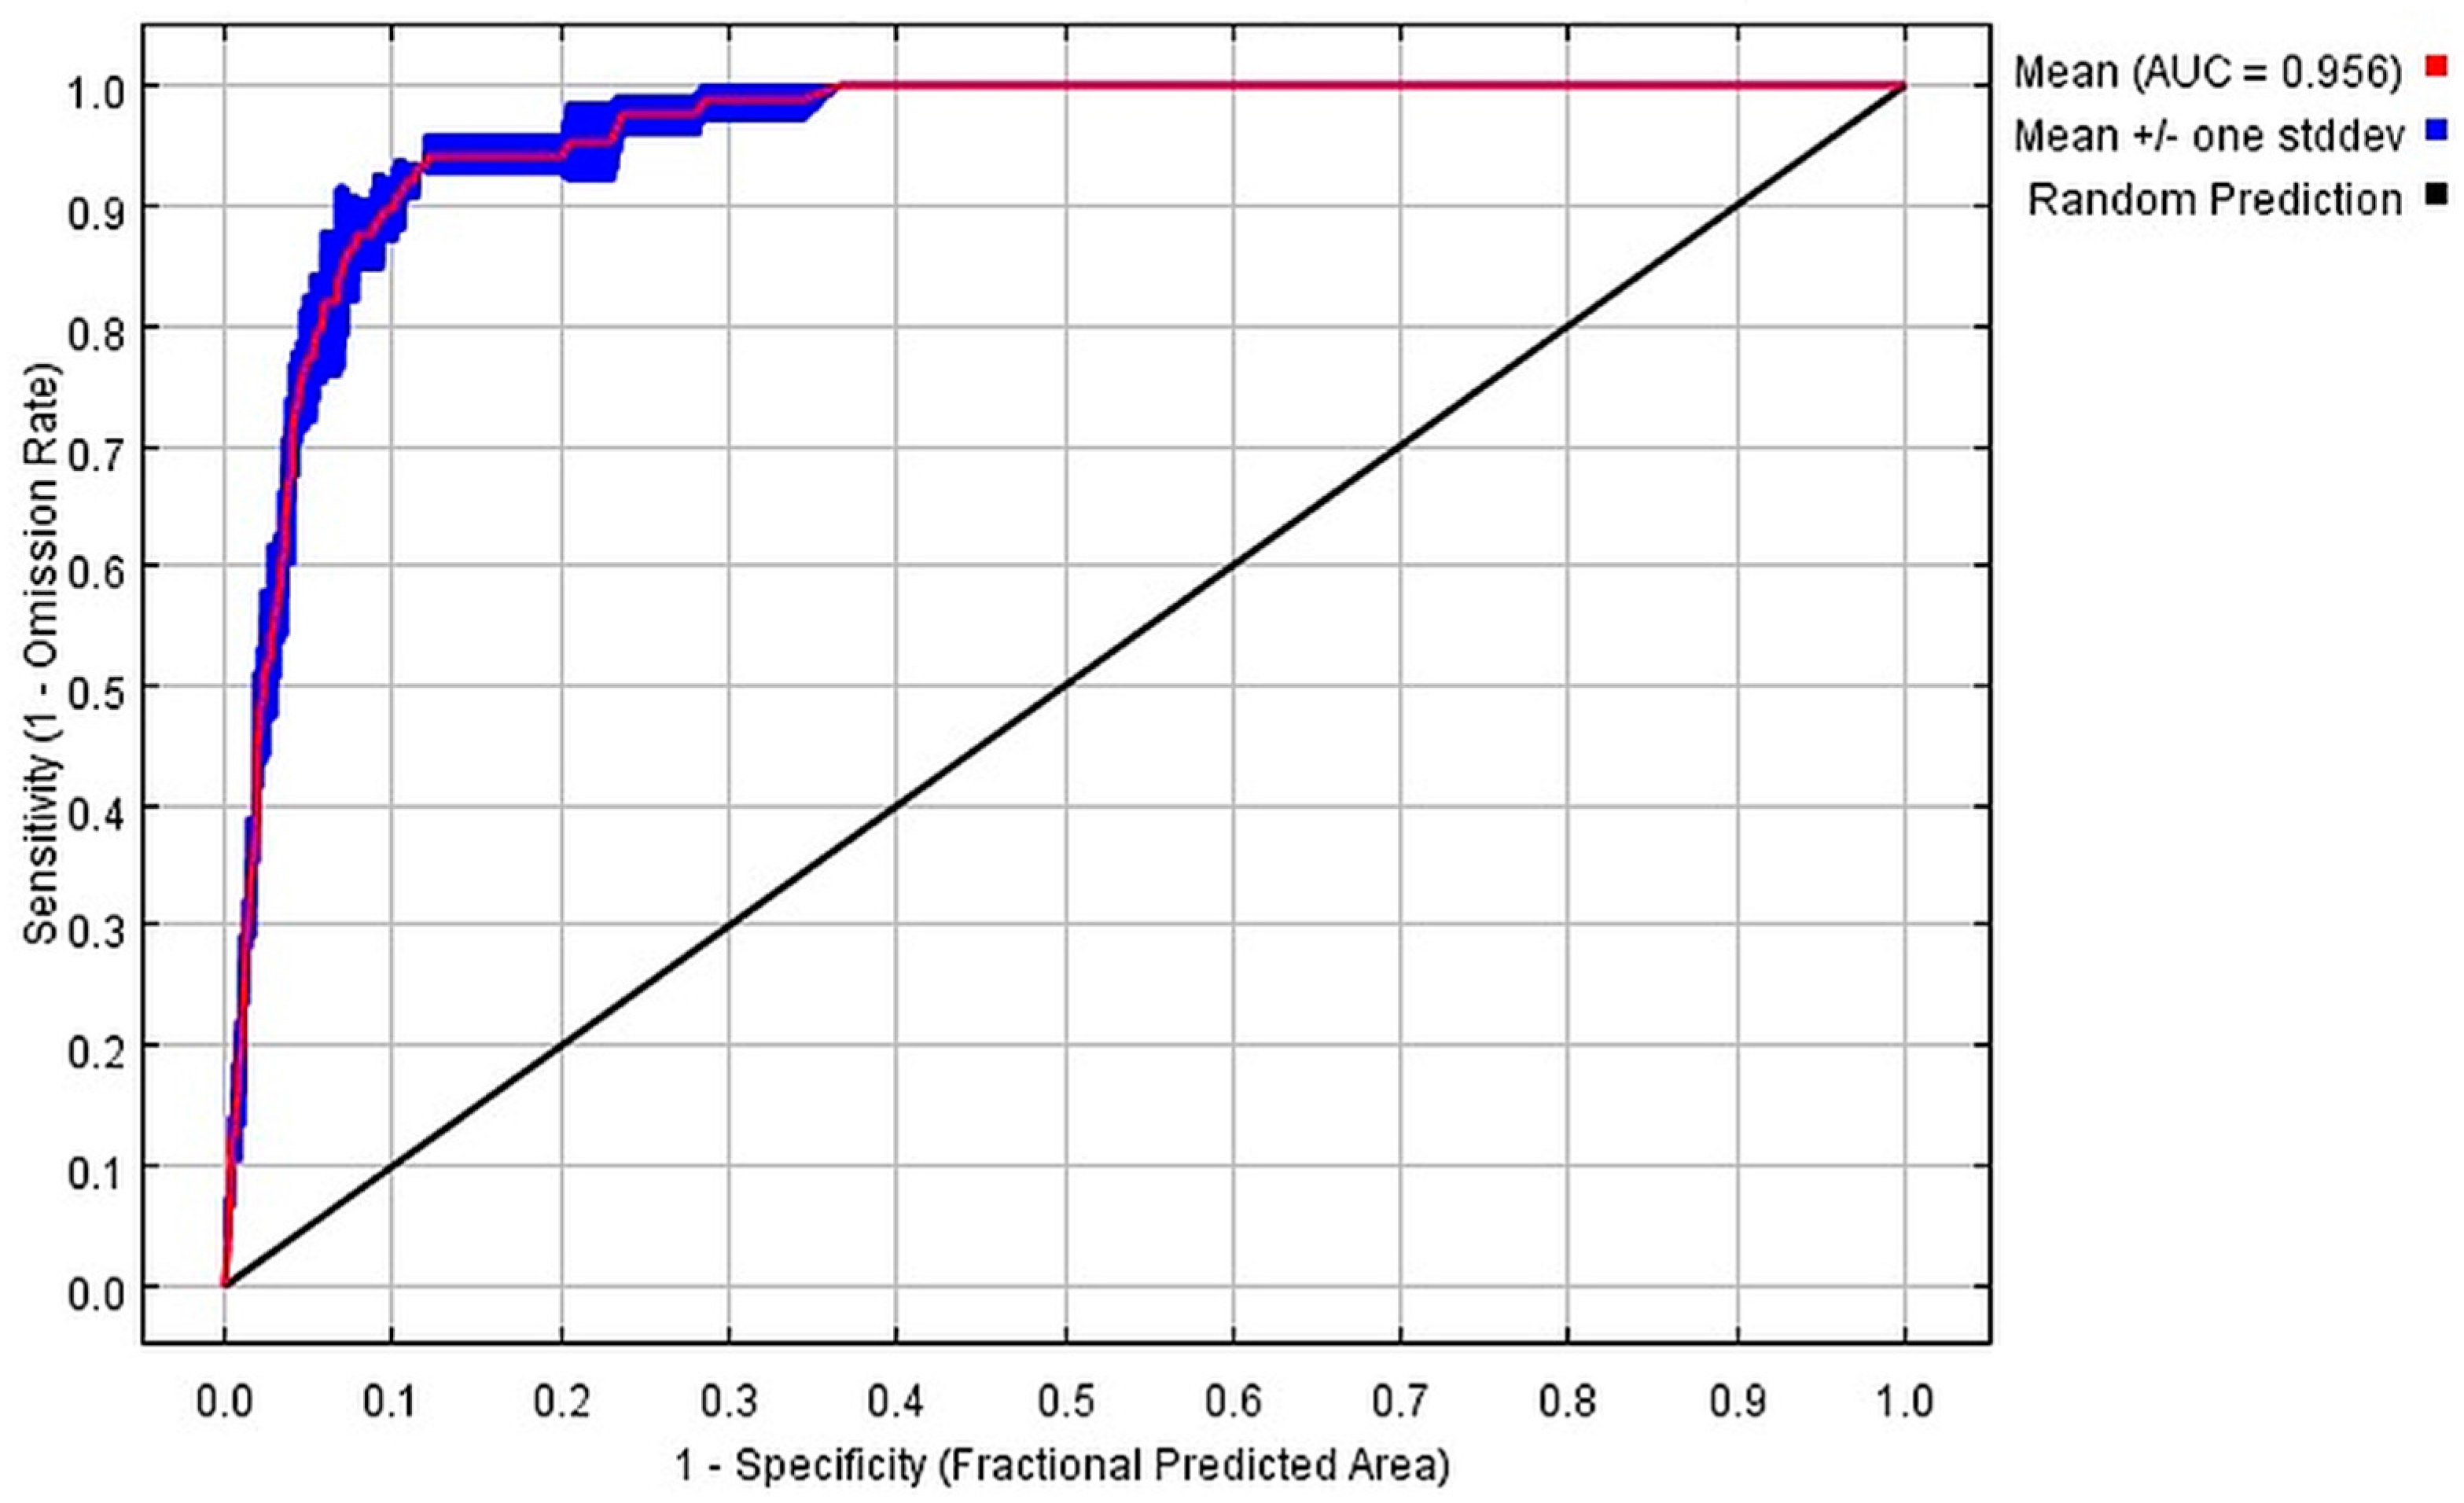
Figure 5.
Center displacement of different levels from the present to the 2080s. (a–c) Zoom in the center displacement of L1–L3, representing a potential distribution probability of 0.3–0.5 (moderate potential), 0.5–0.7 (good potential), and 0.7–1.0 (high potential), respectively. (d,e) Present the location of center displacement in China and southwest China.

Table 1.
Content information of environment variables collected.
| Variables | Description | Variables | Description |
|---|---|---|---|
| BIO1 | Annual mean temperature | BIO14 | Precipitation of driest month |
| BIO2 | Mean diurnal range (Mean of monthly (maximum temperature—minimum temperature)) | BIO15 | Coefficient variation of precipitation |
| BIO3 | Isothermality [(BIO2/BIO7) × 100] | BIO16 | Precipitation of wettest quarter |
| BIO4 | Temperature seasonality(standard deviation × 100) | BIO17 | Precipitation of driest quarter |
| BIO5 | Maximum temperature of the warmest month | BIO18 | Precipitation of warmest quarter |
| BIO6 | Minimum temperature of the coldest month | BIO19 | Precipitation of coldest quarter |
| BIO7 | Temperature annual range (BIO5–BIO6) | TmeanX | Mean temperature of the Xth month in a year |
| BIO8 | Mean temperature of the wettest quarter | Tmax | Maximum temperature of the Xth month in a year |
| BIO9 | Mean temperature of the driest quarter | Tmin | Minimum temperature of the Xth month in a year |
| BIO10 | Mean temperature of the warmest quarter | Prec | Precipitation of the Xth month in a year |
| BIO11 | Mean temperature of the coldest quarter | Alt | Altitude |
| BIO12 | Annual precipitation | Asp | Aspect |
| BIO13 | Precipitation of the wettest month | Slp | Slope |
Table 2.
Estimates of factor importance.
| Variable | ENFA | Percent Contribution | Jackknife | Weighted Average | Rank |
|---|---|---|---|---|---|
| Tmax3 | 3 | 3 | 1 | 2.3 | 1 |
| Tmean1 | 4 | 2 | 2 | 2.7 | 2 |
| Tmax1 | 2 | 1 | 6 | 3.0 | 3 |
| Tmax2 | 1 | 9 | 4 | 4.7 | 4 |
| BIO11 | 5 | 7 | 5 | 5.7 | 5 |
| Tmean2 | 6 | 10 | 3 | 6.3 | 6 |
| Tmean12 | 8 | 6 | 7 | 7.0 | 7 |
| Tmax12 | 7 | 5 | 10 | 7.3 | 8 |
| BIO6 | 9 | 4 | 9 | 7.3 | 8 |
| Tmin1 | 10 | 8 | 8 | 8.7 | 10 |
© 2017 by the authors. Licensee MDPI, Basel, Switzerland. This article is an open access article distributed under the terms and conditions of the Creative Commons Attribution (CC BY) license (http://creativecommons.org/licenses/by/4.0/).
Share and Cite
MDPI and ACS Style
Wang, C.; Lin, H.; Feng, Q.; Jin, C.; Cao, A.; He, L. A New Strategy for the Prevention and Control of Eupatorium adenophorum under Climate Change in China. Sustainability 2017, 9, 2037. https://doi.org/10.3390/su9112037
AMA Style
Wang C, Lin H, Feng Q, Jin C, Cao A, He L. A New Strategy for the Prevention and Control of Eupatorium adenophorum under Climate Change in China. Sustainability. 2017; 9(11):2037. https://doi.org/10.3390/su9112037
Chicago/Turabian StyleWang, Chong, Huilong Lin, Qisheng Feng, Cangyu Jin, Aocheng Cao, and Lan He. 2017. "A New Strategy for the Prevention and Control of Eupatorium adenophorum under Climate Change in China" Sustainability 9, no. 11: 2037. https://doi.org/10.3390/su9112037
Note that from the first issue of 2016, this journal uses article numbers instead of page numbers. See further details here.