Energy and Economic Performance of Plant-Shaded Building Façade in Hot Arid Climate


Architectural Engineering Department, College of Engineering, UAE University, PO Box 15551, Al-Ain, UAE
*
Author to whom correspondence should be addressed.
Sustainability 2017, 9(11), 2026; https://doi.org/10.3390/su9112026
Submission received: 15 September 2017
/
Revised: 28 October 2017
/
Accepted: 30 October 2017
/
Published: 6 November 2017
(This article belongs to the Special Issue Climate Change Mitigation and Adaptation - ZEMCH 2016)
Abstract
:The use of vegetated walls and intensive plantation around buildings has increased in popularity in hot and arid climates, such as those in the United Arab Emirates (UAE). This is due to its contribution towards reducing the heat gain and increasing the occupants’ comfort levels in spaces. This paper examines the introduction of plant-shaded walls as passive technique to reduce heat gain in indoor spaces as a strategy to lower cooling demand in hot arid climate of Al-Ain city. Experimental work was carried out to analyze the impact of using plantation for solar control of residential building façades in extreme summer. External and internal wall surface and ambient temperatures were measured for plant-shaded and bare walls. The study concluded that shading effect of the intensive plantation can reduce peak time indoor air temperature by 12 °C and reduce the internal heat gain by 2 kWh daily in the tested space. The economic analysis reveals a payback period of 10 years considering local energy tariff excluding environmental savings.
1. Introduction
Building energy efficiency, an important design problem, is increasingly being achieved though optimal passive design approach. Through careful selection of building layout and materials in context of local climate, energy consumption can be reduced retaining thermal comfort [1]. Shading buildings by artificial or natural means is proven technique to save energy in hot climates [2]. Solar shading in subtropical regions of China saved 26.06% and 24.42% compared to Low-E windows and fabric roller shades respectively [3]. One extension of the same consideration is plant shading as the impact of plant shaded walls creates a balance between energy performance and aesthetic appearance. The amount of shading to be provided can be easily manipulated from very light 10% coverage to very dense 80% coverage by appropriate selection of height and density of the plants. Additionally, a layer of air is trapped within the vegetation thus limits the movement of heat through the wall of the building by means of evapotranspiration [4,5,6].
The level of thermal performance depends on plant covering percentage, density & width of plant foliage, type & size of the trees and orientation of the plant-shaded walls [7]. The plant orientation is reported to influence energy savings where the west and east directions are recommended to grow trees understandably to provide shade for most of the day time [8]. McPherson and Simpson [9] further determined the impact of orientation coupled with distance between the plants and façade. They concluded that energy savings of plant-shaded walls are positive on east and west directions up to 12.2 m, neutral on south direction due to summer savings being offset by winter losses, not affected on north due to direct radiation not being blocked and not impacted beyond 12.2 m at any façade due to shadow not reaching the building [10].
A study conducted in Amman, Jordan with trees on the west and south faces of a typical residential house reported an energy saving of up to 23.96% in hottest month of July [11]. The summers in Amman (May to September) are hot and dry with cool evenings, the hottest month being July with average maximum temperature of 33 °C and humidity around 38% whilst the coldest weather is in December and January with an average temperature of 10 °C [12]. A study conducted in the US cities namely Minneapolis, Charlotte and Metro Orlando where the temperature ranges are 2.9 °C to 12.9 °C, 9.3 °C to 21.6 °C and 17.9 °C to 22.9 °C respectively [13] determined the effect of climatic conditions on energy savings of plant shaded wall. They concluded substantially varying energy savings in different climatic zones being 14 kWh in Minneapolis, MN, 25 kWh Charlotte, NC and 44 kWh in Metro Orlando, FL [14,15]. In Australian summer and spring conditions, it was found that, tree shade reduced wall surface temperatures by up to 9 °C and external air temperatures by up to 1 °C [6] The combined cooling and shading effect of trees is reported to save up to 50% of building air-conditioning costs [4]. The effect of vegetated living wall installed on a school building façades employing local plants was studied in Al-Ain, UAE during the peak summer (July). The study concluded that the installed plantation can reduce peak time indoor air temperature by at least 5 °C, and reduce the peak air conditioning energy demand by 20% [16].
In winter, the plant shaded wall creates a buffer against the wind, which reduces the energy loss associated with indoor heating. Therefore, using plants to shade walls have year round thermal advantages, with economic and energy-saving benefits [17]. In winter, under a Nordic Climate, the green roofs held the moisture content below the critical volume (15–20%), and can thus improve roof insulation during freezing [18]. In the Oceanic climate during the winters the green facade showed moderate reduction of heat losses, and its energy balance was found to be 20% higher than an orthodox facade [19]
Apart from energy savings, the plants enhance the environmental quality of the urban ecosystem, bringing benefits in terms of human health [20]. Moreover, tree shade helps reduce glare and transmits diffused light coming from the sky. When the sound wave hits the plants a vibration of its elements occurs converting and dissipating sound energy into heat. The plants eventually absorb sound waves and reduce noise pollution converting it into a pleasant sound of its own in the presence of breeze [21].
In local context, the UAE forests cover 741,000 acres (300,000 ha) area [22] planted with native and exotic tree and shrub species including gafas bush, desert hyacinths and common acacia vegetation [23]. Al-Ain, has a desert climate with year-round sunshine characterized by scarce rainfall and high levels for temperature. In summer (May to September), the weather is very hot, with daytime temperatures swinging between 35 °C and 50 °C. During the winter (December to February), the daytime temperatures swings between 25 °C and 35 °C. Rainfall is infrequent and falling mainly in winter, with an annual average rainfall of 10 cm [24]. The solar irradiance (yearly average global horizontal irradiance is in excess of 20 MJ/m2/day [25], which makes air conditioning necessary to maintain acceptable indoor comfort levels. Although proven for energy savings through previous research, economic aspects of plant shaded walls have not been studied in worst case scenarios. The present study considers the worst case scenario of extremely hot ambient, rare rain falls, total mechanical irrigation and completely desalinated water without using ground water that involves additional cost although in the extremely subsidized electricity tariff rates. The present study employs local cost of planting and maintaining trees, purchasing materials, pruning, pest and disease control and irrigation [26] which is the theme of current article.
2. Experimental Set Up
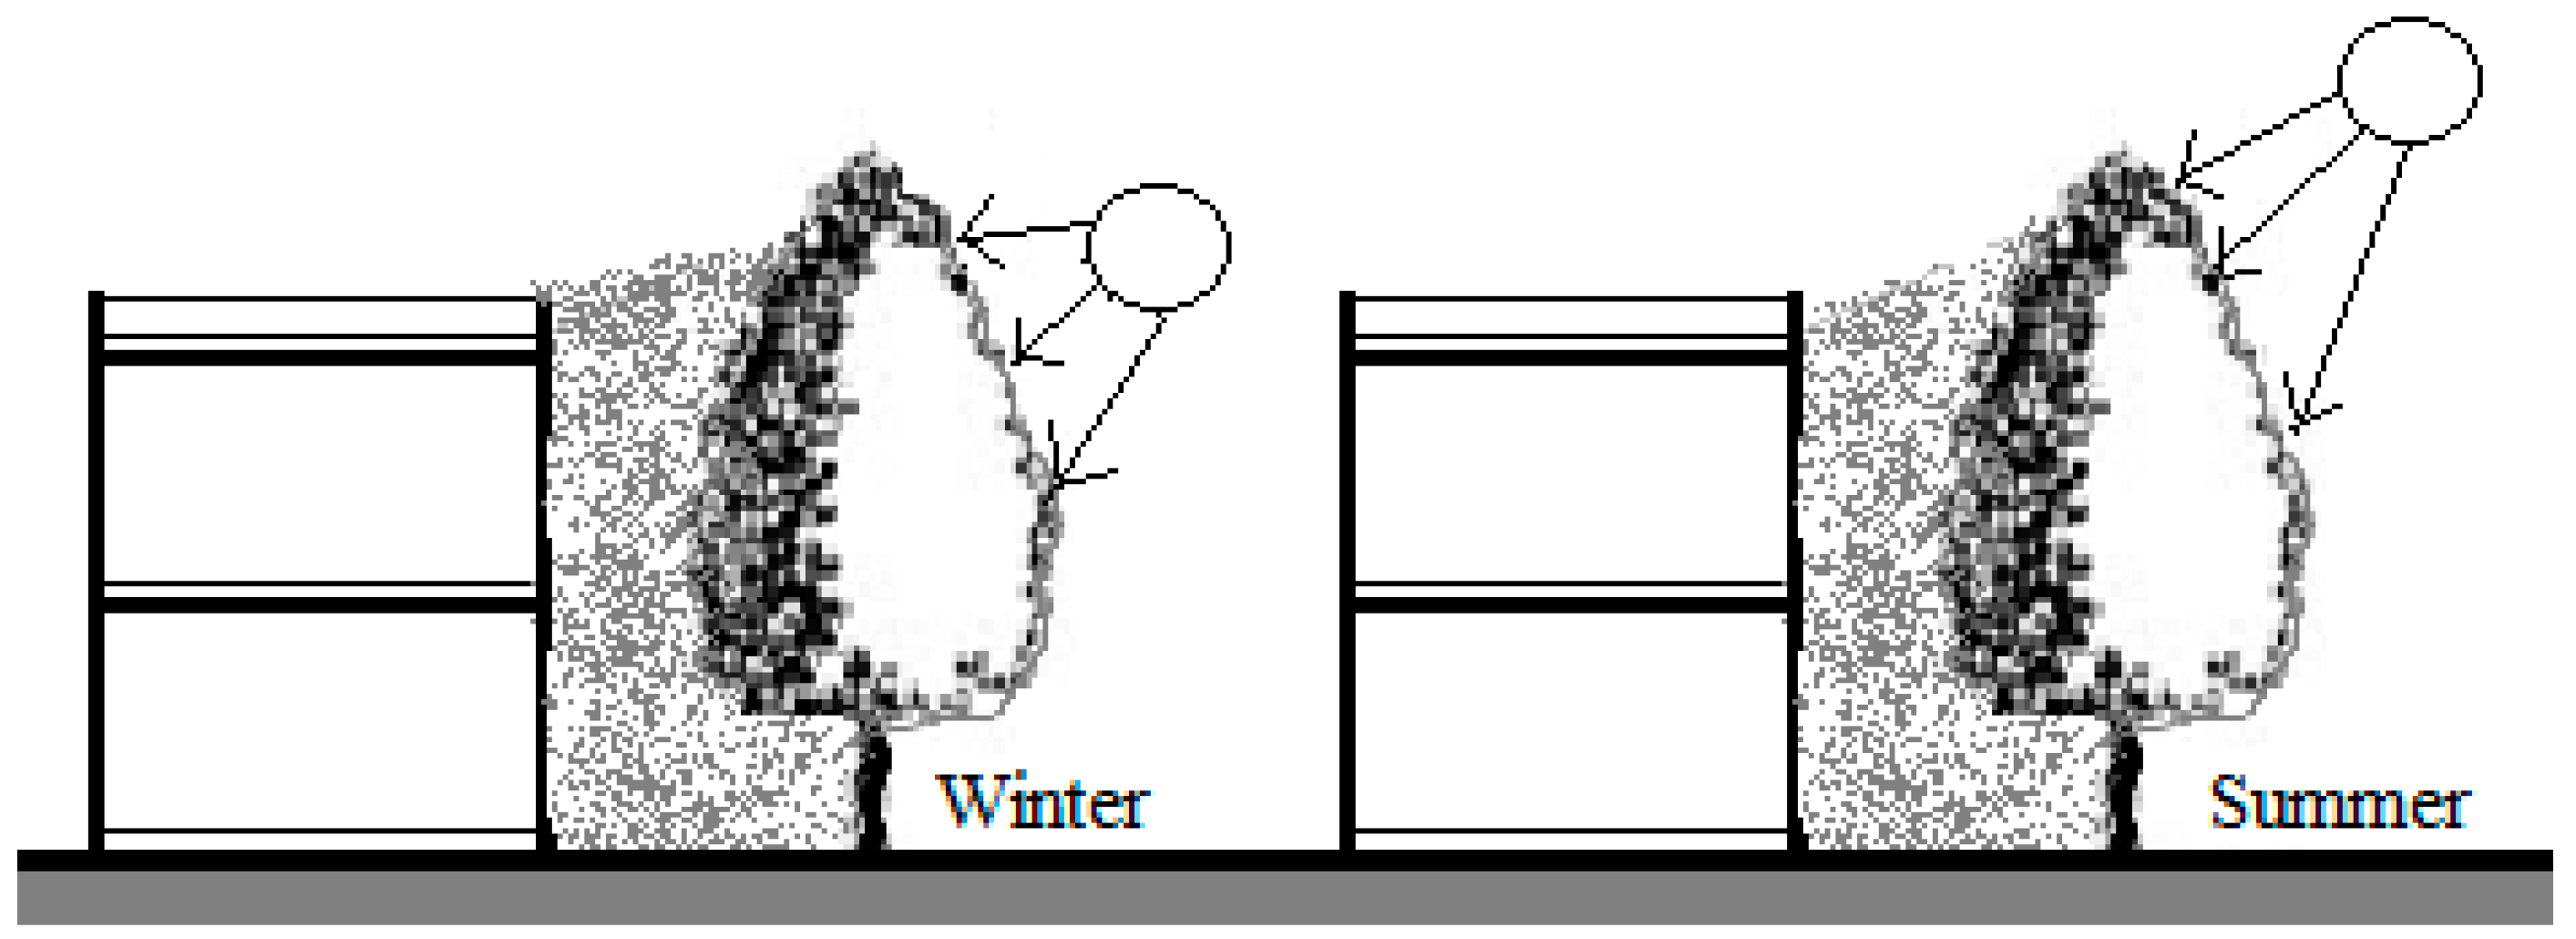
As part of an experimental work, two identical semi-attached housing units have been selected to investigate the thermal performance of plant-shaded walls in the hot climate of Al-Ain City. As shown in Figure 1, the external wall facing south of the first house is unshaded (bare wall); however, the external wall of the second house is shaded with non-deciduous trees (plant-shaded wall), both walls having a south facing area of 12 m2. Non-deciduous shade trees, or evergreens, do not drop their leaves during the year unlike deciduous trees, which lose their leaves in winter (Figure 2).
The tested space areas, glass ratio, furniture, construction materials, internal finishing and ventilation systems are identical in both cases. The external walls of the case studies are constructed from hollow concrete blocks with thickness of 20 cm. The internal surface of the walls is covered with white stucco, however the external surface is cladded with light color stone and stucco, using wet-fixation method (without thermal insulation layer). The glass windows nearly cover 60 percent of the building façades.
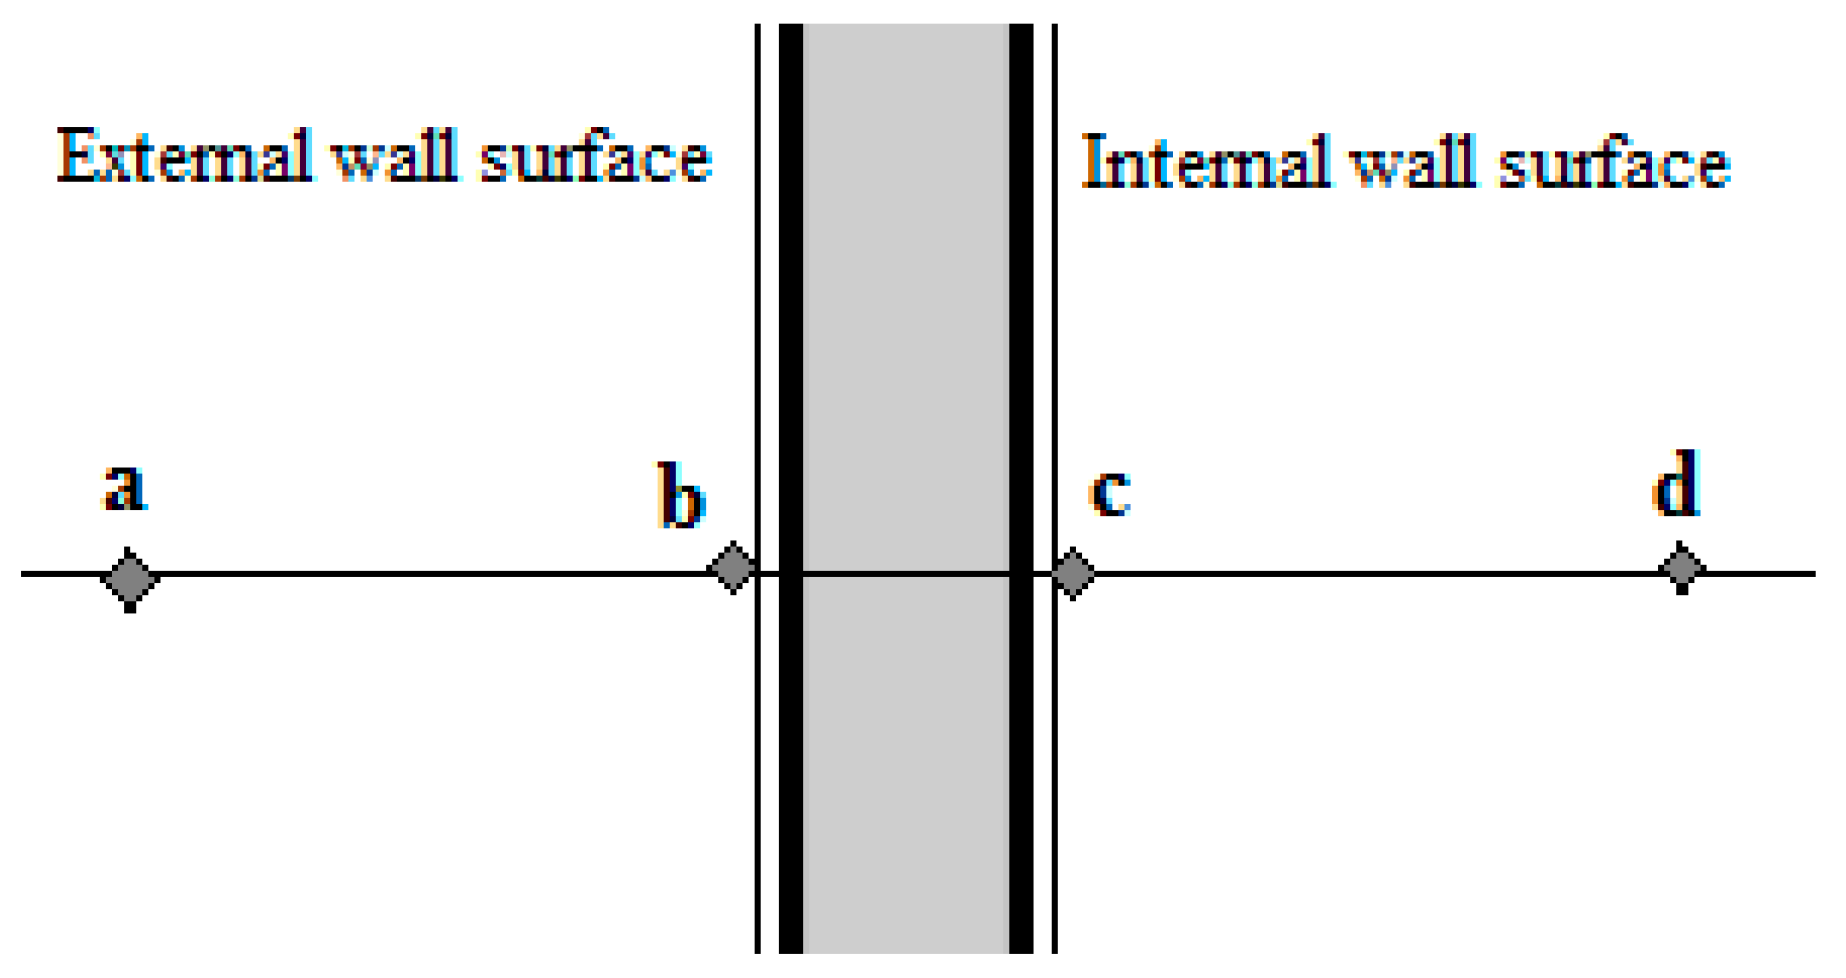
In order to truly represent the prevalent weather conditions, i.e., higher irradiance and higher heat load, and avoid the intervention from occupancy of the houses, the summer holiday season was selected to test unoccupied buildings. The experiments were conducted from the end of June to mid-August to study the impact of plantation as heat insulators in extreme hot weather and determine the resulting cooling effect indoors in residential spaces. To determine the temperature regulation effect of plant-shaded wall on indoor spaces; temperatures at four locations were recorded for both façades, using “DaqPRO” Omega data loggers: (a) outdoor ambient air temperature (1 m away from the external wall); (b) external surface temperature; (c) internal surface temperature; and (d) indoor air temperature (1 m inside from the internal wall) as shown in Figure 3. Considering spatial temperature distribution, the temperatures at each side (a–d) were measured at three points separated by a distance of 1 m each, and the average of the three is plotted.
The weather data of solar irradiation, ambient temperature and wind speed were consistently measured with a time steps of 10 min to achieve a uniform profile during the experiments. The accuracies of the measurement set up are provided in Table 1 below.
3. Results and Discussion
3.1. Temperature Decrement and Time Lag
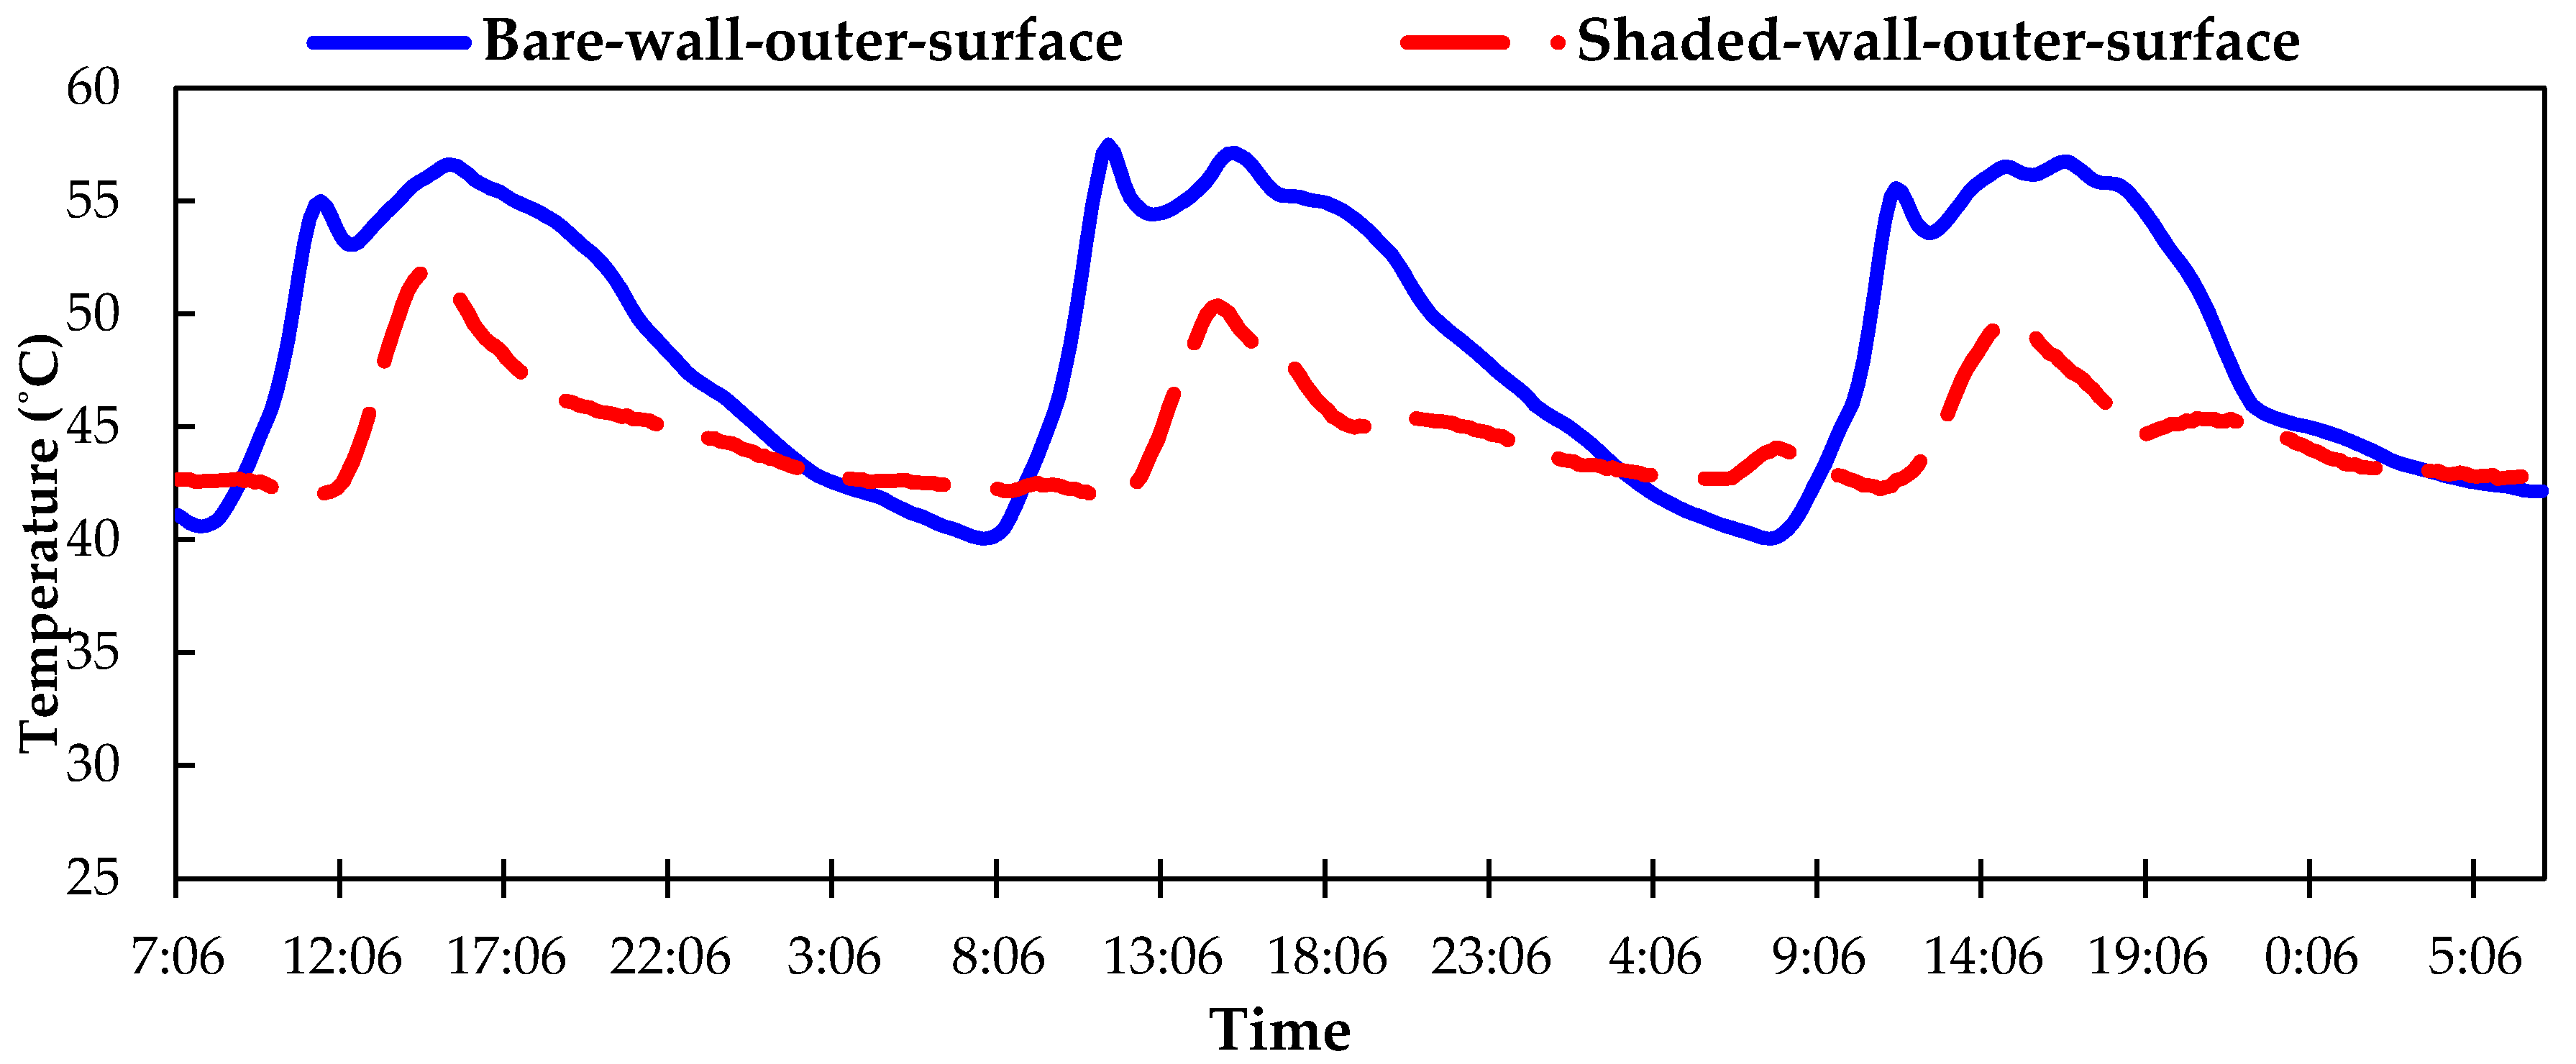
To understand the impact of plants on the heat transfer through the façade into the building, the temperature evolution at the outer surface, inner surface and indoor ambience is presented for three representative days in Figure 4, Figure 5 and Figure 6, respectively. The figures highlight three important outcomes of plants in terms of (1) temperature decrement; (2) time lag to reach peak temperature; and (3) duration of peak temperature. The bare wall (reference) and the plant shaded wall responded to the incoming radiation differently. The radiation reached the bare wall un-interrupted compared to the plant-shaded wall wherein the radiation was partially blocked by the plants.
External surface temperature of the bare wall raised to peak in quick fashion where it stayed a few hours longer compared to the plant-shaded wall during day time for the three presented days in July as shown in Figure 4. It shows that, at peak time, the external surface temperature reached around 56 ± 0.5 °C on most of the first day, while the temperature on the external plant-shaded wall peaked around 51 ± 0.5 °C for the same day showing a decrement of around 5 °C. The external surface of plant-shaded wall reached a peak at 3:30 p.m., while the bare wall reached the same temperature at 11:30 a.m., thus the plant-shaded wall showed a time lag of 4 h. Similarly, the plant-shaded wall remained at 50 °C for 30 min, while the bare wall remained at or above the same temperature for at least 8 h. All the three factors described represent the cooling effect produced by the plant shaded wall. At nighttime, the bare wall showed an increased rate of cooling yielding a lower temperature compared to the plant shaded wall attributed to the heat retention of the plant-shaded wall. A similar behavior can be observed for rest of the two days presented.
The reduced external surface temperature on the shaded wall naturally resulted in a reduction of the internal wall surface temperature compared to the internal wall surface temperature of bare wall shown in Figure 5. The internal surface temperature of the bare wall peaked at 50 ± 0.5 °C, while that of the plant-shaded wall peaked at 47 ± 0.5 °C for the same day, showing a drop of 3 °C. Similarly, the temperature increased on the plant-shaded wall with a time delay, when compared to the bare wall. The bare wall again remained at or above the maximum temperature achieved by the plant-shaded wall for at least 6 h from 2 p.m. to 8 p.m. A similar behavior can be observed for the rest of the two days presented.
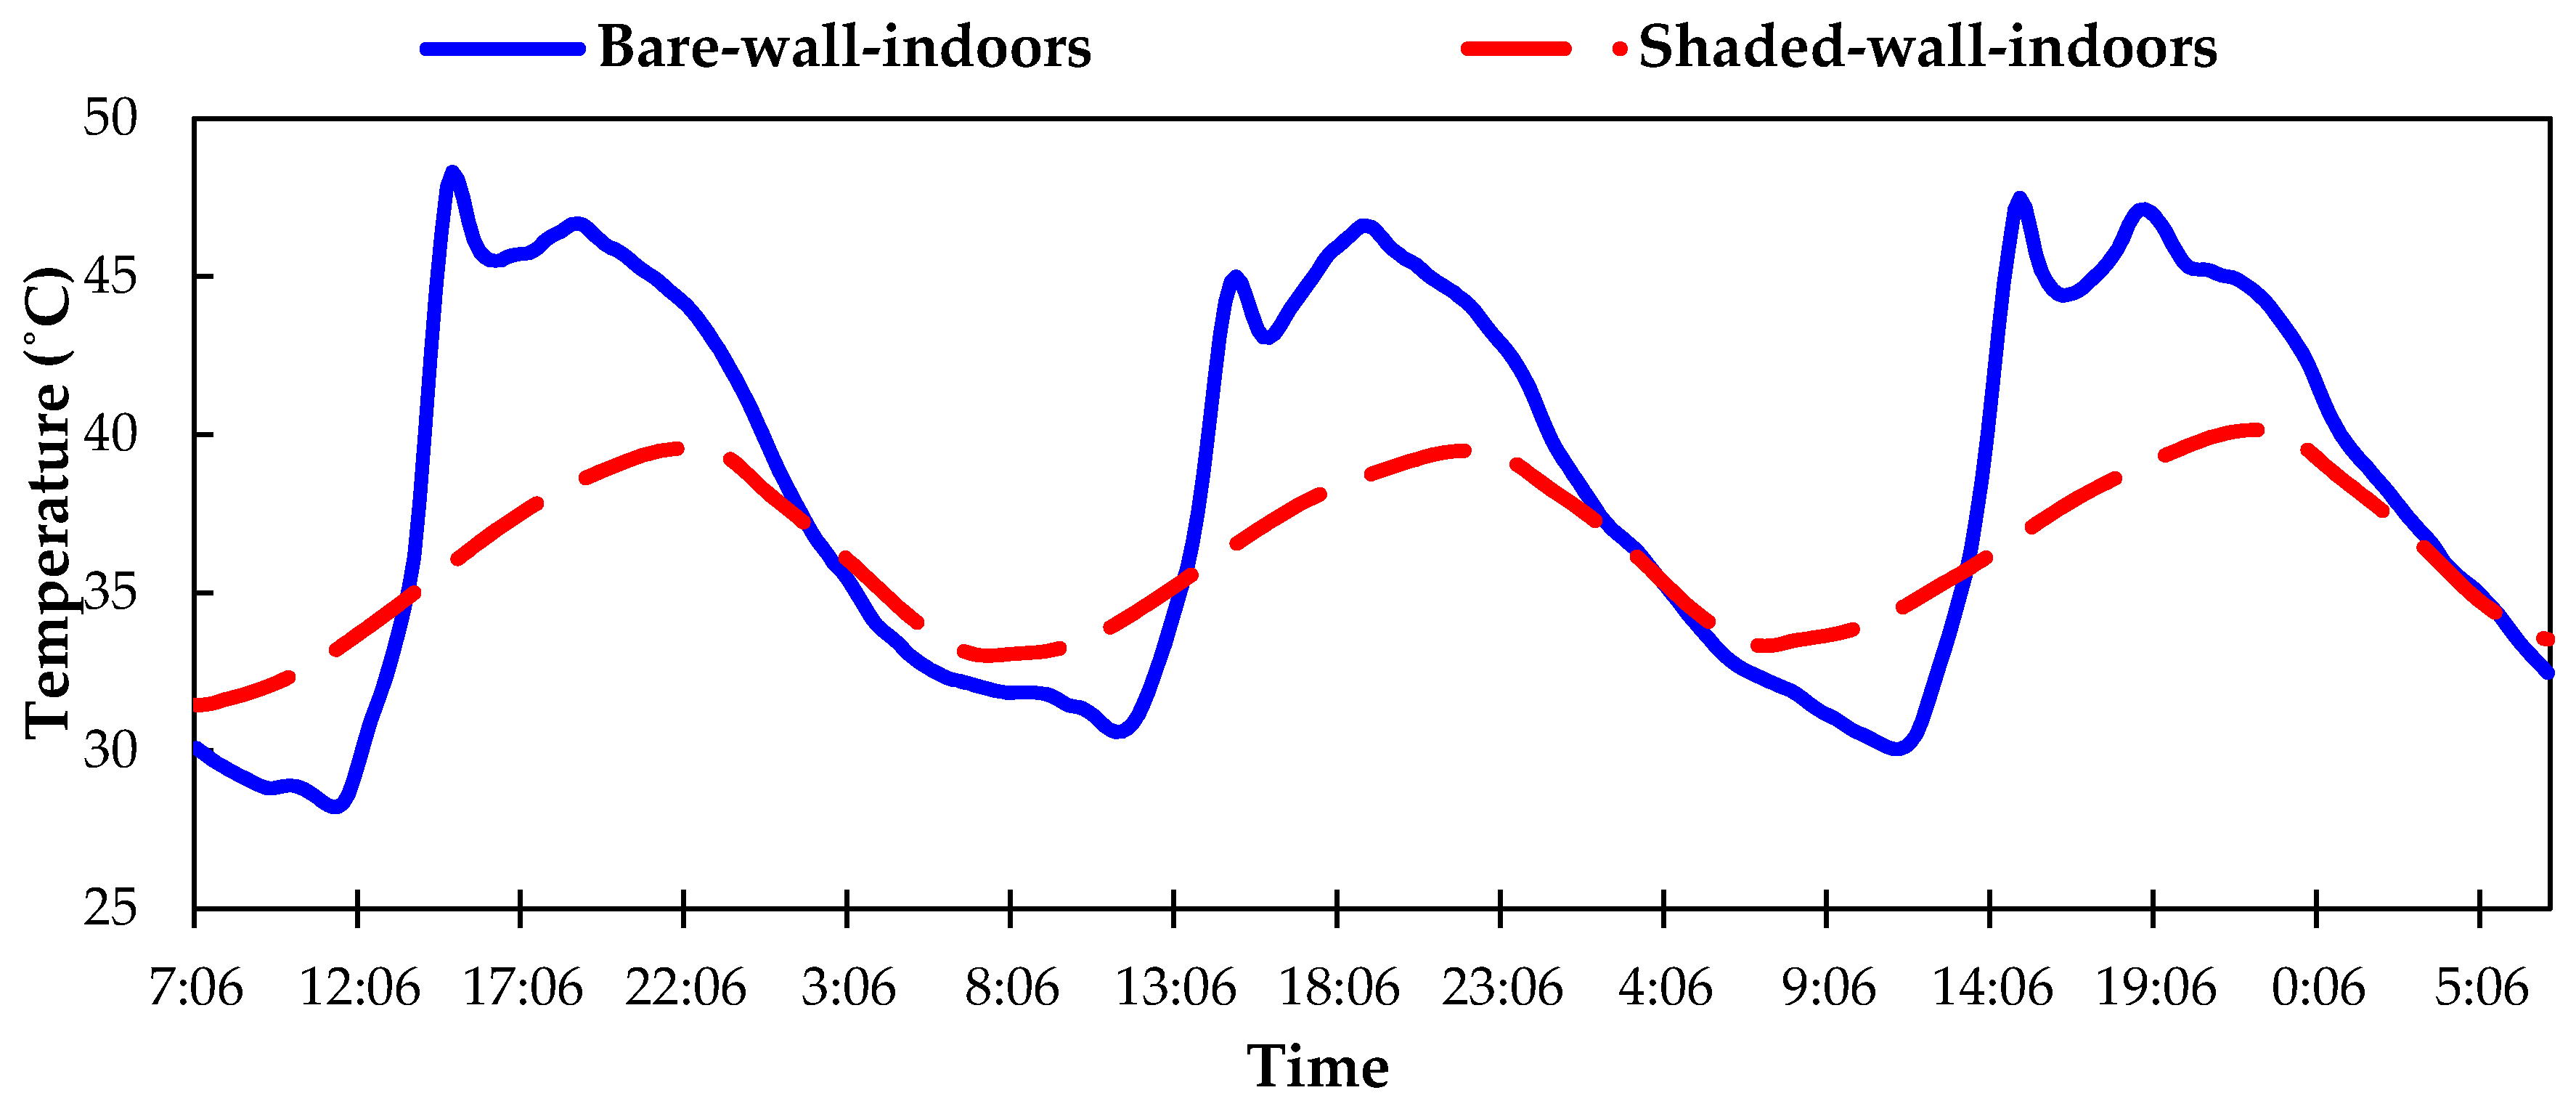
As shown in Figure 6, the indoor air temperature in the case of plant-shaded walls always showed a decrement, time lag and reduced duration of peak temperature compared to that of bare wall confirming the cooling effect produced by the plants. The peak indoor air temperature in the case of bare wall reached 47 °C, while that of the plant-shaded wall reached 39 °C, showing a drop of 8 °C. A very important finding is that the indoor temperature reached its peak very late in the evening, at 8 p.m., compared to that of bare wall at 2 p.m., showing a time lag of 6 h. A similar behavior can be observed for the rest of the two days presented. At nighttime, indoor air in the bare wall showed an increased rate of cooling, yielding a lower temperature compared to the plant shaded wall attributed to the heat retention of the plant shaded wall.
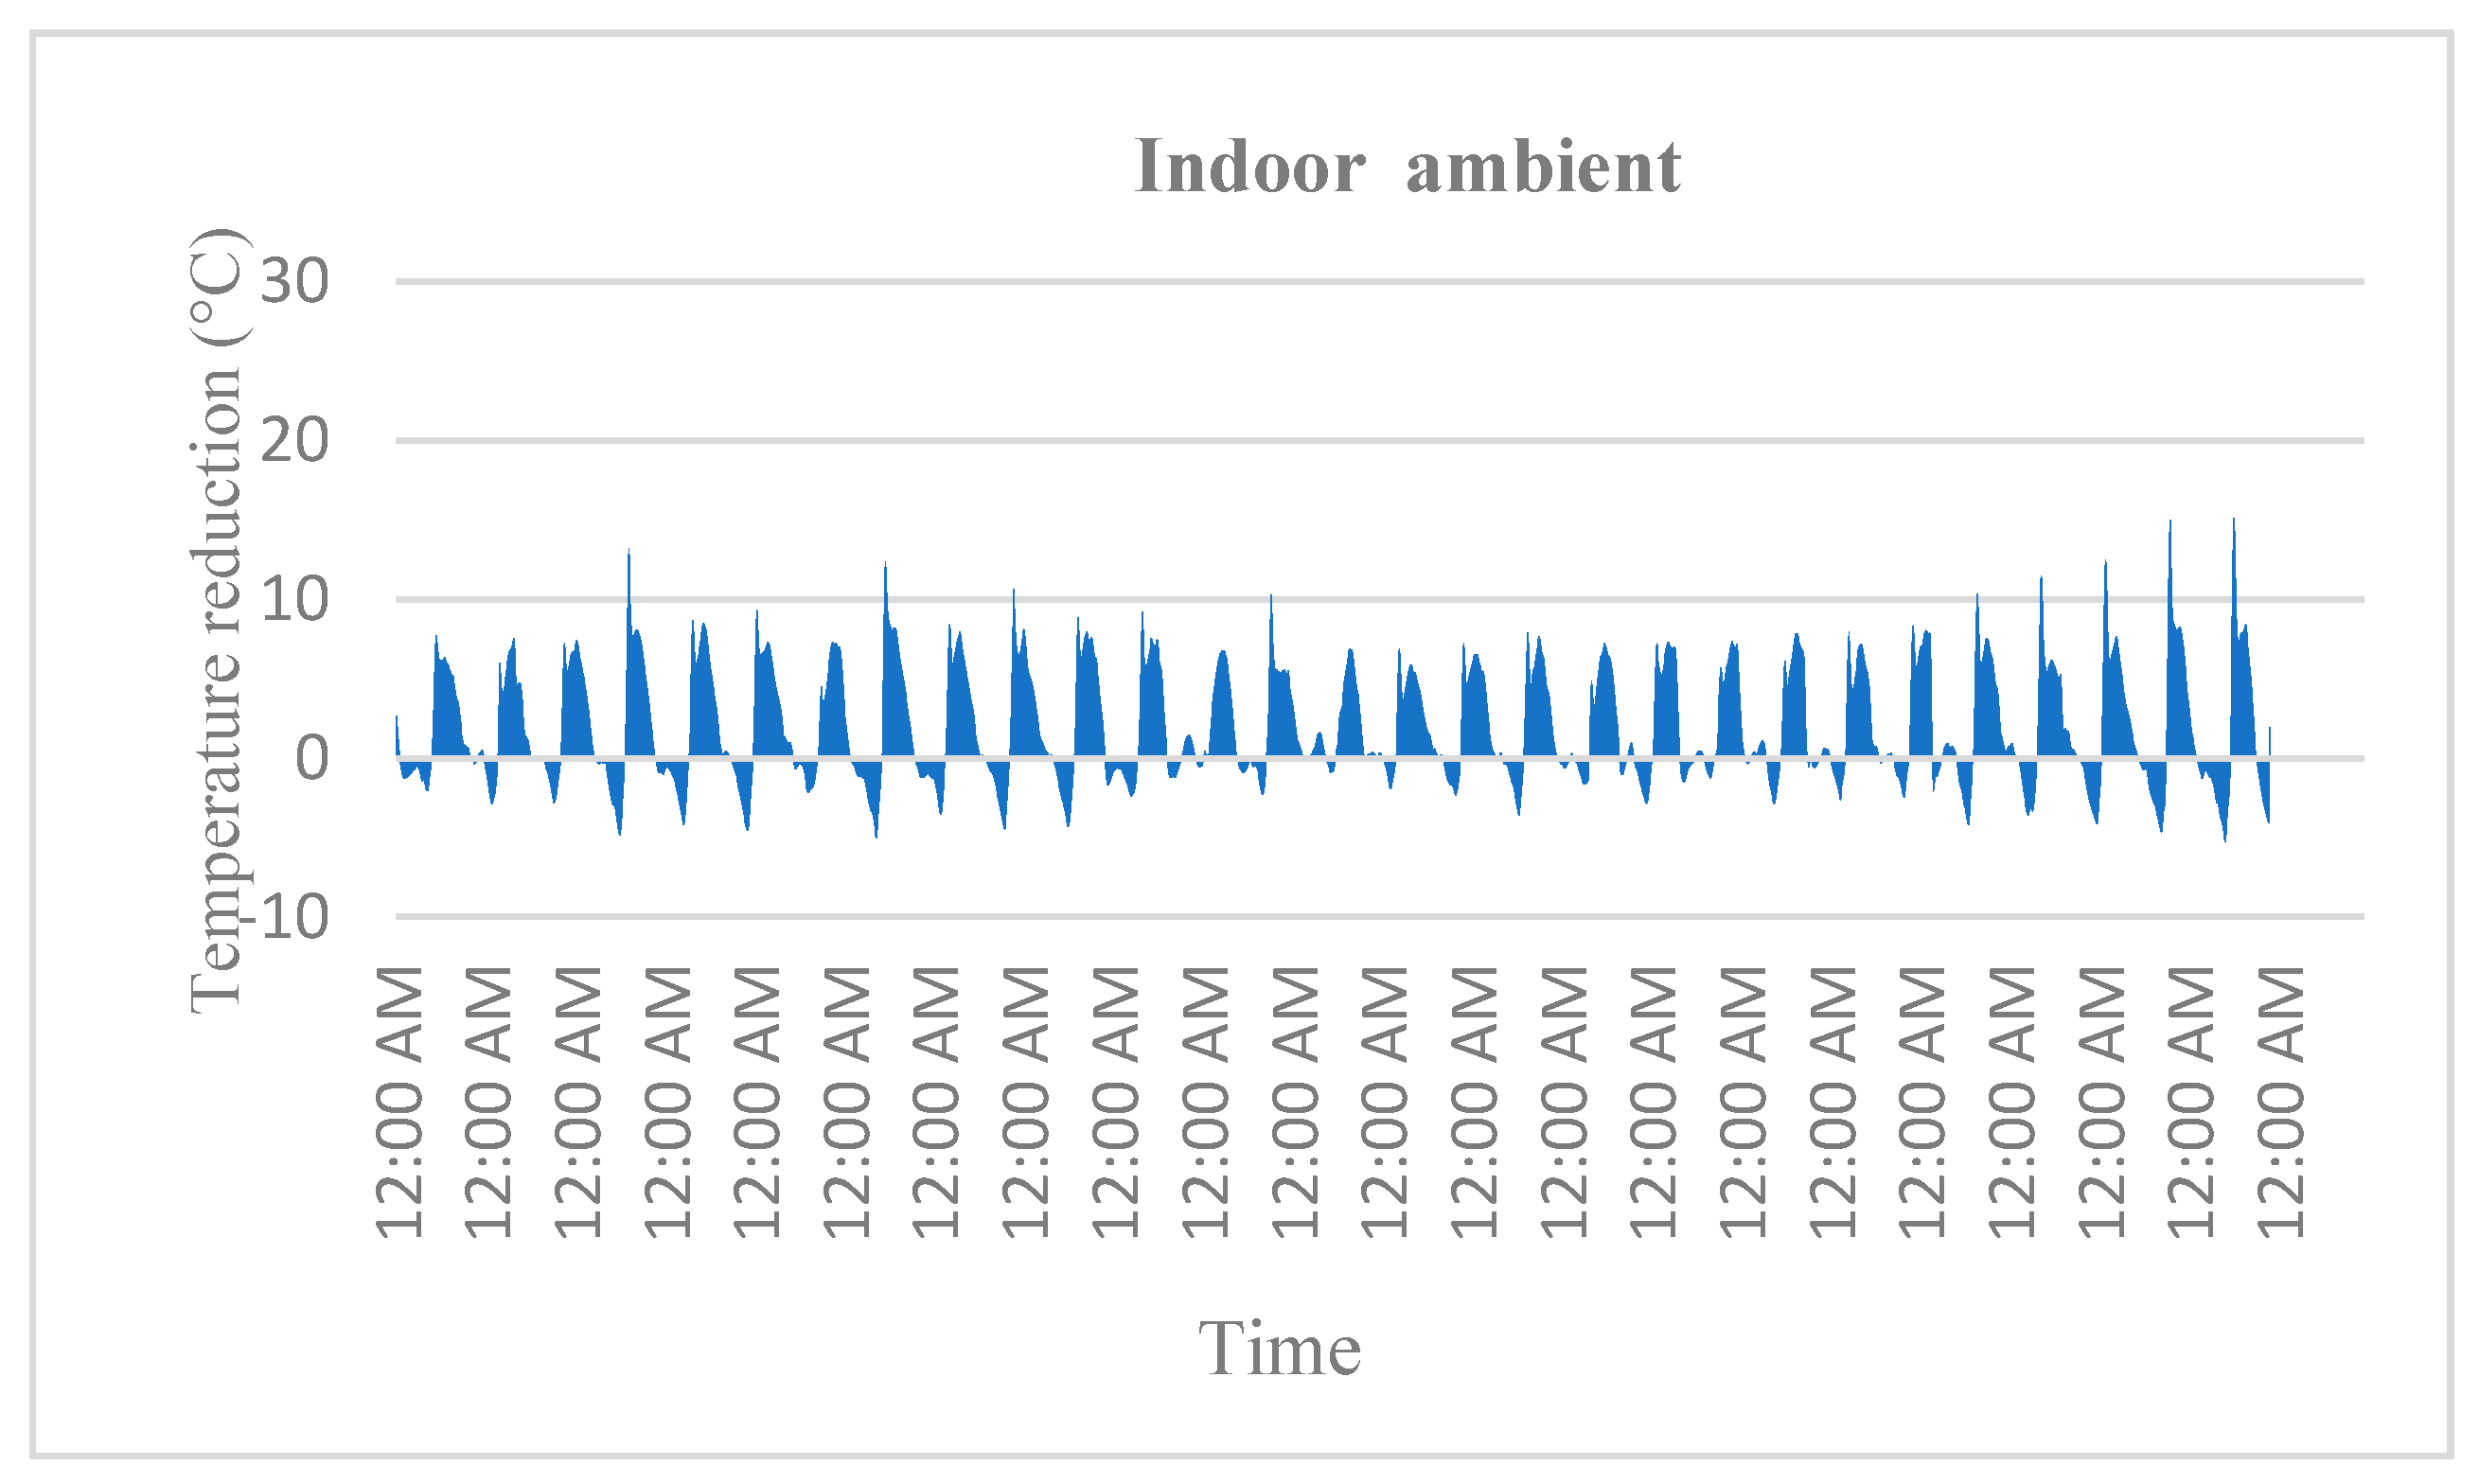
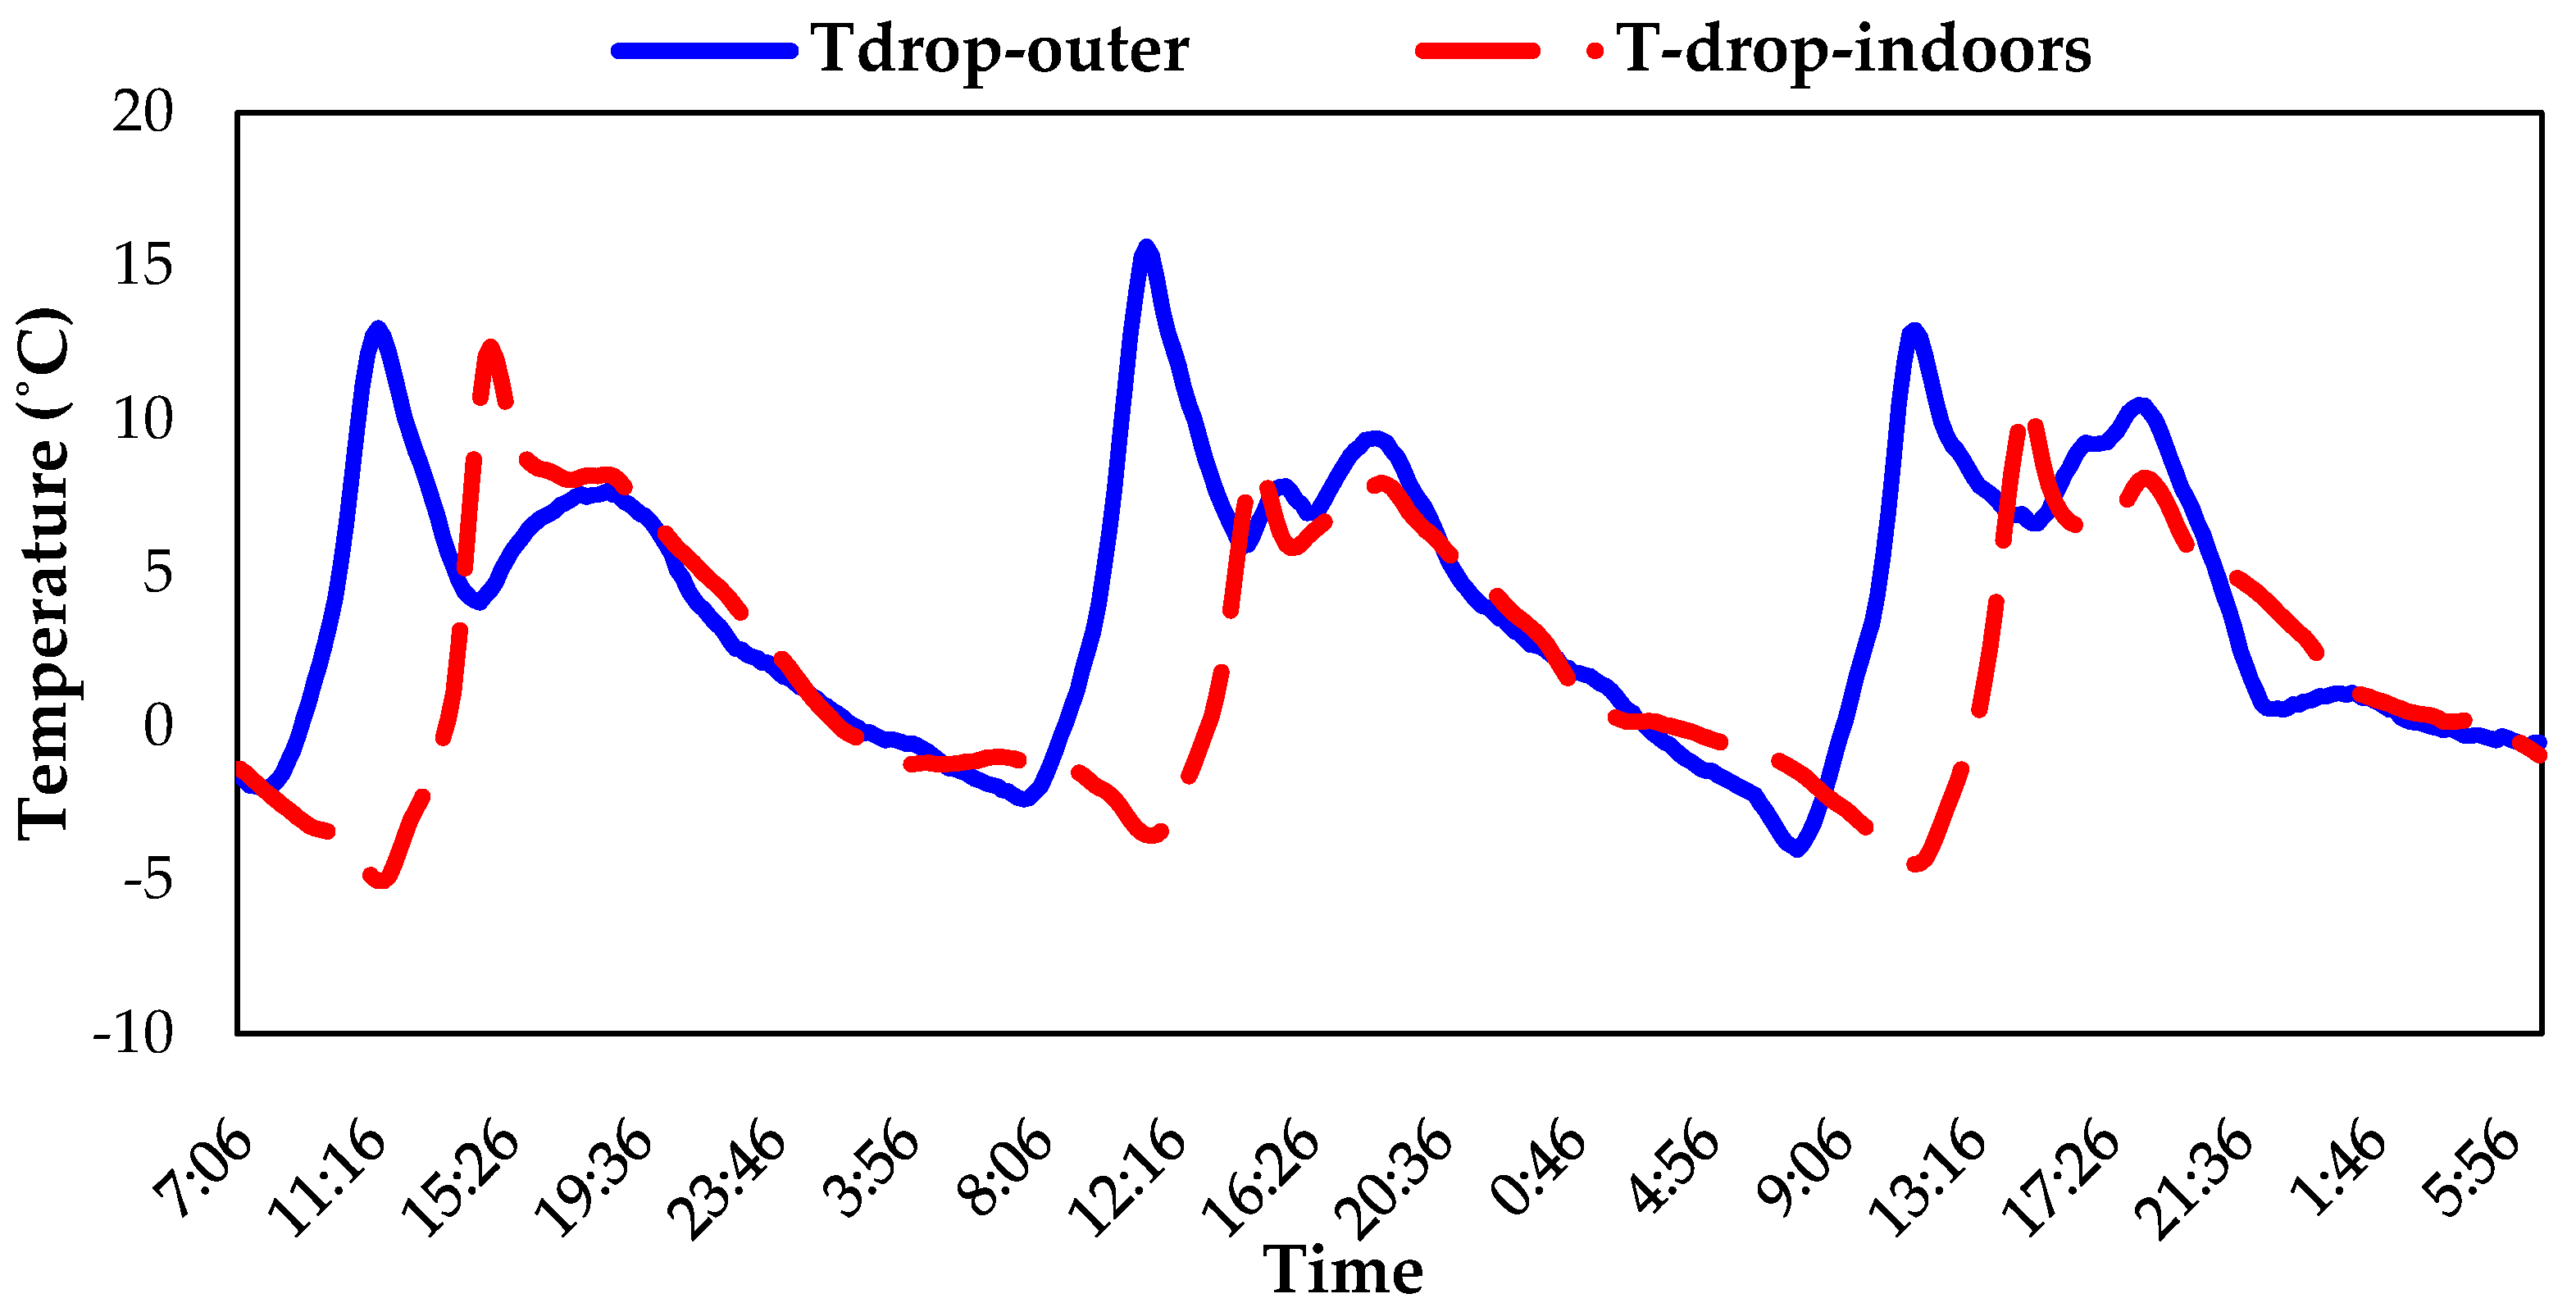
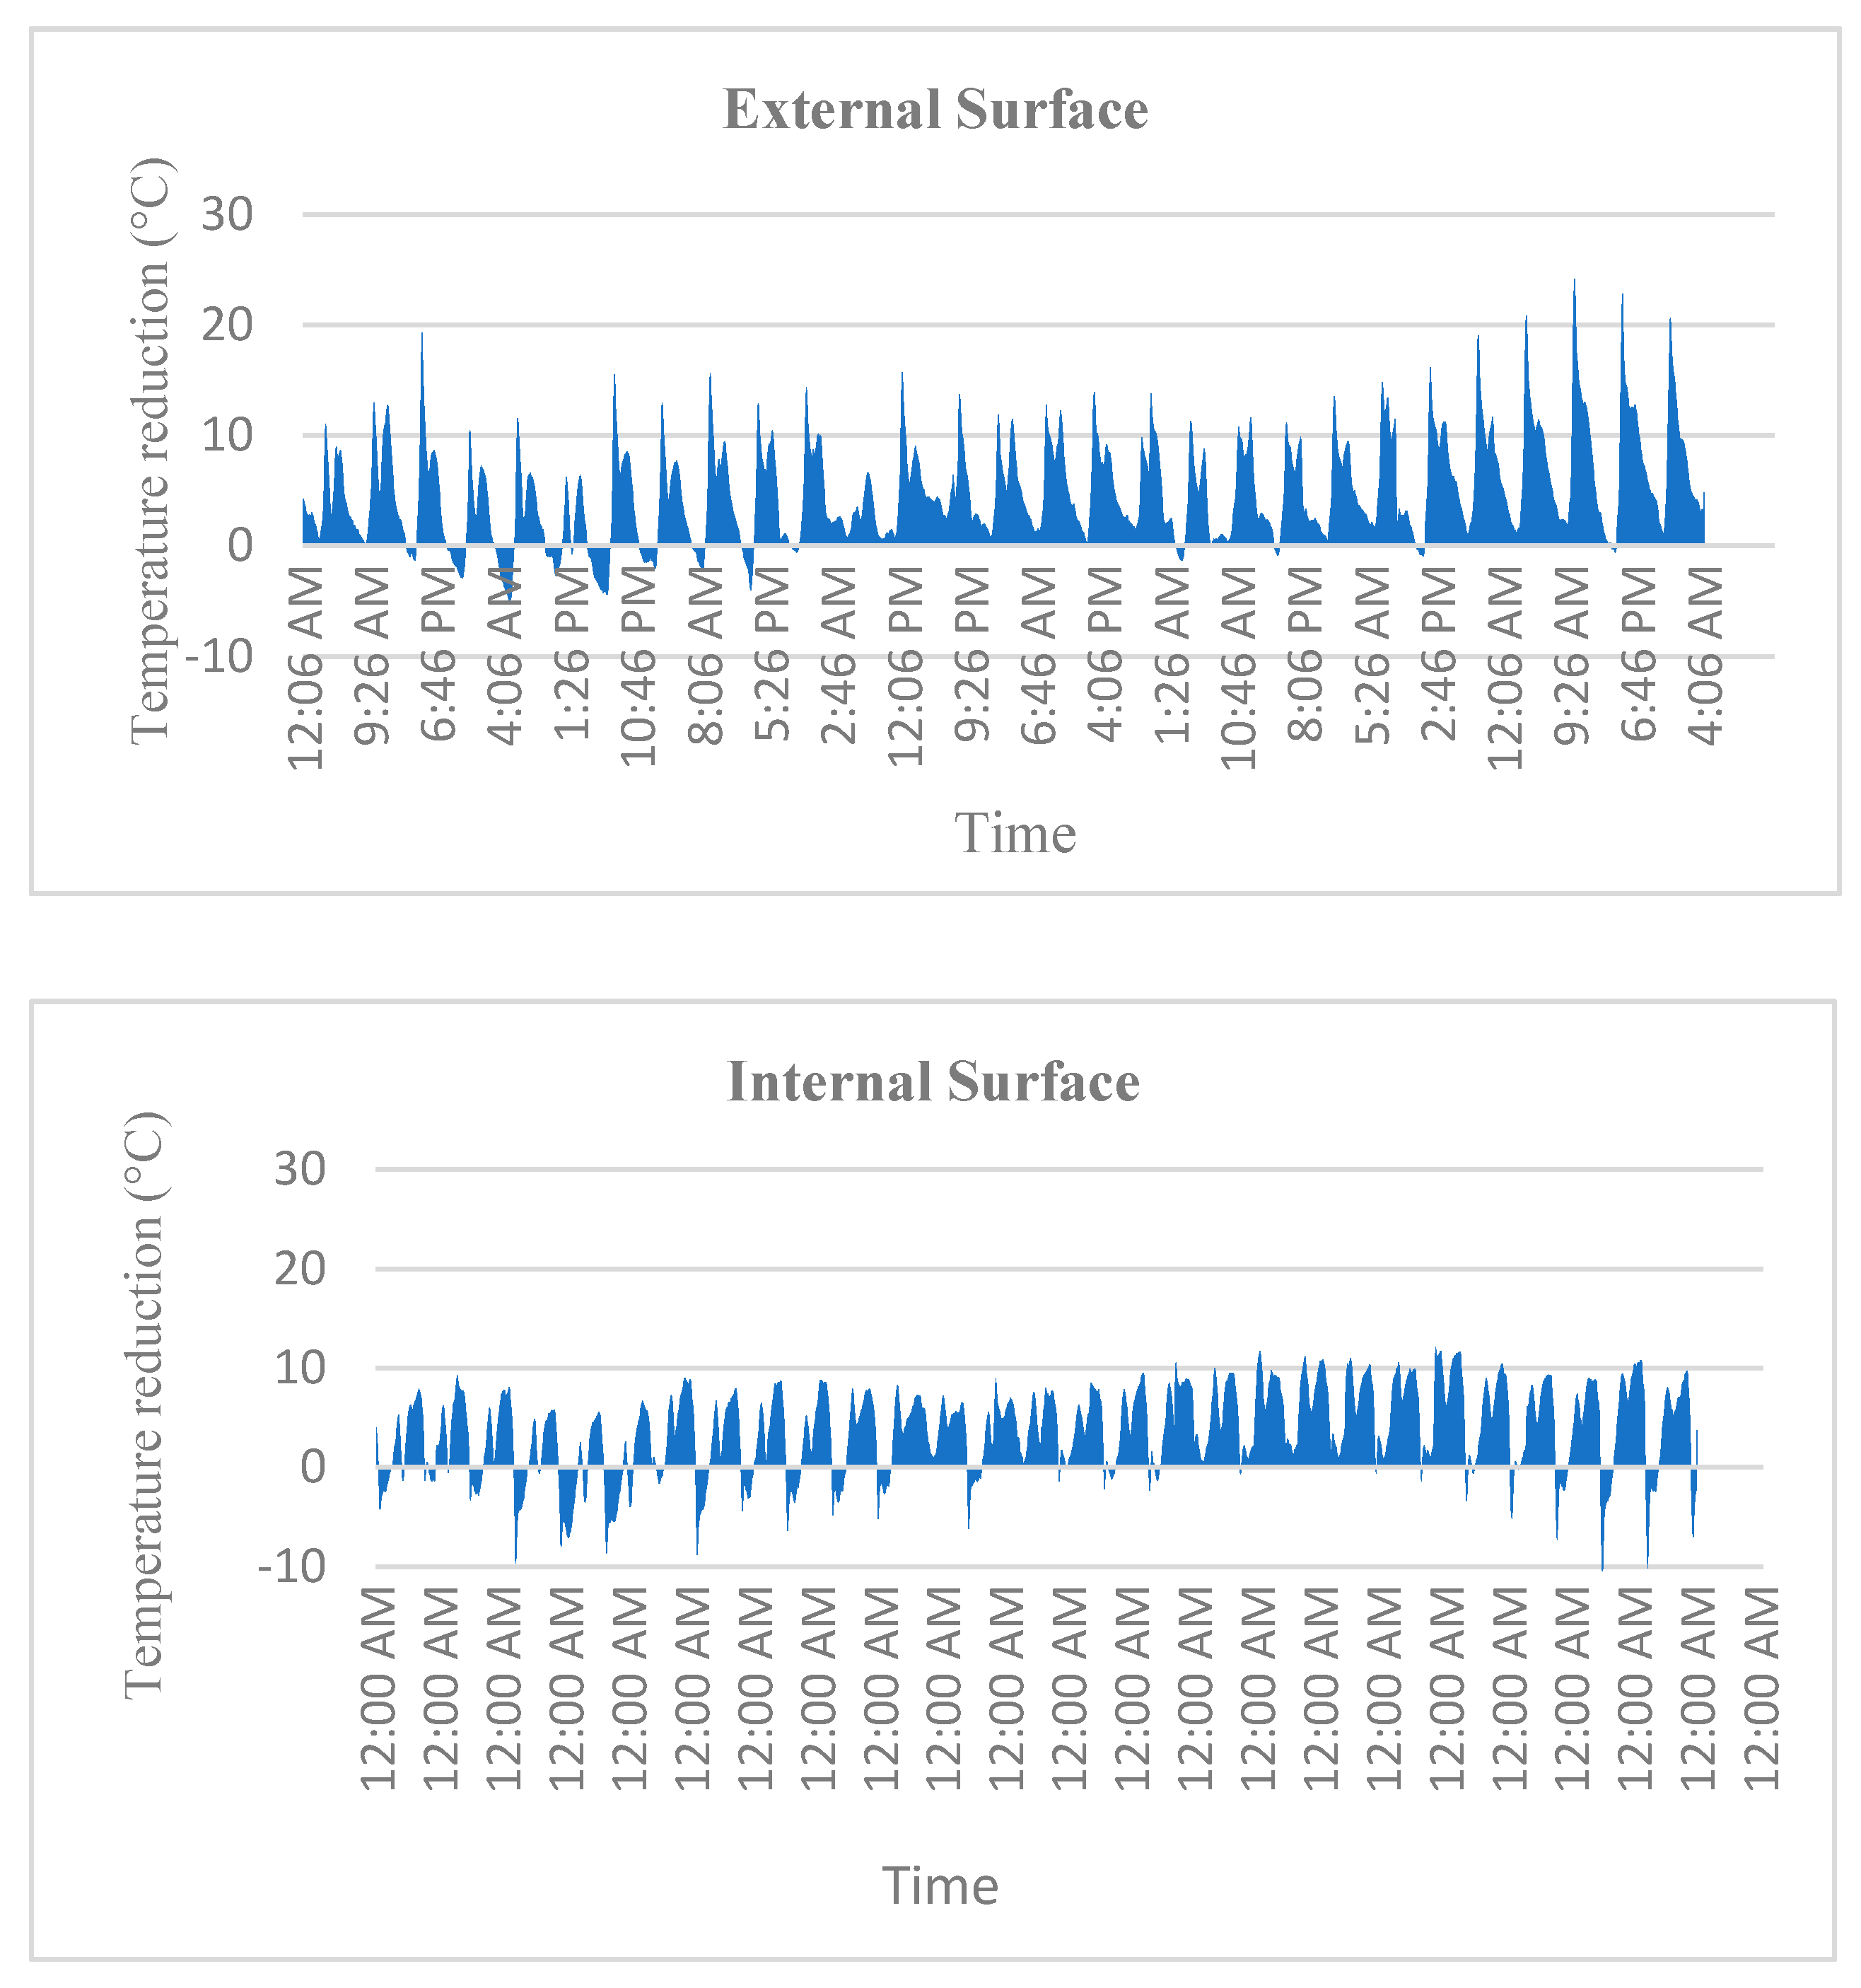
Figure 7 shows the temperature drop achieved at any time at the front surface and the indoors by the plant-shaded wall. The peak temperature drop was observed at about 11:00 a.m. at the outer surface with the values in the range of 12–14 °C, which is slightly higher than the maximum temperature drop of 9 °C reported in the weather condition of Australia [11] primarily due to summer in UAE being stronger than that in Australia, contributing to better shading performance. The peak indoors temperature dropped by 10–12 °C which is higher than the temperature drop of 5 °C achieved by green wall in the same climatic [16]. The reason can be that the trees acts as a wider buffer between radiation in facades and retard heat through natural heat dissipation into ambience, while in case of green wall, the façade is in intimate contact with the plantation that reduces heat dissipation in the ambient. The temperature drop of 3.5 °C on outer wall and 2 °C on indoor ambient was achieved, which is slightly higher than the ambient temperature drop of 1 °C reported in Australian summer, due to difference of intensity of the summer [11]. The temperature drop achieved by the plant-shaded wall over a long period of time is shown in the Appendix A, which reveals that the plant-shaded wall consistently achieved a similar temperature drop over an extended time in summer.
Despite the fact that the indoor ambient temperature of the plant-shaded façade is lower, the indoor air temperature still did not reach the comfortable temperature of 26–28 °C. This means that, in such a hot climate, the use of plant-shaded walls alone will not be enough, and mechanical cooling systems would be necessary to produce a comfortable indoor climate. The main benefit of using plant-shaded walls, however, comes from the energy savings and the reduced peak air conditioning demand.
3.2. Heating Prevention
The temperature drop achieved by the shaded wall at the interior surface eventually transmitted less heat to indoors compared to the bare wall. The heat transmitted indoors (Q) is calculated by applying combined convection and radiation heat loss (U) represented by Equation (1). The U value is represented by U = 5.9 + 3.4 v in the air velocity (v) at 0.5 m·s−1 [27].
where A is the surface area of the internal wall contributing to heat release (12 m2), Tsurf is the internal surface temperature, Tair is the internal air temperature and i is time step being i = 1, 2, 3, …, n. The transient heat transmitted at any time step is presented in the Figure 8. Predominantly, the bare wall transmits heat from the wall to indoors (heat gain-positive value), while it only transmits from indoors to wall (heat loss-negative value) late at night for a short time. In case of the plant-shaded wall, the heat transmission is always in the positive direction representing heat gain by the building. It also highlights that the plant cover acts as a heat barrier to leave outdoors at night time, which can be exploited in the moderate winter season to eliminate the meagre heating load in Al-Ain. The heat transmitted by each interior wall is monotonic with the cooling load of the building, considering that both tested spaces apply the same cooling and ventilation system.
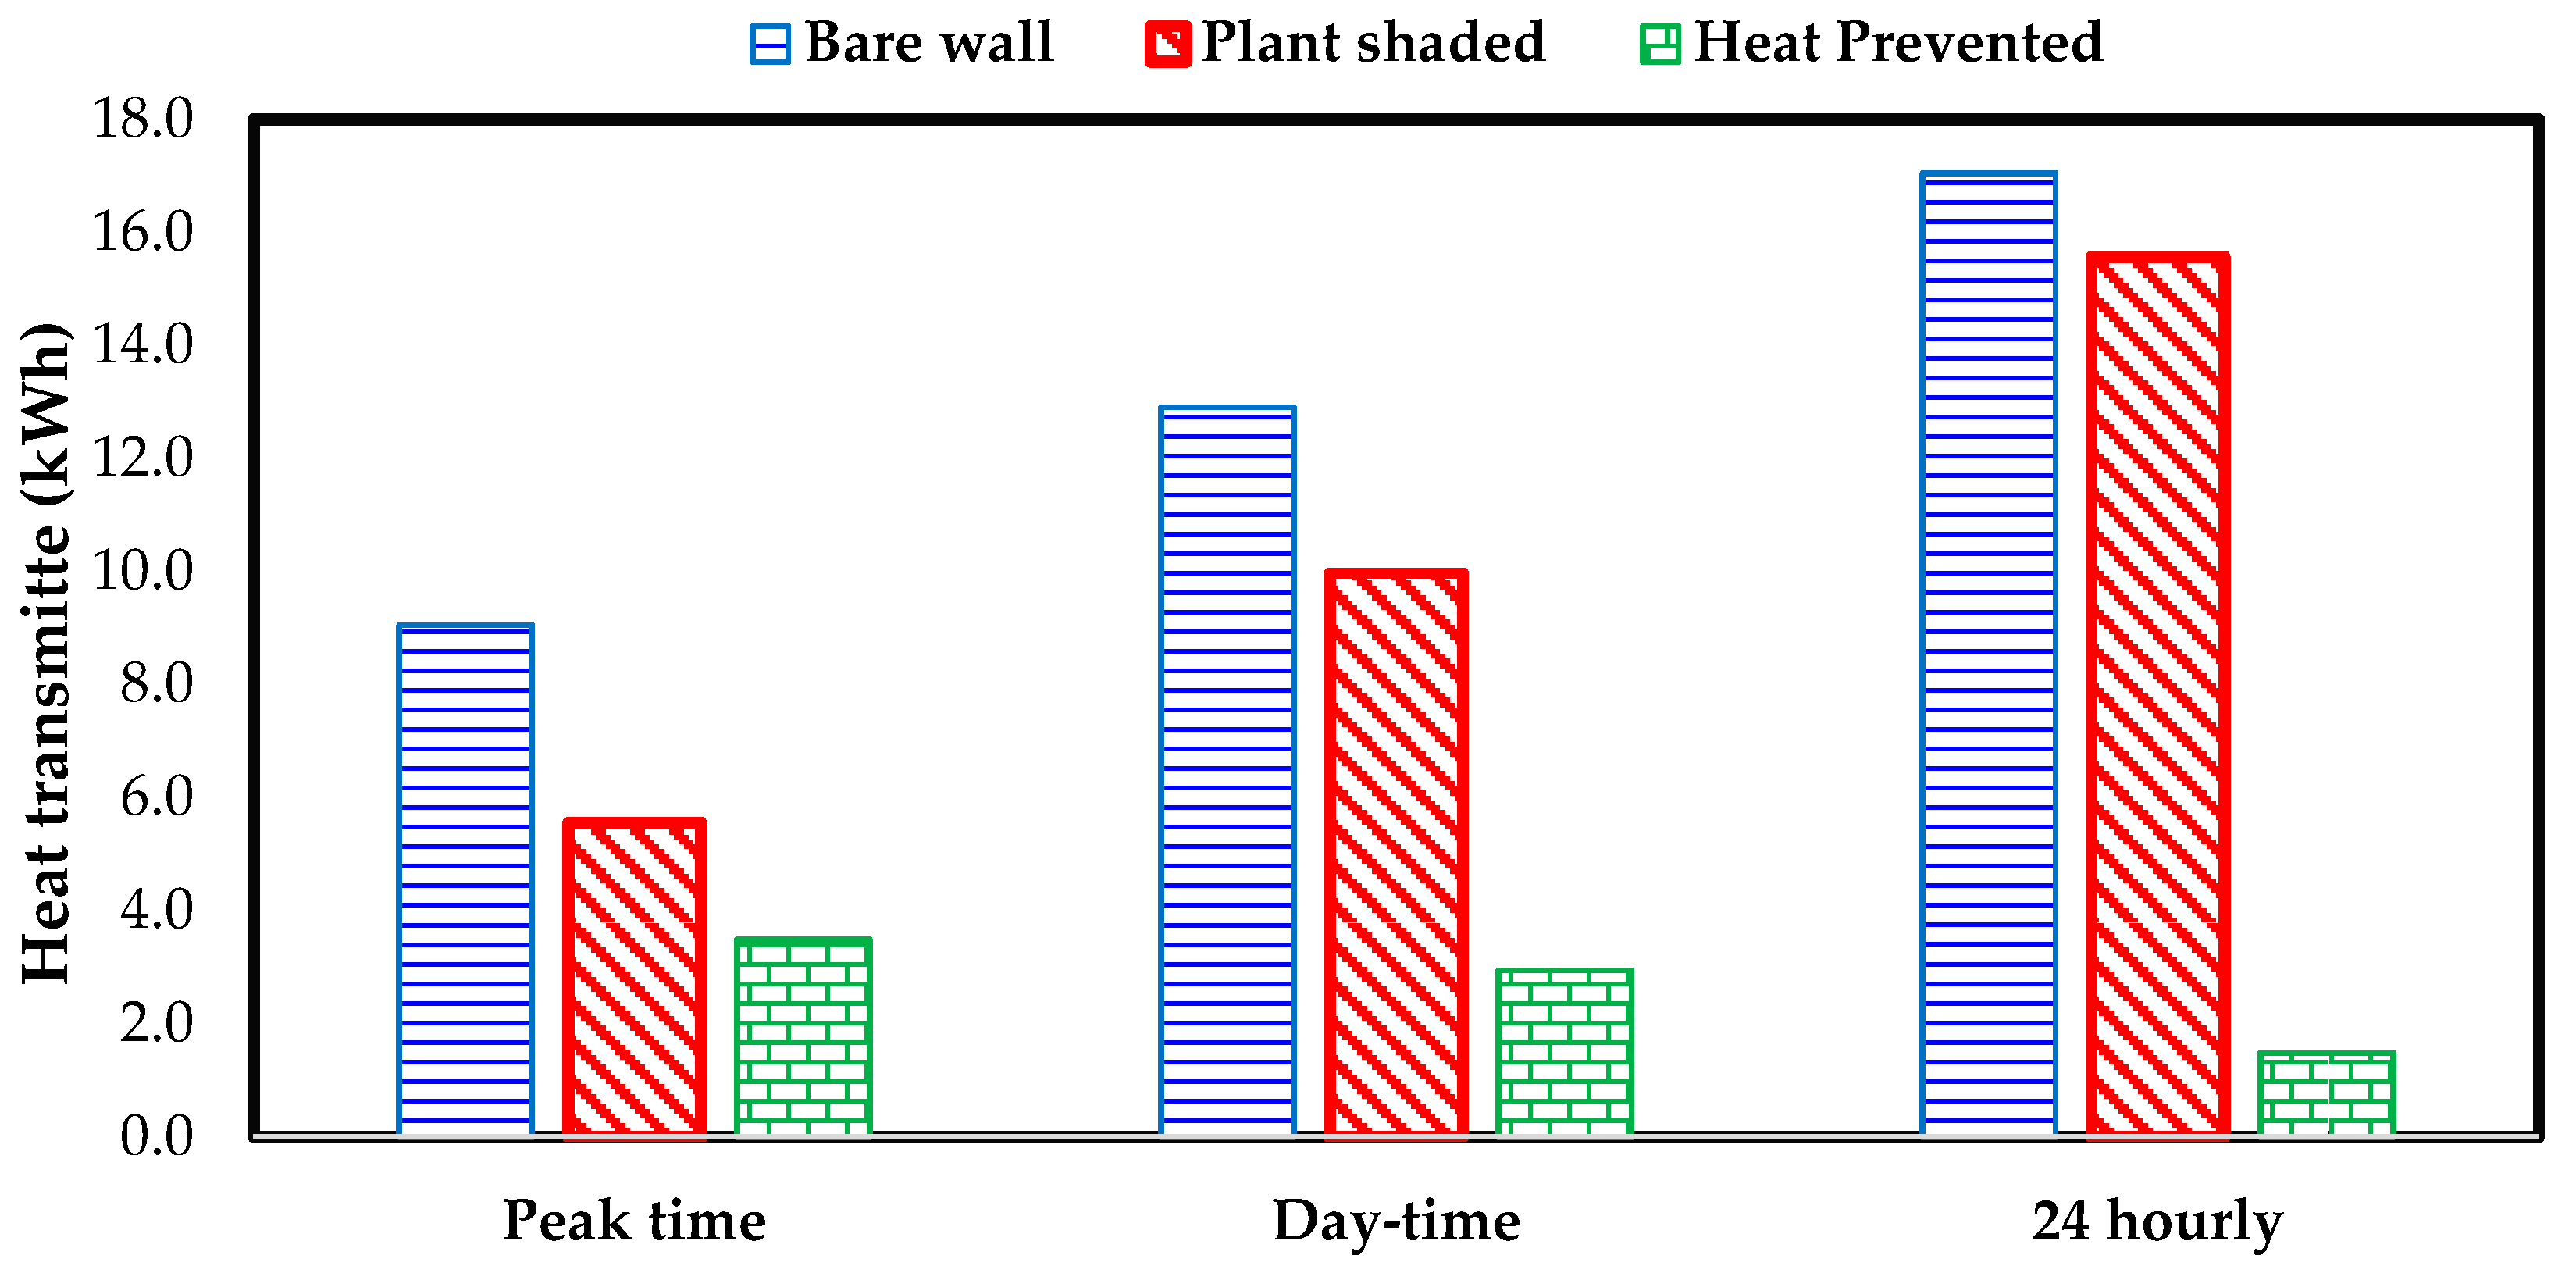
The difference of heat transmitted by bare wall and plant-shaded wall can be considered as cooling load capacity savings. The peak cooling capacity required by the bare wall reached 1.7 kW, which was reduced to 1.3 kW in the case of the plant-shaded wall. Since both the spaces have the same type of air conditioning system installed, net heat gain in certain duration of time can be regarded as cooling demand of the building. The net cooling demand is calculated for three different time frames, i.e., morning till peak time (2 p.m.), day time only (7 p.m.), and on 24 hourly basis, as shown in Figure 9. The plant-shaded wall always demanded less cooling compared to the bare wall, thus saving cooling load. Cooling load saved by the plant-shaded wall till the peak time was 3.5 kWh, which was reduced to 2.9 kWh on the day time basis and 1.5 kWh on the 24 h basis. Since the cooling demand season prevails from March to October in Al-Ain, cooling demand savings per year can be extrapolated by multiplying the daily saving by 245 cooling days, resulting in 367 kWh/year, which is much higher than the reported values of 44 kWh in Metro Orlando, FL [14,15] predominantly due to hot summer condition sin UAE.
4. Cost Benefit Analysis
Several studies have proved the economic incentives of these green techniques. However, the main question that should be asked here is “are vegetated and plant-shaded greenery systems economically sustainable in the local context?” To answer this question, the study investigates a cost-benefit Analysis of the plant-shaded facade of the case study, considering personal economic benefits as well as the life span of the building skin. As described by Perini and Rosasco, personal economic benefits are directly related to energy saving for air conditioning, improvement of real estate value, and durability of building façades [28]. At this stage, the environmental benefits of air quality improvement, carbon reduction, climate and biodiversity improvements, habitat creation, sound control and urban heat island are not included.
Initial and installation costs, maintenance and running costs of the plant-shaded building façade are considered in the study and compared mainly with cooling load reduction and property value addition. Installation costs of the plant-shaded façade were obtained from product firms and companies available in the UAE. The initial and installation costs cover plants and growing media, irrigation system and water for irrigation. As shown in Table 2, the initial cost of the analyzed greenery system was 20 US$/m2, while the installation costs reached 11 US$/m2. Irrigation using a PVC pipe network and automatic control system costs 4.6 US$/m2 and the local cost of used water was 3.4 US$/m2.
Maintenance and running costs depend mainly on the type of greenery system. Plant-shaded façade requires low maintenance in comparison with direct and indirect vertical greening systems. For plant-shaded façade, maintenance covers mainly plant pruning and can be carried out every year. For indirect greening systems combined with planter boxes, maintenance also covers water pipe replacement and plant species substitution. For living wall systems, plant replacement, removal, and transport to landfill was added to the maintenance costs [28,29]. Façade cladding renovation can be added to the maintenance cost [28]; however, it is not included in this analysis due to its variation and life cycle.
By reducing the surface temperature of a building façade and using appropriate insulation techniques, such as water proof wall panels, vegetated and plant-shaded wall techniques can protect building surfaces and extend the lifespan of the building skin [16]. This protection comes mainly from keeping rain off the building while allow moisture to escape, reducing the expansion and contraction of building materials and protecting walls against wind and solar radiation, which might affect building materials. The use of plantation on and around the building façade reduces the frequency of the maintenance service of building skin, depending on the quality of wall surface cladding, and the environmental condition. It was estimated that without vegetation, the renovation frequency of the building façade varies between 25 and 35 years. However, the use of plantation lengthens the coating lifetime of 15 years [28].
The economic performance of the plant-shaded façade is generally calculated by the mean of three indicators [28]: the Net Present Value (the discounted value of the total costs and benefits that occur within the period of life considered); the Internal Rate of Return (the annual percentage rate of return on investment; and Payback Period (the number of years from which the total revenue equals or exceeds the total costs). The present study employs payback period through energy savings and increased rental value included as benefit while ignoring the environmental benefits and inflation rates at this stage.
A living space of the housing, combined with an average façade area of 12 m2 was tested and the total cost was calculated as shown below and summarized in Table 2.
The benefit of plant-shaded wall is also calculated through the energy savings achieved by reduced cooling load and increased rental rate.
Cooling load reduction = 370 kWh/year
Average yearly rent for the tested space with the extra external green area = 3500 US$
Increased rental rate = 4%
1/4th of the façade is plant shaded so the increment applies to 25% of the rent.
Added property value of tested space due to greening = 0.04 × 3500 × 0.25 = 35 US$
Local cost of electricity = 320 AED/MWh = 87.12 US$/MWh
Energy cost savings = 87.12 × 0.37 = 32.23 US$/year
Total savings = saving on rental + energy cost saving = 35 + 32.23 = 67.23 US$/year
Payback period = 696/67.23 = approx. 10 years
As shown in Table 2, the plant-shaded wall system is economically sustainable with a payback period of 10 years. The payback period employs unsubsidized local electricity rate. The most favorable economic conditions take place when the payback period is low. In comparison with other greenery techniques, where the payback periods are usually higher than 10 years, e.g., 14–20 years for indirect green façade combined with planter boxes and steel mesh [28,30]. The authors expect to achieve a reduced payback period once the social and environmental benefits are included as subject of future study to make the use of greening systems financially viable.
5. Conclusions
The use of vegetation on and around building façades has gained increasing popularity in many cities for improving thermal performance in buildings and reducing negative environmental impacts. Plant-shaded wall technique was tested in Al-Ain, the Garden City, to increase energy efficiency and reduce cooling load in residential buildings. The study finds that plant-shaded façades can reduce the yearly cooling energy by up to 0.37 MWh compared to the unshaded façades. An indoor temperature reduction of 12 °C at the peak time and 2 °C on average on a 24-h basis was achieved in the month of July. The decreased temperature was achieved by the shading and insulation effect of low-conductivity plant foliage that rendered less thermal energy gain eventually reducing cooling demand of the building. The economic analysis reveals that the payback period of plant-shaded greenery system was 10 years, in the case of unsubsidized energy tariffs. A further reduction of the payback period is expected once the environmental savings are included, which is a subject for future study.
Acknowledgments
The authors would like to express their appreciations to the College of Engineering at the UAE University for funding this research project.
Author Contributions
Mahmoud Haggag envisioned the idea; Ahmed Hassan and Mahmoud Haggag conducted the experiments; Ahmed Hassan analyzed the results; and Ghulam Qadir collected the literature survey. The paper was written as a joint effort.
Conflicts of Interest
The Authors confirm no conflict of interest.
Appendix A
Figure A1.
Temperature reductions (°C) in external surface, internal surface & ambient temperature.

References
- Pacheco, R.; Ordónez, J.; Martínez, G. Energy efficient design of building: A review. Renew. Sustain. Energy Rev. 2012, 16, 3559–3573. [Google Scholar] [CrossRef]
- Yao, J.; Zheng, R.Y. Determining a practically optimal overhang depth for south facing windows in hot summer and cold winter zone. Open House Int. 2017, 42, 89–95. [Google Scholar]
- Yao, J. Effect of a novel internal roller shading system on energy performance. J. Green Build. 2014, 9, 125–145. [Google Scholar] [CrossRef]
- Sassi, P. Strategies for Sustainable Architecture; Francis & Taylor: New York, NY, USA, 2006; ISBN 10 0-203-48010-4 (ebk). [Google Scholar]
- Shahidan, M.F.; Shariff, M.K.; Jones, P.; Salleh, E.; Abdullah, A.M. A comparison of Mesua ferrea L. and Hura crepitans L. for shade creation and radiation. Landsc. Urban Plan. 2010, 97, 168–181. [Google Scholar] [CrossRef]
- Berry, R.; Livesley, S.J.; Ayeb, L. Tree canopy shade impacts on solar irradiance received by building. Build. Environ. 2013, 69, 91–100. [Google Scholar] [CrossRef]
- Eumorfopoulou, E.A.; Kontoleon, K. Experimental approach to the contribution of plant-covered walls to the thermal behaviour of building envelopes. Build. Environ. 2009, 44, 1024–1038. [Google Scholar] [CrossRef]
- Hes, D.; Dawkins, A.; Jensen, C.; Aye, L. A Modelling Method to Assess the Effect of Tree Shading for Building Performance Simuation. In Proceedings of the International Building Performance Simulation Association, Sydney, Australia, 14–16 November 2016. [Google Scholar]
- Mc Pherson, E.G.; Simpson, J.R. Potential energy savings in buildings by an urban tree planting programme in California. Urban For. Urban Green. 2003, 2, 73–86. [Google Scholar] [CrossRef]
- Akbari, H. Shade trees reduce building energy use and CO2 emissions from power plants. Environ. Pollut. 2002, 116, 119–126. [Google Scholar] [CrossRef]
- Abdul Aziz, D.M. Effects of Tree Shading on Building’s Energy Consumption. J. Archit. Eng. Technol. 2014, 3, 135. [Google Scholar] [CrossRef]
- Weather and Climate. Average Monthly Weather in Amman. Available online: https://weather-and-climate.com/average-monthly-Rainfall-Temperature-Sunshine,Amman,Jordan (accessed on 18 October 2017).
- U.S Climate Data. Available online: https://www.usclimatedata.com/ (accessed on 17 October 2017).
- Hwang, W.H.; Wiseman, P.E.; Thomas, V.A. Tree planting configuration influences shade on residential structures in four U.S. cities. Arboric. Urban For. 2015, 41, 208–222. [Google Scholar]
- Hwang, W.H.; Wiseman, P.E.; Thomas, V.A. Simulation of shade tree effects on residential energy consumption in four U.S. cities. Cities Environ. 2016, 9, 2. [Google Scholar]
- Haggag, M.; Hassan, A.; Elmasry, S.K. Experimental study on reduced heat gain through green façades in a high heat load climate. Energy Build. 2014, 82, 668–674. [Google Scholar] [CrossRef]
- Hopkins, G.; Goodwin, C. Living Architecture: Green Roofs and Walls; Csiro Publishing: Clayton, Australia, 2011; ISBN 9780643103078. [Google Scholar]
- Collins, S.; Kuoppamaki, K.; Kotze, D.J.; Lü, X. Thermal behavior of green roofs under Nordic winter conditions. Build. Environ. 2017, 122, 206–214. [Google Scholar] [CrossRef]
- Djedjiga, R.; Belarbib, R.; Bozonne, E. Experimental study of green walls impacts on buildings in summer and winter under an oceanic climate. Energy Build. 2017, 150, 403–411. [Google Scholar] [CrossRef]
- Pandit, R.; Laband, D.N. Energy savings from tree shade. Ecol. Econ. 2010, 69, 1324–1329. [Google Scholar] [CrossRef]
- Horoshenkov, K.V.; Khan, A.; Benkreira, H. Acoustic properties of low growing plants. J. Acoust. Soc. Am. 2013, 133, 2554–2565. [Google Scholar] [CrossRef] [PubMed]
- El-Keblawy, A.; Al Rawai, A. Impacts of the invasive exotic Prosopis juliflora (Sw.) D.C. on the native flora and soils of the UAE. Plant Ecol. 2017, 190, 23–35. [Google Scholar]
- Sinimar. Biota in UAE Fauna and Flora. 2017. Available online: http://www.sinimar.eu/en/biota-in-uae-fauna-and-flora/#axzz4vYn29Bob (accessed on 10 October 2017).
- Taleb, M. Natural ventilation as energy efficient solution for achieving low-energy houses in Dubai. Energy Build. 2015, 99, 284–291. [Google Scholar] [CrossRef]
- Mokri, A.; Aal Ali, M.; Emziane, M. Solar energy in the United Arab Emirates. Renew. Sustain. Energy Rev. 2013, 28, 340–375. [Google Scholar] [CrossRef]
- United States Environmental Protection Agency, Using Trees and Vegetation to Reduce Heat Islands. 2017. Available online: https://www.epa.gov/heat-islands/using-trees-and-vegetation-reduce-heat-islands#4 (accessed on 15 August 2017).
- Tiwari, A.; Sodha, M.S. Performance evaluation of solar PV/T system: An experimental validation. Sol. Energy 2006, 80, 751–759. [Google Scholar] [CrossRef]
- Perini, K.; Rosasco, P. Cost-benefit analysis for green façades and living wall systems. Build. Environ. 2013, 70, 110–121. [Google Scholar] [CrossRef]
- Ottelé, M.; Perini, K.; Fraaij, A.L.A.; Haas, E.M.; Raiteri, R. Comparative life cycle analysis for green façades and living wall systems. Energy Build. 2011, 43, 3419–3429. [Google Scholar] [CrossRef]
- Dunnett, N.; Kingsbury, N. Planting Green Roofs and Living Walls; Timber Press: Portland, OR, USA, 2008. [Google Scholar]
Figure 1.
Plant-shaded façade in comparison with unshaded façade of identical housing units, Al-Ain, where (a) Unshaded building façade (bare wall), (b) Plant-shaded façade (plant-shaded wall).
Figure 1.
Plant-shaded façade in comparison with unshaded façade of identical housing units, Al-Ain, where (a) Unshaded building façade (bare wall), (b) Plant-shaded façade (plant-shaded wall).
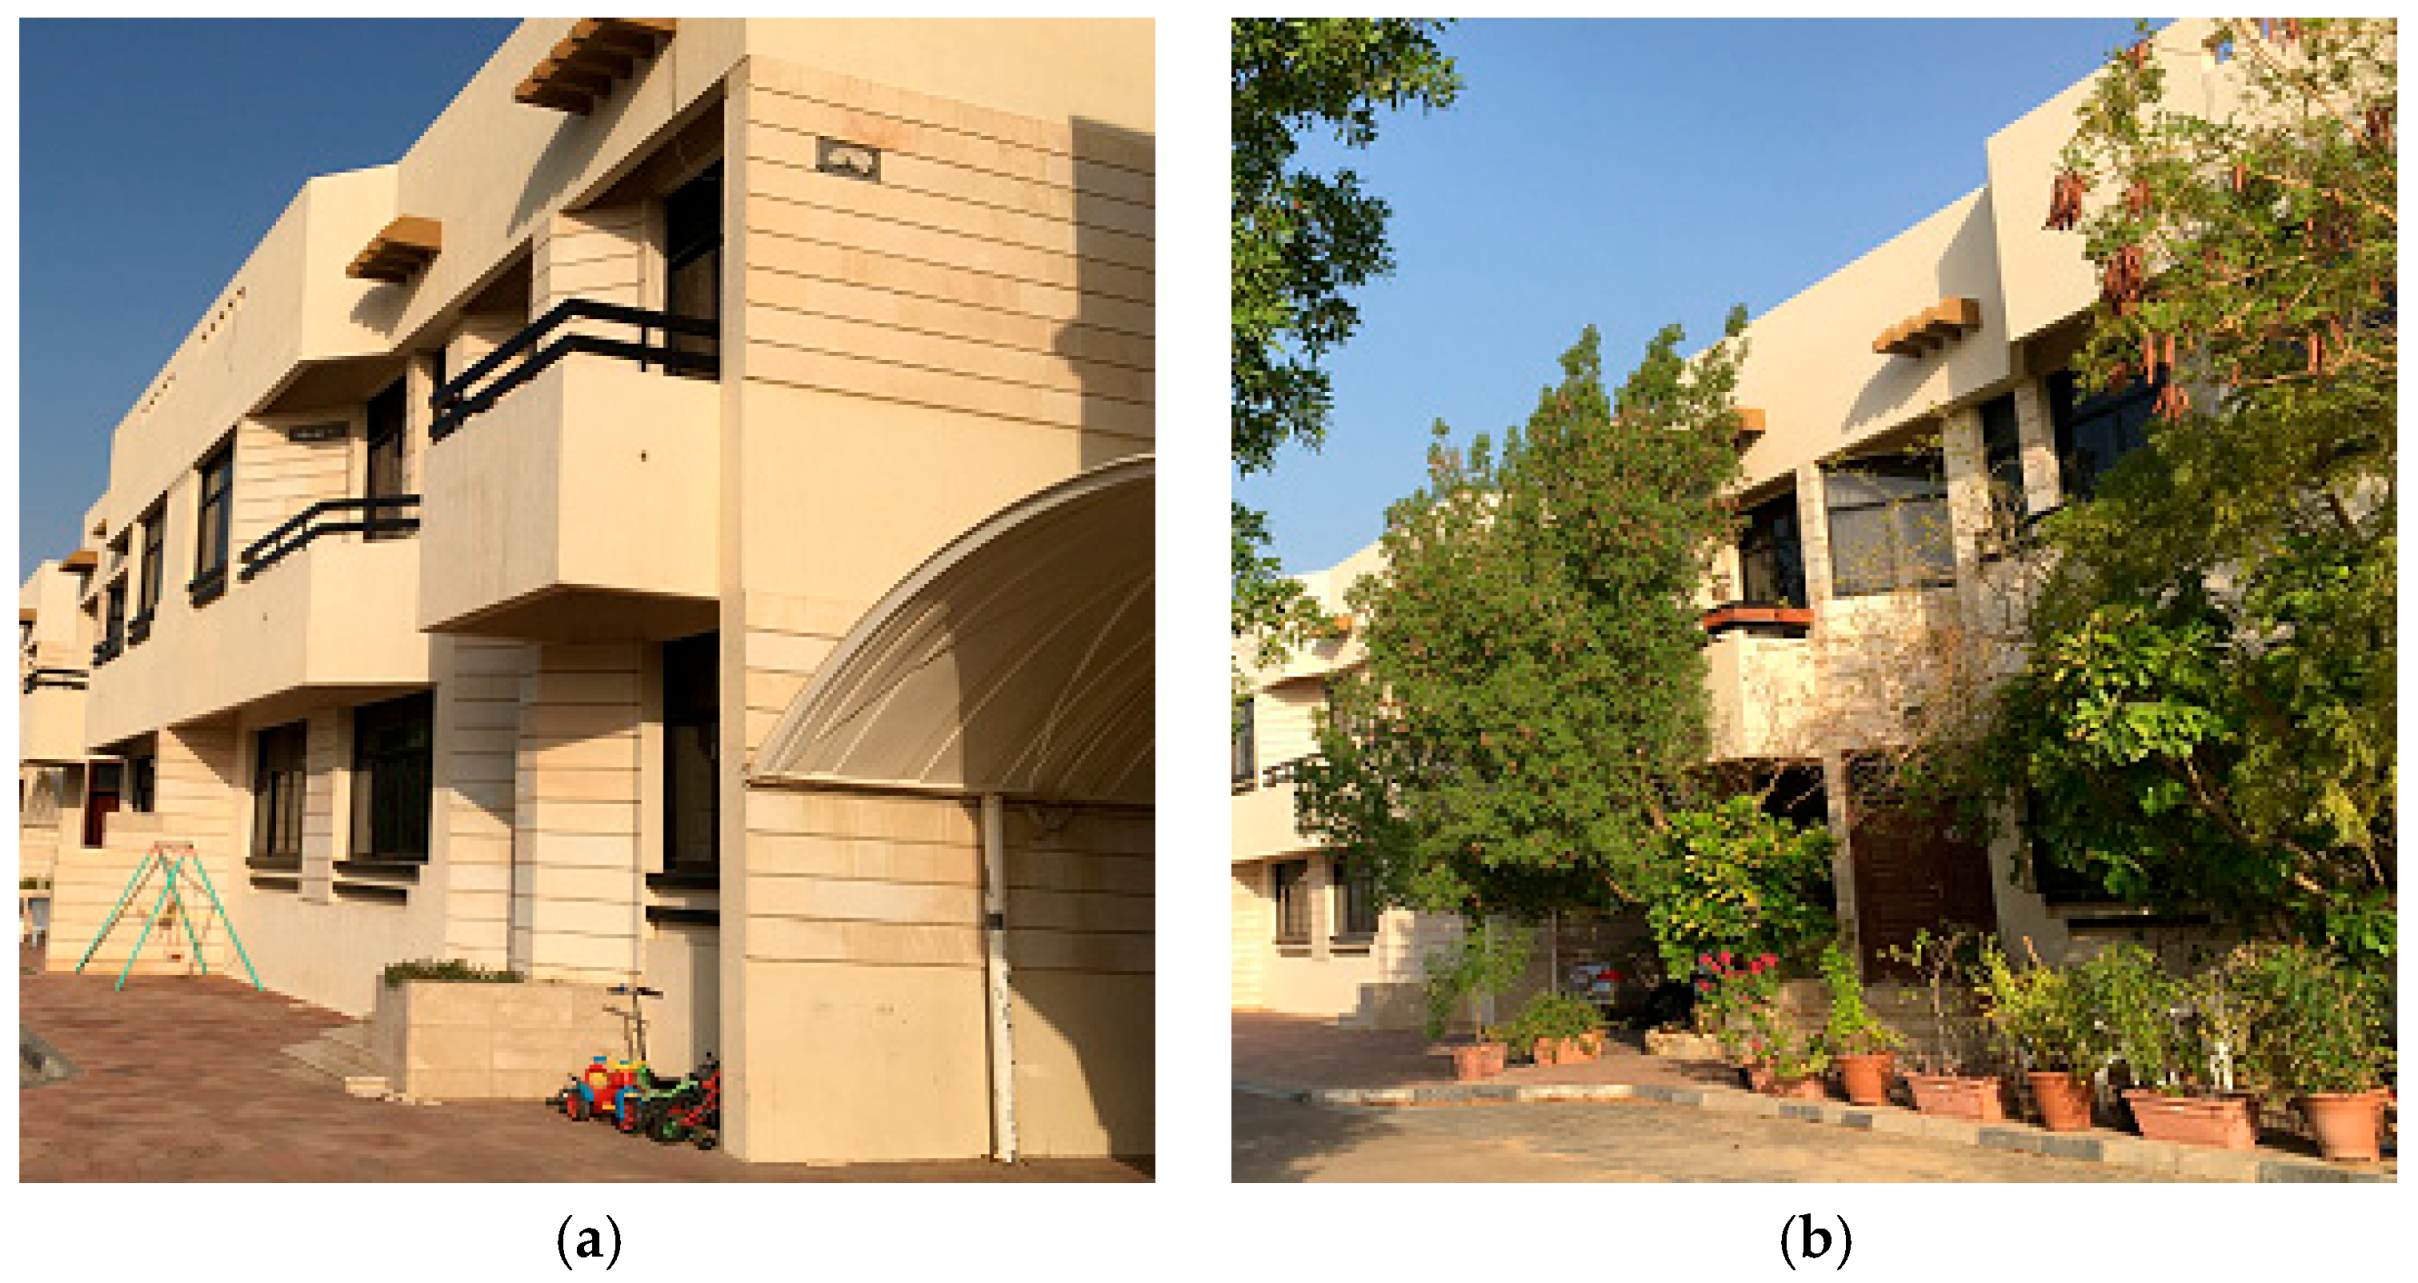
Figure 2.
Non-deciduous trees provide shade in summer and winter seasons that help to conserve energy consumption in hot climate.
Figure 2.
Non-deciduous trees provide shade in summer and winter seasons that help to conserve energy consumption in hot climate.

Figure 3.
Positions of thermocouple wires for measuring wall surface and ambient temperatures.

Figure 4.
Temperature evolution at the front surface of the plant shaded and the bare wall.

Figure 5.
Temperature evolution at the interior surface of the plant-shaded and the bare wall.
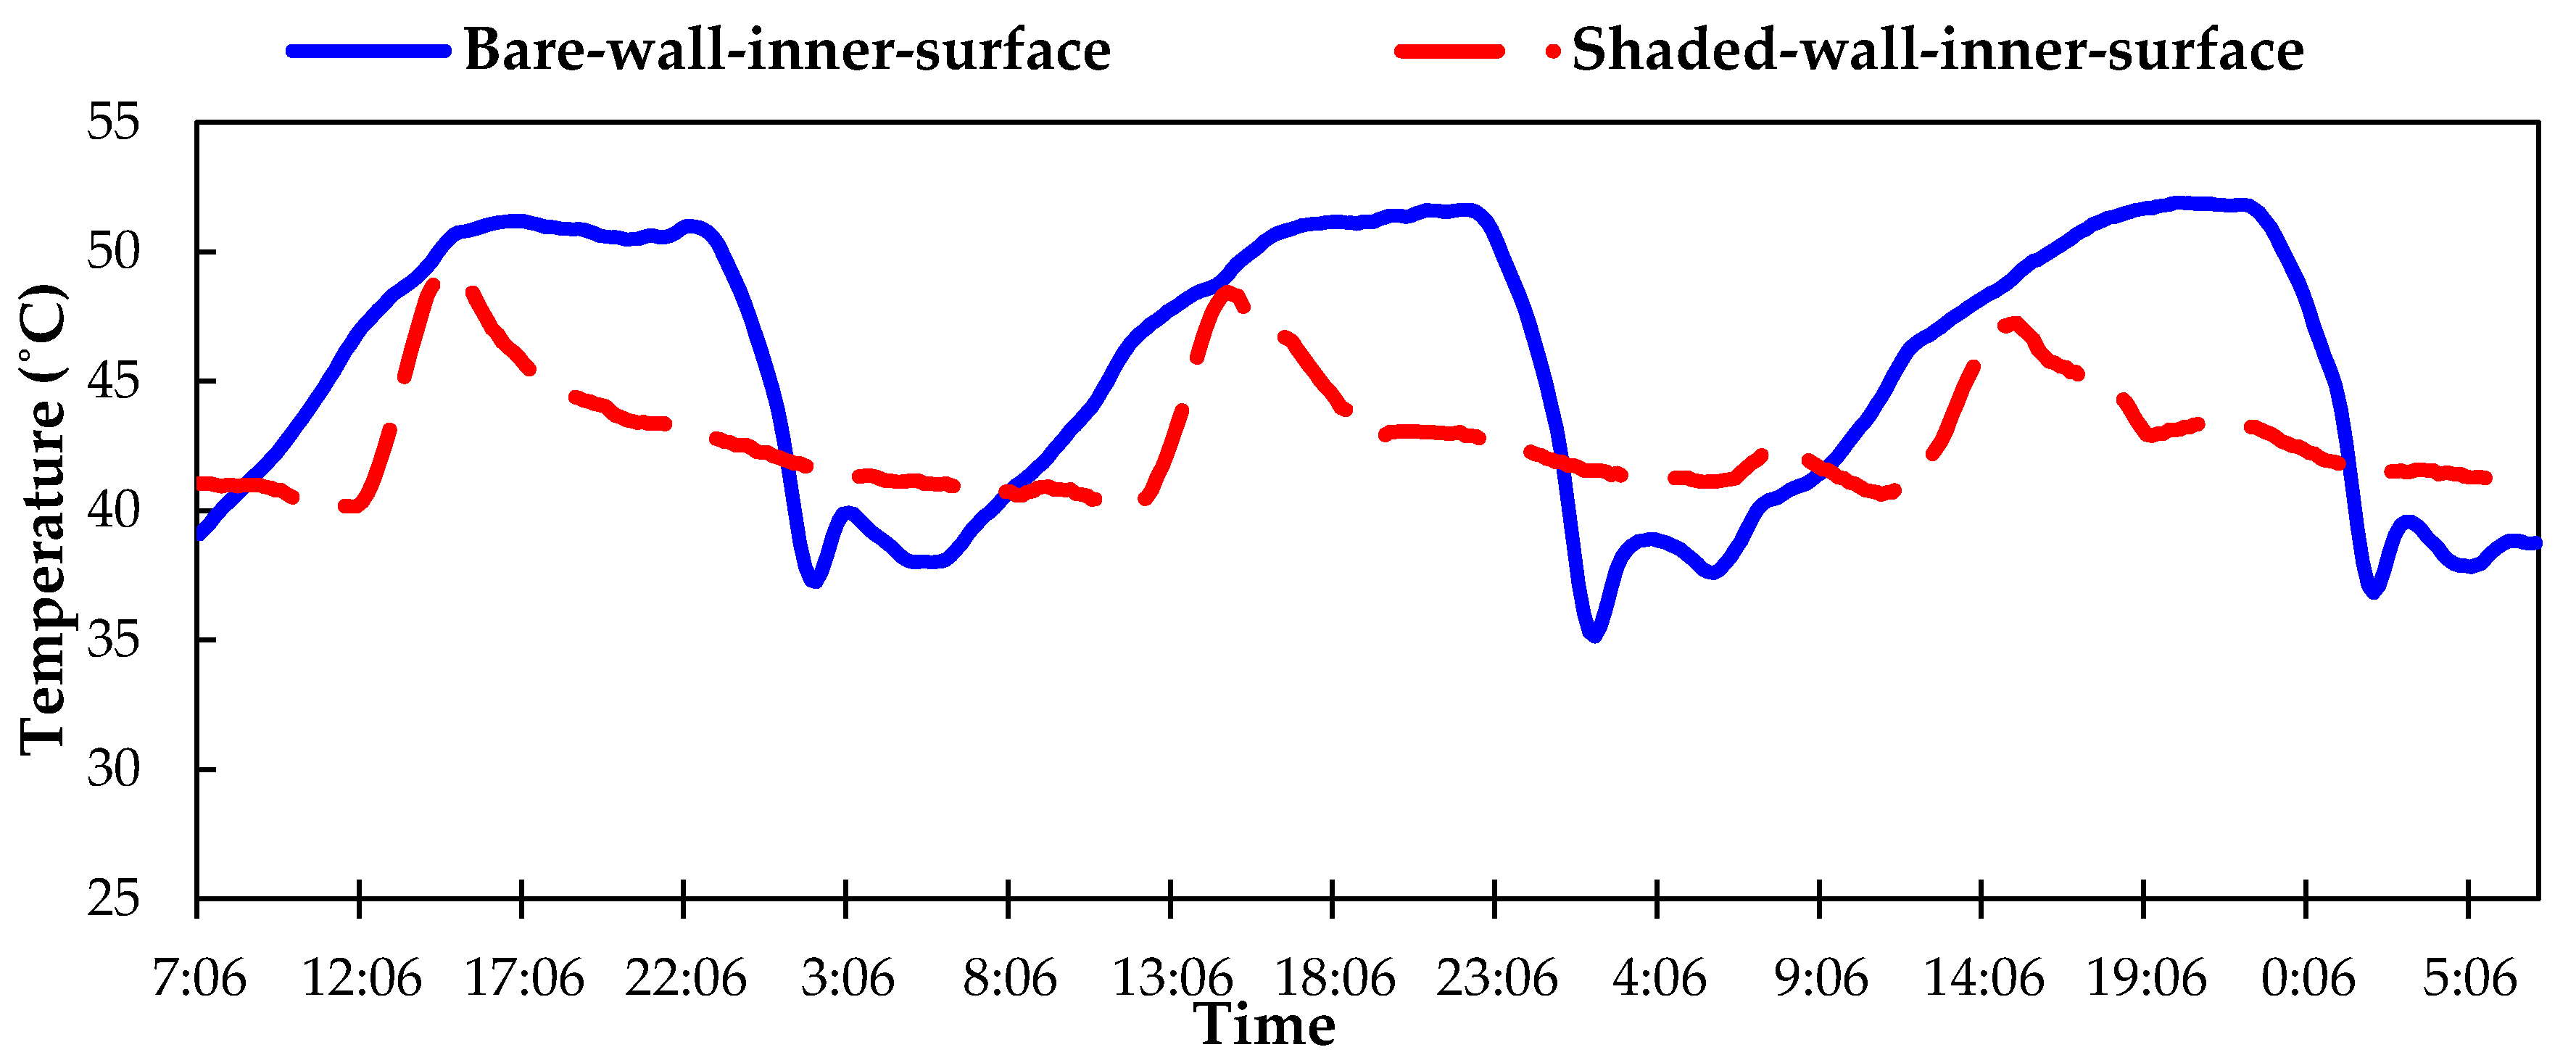
Figure 6.
Temperature evolution of indoor air for plant-shaded and bare wall.

Figure 7.
Temperature drop achieved by plant-shaded wall compared to the bare wall.

Figure 8.
Heat tranmitted indoors by interior wall surface by bare wall and the plant shaded wall.
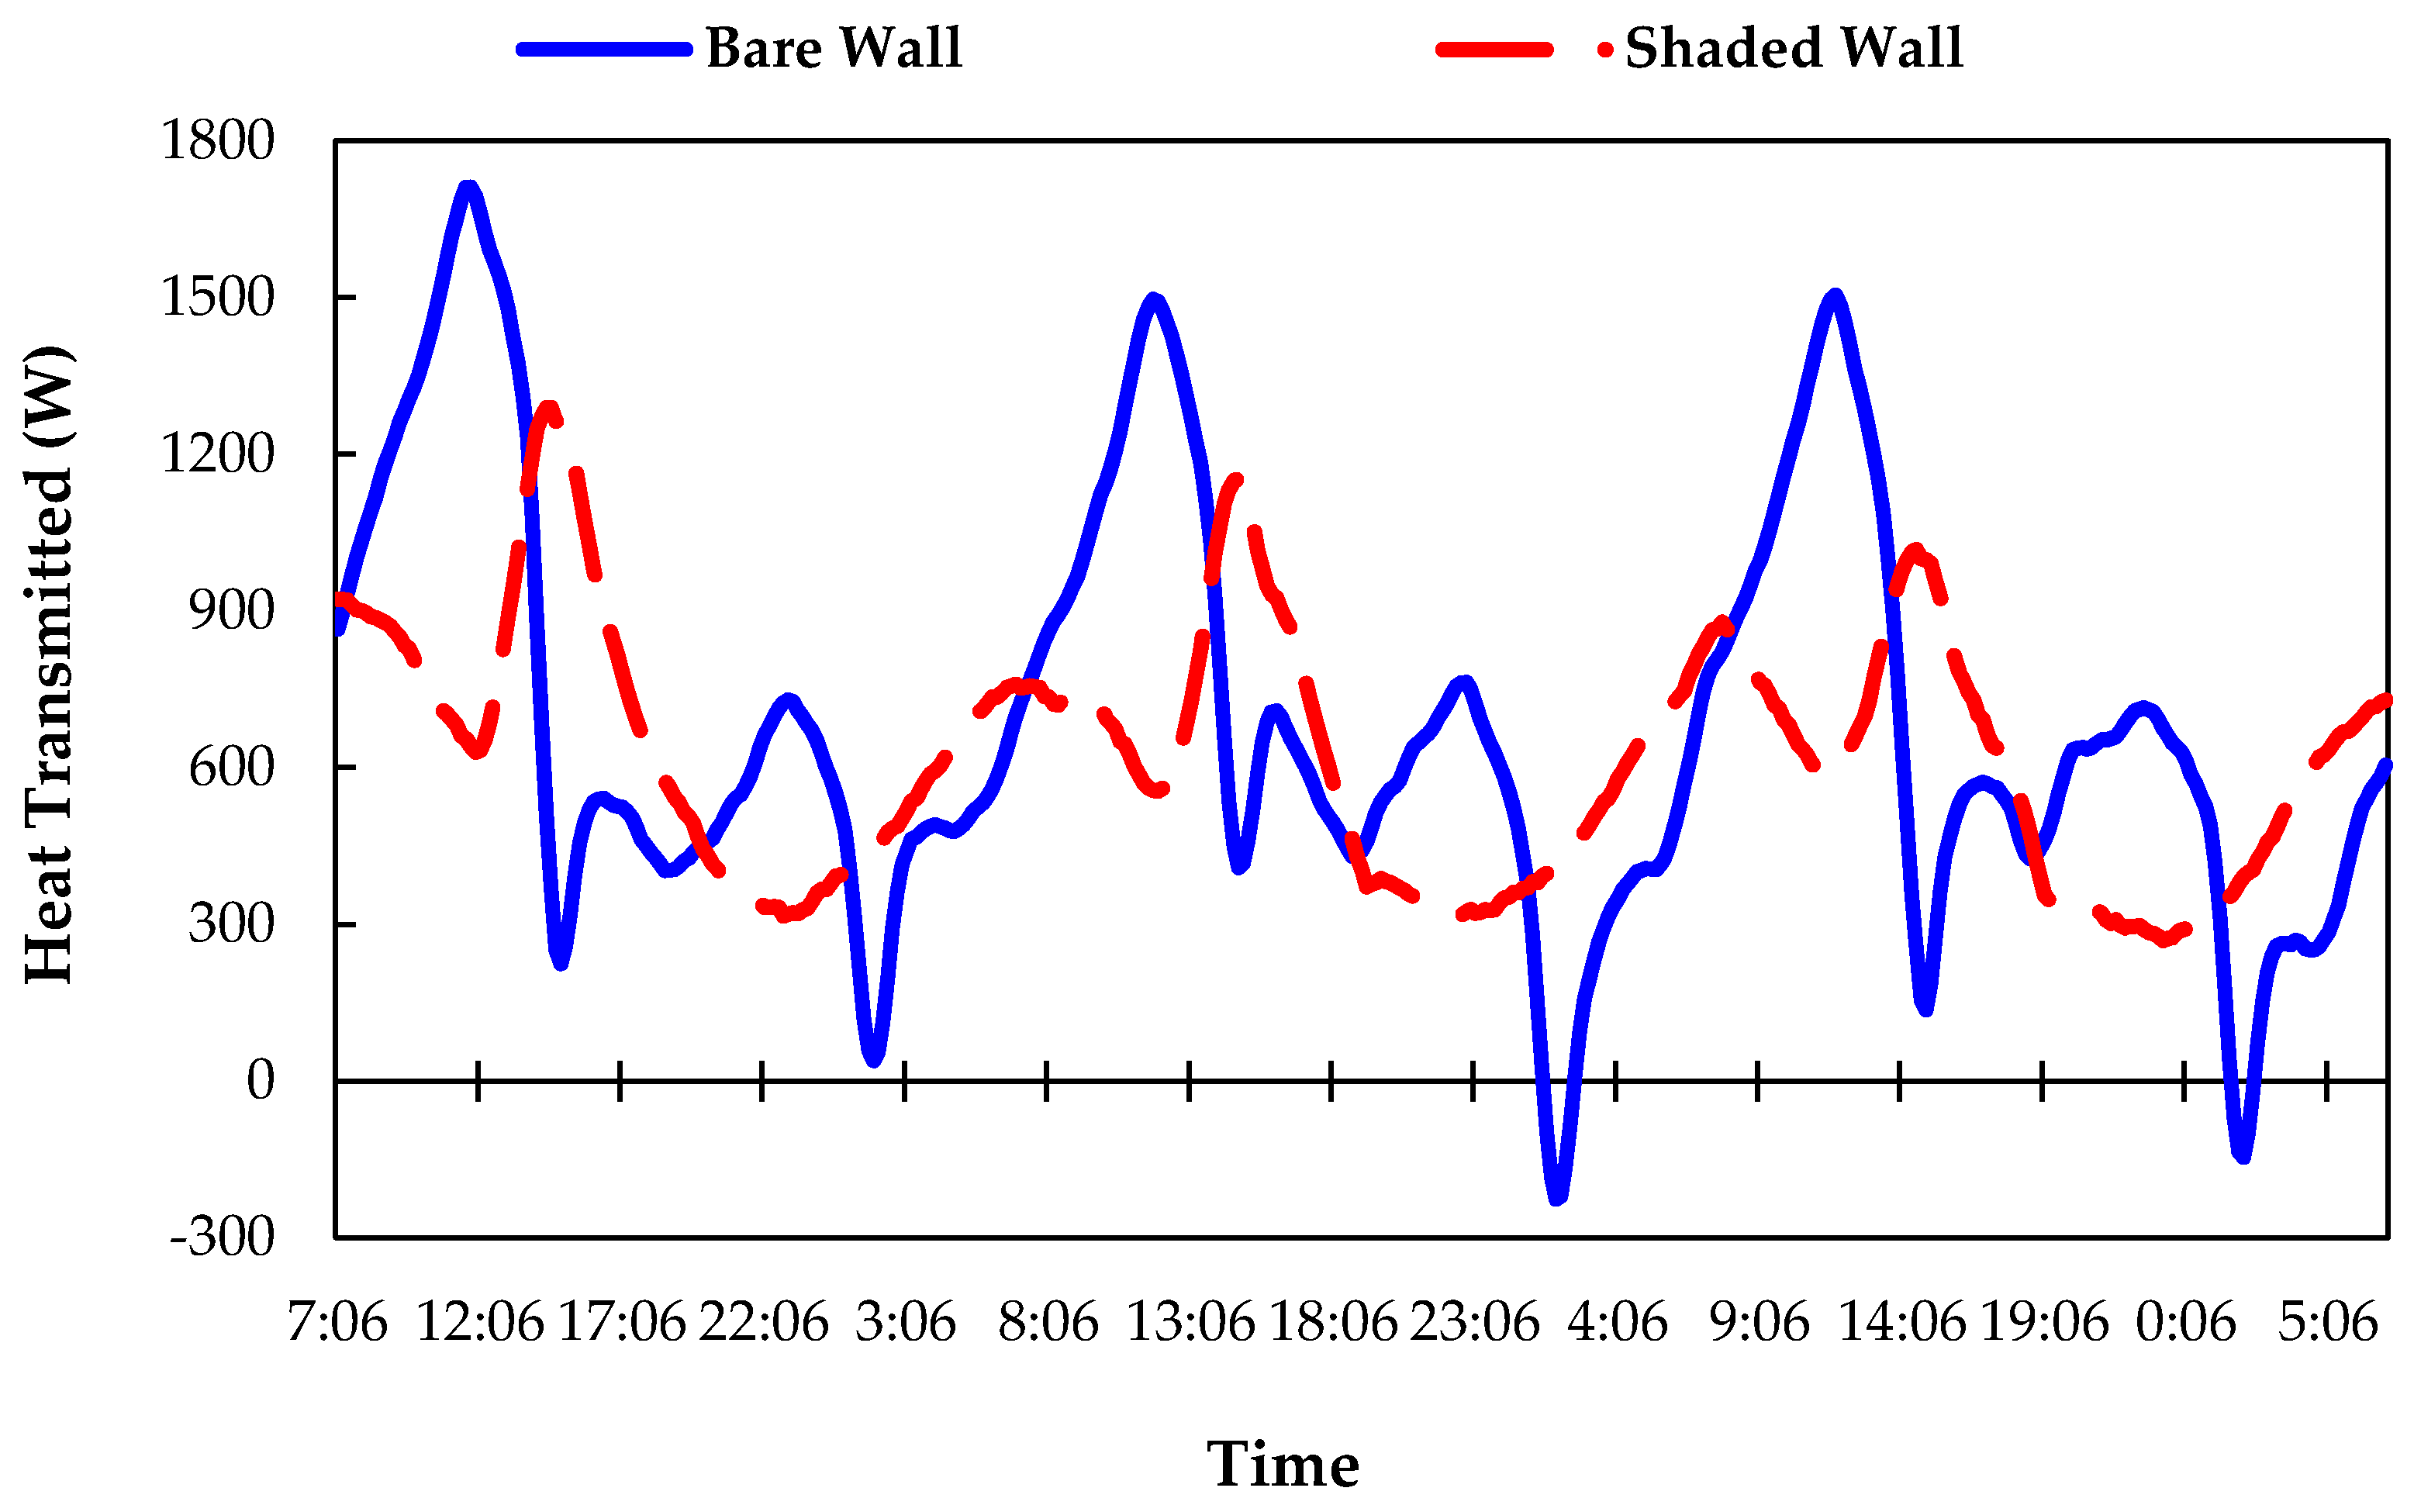
Figure 9.
Net cooling demand over certain time frames for bare wall and plant-shaded wall indoor spaces.
Figure 9.
Net cooling demand over certain time frames for bare wall and plant-shaded wall indoor spaces.


Table 1.
Measurement ranges and accuracies of the instruments used in experiments.
| Measurement Parameter | Device | Model No. | Measurement Range | Accuracy |
|---|---|---|---|---|
| Solar radiation | Apogee Pyranometer (1) | SP-110 | - | ±1% |
| Data acquisition | DAQ-PRO (2) | DAQ-PRO | - | ±0.02% |
| Temperature | RS Pro Thermocouple K-type | 363-0389 | −75 °C to 250 °C | ±1.5 (°C) |
| Ambient temperature | Star meter weather station | WS1041 | −40 °C to 60 °C | ±1% |
| Wind speed | Star meter weather station | WS1041 | Up to 50 ms−1 | ±1% |
Table 2.
Cost and benefits of the plant-shaded wall per tested space.
| Category | Cost in US$ (1 US$ = 3.67 AED) | Category | Benefit |
|---|---|---|---|
| Initial cost of plants and growing media | 240 US$ | Energy savings | 32.23 US$/year |
| Installation cost | 132 US$ | Added property value | 35 US$/year |
| Initial cost of irrigation system | 55.2 US$ | Air quality improvement | Ignored |
| Water cost for irrigation | 40.8 US$/year | Carbon reduction | Ignored |
| Maintenance cost | 108 US$/year | Street noise reduction | Ignored |
| Plantation space use cost | 120 US$/year | Urban heat island | Ignored |
| Total cost | 58 US$/m2 | Total Benefit | 67.23 |
| Tested façade area per floor = 12 m2 | |||
| Total cost for the tested façade per floor (12 × 58) | 696 US$ | Payback Period | 10 years |
© 2017 by the authors. Licensee MDPI, Basel, Switzerland. This article is an open access article distributed under the terms and conditions of the Creative Commons Attribution (CC BY) license (http://creativecommons.org/licenses/by/4.0/).
Share and Cite
MDPI and ACS Style
Haggag, M.; Hassan, A.; Qadir, G. Energy and Economic Performance of Plant-Shaded Building Façade in Hot Arid Climate. Sustainability 2017, 9, 2026. https://doi.org/10.3390/su9112026
AMA Style
Haggag M, Hassan A, Qadir G. Energy and Economic Performance of Plant-Shaded Building Façade in Hot Arid Climate. Sustainability. 2017; 9(11):2026. https://doi.org/10.3390/su9112026
Chicago/Turabian StyleHaggag, Mahmoud, Ahmed Hassan, and Ghulam Qadir. 2017. "Energy and Economic Performance of Plant-Shaded Building Façade in Hot Arid Climate" Sustainability 9, no. 11: 2026. https://doi.org/10.3390/su9112026
Note that from the first issue of 2016, this journal uses article numbers instead of page numbers. See further details here.