Using Green Water Farm to Improve Ecological Restoration
by
 ,
,
Yuan-Hsiou Chang
1,* ,
,
Ting-Jie Zhuang
1,
Tsai-Fu Chuang
1,
Bing-Yu Wu
2,
Hsiao-ling Lu
3 and
Pen-Yuan Chen
4 1
Department of Landscape Architecture and Environmental Planning, MingDao University, No. 369, Wen-Hua Rd., Peetow, Changhua 52345, Taiwan
2
Graduate Institute of Architecture and Sustainable Planning, National Ilan University, Ilan 26047, Taiwan
3
Department of Post-Modern Agriculture, MingDao University, Changhua 52345, Taiwan
4
Department of Landscape Architecture, National Chiayi University, Chiayi 60004, Taiwan
*
Author to whom correspondence should be addressed.
Sustainability 2017, 9(10), 1896; https://doi.org/10.3390/su9101896
Submission received: 23 August 2017
/
Revised: 10 October 2017
/
Accepted: 14 October 2017
/
Published: 20 October 2017
(This article belongs to the Section Environmental Sustainability and Applications)
Abstract
:Artificial Floating Islands (AFIs) are human-made floating structures capable of supporting aquatic vegetation. Previous studies pointed out that most AFIs use aquatic plants to carry out improvement of water quality and ecological conservation. This study proposed a modified AFI system, named Green Water Farm (GWF), to increase the practical application value of traditional AFIs, and added a special design to create an environment that allows for terrestrial plants (including vegetables and flowers) to grow and to carry out improvement of water quality and ecological conservation. The research site was located at the waterfront of Li-tze Lake in Pitou Township, Taiwan. A GWF was established to evaluate the improvement of water quality and ecological conservation. During one year, water quality and ecological conservation assessments were recorded to investigate the performance of GWF system. The research results showed that GWF could improve water quality and ecological conservation. In addition, the results of this study can provide useful information for more food sources for humans and animals, and increase biodiversity and ecological conservation.
1. Introduction
While Artificial Floating Islands (AFI) have been created to conserve bird and wildlife habitats, and waterscape layouts, their potential to improve water quality was not researched until 1990 [1,2]. The AFI study group [3] and Will and Crawford [4] indicated that the first AFI was established in 1900 in lakes in the United States for the nests and habitats of birds. In Asia, Hirose [5] and the Environmental Protection Administration, R.O.C. [6] described the earliest use of AFI in Japan and Taiwan. In Japan, it acts as an egg bed for fish, while in Taiwan it originated from the Thao aboriginal people of Sun Moon Lake, who made bamboo into floating frames laid with grass carpets, and planted them with paddies to form floating farms. In addition, natural floating land is formed by the growth of hydrophilic plants in water areas, and dead or rotting plants form floating islands on the water surface [2,7].
In addition to environmental conservation, AFI can be effective at improving water quality. Nakamura and Mueller [8] and Wen [9] pointed out that the plant root system and floating structures of AFI can intercept contaminants, reduce water velocity, abate the dispersal of pollution, and absorb waves to protect the banks of bodies of water from erosion. It can also effectively reduce organic contaminants in the water [10]. AFI is an effective method to treat eutrophic water, as water pollutants can be transformed and degraded by the combination of plants and microorganisms on the floating island, thus, increasing the efficiency of the natural water quality improving process [11,12]. Dai and Chiang [13] showed that, when using just plants to purify waste water on a floating island, the ammonia nitrogen removal rate is higher than 56%, and the total phosphorus removal rate is higher than 52%; thus, the effect is significant.
Chang et al. [14] pointed out that an AFI could reduce the electrical conductivity (EC) of domestic sewage by 50% and increase DO by 2.7 to 3 times. Zhang et al. [15] directed that, at a temperature higher than constant (30 ± 2 °C), when the algal density is 1.0 × 10⁸ cells/L in a static condition, Odorous Black Water Agglomerate (OBWA) eutrophication occurs. When the Oxidation-Reduction Potential (ORP) value is −250 to −50 mV, the water becomes black and odorous. Therefore, OBWA will be initiated when the ORP value decreases to −300 MV. A floating island can uniformly mix water and inhibit algal growth, thus, reducing NH3-N, NO3−-N, and NO2−-N to rapidly upgrade water quality [16].
Keigo [17] constructed an AFI at the Tsuchiura port in Lake Kasumigaura in 1993, which has a length of 92 m, a width of 9.5 m, and consists of 40 segments. They also surveyed the characteristics of flora, vegetation succession, and the standing crop on the AFI in November 1996, and the results showed that, while the algae cell count was about 10 times higher in summer, the water sample with a floating island had no water blooms, and the cell count of phytoplankton was reduced by 94%. Dissolved oxygen (DO) and EC can influence the microorganisms in water, thus, indirectly influencing biological water quality. Kalff [18] indicated that, on the one hand, the DO concentration reflects the water temperature and photosynthesis in the water body; on the other hand, it reflects the oxygen volume consumed by microbial processes. A floating island can remove nitrogen and phosphorus pollutant content in water through absorbing the nourishment of agricultural plants, and the plants are harvested in appropriate seasons to avoid rotting in autumn [19].
In terms of ecological conservation, Carolin et al. [20] stated that agricultural environment measures differ in their capacity to simultaneously enhance the provision of multiple ecosystem services. As floating islands are isolated from land areas, they provide good invisibility for wildlife to inhabit, including birds, fishes, insects, aquatic insects, and amphibians, thus, maintaining biodiversity [4,7,21,22,23,24]. Pei [25] established that the Occurrence Index = (number of animals shot in an hour/effective working hours of camera in the hour × 1000) represents the hedonic scale of target species for various sample points, where the number of organisms is calculated to represent the environmental organism occurrence rate. Wang and Eagles [26] offered that the formation of floating islands promotes the birth and development of waterscape ecology, which enhances global environmental protection and health.
In terms of the output value of agricultural crops, Yao et al. [27] and Yen et al. [28] indicated that agricultural landscapes can maintain surface drainage to reduce engineering maintenance costs and increase biodiversity, and that vegetated AFI can remove organic substances, such as nitrogen and phosphor. Evans et al. [29] showed that, through low-carbon agriculture, the agricultural landscape could provide a highly cost-efficient system to resist carbon emissions, restore ecosystems, and present biodiversity. The floating island can enhance agricultural land use. Gagne et al. [30] and Fahrig et al. [31] proposed five high-strength land use factors, two of which are: a waterscape can reduce human-made interference on land; and, a waterscape can change land properties and enlarge the land area. Therefore, floating islands with farming are more beneficial than general AFI. The objective of this study is to investigate the improvement of water quality and ecological conservation using the Green Water Farm (GWF) system.
Previous studies pointed out that most AFIs used aquatic plants to carry out water quality improvement or ecological conservation [32,33,34]. This study proposes a modified AFI system, named Green Water Farm (GWF), to increase the practical application value of traditional AFIs, and adds a special design to create an environment that allows for terrestrial plants (including vegetables and flowers) to grow and carry out water quality improvements. The results of this study can provide useful information for more food sources for humans and animals, and increase biodiversity and ecological conservation.
2. Materials and Methods
The study area is about 8.2 m2 in an orchard at Pitou Township of Changhua County, Taiwan, 23°86′79″E, 120°49′33″N.
2.1. GWF Structure
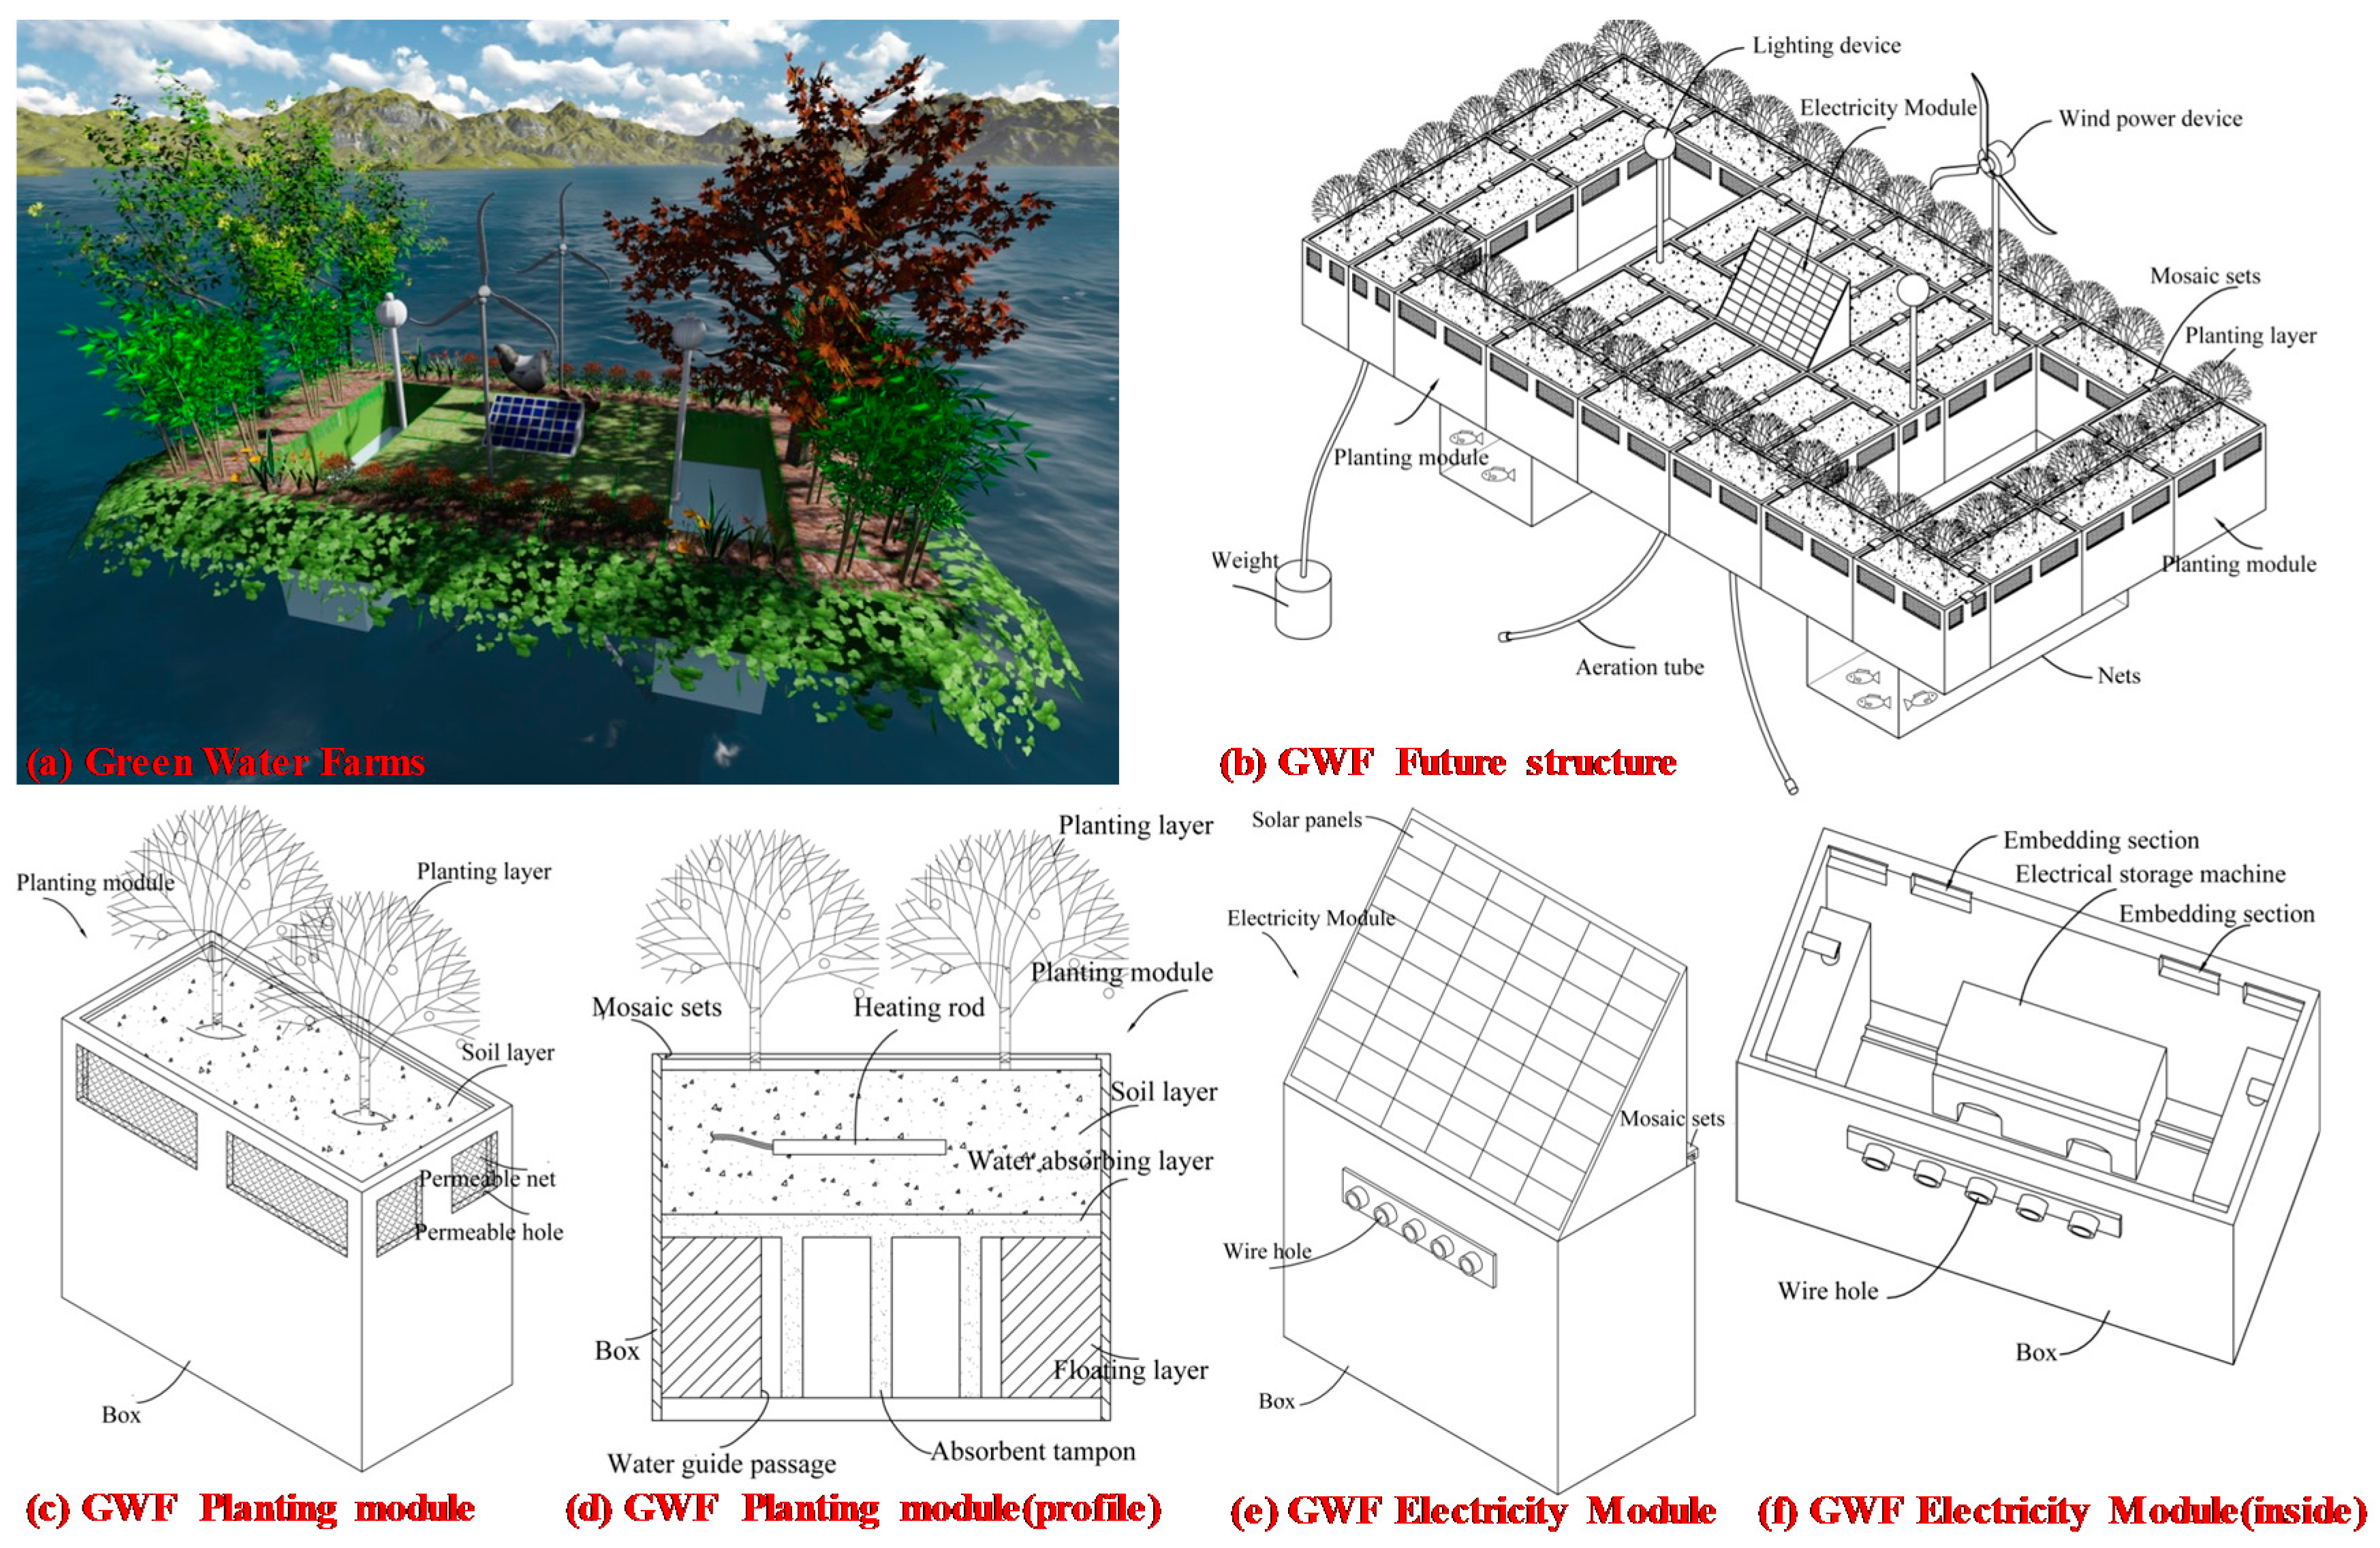
The standard set-up of GWF system, as proposed in this study, is shown in Figure 1a,b. The GWF is integrated modularly, where various units have water space and are covered with soil for planting (Figure 1c). Cotton cloth and cotton strips are placed under the soil layer, and water is absorbed by capillary action to conserve the soil (Figure 1d). In addition, there is a green energy module for generating and storing power for night LED landscape lighting and aeration in water (Figure 1e,f).
In order to implement this study on the practical research site, the above standard set-up of the GWF system is slightly adjusted for experimentation. The materials for the GWF system include two PVC water pipes with diameters of 4″ and 3/2″, eight pipe caps with diameters of 3/2″, and four elbows with diameters of 4″, forming a 70 × 70 cm floating island structure. In addition, there is a 65 × 65 cm black plastic mesh at the bottom to prevent the soil from dropping into the water. The soil pot size is 22 × 22 × 17 cm; the lower layer is a 3 cm thick coconut fiber mat; the middle layer is 12 cm thick culture soil. There are nine vegetables and another nine flowers planted on two floating islands to compare the differences. For vegetables, Phaseolus vulgaris, Ocimumbasilicum, Abelmoschusesculentus, Brassica oleracea var. capitata f. rubra, Allium fistulosum, Capsicum annuum, Lactuca sativa var. capitata L., Allium tuberosum, Rottler Allium odorum L., and Capsicum annuum var. grossum were chosen. For flowers, Chrysanthemum frutescens, Toreniafournieri, Cupheaignea, Melampodium Lemon Delight, Lantana camara, Tageteserecta, Ixorachinensis Lam., and Rosmarinus officinalis, Crossostephiumchinense (L.) Makino are adopted. A 20 cm Lucite pipe filled with water absorbent cotton thread penetrates through a round hole with a radius of 2 cm in the pot bottom to increase the water absorption of the soil. The photovoltaic panel supplies power, the pipe base aeration opening is mounted, and air is pumped above the farm into the water to increase the DO content to improve water quality.
2.2. Measuring Instruments and Research Materials
2.2.1. Water Quality Measurement Equipment
There are five water quality experiments in this study. The five parameters of Water Temperature (T) °C, Electrical Conductivity (EC) C-μS/cm, Potential of Hydrogen (pH), Oxidation-Reduction Potential (ORP) mv, and Dissolved Oxygen (DO) mg/L are tested by a YSI-Pro Plus multi-parameter water quality analyzer throughout one year.
2.2.2. Ecological Environment Instrumentation
The GWF’s biological and aquatic insect species are observed and recorded by a camera according to the visual encounter surveys between 15:00 and 20:00 every Wednesday from 10 March 2014 to 10 March 2015 [35]. The camera specification is SONY X peria ZL, 13 mega pixels. At night, a reflective searchlight headlight is used to provide illumination for the researchers to work. The model of headlights’ specification is the “PAN WORLD 3D05”. More than 15 photos are captured and analyzed every Wednesday for each flume.
2.2.3. Solar Power Supply Equipment
Photovoltaic panel: 100 W monocrystal × 2, size: 160 cm × 108 cm; solar control box: 12 V and 20 A; and solar deep-cycle battery (EVX): 12 V 100 A with two excess power space × 2. The equipment is set up in the experimental mode field, matching the daylighting direction, and the photovoltaic panel tilts 23° southwards. Related equipment is installed under the photovoltaic panel, and power is supplied to GWFs D and E of the experimental group.
2.3. Physical Environment Instrumentation
The VS7LOGGER micro climatological observation instrument is installed in the experimental mode field, which measures five outdoor physical environment data: solar radiation, rainfall, illumination, humidity, and temperature. Data is recorded every 10 min, and this study automatically calculates the average monthly value of the variables throughout the year, in order to monitor the physical environment changes in the experimental mode field, and arrange the water quality experiment.
2.4. Water Body Grouping and Water Quality Research
The experimental field is about 1.5 m away from the bank. Two experimental groups (Waters D and E) and one control group (Water F) are designed and compared. Waters D and E are provided with a GWF, while Water F is without a GWF. The above three flumes (Waters D–F), with a diameter of 1.7 m and depth of 2 m, are dug at intervals of 20 cm; and are filled with the same volume of water.
The above waters needed for Water bodies D, E, and F are the daily-life mixed drainage, as obtained from Water body A (Figure 2a,b). The location of A is the discharge point of the daily-life mixed drainage from the student’s dormitory. In order to observe the of stratification of Waters D to F, this study collects water samples (Waters D to F) at three points, i.e., the upper point (5 cm below water surface), middle point (70 cm below water surface), and lower point (5 cm above bottom) layers.
Regarding the experimental design, the difference between Waters D and E is that only flowers (Water D) or vegetables (Water E) are planted on the GWF floating island. By comparing Waters D to F, we can obtain the benefit assessment of a GWF. According to the water quality test method of the Environmental Protection Administration, Executive Yuan, Water bodies D to F are tested between 14:00 and 15:00 every Wednesday from 10 March 2014 to 10 March 2015 (Figure 2c–e). There are five water quality experiments in this study, and the five water quality parameters of Temperature, EC, pH, ORP, and DO are tested by a YSI-Pro Plus multi-parameter water quality analyzer in order to analyze the changes throughout one year.
2.5. Ecological Investigation Method
The investigation method follows the visual encounter surveys from 10 March 2014 to 10 March 2015, between 15:00 and 20:00 every Wednesday. The visual encounter survey records the number of all the species of insects, amphibians, etc., for a particular route or area within a specified time [35].
2.6. Statistical Analysis
In this study, Analysis of variance (ANOVA) available in SPSS Statistics is adopted to evaluate whether the differences between the three groups (samples D, E, and F) have reached statistical significance.
3. Results
3.1. Climatic Conditions
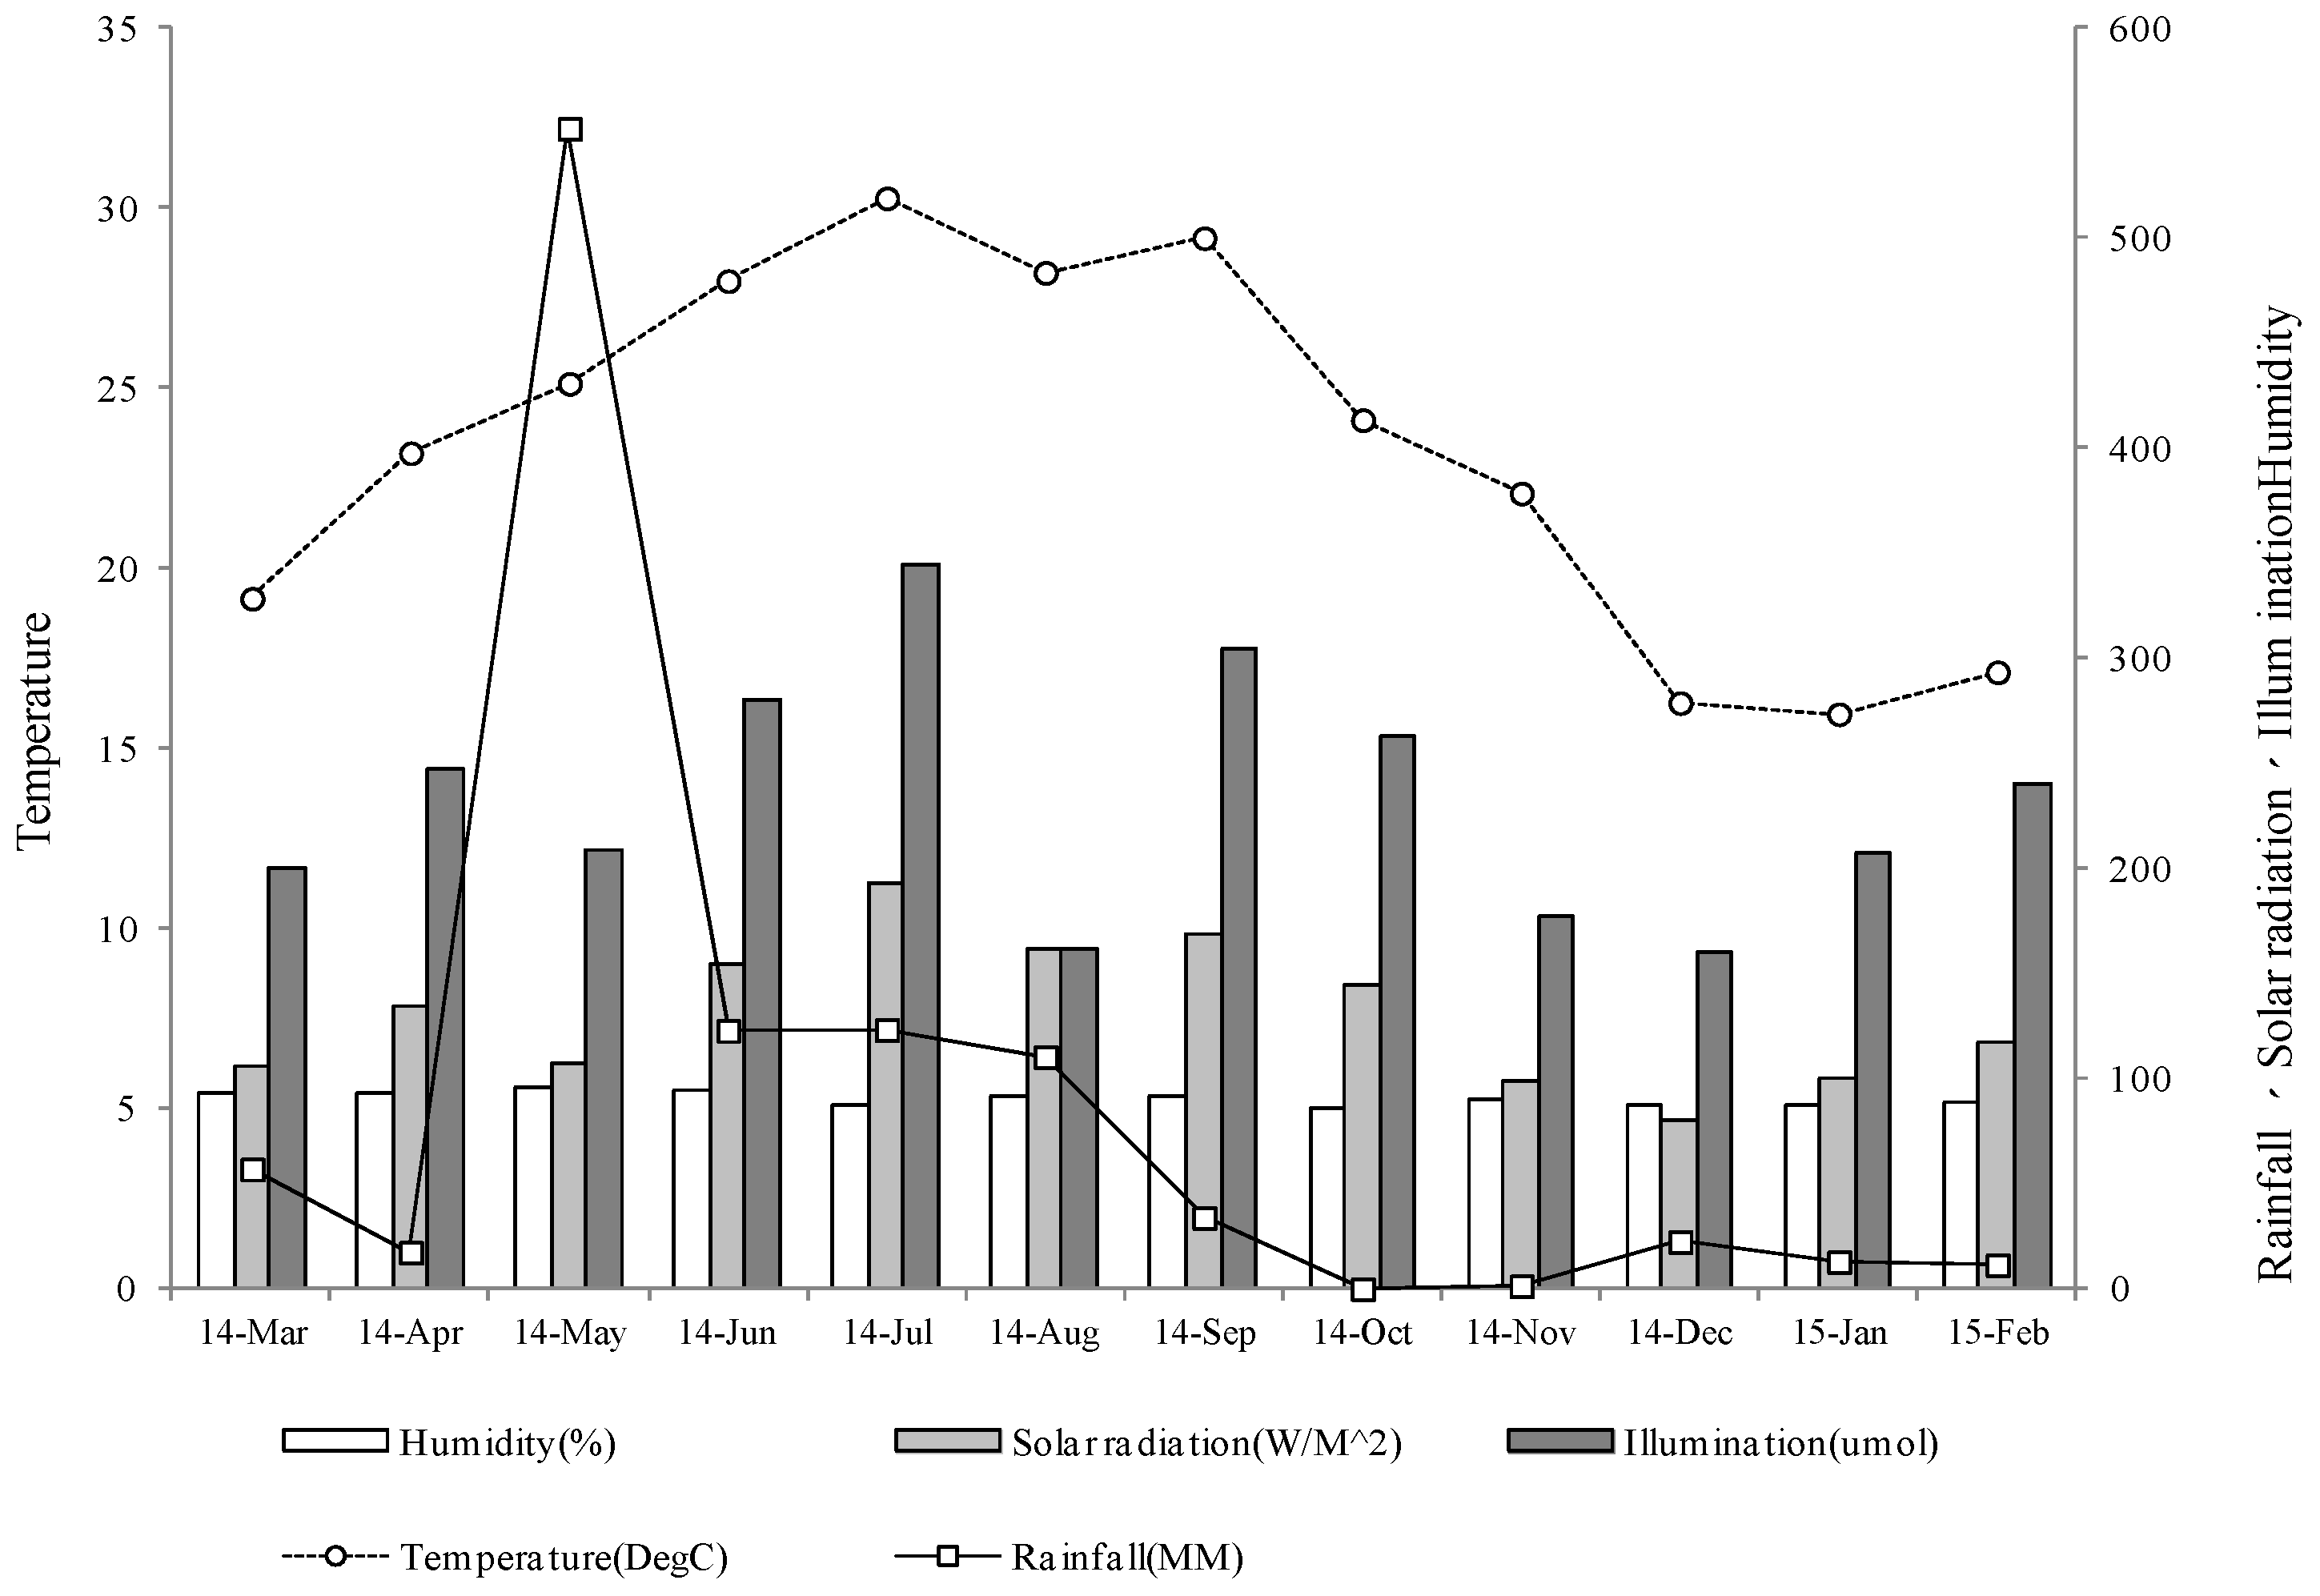
According to the instrument measurements of one year, the maximum daily radiation is from May to October 2014, the maximum value is 188.9W/M2, the daily rainfall is apparently different in May to August 2014, and there is a stationary front in May; thus, the daily rainfall on the 19th day is as high as 126 mm, which is much higher than that in the other months. The maximum average air temperature is about 29 °C from June to September, and the annual maximum temperature is 30 °C in July, which is 15 °C higher than the minimum temperature of 15 °C from February of last year. The annual humidity is approximately 96–99%, as the mode field is located by the waterfront. This study integrates the climatic data, in order to discuss water purification (Figure 3).
3.2. Benefit of Water Quality Improvement
3.2.1. Water Temperature
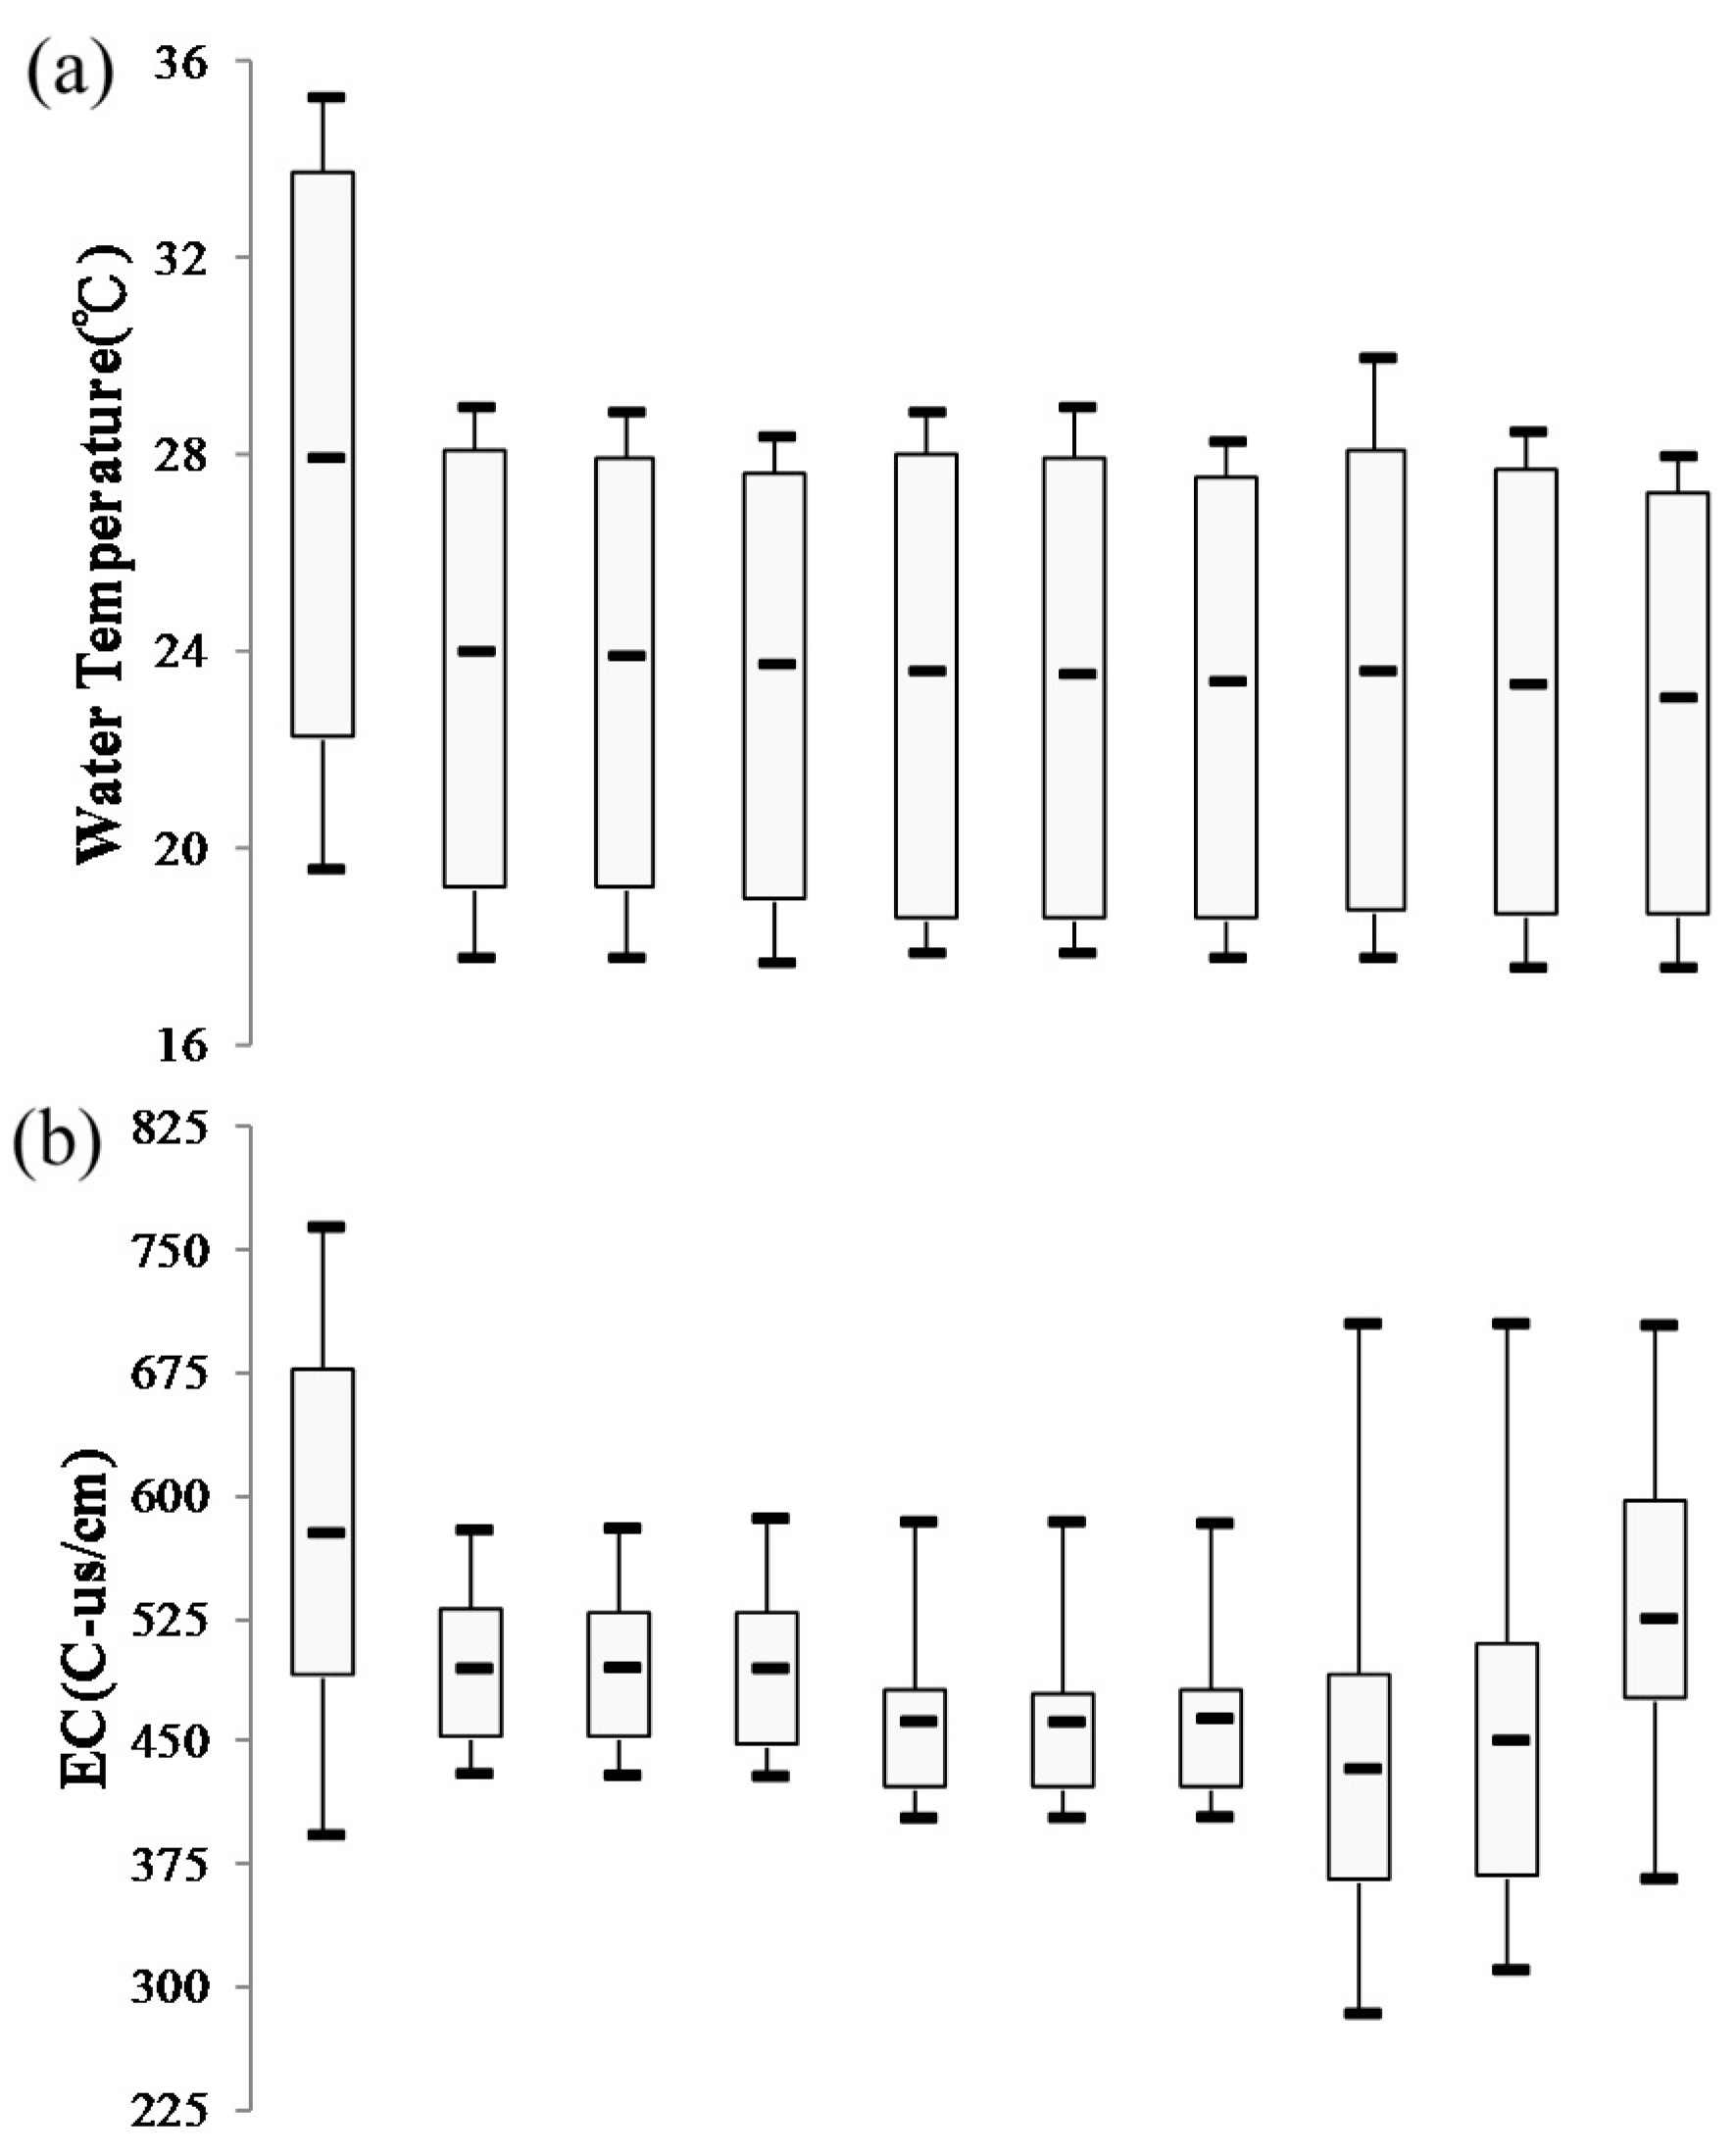
The maximum temperatures of Waters D, E, and F are from June-September (Figure 4). By comparing Waters D to F, the differences among the upper, middle, and lower water temperatures of Water F (control group) are relatively greater than Waters D and E (experimental groups) (Figure 5). The maximum difference between the upper and lower water temperatures of Water F is 1.5 °C in February. The overall maximum temperature of Water A in June is 35.1 °C, which is 18.0 °C higher than the minimum lower temperature 17.1 °C of Water F in January. The temperature rises by about 1.03 times from June to August, and the temperature decreases by 33% from August to February, which is 1% higher than the upper of Water D.
3.2.2. Electrical Conductivity (EC)
Electrical conductivity is measured by the total amount of dissolved salt in the liquid, including inorganic cations (such as calcium, magnesium, sodium, and potassium) and anions (such as carbonate, sulfate, and chloride).
In Taiwan, the maximum allowable value of EC for the effluent standardsis 750 μS/cm [36]. From Figure 4 and Figure 5, it can be seen that all the values of the three points (i.e., upper, middle, and lower points) of EC for Waters D and E are within the effluent standards (i.e., 750 μS/cm). By comparing Waters D to F, the differences among the three points of EC of Water F (control group) are relatively larger than Waters D and E (experimental groups) (Figure 5).
3.2.3. Potential of Hydrogen (pH)
In Taiwan, the allowable standard of potential of hydrogen (pH) for effluent standards is 6–9 [36].
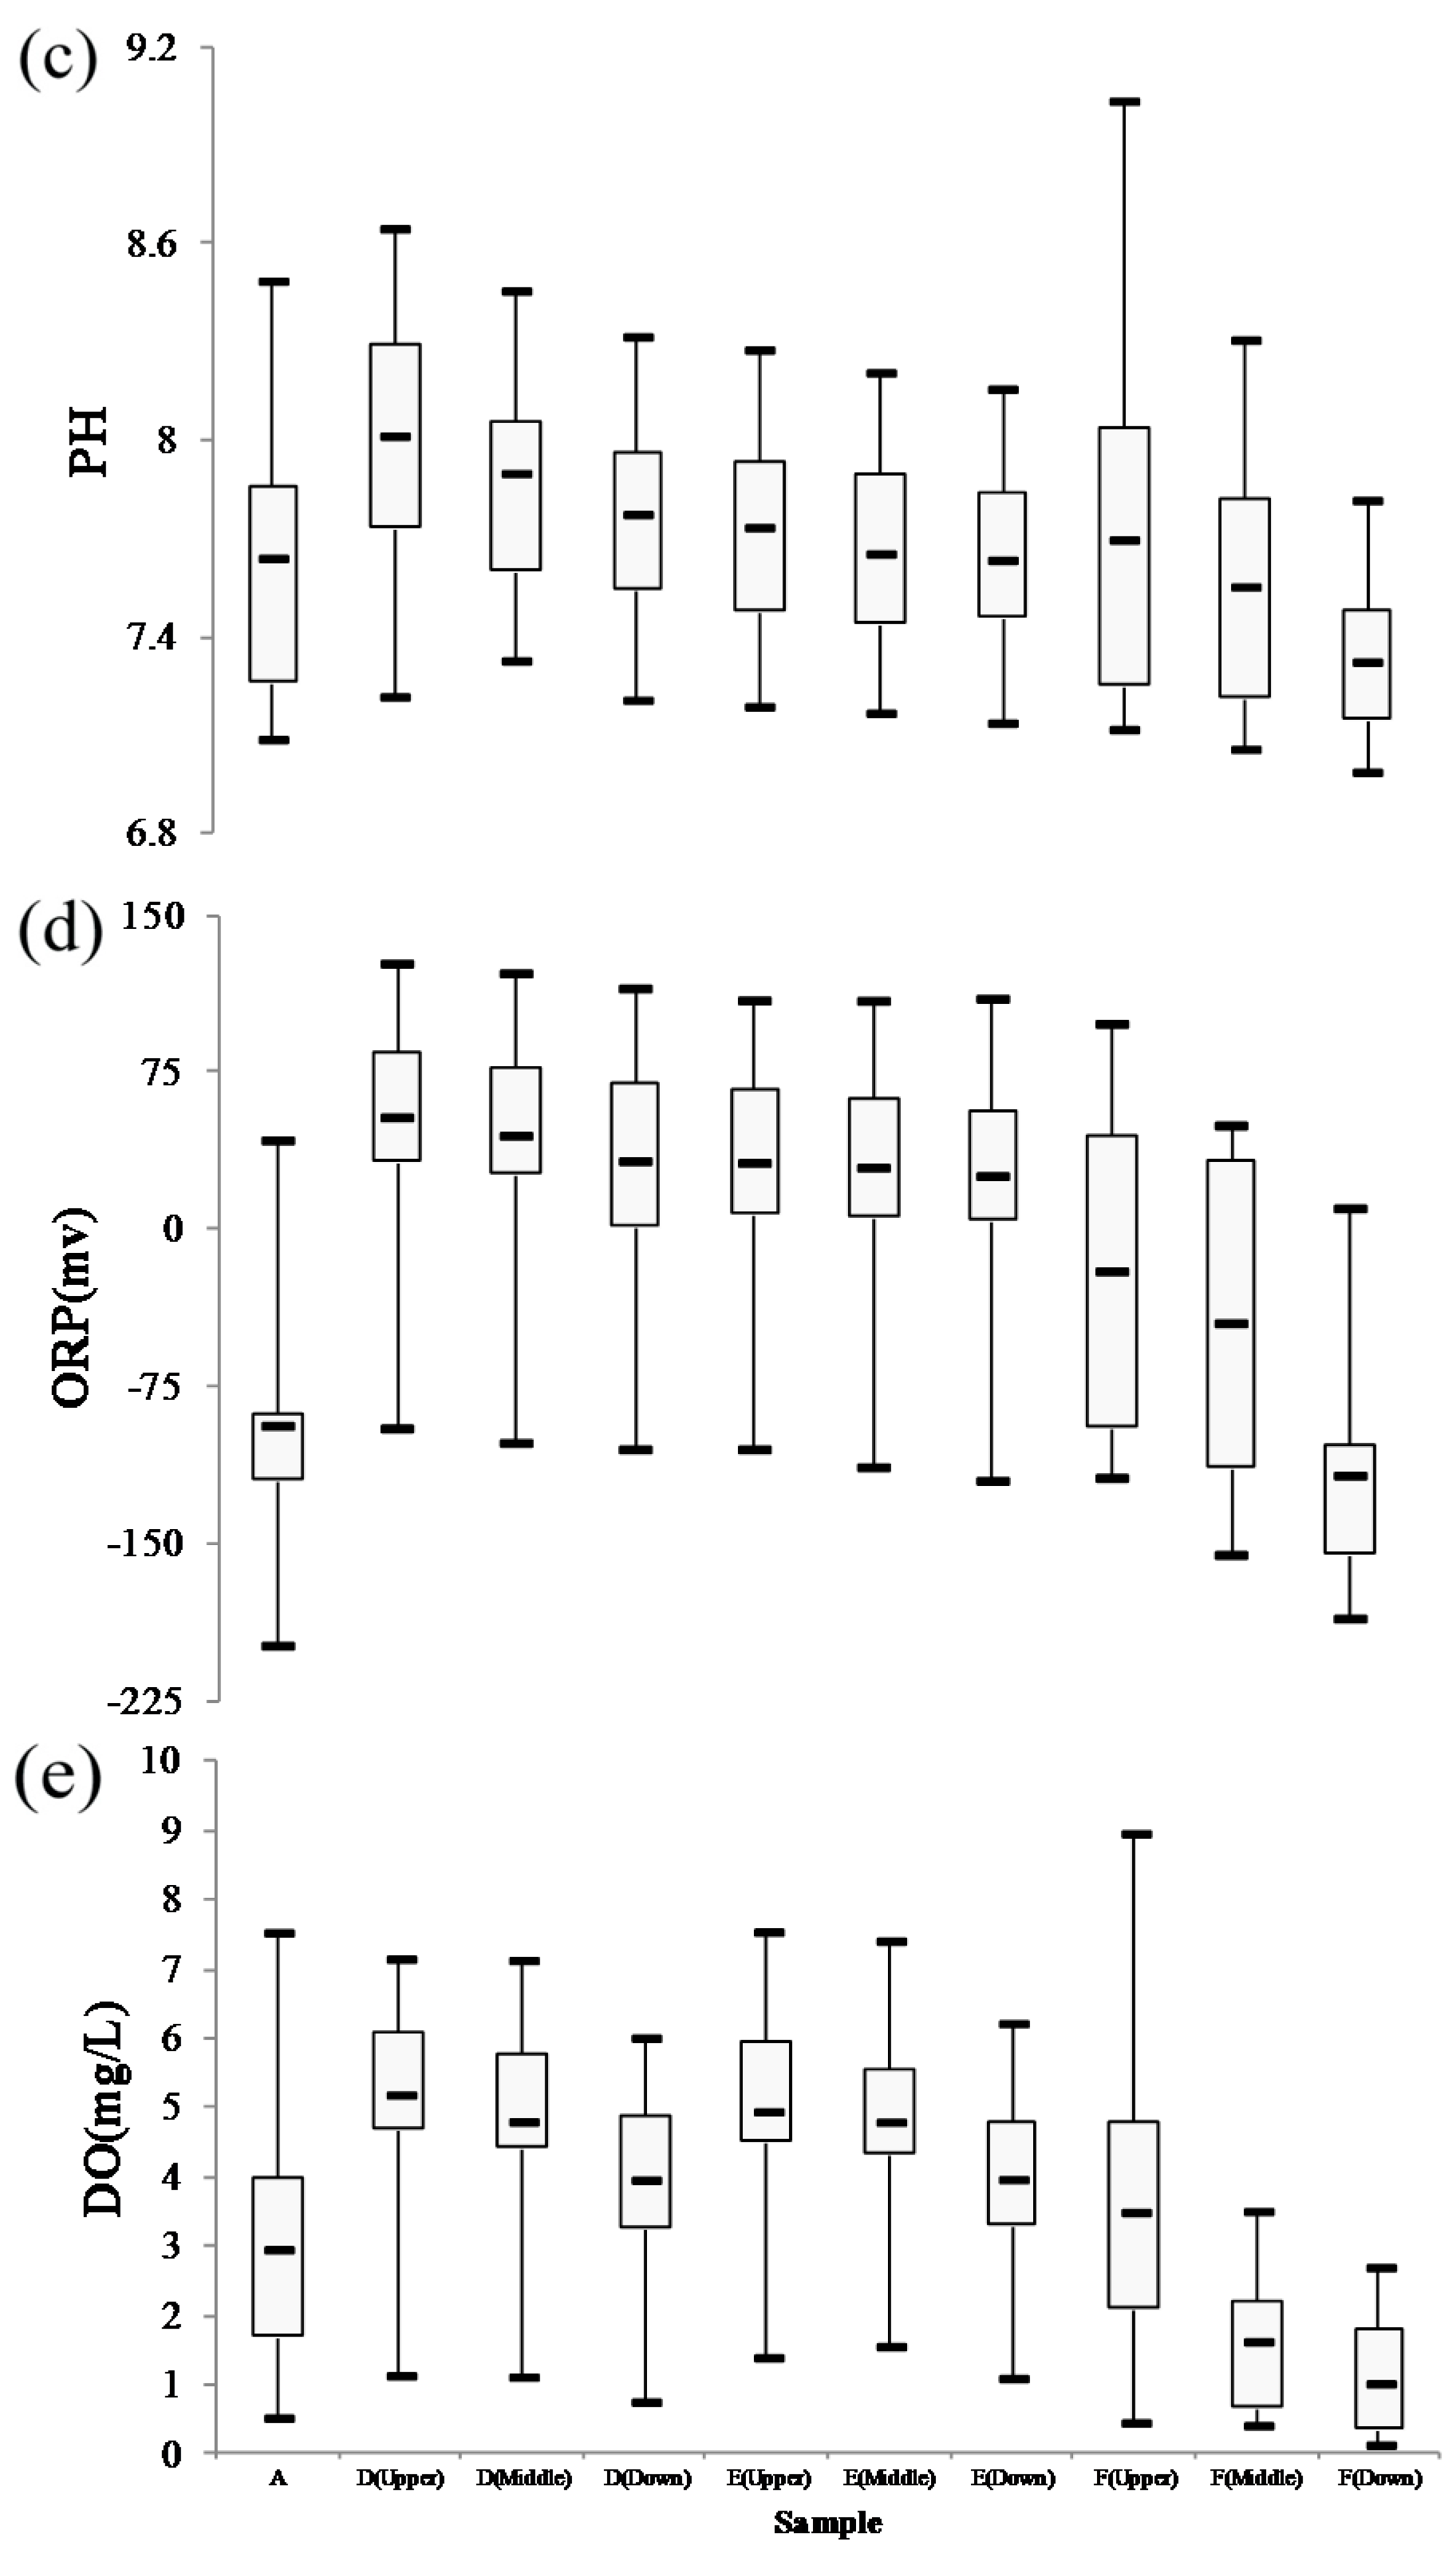
The pH levels of the upper, middle, and lower layers of Waters D and E range at about 7.5–7.9, and there is no obvious stratification, meaning that the water is mixed uniformly. However, according to the comparison between the upper, middle, and lower layers of Water F, the pH difference between the upper and lower layers is 1.18 in July, while the maximum difference between the upper and lower layers of Waters D and E is about 0.4, meaning a GWF can thoroughly mix water to avoid stratification (Figure 4).
3.2.4. Oxidation-Reduction Potential (ORP)
According to the comparison among Waters D, E, and F, the upper, middle, and lower layers of Waters D and E have slight difference, and the minimum ORP is from March–May. Water D’s ORP increases from 5.77 mv in March 2014 to 140.3 mv in March 2015, or greater by 134.5 mv, and is 152.8 mv in February. Water E increases from −23.4 mv to 153.4 mv at the end of the experiment, which is an increase of 176.8 mv. The maximum value is 153.4 mv in February, which is an increase of about 132%. On the other hand, the stratification of Water F is very apparent, the lower layer has a minimum value, and the difference between the upper and lower layers is 139.3 mv, from −99.6 mv to the final 132.2 mv, which an increase of 231.8 mV. Regarding the algae grown in large quantities in Water F in March 2015, as the algae performs photosynthesis and respiratory actions, the oxygen greatly increases, and ORP increases sharply. The changes in ORP of Waters D and E are stable from the beginning to the end of the experiment, while Water D increases by 286%. Thus, it can be seen that a GWF can increase the ORP content in a water body to improve water quality, as shown in Figure 5.
3.2.5. Dissolved Oxygen (DO)
In Taiwan, the minimum allowable value of dissolved oxygen (DO) for the effluent standards is 3.0 mg/L [36]. The amount of DO in water is important for aquatic organisms; for example, when the DO of a river is less than 3.0 mg/L, it is unfavorable for most fish.
By comparing Waters D, E, and F, the three layers of Waters D and E have slight difference; the maximum DO of Water D is 9.9 mg/L, which is an increase of about three times. The maximum DO of Water E is 8.5 mg/L, which an increase of about 2.4 times. The upper, middle, and lower layers of Water F have large differences in DO content, especially in spring; the maximum DO content difference between the upper and lower layers is 11.7mg/L, and the lower layer has a minimum DO content of 1.77 mg/L. This study result is similar to that proposed by Chang et al. [14], that DO is under the average value of 3.8 mg/Land relatively unstable in the sample without AFI. The upper layers of Waters E and F have the maximum difference in March, when Water E is 4.87 mg/L higher than F. As the water aerobics condition is provided by a solar-powered aerator in both Waters D and E, the values of DO are improved significantly. In the control group, Water F does not have the abovementioned aerator, thus, its DO content is relatively low. Therefore, GWF can increase the oxygen content in water and averagely distribute DO in the upper, middle, and lower layers, as shown in Figure 5. Table 1 represents the start, final, and difference data of five water qualities for Samples A, and E to F.
3.3. Ecological Conservation Benefit
3.3.1. Biological Change of Sample D
In order to grow, sample D initially had Polypedates megacephalus (Tadpole) to absorb the nutrient substances in the water, and because Tetragnatha mandibulata comes up to prey on small insects, the water quality improved with time, and when Papilionidae (larva) appeared, it attracted a higher-level species, Caelifera, to settle, thus, forming a food chain. The maximum number of Polypedates megacephalus (Tadpole) is 52; the number of Tetragnatha mandibulata (spider) totals 30; the number of Caelifera totals 12; and, the number of Papilionidae (larva) totals 5. The external ambient temperature, solar radiation, and illumination increased in the mid- and late stages, ORP and DO increased by over two times, and Polypedates megacephalus and Tetragnatha mandibulat are produced and looked for food, thus, attracting later species Papilionidae (larva) and Caelifera to settle. Therefore, as GWF increased biodiversity and improved the environment, Sample D formed an ecological habitat (Figure 6). Chang et al. [37] conducted a study to explore the effects of the green energy landscape fountain (GLF) on ecological preservation. The results of this study agree with Chang et al. [37], that the improvement of water quality will result in increased species richness.
3.3.2. Biological Change of Sample E
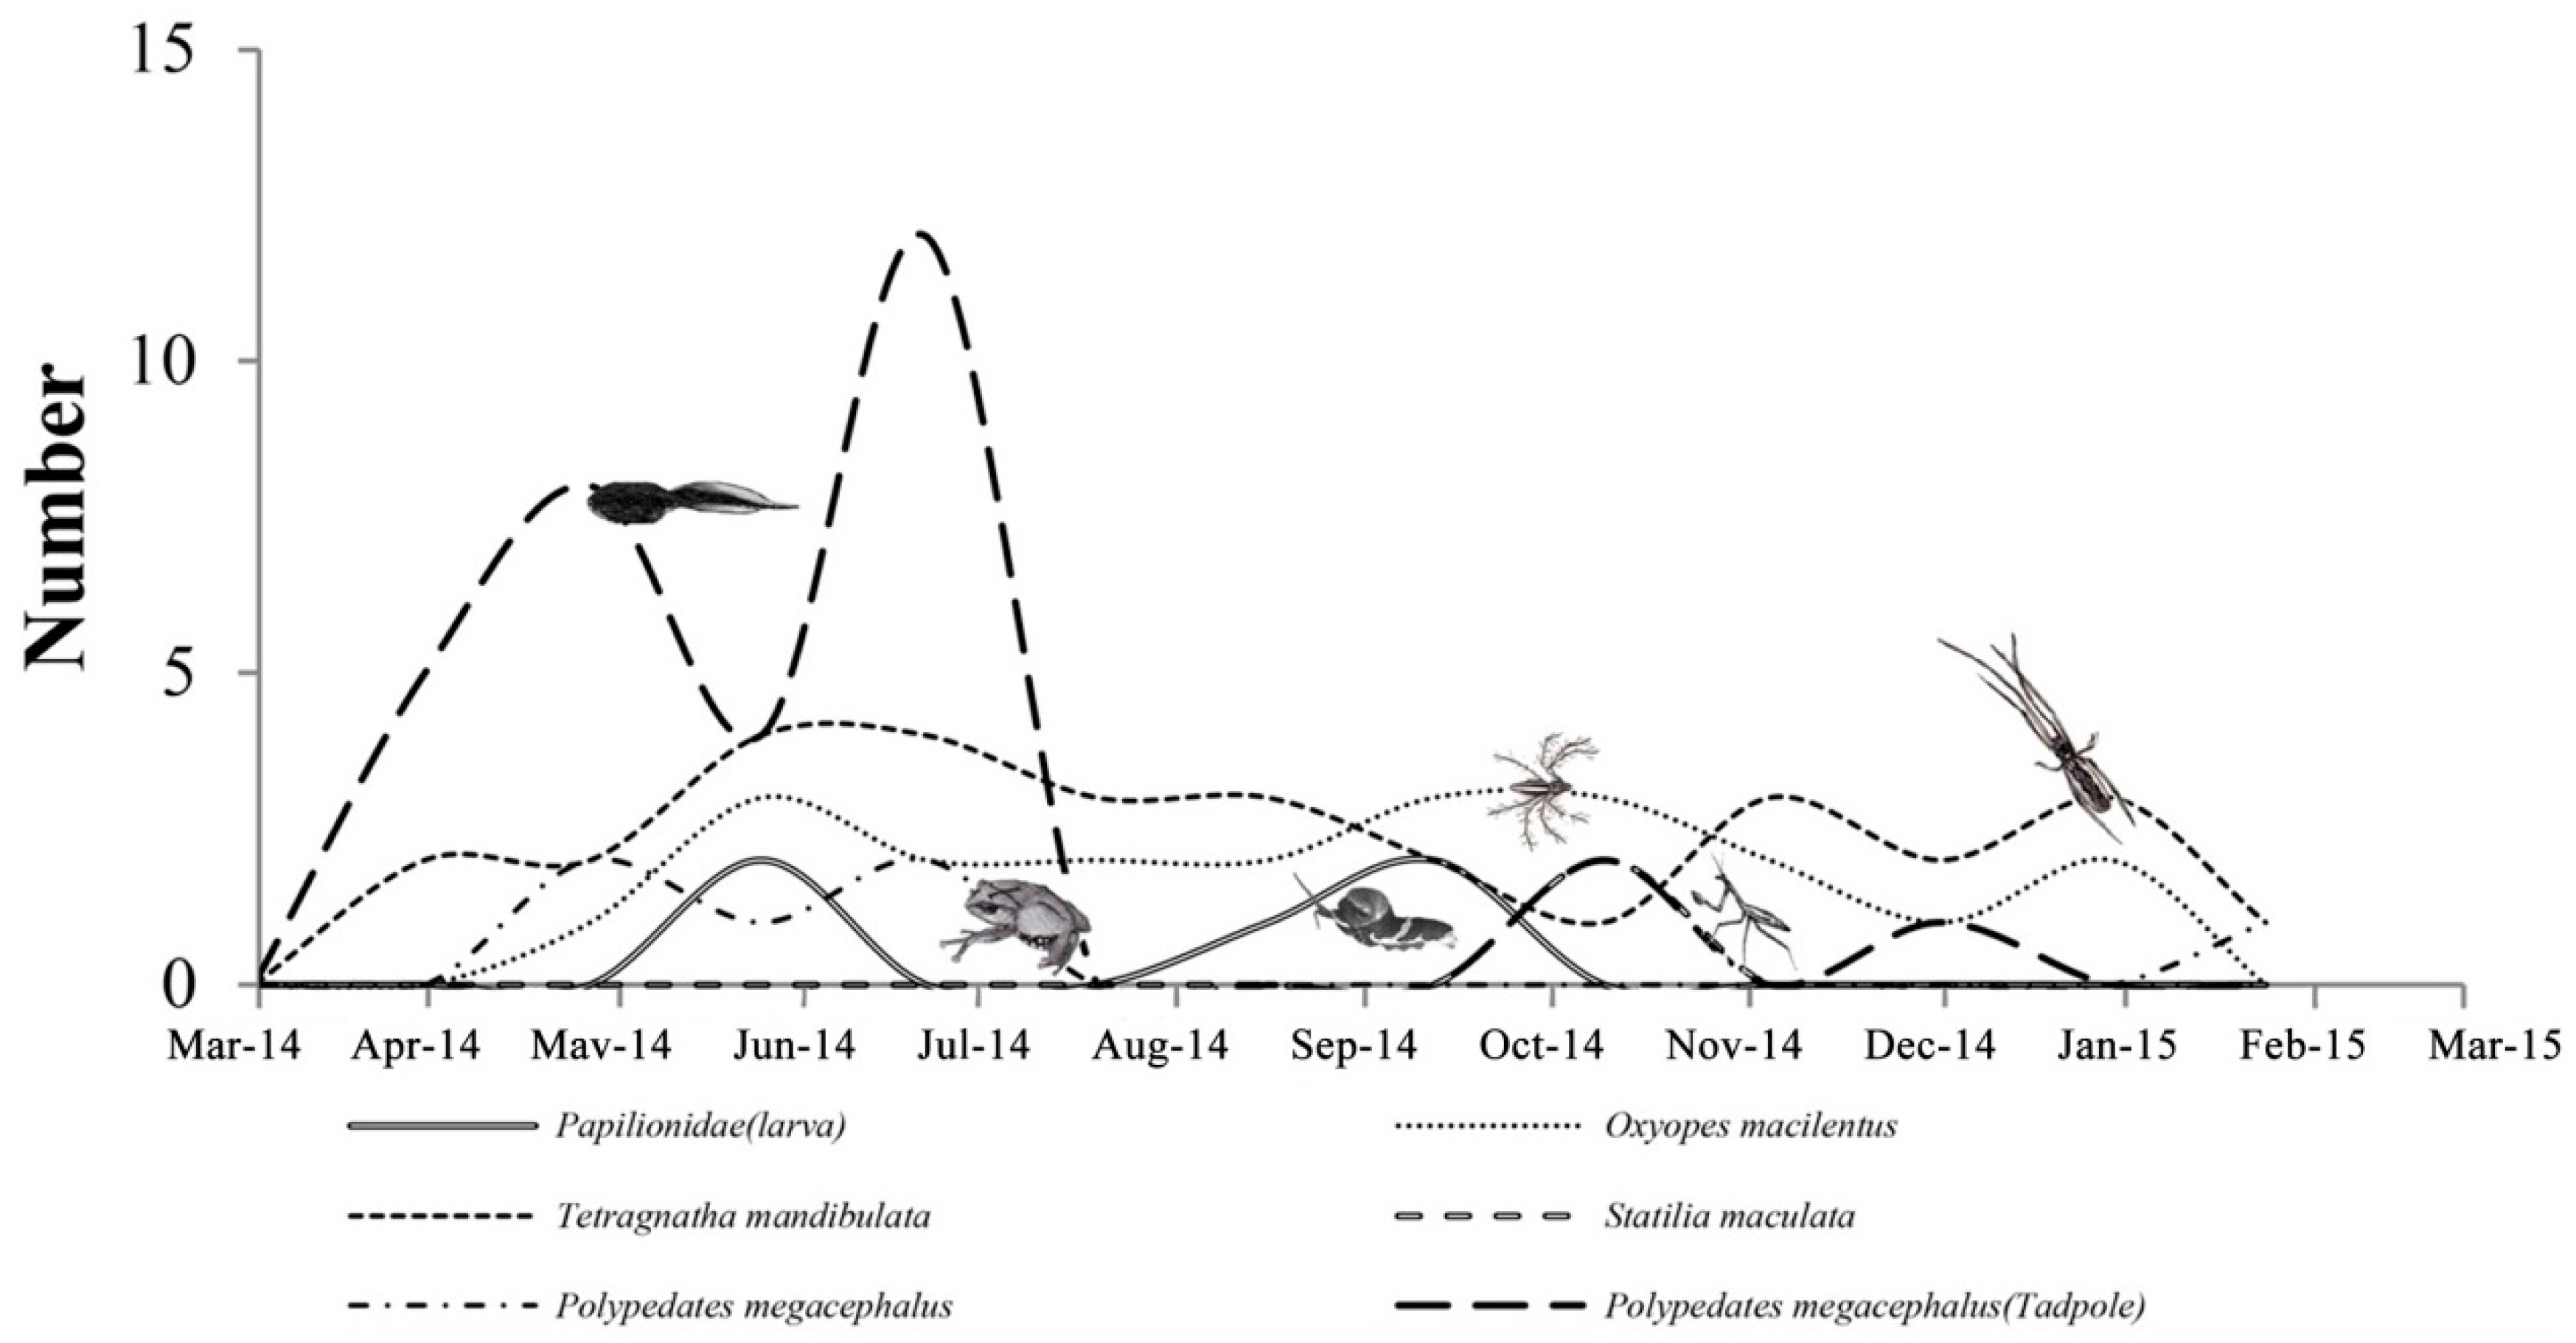
Polypedates megacephalus (Tadpole) and Tetragnatha mandibulata settled in Sample E in the beginning. As Tetragnatha mandibulata preys on small insects, when Tetragnatha mandibulata becomes stable, Oxyopes macilentus appears, and the Papilionidae (larva) and Polypedates megacephalus settle and look for food, thus, forming a food chain. The external ambient temperature, solar radiation, and illumination increased in the mid- and late stages, the ORP and DO are improved and restored to pristine condition, and the number of species increased. The species are abundant, and the high-level species Statiliamaculata preys on Tetragnatha mandibulata and Oxyopes macilentus, thus, forming a food chain and attracting the more advanced consumer Polypedates megacephalus to settle and reproduce (Figure 7). The results of this study agree with Yao et al. [27], that agricultural landscapes can improve biodiversity.
3.3.3. Biological Change of Sample F
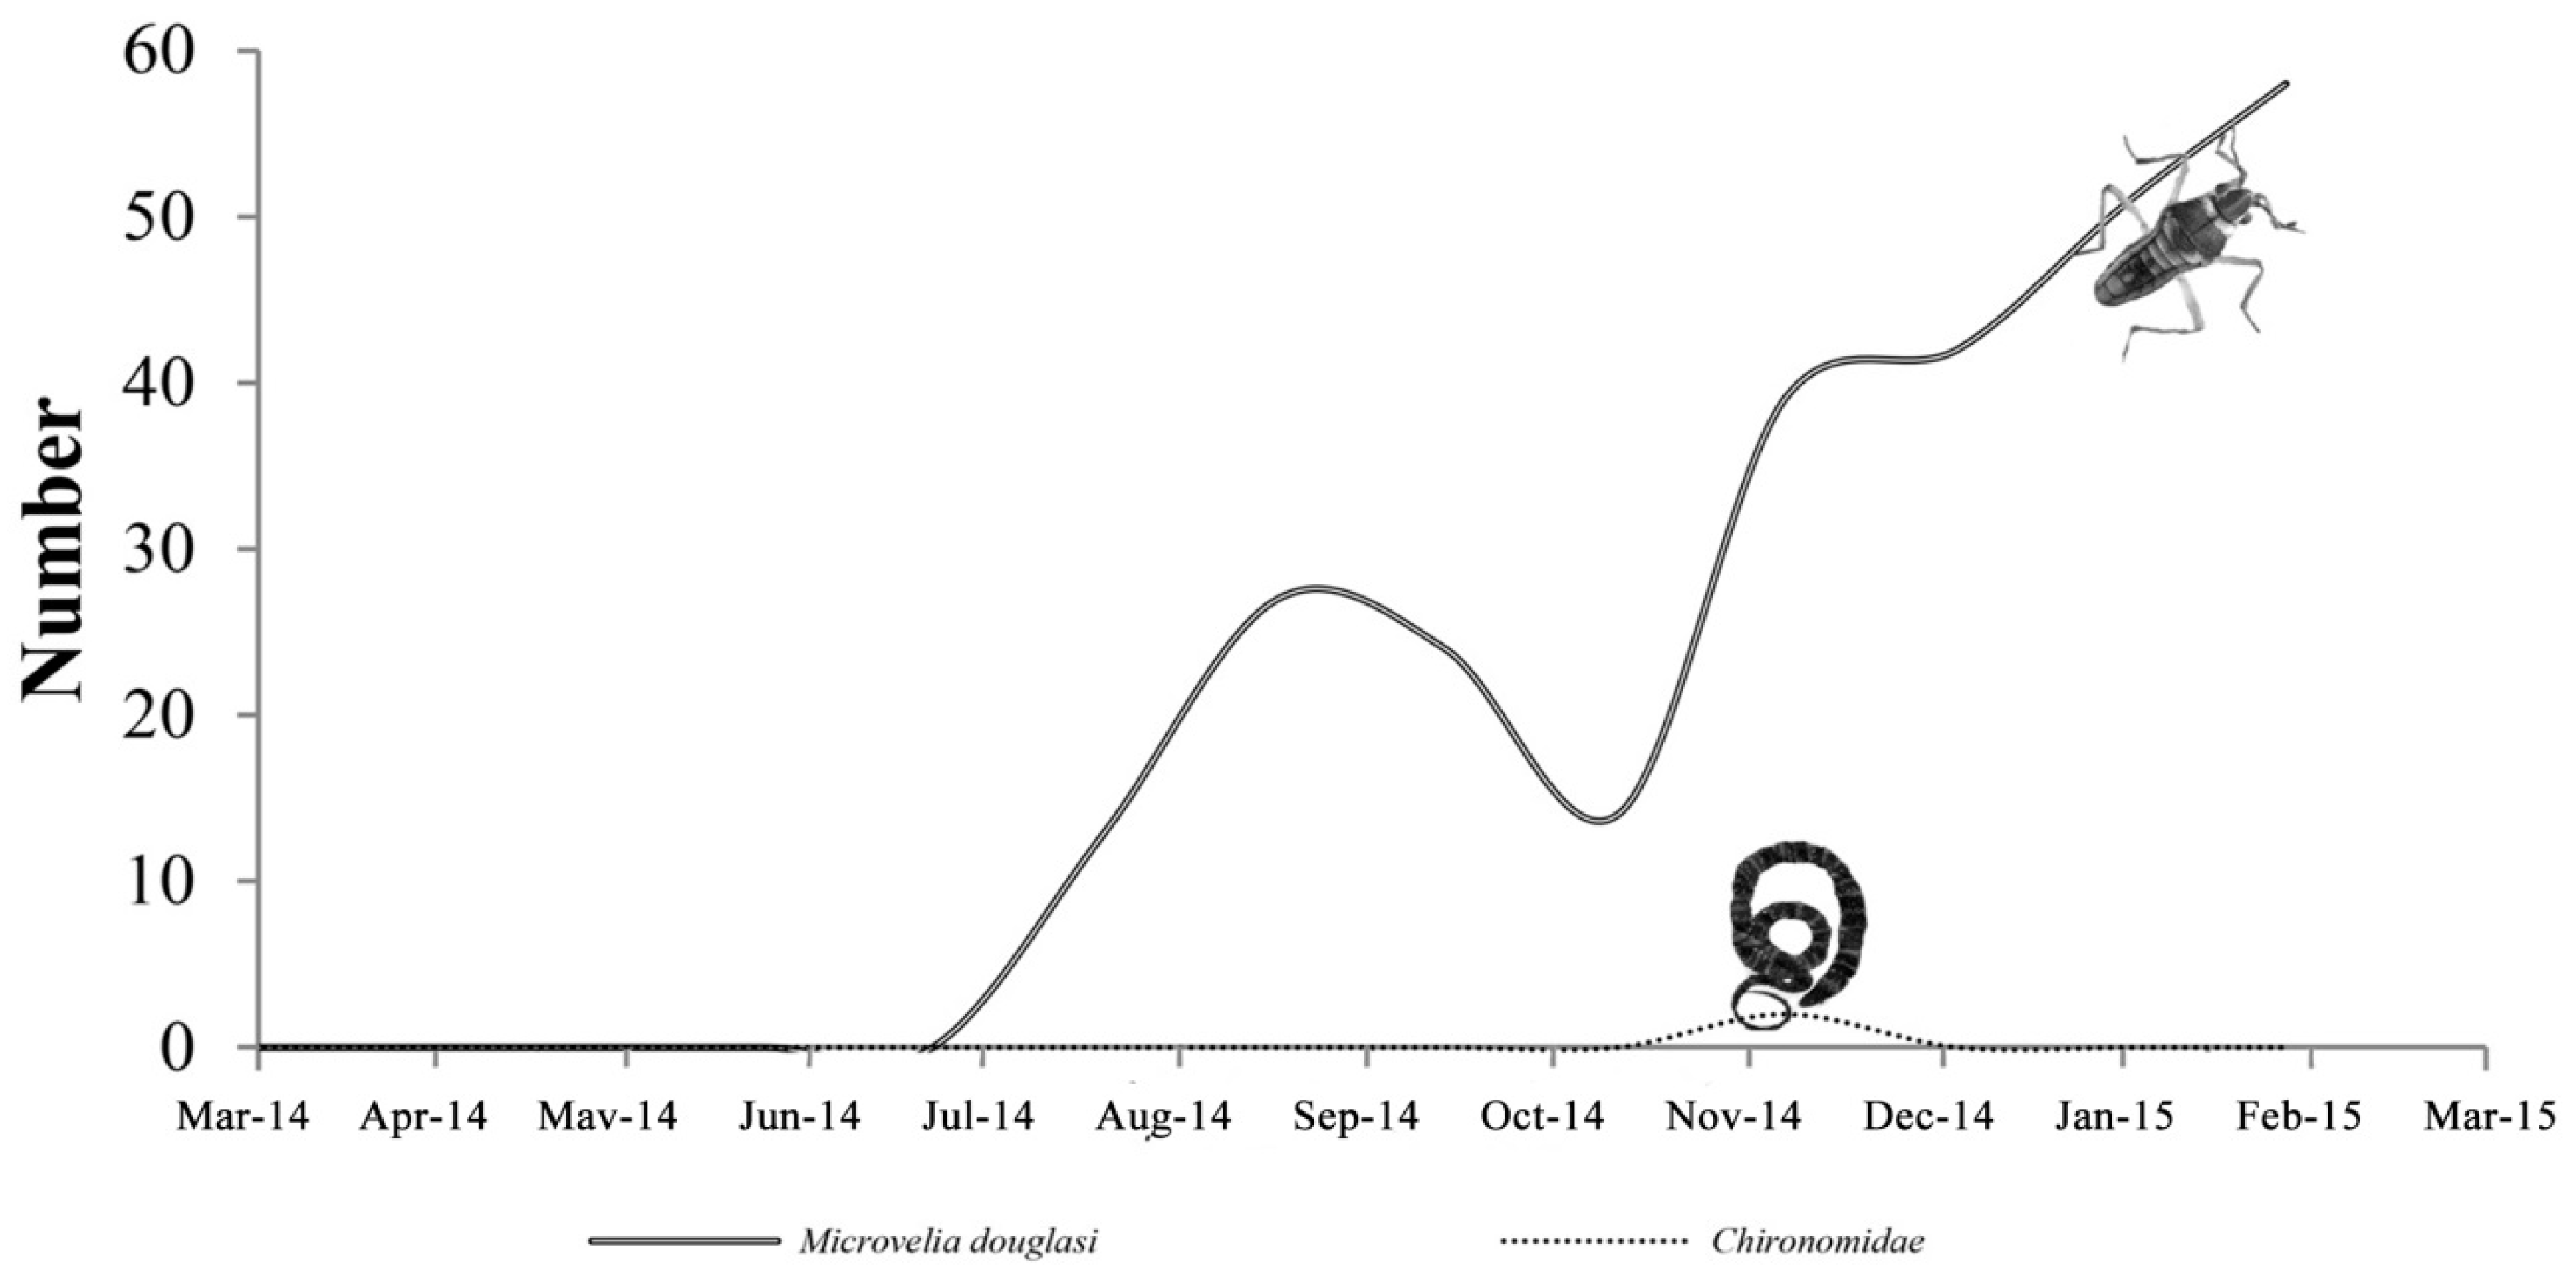
As there is no GWF in this sample and water quality stratification is apparent, the maximum DO difference between the upper layer and lower layer is over 11mg/L, and the minimum is only 1.77mg/L; thus, the aquatic environment is extreme and poor, and is inhabited by few species. However, many Microvelia douglasi appeared, which live in dark, damp, and still water areas, and have high fouling resistance, and because this environment is adverse to other predators, it reproduces in large quantities. When the water quality becomes worse in the late stage, the sewage organism Chironomidae appeared. Therefore, Sample F without a GWF has worse water quality, resulting in most of the species not surviving, and species diversity is relatively low (Figure 8).
3.4. Statistical Analysis Results
In this study, as the upper layer of Waters D and E exhibited better benefits of water quality improvement than the middle and lower layers, the upper layer is selected for statistical analysis.
The statistical analysis results of ANOVA with Scheffe’s test available in SPSS Statistics showed that: (1) For samples D and F, DO (p = 0.641), EC (p = 0.03, p < 0.05), ORP (p = 0.021, p < 0.05), pH (p = 0.656), Temperature (p = 0.969). (2) For samples E and F, DO (p = 1.000), EC (p = 0.259), ORP (p = 0.140), pH (p = 0.507), Temperature (p = 0.999). This implies that only the EC and ORP for the two groups (samples D and F) have reached statistical significance. The statistical results suggest that sample D has better benefit for water quality improvement than sample E.
4. Discussion and Conclusions
This study proposed a Green Water Farm (GWF) to increase the practical application value of traditional AFIs. The outstanding feature of this study is that GWF allows for terrestrial plants to grow and carry out water purification and ecological conservation. The results showed that GWF could be used to carry out water purification and ecological conservation. In particular, the study results provided useful information for more food sources for humans and animals, and increased biodiversity. In particular, there was no obvious stratification in the GWF system (Waters D and E), meaning that the water was uniformly mixed. The statistical results suggest that sample D has better benefit of water quality improvement than sample E.
In the view of ecology, the samples with a GWF (i.e., Waters D and E) showed better ecology conservation benefits than the sample without a GWF (i.e., Water F). As shown in the previous section, four species, i.e., Polypedates megacephalus (Tadpole), Tetragnatha mandibulata, Papilionidae (larva), and Caelifera, appeared in Sample D. Moreover, six species, i.e., Polypedates megacephalus (Tadpole), Tetragnatha mandibulata, Oxyopes macilentus, Papilionidae (larva), Statiliamaculata, and Polypedates megacephalus, appeared in Sample E. However, only two saprobic index species, Microvelia douglasi and Chironomidae, appeared in Sample F throughout the entire year. According to the number of species, it can be suggested that Samples D and E have better ecological conservation benefits than Sample F. Moreover, it is worth noting that the existence of frogs can generally be used to identify whether an environment is good or bad, as frogs are also generally regarded as a keystone species in ecology. The existence of frogs (i.e., Polypedates megacephalus) in Sample E pointed out that Sample E is an acceptable habitat for frogs, which provides further evidence that a GWF can help ecological conservation.
Acknowledgments
Authors are appreciative of financial support from the Ministry of Science and Technology (MOST) of Taiwan, Project Number: MOST 104-2221-E-451-012.
Author Contributions
All authors are responsible for the design of the research. Yuan-Hsiou Chang and Ting-Jie Zhuang were mainly responsible for the experimental control. Tsai-Fu Chuang was mainly responsible for the statistical analysis. All authors contributed to the writing of the paper and to the discussion of the analysis.
Conflicts of Interest
The authors declare no conflicts of interest.
References
- Shih, P.K.; Chang, W.L. Surveying the growth of aquatic macrophyte and water purification on artificial floating island. J. Chin. Agric. Eng. 2006, 29, 1–13. [Google Scholar]
- Huang, C.H. Effects of Floating Beds on Water Purification in Salt Marsh Type of Constructed Wetlands; Department of Marine Biotechnology and Resources, National Sun Yat-sen University: Kaohsiung, Taiwan, 2013. (In Chinese) [Google Scholar]
- Artificial Floating Island Study Group. Guideline for Installation of Artificial Floating Island; Water Resources Environment Technology Center (WEC): Tokyo, Japan, 2000. (In Japanese) [Google Scholar]
- Will, G.C.; Crawford, G.I. Evaluated and floating nest structures for Canada geese. J. Wildl. Manag. 1970, 34, 583–586. [Google Scholar] [CrossRef]
- Hirose, T. Introduction of Applied Ecological Engineering; Shinzansha: Tokyo, Japan, 1997; Volume 70. (In Japanese) [Google Scholar]
- Environmental Protection Administration, R.O.C. Water Quality Monitoring Project and Its Significance. 2015. Available online: http://ecological.epa.gov.tw/Taiwan.aspx?Num=06 (accessed on 30 June 2016).
- Liu, H. Environmental Greening Foundation. Introduction of Artificial Floating Island on T Drunken Moon Lake in Taiwan University. 2009. Available online: http://www.hsiliu.org.tw/ (accessed on 28 February 2016).
- Nakamura, K.; Mueller, G. Review of the performance of the artificial floating island as a restoration tool for aquatic environments. In Proceedings of the World Environmental and Water Resources Congress, Honolulu, HI, USA, 12–16 May 2008; pp. 1–10. [Google Scholar]
- Wen, L.; Recknagel, F. In situ removal of dissolved phosphorus in irrigation drainage water by planted floats: Preliminary results from growth chamber experiment. Agric. Ecosyst. Environ. 2002, 90, 9–15. [Google Scholar] [CrossRef]
- Kamble, R.; Patil, D. Artificial Floating Island: Solution to River Water Pollution in India. Case Study: River in Pune City. In Proceedings of the International Conference on Environmental, Biomedical and Biotechnology, Dubai, UAE, 4–5 August 2012; Volume 41, pp. 136–140. [Google Scholar]
- Bernie, M. The ability of vegetated floating Islands to improve water quality in natural and constructed wetlands: A review. Water Pract. Technol. 2012, 7. [Google Scholar] [CrossRef]
- Liu, X.; Li, J. The Progress of Chinese Aquatic Ecological Restoration; Hanghzou Dianzi University: Hangzhou, China, 2013. [Google Scholar]
- Dai, W.C.; Chiang, H. Effectiveness of improving lake water quality through artificial floating island system. J. Chin. Agric. Eng. 2008, 54, 26–34. [Google Scholar]
- Chang, Y.H.; Wu, B.Y.; Lai, C.F. The effect of a green energy landscape fountain on water quality improvement. Ecol. Eng. 2014, 73, 201–208. [Google Scholar] [CrossRef]
- Zhang, X.; Chen, C.; Ding, J.; Hou, A.; Li, Y.; Niu, B.; Su, X.; Xu, Y.; Laws, E. The 2007 water crisis in Wuxi, China: Analysis of the origin. J. Hazard. Mater. 2010, 182, 130–135. [Google Scholar] [CrossRef] [PubMed]
- Lu, H.L.; Ku, C.R.; Chang, Y.H. Water quality improvement with artificial floating islands. Ecol. Eng. 2015, 74, 371–375. [Google Scholar] [CrossRef]
- Keigo, N. Artificial floating island technical Isaono. Civ. Technol. Inf. 1999, 41, 26–31. [Google Scholar]
- Kalff, J. Limnology: Inland Water Ecosystems; Prentice Hall: Upper Saddle River, NJ, USA, 2001. [Google Scholar]
- Wang, Z.Q.; Shi, Y.; Cheng, M.M.; He, C.G.; Zhuang, J.; Sheng, L.X. Purification of small-scale stagnant water in urban regions: Human-powered water lift and bank-based constructed wetland. Ecol. Eng. 2015, 83, 108–111. [Google Scholar] [CrossRef]
- Carolin, G.; Christina, V.H.; Christian, A. Optimizing environmental measures for landscape multifunctionality: Effectiveness, efficiency and recommendations for agri-environmental programs. J. Environ. Manag. 2015, 151, 243–257. [Google Scholar]
- Fager, L.F.; York, J.C. Floating islands for waterfowl in Arizona. Soil Conserv. 1975, 41, 4–5. [Google Scholar]
- Payne, N.F. Techniques for Wildlife Habitat Management of Wetlands; McGraw-Hill, Inc.: New York, NY, USA, 1992. [Google Scholar]
- Hiraoka, T. Utilization of artificial floating objects as nest Platforms by little Grebes and Eurasian, Central Japan. J. Yamashina Inst. Ornithol. 1996, 28, 108–112. [Google Scholar] [CrossRef]
- Momose, H.; Funakubo, S.; Kibe, N.; Nakamura, K.; Fujiwara, N.; Tanaka, T. Use of different types of planted floating islands by water birds. Environ. Syst. Res. 1998, 26, 45–53. (In Japanese) [Google Scholar] [CrossRef]
- Pei, K. Activity Rhythm of the Spinous Country Rat (Niviventer coxingi) in Taiwan. Zool. Stud. 1995, 34, 55–58. [Google Scholar]
- Wang, L.; Eagles, P. Some theoretical considerations: From landscape ecology to waterscape ecology. Acta Ecol. Sin. 2009, 29, 176–181. [Google Scholar]
- Yao, K.; Song, S.; Zhang, Z.; Xu, J.; Zhang, R.; Liu, J.; Cheng, L.; Liu, J. Vegetation characteristics and water purification by artificial floating island. Afr. J. Biotechnol. 2011, 10, 19119–19125. [Google Scholar]
- Yen, N.; Yen, P.; Chang, Y.H. Artificial floating islands for environmental improvement. Renew. Sustain. Energy Rev. 2015, 47, 616–622. [Google Scholar]
- Evans, M.C.; Carwardine, J.; Fensham, R.J.; Butler, D.W.; Wilson, K.A.; Possingham, H.P.; Martin, T.G. Carbon farming via assisted natural regeneration as a cost-effective mechanism for restoring biodiversity in agricultural landscapes. Environ. Sci. Policy 2015, 50, 114–129. [Google Scholar] [CrossRef]
- Gagné, S.A.; Eigenbrod, F.; Bert, D.G.; Cunnington, G.M.; Olson, L.T.; Smith, A.C.; Fahrig, L. A simple landscape design framework for biodiversity conservation. Landsc. Urban Plan. 2015, 136, 13–27. [Google Scholar]
- Fahrig, L.; Girard, J.; Duro, D.; Pasherb, J.; Smithb, A.; Javorekc, S.; Kinga, D.; Lindsaya, K.F.; Mitchella, S.M.; Tischendorfa, L. Farmlands with smaller crop fields have higher within-field biodiversity. Agric. Ecosyst. Environ. 2015, 200, 219–234. [Google Scholar] [CrossRef]
- Faulwetter, J.L.; Burr, M.D.; Cunningham, A.B.; Stewart, F.M.; Camper, A.K.; Stein, O.R. Floating treatment wetlands for domestic wastewater treatment. Water Sci. Technol. 2011, 64, 2089–2095. [Google Scholar] [CrossRef] [PubMed]
- Kato, Y.; Takemon, Y.; Hori, M. Invertebrate assemblages in relation to habitat types on a floating mat in Mizorogaike Pond, Kyoto, Japan. Limnology 2009, 10, 167–176. [Google Scholar] [CrossRef]
- Song, H.L.; Li, X.N.; Wang, X.J.; Lu, X.W. Enhancing nitrogen removal performance of vegetated floating-bed by adding Hyriopsiscumingii Lea and an artificial medium. Fresenius Environ. Bull. 2011, 20, 2435–2441. [Google Scholar]
- Lee, P.F.; Liang, S.H. The Assess Mode Validation of Animal Ecology Research and Evaluation Techniques; Executive Yuan Environmental Protection Agency: Taipei, Taiwan, 2003.
- Environmental Protection Administration, R.O.C. Effluent Standards. Available online: https://oaout.epa.gov.tw/law/ (accessed on 28 February 2017).
- Chang, Y.H.; Wu, B.Y.; Lai, C.F. A study of the ecological benefits of the green energy landscape fountain. Ecol. Eng. 2015, 75, 128–136. [Google Scholar] [CrossRef]
Figure 1.
Standard set-up of Green Water Farms.

Figure 2.
Water samples’ distributed architecture.
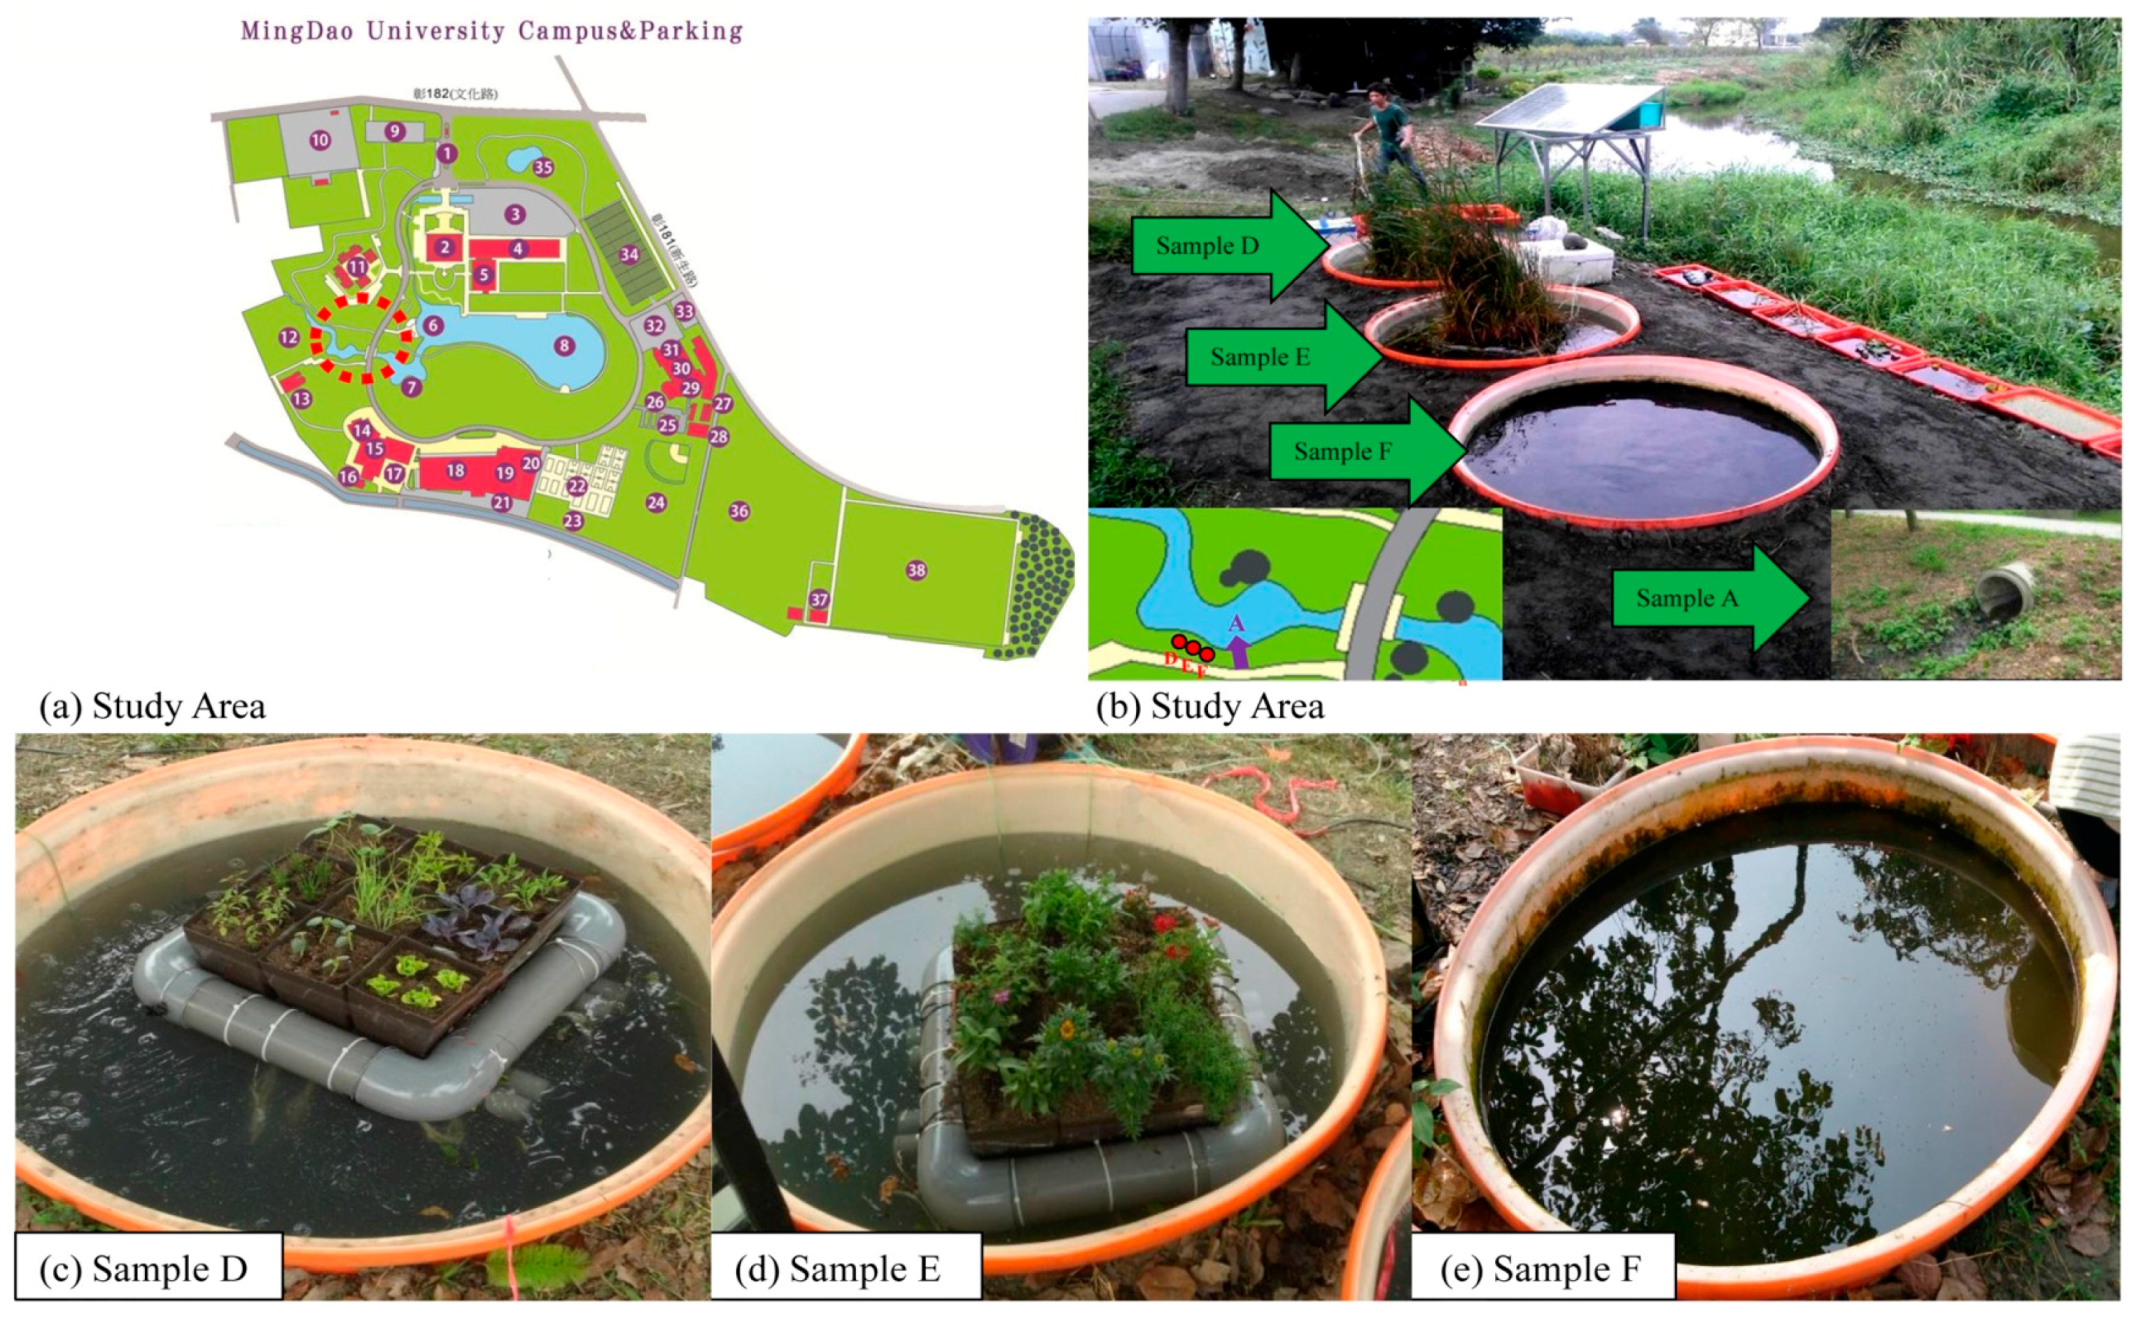
Figure 3.
Climatic conditions for the experimental period.

Figure 4.
Experimental results of five water qualities (monthly).
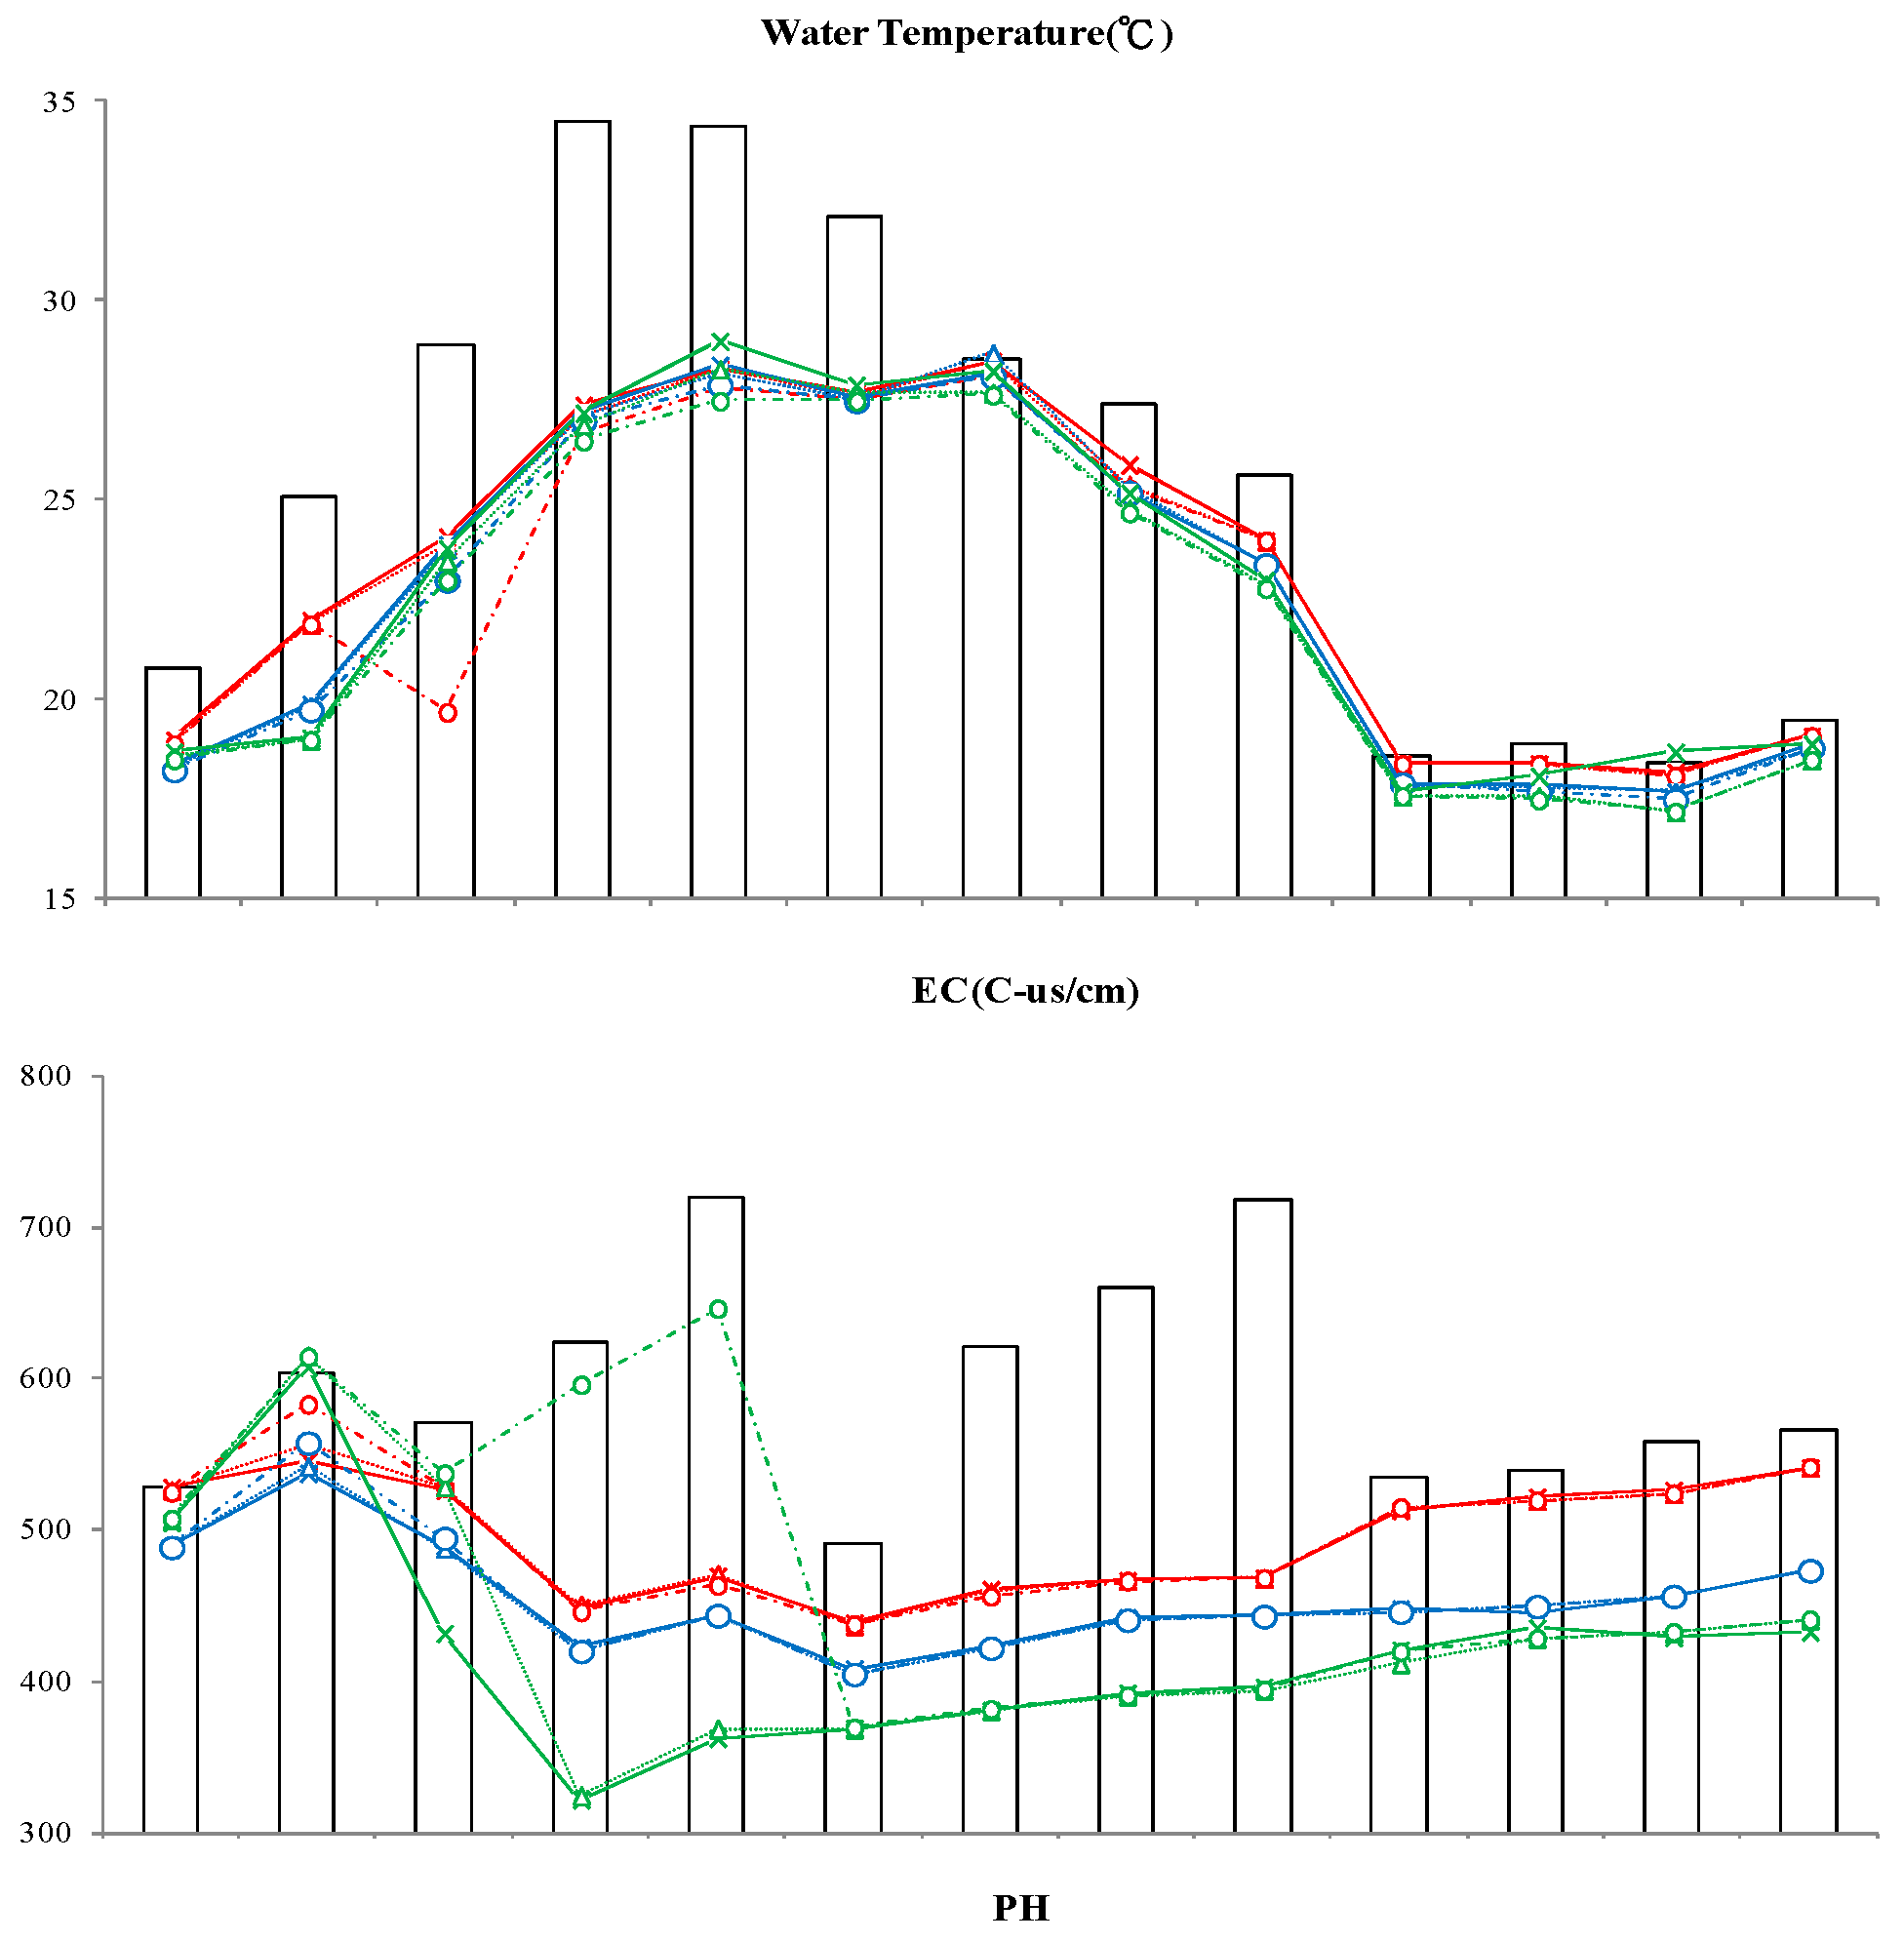
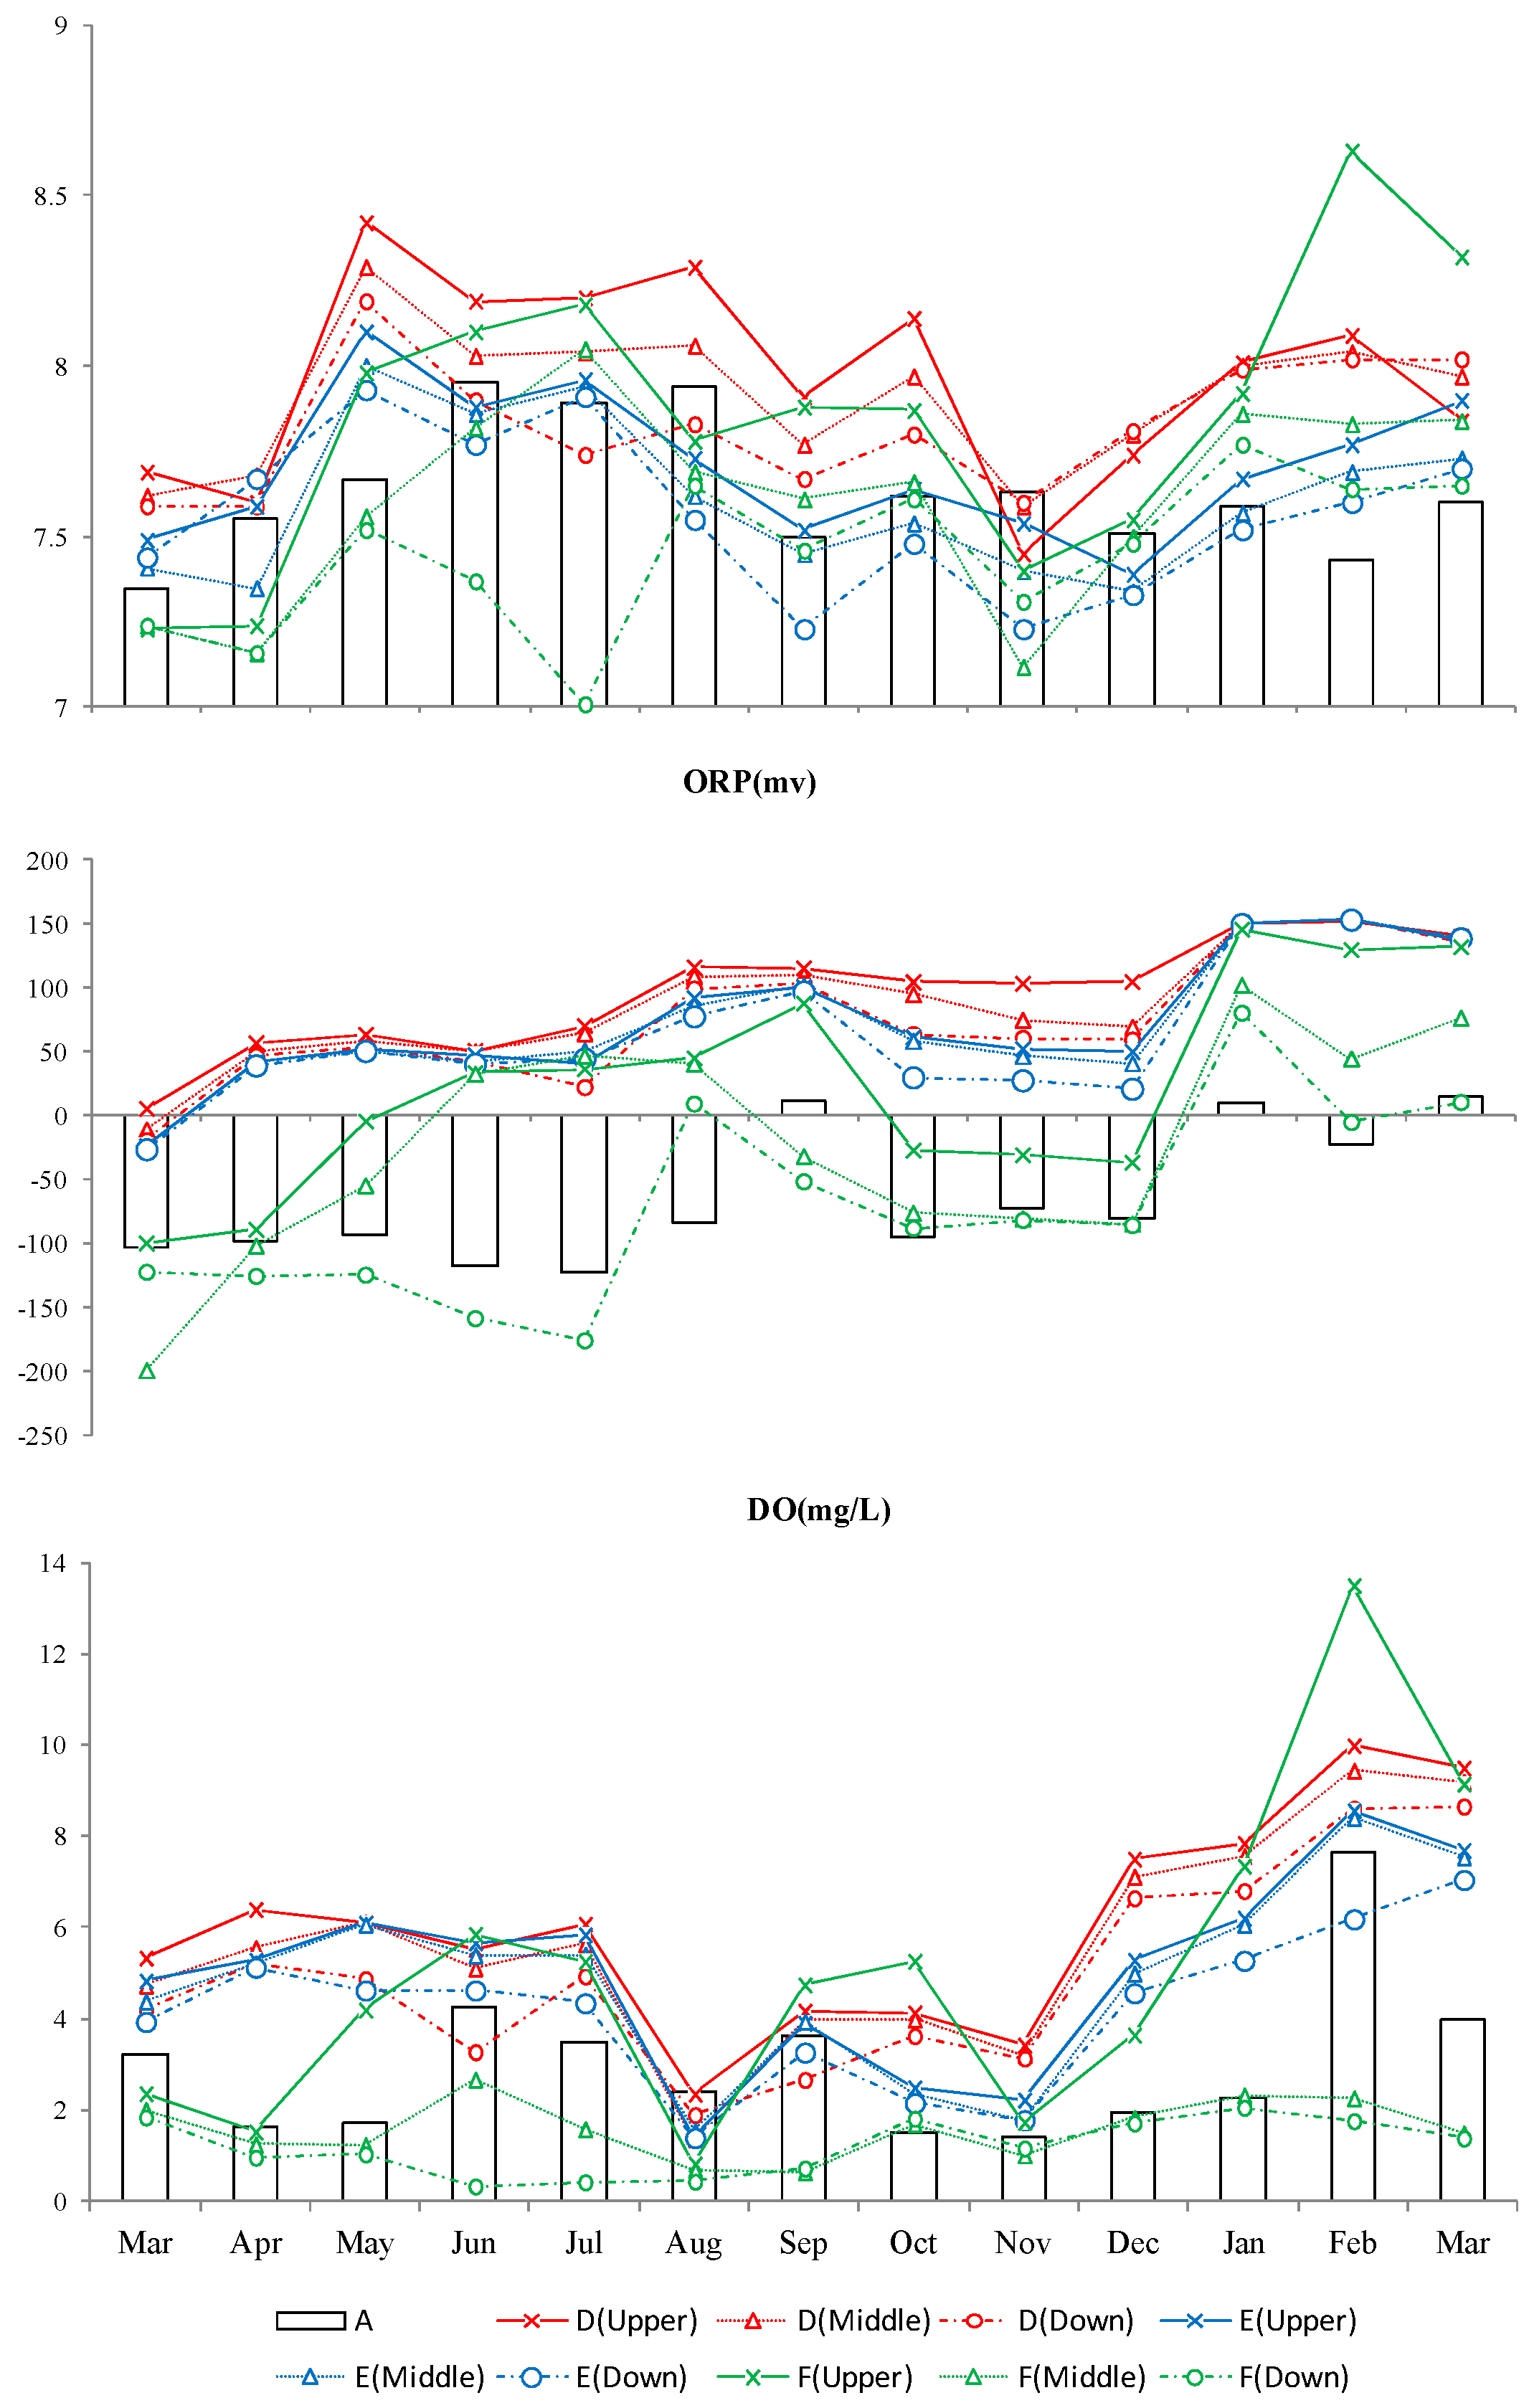
Figure 5.
Experimental results of five water qualities (average).


Figure 6.
Number of each species for Water D (monthly).
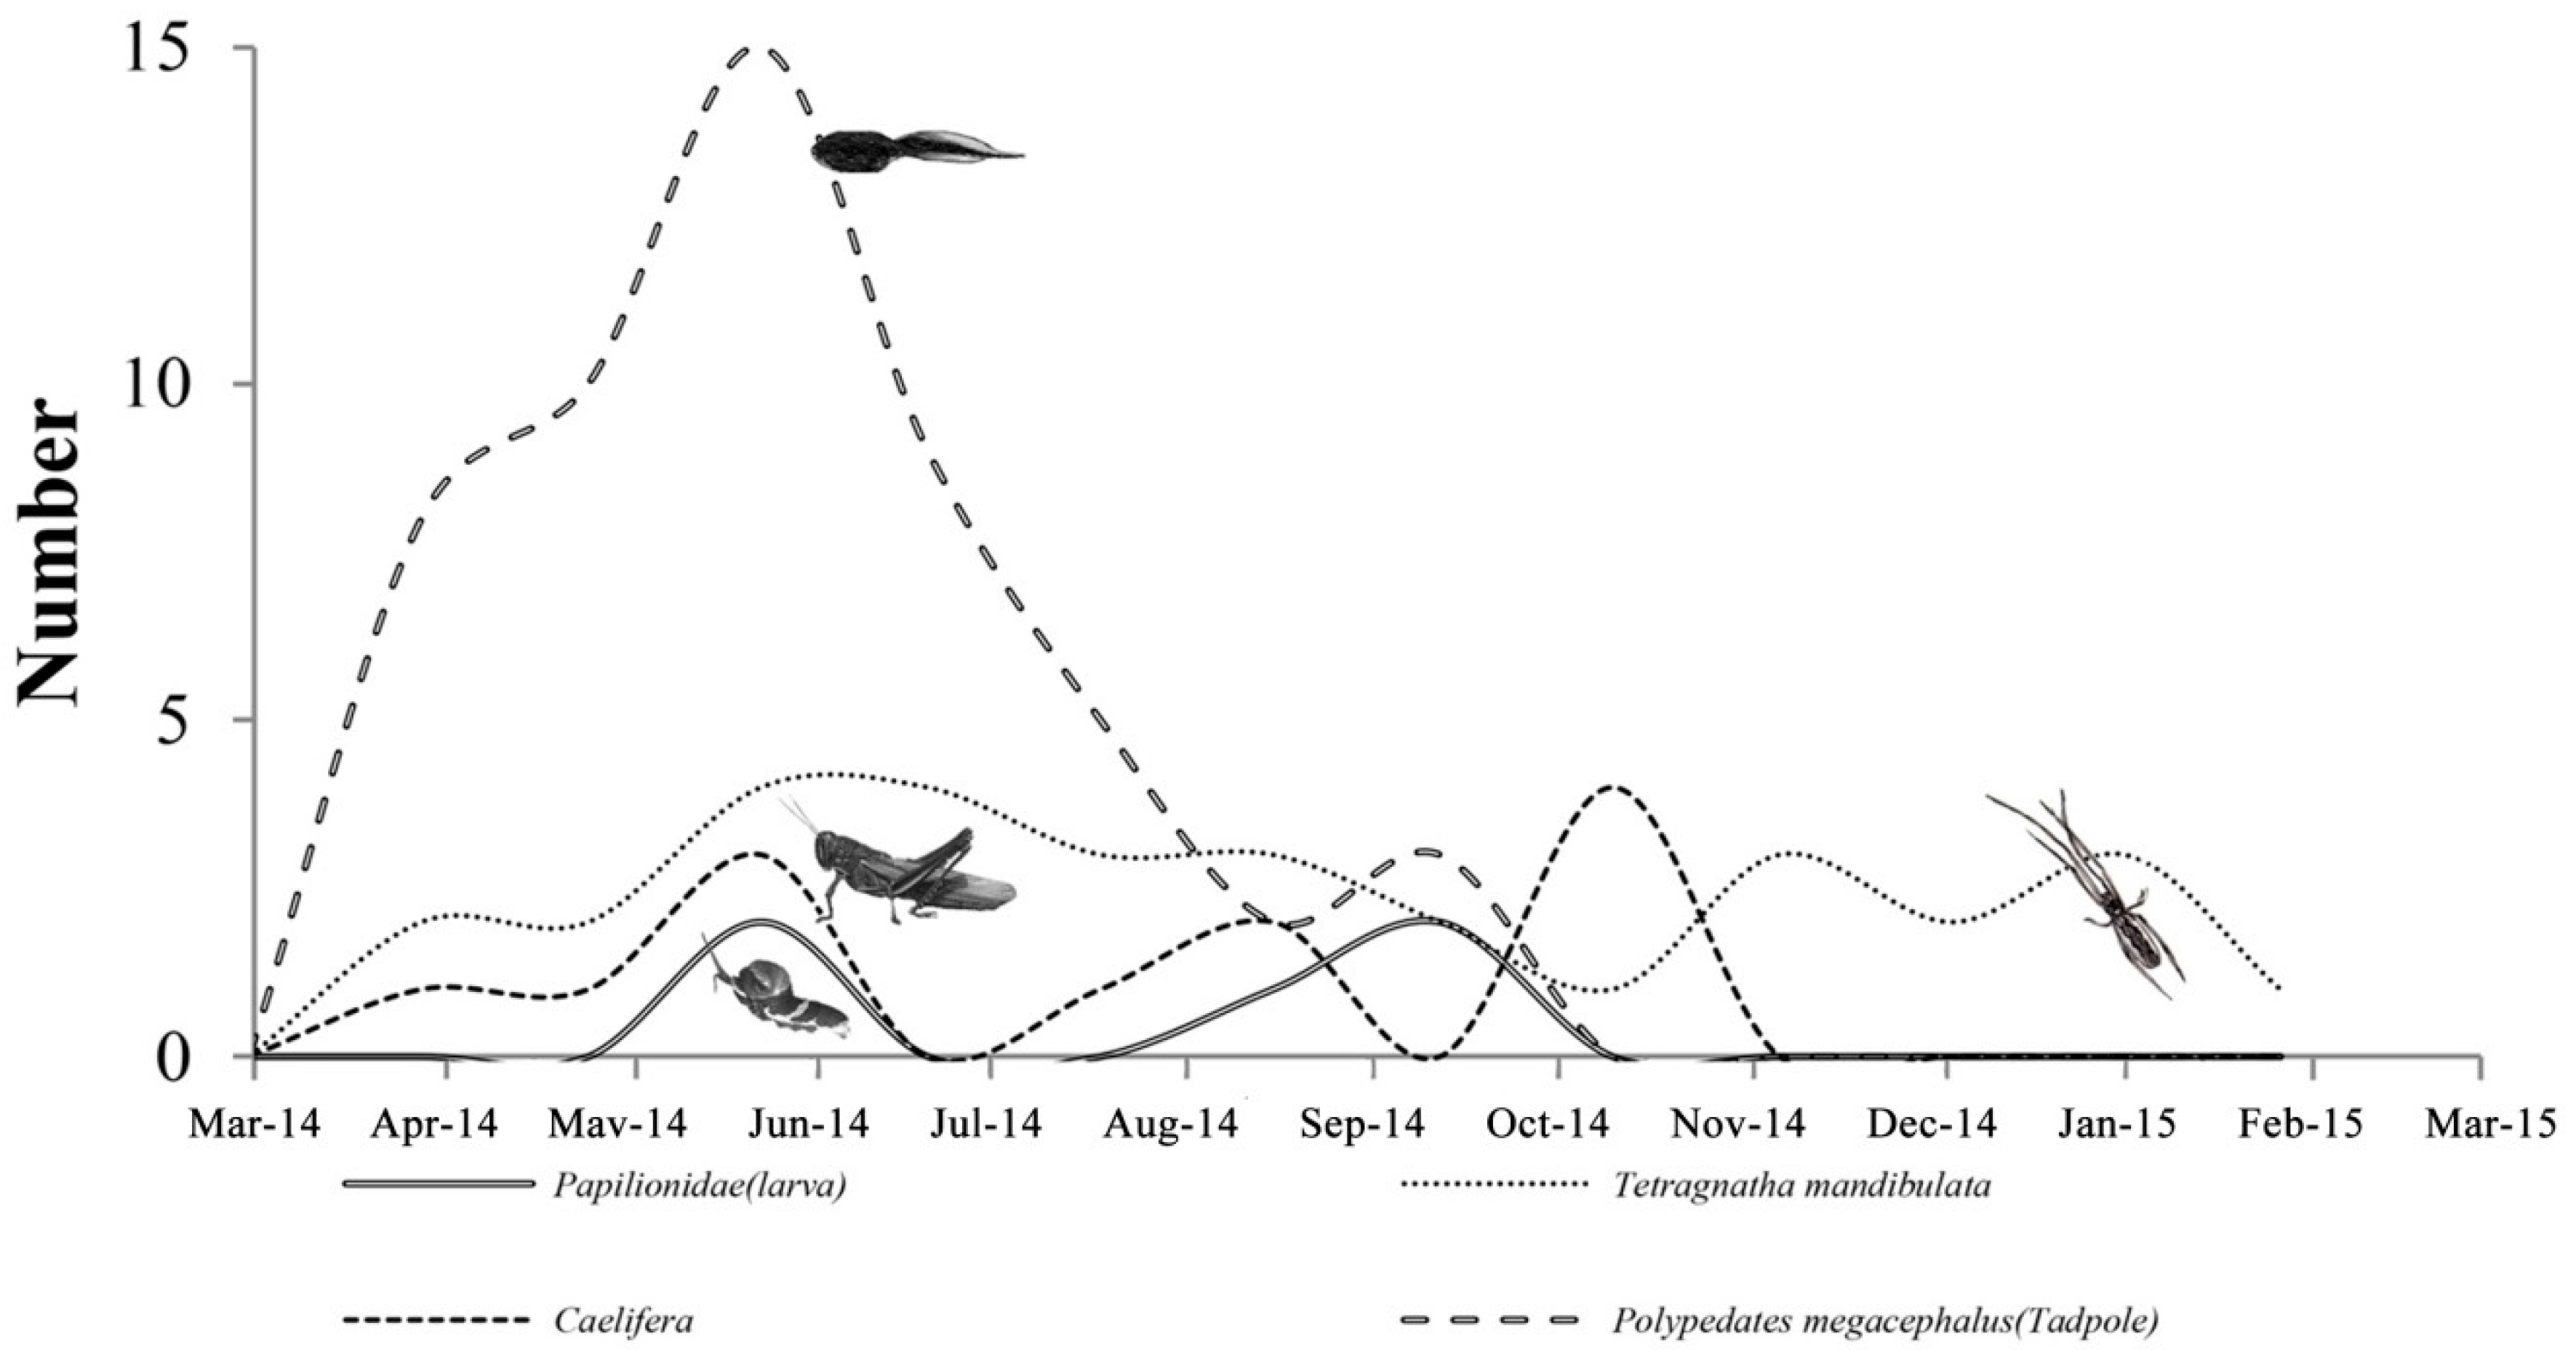
Figure 7.
Number of each speciesfor Water E (monthly).

Figure 8.
Number of each species for Water F (monthly).

Table 1.
Start, final, and difference data of five water qualities.
| Project Sample | Tempe (°C) | DO (mg/L) | EC (C-μS/cm) | pH | OR (mv) | |
|---|---|---|---|---|---|---|
| A | Start | 20.8 | 3.2 | 527.9 | 7.3 | −103 |
| Final | 19.5 | 4 | 566.5 | 7.6 | 14.8 | |
| Difference | 1.3 | 0.8 | 38.6 | 0.3 | 117.8 | |
| D | Start | 18.9 | 4.7 | 526 | 7.6 | −10.9 |
| Final | 19.1 | 9.2 | 541 | 7.9 | 138 | |
| Difference | 0.2 | 4.5 | 15 | 0.3 | 148.9 | |
| E | Start | 18.2 | 4.3 | 488.6 | 7.4 | −24.5 |
| Final | 18.8 | 7.5 | 473.3 | 7.7 | 138.7 | |
| Difference | 0.6 | 3.2 | 15.3 | 0.3 | 163.2 | |
| F | Start | 18.5 | 2 | 507 | 7.2 | −199 |
| Final | 18.5 | 1.5 | 441 | 7.8 | 76.4 | |
| Difference | 0 | 0.5 | 66 | 0.6 | 275.4 | |
Note: “Start” represents the first data of the entire experimental period; “Final” represents the final data of the entire experimental period; “Difference” is the difference between the first and final data.
© 2017 by the authors. Licensee MDPI, Basel, Switzerland. This article is an open access article distributed under the terms and conditions of the Creative Commons Attribution (CC BY) license (http://creativecommons.org/licenses/by/4.0/).
Share and Cite
MDPI and ACS Style
Chang, Y.-H.; Zhuang, T.-J.; Chuang, T.-F.; Wu, B.-Y.; Lu, H.-l.; Chen, P.-Y. Using Green Water Farm to Improve Ecological Restoration. Sustainability 2017, 9, 1896. https://doi.org/10.3390/su9101896
AMA Style
Chang Y-H, Zhuang T-J, Chuang T-F, Wu B-Y, Lu H-l, Chen P-Y. Using Green Water Farm to Improve Ecological Restoration. Sustainability. 2017; 9(10):1896. https://doi.org/10.3390/su9101896
Chicago/Turabian StyleChang, Yuan-Hsiou, Ting-Jie Zhuang, Tsai-Fu Chuang, Bing-Yu Wu, Hsiao-ling Lu, and Pen-Yuan Chen. 2017. "Using Green Water Farm to Improve Ecological Restoration" Sustainability 9, no. 10: 1896. https://doi.org/10.3390/su9101896
Note that from the first issue of 2016, this journal uses article numbers instead of page numbers. See further details here.