Long-Term Sustainability from the Perspective of Cullet Recycling in the Container Glass Industry: Evidence from Italy

 , and
, and
Abstract
:1. Introduction
2. Background
2.1. A Brief Historical Overview
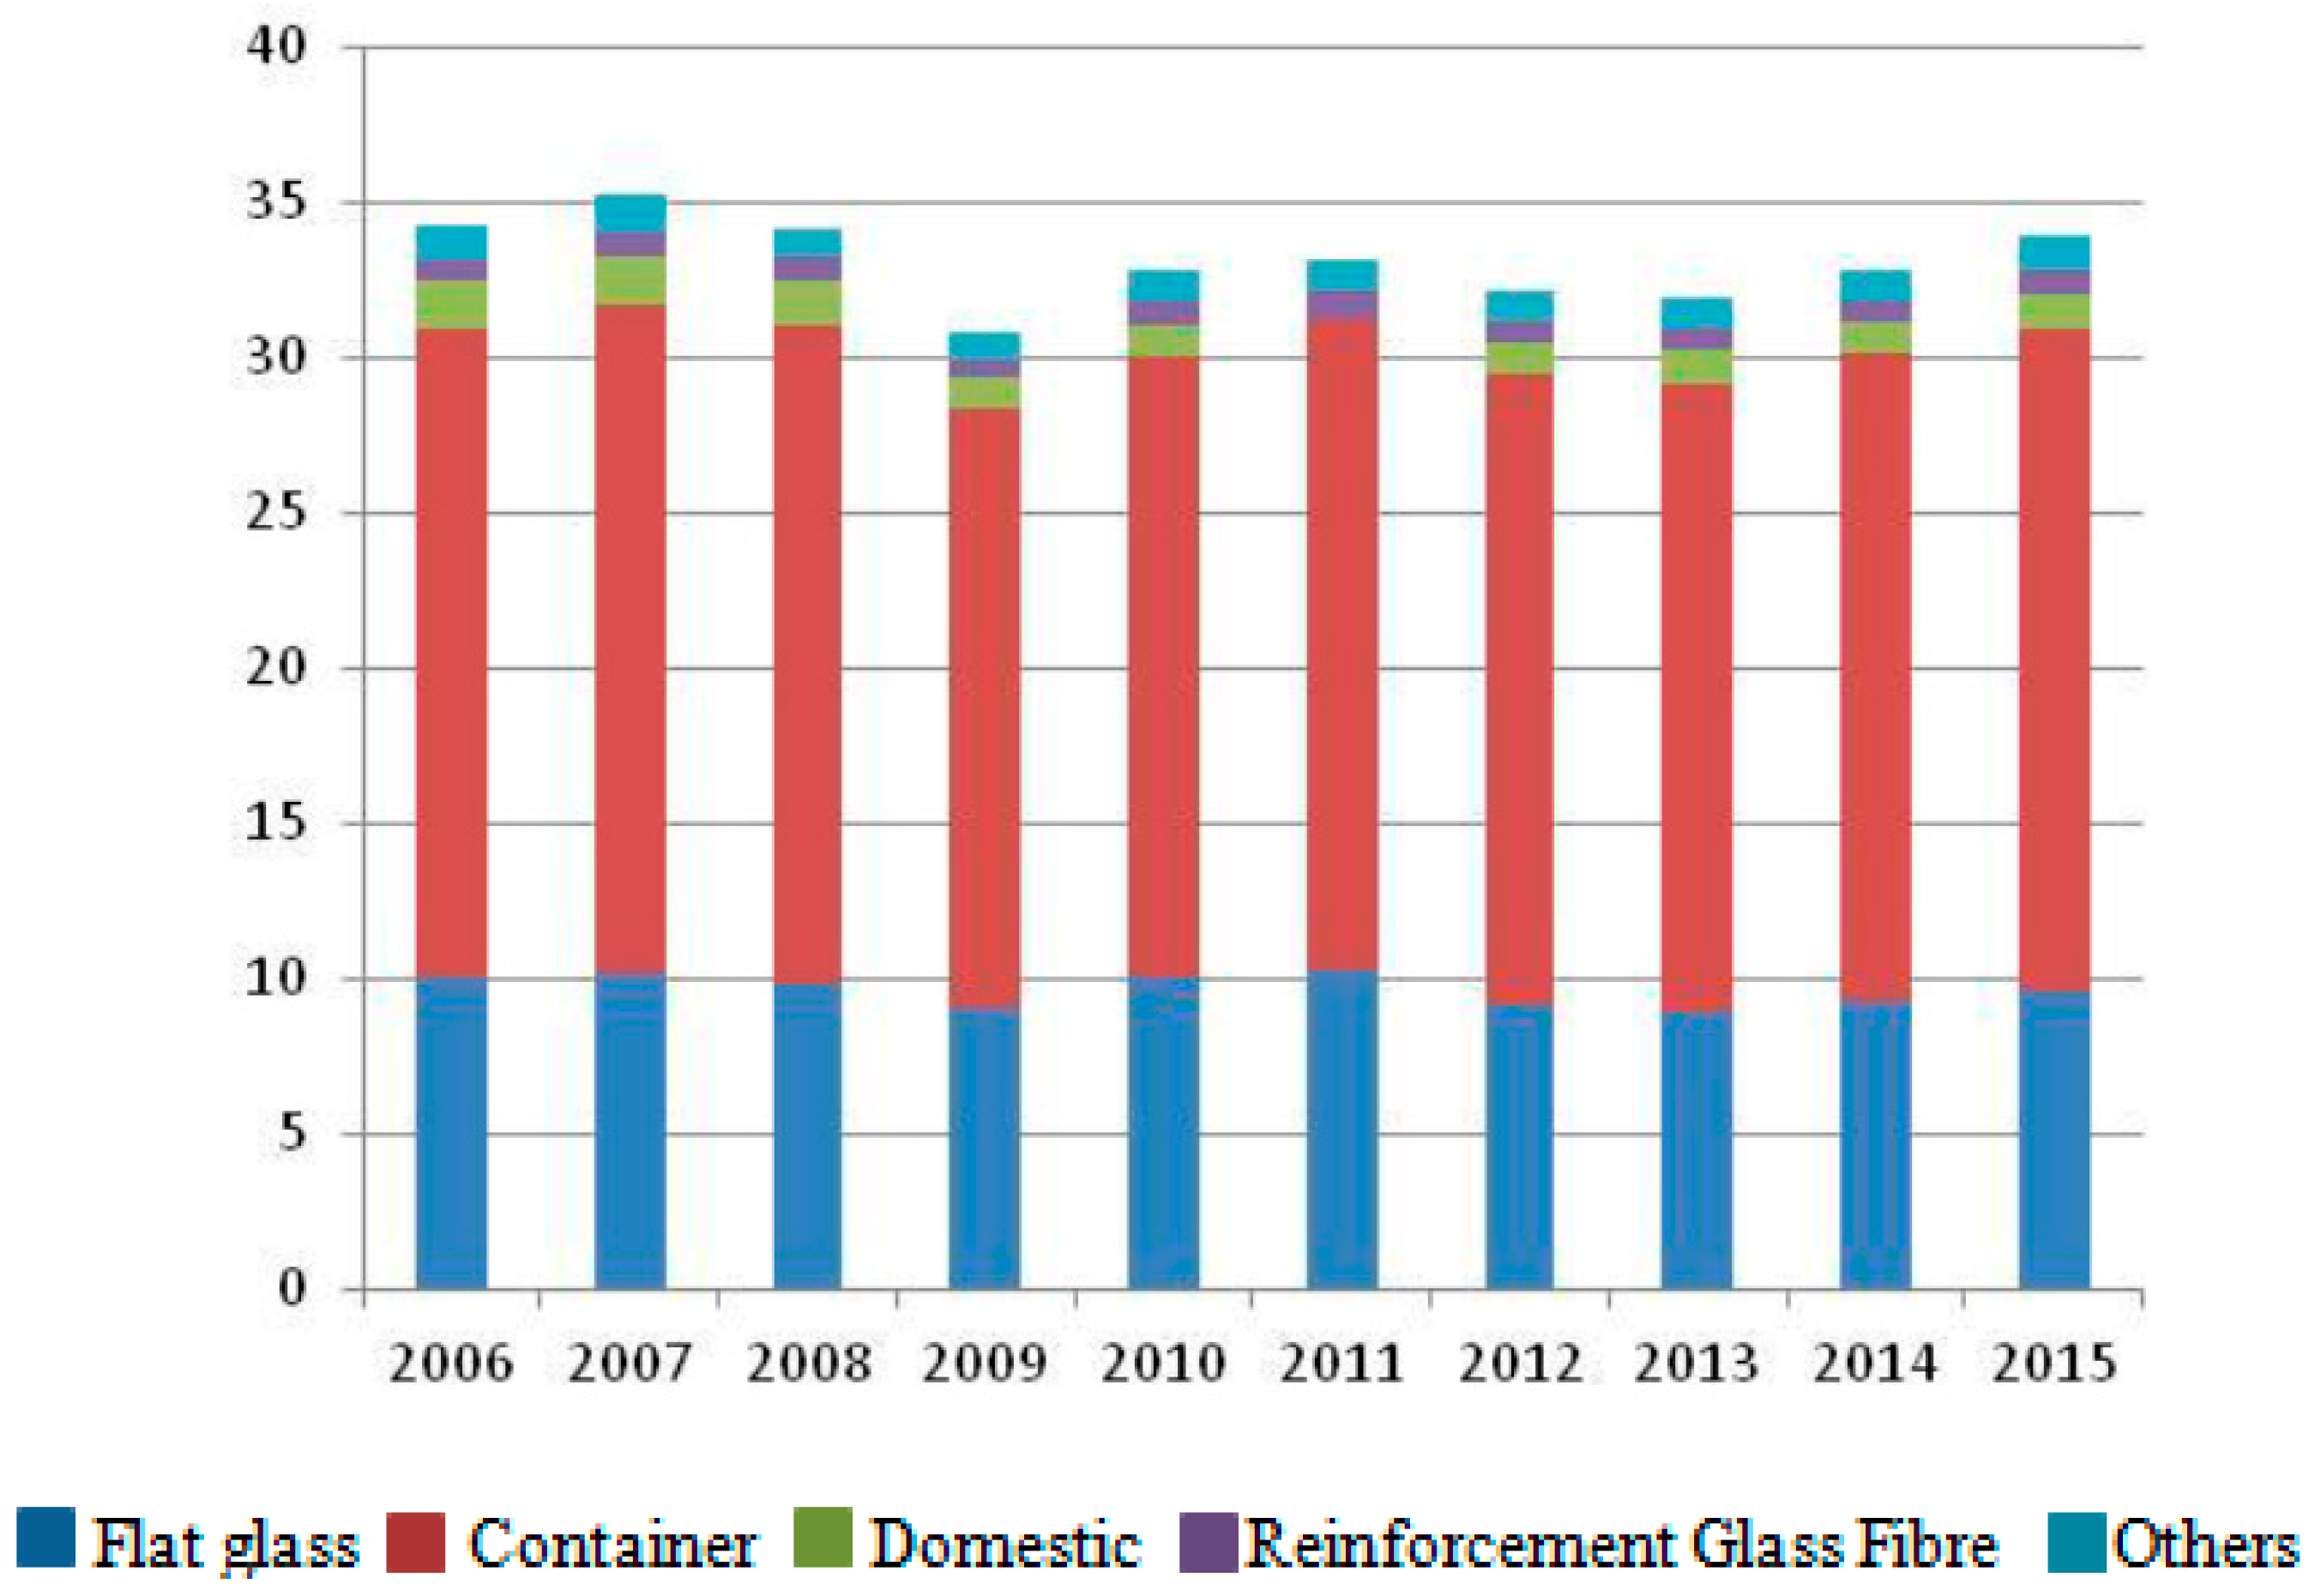
2.2. The European Glass Industry Landscape
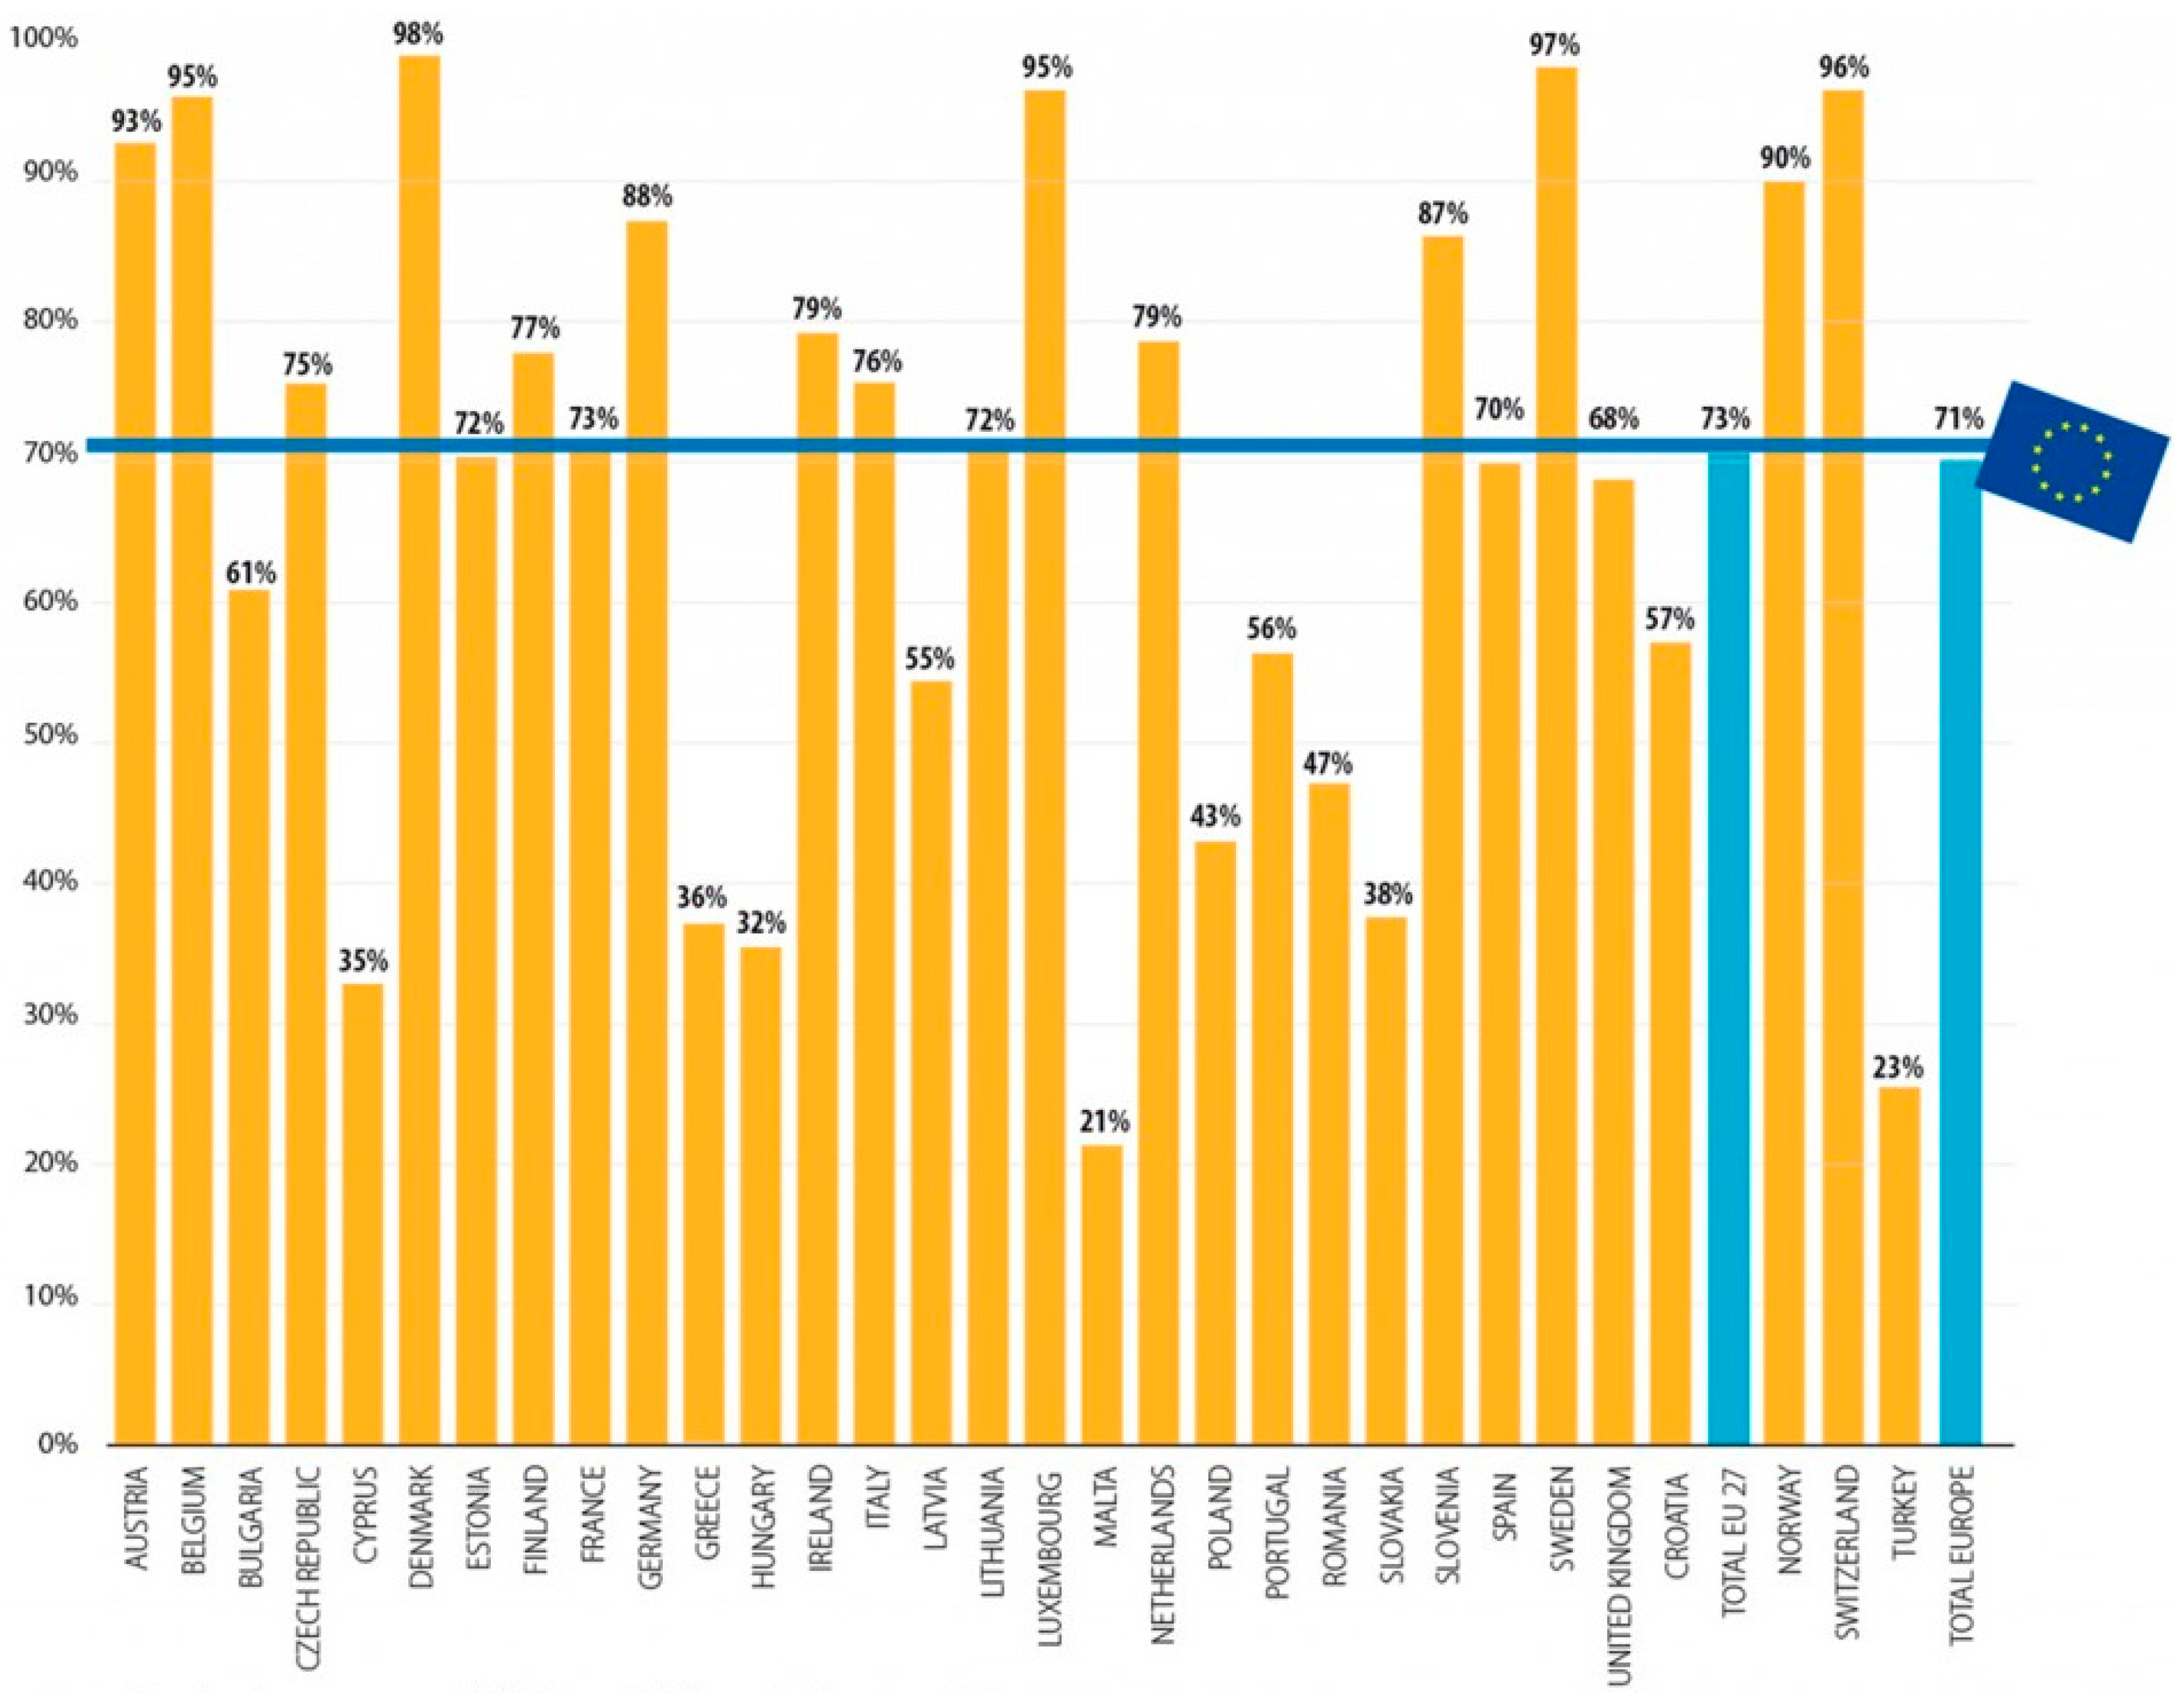
3. The EU Container Glass Industry between Competitiveness and Sustainability for Improving Circular Economy
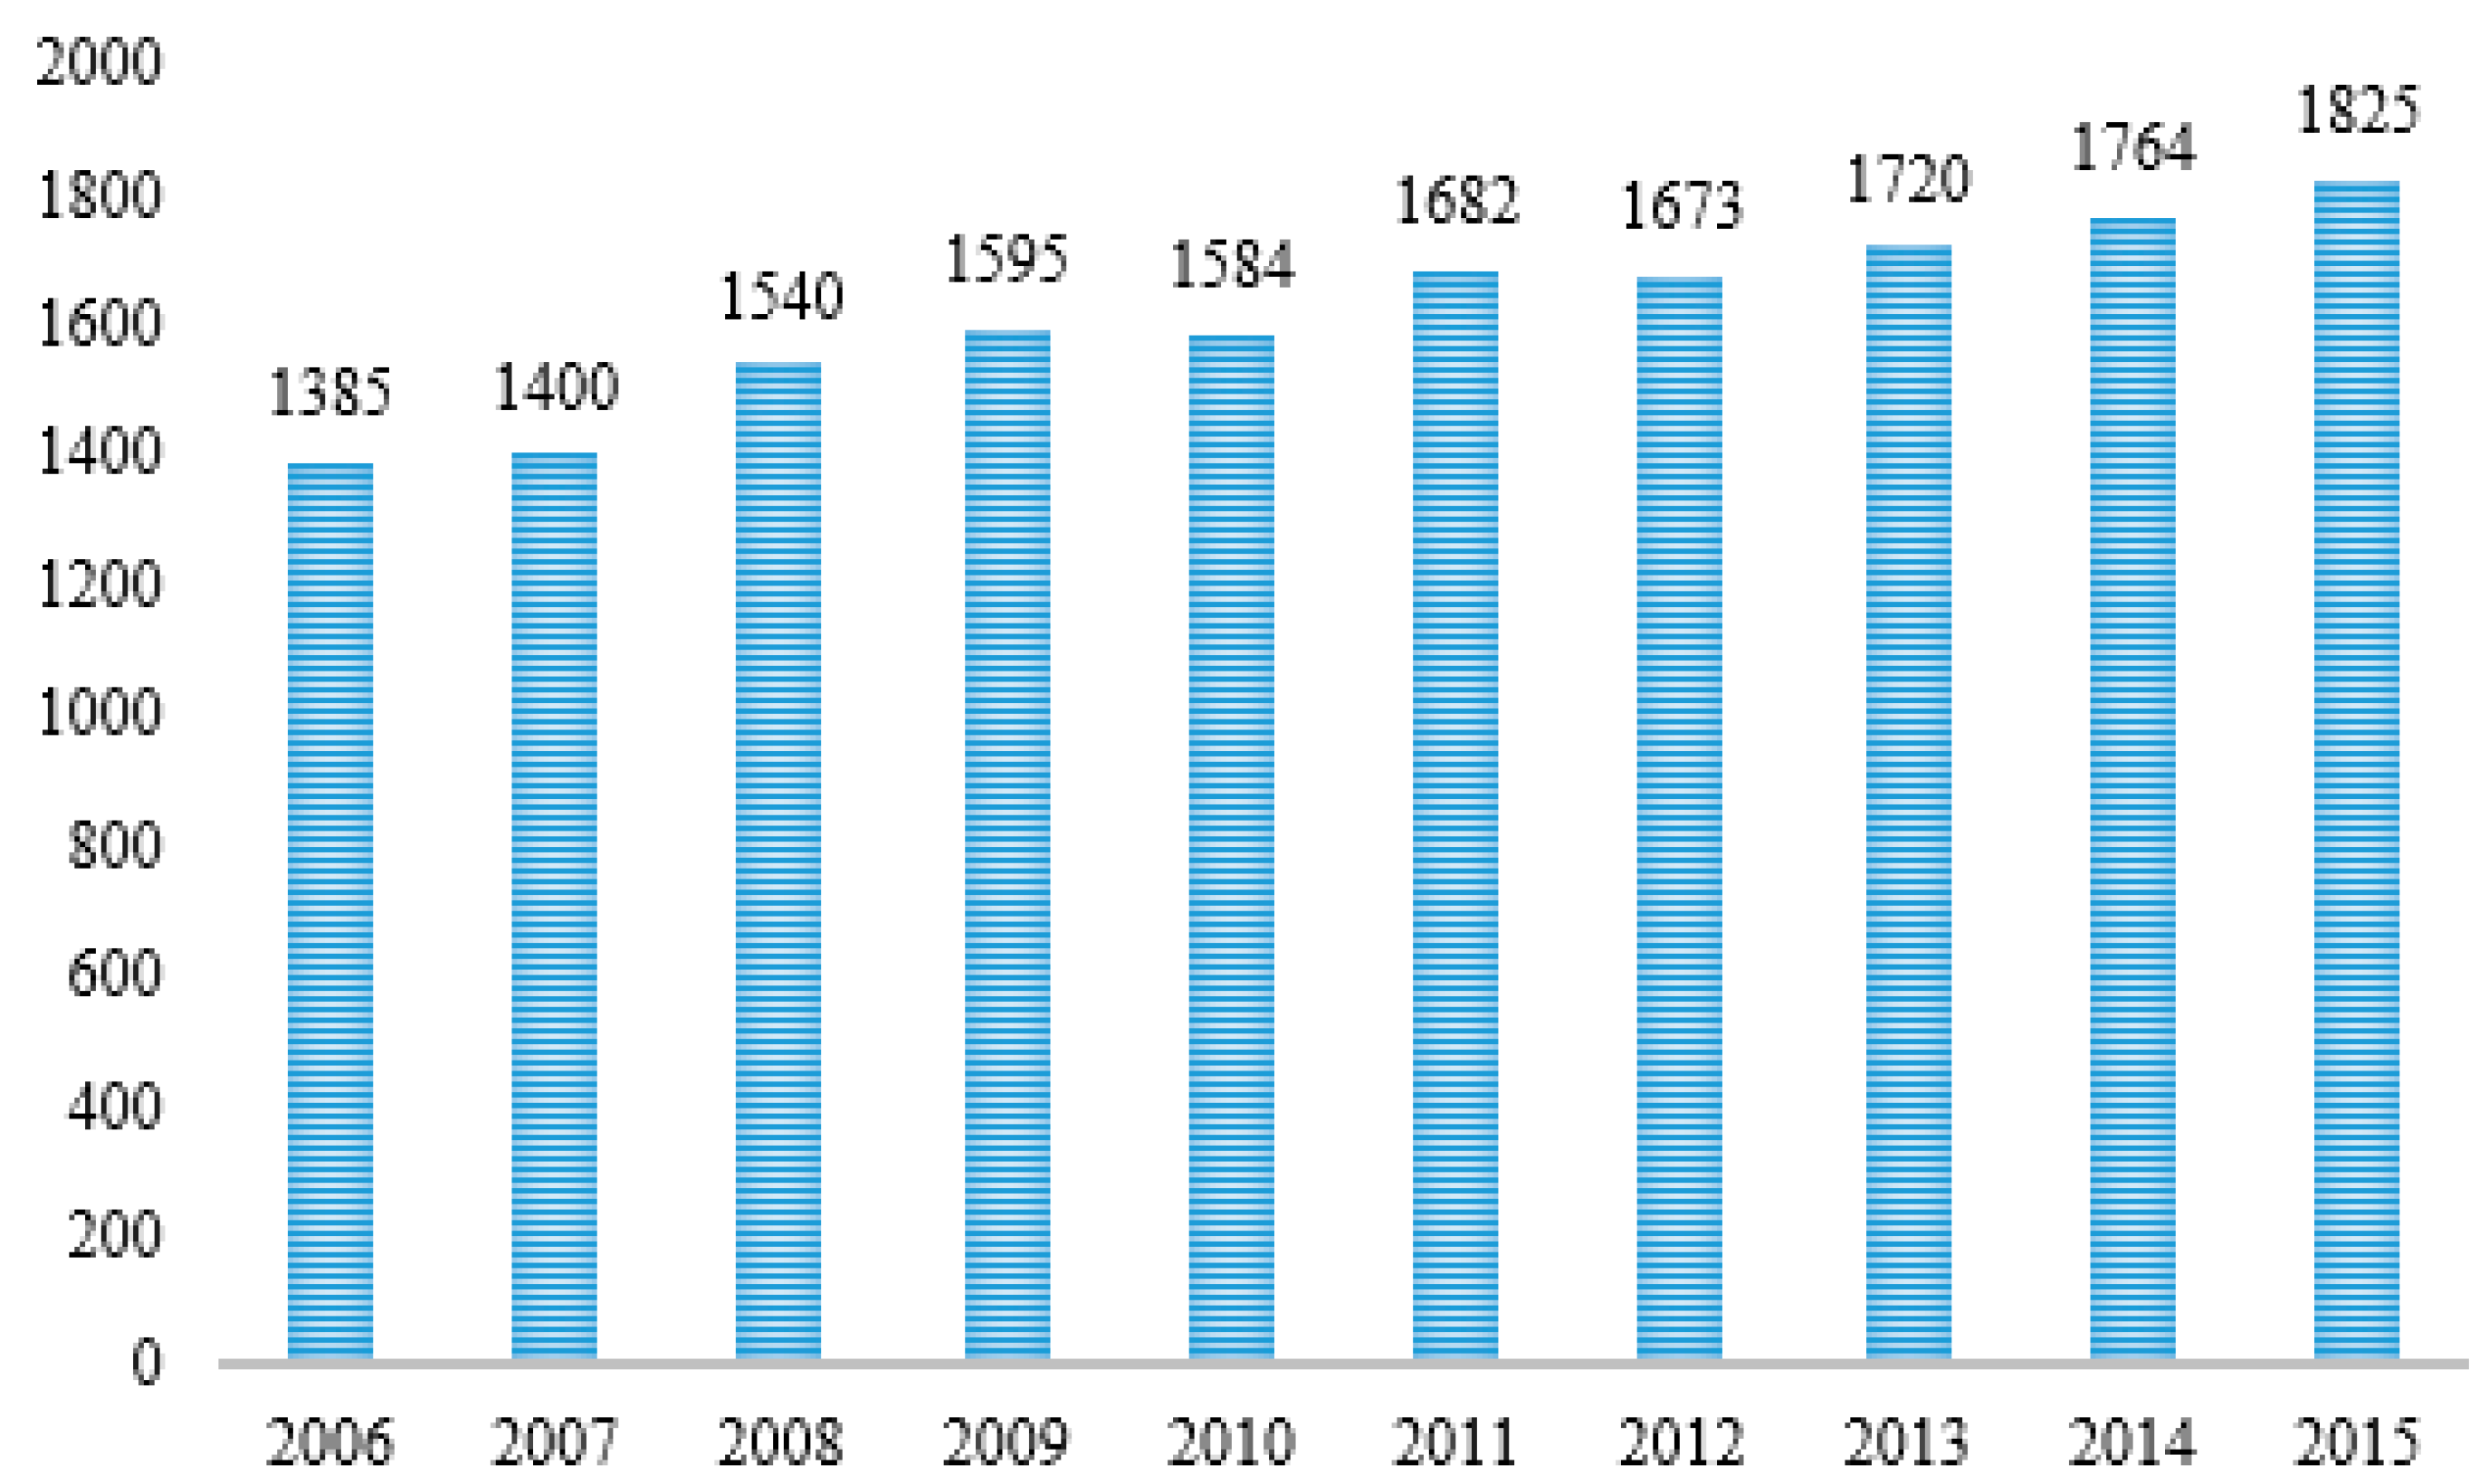
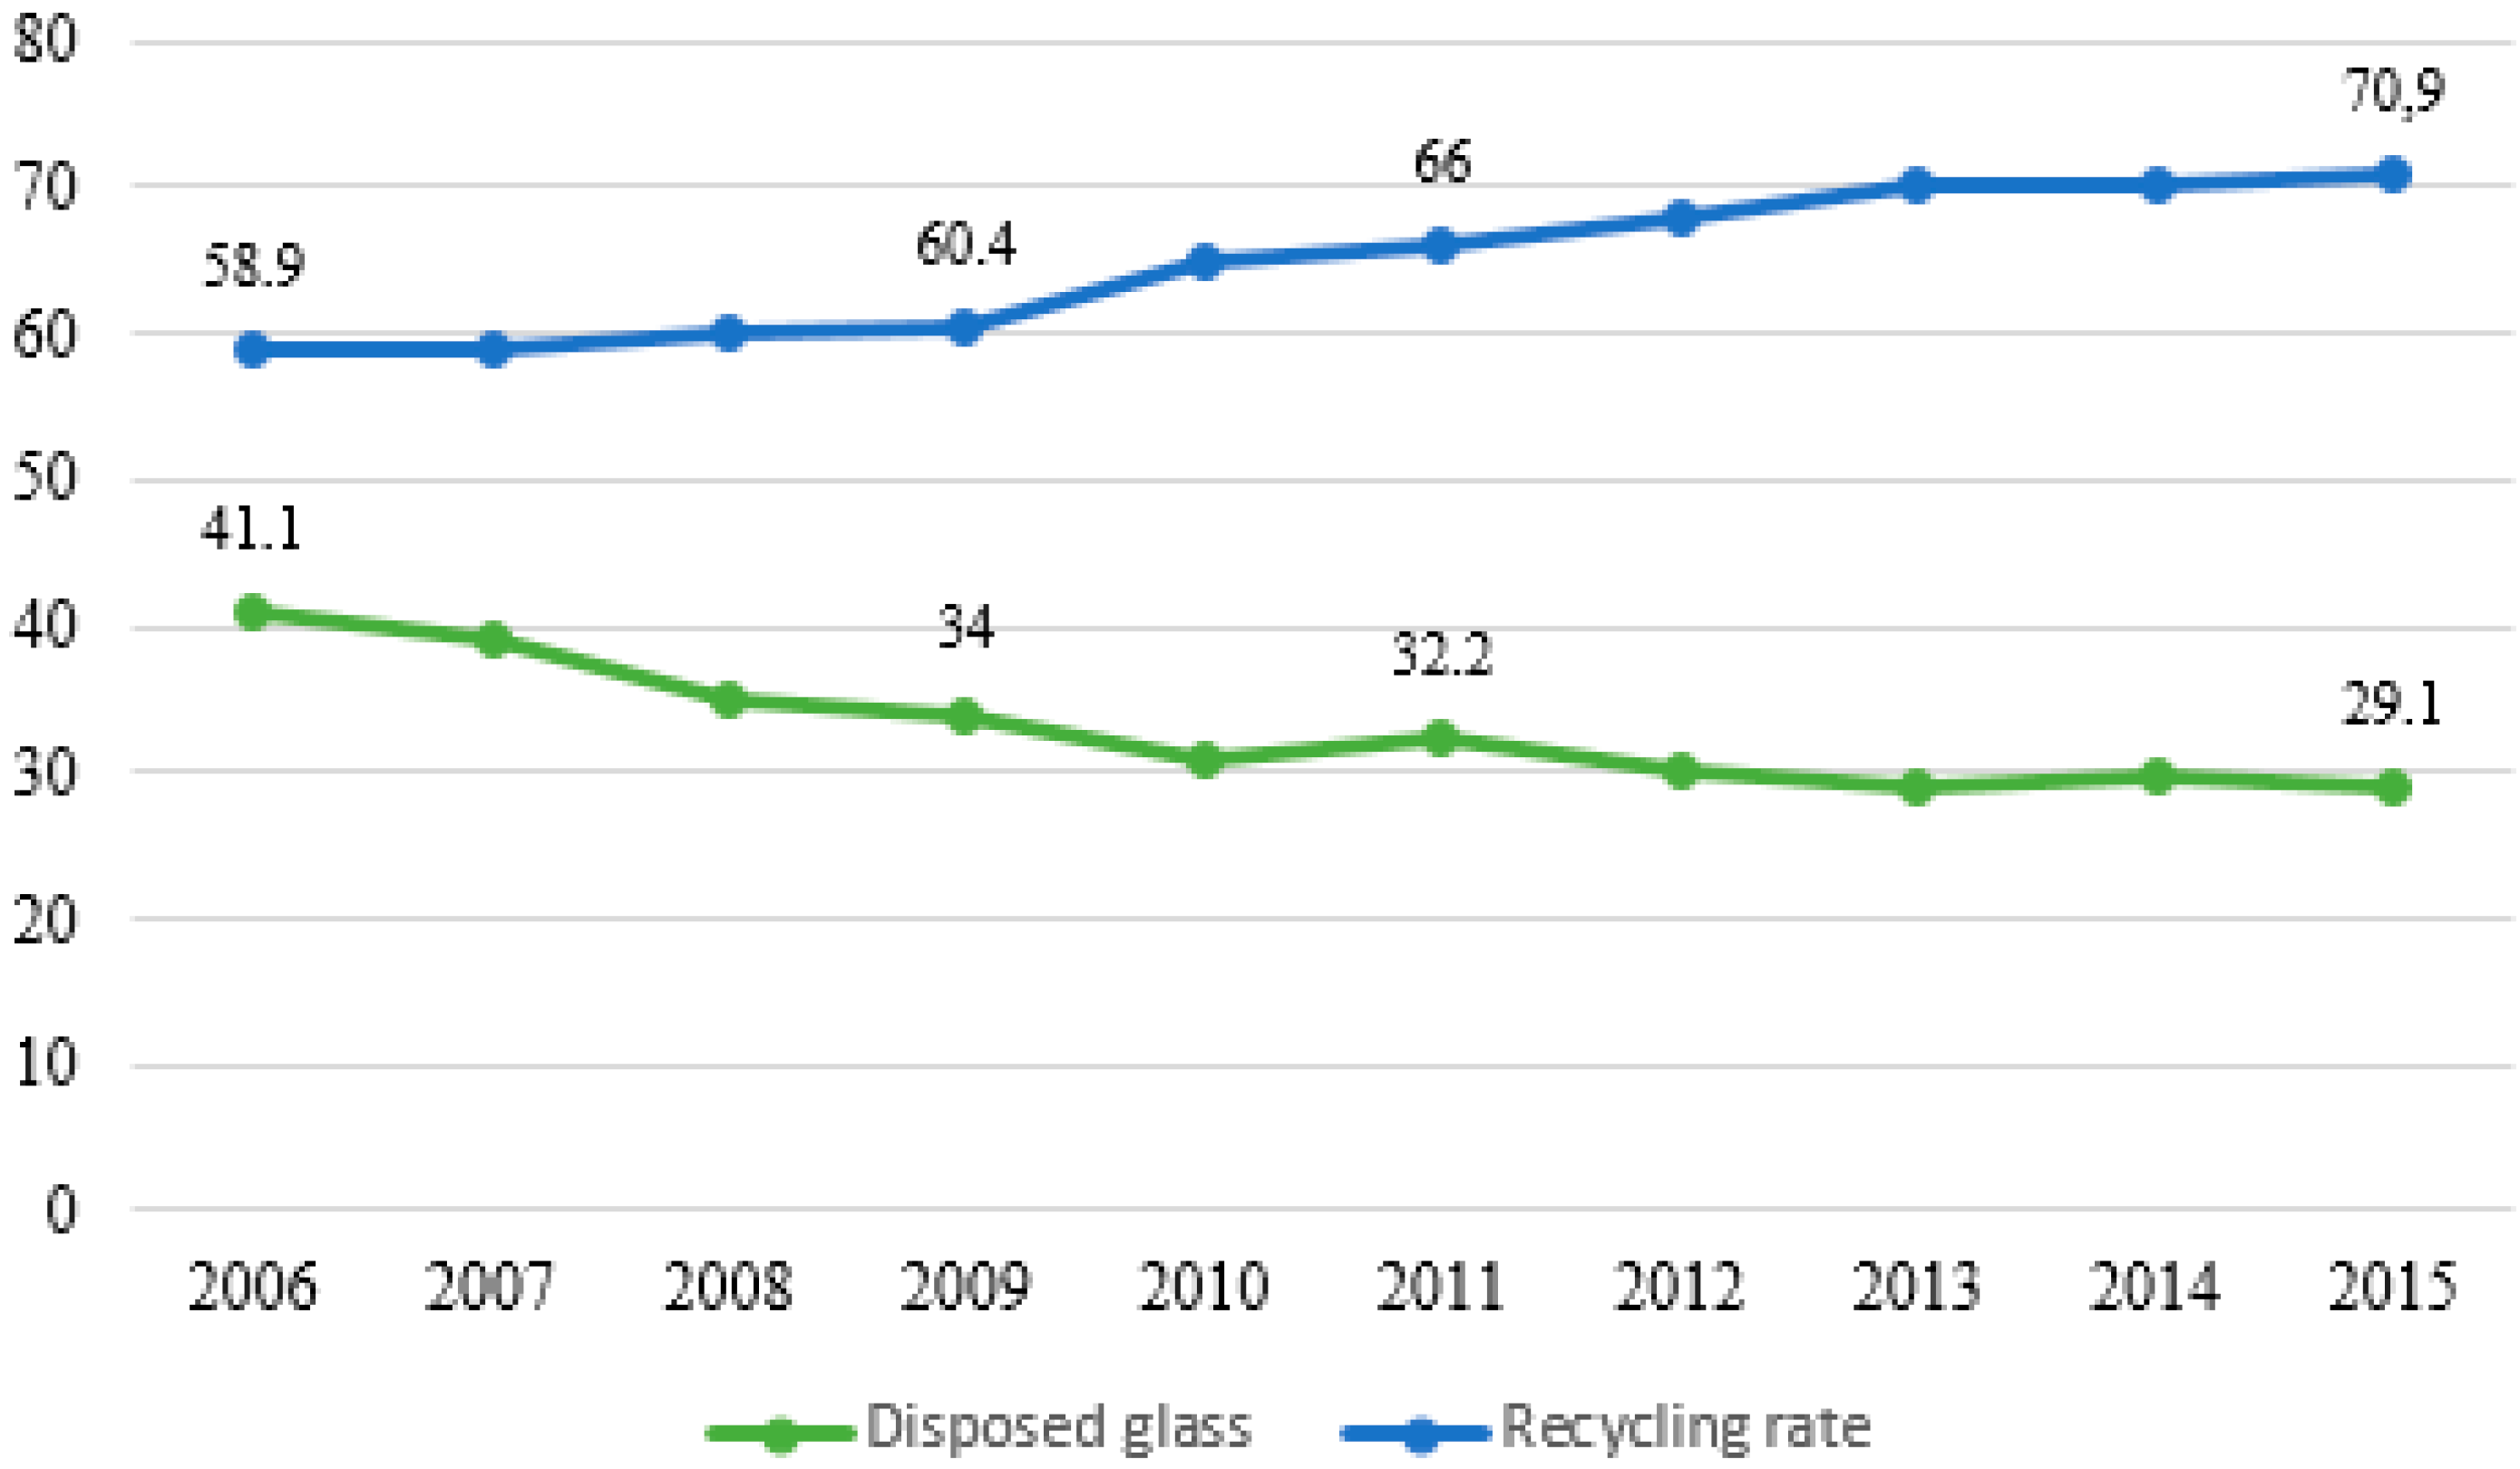
4. Circular Economy for Container Glass Sector: Evidence from Italy
5. Conclusions
- -
- Developing collection and recycling waste glass systems in Italy must find solutions suited to local realities, with the support of appropriate and targeted financial measures, while sharing knowledge on the management of container glass waste.
- -
- Identifying good practices in the selective collection and closed-loop recycling of glass packaging waste from Municipal Solid Waste (MSW) across European and Italian regional and local authorities.
- -
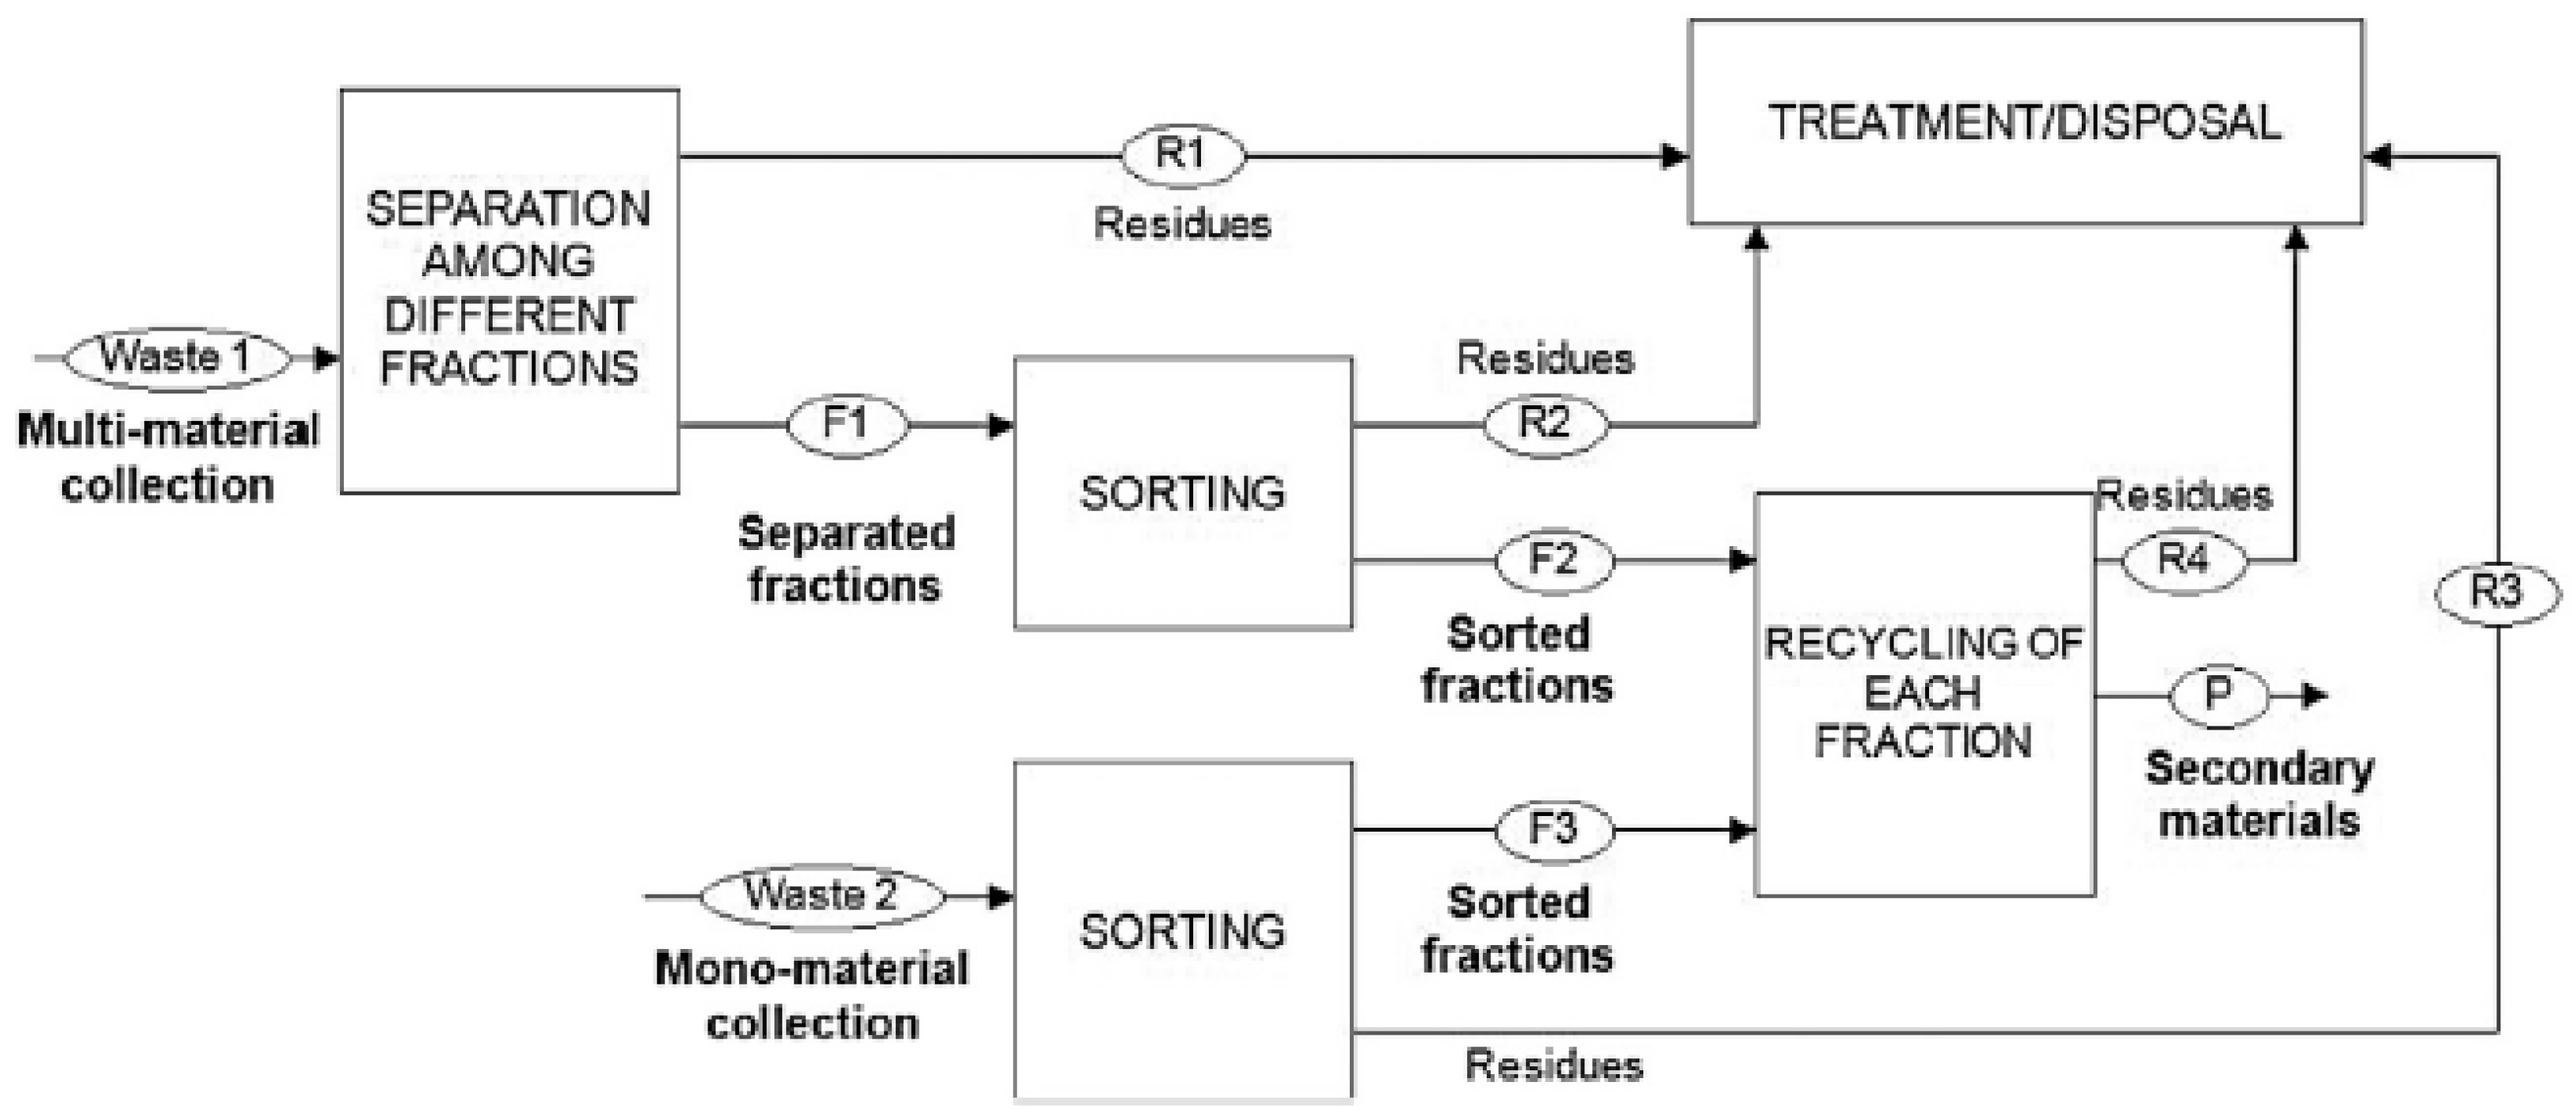
- Implementing different collection schemes (kerbside, bottle banks, deposit schemes, and other types of schemes), including sectorial differences for glass collection (commercial, household) and/or colour-separate glass collection versus mixed glass collection.
- -
- Increasing the quality and efficiency of the glass recycling value chain through efficient collection and quality recycling, investing in Italian cullet treatment centers where used glass is sorted, freed of impurities, and crushed to make clean cullet ready to be transformed into new glass.
- -
- Evaluating the performance of the different glass collection schemes.
- -
- Promoting synergic partnerships and networks of all stakeholders to embed programs and synchronize business and environmental goals.
- -
- Re-engineering the waste management supply chain, and also optimizing the paths of reverse collection and logistics, focusing on ‘multiple’ closed-loop frameworks by stakeholder partnerships and networks at various levels, and sharing knowledge and skills.
- -
- Raising awareness amongst households and other targets through communication and education campaigns.
Acknowledgments
Author Contributions
Conflicts of Interest
References
- McLellan, G.W.; Shand, E.B. Glass Engineering Handbook; McGraw-Hill: New York, NY, USA, 1984. [Google Scholar]
- Schmitz, A.; Kamiński, J.; Scalet, B.M.; Soria, A. Energy consumption and CO2 emissions of the European glass industry. Energy Policy 2011, 39, 142–155. [Google Scholar] [CrossRef]
- Scalet, B.M.; Garcia Muñoz, M.; Sissa, A.Q.; Roudier, S.; Delgado Sancho, L. Best Available Techniques (BAT) Reference Document for the Manufacture of Glass, Industrial Emissions Directive 2010/75/EU (Integrated Pollution Prevention and Control); JRC Reference Report; European Union: Luxembourg, 2013; Available online: http://eippcb.jrc.ec.europa.eu/reference/BREF/GLS_Adopted_03_2012.pdf (accessed on 22 March 2017).
- IEA. Tracking Industrial Energy Efficiency and CO2 Emissions. 2007. Available online: https://www.iea.org/publications/freepublications/publication/tracking_emissions.pdf (accessed on 11 April 2017).
- Miketa, A. Analysis of energy intensity developments in manufacturing sectors in industrialized and developing countries. Energy Policy 2001, 29, 769–775. [Google Scholar] [CrossRef]
- Supino, S.; Malandrino, O.; Testa, M.; Sica, D. Sustainability in the EU cement industry: the Italian and German experiences. J. Clean. Prod. 2016, 112, 430–442. [Google Scholar] [CrossRef]
- EIA. Annual Energy Outlook with Projections to 2040; DOE/EIA-0383; U.S. Energy Information Administration, Office of Energy Analysis, U.S. Department of Energy: Washington, DC, USA, 2016. Available online: https://www.eia.gov/outlooks/aeo/pdf/0383(2016).pdf (accessed on 31 March 2017).
- Glass Alliance Europe. Industries. 2012. Available online: http://www.glassallianceeurope.eu/en/industries (accessed on 31 March 2017).
- Glass Alliance Europe. Common Challenges. 2012. Available online: http://www.glassallianceeurope.eu/en/common-challenges (accessed on 31 March 2017).
- Lieder, M.; Rashid, A. Towards circular economy implementation: A comprehensive review in context of manufacturing industry. J. Clean. Prod. 2016, 115, 36–51. [Google Scholar] [CrossRef]
- Waite, S.; Cox, P.; Tudor, T. Strategies for local authorities to achieve the EU 2020 50% recycling, reuse and composting target: A case study of England. Resour. Conserv. Recycl. 2015, 105, 18–28. [Google Scholar] [CrossRef]
- European Commission. Establishing Criteria Determining When Glass Cullet Ceases to Be Waste under Directive 2008/98/EC of the European Parliament and of the Council, Commission Regulation (EU) No 1179/2012, 10 December 2012. Available online: http://eur-lex.europa.eu/legal-content/EN/TXT/PDF/?uri=CELEX:32012R1179 (accessed on 31 March 2017).
- Vieitez, E.R.; Eder, P.; Villanueva, A.; Saveyn, H. End-of-Waste Criteria for Glass Cullet: Technical Proposals, JRC Scientific and Technical Reports; European Union: Luxembourg, 2011; Available online: http://ftp.jrc.es/EURdoc/JRC68281.pdf (accessed on 30 March 2017).
- European Commission. Report from the Commission to the European Parliament, the Council, the European Economic and Social Committee and the Committee of the Regions on the Implementation of the Circular Economy Action Plan COM (2017) 33 Final, 26 January 2017; European Commission: Brussels, Belgium, 2017. [Google Scholar]
- Kirk, O. Encyclopedia of Chemical Technology. Fluorine Compounds, Organic to Gold and Gold Compounds, 3rd ed.; Wiley: New York, NY, USA, 1980; Volume 11. [Google Scholar]
- Dan, K.; Ward, L. The History of Glass; Orbis: London, UK, 1984. [Google Scholar]
- Rasmussen, S.C. Origin of Glass: Myth and Known History. In How Glass Changed the World; SpringerBriefs in History of Chemistry; Springer: Berlin/Heidelberg, Germany, 2012. [Google Scholar]
- Jacobs, M.B. Review of How Glass Changed the World: The History and Chemistry of Glass from Antiquity to the 13th Century. J. Chem. Educ. 2015, 406–407. [Google Scholar] [CrossRef]
- Encyclopedia Britannica. Geaorge Ravenscroft. Available online: www.britannica.com/biography/George-Ravenscroft (accessed on 1 April 2017).
- Glass Alliance Europe. EU Glass Production. 2012. Available online: http://www.glassallianceeurope.eu/images/cont/production-evolution-2015_file.pdf (accessed on 1 April 2017).
- Glass Alliance Europe. Production Evolution within Sectors. 2012. Available online: http://www.glassallianceeurope.eu/images/cont/production-evolution-2015-by-sectors_file.pdf (accessed on 1 April 2017).
- Industrial Efficiency Technology Database. Glass. 2017. Available online: http://ietd.iipnetwork.org/content/glass (accessed on 1 April 2017).
- Worrell, E.; Galitsky, C.; Masanet, E.; Graus, W. Energy Efficiency Improvement and Cost Saving Opportunities for the Glass Industry; An ENERGY STAR® Guide for Energy and Plant Managers; Energy Analysis Department Environmental Energy Technologies Division, Ernest Orlando Lawrence Berkeley National Laboratory, University of California: Berkeley, CA, USA, 2008. Available online: https://www.energystar.gov/ia/business/industry/Glass-Guide.pdf (accessed on 8 May 2017).
- Ecoprog. Glass Factories under the Industrial Emissions Directive. Sites, Competition and Investment Potentials in Europe. 2014. Available online: http://www.ecoprog.com/fileadmin/user_upload/leseproben/ext_market_report_glass_factories_in_europe_IED_ecoprog.pdf (accessed on 11 April 2017).
- Supino, S. Evoluzione dei consumi energetici nell’industria del vetro in Italia. Riv. Stn. Sper. Vetro. 2001, 3, 9–16. [Google Scholar]
- European Economic and Social Committee. Opinion of the European Economic and Social Committee on an Industrial Policy for the European Glass Sector. CCMI/127 Glass Industry, 22 April 2015. Available online: http://www.eesc.europa.eu/?i=portal.en.ccmi-opinions.32821 (accessed on 16 March 2017).
- Researchandmarkets. APAC Glass Containers Market—by Countries and Vendors—Market Trends and Forecasts (2014–2020). 2017. Available online: http://www.researchandmarkets.com/reports/3515904/apac-glass-containers-market-by-countries-and (accessed on 8 May 2017).
- FEVE. EU Container Glass Production Growth Shows Industry Resilience. 2015. Available online: http://feve.org/wp-content/uploads/2016/04/EU-container-glass-production-growth-shows-industry-resilience.pdf (accessed on 8 May 2017).
- FEVE. Glass Packaging Industry Making the EU Circular Economy Real. 2015. Available online: http://www.nvc.nl/userfiles/files/FEVE_Press_Release.pdf (accessed on 1 April 2017).
- FEVE. Recycling. Why Glass Always Has a Happy CO2 Ending. 2010. Available online: http://feve.org/wp-content/uploads/2016/04/FEVE-brochure-Recycling-Why-glass-always-has-a-happy-CO2-ending-.pdf (accessed on 16 March 2017).
- FERVER. Glass Recycling: Years of Improvement, Glassman Europe. 2015. Available online: http://www.glassmanevents.com/europe/content-images/misc/FERVER.pdf (accessed on 16 March 2017).
- Federico, L.M.; Chidiac, S.E. Waste glass as a supplementary cementitious material in concrete—Critical review of treatment methods. Cem. Concr. Compos. 2009, 31, 606–610. [Google Scholar] [CrossRef]
- Idir, R.; Cyr, M.; Tagnit-Hamou, A. Pozzolanic properties of fine and coarse color-mixed glass cullet. Cem. Concr. Compos. 2011, 33, 19–29. [Google Scholar] [CrossRef]
- Ruth, M.; Dell’Anno, P. An industrial ecology of the US glass industry. Resour. Policy 1997, 23, 109–124. [Google Scholar] [CrossRef]
- Wartman, J.; Grubb, D.G.; Nasim, A.S.M. Select engineering characteristics of crushed glass. J. Mater. Civ. Eng. 2004, 16, 526–539. [Google Scholar] [CrossRef]
- Ahmad, F.; Mujah, D.; Hazarika, H.; Safari, A. Assessing the potential reuse of recycled glass fibre in problematic soil applications. J. Clean. Prod. 2012, 35, 102–107. [Google Scholar] [CrossRef]
- Bignozzi, M.C.; Saccani, A.; Barbieri, L.; Lancellotti, I. Glass waste as supplementary cementing materials: The effects of glass chemical composition. Cem. Concr. Compos. 2015, 55, 45–52. [Google Scholar] [CrossRef]
- Jani, Y.; Hogland, W. Waste glass in the production of cement and concrete—A review. J. Environ. Chem. Eng. 2014, 2, 1767–1775. [Google Scholar] [CrossRef]
- Arulrajah, A.; Disfani, M.M.; Maghoolpilehrood, F.; Horpibulsuk, S.; Udonchai, A.; Imteaz, M.; Du, Y.J. Engineering and environmental properties of foamed recycled glass as a lightweight engineering material. J. Clean. Prod. 2015, 94, 369–375. [Google Scholar] [CrossRef]
- Blengini, G.A.; Busto, M.; Fantoni, M.; Fino, D. Eco-efficient waste glass recycling: Integrated waste management and green product development through LCA. Waste Manag. 2012, 32, 1000–1008. [Google Scholar] [CrossRef] [PubMed]
- Ellen MacArthur Foundation. The Circular economy and the Promise of Glass in Concrete. Available online: https://www.ellenmacarthurfoundation.org/assets/downloads/circular-economy/The-Circular-Economy-and-the-Promise-of-Glass-in-Concrete.pdf (accessed on 22 March 2017).
- Tiozzo, S.; Favaro, N. Permanent Materials in the Framework of the Circular Economy Concept: Review of Existing Literature and Definitions, and Classification of Glass as a Permanent Material. Report 136480. 2016. Available online: http://feve.org/wp-content/uploads/2016/09/SSV-Report-on-Glass-as-Permanent-Material.pdf (accessed on 16 March 2017).
- FEVE. Glass Recycling Hits 73% in the EU. Best Performing Bottle to Bottle Closed Loop Recycling System. 2015. Available online: http://feve.org/wp-content/uploads/2016/04/Press-Release-EU.pdf (accessed on 1 April 2017).
- Hsieh, Y.C.; Lin, K.Y.; Lu, C.; Rong, K. Governing a Sustainable Business Ecosystem in Taiwan’s Circular Economy: The Story of Spring Pool Glass. Sustainability 2017, 9, 1068. [Google Scholar] [CrossRef]
- Eurostat. Municipal Waste Generation and Treatment, by Type of Treatment Method. 2016. Available online: http://ec.europa.eu/eurostat/tgm/refreshTableAction.do?tab=table&plugin=1&pcode=tsdpc240&language=en (accessed on 8 May 2017).
- ISPRA. Rapporto Rifiuti Urbani. 2016. Available online: http://www.isprambiente.gov.it/files/pubblicazioni/rapporti/RapportoRifiutiUrbani_Ed.2016_n.251_Vers.Integrale_ErrataCorrige.pdf (accessed on 28 March 2017).
- Rigamonti, L.; Ferreira, S.; Grosso, M.; Marques, R.C. Economic-financial analysis of the Italian packaging waste management system from a local authority’s perspective. J. Clean. Prod. 2015, 87, 533–541. [Google Scholar] [CrossRef]
- Rigamonti, L.; Grosso, M.; Sunseri, M.C. Influence of assumptions about selection and recycling efficiencies on the LCA of in of integrated waste management systems. Int. J. Life Cycle Assess. 2009, 14, 411–419. [Google Scholar] [CrossRef]
- Rigamonti, L.; Grosso, M.; Giugliano, M. Life cycle assessment of sub-units composing a MSW management system. J. Clean. Prod. 2010, 18, 1652–1662. [Google Scholar] [CrossRef]
- ASSOVETRO. Relazione alla Assemblea Generale delle Aziende Associate; ASSOVETRO: Roma, Italy, 2015. [Google Scholar]
- ASSOVETRO. Relazione alla Assemblea Generale delle Aziende Associate; ASSOVETRO: Roma, Italy, 2016. [Google Scholar]
- CONAI. Programma Generale di Prevenzione e Gestione degli Imballaggi e dei Rifiuti di Imballaggi. 2015. Available online: http://www.conai.org/wp-content/uploads/2016/07/PGP_CONAI_2016.pdf (accessed on 16 March 2017).
- CoReVe. Piano Specifico di Prevenzione 2016, Risultati di Raccolta e Riciclo 2015. 2016. Available online: https://www.coreve.it/pdfdownload/risorse_documenti_download_pdf_90.pdf (accessed on 28 March 2017).
- Fondazione per lo Sviluppo Sostenibile. Dossier. Il Riciclo del Vetro e i Nuovi Obiettivi Europei per la Circular Economy. 2016. Available online: http://www.reteambiente.it/repository/normativa/23897.pdf (accessed on 16 March 2017).
- Canalenergia, Raccolta vetro. Co.Re.Ve: 3Mln di euro al Sud per chi fa Squadra. 2017. Available online: https://www.canaleenergia.com/archivio-rubriche/42-smart-city/5667-raccolta-vetro-coreve-3-mln-di-euro-al-sud-per-chi-fa-squadra.html (accessed on 1 April 2017).
- CoReVe. Piano Specifico di Prevenzione 2015, Risultati di Raccolta e Riciclo 2014. Available online: https://www.coreve.it/pdfdownload/risorse_documenti_download_pdf_434084139.pdf (accessed on 28 March 2017).
- CoReVe. CoReVe Scommette sul Sud per Incrementare la Raccolta del Vetro. 2017. Available online: https://www.coreve.it/showPage.php?template=news&id=111 (accessed on 8 May 2017).
- Delle Selve, M. Research Favours Separated Collection for Effective Recycling, Glass International. 2012. Available online: http://www.glass-international.com/contentimages/features/FEVE_00_GI_0909.pdf (accessed on 28 March 2017).
- Giugliano, M.; Cernuschi, S.; Grosso, M.; Rigamonti, L. Material and energy recovery in integrated waste management system. An evaluation based on life cycle assessment. Waste Manag. 2011, 31, 2092–2101. [Google Scholar] [CrossRef] [PubMed]
- Pennacchia, E.; Tiberi, M.; Carbonara, E.; Garcia, D.A.; Cumo, F. Reuse and Upcycling of Municipal Waste for ZEB Envelope Design in European Urban Areas. Sustainability 2016, 8, 610. [Google Scholar] [CrossRef]


| Country | 2010 | 2011 | 2012 | 2013 | 2014 | Growth 2010–2014 (%) |
|---|---|---|---|---|---|---|
| Germany | 3,787,7500 | 4,065,452 | 3,934,844 | 3,933,641 | 3,973,786 | 4.9 |
| Italy | 3,506,532 | 3,568,710 | 3,391,637 | 3,445,302 | 3,467,462 | −1.1 |
| France | 3,152,023 | 3,310,186 | 3,146,755 | 3,030,949 | 3,097,473 | −1.7 |
| United Kingdom | 2,316,604 | 2,310,667 | 2,226,321 | 2,240,759 | 2,245,986 | −3.0 |
| Other North-Central | 1,950,400 | 2,041,404 | 2,096,753 | 2,093,984 | 2,138,703 | 9.6 |
| Spain | 1,979,957 | 2,067,016 | 2,012,381 | 2,087,000 | 2,099,236 | 6.0 |
| Portugal | 1,312,909 | 1,351,919 | 1,441,962 | 1,439,429 | 1,451,735 | 10.6 |
| Other South-East | 1,068,659 | 1,186,726 | 1,198,207 | 1,364,601 | 1,403,563 | 31.3 |
| Turkey | 779,462 | 822,502 | 950,000 | 1,021,000 | 1,172,313 | 50.4 |
| Poland | 986,347 | 986,750 | 996,660 | 1,003,551 | 1,078,071 | 9.3 |
| Total Europe | 20,840,643 | 21,711,331 | 21,395,520 | 21,660,216 | 22,128,328 | 6.2 |
| Total EU28 | 19,956,884 | 20,783,077 | 20,333,593 | 20,533,216 | 20,858,515 | 4.5 |
| Years | Production | Import | Export |
|---|---|---|---|
| 2006 | 3644 | 458 | 570 |
| 2007 | 3695 | 475 | 539 |
| 2008 | 3808 | 531 | 558 |
| 2009 | 3500 | 480 | 448 |
| 2010 | 3778 | 623 | 502 |
| 2011 | 3835 | 641 | 519 |
| 2012 | 3679 | 650 | 507 |
| 2013 | 3658 | 600 | 536 |
| 2014 * | 3949 | 694 | 531 |
| 2015 * | 4076 | 743 | 557 |
| 2006 | 2007 | 2008 | 2009 | 2010 | 2011 | 2012 | 2013 | 2014 | 2015 | |
|---|---|---|---|---|---|---|---|---|---|---|
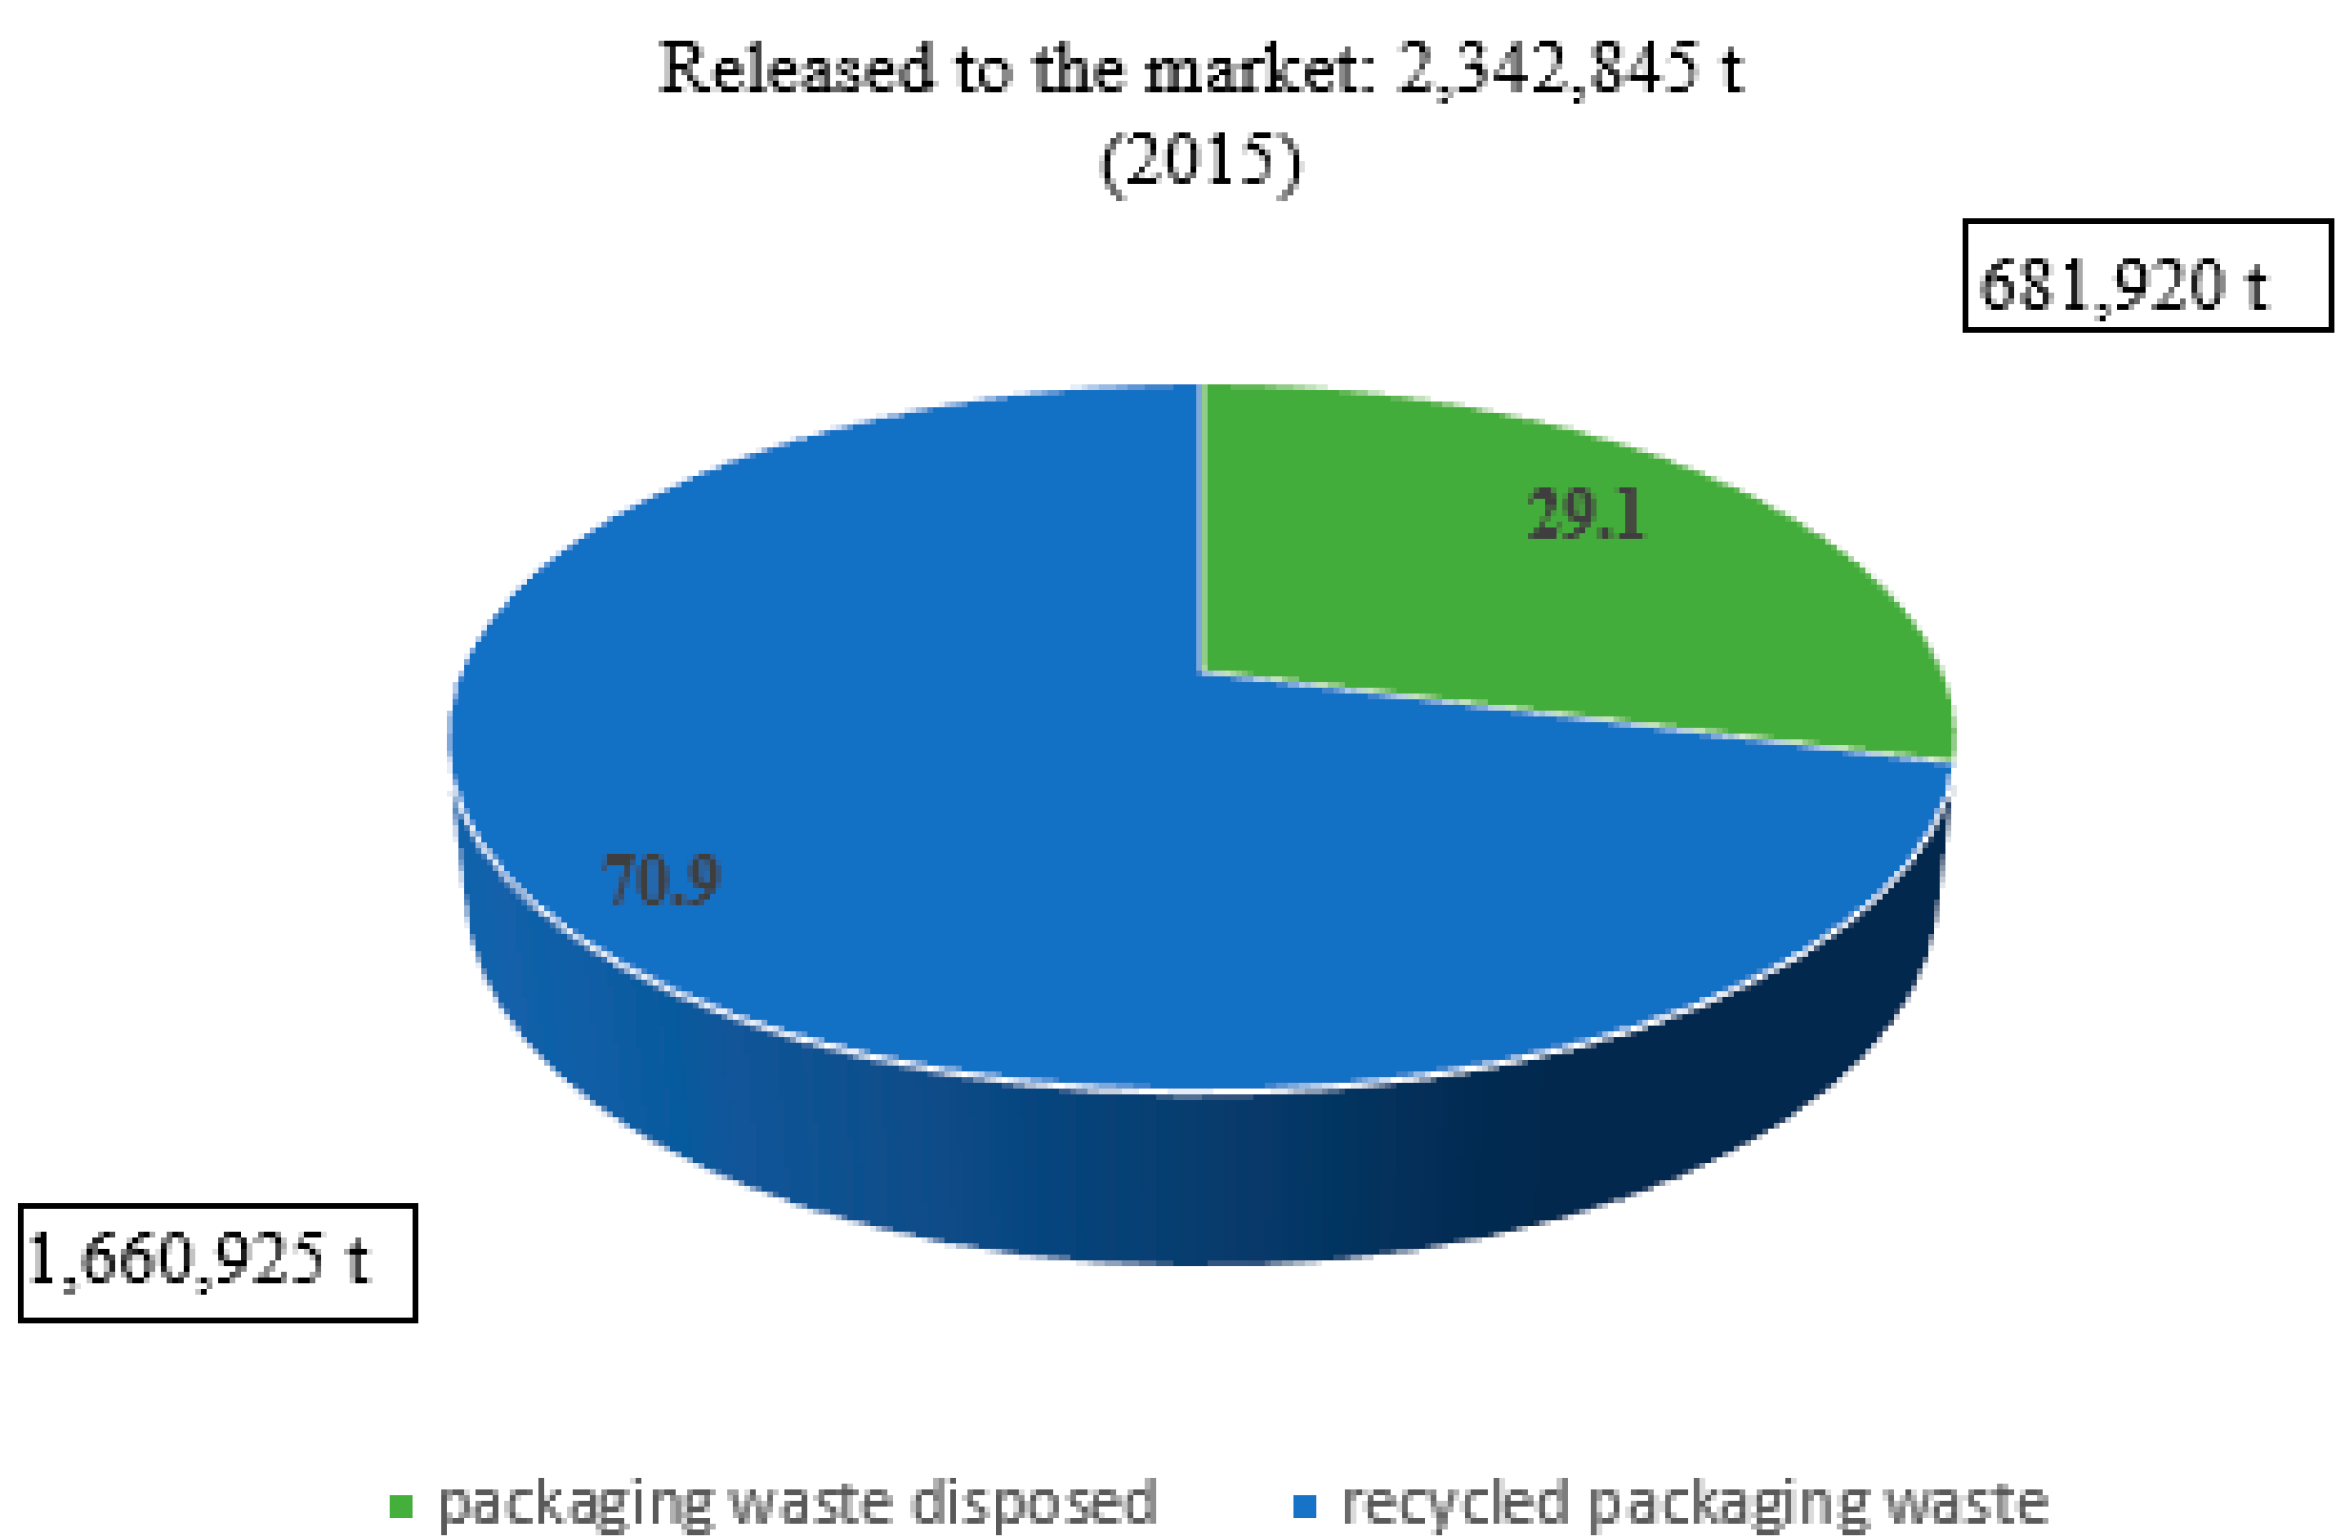
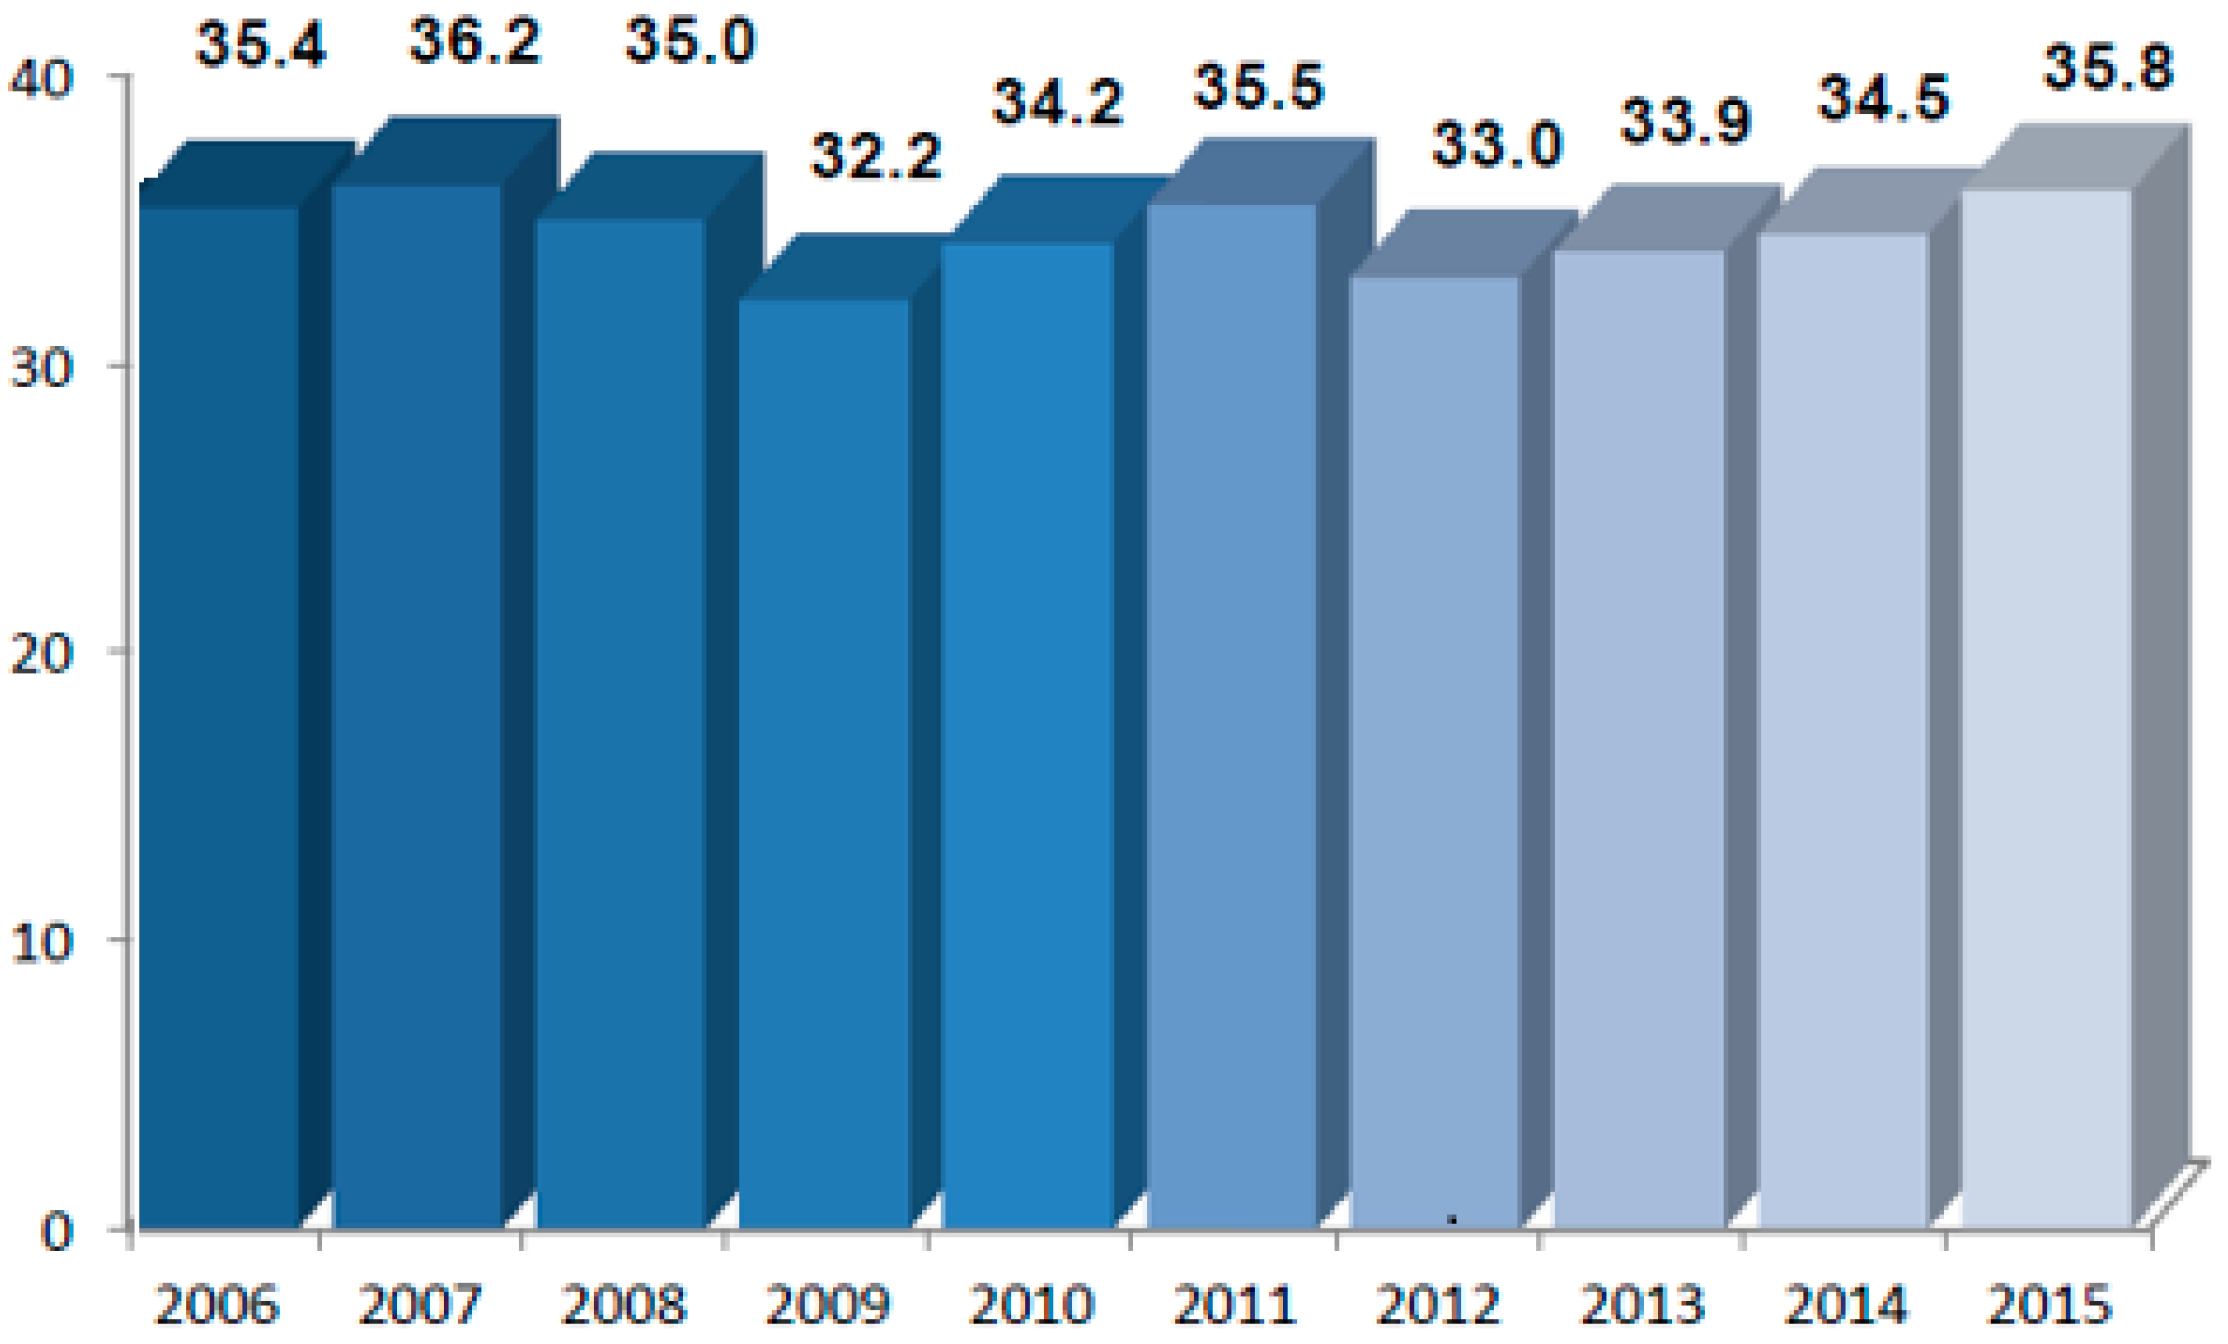
| Released to the market (kt) | 2133 | 2156 | 2139 | 2065 | 2153 | 2266 | 2212 | 2255 | 2298 | 2343 |
| Odds (%) | 0.8 | 1.1 | −0.8 | −3.5 | 4.3 | 5.2 | −2.4 | 1.9 | 1.9 | 1.9 |
| Recycled (kt) | 1256 | 1303 | 1390 | 1362 | 1471 | 1570 | 1568 | 1596 | 1615 | 1661 |
| Odds (%) | 3.7 | 3.7 | 6.7 | −2.0 | 8.0 | 6.7 | −0.1 | 1.8 | 1.2 | 2.9 |
| Recycling rate (%) | 58.9 | 60.4 | 65.0 | 66.0 | 68.3 | 69.3 | 70.9 | 70.8 | 70.3 | 70.9 |
| Separate Collection System | Recycled from Total Collected Glass (%) | Effective Waste (%) |
|---|---|---|
| Bell only glass | 96 | 4 |
| Bell glass and metal | 92 | 8 |
| Door-to-door only glass | 90 | 10 |
| Door-to-door glass and metal | 79 | 21 |
| Road container for glass, metal, and plastic | 65 | 35 |
© 2017 by the authors. Licensee MDPI, Basel, Switzerland. This article is an open access article distributed under the terms and conditions of the Creative Commons Attribution (CC BY) license (http://creativecommons.org/licenses/by/4.0/).
Share and Cite
Testa, M.; Malandrino, O.; Sessa, M.R.; Supino, S.; Sica, D. Long-Term Sustainability from the Perspective of Cullet Recycling in the Container Glass Industry: Evidence from Italy. Sustainability 2017, 9, 1752. https://doi.org/10.3390/su9101752
Testa M, Malandrino O, Sessa MR, Supino S, Sica D. Long-Term Sustainability from the Perspective of Cullet Recycling in the Container Glass Industry: Evidence from Italy. Sustainability. 2017; 9(10):1752. https://doi.org/10.3390/su9101752
Chicago/Turabian StyleTesta, Mario, Ornella Malandrino, Maria Rosaria Sessa, Stefania Supino, and Daniela Sica. 2017. "Long-Term Sustainability from the Perspective of Cullet Recycling in the Container Glass Industry: Evidence from Italy" Sustainability 9, no. 10: 1752. https://doi.org/10.3390/su9101752