Article

Drought Dynamics and Vegetation Productivity in Different Land Management Systems of Eastern Cape, South Africa—A Remote Sensing Perspective

1
Center for Remote Sensing of Land Surfaces, University of Bonn, Walter-Flex-Straße 3, 53113 Bonn, Germany
2
Remote Sensing Research Group, University of Bonn. Meckenheimer Allee 166, 53115 Bonn, Germany
3
Institute for Environment and Human Security, United Nations University, Platz der Vereinten Nationen 1, 53113 Bonn, Germany
4
Disaster Management Training and Education Centre for Africa, University of the Free State, PO Box 339, Bloemfontein 9300, South Africa
5
United Nations Office for Outer Space Affairs (UNOOSA), United Nations Platform for Space-based Information for Disaster Management and Emergency Response (UN-SPIDER), Platz der Vereinten Nationen 1, 53113 Bonn, Germany
*
Author to whom correspondence should be addressed.
Sustainability 2017, 9(10), 1728; https://doi.org/10.3390/su9101728
Submission received: 30 July 2017 / Revised: 14 September 2017 / Accepted: 18 September 2017 / Published: 26 September 2017
(This article belongs to the Special Issue Sustainability Assessment of Land Use and Land Cover)

Abstract

:
Eastern Cape Province in South Africa has experienced extreme drought events during the last decade. In South Africa, different land management systems exist belonging to two different land tenure classes: commercial large scale farming and communal small-scale subsistence farming. Communal lands are often reported to be affected by land degradation and drought events among others considered as trigger for this process. Against this background, we analyzed vegetation response to drought in different land management and land tenure systems through assessing vegetation productivity trends and monitoring the intensity, frequency and distribution of the drought hazard in grasslands and communal and commercial croplands during drought and non-drought conditions. For the observation period 2000–2016, we used time series of 250 m Vegetation Condition Index (VCI) based on the Moderate Resolution Imaging Spectroradiometer (MODIS) Enhanced Vegetation Index (EVI) and Climate Hazard Group InfraRed Precipitation with Station data (CHIRPS) precipitation data with 5 km resolution. For the assessment of vegetation dynamics, we: (1) analyzed vegetation productivity in Eastern Cape over the last 16 years with EVI; (2) analyzed the impact of drought events on vegetation productivity in grasslands as well as commercial and communal croplands; and (3) compared precipitation-vegetation dynamics between the drought season 2015/2016 and the non-drought season 2011/2012. Change in total annual vegetation productivity could detect drought years while drought dynamics during the season could be rather monitored by the VCI. Correlation of vegetation condition and precipitation indicated areas experiencing significant vegetation productivity trends showing low and even negative correlation coefficients indicating other drivers for productivity change and drought impact besides rainfall.

1. Introduction

Drought is one of the biggest disasters of the 21st century; threatens global food security causing environmental, societal, and economic problems; and ranks first in degree of severity, length of event, total area extend and social effect compared to other hazards [1,2]. Although often more visible as a problem in the developing world and semi-arid or arid regions, the effects are global. We observe growing international interest in droughts during the last years [3] due to their increasing frequency triggered by climate change and resulting negative impacts on environment and livelihoods [4]. Drought is also a priority concern for most countries of the African continent [3,5,6]. Especially during the last decades, South Africa has been affected by droughts several times.
Droughts are not clearly defined and rely rather on a conceptual definition describing a deficit of precipitation that results in damage of crops and yield loss [7]. Four types of droughts can be distinguished: meteorological, agricultural, hydrological, and socioeconomic drought [8]. The two relevant droughts, influencing vegetation, are meteorological drought, which is a consequence of reduction of precipitation, and agricultural drought, which refers to shortage of available water for plant growth [1,8,9].
The index recommended by the World Meteorological Organization (WMO) to characterize meteorological drought globally by all National Meteorological and Hydrological Services (NMHSs) is the Standardized Precipitation Index (SPI). This index is based on precipitation only referenced with rainfall data spanning a minimum of 30 years [10,11,12]. The SPI can be calculated for different timescales and thereby allows a variety of analysis such as short-term water supply including soil moisture but also long-term water supply with regard to groundwater levels [13].
Even though SPI provides good insights into meteorological drought conditions allowing analysis on different timescales, a combination with further information is needed to understand the effect of lack of rainfall on the vegetation, e.g., for the case of agricultural drought [13]. Satellite Earth Observation data play an unprecedented role in monitoring of vegetation conditions and thus agricultural droughts. Therefore, it complements in-situ measurements as well as meteorological observations for a comprehensive drought hazard analysis. Especially in locations with a limited number of in-situ measurement networks, remote sensing data are often the only available information source for drought hazard monitoring. During the last decade, many remote sensing based indices were developed that monitor different aspects of drought hazard [6,14,15,16,17,18]. These indices have different input data requirements and utilize various methods for drought hazard quantification. The Vegetation Condition Index (VCI), calculated from Normalized Difference Vegetation Index (NDVI) or Enhanced Vegetation Index (EVI), ranks among the most commonly used indices for drought monitoring derived from remote sensing imagery [19,20]. VCI allows the quantification of climatological impacts on vegetation and comparison of the weather impact in ecologically and economically different areas [19]. VCI reflects rainfall dynamics more accurately and is a better index for geographically non-homogeneous areas than, for example, the Normalized Different Vegetation Index (NDVI) only [21]. Different indices have been successfully used for drought hazard monitoring and crop yield estimation based on remote sensing [22,23]. However, new indices are developed continuously to address the lacks that are noted for preceding ones [24,25].
Land ownership in South Africa is historically divided into two tenure systems. The first one is a privately (commercially) owned land tenure system with approximately 70% of the total land cover, while a second one is a communally owned land tenure with about 14% of the total land [26]. Communal land was predominantly located within the former homeland territories and on municipal land around each town in South Africa. Nowadays, land is also handed over as communal land, which did not belong to former homelands [27]. Land degradation is an ongoing problem due to overgrazing, unsustainable land management and droughts, and is often reported for communal lands in South Africa [28,29]. Low income households in particular are vulnerable to climate extremes affecting especially communal farming households depending on land for their living, while dryland agriculture represent their main source of income [30]. Drought acts as external stress factor to land, which in turn, reinforces ongoing land degradation processes leading to even more severe impacts on cropland and rangeland when a drought event occurs [31,32]. Land degradation results in a loss of vegetation productivity and declining yields describing an ongoing process rather than a state or current condition [33,34,35,36]. If land degradation is triggered by the event of a drought, impacts on vulnerable social-ecological systems are even more severe. Land degradation processes can occur in different forms such as decrease in soil fertility, loss of vegetation and bush encroachment. Main indicators to monitor land degradation and improvement with remote sensing are vegetation indices. In addition, for agricultural drought hazard analysis, vegetation response is used as a key indicator, however, the phenomenon of land degradation, as e.g., by bush encroachment, can trigger unexpected productivity trends during drought events which need to be considered.
The main aim of this paper is to analyze vegetation response in different land management systems during drought and non-drought seasons in order to understand the suitability of the measure of vegetation productivity for agricultural drought monitoring. Despite an existing body of literature on droughts, analysis of droughts and its impact on land degradation within different land management systems and under different land tenure has not yet been explicitly addressed. Considering an increasing number of drought events globally, analysis of vegetation response to drought events and possible land degradation processes is needed for further identification of sustainable land management practices. Land degradation and drought hazard assessment both should be, however, in ongoing discussion due to drastic societal impacts linked to high dependency of rural populations on agricultural land [30].
We question if droughts emerge differently in various land management systems and especially within communal and commercial cropland with regard to impacts on vegetation productivity within different land tenures. The objectives of this study were: (i) to monitor vegetation productivity trends; (ii) to characterize and classify drought hazard occurrence in Eastern Cape during the last 16 years based on time series analysis of vegetation condition information (vegetation condition index (VCI)) and precipitation; and (iii) to compare drought characteristics in Eastern Cape, in different land management systems and particular communal and commercial croplands. Vegetation productivity assessment and correlation between vegetation condition and precipitation was conducted for different land management systems such as grasslands and croplands. Detailed analysis on drought impact within different land tenure classes was conducted within croplands only as spatial information of the two different land tenure classes, i.e., communal and commercial, was only available for cultivated land.

2. Materials and Methods
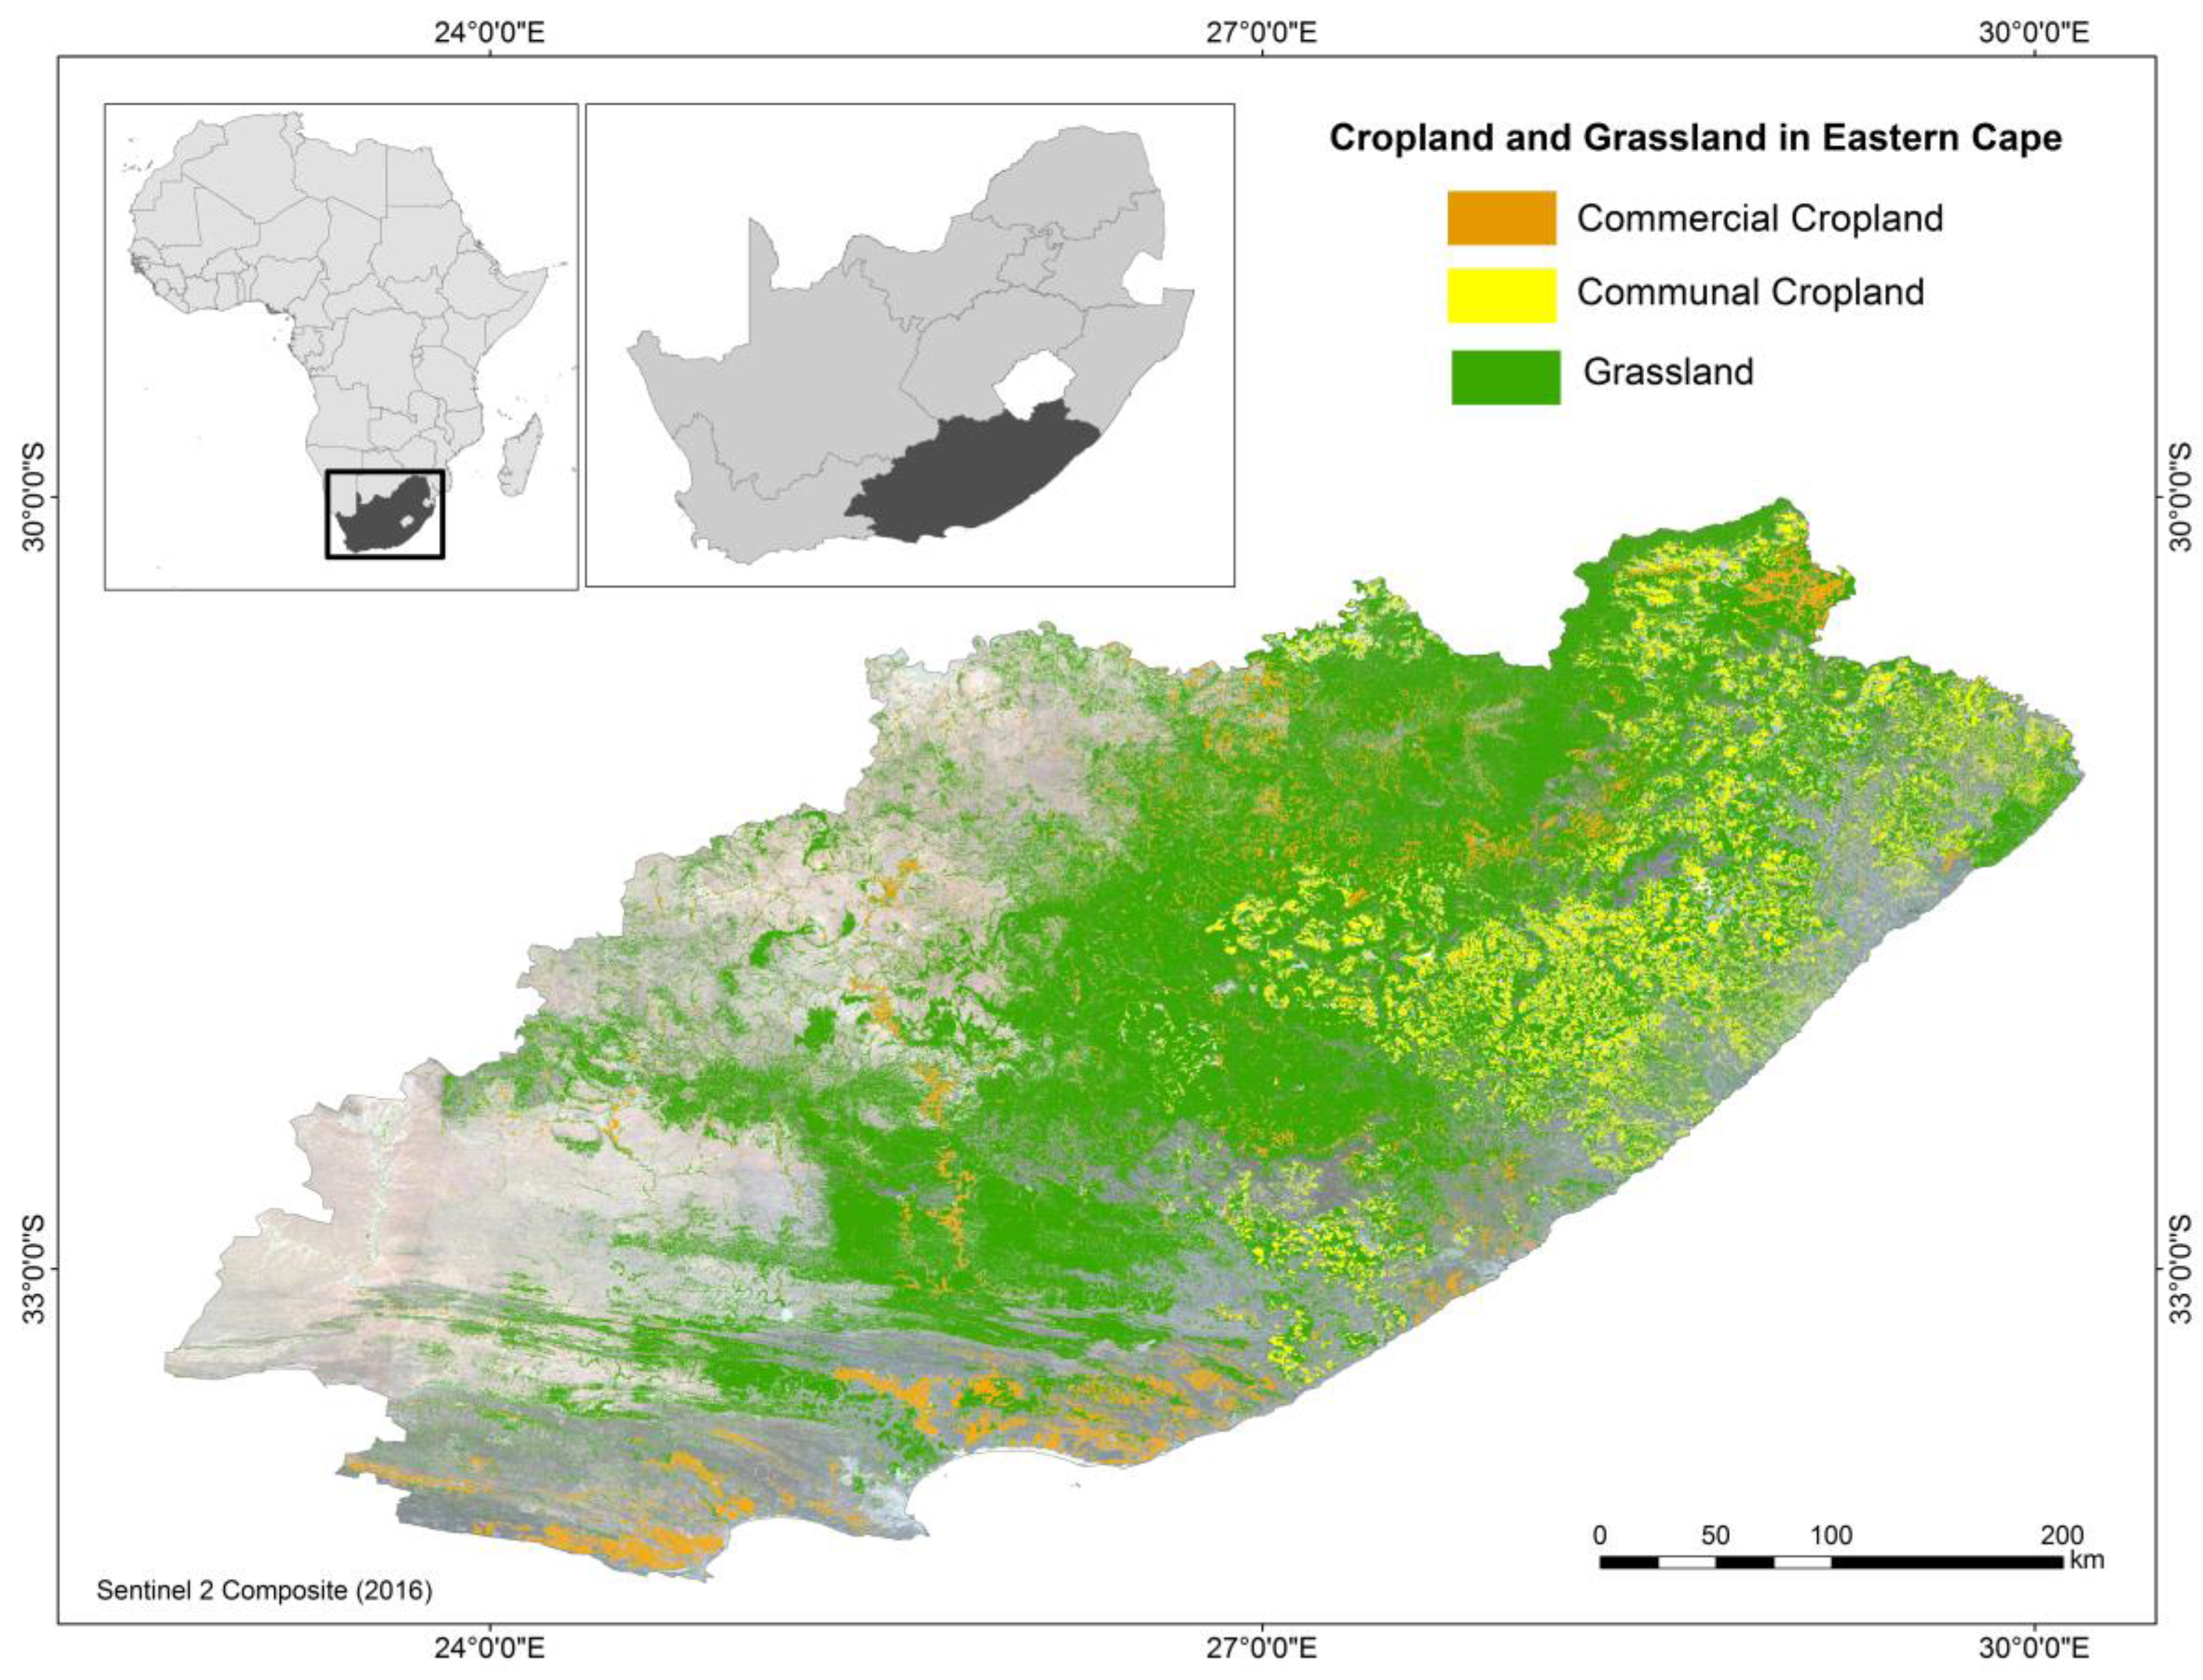
2.1. Study Area

The Eastern Cape Province covers an area of approximately 170,500 km2 and is the second largest province in South Africa, located in the south east of the country (Figure 1). The topography of the province is diverse resulting in climatic complexity and diversity, with very steep and complex environmental gradients leading to a rich mixture of floristic elements. Savanna biomes are the most dominant land cover while large areas are covered by grassland, dwarf-shrub vegetation (Nama Karoo) and thicket biomes [37,38]. The climatic conditions in Eastern Cape vary from mild warm temperatures to subtropical conditions at the coast. Droughts can occur throughout the year, but agricultural crops are particularly vulnerable to droughts in summer during the growing season which mainly goes from October to March. The precipitation regime is characterized by a large variability at various time scales from intra-seasonal, through inter-annual to decadal and multi-decadal [39]. Rainfall distribution shows a gradient from northeast to southwest with higher mean annual precipitation (MAP) (800–1000 mm) in the eastern part of the province. Dry conditions throughout the year (<400 mm MAP) are mainly found in the western area. The El Niño Southern Oscillation phenomena (ENSO) influences the weather patterns including drought events of South Africa [40]. The coupled oceanographic-atmospheric El Niño climate anomaly is usually associated with a band of warm ocean water developing along the coastline in the central and east-central equatorial Pacific. However, due to so-called teleconnections interacting with the equatorial Walker circulation, this local phenomenon is affecting weather conditions over larger distances at the global scale. On average, the southern part of the African continent receives below-normal rainfall during El Niño years, whereas La Niña conditions usually provoke normal or above-normal rainfall [41]. The serious drought conditions affecting larger parts of Southern Africa during 2015/2016 were heavily influenced by a very strong El Niño event [41] causing rainfall deficits across large parts of Zimbabwe, Malawi, Zambia, South Africa, Mozambique, Botswana, and Madagascar, with seasonal rain that has so far been the lowest in the last 35 years [42].
Most land in Eastern Cape Province is used for agriculture, dominated by pastoralism and cropland cultivation. Around 35% of all households, nearly 600,000 people, of Eastern Cape Province are involved in agriculture [43]. Out of these households, only 32% are involved in crop farming while around 65% perform livestock farming [43]. These numbers highlight the importance of grasslands in this area. Overstocking is one of the bigger problems in South Africa as well as on communal land in Eastern Cape, which directly links to livestock farming [44]. Communal cultivated land is characterized mainly by rainfed small-scale agriculture with traditional management practices, while commercially cultivated land mainly addresses large-scale agriculture often using innovative management strategies including also irrigation practices. Figure 1 shows the distribution of grassland and the two land tenure systems in croplands of Eastern Cape. While commercial land is spread throughout the province except the eastern part, communal land is rather concentrated in the eastern part [45]. Accordingly, also population densities are much higher in the eastern part [46].
Small-scale farms in communal areas mainly have a farm size of average 18 ha while commercial farms are distributed over land areas with average 1456 ha in farm size in Eastern Cape [30,47]. This links a different equilibrium of farms and population density in both tenure systems. The communal farming areas are home to the lowest incoming households of the country, which main activity is subsistence farming and dryland agriculture.

2.2. Data and Methods

2.2.1. Enhanced Vegetation Index (EVI)

The Enhanced Vegetation Index (EVI) measures greenness and health of vegetation and vegetation productivity [48,49,50]. By incorporation of the blue band, the index includes reduced background information from the soil as well as effects of aerosols which occur in areas with cloud cover [51,52]. EVI is calculated as followed:
EVI = G × (NIR − RED)/(NIR + C1 × RED − C2 × Blue + L)
C1 and C2 represent coefficients for aerosol resistance, the Blue refers to the blue band in the remote sensing image and L shows the soil-adjustment factor. The corrected aerosol impact is included in the RED while G is a gain factor = 2.5 [53].
For the current study, Moderate Resolution Imaging Spectroradiometer (MODIS) Terra EVI MOD13Q1 (collection 5) data were used from 2000 to 2016. Images are atmospherically corrected 16-day composites of best observations with 250 m resolution [53,54,55]. MODIS EVI data were downloaded from NASA´s EARTHDATA platform and reprojected via the MODIS reprojection tool (MRTWeb) [55]. The study area is covered by four different MODIS tiles, which were mosaicked. The EVI was later used to calculate vegetation productivity trends and the VCI data.

2.2.2. Time Series Trend Analysis

Land degradation manifests in reduced productive potential of land [56]. Vegetation time series analysis is often used to detect land productivity change and from there related to land degradation or improvement [57,58]. Negative trends of EVI time series serve as an indicator of reduced vegetation productivity, and thus may indicate land degradation. Here, EVI trends were integrated to detect decreasing, stable or increasing vegetation productivity trends in the study area. EVI values were aggregated over the full southern year covering all images from July to June of the following year in order to derive at the same time the total vegetation productivity of a pixel.
For time-series trend analysis the Seasonal Mann-Kendall (MK) trend test was applied [59,60]. This method was used extensively with remotely sensed derived time series [61,62]. It is a non-parametric test and can estimate monotonically increasing or decreasing trends, while data can have non-normal distribution. Mann–Kendall Tau can range from −1 to 1, where significant negative values account for negative trends, significant positive values account for monotonically increasing trends and 0 shows time series with no trend. Decreasing vegetation productivity thereby describes significant decreasing trends in the analysis, increasing vegetation productivity significant increasing trends (with p < 0.05).
Trends were overlaid with the grassland and the land tenure cropland masks of the land cover map to detect if the two tenure systems are affected differently by decreasing and increasing vegetation productivity trends as well as drought events in the further analysis.

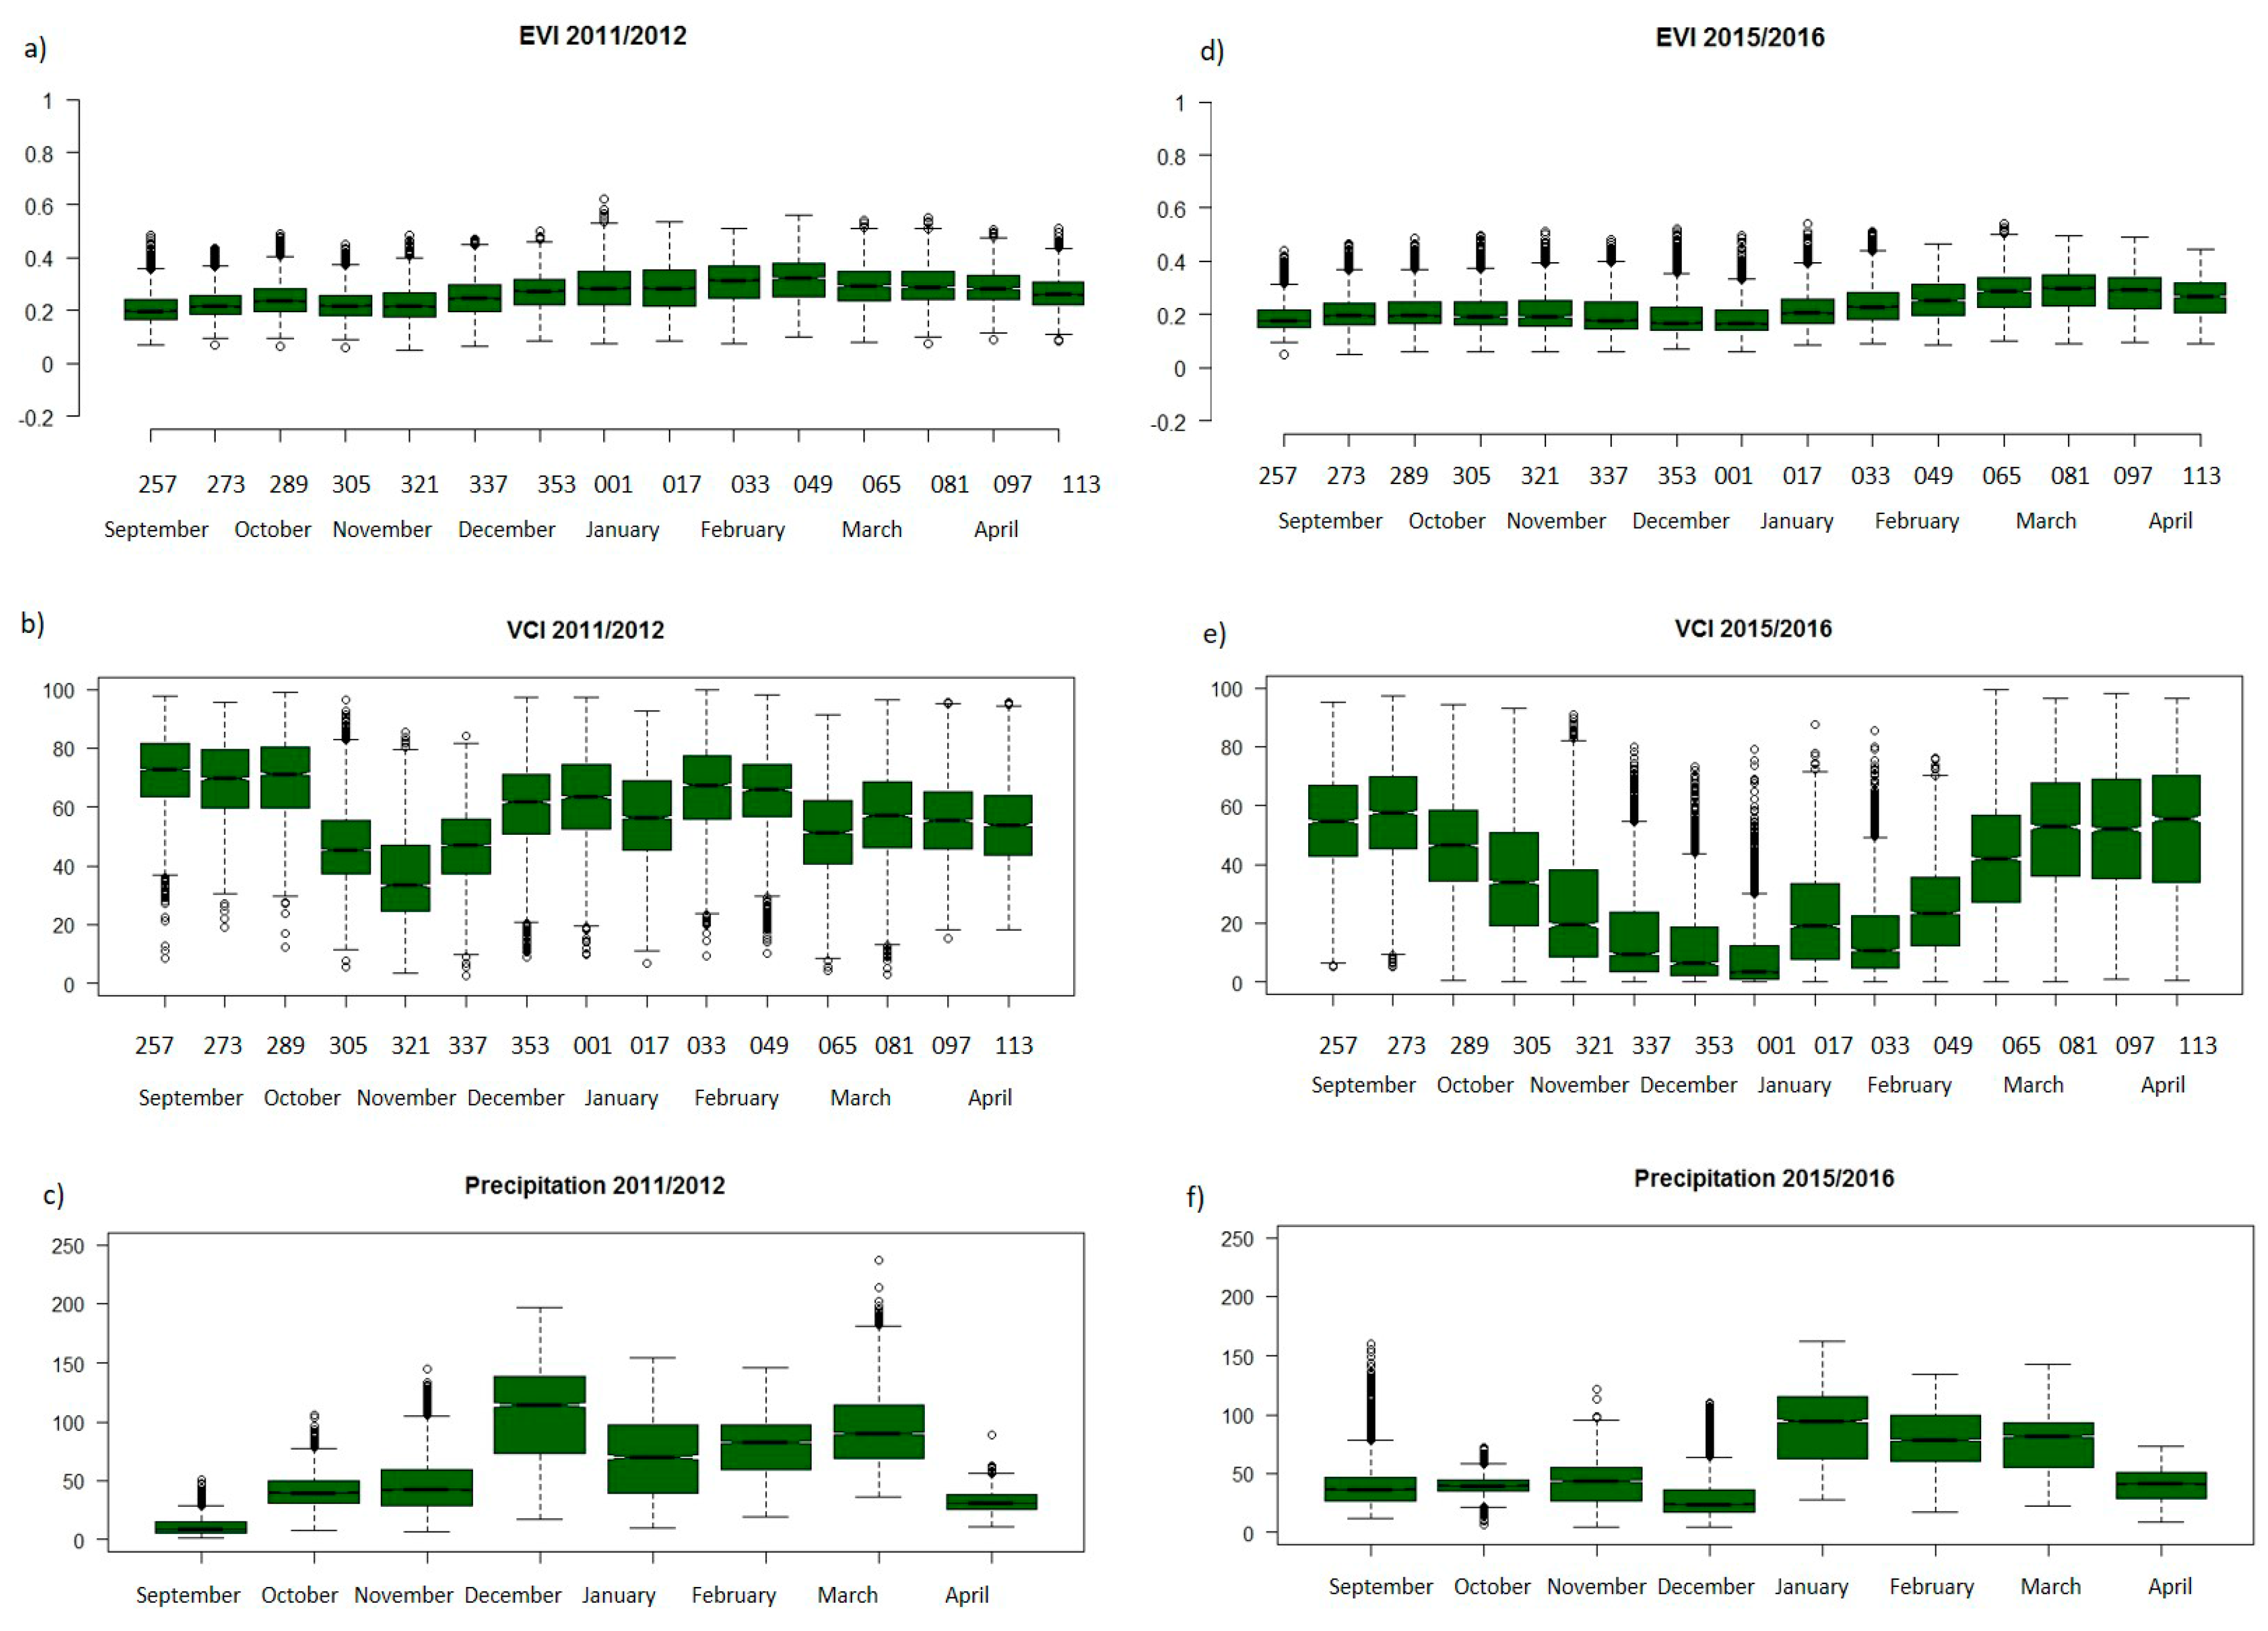
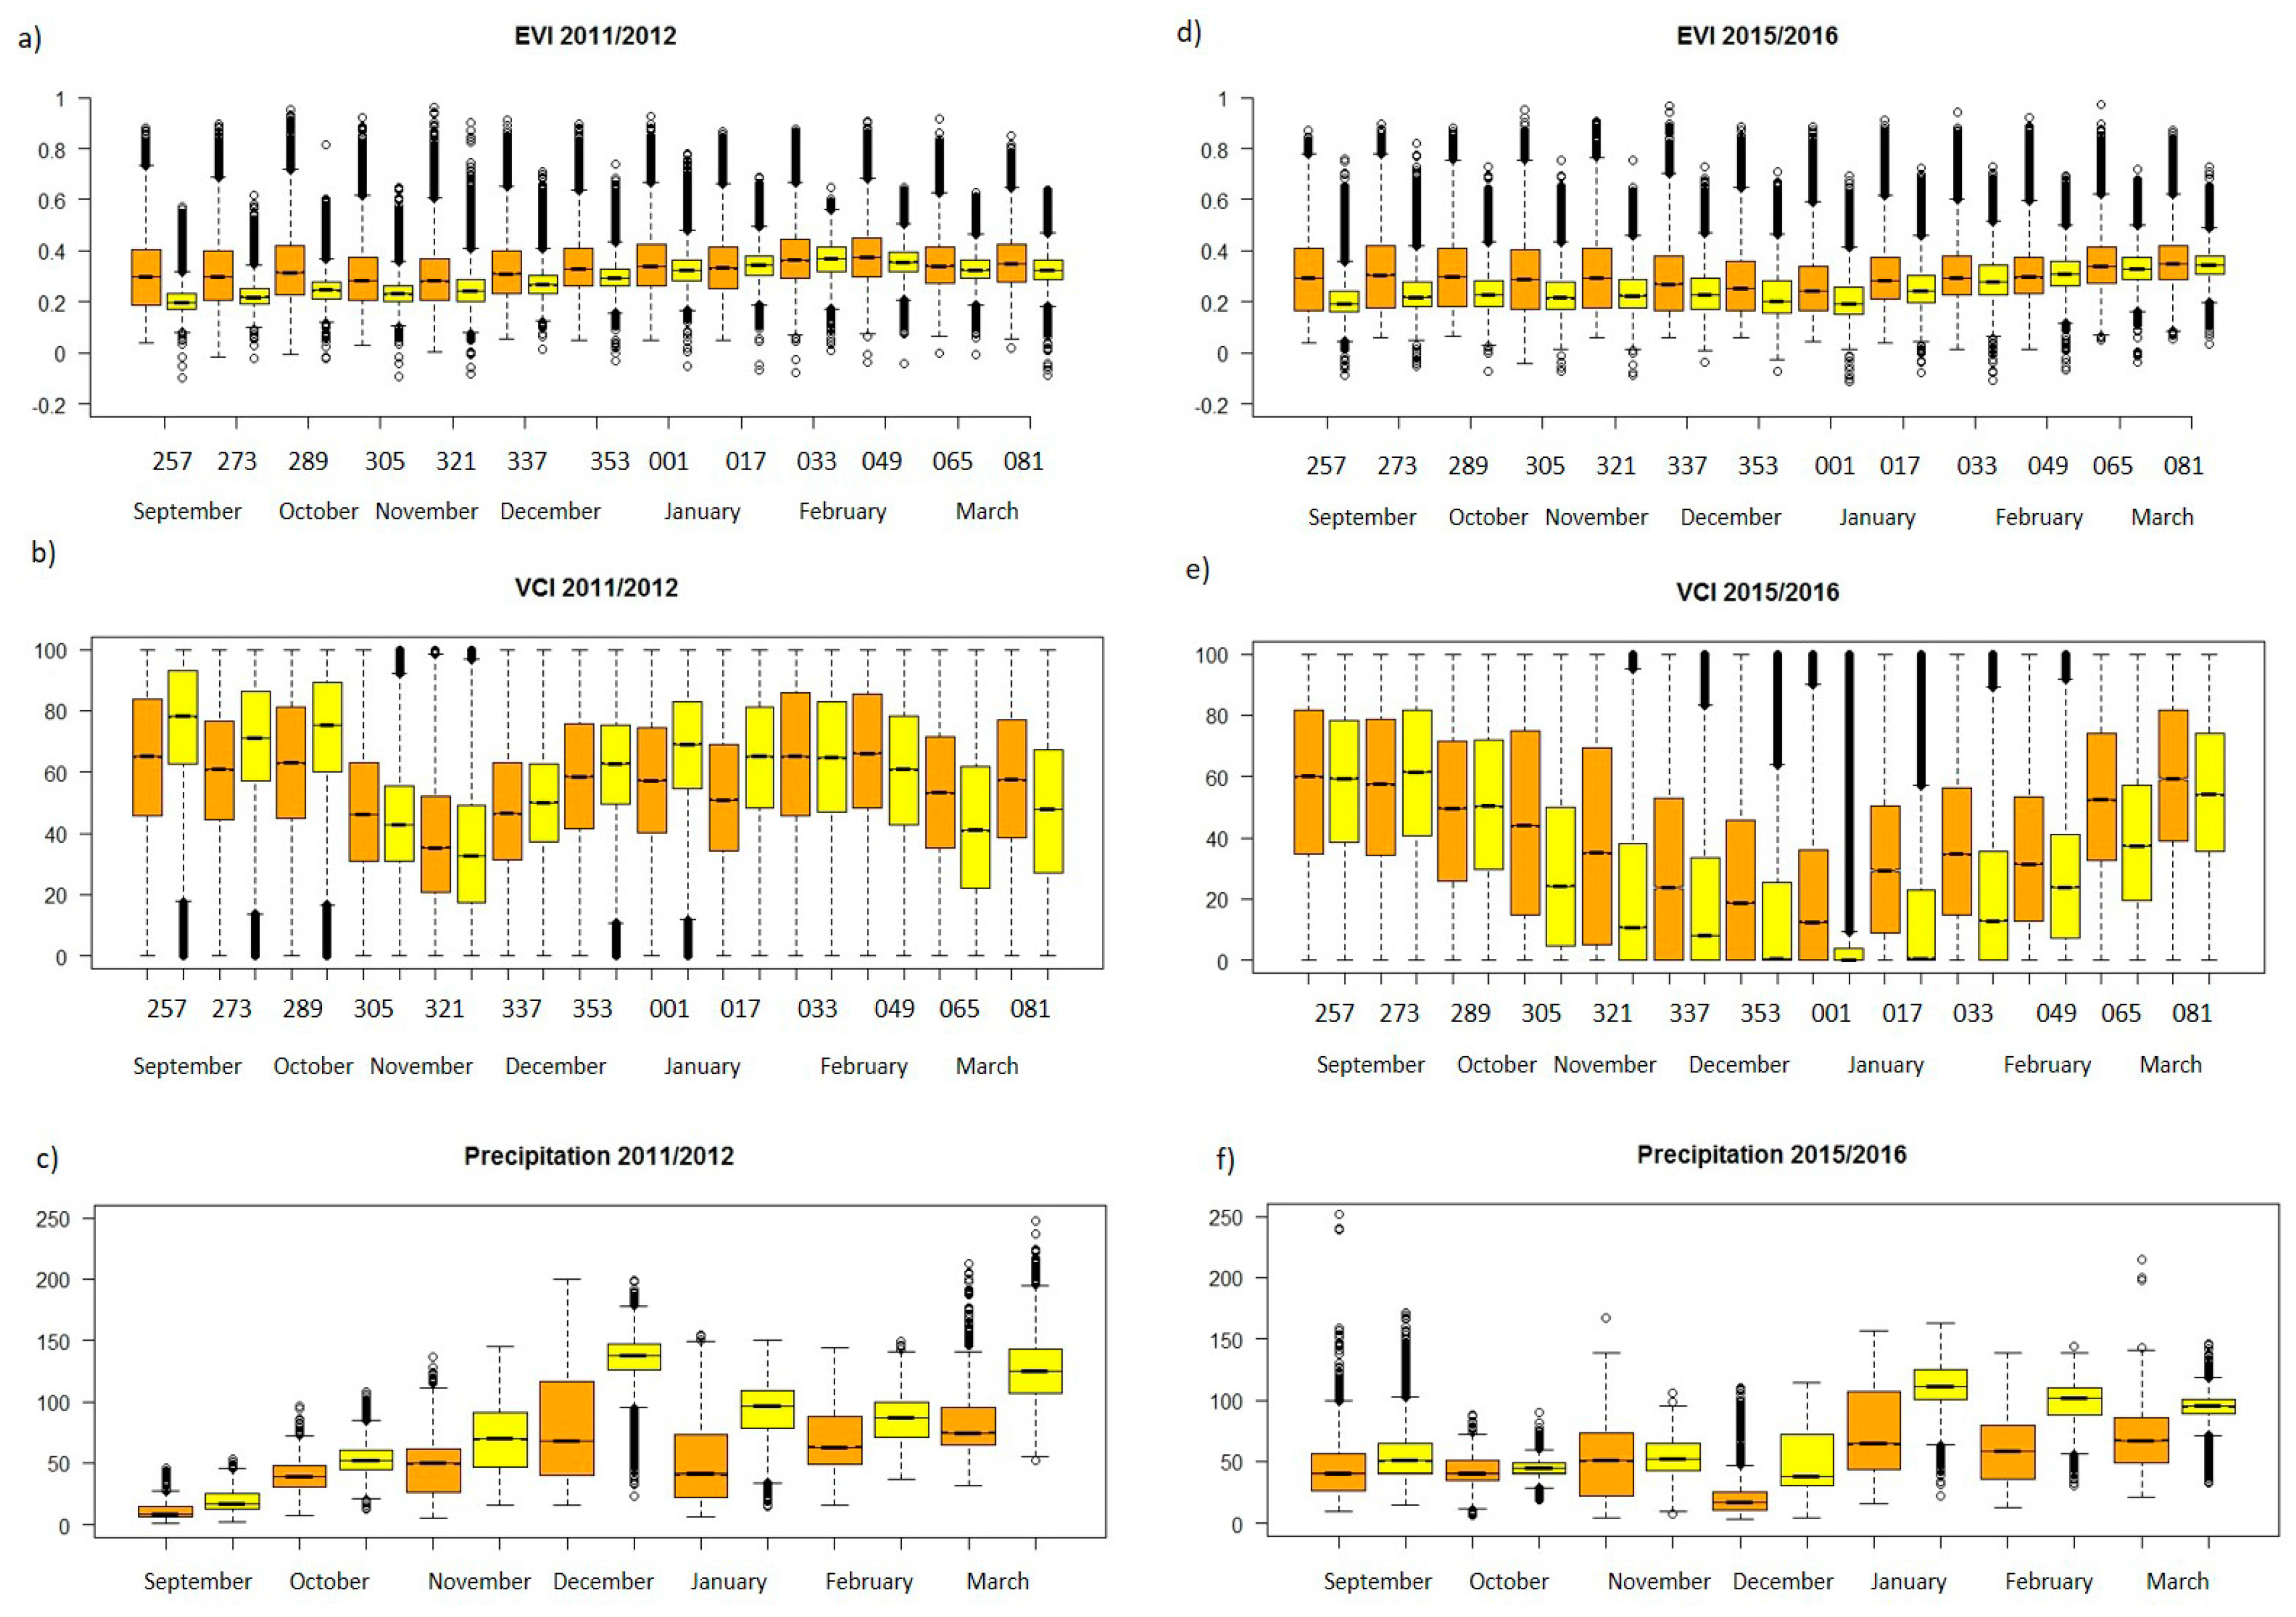
2.2.3. Calculation of Vegetation Condition Index (VCI) for Drought Classification

While the EVI provides information about the greenness, health, density and productivity of the vegetation at a certain point of time, the vegetation condition index (VCI) is a pixel-based normalization which allows relative assessments of changes within an observation period. It is measured by the percentage of EVI regarding its maximum amplitude of the whole time series (Equation (2)). Among all available drought indices, the remote sensing based Vegetation Condition Index (VCI) by Kogan [63] is one of the most frequently applied indices to quantify agricultural drought hazard severity (Table 1). The index scales Vegetation Index (VI) values, from 0 to 100 based on minimum and maximum values of the VI over a defined observation period. For the here presented study, we used the following calculation:
VCI = 100 × (EVI − EVImin)/(EVImax − EVImin)
The classification scheme to indicate different stages of drought hazard severity using VCI is shown in Table 1 [64,65,66].
VCI analysis was conducted based on all images available over the growing seasons within the observation period between 2000 and 2016 to detect possible drought hazard severity during the observation period as well as the correlation between VCI and rainfall to identify the dependency of vegetation condition on precipitation within the region.

2.2.4. Precipitation Data

Precipitation plays a key role for vegetation growth [67,68,69]. To explain vegetation dynamics by water availability through rainfall, we therefore included precipitation information based on the Climate Hazards Group InfraRed Precipitation with Station (CHIRPS) data [70] in our analysis. The global dataset is available at a spatial resolution of 5 km and for different temporal resolutions from daily up to decadal datasets. It incorporates satellite imagery with in-situ station data and also supports drought monitoring analysis by United States Agency for International Development (USAID) Famine Early Warning Systems Network (FEWS NET) [70]. The here chosen product were monthly precipitation rates.

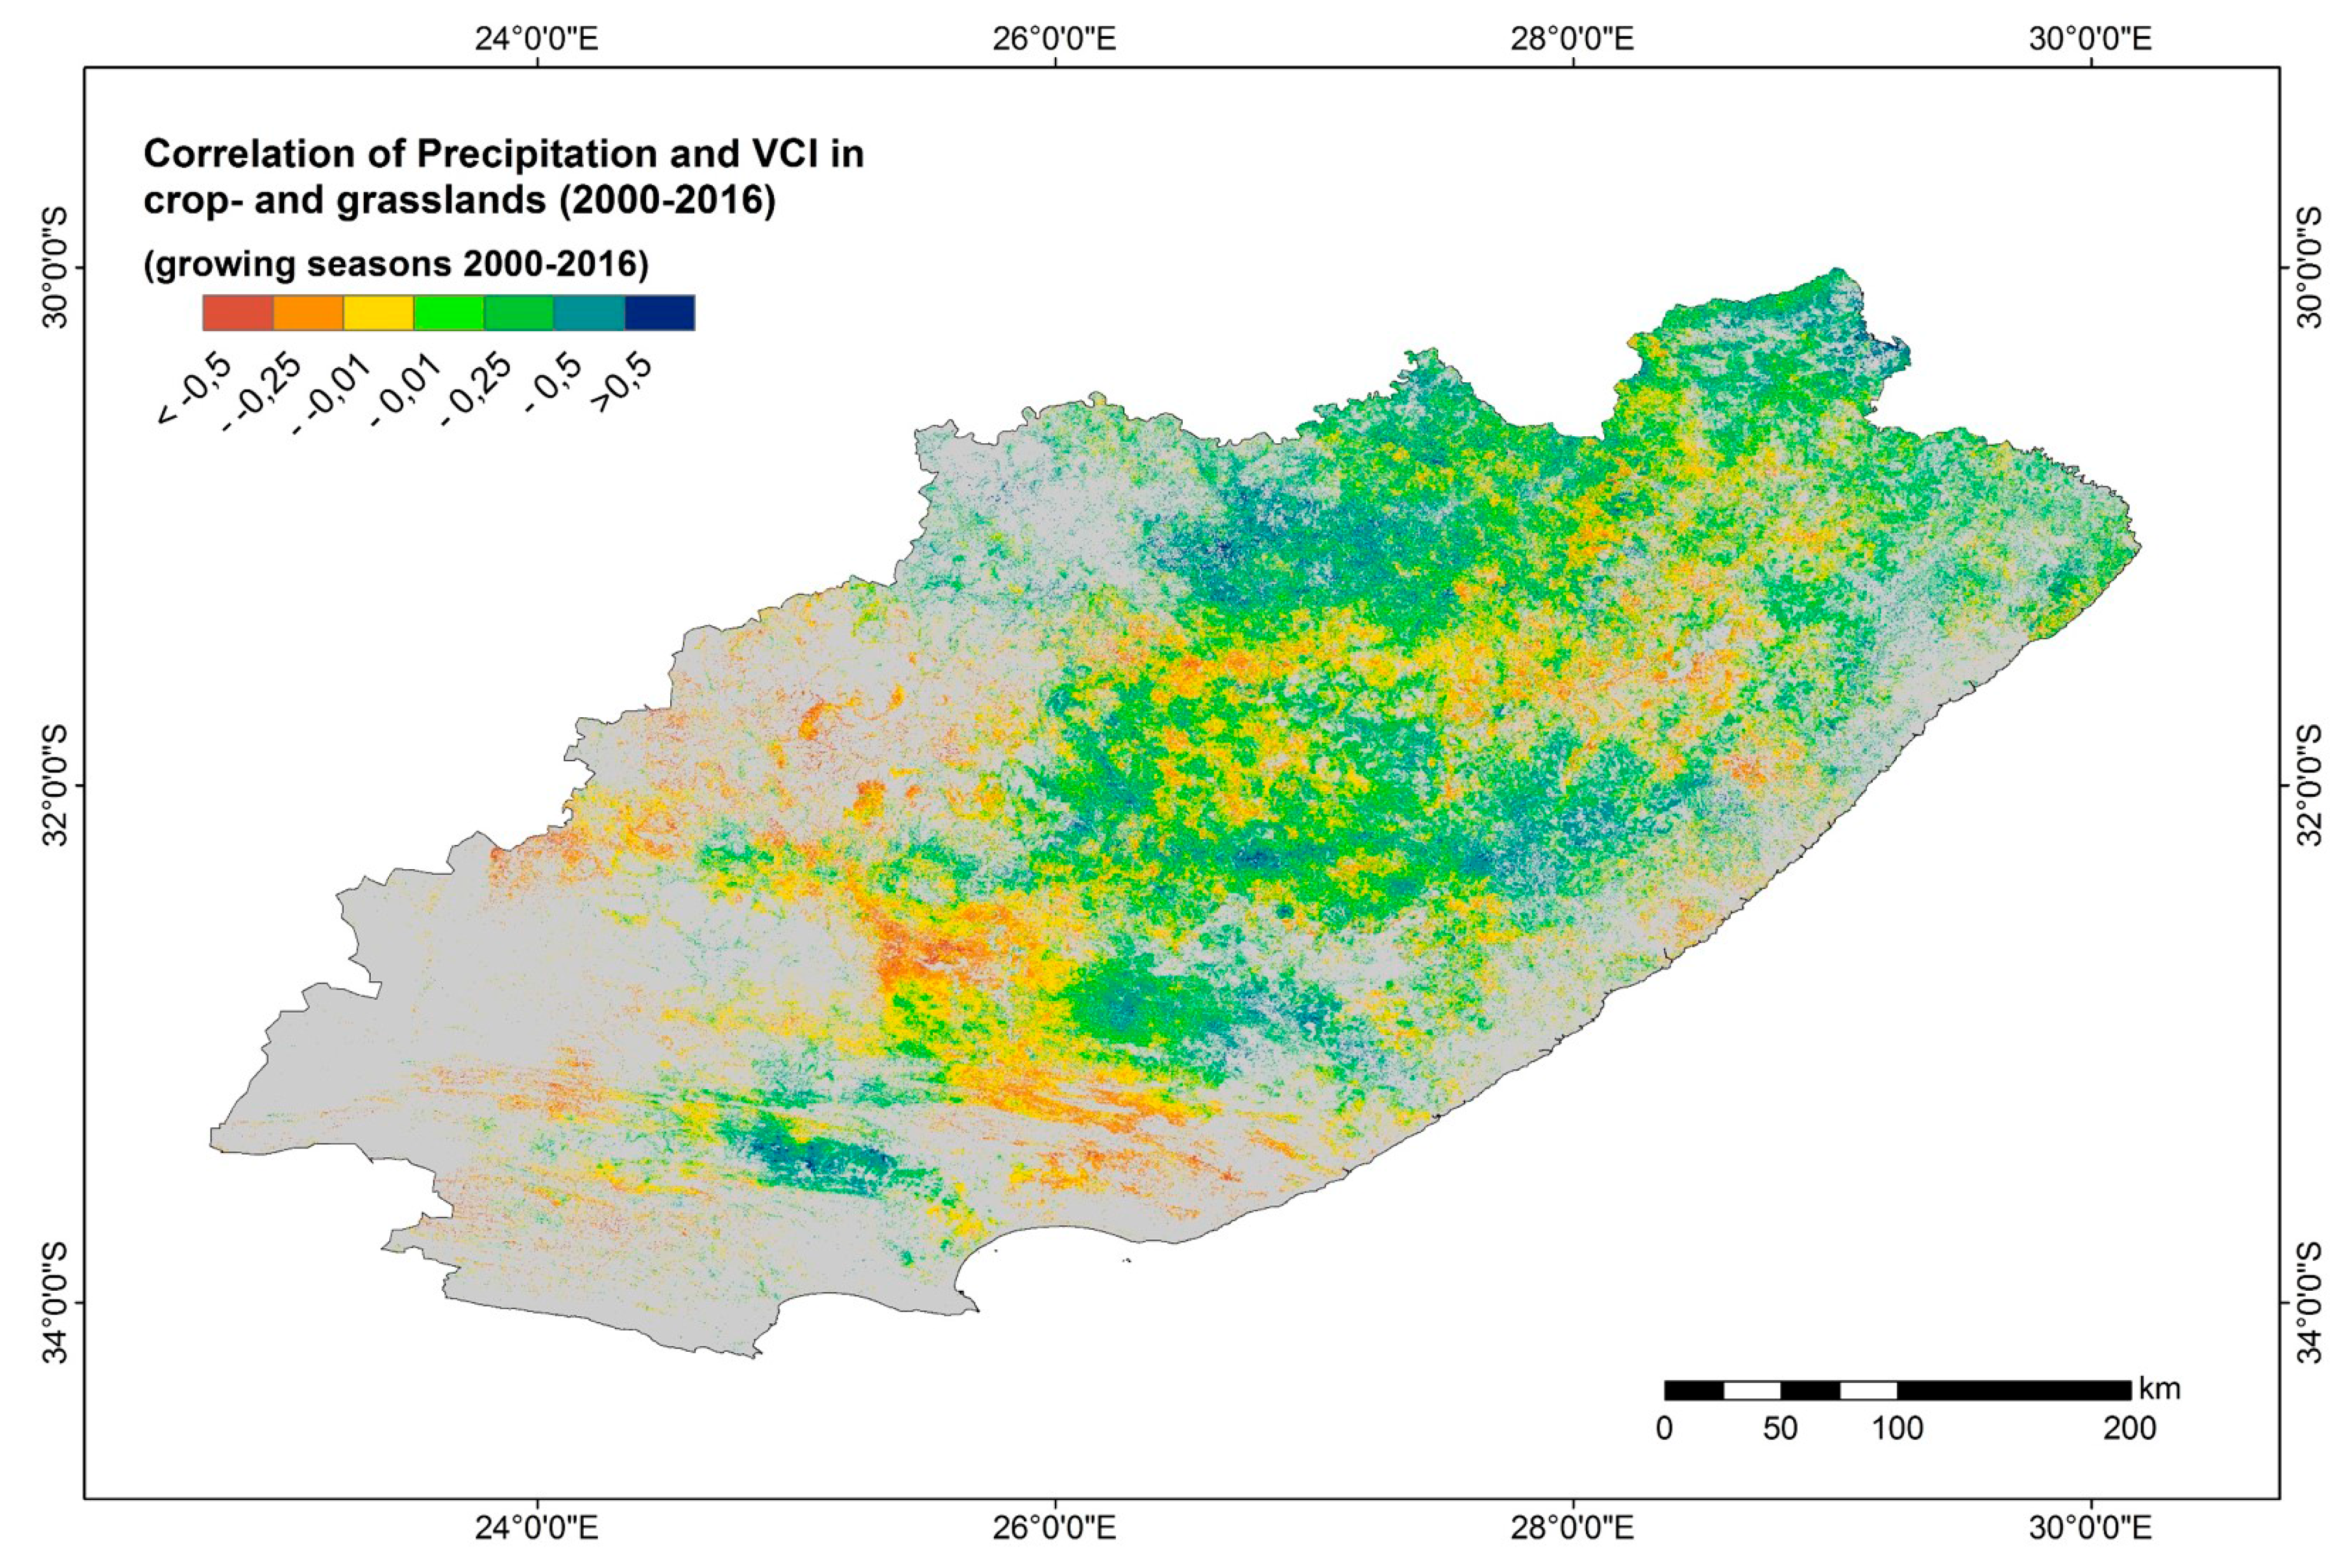
2.2.5. Precipitation–Vegetation Correlation Analysis

As precipitation is the main limiting factor for vegetation growth, precipitation analysis was included to analyze vegetation-rainfall dependencies. Further, correlation with VCI highlights areas where precipitation is not the main driving factor for vegetation condition. As mentioned, VCI data from 2000 to 2016 were identified for each main growing season, i.e., September to March. Median values were built for each growing season resulting in total 16 datasets. Precipitation data for the full growing season were summed to get the total amount of water availability from rainfall. A linear trend was calculated over the full observation period from 2000 to 2016 for growing seasons and full years. The level of analysis was adjusted to the spatial resolution of the VCI data. The rainfall data with 5 km-resolution was therefore resampled using bilinear resampling to 250 m spatial resolution to have a uniform level of analysis. Pearson correlation further was run over the 16 time steps comparing each year of rainfall and vegetation condition over the total period. The correlation coefficients were additionally calculated with sum EVI over the growing season to look into correlation of total vegetation productivity over the growing season in addition to vegetation condition and its relation to rainfall. Further, intensity of vegetation and precipitation dynamics during the growing season of a normal year (2011/2012) and a drought year (2015/2016) was analyzed and compared.

2.2.6. Land Cover Information

Land Cover information is based on the South African National Land-cover datasets produced by GEOTERRAIMAGE in 2013–2014, which was generated with 600 multi-seasonal 30 m Landsat 8 multispectral images that were acquired between April 2013 and March 2014 [71]. The National Land-Cover Dataset for South Africa has an overall accuracy of 81.73% with mean land-cover/land-use class accuracy of 91.27%, which was determined by 6,415 sample point across the region [71]. Among 72 different classes available in the map, we extracted the ones, which identified communal and commercial cropland areas. This distinction was only available for croplands but not for identification of grasslands for the two different land tenure systems. Therefore, we so far only focus on cultivated agricultural land for the two land tenure classes and grassland as one class.

3. Results

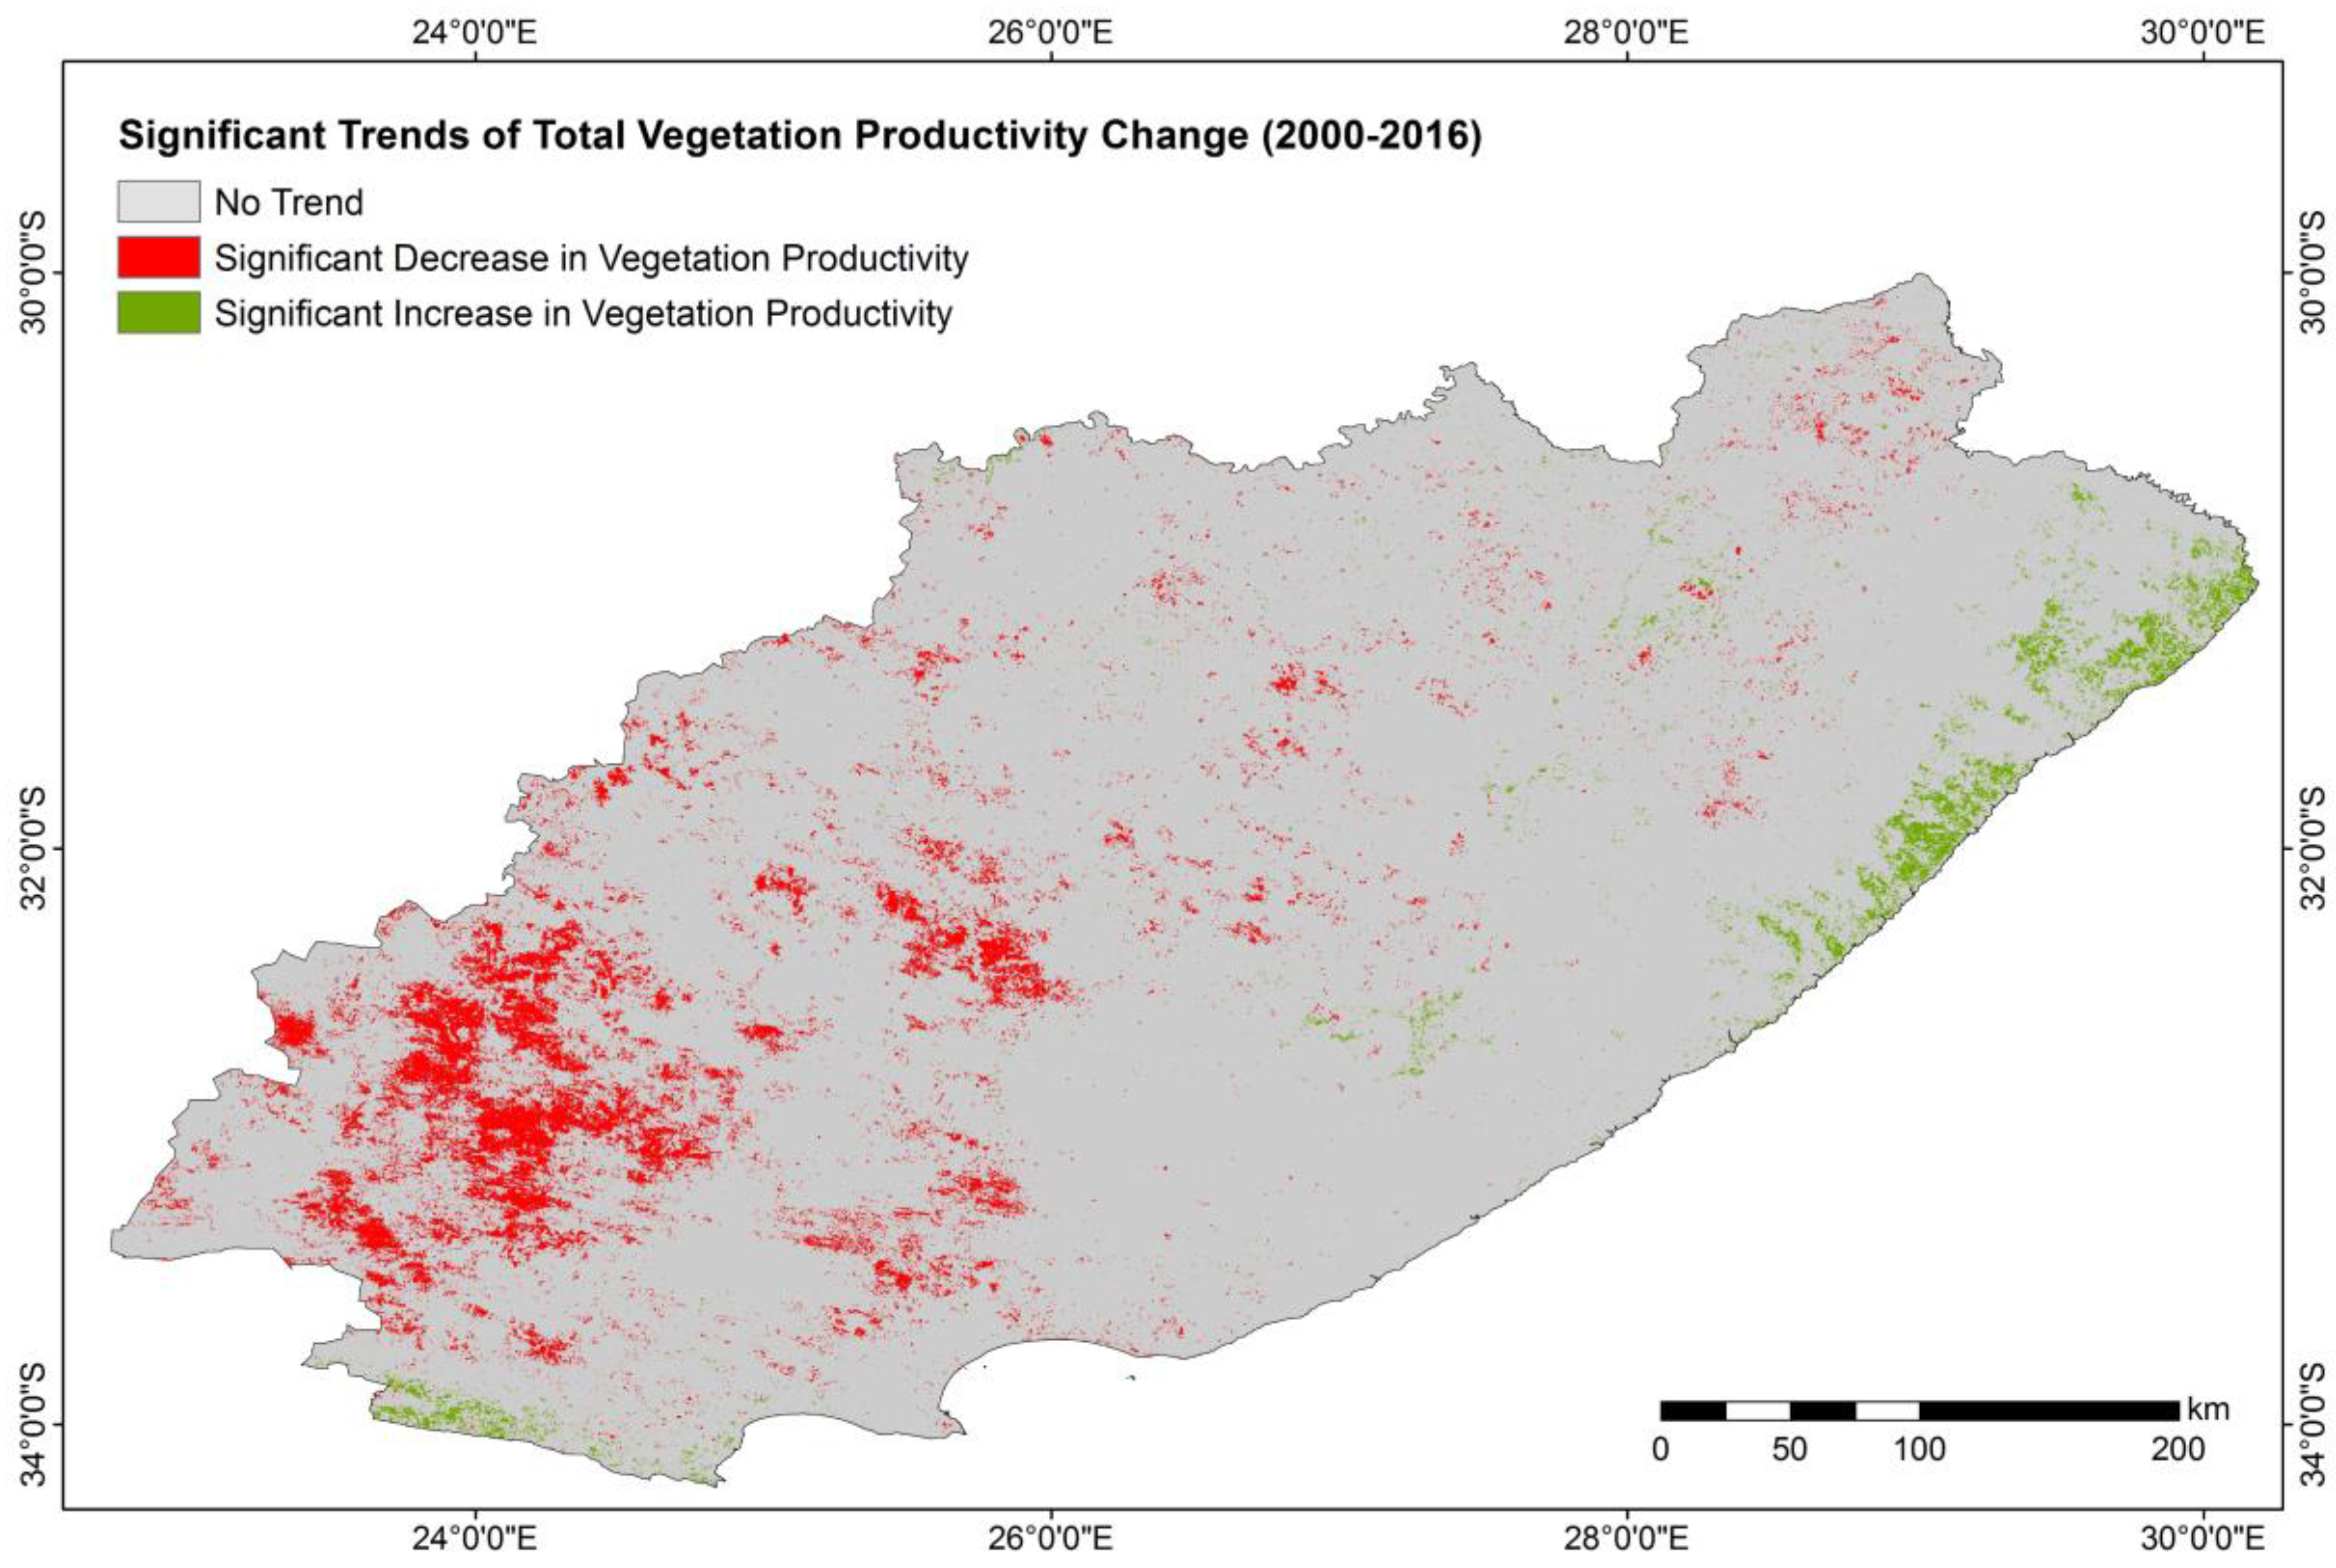
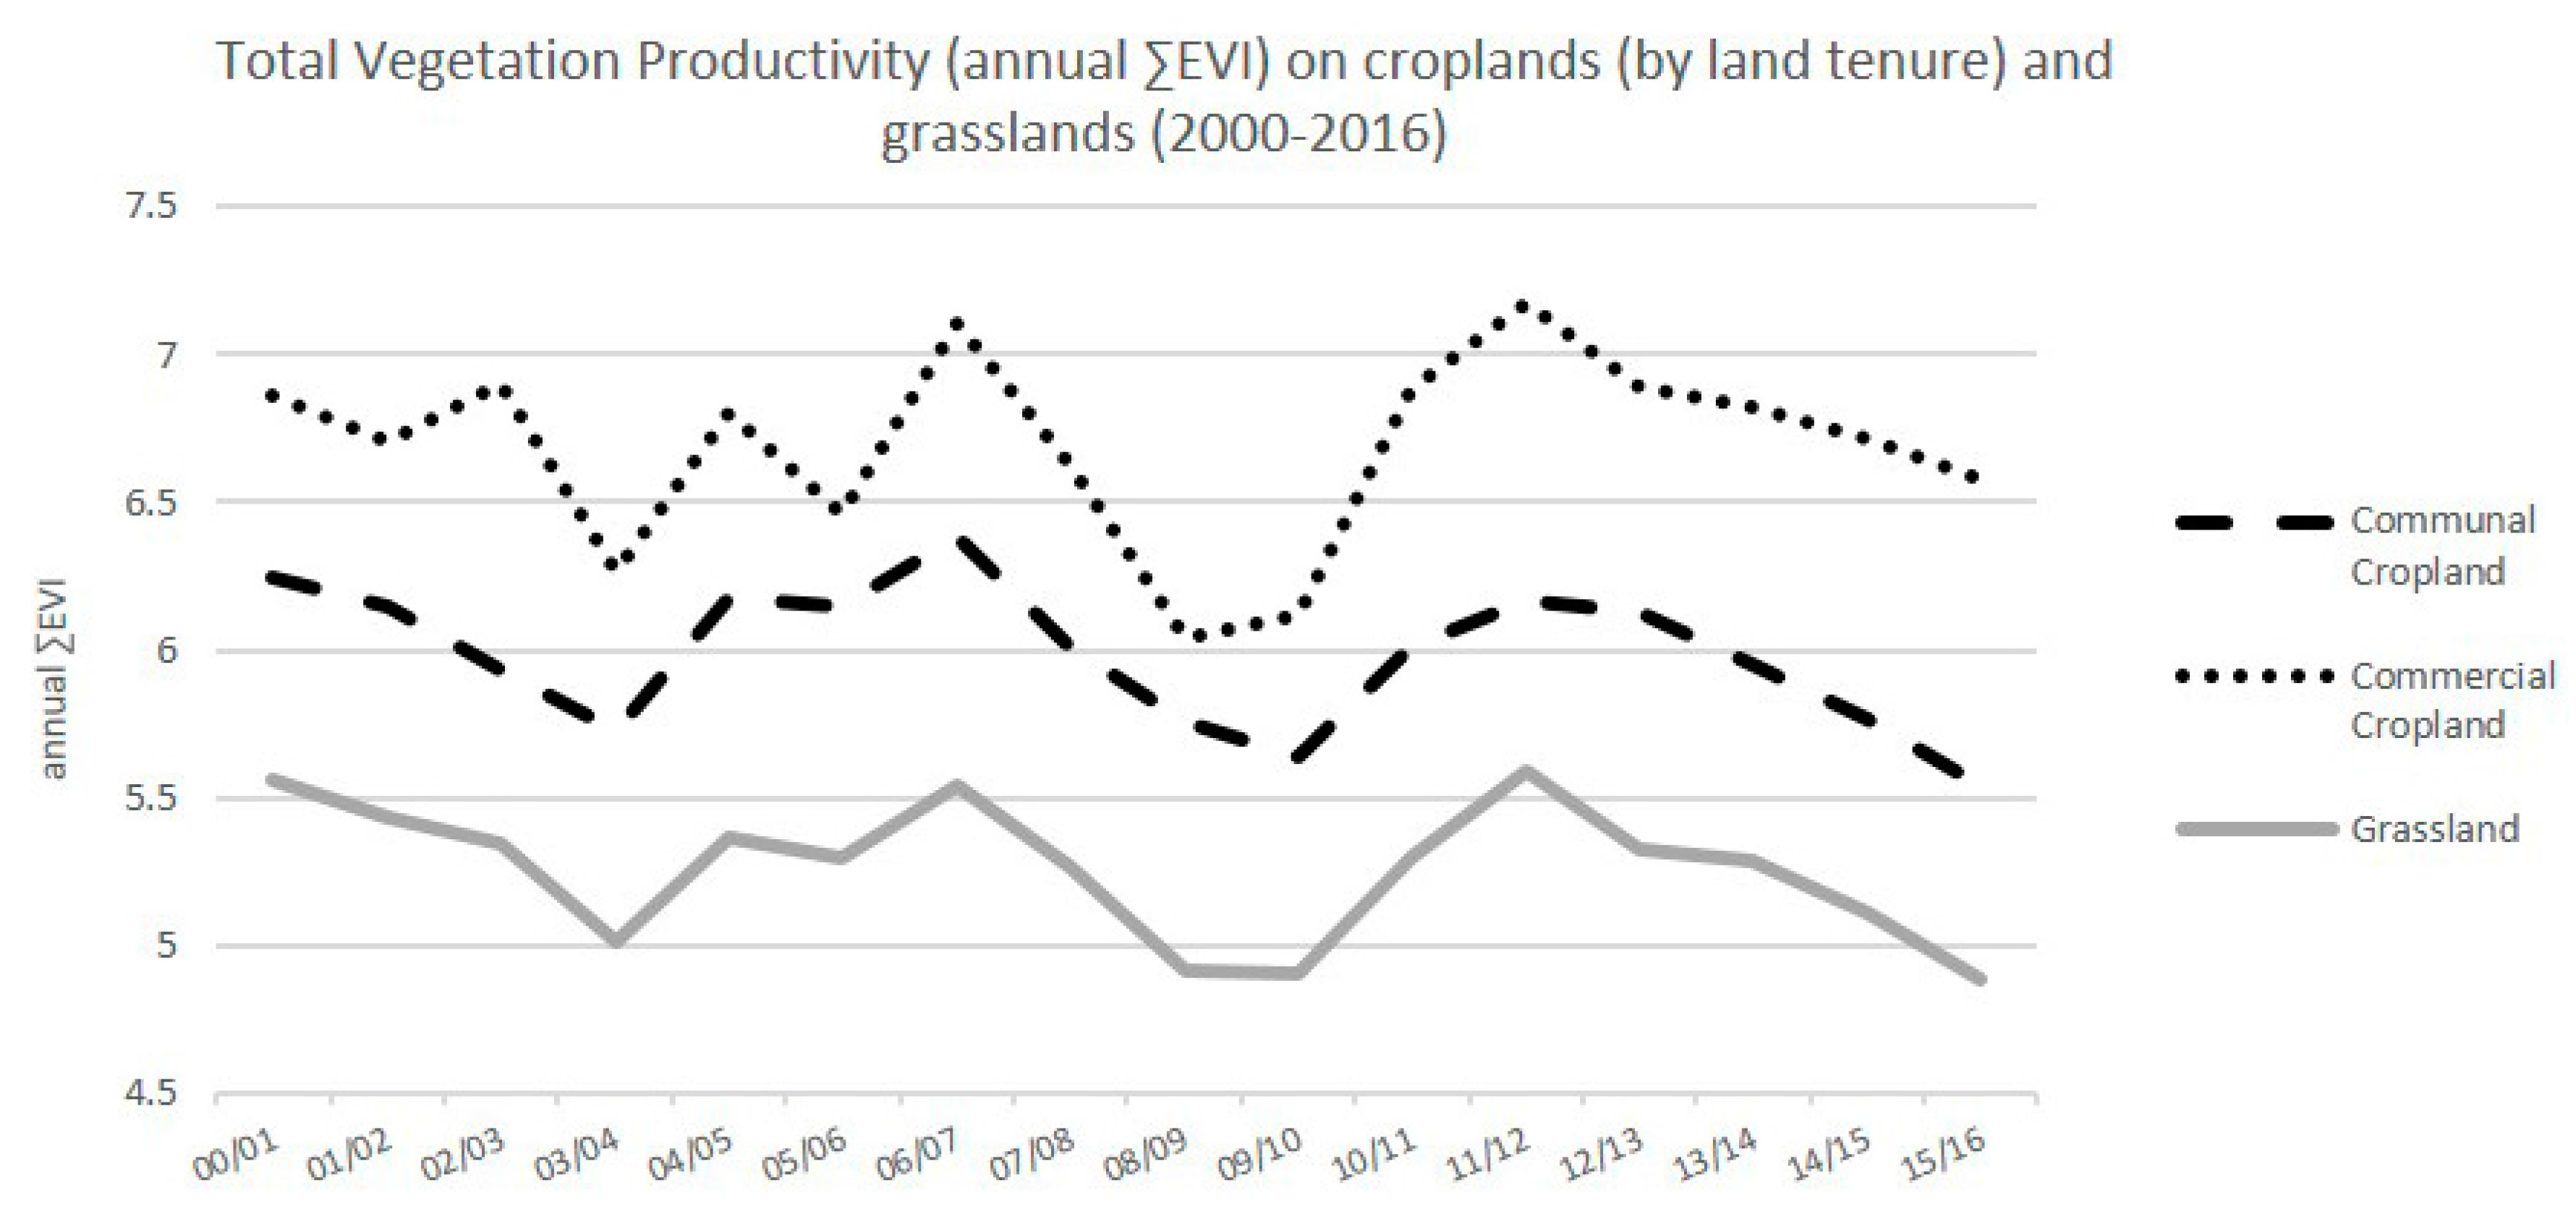
3.1. Vegetation Productivity Trends

MODIS EVI trend analysis with 250 m resolution enabled detection of vegetation productivity trends. Figure 2 shows significant increasing and decreasing vegetation productivity trends in Eastern Cape Province. We can identify significant increasing trends (green) along the coastline. Here, mainly communal croplands are located. Significant decreasing trends (red) are detected in the western part of the province, also partly overlapping with grasslands and commercial croplands. Most significant decreasing trends however were found in low shrublands according to the land cover classification [71].
Overlaying land tenure information in croplands with decreasing and increasing vegetation productivity trends resulted on commercial land in 26,263 ha exposed to decreasing trends and 8669 ha exposed to increasing trends. On communal lands, 9131 ha showed a decreasing trend while 28,968 ha of the area experienced increasing trends based on the EVI trend analysis. Grasslands indicate significant decreasing trends on 215,019 ha and on 75,881 ha significant increasing trends. Grasslands cover large areas in Eastern Cape and are important for livestock keeping for both commercial and communal farmers. Cropland information was distinguished by land tenure, whereas grasslands were indicated as one large class and therefore did not allow distinction of land tenure.
Looking further into vegetation productivity among the different land management systems and within communal and commercial croplands from 2000 to 2016, the graph in Figure 3 points out total vegetation productivity represented by annual ∑EVI for each year.
Drops in total annual vegetation productivity indicate potential drought years as in 2003/2004, 2008/2009, 2009/2010 and 2015/2016, representing the last year of the observation, but also an exceptional drought year. As expected, total productivity is highest in commercial croplands, moderate in communal cropland and lowest in grassland. Drops are most sharp on commercial croplands. Commercial cropland and grasslands further seem to have faster recovery looking into the period 2006/2007 to 2011/2012 where despite drops during 2008/2009 and 2009/2010 ∑EVI values as high as before the droughts can be reached. At the same time, on communal croplands, vegetation productivity did not reach values as high as before drought periods.

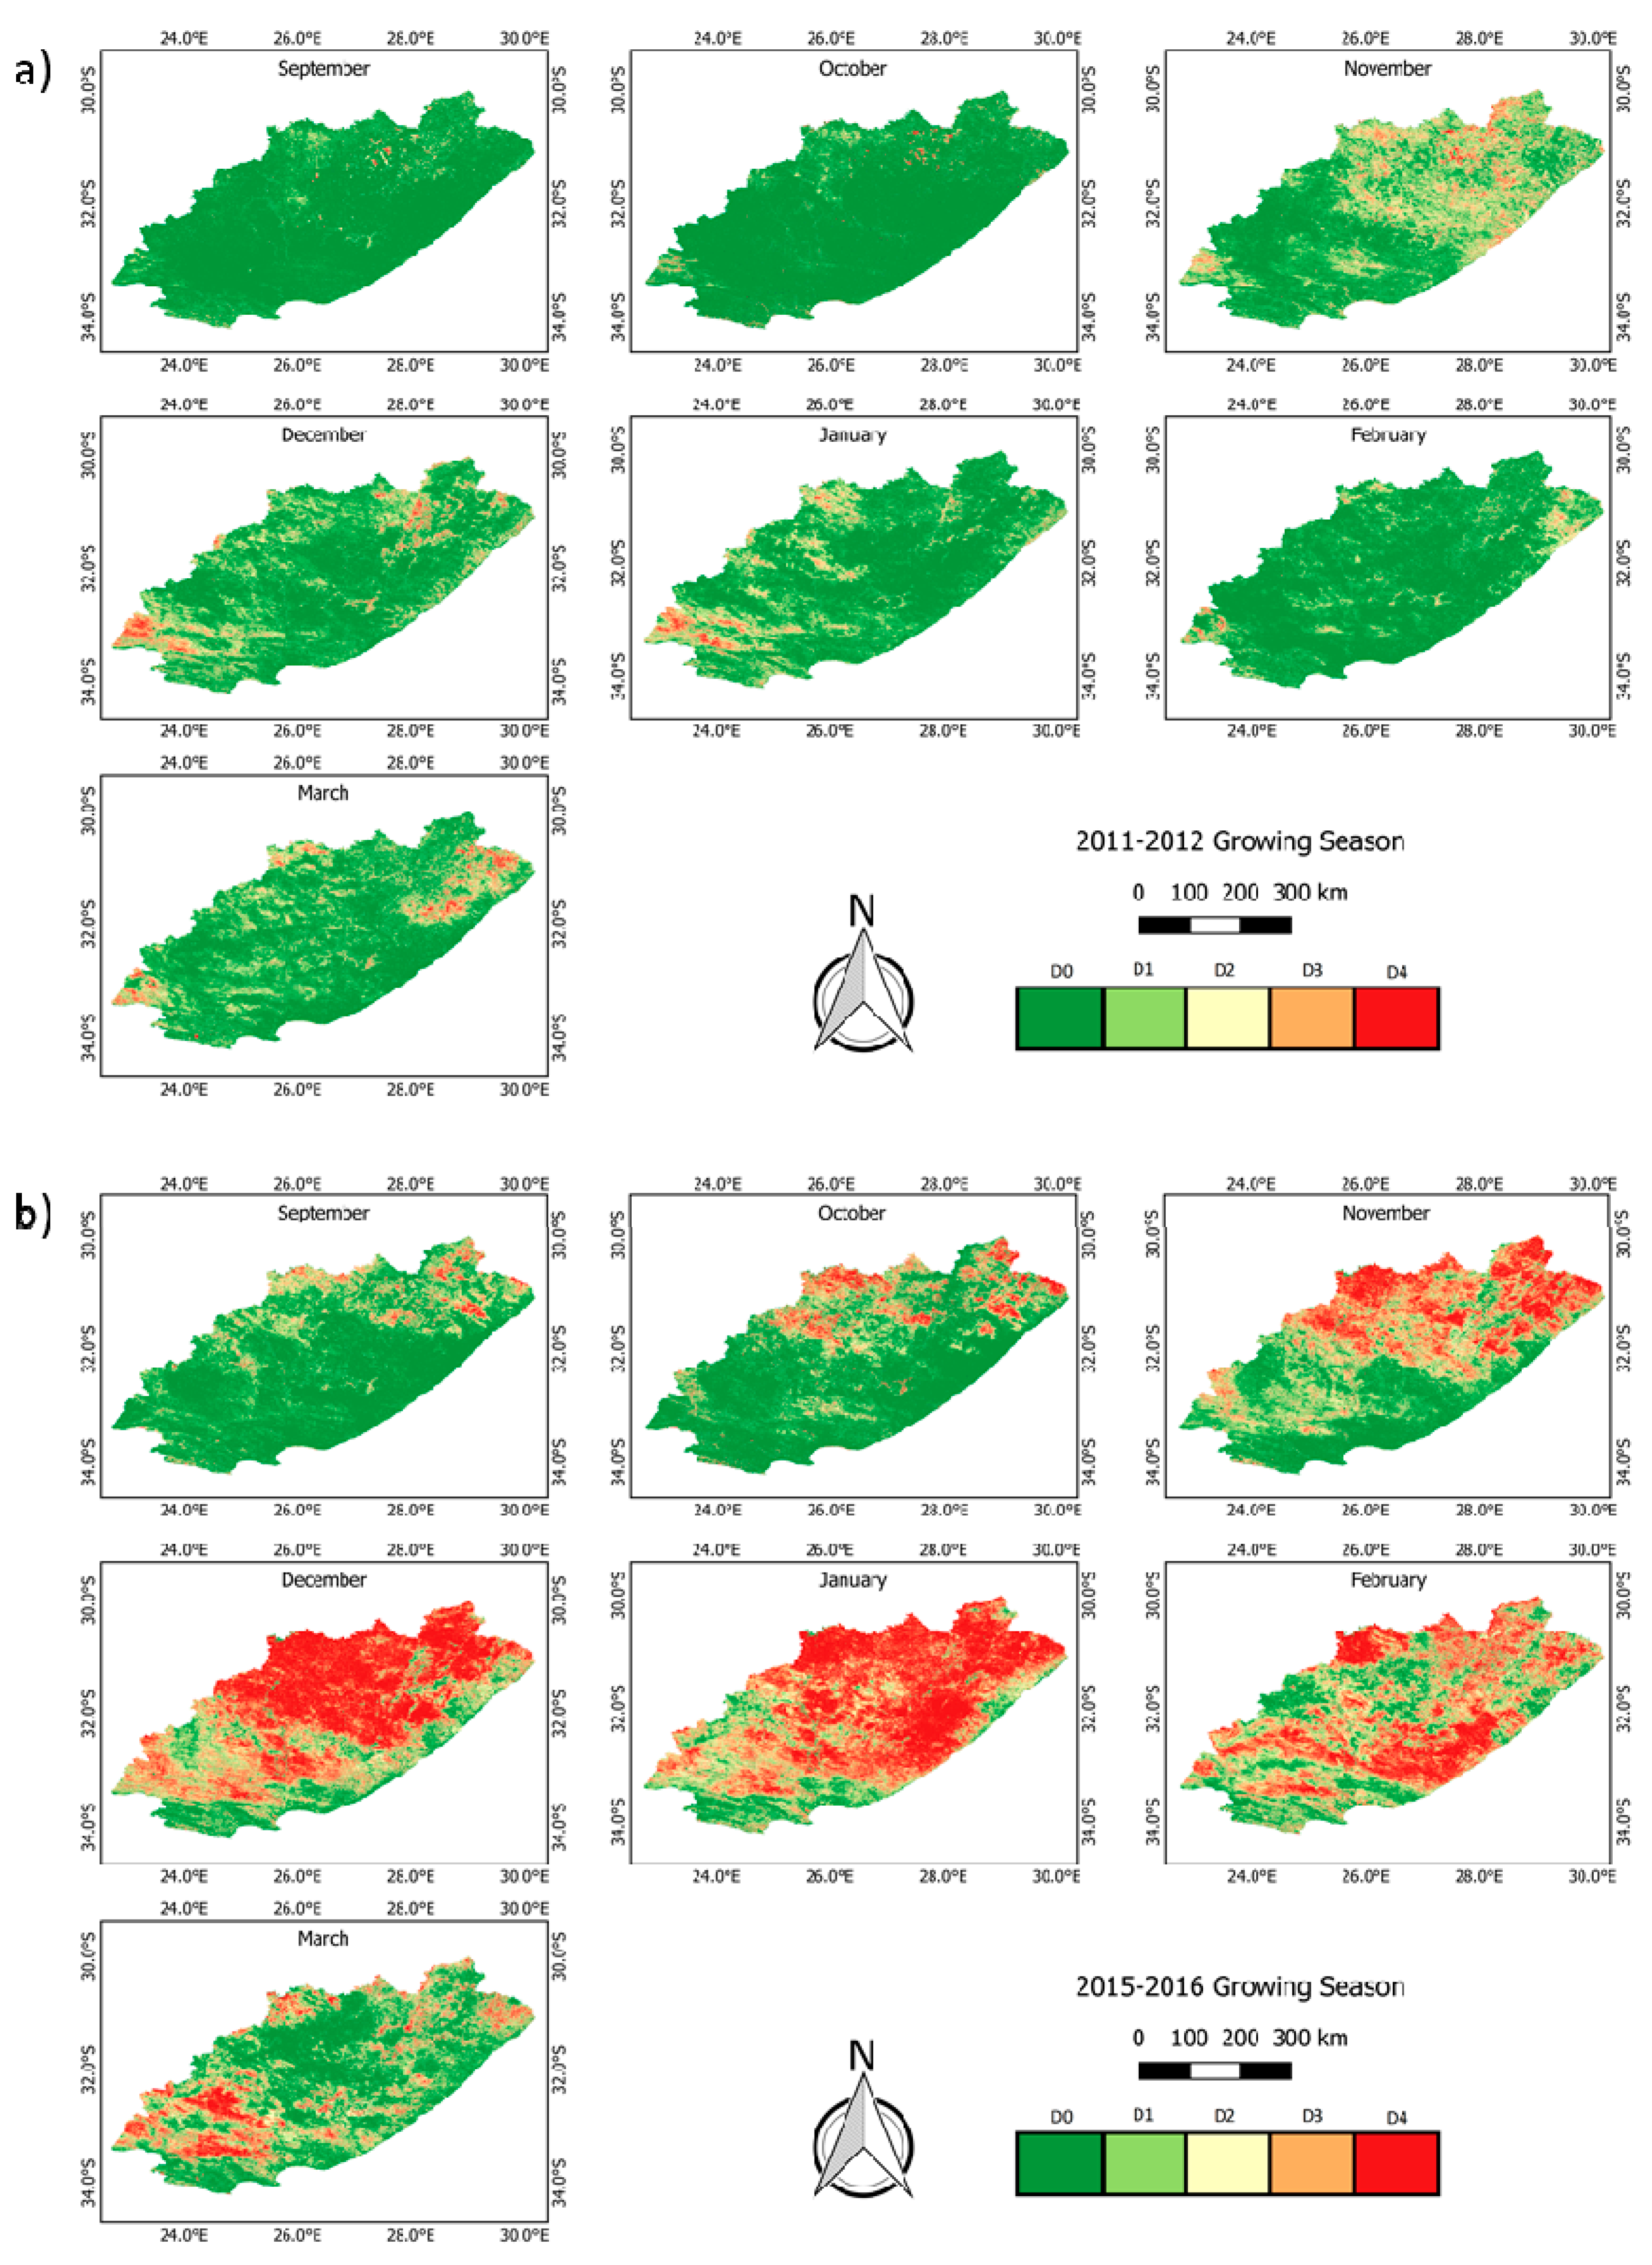
3.2. VCI Development in Eastern Cape during Normal Conditions versus Drought Conditions

Based on EVI time-series analysis and information derived from The International Disaster Database (EM-DAT) [72] we could identify different drought and non-drought years in our study region. Using mean and median VCI as well as the total productivity analysis (see also Figure 3) for each year highlighted drought and non-drought years. As 2015/2016 was known to be a drought year that affected the whole province, we considered this year for further analysis. Additionally, a non-drought year is represented by the growing season of 2011/2012 in this study. Overall, high VCI values throughout the whole province during this growing season together with non-drought conditions based on VCI in the year before and after supported the selection of this season for the non-drought season reference. To gain insights in the vegetation dynamics during normal and drought years, a drought severity classification was conducted for the growing season with monthly classification. The main growing season from October to March was identified as the most important time for farmers in Eastern Cape.
Figure 4a shows the classification of the VCI over the main growing season on a monthly basis referring to the drought severity classification scheme described in Table 1 [64,65,66] over a normal year, i.e., 2011/2012. D0 conditions, indicating no drought, can be found throughout the season over most of the province. Patches in the northeastern and west/southwest regions, which are in general drier compared to the rest of the province with regard to climatic preconditions, show drought conditions even in normal years. With regard to the full season, severe drought conditions cannot be identified over larger areas and over a longer duration of several time steps based on VCI. Figure 4b shows the development of VCI and its drought severity classification during the growing season of a drought year, i.e., 2015/2016. The drought in 2015/2016 was one of the most severe droughts compared to the last decades. We can identify D4 drought conditions throughout the province with only some smaller patterns highlighted along the coastal zone in the southeast. In addition, in the southwestern areas, droughts did not affect the study areas as severe according to the VCI results. The eastern and northeastern part of the province are classified with high drought severity which shows the development of VCI from November to January, where D4 drought conditions are indicated over all months during the growing period. Rainfall in February and March improves the situation lifting some small areas out of D4 drought conditions but they are still occurring in the southwestern part where grassland and low shrubland dominate the land cover.

3.3. Precipitation and Vegetation—How Close Is the Link?

Rainfall is a crucial determinant for crop growth, especially in areas where no irrigation practices are conducted and rainfed agriculture is dominating, which accounts for most parts of South Africa [73]. Detection of different responses to rainfall on grassland and communal and commercial cropland as well as analysis of correlation between rainfall and vegetation productivity and vegetation condition were conducted to detect areas according to their rainfall-vegetation dependency.
We compared rainfall conditions taking into account the total amount of rainfall summarized over a growing season to also include short-term variabilities, with sum EVI over the growing season as well as median VCI values over the growing season of each year. A sufficient amount of rainfall is necessary for plant and thereby crop growth. In the eastern part of the province, where mainly communal cropland is located, higher amounts of rainfall are received during the year, which we could detect by calculating mean annual rainfall for the observation period.
Precipitation trends calculated by linear regression over seasonal and yearly precipitation rates indicated wetter conditions in the southwestern part where increasing vegetation productivity could also be detected, as well as in the western areas where especially decreasing productivity trends were found.
Figure 5 shows correlation coefficients of VCI and total precipitation over the growing seasons over 16 years. Pearson correlation was run over each growing season per year over the whole observation period referring to 16 individual observation points for each, VCI and precipitation. We observed that in those areas where mainly significant positive and negative vegetation productivity trends were observed, precipitation amounts did not play a key role for vegetation growth (Figure 5). Additionally, correlations with sum EVI over the growing season and rainfall reported the same findings. This was also true for regions outside of our focus land management systems in this study.
To understand the relation between vegetation dynamics and rainfall within a growing season under drought and non-drought conditions in different land management systems, the different vegetation indices where compared to rainfall during a non-drought year (2011/2012) and a drought year (2015/2016).
In grasslands, the main active vegetation dynamics can be observed between September and March, which closely corresponds to the precipitation rates which increase in October and drop in April (see also Figure 6). Figure 6a–c shows the year 2011/2012 with normal conditions, Figure 6d–f shows vegetation and precipitation dynamics during a drought year. The additional month April was included here to show the end of the growing season. EVI does not differ much and only shows slightly lower EVI values in a drought year during the growing season compared to a normal year (Figure 6a,d). Grasslands however are very dynamic but only in small ranges throughout the year and react fast to precipitation. VCI differs clearly looking at vegetation condition during a normal year (60–100) and those in a drought year with drops below 40 already in October. However, vegetation response during increasing precipitation rates is also obvious comparing VCI values in Figure 6b,e with precipitation rates in Figure 6c,f. The delayed onset of rainfall in 2015/2016, which was the origin of the drought, is also seen.
Figure 7 shows vegetation and precipitation dynamics for communal (yellow) and commercial (orange) croplands also during the non-drought year 2011/2012 (Figure 7a–c) and the severe drought year 2015/2016 (Figure 7d,e). Total vegetation productivity measured with EVI (Figure 7a,d) again shows only slightly lower values during a drought year compared to a normal year. As already observed before, EVI in general is lower in communal croplands than in commercial croplands. Again, VCI provides a different picture. During a normal year (Figure 7b), VCI values are slightly lower for communal cropland but values do not drop below a VCI of 30, only shortly below 40 in November 2011 (Figure 7b), indicating only slight drought conditions. In 2015/2016, VCI values drop significantly during December and January (Figure 7e). Here, also VCI values in commercial croplands were in general higher than those of communal croplands and additionally recovered faster after a severe drop in December compared to communal croplands which is not always the case during a normal year (Figure 7b). On communal croplands, the increase of VCI in 2015/2016 is much slower until March, after the drop in December/January. In 2011/2012, high amounts of rainfall were received in the eastern part of the province, where mostly communal croplands are located, while areas where commercial croplands are dominant received much lower rainfall at that time. This is in line with the rainfall gradient from East to West. Nevertheless, even though the amount of precipitation is higher on communal croplands (Figure 7c,f), VCI values and also vegetation productivity, here represented by EVI, do not respond accordingly. Comparing precipitation rates with EVI and VCI also shows higher amounts of rainfall on communal croplands but lower vegetation productivity than on commercial lands.

4. Discussion

According to the literature, in South Africa, land degradation is predominantly linked to communal land while commercial land represents the more stable areas [28,74]. Within this study, different land management systems, focusing on grasslands and croplands as the main important land use for the rural population, were analyzed to better understand the vegetation response to drought in different land management systems and for cropland under different land tenure. Land cover and land use information was derived from the national land cover map which represents the most recent land cover information and is nationally accepted. For the here presented analysis, land tenure information was crucial to spatially delineate the two categories: communal and commercial croplands as well as additionally grasslands. Croplands belonging to communal and commercial management systems so far have not changed their tenure system in a large manner.
Further, the interplay of rainfall to vegetation productivity and condition was underlined to distinguish areas where rainfall plays the dependent role for vegetation growth and condition from areas where other factors than rainfall seem to have much more impact.
With time series trend analysis of EVI using the sum over a full southern year (July to June the following year), significant decreasing vegetation productivity was predominantly found in the western areas mainly where grass and low shrubland cover the land [71]. The western part of the province in general receives lower rainfalls while the eastern part and the coastline in the East tend to receive more. Significant increasing trends of vegetation productivity were detected along the coastline and in smaller patterns in the Southwest. Increasing vegetation productivity can also relate to bush encroachment which characterizes the invasion of alien species and especially the expansion of woody vegetation in areas where it is not naturally occurring [75,76]. This invasive vegetation suppresses palatable plant species and grasslands [76,77,78]. Bush encroachment is an ongoing problem in South Arica and in Eastern Cape Province [79,80] and could be one possible explanation for the depicted increasing trends mainly in communal land, where bush encroachment is an indicator of prevalent land degradation. According to studies carried out in the region, the problem of bush encroachment is present in some of the areas along the coastal zone [80,81]. In addition, Skowny et al. [82] showed that areas receiving more than 500 mm MAP show higher rates of woodland expansion. Calculation of MAP for Eastern Cape highlighted the eastern part of the province receiving >500 mm MAP and thereby being prone to bush encroachment according to the findings of Skowny et al. [82]. To mask out these areas, spatial information on invasive species or high resolution data in combination with training samples from the field would be necessary.
Total vegetation productivity was calculated by the sum of EVI over a full southern year for insights in the full productivity in each land tenure class and also including information on, e.g., grassland productivity over the full year. Looking into total annual vegetation productivity, values on communal cropland are always below those of commercial cropland which can be related to management strategies. An aspect of high importance in Eastern Cape is livestock where 65% of agriculture in the province comes from [44]. In addition, grasslands belong to communal and commercial land but this distinction could not be spatially included in the here presented analysis. Grassland productivity is generally lower than those of croplands which could also be visualized in Figure 3. Detecting vegetation productivity over each year could indicate drops that identified drought periods over the last 16 years. These drops could not be detected looking into drought dynamics during the season where EVI shows only slight response.
We compared vegetation dynamics of one normal year (2011/2012) with one exceptional drought year (2015/2016) to identify the distribution of vegetation condition over the region. A drought severity classification thereby helped to classify the individual pixel. During a normal year (2011/2012), VCI values usually stayed above 40. Only small patterns in the western and northeastern part of the province, where in the west low shrubland and in the northeast grassland dominates the land cover, showed lower VCI values even during a normal year. In the western part, significant decreasing vegetation productivity trends could be observed in combination with no to negative correlation with rainfall which explain no or only low impact of rainfall on vegetation growth. The northeastern areas are covered with grasslands which in general show high and fast response to precipitation. As during the indicated month in the drought hazard severity maps (November, Figure 4) rainfall was still low (see also Figure 6b) precipitation can be taken into account as the main driving variable here. All other areas were classified with no drought conditions according to the classification. During the drought year 2015/2016 drought conditions, represented by the highest classification—D4 drought severity—affected the whole province, which was also reported by the farmer on the ground.
As precipitation is the key limitation for plant growth, integration of precipitation data aimed at detecting the link between vegetation productivity, condition and precipitation. A linear trend analysis over the total observation period taking into account the annual sum of a full southern year detected increasing trends in rainfall along the coast which also could explain increasing vegetation productivity here. For detailed analysis of dependencies: (1) correlation between VCI over the growing season and sum rainfall over the growing season; and (2) correlation between total vegetation productivity (sum of EVI) over the growing season and sum rainfall over the growing season were calculated. No and even negative correlations were especially found in those areas where also significant decreasing or increasing vegetation productivity trends were observed. Here, precipitation known as key driver for plant growth was not impacting vegetation condition and productivity. Management strategies could be one possible explanation for these findings, which strengthen the need for an additional socio-economic perspective within the identified regions. Another impact variable taken into account here could be rainfall variability. As here the total amount of precipitation was taken into account over a full growing season, variabilities are rather not included.
A more detailed analysis of VCI, EVI and precipitation development within the different land management systems made the impact of external factors more obvious. Looking into the distribution of VCI and rainfall over a drought versus a normal year showed clear drops in VCI but no strong response of vegetation productivity to rainfall especially on communal croplands, while grasslands were responding accordingly with higher EVI and better VCI after receiving higher rates of precipitation. In addition, commercial croplands showed fast recovery and higher VCI values shortly after severe drought conditions in 2015/2016 in December and January. This could be explained by agricultural and land management practices, such as e.g., irrigation measures, especially on commercial croplands. However, it could also refer to variability of rainfall. While the amount of precipitation is important, so is its distribution. If the total precipitation of a month is received only during a few days, but dry conditions are dominating for the others, results will differ to receiving rainfall throughout the month which secures stable growth of the plants. Nevertheless, the impact of droughts on vegetation productivity cannot be explained solely with biophysical indicators. Vegetation conditions using VCI and even vegetation productivity taking into account EVI do always reflect also management strategies. If irrigation practices are applied during dry conditions, there won´t be a clear response to rainfall as such while on rainfall dependent farmland this plays a more important role. Additionally, also the amount of fertilizer applied to the soil is not possible to detect via remote sensing. We can only assume that commercial farmland is mainly under irrigation schemes and applied fertilizer. In addition, crop rotation from year to year makes relying on VCI difficult, as different crops cultivated over the years might produce different VCI or EVI values. Thus far, a detailed crop map for different times of the observation period is not available.
This study focused on the characterization of the drought hazard severity in relation to vegetation productivity change based on rainfall and vegetation characteristics in grasslands and communal and commercial cropland of the Eastern Cape Province. However, the real impact of drought conditions on the farmers and their livelihoods is highly dependent on the susceptibility of farmers, their agricultural land management practices and the environmental conditions at their farmland, such as for example soil water availability and soil fertility. In addition to this, the impact of a drought might vary strongly dependent on capacities of farmers and their farmland to cope with the drought hazard conditions. Commercial farms might have more capacities to irrigate their cropland under drought conditions or might have alternative capital to cope with the loss of the harvest, whereas a subsistence farmer often depends exclusively on the production capacity of his land [83]. The integration of socio-economic data will thereby be essential to define the actual impact of a drought on a particular farming system and identify sustainable land management practices and should be part of ongoing research.
Our observation period ends in the growing season 2015/2016 which was a severe drought year. Long-term effects of a drought with this intensity might still be visible in the coming years which would have to be confirmed by extending the observation period of analysis. We should also consider that the total observation period for this study contains 16 years only. This is rather a short time period for the detection of long-term processes, especially with regard to land degradation. However, it gave good insight into current and ongoing conditions in the study area, especially after multiple drought events, and identified regions where further research, integrating socio-economic data, is needed.

5. Conclusions

Total vegetation productivity based on annual ∑EVI detected drought events after analysis of the full season. However, EVI was rather weak for monitoring vegetation response to drought over the growing season. The VCI, representing pixel-based normalization of vegetation condition for the relative assessment of changes, detected drought conditions in a dynamic manner for each time step and therefore serves as an index to monitor the seasonal dynamics of drought conditions. Significant vegetation productivity trends, often used for land degradation assessment, indicated patterns in the western and southeastern area of the province. Significant increasing vegetation trends observed in communal croplands along the coast in the Southeast could indicate one form of land degradation known as bush encroachment, which highlights the importance of this analysis. The comparison of vegetation-precipitation dependencies in a normal year, i.e., 2011/2012, with those conditions during a drought year, i.e., 2015/2016, shows that grassland vegetation generally responds to the amount of precipitation while croplands showed no clear response. Although communal cropland receives higher precipitation rates linked to climatic preconditions, vegetation productivity and condition do not respond accordingly. Communal cropland also showed low recovery of vegetation after drought events compared to those in commercial croplands. As grasslands are of high importance for agricultural productivity and livestock keeping, information on land tenure rights would be important to understand individual dynamics in grasslands as well as further identify areas with possible sustainable land management practices. As areas experiencing high vegetation dynamics with regard to vegetation productivity change and drought hazard severity have often no direct link to precipitation as the main limiting factor for vegetation development, these findings strengthen the need for additional assessment on the ground. Besides management strategies such as fertilizer application and irrigation practices, socio-economic dynamics among farm households within the different land management systems might play key roles.

Acknowledgments

This study was done in the framework of the project “Earth observation-based information products for drought risk on a national level” (EvIDENz) funded by the Federal Ministry for Economic Affairs and Energy (BMWi; grant No. 50EE1541). Local insights from our partners at the University of the Free State on Eastern Cape Province which helped to get more insights for the here presented analysis is acknowledged. Thanks also go to Guido Lüchters and Frederik Graw for feedback on statistical analysis in this paper and to Zita Sebesvari for her review on this paper.

Author Contributions

Valerie Graw and Olena Dubovyk conceived and designed the study; Valerie Graw and Gohar Ghazaryan performed the experiments; Valerie Graw and Gohar Ghazaryan analyzed the data; Ruben Piroska, Andoni Delgado-Gómez, Ayman Abdel-Hamid and Karen Dall contributed reagents/materials/analysis tools; Valerie Graw wrote the paper; Yvonne Walz revised the paper and adjusted the framing of the study; Andries Jordaan contributed local field knowledge and revised the paper; and Joachim Post and Jörg Szarzynski contributed with discussions on dynamics and impact of droughts in Eastern Cape and South Africa.

Conflicts of Interest

The authors declare no conflict of interest.

References

  1. Wilhite, D.A. Chapter 1 Drought as a Natural Hazard: Concepts and Definitions. In Drought: A Global Assessment; Wilhite, D.A., Ed.; Routledge: London, UK, 2000; pp. 3–18. [Google Scholar]
  2. Toulmin, C. Drought and the farming sector: Loss of farm animals and post-drought rehabilitation. Dev. Policy Rev. 1987, 5, 125–148. [Google Scholar] [CrossRef]
  3. Sivakumar, M.V.K. Agricultural Drought—WMO Perspectives. In Agricultural Drought Indices, Proceedings of the Expert Meeting, Murcia, Spain, 2–4 June 2010; Sivakumar, M.V.K., Motha, R.P., Wilhite, D.A., Wood, D.A., Eds.; World Meteorological Organization: Geneva, Switzerland, 2011; pp. 22–34. [Google Scholar]
  4. Pachauri, R.K.; Allen, M.R.; Barros, V.R.; Broome, J.; Cramer, W.; Christ, R.; Church, J.A.; Clarke, L.; Dahe, Q.; Dasgupta, P.; et al. Climate Change 2014: Synthesis Report; Contribution of Working Groups I, II and III to the Fifth Assessment Report of the Intergovernmental Panel on Climate Change; Pachauri, R.K., Meyer, L., Eds.; IPCC: Geneva, Switzerland, 2014. [Google Scholar]
  5. Henricksen, B.L.; Durkin, J.W. Growing period and drought early warning in Africa using satellite data. Int. J. Remote Sens. 1986, 7, 1583–1608. [Google Scholar] [CrossRef]
  6. Rojas, O.; Vrieling, A.; Rembold, F. Assessing drought probability for agricultural areas in Africa with coarse resolution remote sensing imagery. Remote Sens. Environ. 2011, 115, 343–352. [Google Scholar] [CrossRef]
  7. Moacelli, G. WMO Drought Assessment and Forecasting. Weather, Climate and Water; Draft Report 2005, WGH/RA VI/Doc.8 (26.IV.2005); World Meteorological Organization: Pruhonice, Czec Republic, 2005; Available online: www.wmo.int/pages/prog/hwrp/documents/regions/DOC8-pdf (accessed on 27 July 2017).
  8. Wilhite, D.A.; Glantz, M.H. Understanding the drought phenomenon: The role of definitions. Water Int. 1985, 10, 111–120. [Google Scholar] [CrossRef]
  9. Keyantash, J.; Dracup, J.A. The quantification of drought: An evaluation of drought indices. Bull. Am. Meteorol. Soc. 2002, 83, 1167–1180. [Google Scholar]
  10. McKee, T.B.; Doesken, N.J.; Kleist, J. The Relationship of Drought Frequency and Duration to Time Scales. In Proceedings of the 8th Conference on Applied Climatology, Anaheim, CA, USA, 17–22 January 1993. [Google Scholar]
  11. McKee, T.B.; Doesken, N.J.; Kleist, J. Drought Monitoring with Multiple Time Scales. In Proceedings of the 9th Conference on Applied Climatology, Dallas, TX, USA, 15–20 January 1995; pp. 233–236. [Google Scholar]
  12. World Meteorological Organization (WMO). Standardized Precipitation Index User Guide; WMO: Geneva, Switzerland, 2012. [Google Scholar]
  13. Hayes, M.J.; Svoboda, M.D.; Wilhite, D.A.; Vanyarkho, O.V. Monitoring the 1996 drought using the standardized precipitation index. Bull. Am. Meteorol. Soc. 1999, 80, 429–438. [Google Scholar] [CrossRef]
  14. Rhee, J.; Im, J.; Carbone, G.J. Monitoring agricultural drought for arid and humid regions using multi-sensor remote sensing data. Remote Sens. Environ. 2010, 114, 2875–2887. [Google Scholar] [CrossRef]
  15. Son, N.T.; Chen, C.F.; Chen, C.R.; Chang, L.Y.; Minh, V.Q. Monitoring agricultural drought in the Lower Mekong Basin using MODIS NDVI and land surface temperature data. Int. J. Appl. Earth Obs. 2012, 18, 417–427. [Google Scholar] [CrossRef]
  16. Vicente-Serrano, S.M.; Beguería, S.; Gimeno, L.; Eklundh, L.; Giuliani, G.; Weston, D.; El Kenawy, A.; López-Moreno, J.I.; Nieto, R.; Ayenew, T.; et al. Challenges for drought mitigation in Africa: The potential use of geospatial data and drought information systems. Appl. Geogr. 2012, 34, 471–486. [Google Scholar] [CrossRef] [Green Version]
  17. Skakun, S.; Kussul, N.; Kussul, O.; Shelestov, A. Quantitative estimation of drought risk in Ukraine using satellite data. In Proceedings of the IEEE Geoscience and Remote Sensing Symposium, Quebec, QC, Canada, 13–18 July 2014; pp. 5091–5094. [Google Scholar]
  18. World Meteorological Organization (WMO); Global Water Partnership (GWP). Handbook of Drought Indicators and Indices; Svoboda, M., Fuchs, B.Z., Eds.; Integrated Drought Management Tools and Guidelines SERIES 2; Integrated Drought Management Programme (IDMP): Geneva, Switzerland, 2016; Available online: www.droughtmanagement.info/literature/GWP_Handbook_of_Drought_Indicators_and_Indices_2016.pdf (accessed on 27 July 2017).
  19. Unganai, L.S.; Kogan, F.N. Drought monitoring and corn yield estimation in Southern Africa from AVHRR data. Remote Sens. Environ. 1998, 63, 219–232. [Google Scholar] [CrossRef]
  20. Quiring, S.M.; Ganesh, S. Evaluating the utility of the vegetation condition index (VCI) for monitoring meteorological drought in Texas. Agric. For. Meteorol. 2010, 150, 330–339. [Google Scholar] [CrossRef]
  21. Kogan, F.N. Remote sensing of weather impacts on vegetation in non-homogeneous areas. Int. J. Remote Sens. 1990, 11, 1405–1419. [Google Scholar] [CrossRef]
  22. Rouault, M.; Richard, Y. Intensity and spatial extension of drought in South Africa at different time scales. Water SA 2003, 29, 489–500. [Google Scholar] [CrossRef]
  23. Holzman, M.E.; Rivas, R.E. Early Maize Yield Forecasting From Remotely Sensed Temperature/Vegetation Index Measurements. IEEE J. Sel. Top. Appl. Earth Obs. Remote Sens. 2016, 9, 507–519. [Google Scholar] [CrossRef]
  24. Gu, Y.; Brown, J.F.; Verdin, J.P.; Wardlow, B. A five-year analysis of MODIS NDVI and NDWI for grassland drought assessment over the Central Great Plains of the United States. Geophys. Res. Lett. 2007, 34. [Google Scholar] [CrossRef]
  25. Zribi, M.; Dridi, G.; Amri, R.; Lili-Chabaane, Z. Analysis of the effect of drought on vegetation cover in a Mediterranean Region through the use of SPOT-VGT and TERRA-MODIS long time series. Remote Sens. 2016, 8, 992. [Google Scholar] [CrossRef]
  26. Parplies, A.; Dubovyk, O.; Tewes, A.; Mund, J.-P.; Schellberg, J. Phenomapping of rangelands in South Africa using time series of RapidEye data. Int. J. Appl. Earth Obs. 2016, 53, 90–102. [Google Scholar] [CrossRef]
  27. Oomen, B. Chiefs in South Africa: Law, Power & Culture in the Post-Apartheid Era; James Currey: Melton, UK, 2005. [Google Scholar]
  28. Hoffman, M.T.; Todd, S. A national review of land degradation in South Africa: The influence of biophysical and socio-economic factors. J. South. Afr. Stud. 2000, 26, 743–758. [Google Scholar] [CrossRef]
  29. Dubovyk, O.; Landmann, T.; Erasmus, B.F.N.; Tewes, A.; Schellberg, J. Monitoring vegetation dynamics with medium resolution Modis-Evi time series at Sub-Regional Scale in Southern Africa. Int. J. Appl. Earth Obs. 2015, 38, 175–183. [Google Scholar] [CrossRef]
  30. Ngaka, M.J. Drought preparedness, impact and response: A case of the Eastern Cape and Free State provinces of South Africa. Jamba J. Disaster Risk Stud. 2012, 4, 1–10. [Google Scholar] [CrossRef]
  31. Conacher, A.J.; Sala, M. (Eds.) Land Degradation in Mediterranean Environments of the World: Nature and Extent, Causes and Solutions; John Wiley and Sons Ltd: Hoboken, NJ, USA, 1998. [Google Scholar]
  32. Holden, S.; Shiferaw, B. Land degradation, drought and food security in a less-favoured area in the Ethiopian Highlands: A bio-economic model with market imperfections. Agric. Econ. 2004, 30, 31–49. [Google Scholar] [CrossRef]
  33. Dregne, H.E. Land degradation in the drylands. Arid Land Res. Manag. 2002, 16, 99–132. [Google Scholar] [CrossRef]
  34. Ravi, S.; Breshears, D.D.; Huxman, T.E.; D’Odorico, P. Land degradation in drylands: Interactions among hydrologic–aeolian erosion and vegetation dynamics. Geomorphology 2010, 116, 236–245. [Google Scholar] [CrossRef]
  35. Blaikie, P.; Brookfield, H. Land Degradation and Society; Routledge: New York, NY, USA, 2015. [Google Scholar]
  36. Sonneveld, B.; Keyzer, M.A.; Ndiaye, D. Quantifying the impact of land degradation on crop production: The case of Senegal. Solid Earth 2015, 7, 93–103. [Google Scholar] [CrossRef]
  37. Hoare, D.B.; Bredenkamp, G.J. Grassland communities of the Amatola/Winterberg Mountain Region of the Eastern Cape, South Africa. S. Afr. J. Bot. 1999, 65, 75–82. [Google Scholar] [CrossRef]
  38. Hoare, D.B.; Bredenkamp, G.J. Syntaxonomy and environmental gradients of the grasslands of the Stormberg/Drakensberg Mountain Region of the Eastern Cape, South Africa. S. Afr. J. Bot. 2001, 67, 595–608. [Google Scholar] [CrossRef]
  39. Kane, R.P. Periodicities, ENSO effects and trends of some South African rainfall series: An update. S. Afr. J. Sci. 2009, 105. [Google Scholar] [CrossRef]
  40. Malherbe, J.; Dieppois, B.; Maluleke, P.; Staden, M.V.; Pillay, D.L. South African droughts and decadal variability. Nat. Hazards 2016, 80, 657–681. [Google Scholar] [CrossRef]
  41. South African Weather Service (SAWS). Available online: http://www.weathersa.co.za/ (accessed on 27 July 2017).
  42. Food and Agriculture Organization of the United Nations (FAO). El Niño Set to Have a Devastating Impact on Southern Africa’s Harvests and Food Security 2016. Available online: http://www.fao.org/news/story/en/item/382932/icode/ (accessed on 27 July 2017).
  43. Goldblatt, A. Agriculture: Facts & Trends. 2004. Available online: http://awsassets.wwf.org.za/downloads/facts_brochure_mockup_04_b.pdf (accessed on 27 July 2017).
  44. Statistics South Africa (StatSA) Census 2011. Available online: http://www.statssa.gov.za (accessed on 15 August 2017).
  45. DAFF Maps and Graphics: Environmental Geographic Information Systems (EGIS) 2016. Available online: https://egis.environment.gov.za (accessed on 27 July 2017).
  46. Stats SA Library Cataloguing-in-Publication (CIP). Data Census 2011 Provincial Profile: Eastern Cape; Statistics South Africa: Pretoria, South Africa, 2014; Appendix pp. 46–49.
  47. Ntsebeza, L.; Hall, R. The Land Question in South Africa: The Challenge of Transformation and Redistribution; HSRC Press: Pretoria, South Africa, 2007. [Google Scholar]
  48. Helldén, U.; Tottrup, C. Regional desertification: A global synthesis. Glob. Planet. Chang. 2008, 64, 169–176. [Google Scholar] [CrossRef]
  49. Nkonya, E. The Economics of Land Degradation: Toward an Integrated Global Assessment; Peter Lang: Frankfurt, Germany, 2011. [Google Scholar]
  50. De Jong, R.; de Bruin, S.; Schaepman, M.; Dent, D. Quantitative mapping of global land degradation using earth observations. Int. J. Remote Sens. 2011, 32, 6823–6853. [Google Scholar] [CrossRef] [Green Version]
  51. Huete, A.; Didan, K.; Miura, T.; Rodriguez, E.P.; Gao, X.; Ferreira, L.G. Overview of the radiometric and biophysical performance of the MODIS vegetation indices. Remote Sens. Environ. 2002, 83, 195–213. [Google Scholar] [CrossRef]
  52. Pettorelli, N. Normalized Difference Vegetation Index; Oxford University Press: Oxford, UK, 2013. [Google Scholar]
  53. Jiang, Z.; Huete, A.R.; Didan, K.; Miura, T. Development of a two-band enhanced vegetation index without a blue band. Remote Sens. Environ. 2008, 112, 3833–3845. [Google Scholar] [CrossRef]
  54. Vermote, E.F.; El Saleous, N.Z.; Justice, C.O. Atmospheric correction of modis data in the visible to middle infrared: First results. Remote Sens. Environ. 2002, 83, 97–111. [Google Scholar] [CrossRef]
  55. NASA EOSDIS Land Processes DAAC MODIS Reprojection Tool. Available online: https://lpdaac.usgs.gov/tools/modis_reprojection_tool (accessed on 21 March 2017).
  56. Reynolds, J.F.; Smith, D.M.S.; Lambin, E.F.; Turner, B.L.; Mortimore, M.; Batterbury, S.P.J.; Downing, T.E.; Dowlatabadi, H.; Fernández, R.J.; Herrick, J.E.; et al. Global desertification: Building a science for dryland development. Science 2007, 316, 847–851. [Google Scholar] [CrossRef] [PubMed]
  57. Symeonakis, E.; Drake, N. Monitoring desertification and land degradation over Sub-Saharan Africa. Int. J. Remote Sens. 2004, 25, 573–592. [Google Scholar] [CrossRef]
  58. Bai, Z.G.; Dent, D.L.; Olsson, L.; Schaepman, M.E. Proxy global assessment of land degradation. Soil Use Manag. 2008, 24, 223–234. [Google Scholar] [CrossRef]
  59. Kendall, M.G. A new measure of rank correlation. Biometrika 1938, 30, 81–93. [Google Scholar] [CrossRef]
  60. Mann, H.B. Nonparametric tests against trend. Econometrica 1945, 13, 245–259. [Google Scholar] [CrossRef]
  61. Neeti, N.; Eastman, J.R. A contextual Mann-Kendall approach for the assessment of trend significance in image time series. Trans. GIS 2011, 15, 599–611. [Google Scholar] [CrossRef]
  62. Tüshaus, J.; Dubovyk, O.; Khamzina, A.; Menz, G. Comparison of medium spatial resolution ENVISAT-MERIS and Terra-MODIS time series for vegetation decline analysis: a case study in Central Asia. Remote Sens. 2014, 6, 5238–5256. [Google Scholar] [CrossRef]
  63. Kogan, F.N. Application of vegetation index and brightness temperature for drought detection. Adv. Space Res. 1995, 15, 91–100. [Google Scholar] [CrossRef]
  64. Bhuiyan, C.; Singh, R.P.; Kogan, F.N. Monitoring drought dynamics in the Aravalli Region (India) using different indices based on ground and remote sensing data. Int. J. Appl. Earth Obs. 2006, 8, 289–302. [Google Scholar] [CrossRef]
  65. Zhang, A.; Jia, G. Monitoring meteorological drought in semiarid regions using multi-sensor microwave remote sensing data. Remote Sens. Environ. 2013, 134, 12–23. [Google Scholar] [CrossRef]
  66. Zambrano, F.; Lillo-Saavedra, M.; Verbist, K.; Lagos, O. Sixteen years of agricultural drought assessment of the biobío region in Chile using a 250 m resolution vegetation condition index (VCI). Remote Sens. 2016, 8, 530. [Google Scholar] [CrossRef]
  67. Nicholson, S.E.; Davenport, M.L.; Malo, A.R. A comparison of the vegetation response to rainfall in the Sahel and East Africa, using normalized difference vegetation index from Noaa Avhrr. Clim. Chang. 1990, 17, 209–241. [Google Scholar] [CrossRef]
  68. Davenport, M.L.; Nicholson, S.E. On the relation between rainfall and the normalized difference vegetation index for diverse vegetation types in East Africa. Int. J. Remote Sens. 1993, 14, 2369–2389. [Google Scholar] [CrossRef]
  69. Herrmann, S.M.; Anyamba, A.; Tucker, C.J. Recent trends in vegetation dynamics in the African Sahel and their relationship to climate. Glob. Environ. Chang. 2005, 15, 394–404. [Google Scholar] [CrossRef]
  70. Funk, C.; Peterson, P.; Landsfeld, M.; Pedreros, D.; Verdin, J.; Shukla, S.; Husak, G.; Rowland, J.; Harrison, L.; Hoell, A.; et al. The climate hazards infrared precipitation with stations—A new environmental record for monitoring extremes. Sci. Data 2015, 2, 150066. [Google Scholar] [CrossRef] [PubMed]
  71. GEOTERRAIMAGE 2013–2014 South African National Land-Cover Dataset. Data User Report and MetaData 2015. Available online: https://www.geoterraimage.com/uploads/GTI%20201314%20SA%20LANDCOVER%20REPORT%20-%20CONTENTS%20vs%2005%20DEA%20OPEN%20ACCESS%20vs2b.pdf (accessed on 27 July 2017).
  72. Guha-Sapir, D. EM-DAT: The Emergency Events Database. Available online: www.em-dat.be (accessed on 26 July 2017).
  73. Hardy, M.; Dziba, L.; Kilian, W.; Tolmay, J. Rainfed farming systems in South Africa. In Rainfed Farming Systems; Tow, P., Cooper, I., Partridge, I., Birch, C., Eds.; Springer: Dordrecht, The Netherlands, 2011; pp. 395–432. [Google Scholar]
  74. Meadows, M.E.; Hoffman, M.T. The nature, extent and causes of land degradation in South Africa: Legacy of the past, lessons for the future? Area 2002, 34, 428–437. [Google Scholar] [CrossRef]
  75. Ward, D. Do we understand the causes of bush encroachment in African savannas? Afr. J. Range Forage Sci. 2005, 22, 101–105. [Google Scholar] [CrossRef]
  76. Graw, V.; Oldenburg, C.; Dubovyk, O. Bush Encroachment Mapping for Africa: Multi-Scale Analysis with Remote Sensing and GIS; Social Science Research Network: Rochester, NY, USA, 2016. [Google Scholar]
  77. Saha, M.V.; Scanlon, T.M.; D’Odorico, P. Examining the linkage between shrub encroachment and recent greening in water-limited Southern Africa. Ecosphere 2015, 6, 1–16. [Google Scholar] [CrossRef]
  78. Mitchard, E.T.A.; Flintrop, C.M. Woody encroachment and forest degradation in Sub-Saharan Africa’s woodlands and savannas 1982–2006. Philos. Trans. R. Soc. B 2013, 368, 20120406. [Google Scholar] [CrossRef] [PubMed] [Green Version]
  79. Meissner, H.H.; Scholtz, M.M.; Palmer, A.R. Sustainability of the South African livestock sector towards 2050 Part 1: Worth and impact of the sector. S. Afr. J. Anim. Sci. 2013, 43, 282–297. [Google Scholar] [CrossRef]
  80. O’Connor, T.G.; Crow, V.R.T. Rate and pattern of bush encroachment in Eastern Cape savanna and grassland. Afr. J. Range Forage Sci. 1999, 16, 26–31. [Google Scholar] [CrossRef]
  81. Wigley, B.J.; Bond, W.J.; Hoffman, M.T. Bush encroachment under three contrasting land-use practices in a mesic South African savanna. Afr. J. Ecol. 2009, 47, 62–70. [Google Scholar] [CrossRef]
  82. Skowno, A.L.; Thompson, M.W.; Hiestermann, J.; Ripley, B.; West, A.G.; Bond, W.J. Woodland expansion in South African grassy biomes based on satellite observations (1990–2013): General Patterns and Potential Drivers. Glob. Chang. Biol. 2017, 23, 2358–2369. [Google Scholar] [CrossRef] [PubMed]
  83. Jordaan, A.J.; Sakulski, D.M.; Muyambo, F.; Shwababa, S.; Mdungela, N.; Phatudi-Mphahlele, B.; Mashimbye, C.; Mlambo, D.; Fadeyi, O.; Miya, T.; et al. Vulnerability, Adaptation to and Coping with Drought: The Case of Commercial and Subsistence Rain Fed Farming in the Eastern Cape. 2017. Available online: http://dimtecrisk.ufs.ac.za/wrc_ec/report/2_report.pdf (accessed on 19 September 2017).
Figure 1. Study Area with land tenure systems. Information on land tenure was obtained from the National Land Cover, Data Source: 72 Class GeoTerraImage (GTI) South African National Land Cover Dataset (2013/2014) produced by GEOTERRAIMAGE [45].
Sustainability 09 01728 g001
Figure 2. Significant decreasing and increasing vegetation productivity trends in Eastern Cape based on the time series trend analysis of Sum Enhanced Vegetation Index (∑EVI) over a full southern year in the observation period of 2000–2016.
Sustainability 09 01728 g002
Figure 3. ∑EVI development over the full southern year (July–June) during 2000–2016 on communal (dashed line) and commercial (pointed line) croplands and grasslands (grey line).
Sustainability 09 01728 g003
Figure 4. VCI Drought Classification over the growing season: during a normal non-drought year 2011/2012 (a), and during a drought year 2015/2016 (b), based on the drought severity classification as stated in Section 3.2.
Sustainability 09 01728 g004
Figure 5. Correlation coefficients of Median VCI and ∑precipitation over the growing seasons within the observation period 2000–2016 in croplands and grasslands resampled to 250 m resolution. The grey background color indicates other land covers than grasslands and croplands.
Sustainability 09 01728 g005
Figure 6. EVI, VCI and precipitation rates over the main growing season in Grasslands during: a normal non-drought year (2011/2012) (ac); and a drought year (2015/2016) (df). The x-axis of (a,b,d,e) indicates Julian days of the respective years.
Sustainability 09 01728 g006
Figure 7. EVI, VCI and precipitation rates over the main growing for communal (yellow) and commercial (orange) cropland during: a normal non-drought year (2011/2012) (ac); and a drought year (2015/2016) (df). The x-axis of (a,b,d,e) indicates Julian days of the respective years.
Sustainability 09 01728 g007
Table 1. Vegetation Condition Index (VCI) values for drought classification.
Drought Hazard Severity ClassesVCI Values
No Drought>40
Mild Drought30–40
Moderate Drought20–30
Severe Drought10–20
Extreme Drought<10

