A New Framework for Understanding Urban Social Vulnerability from a Network Perspective

1
State Key Laboratory of Pollution Control & Resource Re-use, School of the Environment, Nanjing University, Nanjing 210093, China
2
School of Transportation, Southeast University, Nanjing 210018, China
3
School of Government, Center for Risk, Disaster & Crisis Research, Nanjing University, Nanjing 210093, China
*
Authors to whom correspondence should be addressed.
Sustainability 2017, 9(10), 1723; https://doi.org/10.3390/su9101723
Submission received: 17 August 2017
/
Revised: 21 September 2017
/
Accepted: 24 September 2017
/
Published: 26 September 2017
Abstract
:Rapid urbanization in China has strengthened the connection and cooperation among cities and has also led urban residents to be more vulnerable in adverse environmental conditions. Vulnerability research has been an important foundation in urban risk management. To make cities safe and resilient, it is also necessary to integrate the connection among cities into a vulnerability assessment. Therefore, this paper proposed a new conceptual framework for urban social vulnerability assessment based on network theory, where a new dimension of social vulnerability (connectivity) was added into the framework. Using attribute data, the traditional social vulnerability index of a city (SVInode) was calculated via the projection pursuit cluster (PPC) model. With the relational data retrieved from the Baidu search index, a new dimension (connectivity) of social vulnerability (SVIconnectivity) was evaluated. Finally, an integrated social vulnerability index (SVIurban) was measured combined with SVInode and SVIconnectivity. This method was applied in the Yangtze River Delta region of China, where the top three high values of SVInode belonged to the cities of Taizhou (Z), Jiaxing, and Huzhou. The three lowest cities were Hangzhou, Nanjing, and Shanghai. For SVIurban, the social vulnerability of cities in different hierarchies behaved differently. For Hierarchies 2 and 3, when compared to SVInode, the SVIurban was significantly reduced. However, the variation between SVInode and SVIurban in Hierarchy 4 was slight. Furthermore, an increase for the city of Taizhou (J) in its social vulnerability was achieved after connecting to the network. Huzhou, in Hierarchy 5, increased its social vulnerability the most when adding connectivity in the social vulnerability assessment. Based on the results of our case study, a conclusion was drawn that network connectivity had an influence on social vulnerability. However, when connectivity was strong enough, it could help cities to mitigate their traditional social vulnerability, whereas a loose connection in the network aggregated their traditional social vulnerability. Hence, the latter should be emphasized in future urban risk management.
1. Introduction
In 1800, only approximately 2% of the world’s population lived in cities, whereas today, about 54% of the world’s population reside in cities, which is projected to rise to over 67% by 2050 [1,2]. Most of these individuals live in the developing world, in places such as China. Over the past three decades, China become increasingly urbanized and its urbanization rate has soared from 19.39% in 1980 to 53.73% in 2013 [3]. According to the Demographic World Urban Areas Report (12th Annual Edition, 2016), Shanghai, Beijing, and Guangzhou-Foshan are among the top twenty largest cities in the world. Shanghai has become the eighth largest city (with a population of 22.7 million people), Beijing is ranked as the eleventh largest in the world (with a population of 20.4 million), and Guangzhou-Foshan is the thirteenth largest city (with a population of 18.8 million). Such rapid urbanization has and will continue to strengthen the connection and cooperation among cities. Thus, around Shanghai, Beijing, and Guangzhou-Foshan, three giant city agglomerations have developed separately: the Yangtze River Delta Region, the Beijing-Tianjin-Hebei Region, and the Pearl River Delta Region. However, the emergence of such high-density city agglomerations in a developing country has incurred social stratification and inequality, and increased the exposure of urban residents to adverse environmental conditions such as natural hazards, climate change, environmental pollutions, and so on [3,4]. As a result, local residents are more vulnerable both physically and socially. As one of the defining components of risk, identifying vulnerability has become an important foundation that supports urban risk management. Furthermore, integrating the connections between cities into a vulnerability assessment is extremely essential in making cities safe and resilient in the context of rapid urbanization.
This paper concentrates on urban social vulnerability and investigates a new conceptual framework for assessing social vulnerability based on network theory. The paper is organized as follows. Section 2 reviews the literature on social vulnerability including concepts, evolution, and assessment. Section 3 presents the methodology of urban social vulnerability based on the new conceptual framework from a network perspective, using a case study of the Yangtze River Delta region in China. Section 4 consists of the study results including the vulnerability profile of each city in the study areas through GIS mapping and a discussion of the results. Section 5 provides our final conclusions and recommendations.
2. Literature Review: Conceptual Basis and Evolution of Vulnerability
More than 40 years ago, the concept of vulnerability emerged within the geography and natural hazards research field. At that time, most studies emphasized disaster exposure risk and linked vulnerability to the amount of damage caused by a particular hazard from a technical or engineering sciences perspective [5,6]; however, since the 1980s, scholars have been reluctant to take this perspective. From a social science viewpoint, researchers have embraced the theory that vulnerability is a state that exists in a system before it encounters a hazard and emphasized that the negative impacts of disasters could be magnified by certain social factors, including poverty, low levels of education, poor public infrastructure, and social services [7,8]. Methodologies that take vulnerability as a starting point for risk reduction and apply demographic data to assess vulnerability were regarded and signified a paradigm shift from natural sciences to a social sciences perspective in the standard interpretation of natural disasters [9,10,11,12,13]. To date, vulnerability research has covered different fields including climate studies, security studies, engineering, geography, political ecology, and disaster risk management [14,15,16]. To do so, vulnerability has been divided into biophysical and social aspects, both of which help scholars clarify the circumstances that put people and places at risk, and the conditions that reduce responsiveness to environmental threats [17].
As one important aspect of vulnerability, social vulnerability refers to the predisposition and inner state of individuals, organizations, or societies that affect the way they withstand adverse impacts from disruptive events such as natural hazards, climate change, or other dangerous incidences [18,19,20]. In essence, social vulnerability is a by-product of social stratification and social inequalities among different communities and different places from the built environment [21,22,23]. It has roots in the various characteristics of people including socio-economic status, demographics, and risk perception [24]. Cutter et al. provided generally accepted factors that influence social vulnerability: (1) frail and physically limited individuals (e.g., the elderly, children, special needs people, and even females); (2) the type and density of infrastructure and lifelines; (3) building stock; (4) limited access to public resources (e.g., knowledge, information and technology); (5) insufficient access to service resources (e.g., education and medicine); (6) lack of access to political power and social capital; and, (7) beliefs and customs [22,25]. Owing to its “mediating role”, social vulnerability is not only registered by exposure to hazards alone, but also resides in the local sensitivity to external stress and the capacity of the system to prepare, cope, and recover from damage [5,7,26,27]. Therefore, social vulnerability typically includes three basic components (or dimensions): exposure, sensitivity, and adaptability [28,29]. The United Nation Office for Disaster Risk Reduction (UNISDR) defines exposure as “the people, property, systems, or other elements present in hazard zones that are thereby subject to potential losses”, and can be biophysical or social [30]. Sensitivity reflects the degree to which a given community or system is affected by climatic stresses [31]. Adaptability is defined as “the ability of a system or individuals to respond, adjust, and cope with negative impacts of climate change and natural hazards [8,31,32].
Scholars have proposed multiple conceptual frameworks to assess social vulnerability [33,34], among which, there are four famous frameworks: the Pressure-and-Release (PAR) framework, the Hazards-of-Place (HOP) framework, the Exposure-Sensitivity-Resilience (ESR) framework, and the Bogardi-Birkmann-Cardona (BBC) framework. The PAR framework shows the progression of vulnerability with three social components: root causes, dynamic pressures, and unsafe conditions; however, it does not consider exposure in the definition of vulnerability [35]. The Hazards of Place (HOP) framework proposes the idea of “place” to bridge the gap between biophysical vulnerability produced by dangerous geographic context and social vulnerability created by social fabric [36]. The Exposure-Sensitivity-Resilience framework describes the complexity and interactions involved in vulnerability analysis. In this model, vulnerability emerges in a specific place, whereas, it is influenced by a human-environment system at broader scales such as regional and global levels [20,37]. The BBC framework indicates that vulnerability is a dynamic process and consists of two elements: exposed and vulnerable elements, and coping capacity. In this process, vulnerability is hidden in the environmental, social, and economic key spheres, which ultimately results in three risks: environmental risk, social risk, and economic risk [12]. In these conceptual frameworks, a geographic area (or place) is taken as a whole and complex system, where each component affects or is affected by other components, just like a systems view is taken in most logistic and supply chain management studies [38]; however, all of the interactions analyzed in vulnerability studies are mostly limited inside of the system border, that is to say, the interactions and connections between the systems are neglected.
Under these frameworks, a variety of tools and methods, such as integrated assessment models, household surveys, and indicator approaches have been used to measure social vulnerability [6,39,40]. Despite ongoing debates on the viability of measuring social vulnerability [41], a methodology of aggregating related indicators to produce a composite index of social vulnerability (SVI) has gained general acceptance and is one of the leading tools for quantifying social vulnerability [42]. This methodology has been successfully applied in various contexts described in References [21,40,42,43,44]. It is fairly robust and strongly supported for identifying and monitoring social vulnerability over space.
3. Materials and Methods
3.1. A New Conceptual Framework from a Network Perspective
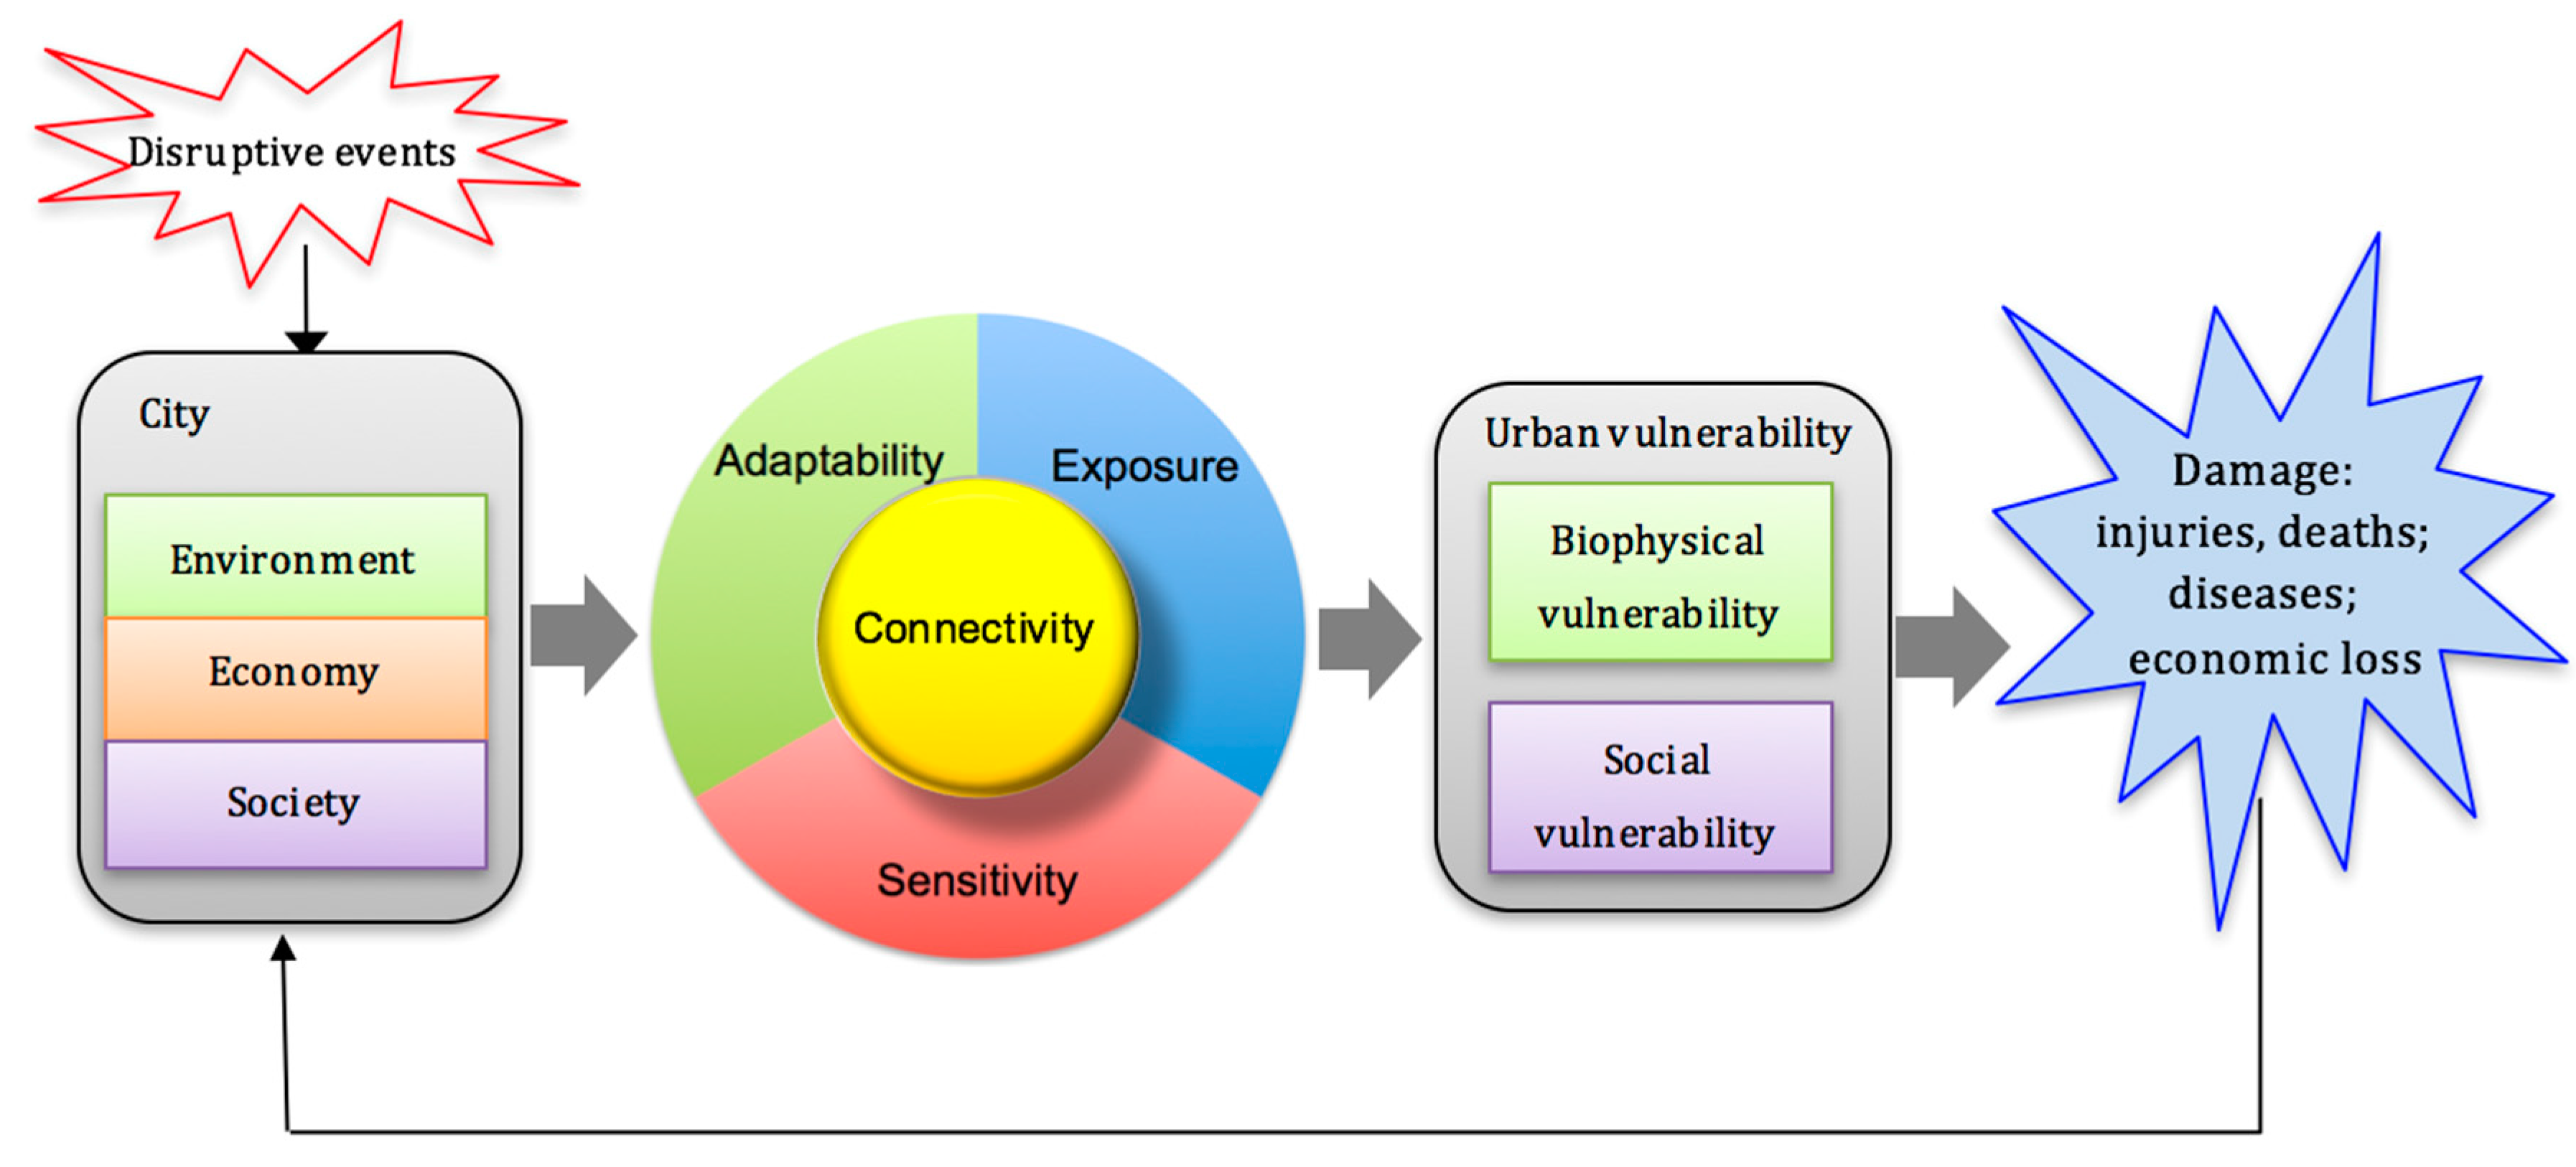
Vulnerability is thought to arise from the inequalities of core thematic dimensions such as environment, economy, society, and so on [41]. As a popular method in social vulnerability assessment, the index methodology always selects the related factors influencing vulnerability from these aspects and presents them in terms of exposure, sensitivity, and adaptability. In this methodology, the connectivity between different systems or geographic areas is usually neglected. In fact, we have witnessed dramatic economic changes at a global level along with an increasing close mutual interaction shaped by flows of goods, people, and information between local and global processes over the past three decades [45,46,47]. In modern conceptions of the city, cities are considered as lived places with various attributes or dimensions, and are also regarded as nodes where different networks run together. Cities have crossed their geographical boundaries and connected to each other through a variety of high-speed worldwide or regional networks that play an important role in understanding the nature of cities [47,48]. City networks can be physical connections to other places such as transport systems, and can also exist in immaterial forms such as trade, migration, information, capital, and cultural links [49]. The research on city networks is regarded as a symbol of the transition from the theory of ‘space of places’—which focuses on structure—to the theory of ‘space of flows’ that emphasizes the relationships in urban geography [48,50,51]. It is an important paradigm transition and also offers a new perspective on social vulnerability assessment. Network analysis will play an increasing role in vulnerability studies [52]; hence, based on the theory of city networks, this paper proposed a new conceptual framework to emphasize the open, dynamic, and interactive characteristics of urban vulnerability (Figure 1).
As illustrated in Figure 1, when a city suffers from a disruptive event, all of the attributes stemming from three aspects of environment, economy, and society manifest as different forms of vulnerability. Traditionally, they are superimposed in three dimensions: exposure, sensitivity, and adaptability, and are considered as attribute data. In fact, as a whole and complex system, a city is also a node linking to other cities (nodes) with various types of flows in a larger scale system, known as a network of regions [38]. Either physical flows or immaterial flows always change urban attributes in the aspects of environment, economy, and society, and further affects urban exposure, sensitivity, and adaptability. Ultimately, urban vulnerability has changed as networks can affect the level of vulnerability [52]. To embed urban vulnerability in the context of networks, a fourth important dimension, namely connectivity, was added to our conceptual framework. This dimension aims to evaluate the ability of a city on the connection, openness, and coordination in networks. Three traditional dimensions (exposure, sensitivity, and adaptability) lie in the first level of the model and the new dimension (connectivity) is on the second level of model as the fourth new dimension emerges later and has influence on the other three. Several researchers have proposed that well-coordinated and better connectivity networks can play active roles in decreasing disaster vulnerability and increase resilience before, during, and after disasters [53]. Based on various connections and flows, networks can provide cities with more potential access to resources, and also a higher possibility of effectively mobilizing resources to meet priorities and further achieve their goals in reducing vulnerability [52]. In contrast, fragmented urban communities in a complex physical environment are relatively vulnerable due to a lack of social support and cohesion [54]. It can be concluded that this new dimension of connectivity is an efficient complement to adaptability. However, it differs from adaptability as connectivity needs to be evaluated by relational data [55]. Similar to a risk perspective, these four dimensions (exposure, sensitivity, adaptability, and connectivity) can be further divided into biophysical and social vulnerabilities that interact with each other to produce the overall vulnerability. When the overall vulnerability interacts with a disruptive event, it will result in damage such as injuries, deaths, disease, and economic losses. Damage, in turn, can affect urban attributes and connections that, furthermore, moderate or enhance vulnerability. In this paper, we only focused on urban social vulnerability.
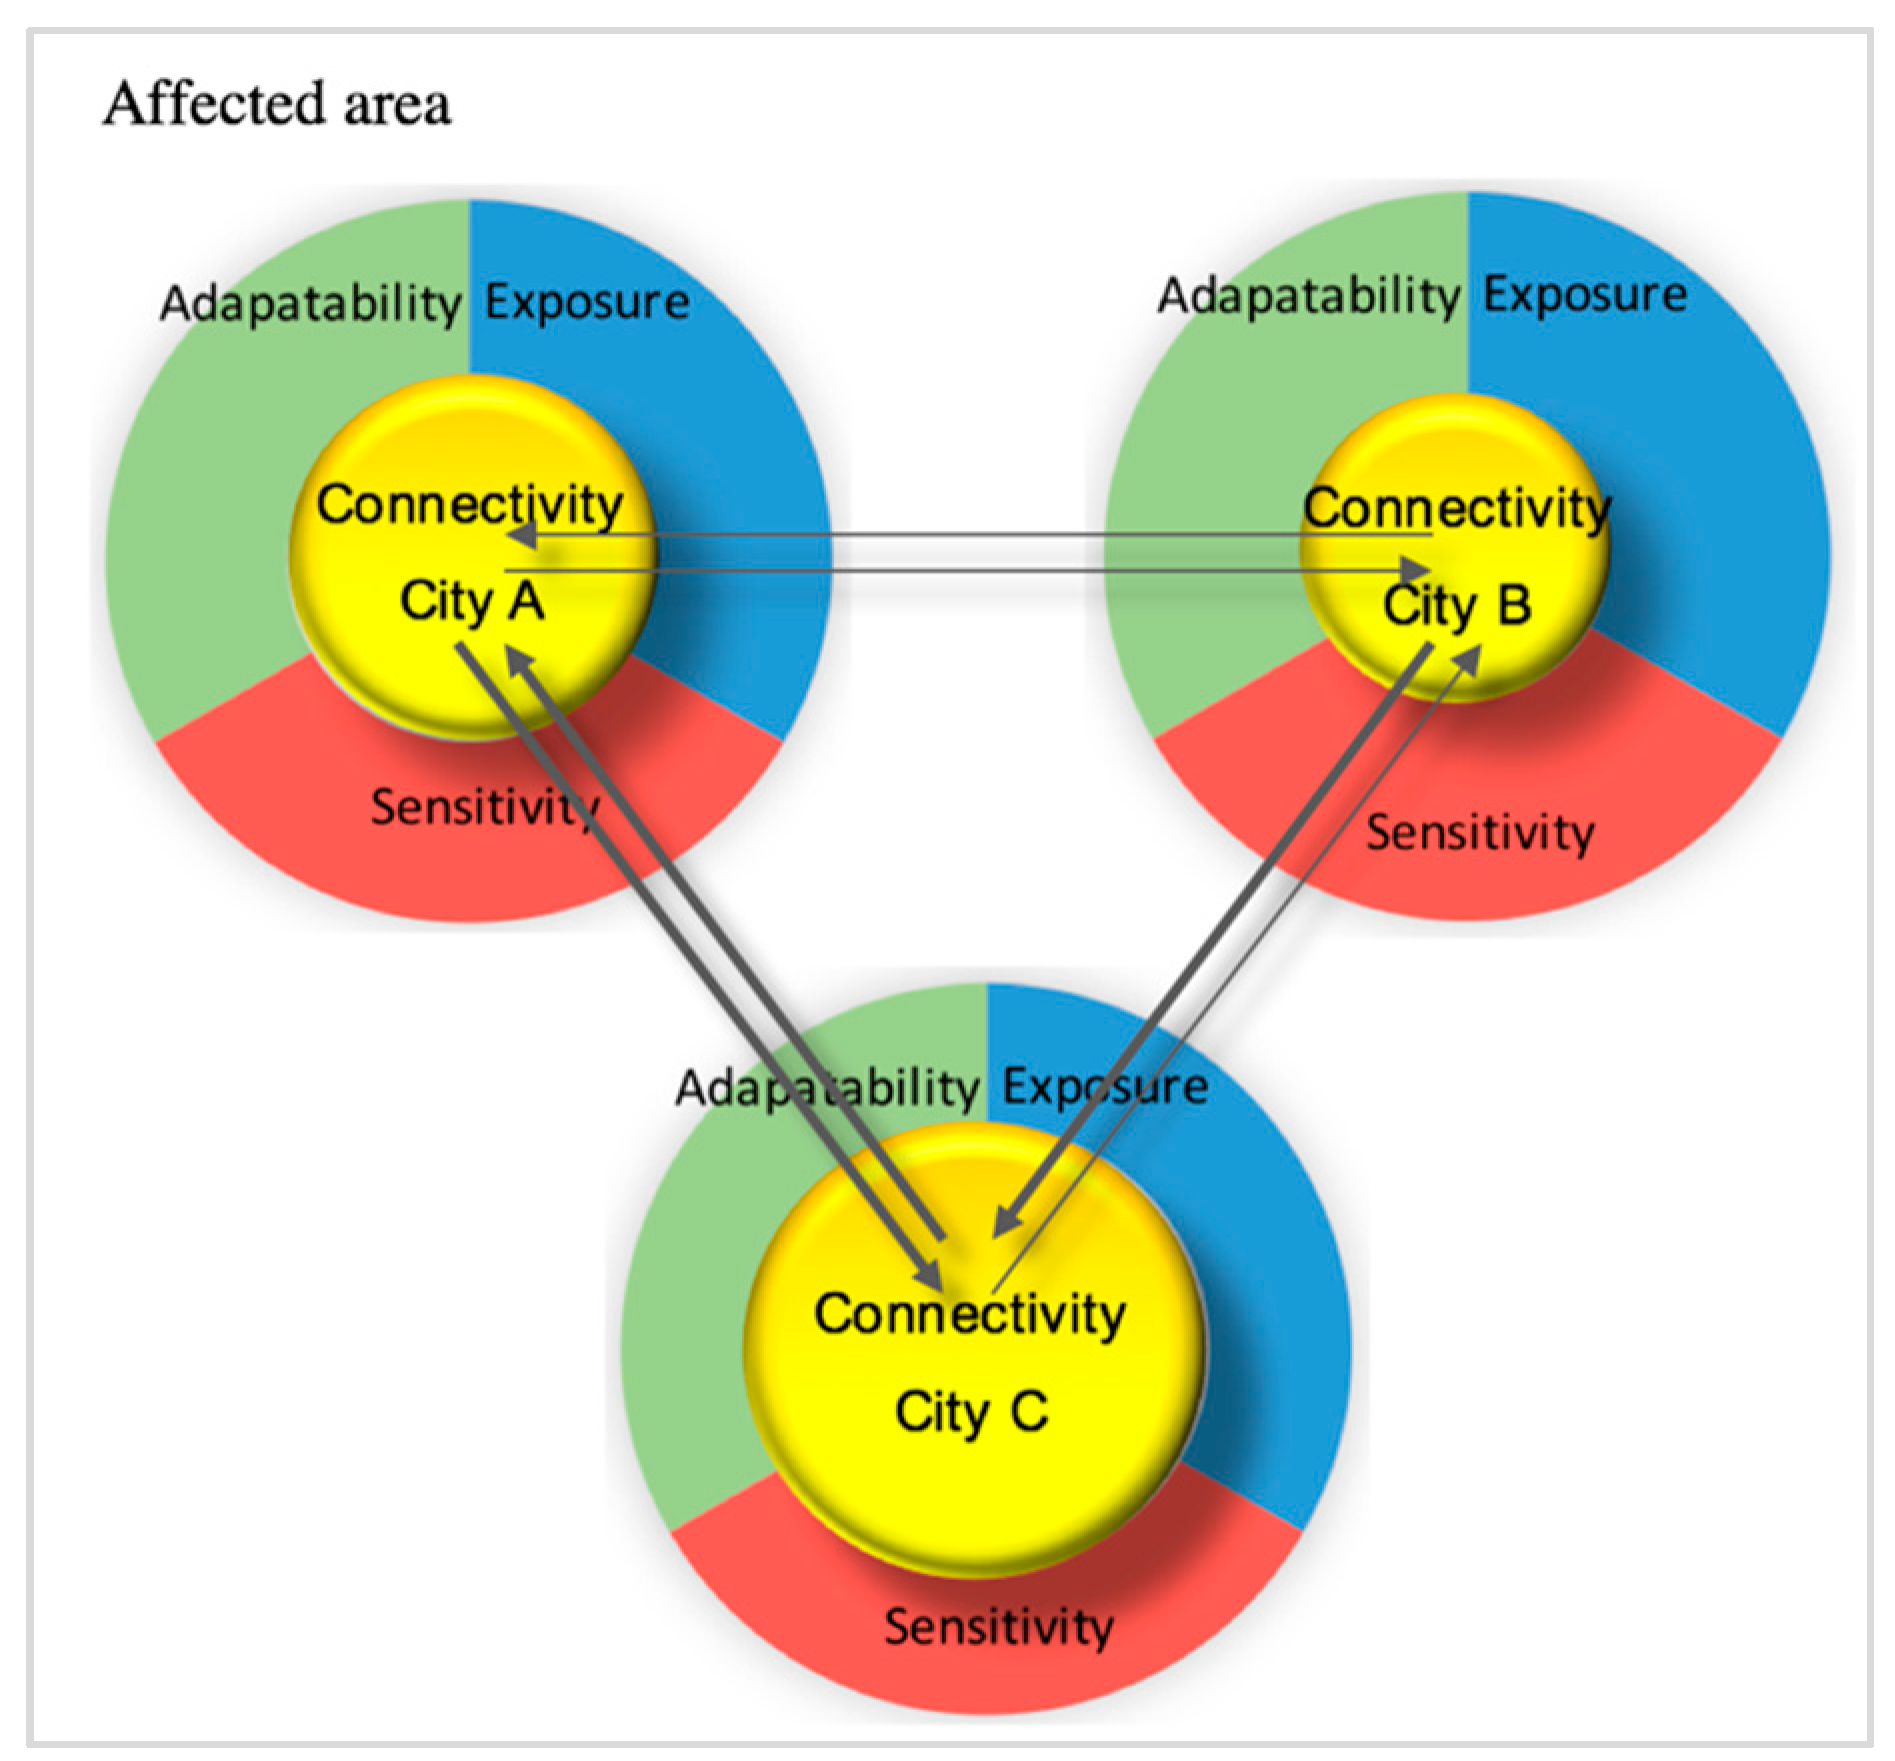
Figure 2 shows a particular description of connectivity. Cities A, B, and C are three different cities in an affected area. Due to developments in physical and immaterial flows, these three cities are linked to each other and become three nodes in a network. They are different in four vulnerability dimensions: exposure, sensitivity, adaptability, and connectivity, which correspond to the different area of annulus, as illustrated in Figure 2. All of the flows between the adjacent nodes were simplified into in-flow and out-flow presented by the lines. The width of the lines represents the strength of flow. Here, flow strength is simply defined as “bold” and “thin”. As Connectivity A = 2 (thin lines) + 2 (bold lines); Connectivity B = 3 (thin lines) + 1 (bold lines); and, Connectivity C = 1 (thin lines) + 3 (bold lines), therefore, Connectivity C > Connectivity A > Connectivity B. In our post-industrialized society, a large amount of fast moving information flows between cities is the essential and obvious feature [55]. To a certain extent, information flows have reshaped the urban network. Therefore, we only focused on information flows in this paper.
3.2. Study Area
Located in the easternmost part of China (118°20′E–122°46′E, 28°2′N–33°25′N), the Yangtze River Delta (YRD) region is one of the major engines of China’s economic growth and is considered to be the world’s sixth-largest economic center. In general, the Yangtze Delta region is comprised of three major areas: the municipality of Shanghai, the central and southern parts of Jiangsu Province, and the northern parts of Zhejiang Province. Together, sixteen large-sized and medium-sized cities are included: Yangzhou, Taizhou, Nantong, Nanjing, Zhenjiang, Changzhou, Wuxi, Suzhou, Shanghai, Huzhou, Jiaxing, Hangzhou, Shaoxing, Ningbo, Zhoushan, and Taizhou (Figure 3). The linkage between city agglomerates to individual cities can be likened to the relationship between “networks and knots”. Amidst competition and cooperation, every individual city has important positions and complementary functions to other cities, and all of the cities in this region have achieved a win-win outcome.
The YRD region has always ranked among the top with the highest urbanization level, population density, and economic development in China [56,57]. In 2010, the population of this region was 108.12 million that accounted for 8.06 percent of the nation’s total population. Of this, 57.19% of the total population lived in urban areas. Hence, the population density in the urban areas of the YRD region reached 1646 people per km2, notably higher than in the national figure of 140 people per km2. Moreover, with only 1.1% of the total land area of China, the Gross Domestic Product (GDP) of the YRD region soared to 6824.89 billion Yuan and accounted for 17.0% of the whole nation’s GDP. Even with such high population density, its per capita GDP was RMB 68,337, nearly 1.3 times more than the national average (Table 1).
However, with heavy population pressure and high consumption of resources and energy, the eco-environment system of the YRD has become increasingly vulnerable [57]. Hence, the YRD new-style urbanization plan has called for the development of smart city clusters, regarded as one of the most powerful strategies for moving cities towards sustainability in an increasingly urbanized world [58]. This plan includes enhancing fixed line and wireless broadband service coverage, using new-generation information technology to drive IoT (Internet of Things), and other technical applications for transportation, the environment, municipal facilities, and other urban management domains. Undoubtedly, the Internet has become increasingly important to people in their everyday lives. At the same time, the connection of cities in the YRD region will become closer in the immediate future.
In this context, the YRD was selected for conducting our urban social vulnerability assessment within the new conceptual framework.
3.3. Data
Two types of data were used in our study: attribute data and relational data. The former were applied to measure traditional SVI composed of three dimensions: exposure, sensitivity, and adaptability. The latter were the data of information flows for examining the fourth new dimension of social vulnerability: connectivity. The attribute data were collected from the 6th National Population Census of China (2010), the Jiangsu Statistical Yearbook, the Shanghai Statistical Yearbook, and the Zhejiang Statistical Yearbook, as well as the 2010 China Civil Affairs Statistical Yearbook. Referencing our similar previous study in the YRD area [19], nineteen indicators were finally selected for assessing social vulnerability after removing indicators for their high correlation, and included: Population density, Urban Resident, Female, Children, Elderly, Ethnicity, Illiterate, Poor, Unemployment Rate, Employees in the Second Sector, Employees in Mining, Employees in Construction, GDP in the Second Industry, Per GDP, Educated, Beds in Hospitals, Physicians in Hospital, Employees in Management Sector, and Green Space Coverage.
The relational data were retrieved from the Baidu Index [59]. In China, Baidu is the most widely used search engine and Baidu Inc. developed a public web facility named the Badidu Index in 2006. Like Google trend, the Baidu Index is an unbiased sample of search data based mainly on the consumption of Web information (e.g., the information being actively being sought) [49]. It helps to investigate a user’s interest in a particular topic or a specific set of search terms over time from around the globe and drills down to city-level geography. The analysis of data obtained from search engines like Google or Baidu were labeled as Web activity Analysis (WAA), and was used to illustrate the urban information flows in network studies [49,55,60,61,62]. To simulate the information flow, we investigated the mutual search interests among the sixteen cities, and more details will be shown in the following section.
3.4. Method
The method used in this paper is shown in Figure 4.
As illustrated in Figure 4, the urban social vulnerability included three parts.
- (1)
- With attribute data, the traditional urban SVI was regarded as an index of individual nodes (each city) without connectivity and was evaluated with the projection pursuit cluster (PPC) model. The detailed procedure is as follows:Step 1: Normalize the values of proxy indicators by using the min-max rescaling transformation method.Step 2: Develop the index function Q(a). First, the dataset of {x(i, j)|i = 1, 2,…, n; j = 1, 2,…, p} (n = 16, p = 13) was converted into a one-dimensional projection value z(i):where a(j) is a p-dimensional unit vector of the projection direction. Different projection directions revealed different features of the data structure. An optimal projection direction, or the direction exposing the most interesting structure of high dimension data, was taken as the weight of the indicator in this paper. To find the optimal projection, the index function Q(a) was evaluated as follows:where E(z) is the mean of z(i); R is the local density radius of the window set as ; corresponds to the distance between the sample and was set as ; and u(t) is the unit step function: .Step 3: Based on the program of the real-coded genetic algorithm implemented in PYTHON, Q(a) was maximized to find the optimal projection a*(j). a*(j) also corresponded to the best suitable weights of social vulnerability indicators. Next, the traditional urban SVI (labelled as the SVInode) was calculated:where a*(j) is the optimal projection direction.More detailed steps were illustrated in our previous paper: Mapping Social Vulnerability to Air Pollution: A Case Study of the Yangtze River Delta Region, China [19].
- (2)
- With the relational data retrieved from the Baidu Index, the new dimension (connectivity) of social vulnerability (labelled as SVIconnectivity) was calculated according Equation (2).where i and j represent the city (n = 16 for this case). The first item corresponded to the total searches from all the other 15 cities to city i, which meant the sum of information flowing in city i. For example, if city i = Shanghai, this item records all of the search data where the search topic is “Shanghai” and the search regions are “Yangzhou, Taizhou, Nantong, Nanjing, Zhenjiang, Changzhou, Wuxi, Suzhou, Huzhou, Jiaxing, Hangzhou, Shaoxing, Ningbo, Zhoushan and Taizhou”. The second item represents the total searches from city i to all the other 15 cites, which means the sum of information flowing out of city i. In the above example, if city i = Shanghai, then the search topic is any one of “Yangzhou, Taizhou, Nantong, Nanjing, Zhenjiang, Changzhou, Wuxi, Suzhou, Huzhou, Jiaxing, Hangzhou, Shaoxing, Ningbo, Zhoushan and Taizhou”, while, the search region is “Shanghai”. The third item represents the searches from city i to itself, that is, the search topic and search region are both “Shanghai”.
- (3)
- As above-mentioned, a node with better connectivity should be less vulnerable to disasters. Hence, the urban SVI was modelled as follows:
4. Results and Discussion
4.1. Connectivity
These sixteen cities of in the YRD region in the order of highest connectivity to lowest were Shanghai, Suzhou, Nanjing, Hangzhou, Ningbo, Wuxi, Changzhou, Jiaxing, Yangzhou, Nantong, Taizhou (Z), Zhenjiang, Zhoushan, Shaoxing, Taizhou (J), and Huzhou. More details on the connectivity are shown in Table 2 (note: “Flow-in” means the total searches from all the other 15 cities to city i in the Baidu Index. “Flow-out” means the total searches from city i to all the other 15 cities. “Itself” means the total searches from city i to itself. “Connectivity” is the sum of “Flow-in” and “Flow-out”).
According to Table 2, there were five types of connectivity structure: (1) “Flow-out” > “Itself” > “Flow-in”, for example, Shanghai; (2) “Flow-out” > “Flow-in”> “Itself”, e.g., Suzhou; (3) “Flow-in” > “Flow-out” > “Itself”, from Nanjing to Zhoushan; and (4) “Flow-out” > “Flow-in” > “Itself” (Shaoxing, Taizhou and Huzhou). By considering the general characters of the cities described in Table 1, several conclusions were drawn from the results in Table 2: (1) smaller or less-developed cities had fewer searches from other cities, focused less on themselves, and were more interested in other cities, that is, a city with less inner vitality was used to following others; (2) As the scale or economy of the city increased, more searches from other cities and more focus was placed on itself, which meant that the city began to affect others and be more active; and, (3) as the city or economy grew further, searches from this city to other cities increased again, and even searches about itself were larger than searches from the other cities, which demonstrated that a city has become more open, active, and is capable of learning from others.
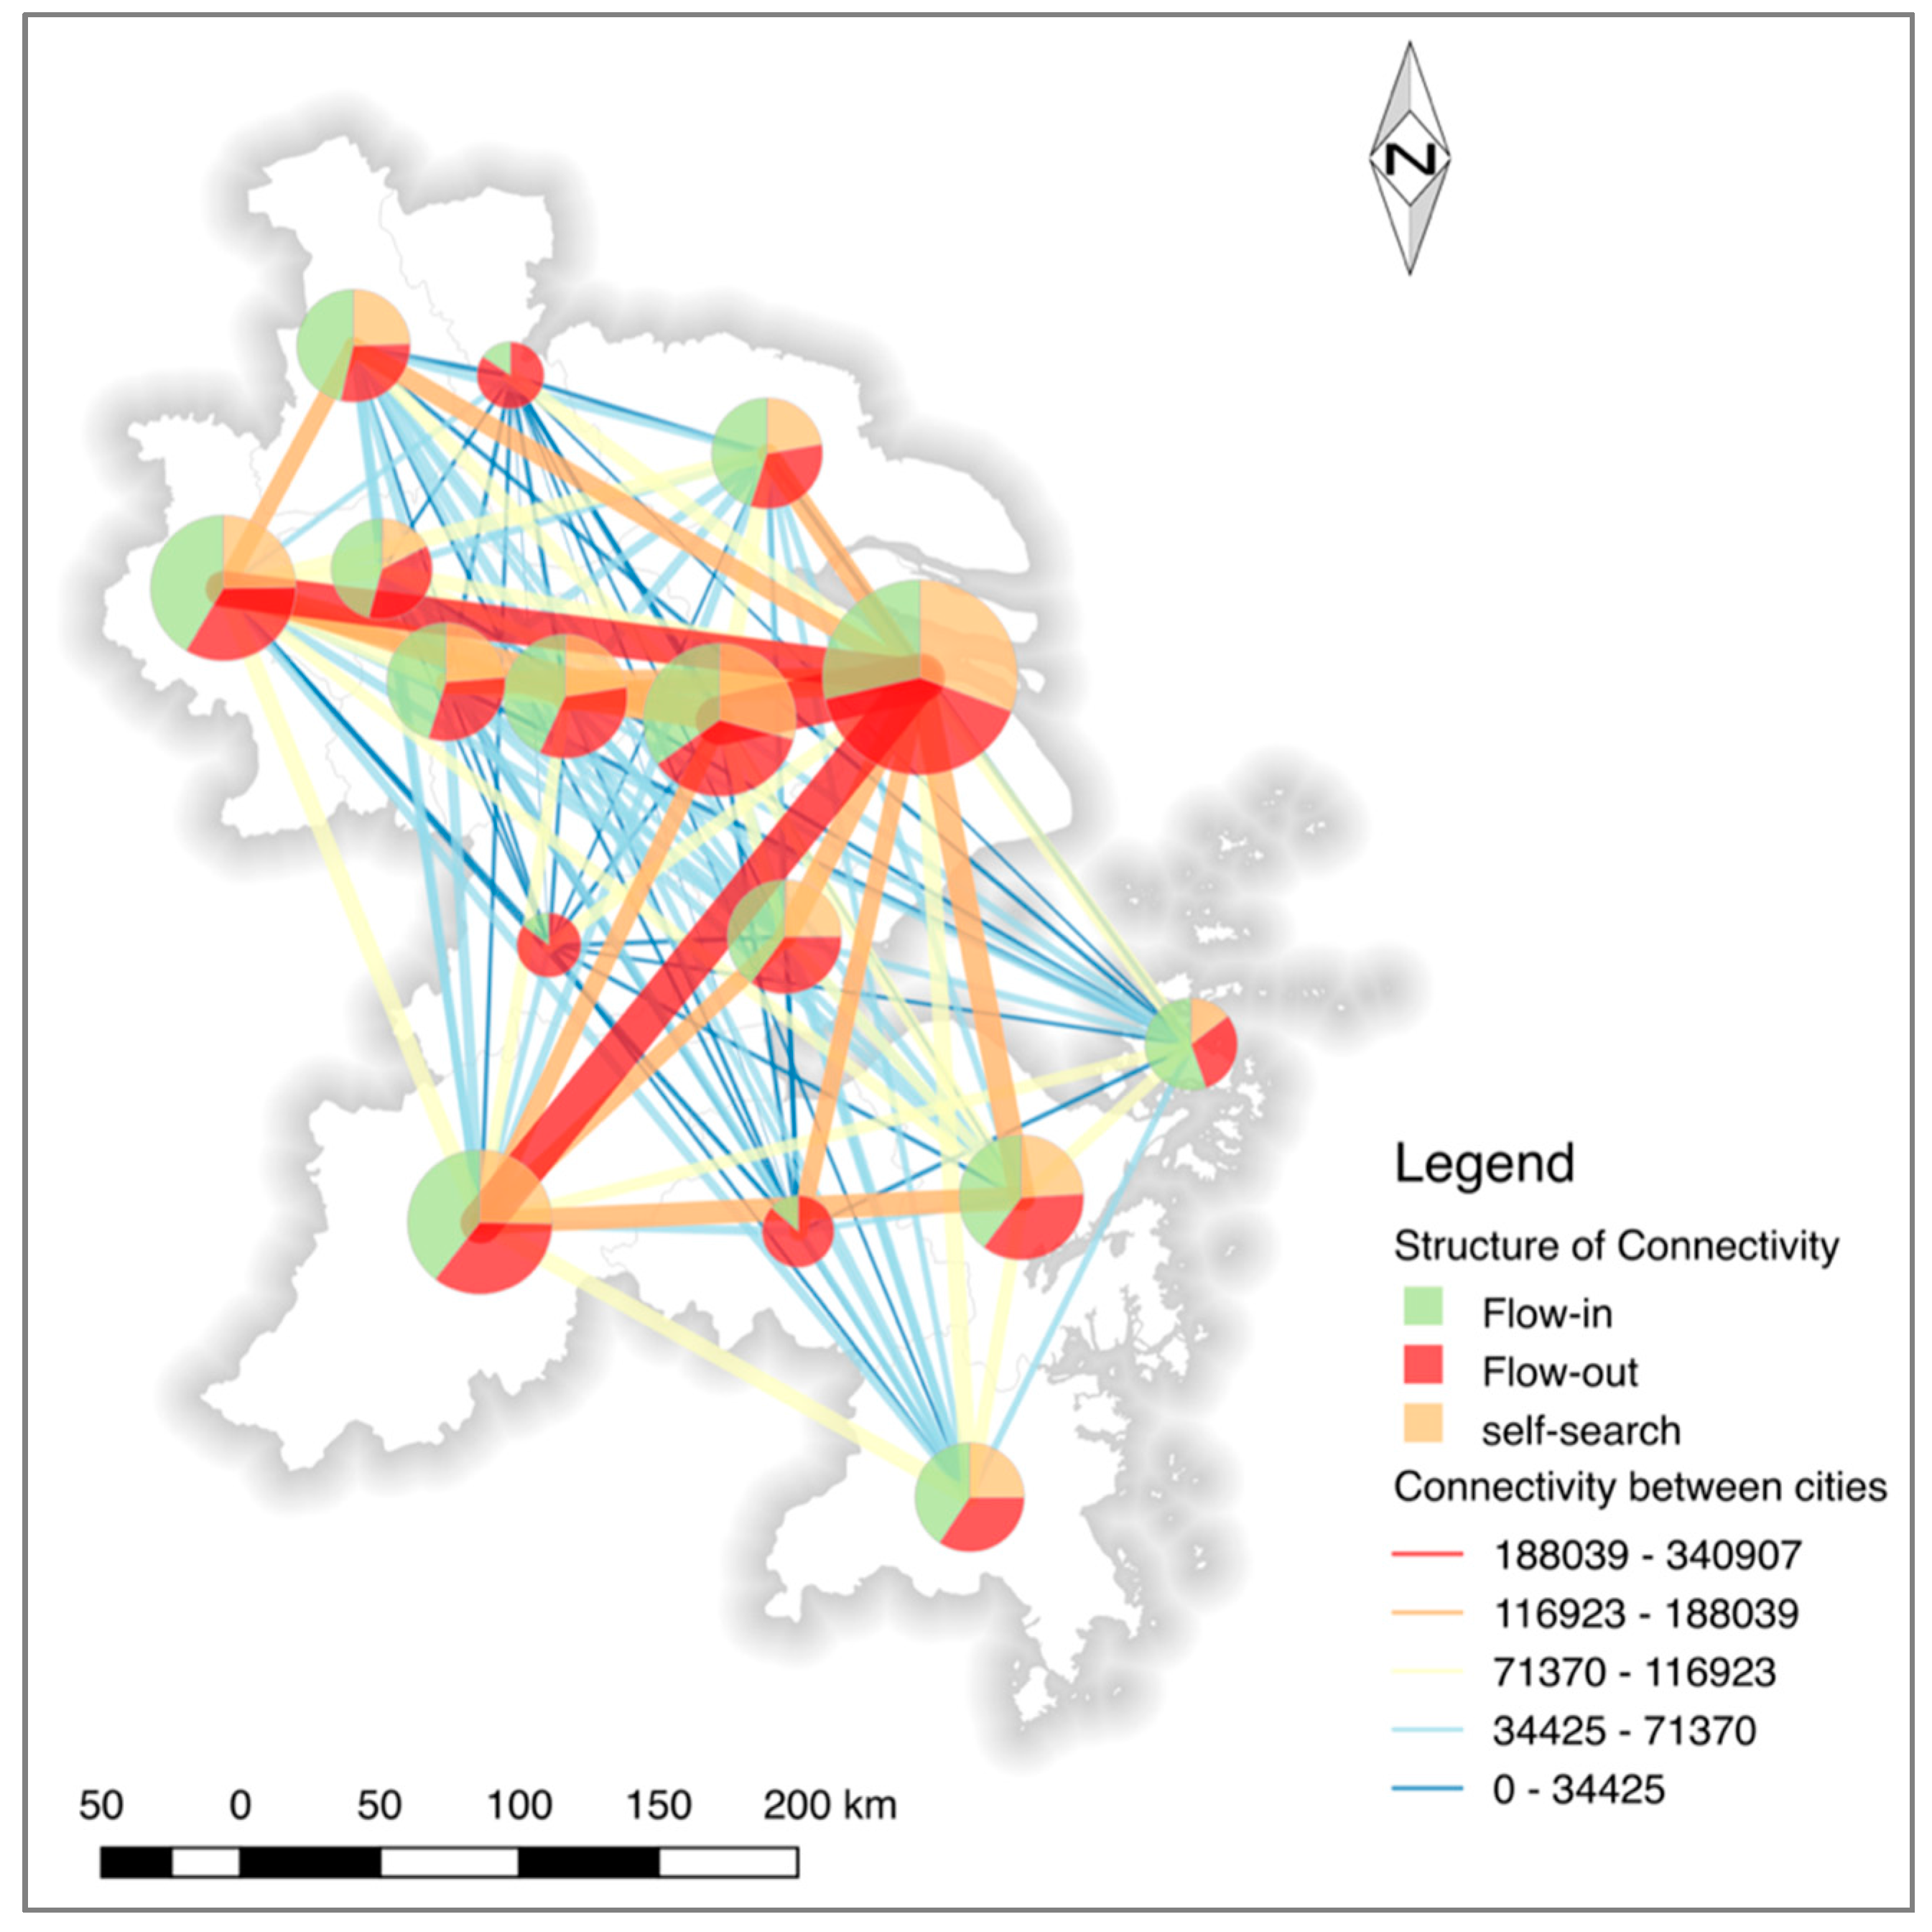
To illustrate the spatial distribution of connectivity, we mapped the results with QGIS and are shown in Figure 5 (note: the circle’s area and color represents the connectivity of the city, and the width and color of line represents the strength of connections between two cities) [63].
According to Table 2 and Figure 5, the connectivity of Shanghai was the highest in the region and all of the connections between Shanghai and another city belong to Level 1 (the red lines), or Level 2 (the orange lines). This made Shanghai the most important node of this information network in the YRD region. Considering the total connection strength, Suzhou, Nanjing, and Hangzhou had leading roles on their local information connection. Aside from the relatively weak connection between Nanjing and Hangzhou, the connectivity between Shanghai, Suzhou, Nanjing, and Hangzhou were stronger than any other city pairs. Hence, they can be considered as four basic pillars carrying the whole information network and constitute the red backbone of the network, therefore were recognized as Level 1. The second group was composed of Yangzhou, Nantong, Changzhou, Wuxi, Jiaxing, Shaoxing, and Ningbo. Coupled with the top four, they constituted the Level 2 skeleton of the network which is presented in orange. The third group included Taizhou (J), Zhenjiang, Huzhou, Zhoushan, and Taizhou (Z). Connecting with the first and the second group, they formed the Level 3 framework of network rendered in yellow.
Although all of these connections in the information network are immaterial, they actually correspond to physical connections of the material network, such as (1) the transportation network where Shanghai, Nanjing, and Hangzhou are three key transport hubs for rail or highway networks, and Suzhou, Wuxi, and Changzhou are important sub-hubs of transportation networks; and, (2) urban hierarchy. As a direct-controlled municipality of China, Shanghai is the largest city in the region and a global financial hub. Thus, it is on the top tier of the urban hierarchy. Being the capital city of the province, both Nanjing and Hangzhou are classified as sub-provincial cities and sub-centers in urban hierarchy. Suzhou, the second largest city in Jiangsu province and a major economic center in China, was another sub-center of the YRD region. The reality of the material networks supported our results of the immaterial network.
4.2. SVInode and SVIurban
Mapped with QGIS 2.14.10, the spatial distribution of SVInode and SVIurban is illustrated in Figure 6. The detailed information about the differences between SVInode and SVIurban are shown in Table 3.
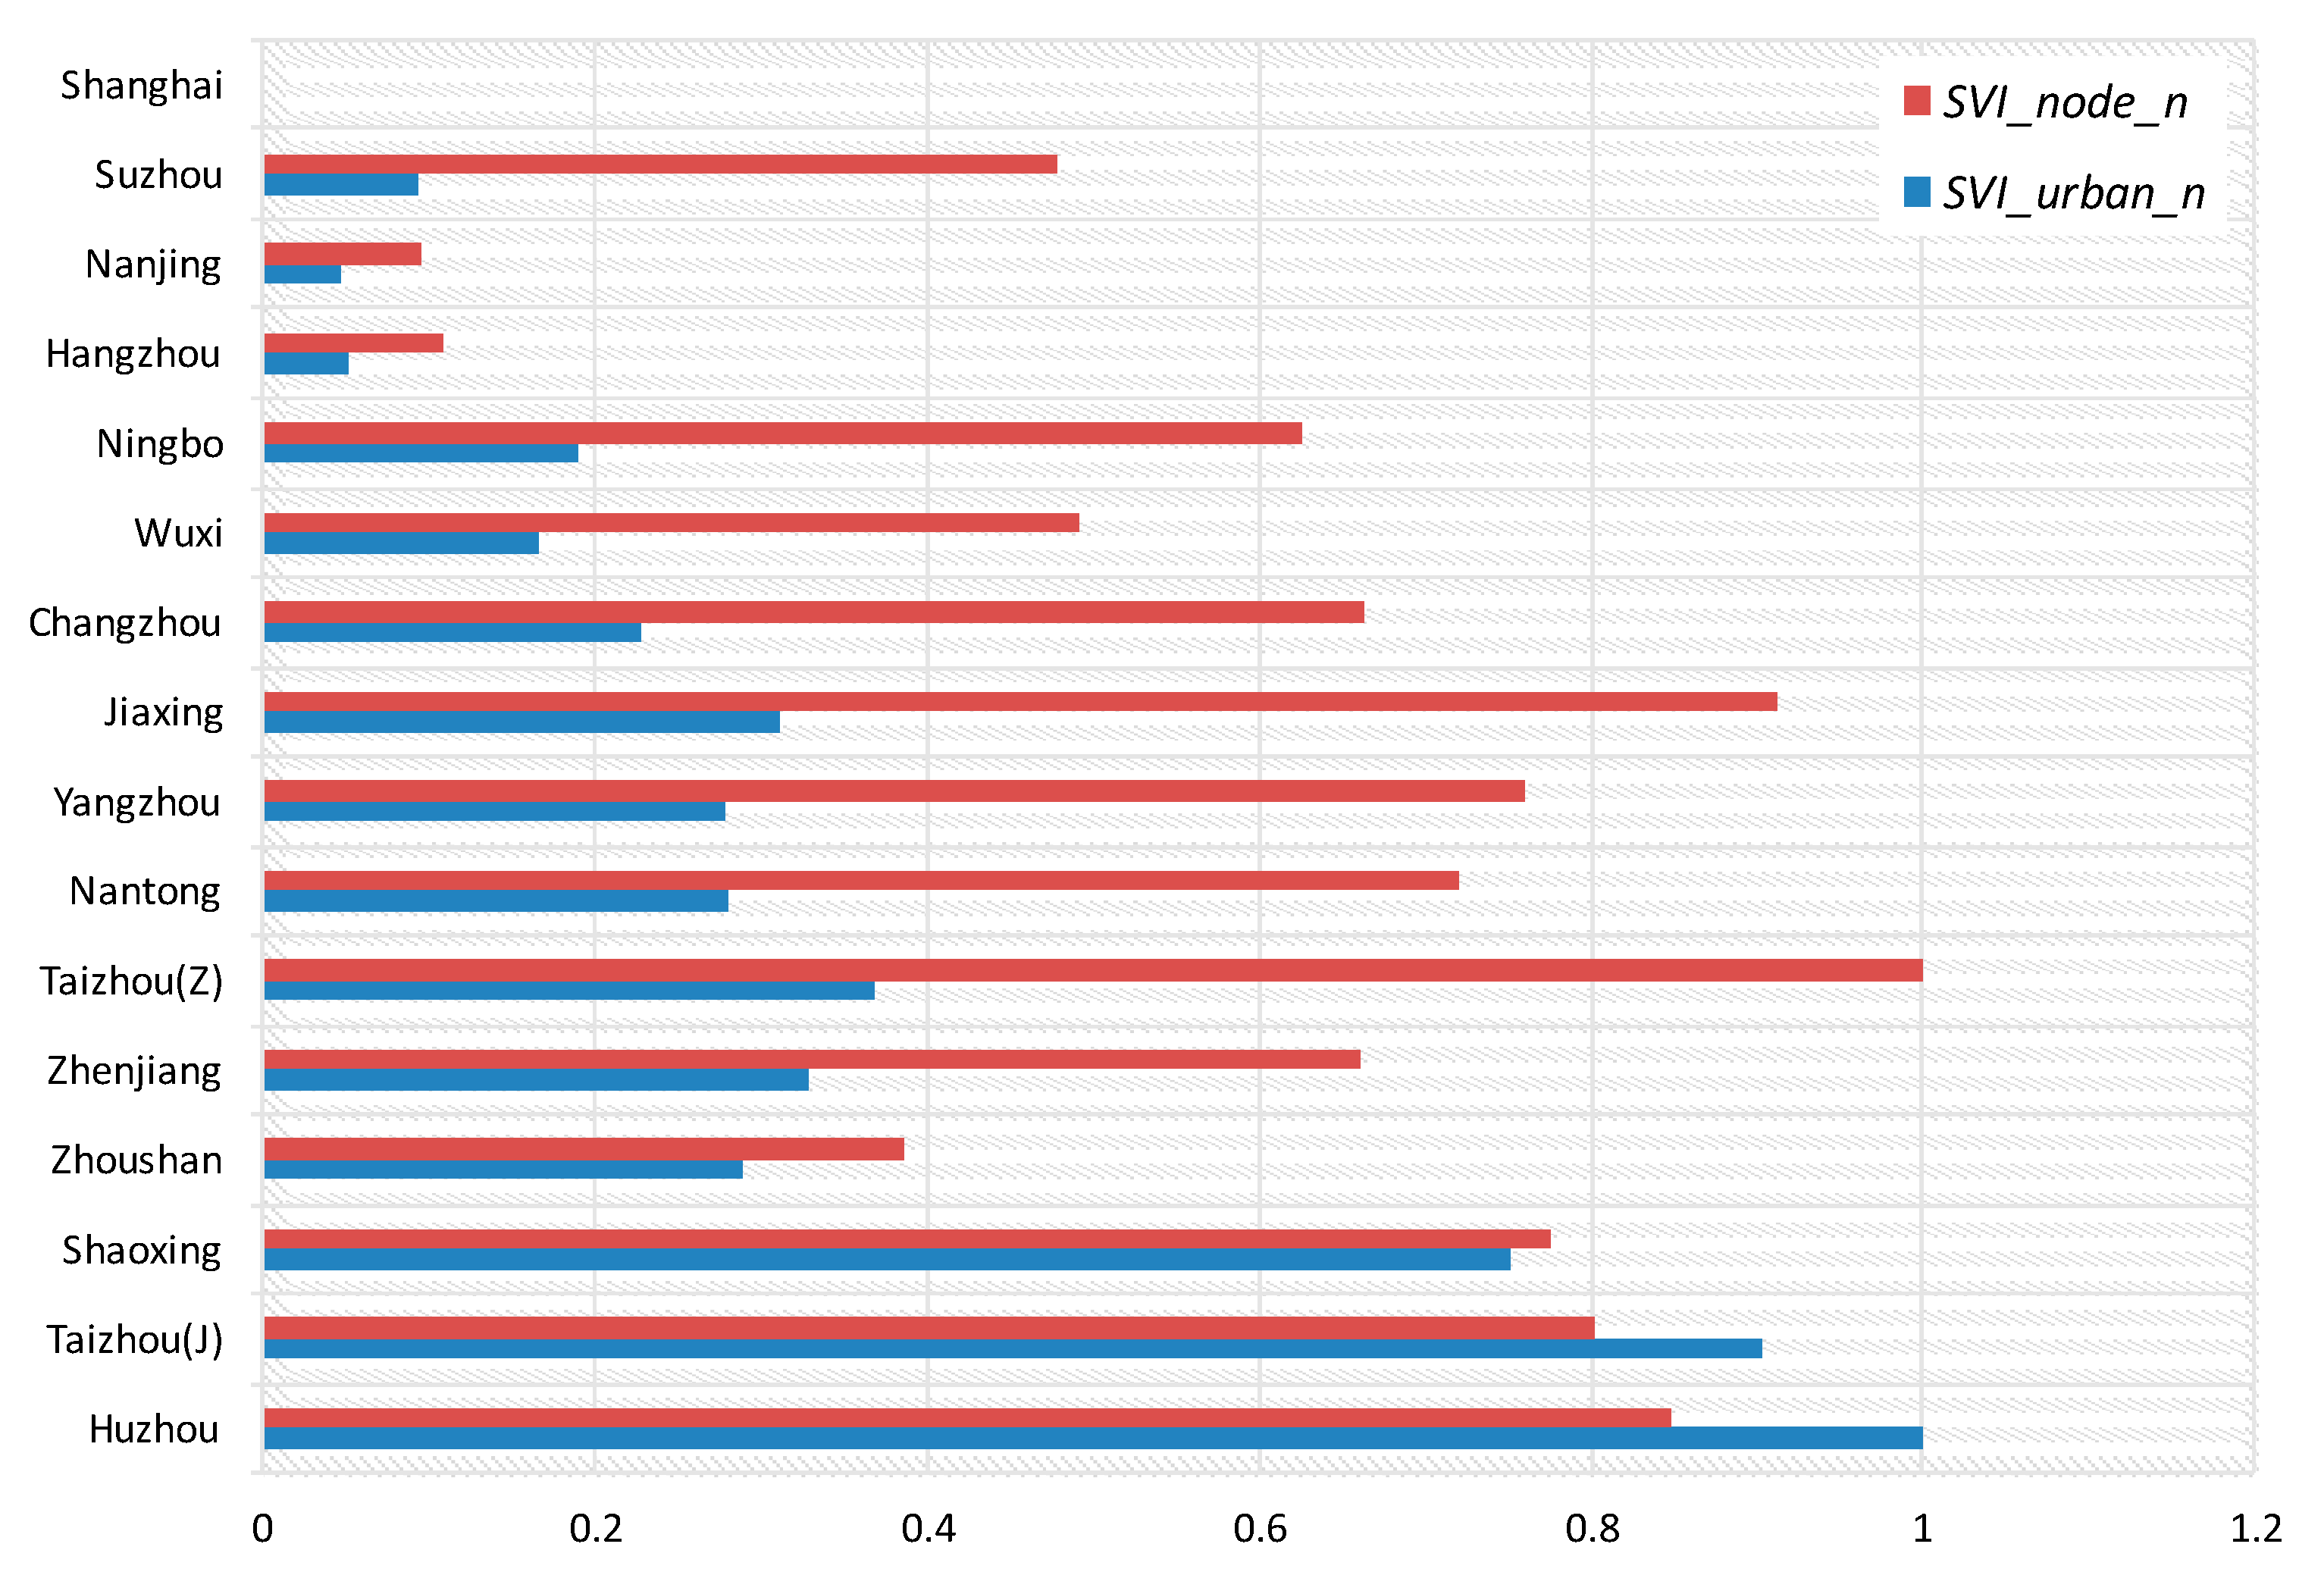
The condition of traditional social vulnerability (SVInode) for cities in the YRD region can be classified in three parts: (1) The lowest three are Hangzhou (1.09), Nanjing (1.06), and Shanghai (0.88); (2) these were followed by Zhoushan, Suzhou, Wuxi, Ningbo, Zhenjiang, Changzhou, Nantong, Yangzhou, Shaoxing, and Taizhou (J), with SVI from 1.61 to 2.34; and, (3) the top three high values of SVInode were located in Taizhou (Z) (2.76), Jiaxing (2.60), and Huzhou (2.48), which all belong to Zhejiang Province. Either the top three or the bottom three just corresponded to the urbanization ranking in Table 1. The average value in Jiangsu Province as less than in Zhejiang Province, which showed that the condition of traditional social vulnerability in Jiangsu Province was better than Zhejiang Province. The distribution of new social vulnerability (SVIurban) showed that once these sixteen cities were connected with each other by information flows, their social vulnerability changed obviously. SVIurban in some cities was reduced such as in Yangzhou, Suzhou, Taizhou (Z), whereas, Taizhou (J) increased its social vulnerability distinctly. By examining their changes more clearly, we normalized SVInode and SVIurban, and these are demonstrated in Figure 7.
In Figure 7, both the SVInode and SVIurban of Shanghai were the minimum in our study area, so these two values became zero after normalization. In most cities, the SVIurban was far less than the SVInode. It indicated that connecting in the information network helped most of the cities mitigate their social vulnerability. However, two cities, Taizhou in Jiangsu Province and Huzhou in Zhejiang Province, had an SVIurban higher than their SVInode. This showed that their social vulnerability could not be reduced for the connecting network. To explore the relationship between SVI and connectivity, we examined the variation of SVInode and SVIurban, and linked it to the hierarchy of cities. According to Figure 5, there were five hierarchies of connectivity between the cities: (1) Hierarchy 1, where connectivity was from 188,039 to 340,907, of which only Shanghai belonged to this type; (2) Hierarchy 2, where connectivity was from 116,923 to 188,039, and Suzhou, Hangzhou, and Nanjing belonged to this type; (3) Hierarchy 3, where connectivity was from 71,370 to 116,923, and eight cities (Ningbo, Wuxi, Jiaxing, Changzhou, Yangzhou, Taizhou (Z), Nantong, and Zhenjiang) belonged this type; (4) Hierarchy 4, with connectivity from 34,425 to 71,370 and Zhoushan, Shaoxing and Taizhou (J) belonged to this type; and (5) Hierarchy 5, where connectivity was below 34,425, and only Huzhou was classified as this type. Furthermore, the variation between SVInode and SVIurban (normalized value) was calculated and all the results are shown in Table 3.
First of all, the city in Hierarchy 1 (Shanghai) kept its minimum value for either SVInode or SVIurban, so no variation occurred. For Hierarchy 2, though the SVInode of these three cities were already sufficiently low, the SVIurban still obviously decreased because their connectivity was strong enough. Eight cities belonged to Hierarchy 3, which meant that their connectivity was weaker than cities in Hierarchy 2. At the same time, the mean values of SVInode and SVIurban were both higher than ones in Hierarchy 2 so they have decreased their social vulnerability more so than cities in Hierarchy 2, therefore, these eight cities benefited most from the network. As for the three cities belonging to Hierarchy 4, the situation was the reverse. The mean value of the SVInode of Hierarchy 4 was less than Hierarchy 3, while the mean value of SVIurban was much more than that of Hierarchy 3. The variation in Hierarchy 4 was slight. The city of Taizhou (J) even increased its social vulnerability after connecting in the network. Therefore, Hierarchy 4 did not benefit much from the network. The last city in Hierarchy 5 increased its social vulnerability most when adding connectivity in the social vulnerability assessment. Based on the results of our case study, a conclusion was drawn that network connectivity influenced social vulnerability. If connectivity was strong enough, it could help cities mitigate their traditional social vulnerability, otherwise, a loose connection in the network aggregated their traditional social vulnerability.
5. Discussion and Conclusions
In modern conceptions, cities are regarded as residential places with various attributes and also as nodes in a variety of networks run together. Network analysis can offer new insights into social vulnerability assessments. Based on the theory of city networks, this paper proposed a new conceptual framework to evaluate social vulnerability in city agglomerations. In detail, it measured social vulnerability in three parts: (1) with the attribute data, the SVInode was calculated using the PPC model based on the real-coded genetic algorithm implemented in Python; (2) with the relational data retrieved from the Baidu Index, a new dimension of social vulnerability (connectivity in networks) was measured; and, (3) based on SVInode and SVIconnectivity, a new integrated social vulnerability of a city (SVIurban) was evaluated. This method was applied in the Yangtze River Delta region in China.
Our findings are summarized as follows. First, regarding the traditional social vulnerability (SVInode), the top three highest values of SVInode were located in Taizhou (Z), Jiaxing, and Huzhou. All of these are cities in the Zhejiang Province. The bottom three were Hangzhou, Nanjing, and Shanghai. Thus, the condition of traditional social vulnerability of Jiangsu Province is better than Zhejiang Province. Second, on connectivity. The connectivity of Shanghai was the highest in the region, which made Shanghai the most important node of the information network in the YRD region. Aside from the relatively weak connection between Nanjing and Hangzhou, the connectivity between Shanghai, Suzhou, Nanjing, and Hangzhou were stronger than that any other city pairs, therefore making them the four basic pillars carrying the whole information network. The second group as composed of Yangzhou, Nantong, Changzhou, Wuxi, Jiaxing, Shaoxing, and Ningbo. Coupled with the top four, they constituted the Level 2 skeleton of network. Third, concerning integrated social vulnerability (SVIurban), the social vulnerability of cities in different hierarchies behaved differently. For Hierarchy 2, the SVIurban obviously decreased because their connectivity was sufficiently strong. The connectivity of cities in Hierarchy 3 was weaker than that of cities in Hierarchy 2, who had decreased their social vulnerability the most. The situation is the reverse for cities in Hierarchy 4 where the variation between SVInode and SVIurban in was slight. The city of Taizhou (J) even increased its social vulnerability after connecting to the network. Huzhou in Hierarchy 5 also increased its social vulnerability the most when adding connectivity in the social vulnerability assessment. Based on the results of our case study, a conclusion was drawn that network connectivity influenced social vulnerability. If only connectivity was strong enough, it could help cities mitigate their traditional social vulnerability, otherwise, a loose connection in the network aggregated their traditional social vulnerability. Hence, the latter should be the main emphasis of future urban risk management.
Our study also had limitations despite yielding interesting explorative results. First, our conceptual framework was simple and only provided a primary theoretical analysis of social vulnerability and connectivity. This should be further developed to reflect their complicated relationships in reality. Second, this paper only focused on the informational connection among cities, and would be better if physical connections of material networks, such as transports networks, logistics networks, or electricity network were added. Third, data availability is the biggest challenge in social vulnerability assessment in China. On one hand, it is time consuming to collect data; however, it was still difficult for us to obtain all of the required indicators even if much time was spent on data collection. As data limited our study, we only selected 16 cities and 19 indicators to measure social vulnerability in networks and to explore the relationship between social vulnerability and connectivity. Moving forward, our aim is to collect more samples and indicators in future works.
Acknowledgments
This study was financially supported by the National Natural Science Foundation of China (Grant No. 41571488 and Grant No. 41401382), National foundation of philosophy and social sciences, philosophical study on the climate science debates (Grant No. 13BZX029). Special thanks to the reviewers and the editors for their critical comments that greatly helped in improving the quality of this article.
Author Contributions
Yi Ge and Wen Dou contributed the materials; Wen Dou designed and performed the computer code of PPC model; Haibo Zhang analyzed the data; Yi Ge wrote the paper.
Conflicts of Interest
The authors declare no conflict of interest.
References
- Andrey, J.; Jones, B. The dynamic nature of social disadvantage: Implications for hazard exposure and vulnerability in Greater Vancouver. Can. Geogr. 2008, 1, 146–168. [Google Scholar] [CrossRef]
- Voskamp, I.M.; Van de Ven, F.H.M. Planning support system for climate adaptation: Composing effective sets of blue-green measures to reduce urban vulnerability to extreme weather events. Build. Environ. 2015, 83, 159–167. [Google Scholar] [CrossRef]
- Zhao, Y.; Wang, S.; Zhou, C. Science of the Total Environment Understanding the relation between urbanization and the eco-environment in China’s Yangtze River Delta using an improved EKC model and coupling analysis. Sci. Total Environ. 2016, 571, 862–875. [Google Scholar] [CrossRef] [PubMed]
- Gong, P.; Liang, S.; Carlton, E.J.; Jiang, Q.; Wu, J.; Wang, L. Urbanisation and health in China. NIH Public Access 2012, 379, 843–852. [Google Scholar] [CrossRef]
- Kasperson, J.; Kasperson, R.; Turner, B.; Schiller, A.; Hsieh, W. Vulnerability to global environmental change. In The Human Dimensions of Global Environmental Change; Diek-mann, A., Dietz, T., Jaeger, C., Rosa, E., Eds.; MIT Press: Cambridge, MA, USA, 2003. [Google Scholar]
- Su, S.; Pi, J.; Wan, C.; Li, H.; Xiao, R.; Li, B. Categorizing social vulnerability patterns in Chinese coastal cities. Ocean Coast. Manag. 2015, 116, 1–8. [Google Scholar] [CrossRef]
- Brooks, N.; Neil Adger, W.; Mick Kelly, P. The determinants of vulnerability and adaptive capacity at the national level and the implications for adaptation. Glob. Environ. Chang. 2005, 15, 151–163. [Google Scholar] [CrossRef]
- Adger, W.N. Vulnerability. Glob. Environ. Chang. 2006, 16, 268–281. [Google Scholar] [CrossRef]
- Cutter, S.L.; Finch, C. Temporal and spatial changes in social vulnerability to natural hazards. Proc. Natl. Acad. Sci. USA 2008, 7, 2301–2306. [Google Scholar] [CrossRef] [PubMed]
- King, R.A.R.; Blackmore, K.L. Physical and political boundaries as barriers to the continuity of social vulnerability. Appl. Geogr. 2013, 44, 79–87. [Google Scholar] [CrossRef]
- Lee, Y.-J. Social vulnerability indicators as a sustainable planning tool. Environ. Impact Assess. Rev. 2014, 44, 31–42. [Google Scholar] [CrossRef]
- Birkmann, J. Measuring vulnerability to promote disaster-resilient societies: Conceptual frameworks and definitions. In Measuring Vulnerability; United Nations University Press: New Delhi, India, 2006; pp. 9–54. [Google Scholar]
- Ciurean, R.L.; Schröter, D.; Glade, T. Conceptual Frameworks of Vulnerability Assessments for Natural Disasters Reduction. In Approaches to Disaster Management—Examining the Implications of Hazards, Emergencies and Disasters; InTech Open Access Publisher: Rijeka, Croatia, 2013. [Google Scholar]
- Füssel, H.-M. Vulnerability: A generally applicable conceptual framework for climate change research. Glob. Environ. Chang. 2007, 17, 155–167. [Google Scholar] [CrossRef]
- Li, X.; Zhou, Y.; Tian, B.; Kuang, R.; Wang, L. GIS-based methodology for erosion risk assessment of the muddy coast in the Yangtze Delta. Ocean Coast. Manag. 2015, 108, 97–108. [Google Scholar] [CrossRef]
- Janssen, M.A.; Schoon, M.L.; Ke, W.; Bo, K. Scholarly networks on resilience, vulnerability and adaptation within the human dimensions of global environmental change. Glob. Environ. Chang. 2006, 16, 240–252. [Google Scholar] [CrossRef]
- Vogel, C.; Moser, S.C.; Kasperson, R.E.; Dabelko, G.D. Linking vulnerability, adaptation, and resilience science to practice: Pathways, players, and partnerships. Glob. Environ. Chang. 2007, 17, 349–364. [Google Scholar] [CrossRef]
- Neil, L.; Conde, C.; Kulkarni, J.; Nyong, A.; Pulbin, J. Climate Change and Vulnerability; Earthscan: London, UK; Sterling, VA, USA, 2008. [Google Scholar]
- Ge, Y.; Zhang, H.; Dou, W.; Chen, W.; Liu, N.; Wang, Y.; Shi, Y.; Rao, W. Mapping Social Vulnerability to Air Pollution: A Case Study of the Yangtze River Delta Region, China. Sustainability 2017, 9, 109. [Google Scholar] [CrossRef]
- Ge, Y.; Dou, W.; Liu, N. Planning Resilient and Sustainable Cities: Identifying and Targeting Social Vulnerability to Climate Change. Sustainability 2017, 9. [Google Scholar] [CrossRef]
- Zhou, Y.; Li, N.; Wu, W.; Wu, J.; Shi, P. Local spatial and temporal factors influencing population and societal vulnerability to natural disasters. Risk Anal. 2014, 34, 614–639. [Google Scholar] [CrossRef] [PubMed]
- Cutter, S.L.; Boruff, B.J.; Shirley, W.L. Social Vulnerability to Environmental Hazards. Soc. Sci. Q. 2003, 84, 242–261. [Google Scholar] [CrossRef]
- Yenneti, K.; Tripathi, S.; Wei, Y.D.; Chen, W.; Joshi, G. The truly disadvantaged? Assessing social vulnerability to climate change in urban India. Habitat Int. 2016, 56, 124–135. [Google Scholar] [CrossRef]
- Wisner, B.; Blaikie, P.; Cannon, T.; Davis, I. At Risk: Natural Hazards, People’s Vulnerability, and Disasters, 2nd ed.; Routledge: London, UK, 2004. [Google Scholar]
- Singh, S.R.; Eghdami, M.R.; Singh, S. The Concept of Social Vulnerability: A Review from Disasters Perspectives. Int. J. Interdiscip. Multidiscip. Stud. 2014, 1, 71–82. [Google Scholar]
- Lee, Y.; Lin, S.; Chen, C. Mapping Cross-Boundary Climate Change Vulnerability—Case Study of the Hualien and Taitung Area, Taiwan. Sustainability 2016, 8, 64. [Google Scholar] [CrossRef]
- Few, R. Health and climatic hazards: Framing social research on vulnerability, response and adaptation. Glob. Environ. Chang. 2007, 17, 281–295. [Google Scholar] [CrossRef]
- Füssel, H.M.; Klein, R.J.T. Climate change vulnerability assessments: An evolution of conceptual thinking. Clim. Chang. 2006, 75, 301–329. [Google Scholar] [CrossRef]
- IPCC. Climate Change 2001: Impacts, Adaptation and Vulnerability; McCarthy, J.J., Canziani, O.F., Leary, N.A., Dokken, D.J., White, K.S., Eds.; Cambridge University Press: Cambridge, UK, 2001. [Google Scholar]
- Fellmann, T. The assessment of climate change-related vulnerability in the agricultural sector: Reviewing conceptual frameworks. Build. Resil. Adapt. Clim. Chang. Agric. Sect. 2012. [Google Scholar] [CrossRef]
- IPCC. Climate Change 2007: The Physical Science Basis; Solomon, S., Qin, D., Manning, M., Chen, Z., Marquis, M., Averyt, K.B., Tignor, M., Miller, H.L., Eds.; Cambridge University Press: Cambridge, UK, 2007. [Google Scholar]
- Brooks, N. Vulnerability, Risk and Adaptation: A Conceptual Framework; Tyndall Centre Working Paper No. 38; Tyndall Centre for Climate Change Research: Norwich, UK, 2003. [Google Scholar]
- Firman, T.; Surbakti, I.M.; Idroes, I.C.; Simarmata, H.A. Potential climate-change related vulnerabilities in Jakarta: Challenges and current status. Habitat Int. 2011, 35, 372–378. [Google Scholar] [CrossRef]
- Nahiduzzaman, K.M.; Aldosary, A.S.; Rahman, M.T. Flood induced vulnerability in strategic plan making process of Riyadh city. Habitat Int. 2015, 49, 375–385. [Google Scholar] [CrossRef]
- Blaikie, P.; Cannon, T.; Davis, I.; Wisner, B. At Risk: Natural Hazards, People’s Vulnerability, and Disasters; Routledge: London, UK, 1994. [Google Scholar]
- Cutter, S.L. Vulnerability to environmental hazards. Prog. Hum. Geogr. 1996, 20, 529–539. [Google Scholar] [CrossRef]
- Turner, B.L., II; Kasperson, R.E.; Matson, P.A.; Mccarthy, J.J.; Corell, R.W.; Christensen, L.; Eckley, N.; Kasperson, J.X.; Luers, A.; Martello, M.L.; et al. A framework for vulnerability analysis in sustainability science. Proc. Natl. Acad. Sci. USA 2003, 100, 8074–8079. [Google Scholar] [CrossRef] [PubMed]
- Jahre, M.; Fabbe-Costes, N. Adaptation and adaptability in logistics networks. Int. J. Logist. Res. Appl. 2005, 8, 143–157. [Google Scholar] [CrossRef]
- O’Brien, K.L.; Leichenko, R.; Kelkarc, U.; Venemad, H.; Aandahl, G.; Tompkins, H.; Javed, A.; Bhadwal, S.; Barg, S.; Nygaard, L.; et al. Mapping vulnerability to multiple stressors: Climate change and globalization in India. Glob. Environ. Chang. 2004, 14, 303–313. [Google Scholar] [CrossRef]
- Chen, W.; Cutter, S.L.; Emrich, C.T.; Shi, P. Measuring social vulnerability to natural hazards in the Yangtze River Delta region, China. Int. J. Disaster Risk Sci. 2013, 4, 169–181. [Google Scholar] [CrossRef]
- Birkmann, J.; Cardona, O.D.; Carreño, M.L.; Barbat, A.H.; Pelling, M.; Schneiderbauer, S.; Kienberger, S.; Keiler, M.; Alexander, D.; Zeil, P.; Welle, T. Framing vulnerability, risk and societal responses: The MOVE framework. Nat. Hazards 2013, 67, 193–211. [Google Scholar] [CrossRef]
- Maria, B.; Hummell, D.L.; Cutter, S.L.; Emrich, C.T. Social Vulnerability to Natural Hazards in Brazil. Int. J. Disaster Risk Sci. 2016, 7, 111–122. [Google Scholar]
- Cutter, S.L.; Emrich, C.T.; Webb, J.J.; Morath, D. Social Vulnerability to Climate the Literature Social Vulnerability to Climate Literature; Final Report to Oxfam America; University of South Carolina: Columbia, SC, USA, 2009; pp. 1–44. [Google Scholar]
- Stafford, S.; Abramowitz, J. An analysis of methods for identifying social vulnerability to climate change and sea level rise: A case study of Hampton Roads, Virginia. Nat. Hazards 2017, 85, 1089–1117. [Google Scholar] [CrossRef]
- Choi, J.H.; Barnett, G.A.; Chon, B.S. Comparing world city networks: A network analysis of Internet backbone and air transport intercity linkages. Glob. Netw. 2006, 6, 81–99. [Google Scholar] [CrossRef]
- Keiner, M.; Kim, A. Transnational City Networks for Sustainability Transnational City Networks for Sustainability. Eur. Plan. Stud. 2006, 15, 1369–1395. [Google Scholar] [CrossRef]
- Auria, A.J.D. City networks and sustainability—The role of knowledge and of cultural heritage in globalization. Int. J. Sustain. High. Educ. 2001, 2, 38–47. [Google Scholar] [CrossRef]
- Feng, Z.; Xia, W.; Jun, Y.I.N.; Min, Z. An Empirical Study on Chinese City Network Pattern Based on Producer Services. Chin. Geogr. Sci. 2013, 23, 274–285. [Google Scholar]
- Boulton, A.; Devriendt, L.; Brunn, S.; Derudder, B.; Witlox, F. City networks in cyberspace and time: Using Google hyperlinks to measure global economic and environmental crises. In ICTs for Mobile and Ubiquitous Urban Infrastructures: Surveillance, Locative Media and Global Networks; Firmino, R.J., Duarte, F., Ultramari, C., Eds.; IGI Global: Hershey, PA, USA, 2011; pp. 67–87. [Google Scholar]
- Castells, M. Urban Geography Grassrooting the Space of Flows Grassrooting the Space of Flows. Urban Geogr. 2017, 20, 294–302. [Google Scholar] [CrossRef]
- Zhao, J.; Song, Y.; Shi, L.; Tang, L. Study on the compactness assessment model of urban spatial form. Shengtai Xuebao Acta Ecol. Sin. 2011, 31, 6338–6343. [Google Scholar]
- Zakour, M.J.; Gillespie, D.F. Community Disaster Vulnerability: Theory, Research, and Practice; Springer Science & Business Media: New York, NY, USA, 2013. [Google Scholar]
- McEntire, D.A. Coordinating multi-organizational responses to disaster: Lessons from the 28 March 2000, Fort Worth Tornado. Disaster Prev. Manag. 2002, 11, 369–379. [Google Scholar] [CrossRef]
- Andrew, S.; Arlikatti, S.; Siebeneck, L.; Pongponrat, K.; Jaikampan, K. Sources of organisational resiliency during the Thailand floods of 2011: A test of the bonding and bridging hypotheses. Disasters 2016, 40, 65–84. [Google Scholar] [CrossRef] [PubMed]
- Xiong, L.; Zhen, F.; Wang, B.; Xi, G. The Research of the Yangtze River Delta Core Area’s City Network Characteristics Based on Baidu Index. Econ. Geogr. 2013, 33, 67–73. [Google Scholar]
- Xu, X.; Tan, Y.; Chen, S.; Yang, G.; Su, W. Urban Household Carbon Emission and Contributing Factors in the Yangtze River. PLoS ONE 2015, 10, e0121604. [Google Scholar] [CrossRef] [PubMed]
- Gu, C.; Hu, L.; Zhang, X.; Wang, X.; Guo, J. Climate change and urbanization in the Yangtze River Delta q. Habitat Int. 2011, 35, 544–552. [Google Scholar] [CrossRef]
- Colldahl, C.; Kelemen, J.E. Smart Cities: Strategic Sustainable Development for an Urban World. Master’s Thesis, School of Engineering, Blekinge Institute of Technology, Karlskrona, Sweden, 2013. [Google Scholar]
- Baidu Index. Available online: https://zhishu.baidu.com/ (accessed on 21 September 2017).
- Yu, X.; Wu, X. The Research of the Northeast Region City Network Characteristics Based on Baidu Index. Nat. Sci. J. Harbin Norm. Univ. 2015, 31, 114–118. [Google Scholar]
- Jiang, D.; Sun, Y.; Yang, T.; Ren, H.; Chen, Y.; Fu, Y.; Zhang, Z. Regional Disparity in the Network Attention of China to Southeast Asia Based on Baidu Index. Trop. Geogr. 2105, 35, 708–718. [Google Scholar]
- Chen, Z.; Zhao, Y.; Chen, Q. The Network Connectivity of Urban Agglomerations in the Middle Reaches of Yangtze River Based on Baidu Index. Mod. City 2016, 11, 34–39. [Google Scholar]
- Quantum GIS Development Team. Quantum GIS Geographic Information System 2009. Available online: http://qgis.org (accessed on 17 September 2017).
Figure 1.
A new conceptual framework for social vulnerability from a network perspective.

Figure 2.
An example of vulnerability dimensions illustrated from a network perspective.

Figure 3.
The Yangtze River Delta, China: geographic location and cities.
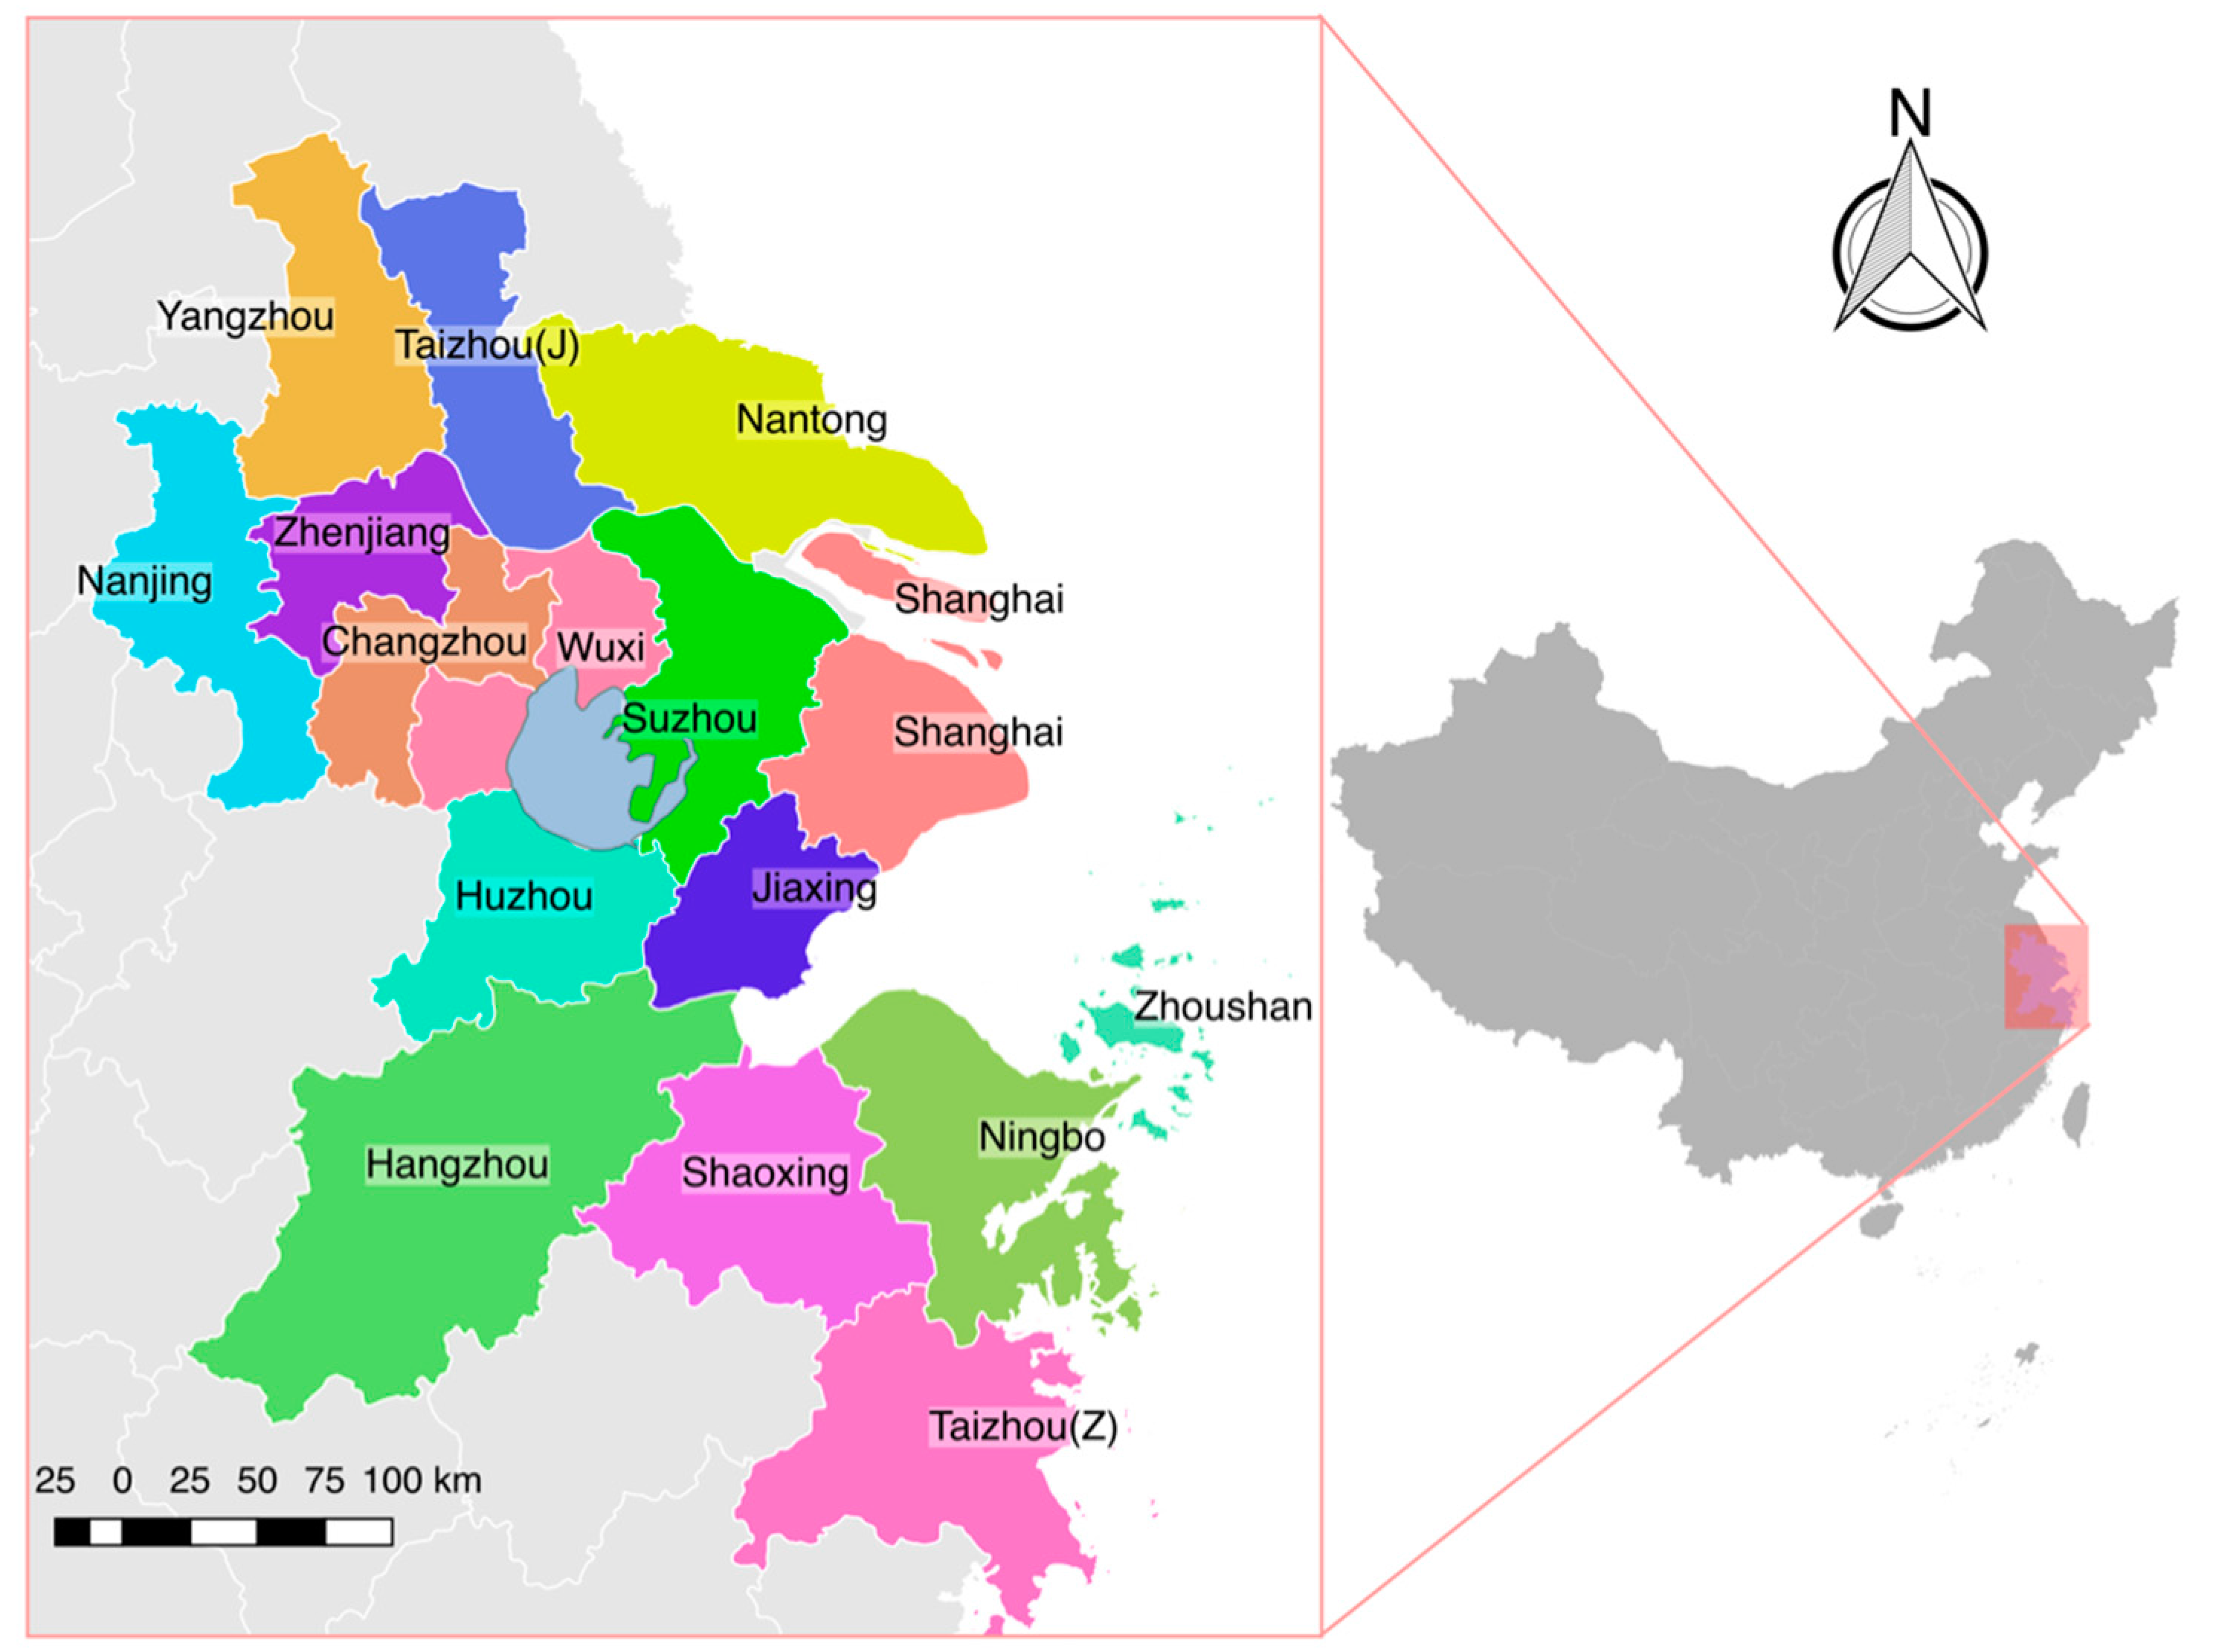
Figure 4.
Method for assessing urban social vulnerability from a network perspective.
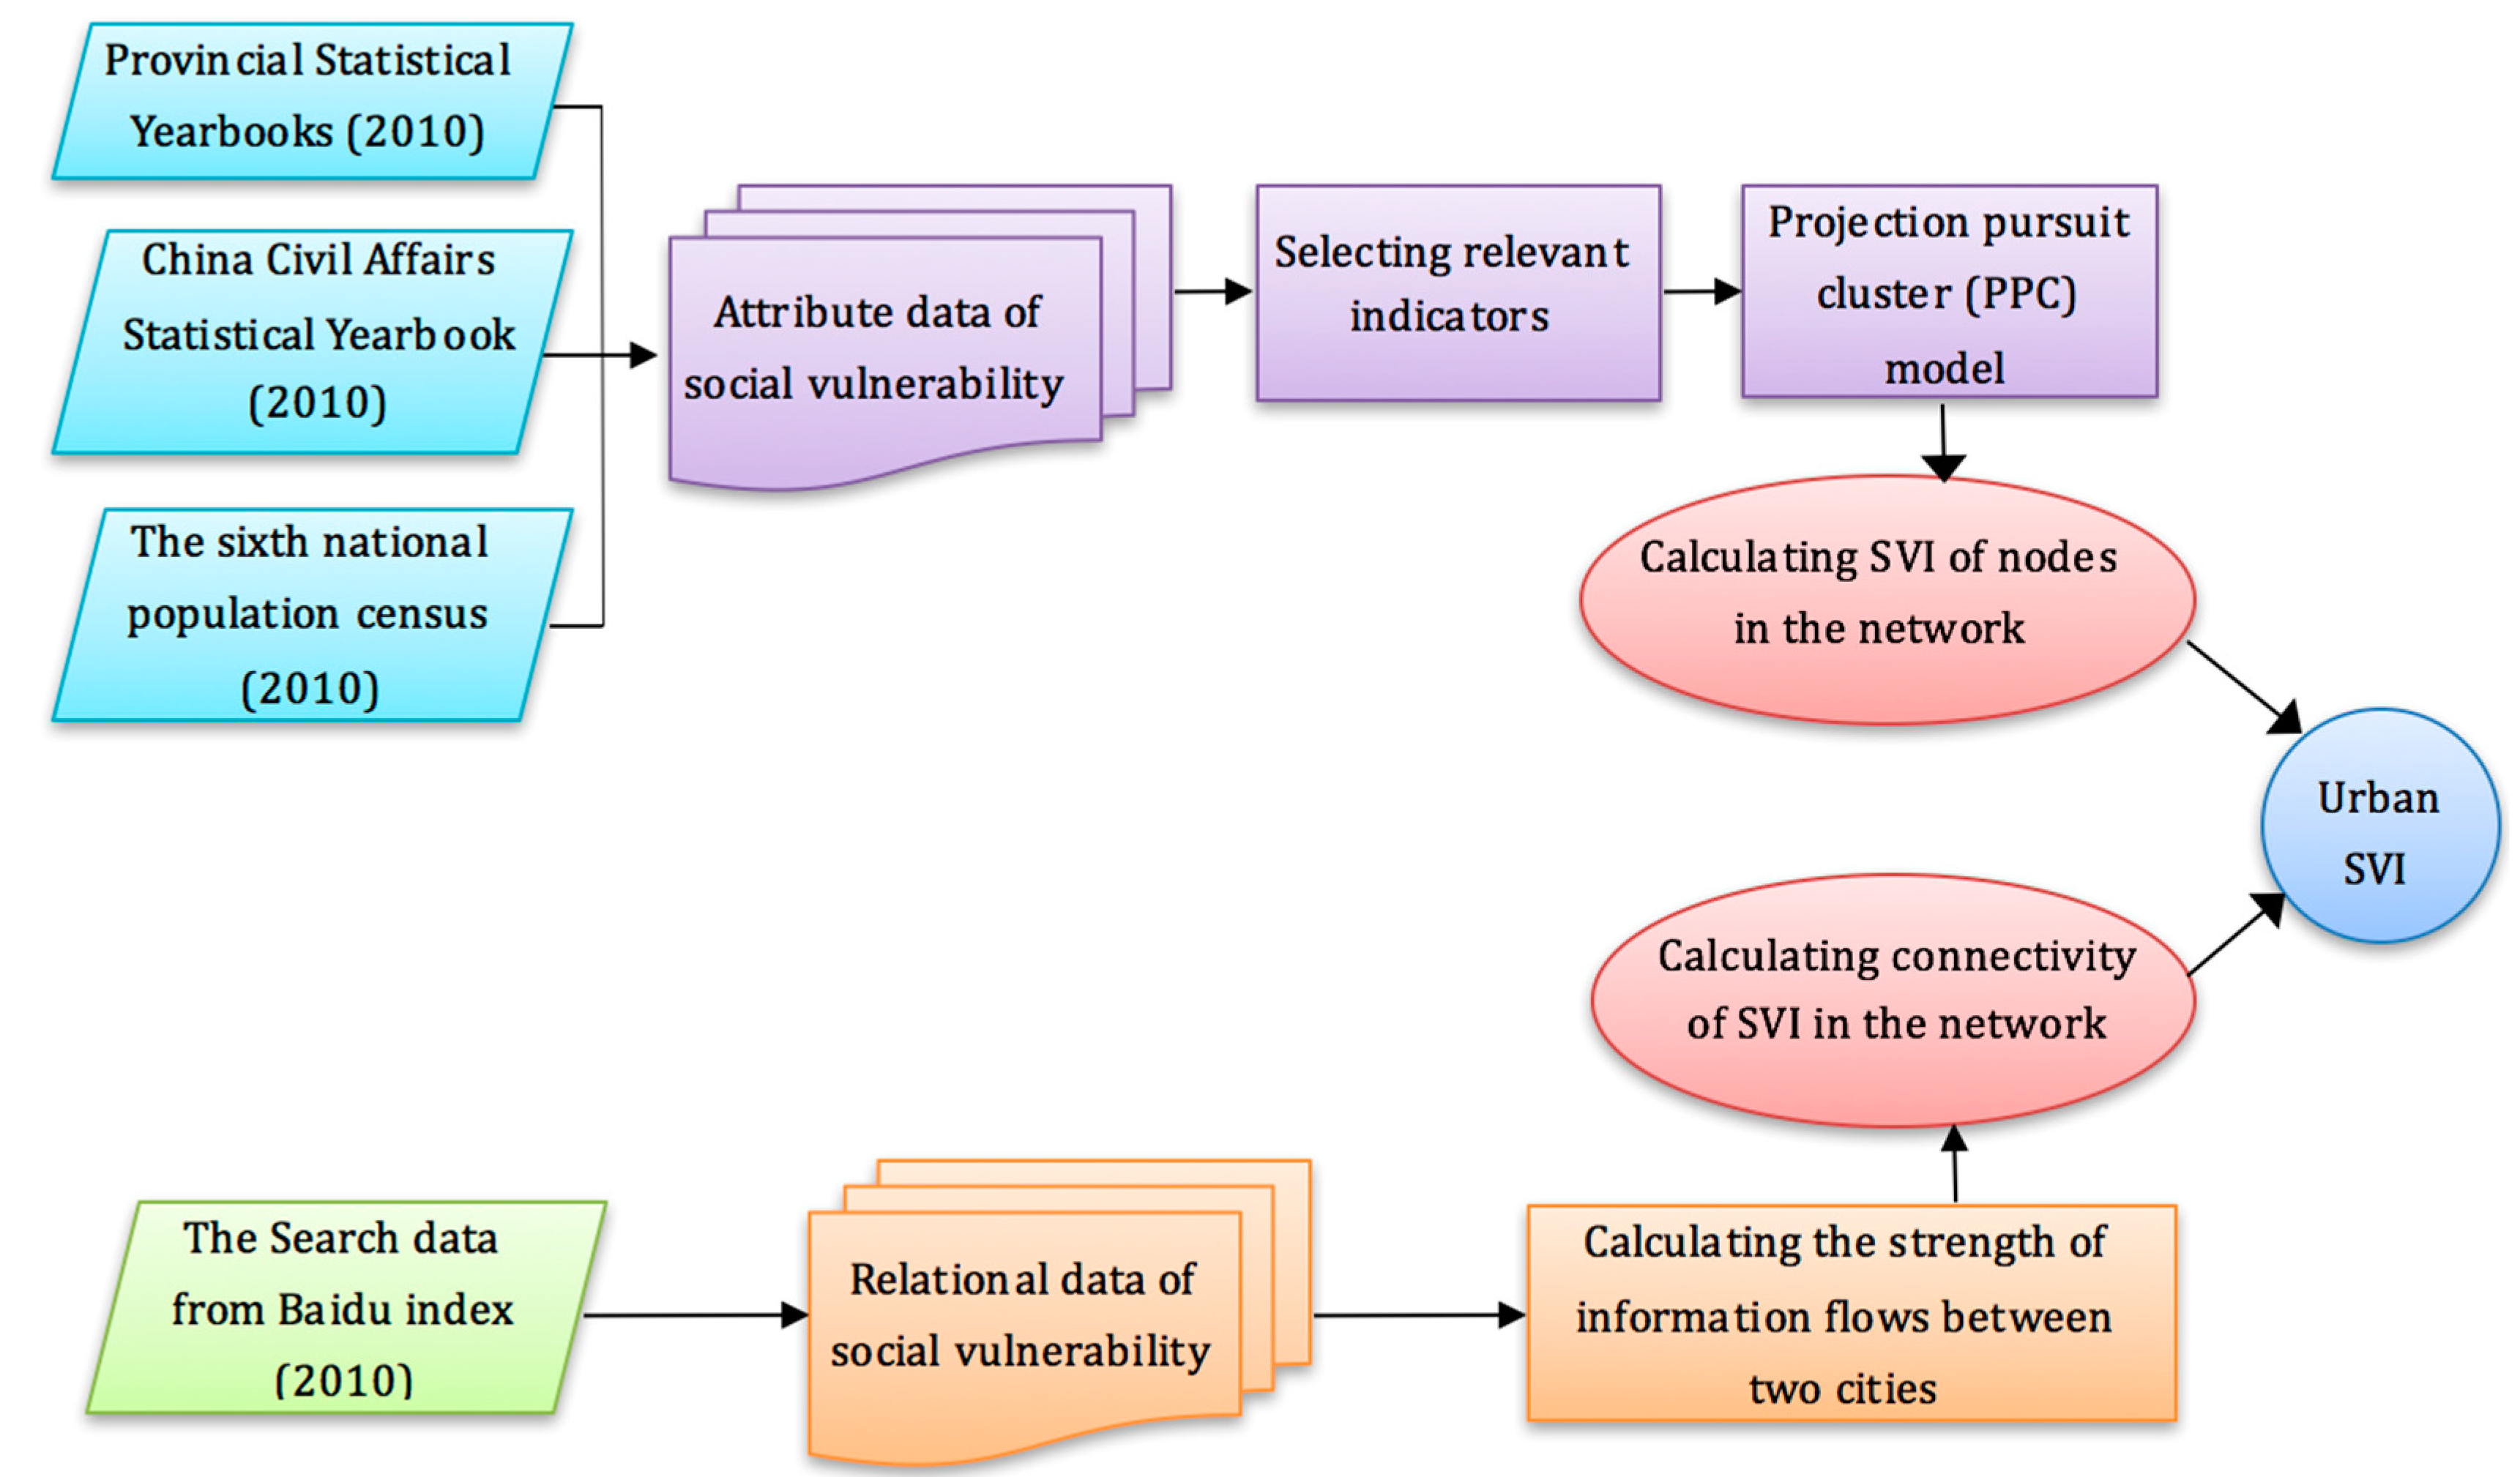
Figure 5.
Spatial distribution of connectivity in the YRD region.

Figure 6.
Spatial pattern of SVInode (left) and SVIurban (right) at the city-scale in the YRD region.
Figure 6.
Spatial pattern of SVInode (left) and SVIurban (right) at the city-scale in the YRD region.
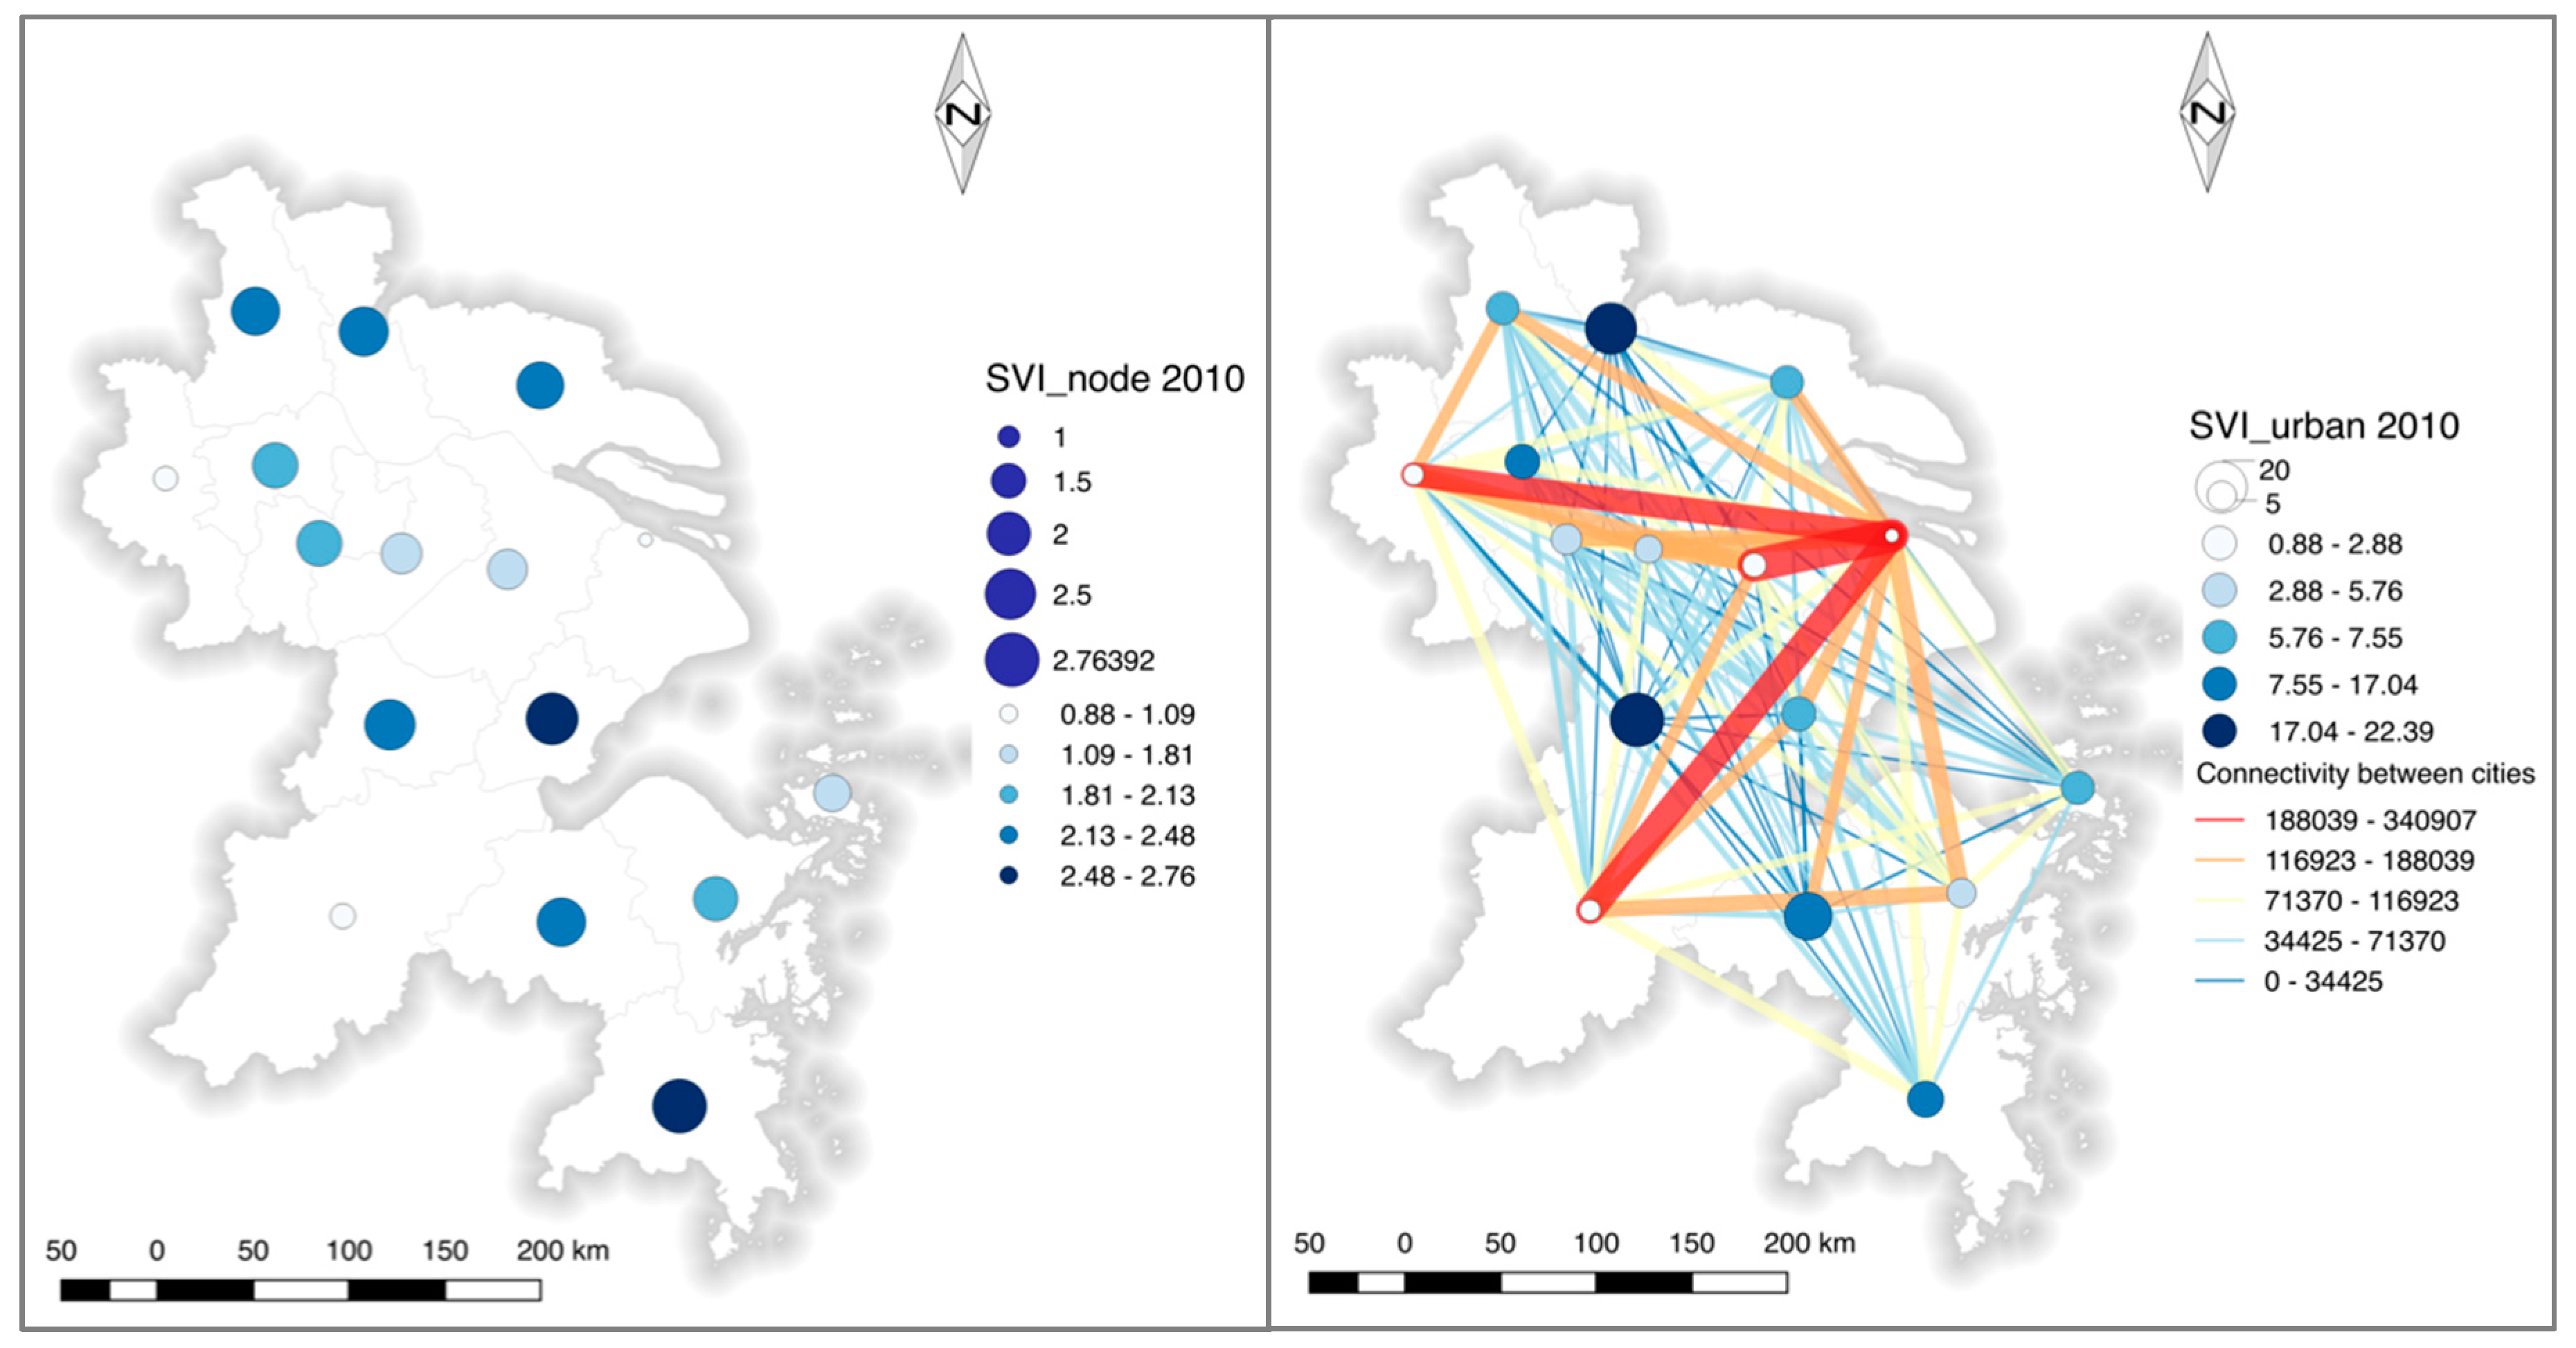
Figure 7.
Differences between SVInode and SVIurban of cities in the YRD region.


Table 1.
General statistics of cities in the Yangtze River Delta (YRD) region (2010).
| City | Province | Urbanization (%) | Population (Million) | Land Area (sq. km2) | Population Density (People Per km2) | GDP (Billion Yuan) | GDP Per Capita (Yuan) |
|---|---|---|---|---|---|---|---|
| Shanghai | Shanghai | 89.30 | 23.47 | 6341 | 3632 | 1716.60 | 76,074 |
| Nanjing | Jiangsu | 77.94 | 8.01 | 6587 | 960 | 513.07 | 65,273 |
| Hangzhou | Zhejiang | 73.25 | 8.71 | 16,596 | 524 | 594.92 | 86,691 |
| Wuxi | Jiangsu | 70.31 | 6.38 | 4627 | 1008 | 579.33 | 92,167 |
| Suzhou | Jiangsu | 70.07 | 10.47 | 8488 | 751 | 922.89 | 93,043 |
| Ningbo | Zhejiang | 68.31 | 7.61 | 9816 | 775 | 516.30 | 90,175 |
| Zhoushan | Zhejiang | 63.59 | 1.12 | 1440 | 672 | 64.43 | 66,581 |
| Changzhou | Jiangsu | 63.17 | 4.59 | 4372 | 825 | 304.49 | 67,327 |
| Zhenjiang | Jiangsu | 61.97 | 3.12 | 3847 | 704 | 198.76 | 64,284 |
| Shaoxing | Zhejiang | 58.58 | 4.91 | 8279 | 530 | 279.52 | 63,770 |
| Yangzhou | Jiangsu | 56.75 | 4.46 | 6591 | 697 | 222.95 | 49,786 |
| Nantong | Jiangsu | 55.80 | 7.28 | 8001 | 954 | 346.57 | 48,083 |
| Taizhou | Jiangsu | 55.64 | 4.62 | 5787 | 872 | 204.87 | 44,118 |
| Taizhou | Zhejiang | 55.54 | 5.97 | 9411 | 620 | 242.65 | 41,777 |
| Jiaxing | Zhejiang | 53.33 | 4.51 | 3915 | 873 | 230.02 | 67,534 |
| Huzhou | Zhejiang | 52.89 | 2.89 | 5818 | 447 | 130.17 | 50,149 |
| The YRD region | 57.19 | 102.15 | 100,505 | 1016 | 6824.89 | 68,337 | |
| The country | 49.95 | 1340.91 | 9,600,000 | 140 | 40,151.28 | 30,015 | |
Table 2.
General information regarding connectivity of cities in the YRD region.
| City | Connectivity | Connectivity Structure | |||||
|---|---|---|---|---|---|---|---|
| Flow-In | Flow-In (%) | Flow-Out | Flow-Out (%) | Itself | Itself (%) | ||
| Shanghai | 2,456,274 | 1,012,732 | 28.6 | 1,443,542 | 40.8 | 1,085,578 | 30.6 |
| Suzhou | 1,552,866 | 764,621 | 34.9 | 788,245 | 36.0 | 638,744 | 29.1 |
| Nanjing | 1,482,085 | 817,798 | 41.5 | 664,287 | 33.7 | 487,696 | 24.8 |
| Hangzhou | 1,466,046 | 774,536 | 39.5 | 691,510 | 35.2 | 496,902 | 25.3 |
| Ningbo | 1,110,875 | 581,852 | 39.8 | 529,023 | 36.2 | 352,219 | 24.0 |
| Wuxi | 1,119,289 | 624,139 | 43.2 | 495,150 | 34.3 | 326,154 | 22.5 |
| Changzhou | 999,329 | 592,878 | 45.2 | 406,451 | 31.0 | 310,951 | 23.8 |
| Jiaxing | 915,068 | 488,300 | 40.0 | 426,768 | 35.0 | 304,749 | 25.0 |
| Yangzhou | 903,912 | 555,265 | 46.4 | 348,647 | 29.1 | 293,219 | 24.5 |
| Nantong | 891,827 | 518,189 | 45.1 | 373,638 | 32.5 | 256,739 | 22.4 |
| Taizhou (Z) | 834,969 | 452,718 | 40.7 | 382,251 | 34.4 | 277,772 | 24.9 |
| Zhenjiang | 782,454 | 433,599 | 45.8 | 348,855 | 36.8 | 164,911 | 17.4 |
| Zhoushan | 685,121 | 443,720 | 55.3 | 241,401 | 30.1 | 117,048 | 14.6 |
| Shaoxing | 487,174 | 65,708 | 13.5 | 421,466 | 86.5 | 0 | 0.0 |
| Taizhou (J) | 417,266 | 64,938 | 15.6 | 352,328 | 84.4 | 0 | 0.0 |
| Huzhou | 392,207 | 57,388 | 14.6 | 334,819 | 85.4 | 0 | 0.0 |
Table 3.
Statistics of differences between the SVInode and SVIurban of cities in the YRD region.
| No. | City | Province | Hierarchy | SVInode | SVIurban | Variation |
|---|---|---|---|---|---|---|
| 1 | Shanghai | Shanghai | 1 | 0.0000 | 0.0000 | 0.0% |
| 1 | Suzhou | Jiangsu | 2 | 0.4771 | 0.0927 | −80.6% |
| 2 | Hangzhou | Zhejiang | 2 | 0.1093 | 0.0503 | −54.0% |
| 3 | Nanjing | Jiangsu | 2 | 0.0943 | 0.0476 | −49.5% |
| Mean value: | 0.2269 | 0.0635 | −61.3% | |||
| 1 | Ningbo | Zhejiang | 3 | 0.6258 | 0.1908 | −69.5% |
| 2 | Wuxi | Jiangsu | 3 | 0.4918 | 0.1649 | −66.5% |
| 3 | Jiaxing | Zhejiang | 3 | 0.9128 | 0.3099 | −66.1% |
| 4 | Changzhou | Jiangsu | 3 | 0.6642 | 0.2269 | −65.8% |
| 5 | Yangzhou | Jiangsu | 3 | 0.7604 | 0.2771 | −63.6% |
| 6 | Taizhou (Z) | Zhejiang | 3 | 1.0000 | 0.3679 | −63.2% |
| 7 | Nantong | Jiangsu | 3 | 0.7214 | 0.2801 | −61.2% |
| 8 | Zhenjiang | Jiangsu | 3 | 0.6610 | 0.3286 | −50.3% |
| Mean value: | 0.7297 | 0.2683 | −63.3% | |||
| 1 | Zhoushan | Zhejiang | 4 | 0.3848 | 0.2889 | −24.9% |
| 2 | Shaoxing | Zhejiang | 4 | 0.7762 | 0.7509 | −3.3% |
| 3 | Taizhou (J) | Jiangsu | 4 | 0.8029 | 0.9034 | 12.5% |
| Mean value: | 0.6546 | 0.6477 | −5.2% | |||
| 1 | Huzhou | Zhejiang | 5 | 0.8488 | 1.0000 | 17.8% |
© 2017 by the authors. Licensee MDPI, Basel, Switzerland. This article is an open access article distributed under the terms and conditions of the Creative Commons Attribution (CC BY) license (http://creativecommons.org/licenses/by/4.0/).
Share and Cite
MDPI and ACS Style
Ge, Y.; Dou, W.; Zhang, H. A New Framework for Understanding Urban Social Vulnerability from a Network Perspective. Sustainability 2017, 9, 1723. https://doi.org/10.3390/su9101723
AMA Style
Ge Y, Dou W, Zhang H. A New Framework for Understanding Urban Social Vulnerability from a Network Perspective. Sustainability. 2017; 9(10):1723. https://doi.org/10.3390/su9101723
Chicago/Turabian StyleGe, Yi, Wen Dou, and Haibo Zhang. 2017. "A New Framework for Understanding Urban Social Vulnerability from a Network Perspective" Sustainability 9, no. 10: 1723. https://doi.org/10.3390/su9101723
Note that from the first issue of 2016, this journal uses article numbers instead of page numbers. See further details here.