Marcellus Shale Fracking and Susquehanna River Stakeholder Attitudes: A Five-Year Update


The Sigmund Weis School of Business, Susquehanna University, Selinsgrove, PA 17870, USA
*
Author to whom correspondence should be addressed.
Sustainability 2017, 9(10), 1713; https://doi.org/10.3390/su9101713
Submission received: 7 September 2017
/
Revised: 7 September 2017
/
Accepted: 20 September 2017
/
Published: 25 September 2017
Abstract
:The attitudes of Susquehanna River stakeholders regarding natural gas hydraulic fracturing (fracking) in the Marcellus Shale region reflect differing concerns on economic, social, and environmental issues based on gender, education level, and income. The focus on the U.S. State of Pennsylvania section of the Susquehanna River derives from the U.S. States of New York and Maryland, neighbors of Pennsylvania to the immediate north and south, respectively, enacting bans on fracking, while Pennsylvania has catapulted, through Marcellus fracking, to become the second largest natural gas producing state in the U.S. In this Pennsylvania survey, female and more highly educated stakeholders favor a moratorium on fracking, while males and lower income stakeholders support fracking. Of the four categories used to organize the survey, i.e. economic opportunity, health and safety, communities, and energy security, the category of health and safety ranked first in both the 2012 and 2017 survey.
1. Introduction
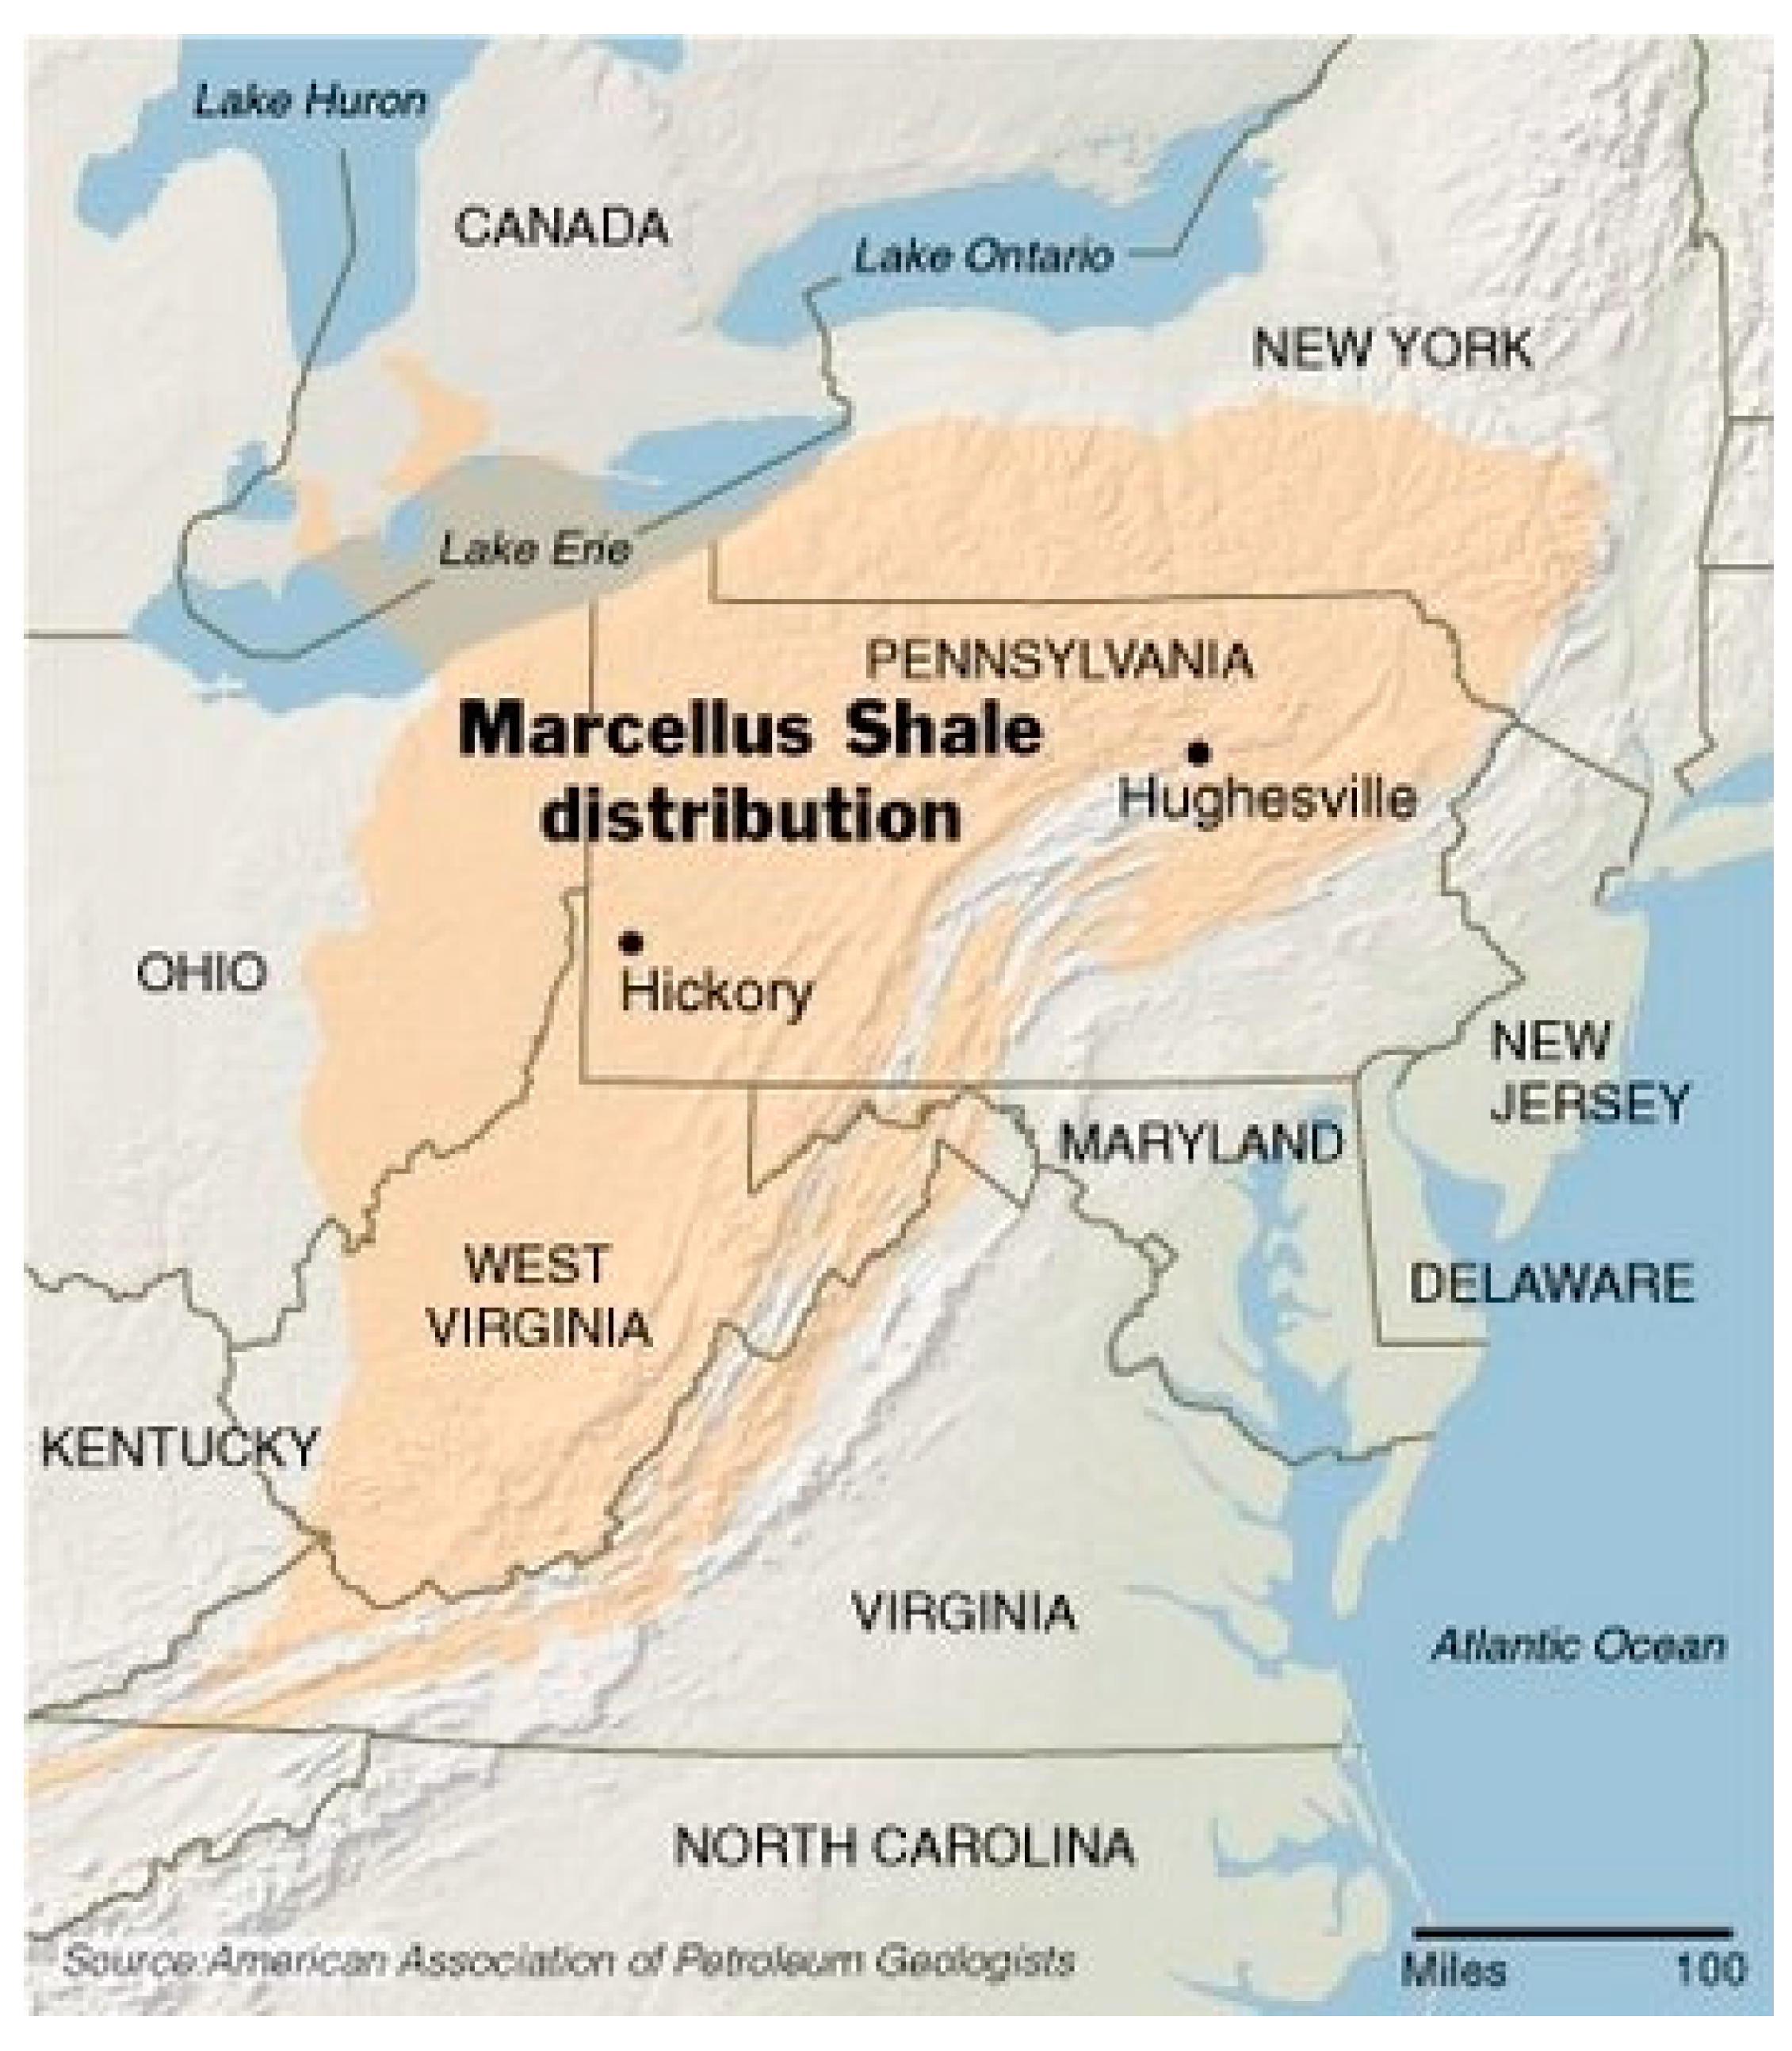
“Stuck in the Middle With You” [1], that old 1970s tune, sums up the attitudes of many Pennsylvanians about natural gas hydraulic fracturing (“fracking”). Instead of “clowns to the left of me and jokers to the right”, New York to the north and Maryland to the south share natural gas deposits in the Marcellus Shale rock formation with Pennsylvania [2] (Figure 1), but disagree with Pennsylvania on what to do with it. Both New York and Maryland have banned fracking [3], while Pennsylvania has catapulted to the second largest natural gas producing state in U.S., according to the U.S. Energy Information Administration (EIA) [4].
In this research paper, we present the results of a survey about stakeholder attitudes regarding the economic, social, and environmental impact of Marcellus Shale development in the Susquehanna River Basin area of Pennsylvania. This effort replicates a 2012 survey conducted at a time when many residents of the region knew relatively little about natural gas fracking [5]. The impetus for repeating the survey was the ongoing turbulence in the Susquehanna River Basin where fracking occurs. This turbulence is due to large-scale increases in gas production volume in Pennsylvania in 2015 [6] followed by a layoff of a third of the Pennsylvania natural gas workforce in 2016 [7], mounting stakeholder concerns about plans for pipelines crisscrossing Pennsylvania to support natural gas shipments to the Eastern seaboard and abroad [8], and initial studies suggesting deleterious health impacts from fracking [9]. The global implications of shale gas drilling in the Marcellus Shale is underscored by the fact that the U.S. is the only nation to produce shale gas commercially on a large scale, despite 41 other nations with large scale reserves. Given that 73.5 percent of gas is traded, the pipelines, either planned or in construction, ensure a continued focus on shale gas production from the Marcellus Shale [10].
The focus on the Susquehanna River Basin as a major ecosystem and source of drinking water in the midst of the Marcellus Shale rock formation, as a highly productive source of natural gas fracking, juxtaposes two divergent theories and drivers of human activity and motivation. First, Coase, in his seminal article entitled The Problem of Social Cost [11], identified the focus of firm behavior on externalizing costs of using or impacting public goods and internalizing profits. Marcellus fracking represents the third generation of industry externalizing environmental and social costs, while internalizing profits. The Marcellus Shale region in Pennsylvania differs from New York and Maryland due to two previous episodes of resource extraction which primarily impacted Pennsylvania. In the 18th century, lumber companies clear cut trees within hauling distance of the Susquehanna River in order to float logs to the Eastern seaboard for supporting construction of growing cities. More recently, coal was mined for generations before the exhausted mines were abandoned and Susquehanna River Basin streams were impacted with ongoing acid mine drainage [5]. Thus, the exposure to firms externalizing the costs of public goods and internalizing profits has an institutional aspect to it, in which coercion from industry and government is begrudgingly recognized, if not accepted. Scott [12] notes that institutional behavior involving a powerful firm or industry often takes the form of coercion in order to maintain institutional practices. The institutionalization of the coercion involving industry and state government is evident in the passage of Act 13, which, among other matters, largely removed zoning decisions about industrial activity from local governments.
As the scale and scope of natural gas fracking, as well as its long term impact, became clearer, incipient signs of social movement organizations opposed to natural gas fracking became evident. Nowhere was this more evident than with water management issues involving the Susquehanna River Basin because of the millions of gallons of water required for each fracking effort, as opposed to the dependence of Susquehanna River Basin citizens on drinking water from the Susquehanna River. Kriesi [13] notes that social movement organizations’ involvement in environmental issues tend to institutionalize more than most other social movements, suggesting that incipient evidence of social movement organizations in the Marcellus Shale region may develop into a broader based effort with organizational ties beyond the Marcellus Shale and the Susquehanna River Basin.
Thus, the focus on the Susquehanna River Basin in this survey seeks to identify stakeholder attitudes regarding support, or at least acquiescence, to the institutionalized coercion by industry and government for natural gas fracking, as well as the formation of social movements opposed to natural gas fracking because of existential threats to drinking water and other health threats. From the perspective of institutional theory, a forceful argument can be made that the ecosystem encompassing the Marcellus Shale region is the most “contested organizational field” [14] in the eastern United States, given ongoing opposition to natural gas pipelines, as well as the expected continuation Marcellus fracking to support exports for many years to come. Hardy and McGuire [15] integrate social movement theory with neo-institutionalism and note that the integration of social movements in neo-institutionalism provides a context for explaining scenarios in contested fields in which alternatives to the dominant ideology and processes of embedded incumbents can be challenged by social movements. For these reasons, we believe the survey of stakeholder attitudes in the Susquehanna River Basin provides useful insights into how the economic power of organizations motivated to externalize the cost of public goods, which now extends ironically to massive political lobbying efforts, can lead to the possible motivation of citizens in the very conservative and normally passive Susquehanna River Basin to form social movement organizations.
Consistent with the 2012 survey, this survey again focuses on stakeholders in the Susquehanna River Basin, of which the Marcellus Shale (Figure 1 and Figure 2) underlies 85 percent. In the 2017 survey, nearly 70 percent of respondents live 10 miles or less from the Susquehanna River and nearly two-thirds work within 10 miles of the river. This proximity of respondents to the Susquehanna River is intentional. A major purpose of this survey research is to understand stakeholder attitudes and perceptions about the Susquehanna River as it pertains to fracking. Consistent with Evensen and Stedman [16], the attitudes and perceptions of respondents in the immediate locale of the object of study may be significantly different from the attitudes of respondents further away, but still even in the same state (or province). More specifically, Evensen and Stedman [16] found differences in attitudes and perceptions regarding fracking from respondents living in the Marcellus Shale area when compared to respondents outside the area. They also found that given the sparse population of the Marcellus Shale Region, survey methodology had to be adjusted when compared to more urban areas. Similarly, we found that, to receive a cross-sector (business, government and nonprofit) sample of stakeholder responses in the 2012 survey, we needed to contact all groups repetitively, across the full spectrum of organization types, purposes and ideological beliefs, as well as request additional email addresses. As Evensen and Stedman [16] conclude, a larger, perhaps statewide, survey would drown out responses of the very stakeholders we focused upon.
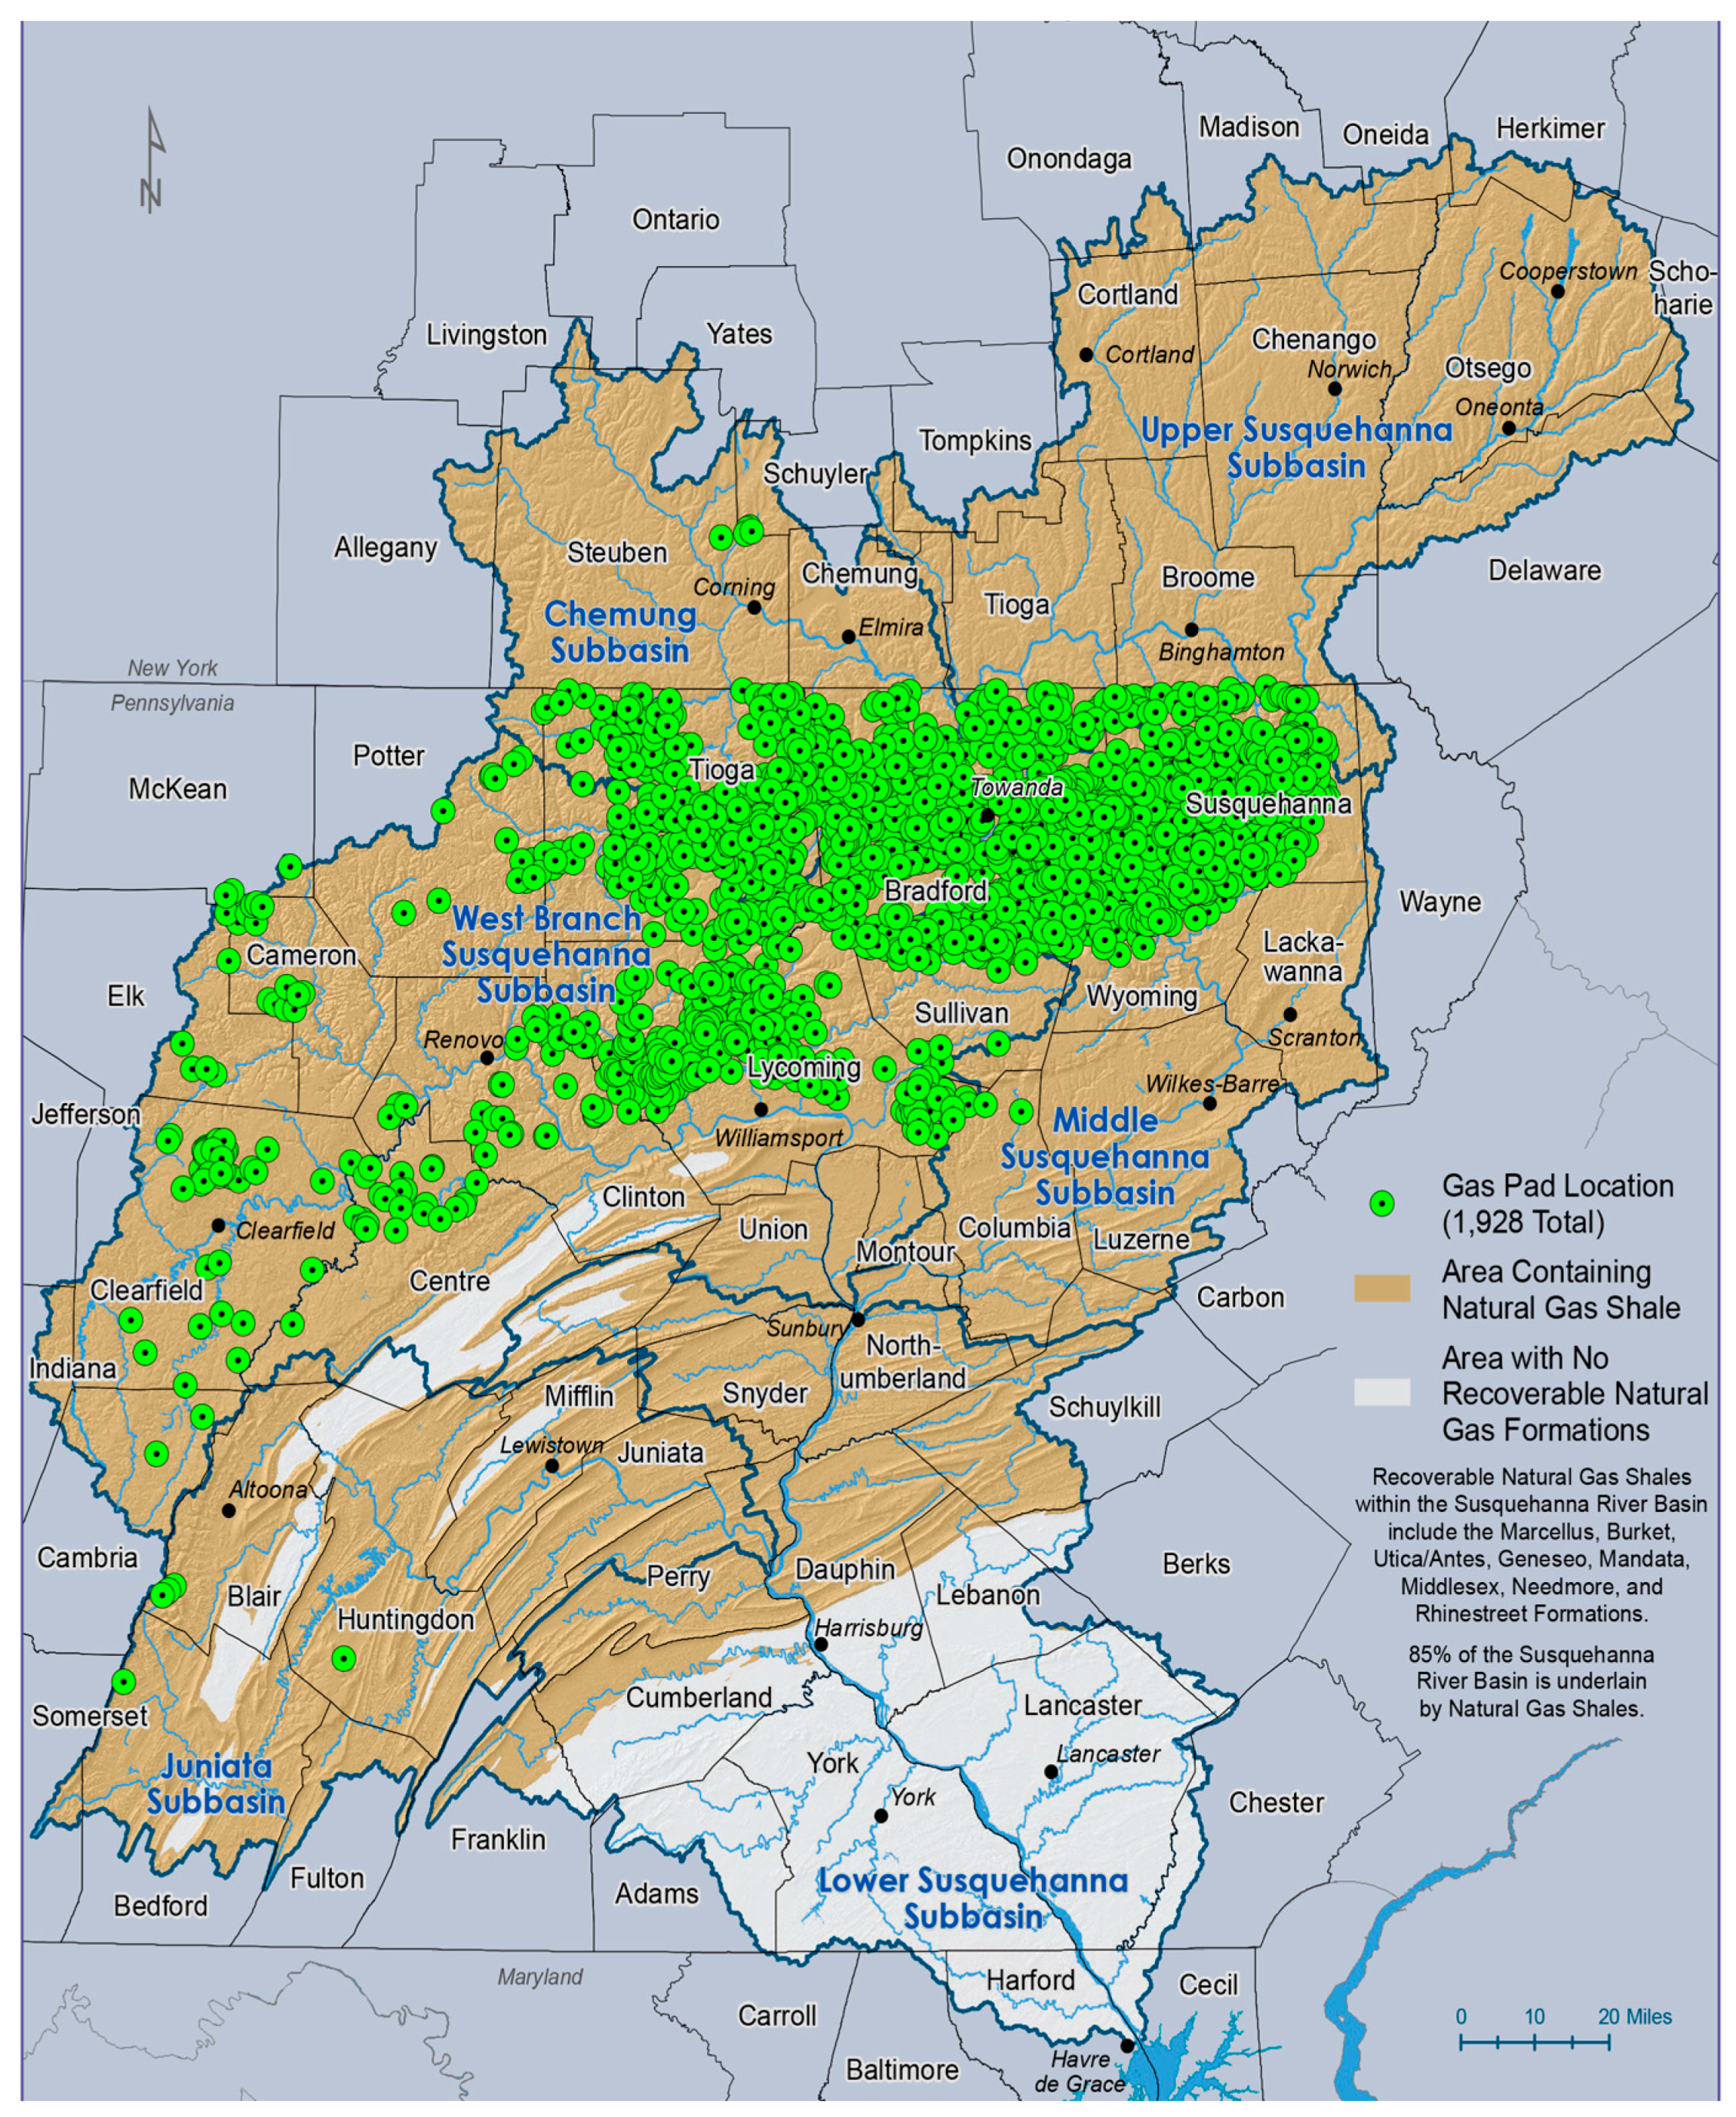
While the Susquehanna River Basin, which extends from its source in Cooperstown, New York, south to Havre de Grace, Maryland, is by no means the only area where fracking occurs, it merits specific attention for several reasons. First, the highest concentration of fracked wells occurs in the Basin (Figure 3). The Susquehanna River Basin is in essence “the canary in the coal mine”. If the rapid depletion of fracked well production after the first year and the predictions for growing demand to support natural gas pipeline shipments globally hold sway, the Basin is only in the early stages of development and thousands more wells will be drilled and fracked [17]. Conversely, if technological innovations lead to increased production from refracturing existing wells, then the industrialization of the Susquehanna River Basin could be reduced [18]. The “canary in the coal mine” reality is that innovation in techniques leading to greater efficiencies and possible reductions in environmental footprints occur with a “learning as you go” approach. This leaves residents of the area in a perpetual watchful waiting mode, hopeful for improved social and environmental conditions before social and environmental problems strike close to home with permanent degradation. Meanwhile, Pennsylvania continues on as the second highest producing state of shale gas [18].
Second, given the relative isolation of the Susquehanna River Basin from urban areas, the cultural identity is more homogenous and, therefore, may be less bound up in issues that could confound stakeholder attitudes toward fracking. For example, the lowest percentage voting for President Trump in the 2016 election among the counties in the Susquehanna River Basin was 64 percent. Some of the counties provided a plurality in the mid-75 percent range [19]. Additionally, the culture of the area has been shaped by two previous eras of natural resource extractions. In the latter part of the 19th century, trees within transport distance of the Susquehanna River were clear cut and exported to areas of population growth on the Eastern seaboard. This was followed by coal mining, now largely abandoned while the residual—acid mine drainage—continues to pollute creeks and rivers. Given this history of natural resource extraction, the expectation at the outset of this research in 2012 was that area residents would have become inured to being on the short end of costs and benefits of such extraction. Given the right of eminent domain, which the federal government can exercise, and the “boom and bust” cycles that come with resource extraction, indelible marks of extraction remain on the physical terrain and social psyche of the area. This recognition is echoed by Cooper et al. [10] whom suggest that states such as Texas and Pennsylvania, with a tradition of oil and gas production, have been more amenable toward fracking than states, such as New York, where such a tradition has been absent.
Third, American Rivers (an environmental nonprofit group) identified the Susquehanna River as “America’s Most Endangered River” in 2011. According to American Rivers [20], the primary cause of the “most endangered” status was the threat of contamination as part of the hydraulic fracturing or fracking process to extract natural gas. Thus, juxtaposing the conservative nature of citizens in the Susquehanna River Basin and the legacy of natural resource extraction with a concern about the “existential need” for clean water provided by the Susquehanna River provides a unique opportunity for seeking a bottom-line clarity about interests and beliefs that are in conflict, potentially.
The survey gauges the importance of the Susquehanna River to its stakeholders with the question: “If use of the Susquehanna River ecosystem were to be limited, it would affect me how?”
The choices are: (1) financially; (2) quality of life (recreation); and (3) existentially (access to clean water). More than 39 percent indicated it would affect them existentially, meaning access to clean water, an increase from 2012, which was 37.8 percent (Table S1, Panel A, Supplementary Materials). In addition, a significantly higher percentage of respondents indicated an impact on quality of life in 2017 than in 2012, while a lower percentage indicated a financial impact in 2017 than in 2012. In terms of sustainable development, more than 25 percent responded negatively to the question: “Based on current usage, the Susquehanna River ecosystem will be available to future generations in a condition similar to today”, again an increase from 2012. Less than one in five responded affirmatively to the question, with one-third uncertain and the remainder (22.6 percent) demurring (Table S1, Panel A, Supplementary Materials).
Finally, aside from the stark contrast between Pennsylvania’s full-bore fracking and New York and Maryland’s ban, utilizing Pennsylvania and the Susquehanna River Basin portion of the Marcellus Region as the focus rather than a broader geography is necessitated by special exemptions from federal law fracking has been granted. For example, under the “Halliburton Loophole”, fracking is exempted from the Safe Drinking Water Act, a federal law that would have provided a uniform approach for protecting underground water aquifers from potential contamination due to injecting liquid wastes into underground wells [21] (p. 7). In the absence of federal law, the states exercise broad jurisdiction over natural gas fracking, which results in policy and regulatory differences that complicate a unified analysis of fracking in the U.S.
The 2012 survey included a cross-sector survey utilizing the same questions as in the 2017 effort. The research question in the 2012 survey was ascertaining if stakeholder attitudes about fracking were differentiated by sector. We learned that the attitudes were not statistically different among the government, nonprofit and business sectors. From interviews as part of developing the survey, we learned that many people had relatively vague ideas about fracking and had not formed strong opinions. Although Cooper et al. [10] assert that knowledge about fracking remains relatively undeveloped, we expected that, in 2017, opinions would be more fully formed in Pennsylvania, given the high visibility of legislative actions regarding fracking, as well as ongoing advertising and public relations efforts by the oil and gas industry.
Thus, one issue we wish to understand better from the 2017 survey research is ”how can Pennsylvania become the second leading natural gas producing state while New York and Maryland have bans on fracking?” One response is money and politics. On the surface, this makes sense. Former Pennsylvania Governor Corbett won the 2010 gubernatorial race with strong financial backing from the oil and gas industry. Corbett supported the industry consistently but lost to Democrat Tom Wolf in 2014. Thus, while Governor Corbett was supporting the industry through a strong growth cycle, adding to Pennsylvania’s economy, he was defeated by a Democrat, arguably less supportive of oil and gas. Meanwhile, a Republican Governor of Maryland signed legislation banning fracking. Thus, while Cooper et al. [10] assert that Texas and Pennsylvania are more amenable toward fracking because of the legacy of oil and gas in their respective states, the politics of fracking in the Marcellus Shale are somewhat murkier than in Texas, the leading natural gas producing state.
Additionally, environmental policy regarding fracking differs in various parts of Pennsylvania. Use of water for fracking is not permitted in the Delaware River Basin, which supports the water needs of Philadelphia and other East Coast areas, while the Susquehanna River Basin Commission, a consortium of state and federal government officials, has supported the significant water needs of the fracking industry in the Marcellus Shale. Meanwhile, the southwestern part of Pennsylvania, closer to Pittsburgh, which was fracked more aggressively earlier than the Marcellus Shale, has experienced significant stakeholder opposition and legal action in response to environmental accidents and water pollution from fracking.
In conclusion, the thesis is that business and government interests in the Susquehanna River Basin, with its rich deposits of natural gas available for fracking, are able to overpower stakeholder groups in rural areas wishing to preserve the Susquehanna River for future generations. We would expect the “boom and bust” cycle of natural resource extraction [22] to be especially profound on the social fabric in rural areas such as the Marcellus Shale because of the lack of scale in the economy (and the resulting need for economic development), as well as the lack of political institutions with active, informed constituencies to manage its impacts. Thus, the institutionalization of natural resource extraction continues apace with fracking as just the next iteration in an industrialization model extant in the Susquehanna River Basin for 150 years. Meanwhile, stakeholder groups in Philadelphia and New York, and somewhat in Pittsburgh, have been able to protect environmental and social interests in their local areas.
Given the strong conservative voting record of counties in the Susquehanna River Basin, one can hypothesize that fewer people will oppose industry interests actively. However, the survey results do indicate an interest in government doing more to protect the environment. We hypothesize that, unlike other industrialization efforts, stronger citizen concerns in both surveys about maintaining the Susquehanna River for future generations reflects the dependence on the Susquehanna River for drinking water and other daily living needs.
We wish to better understand how the 2017 survey results differ from the 2012 results. Specifically, with the demographic data collected in 2017, is there evidence of polarization in attitudes and beliefs such that proximity to the Susquehanna River reflects concerns about clean water now and in the future above and beyond economic returns from fracking given that much of the economic benefit for fracking accrues to areas outside the Susquehanna River Basin?
Given the history of natural resource extraction in the Susquehanna River Basin and the conservative culture of the area, we believe institutional theory [23] explains the relationship between government and business and their joint approach toward natural resource extraction. We cite DiMaggio and Powell’s [24] use of the term “coercive” to explain the manner in which business and government have exerted institutional dominance in developing and supporting policies designed to shift resource wealth from one geographic area to another. Institutional coercion can also be used to explain the withholding of both regulatory (federal environmental regulations suspended for fracking) and administrative support (lack of state budget resources for gas well inspectors in the Marcellus Shale) from the areas where resources are extracted. If the survey results suggest a rising concern about the Susquehanna River and its future condition, we will conduct interviews to determine the presence and strength of a social movement to oppose fracking.
Both the 2012 and 2017 surveys involve convenience samples using Survey Monkey as the survey instrument. In both surveys, diverse groups were sought out by contacting all known Chambers of Commerce; Marcellus Shale industry groups; federal, state and local governments; universities and alumni groups; businesses; and nonprofit organizations. We recognize the limitation of a convenience sample methodology; however, given the small, isolated population in the Susquehanna River Basin, a large percentage of available groups were contacted by email on at least two occasions.
The outline of this paper involves a discussion of the economic, social, environmental, and political developments involving natural gas fracking in Pennsylvania and the Susquehanna River Basin since the initial survey five years ago. The methodology utilized in collecting data and evaluating the results of the survey follows. The broader implications of fracking in Pennsylvania, such as the permitting of thousands of miles of pipeline in support of a nascent export plan, are presented as context for interpreting stakeholder attitudes and projecting future outcomes.
2. Background
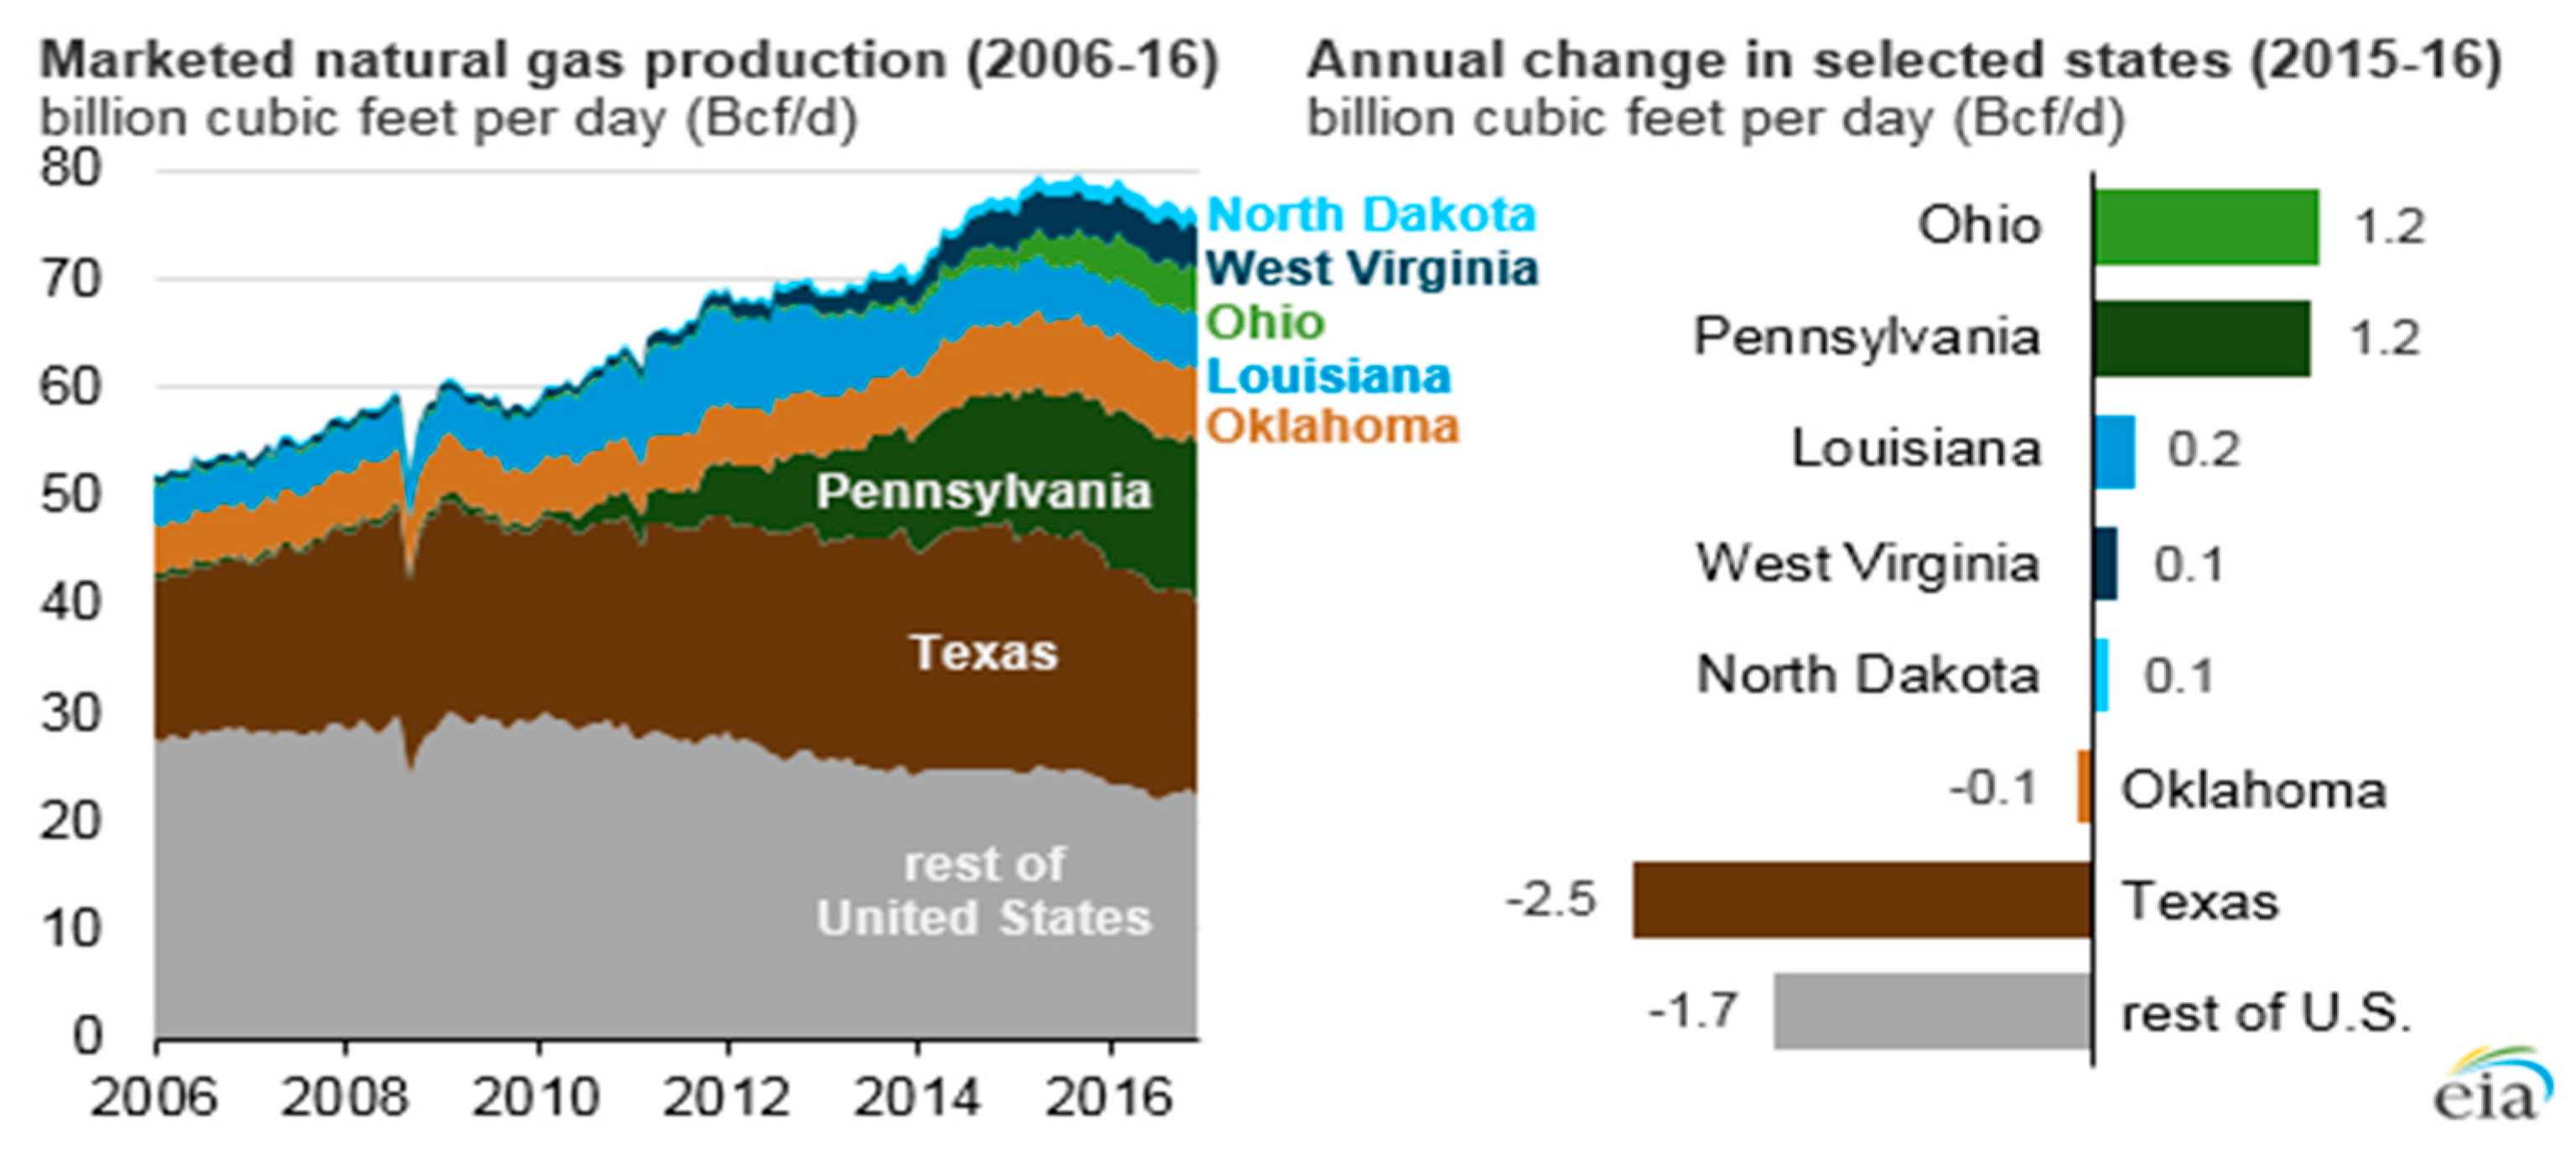
Economic. Pennsylvania produced the largest total gain in annual production of natural gas for the third consecutive year in 2015 (Figure 4), increasing to 13 Bcf/d (billion cubic feet per day), an 11.4 percent increase over 2014 [6]. Based on data collected from the Pennsylvania Department of Environmental Protection (DEP), as of January 2017, there are at least 17,939 proposed and drilled unconventional wells in the state [25].
In 2016, the annual average natural gas price was the lowest since 1999 due to an oversupply [6], causing natural gas production to fall throughout the U.S., except in Pennsylvania, Ohio and West Virginia. Given the job layoffs during this period due to oversupply issues, the increase in production reflected efficiency improvements in Marcellus and Utica Shale fracking [26]. Overall, U.S. natural gas production declined in 2016 to 71.4 Bcf/d after peaking at 75 Bcf/d in 2015; however, the EIA projects natural gas and renewables as the two growth areas for energy production over the next 30 years [6]. Natural gas prices are expected to increase in the 2017-18 period, reflecting higher forecasted consumption and exports, as the Cove Point LNG facility in Maryland is expected to start export operations in December 2017, along with additional projects on the Gulf Coast beginning exports in 2018 [27].
The EIA reports that “several large interstate pipeline projects have come online in recent years to support the shifting geography of domestic natural gas production”, including 6800 miles of pipelines in Pennsylvania by 2015, with significant pipeline growth planned. One example is the Atlantic Sunrise Pipeline, a $2.6 billion project, which will move natural gas out of the Marcellus Shale Region, traverse 10 Pennsylvania counties, and add 1.7 Bcf/d of pipeline capacity [26].
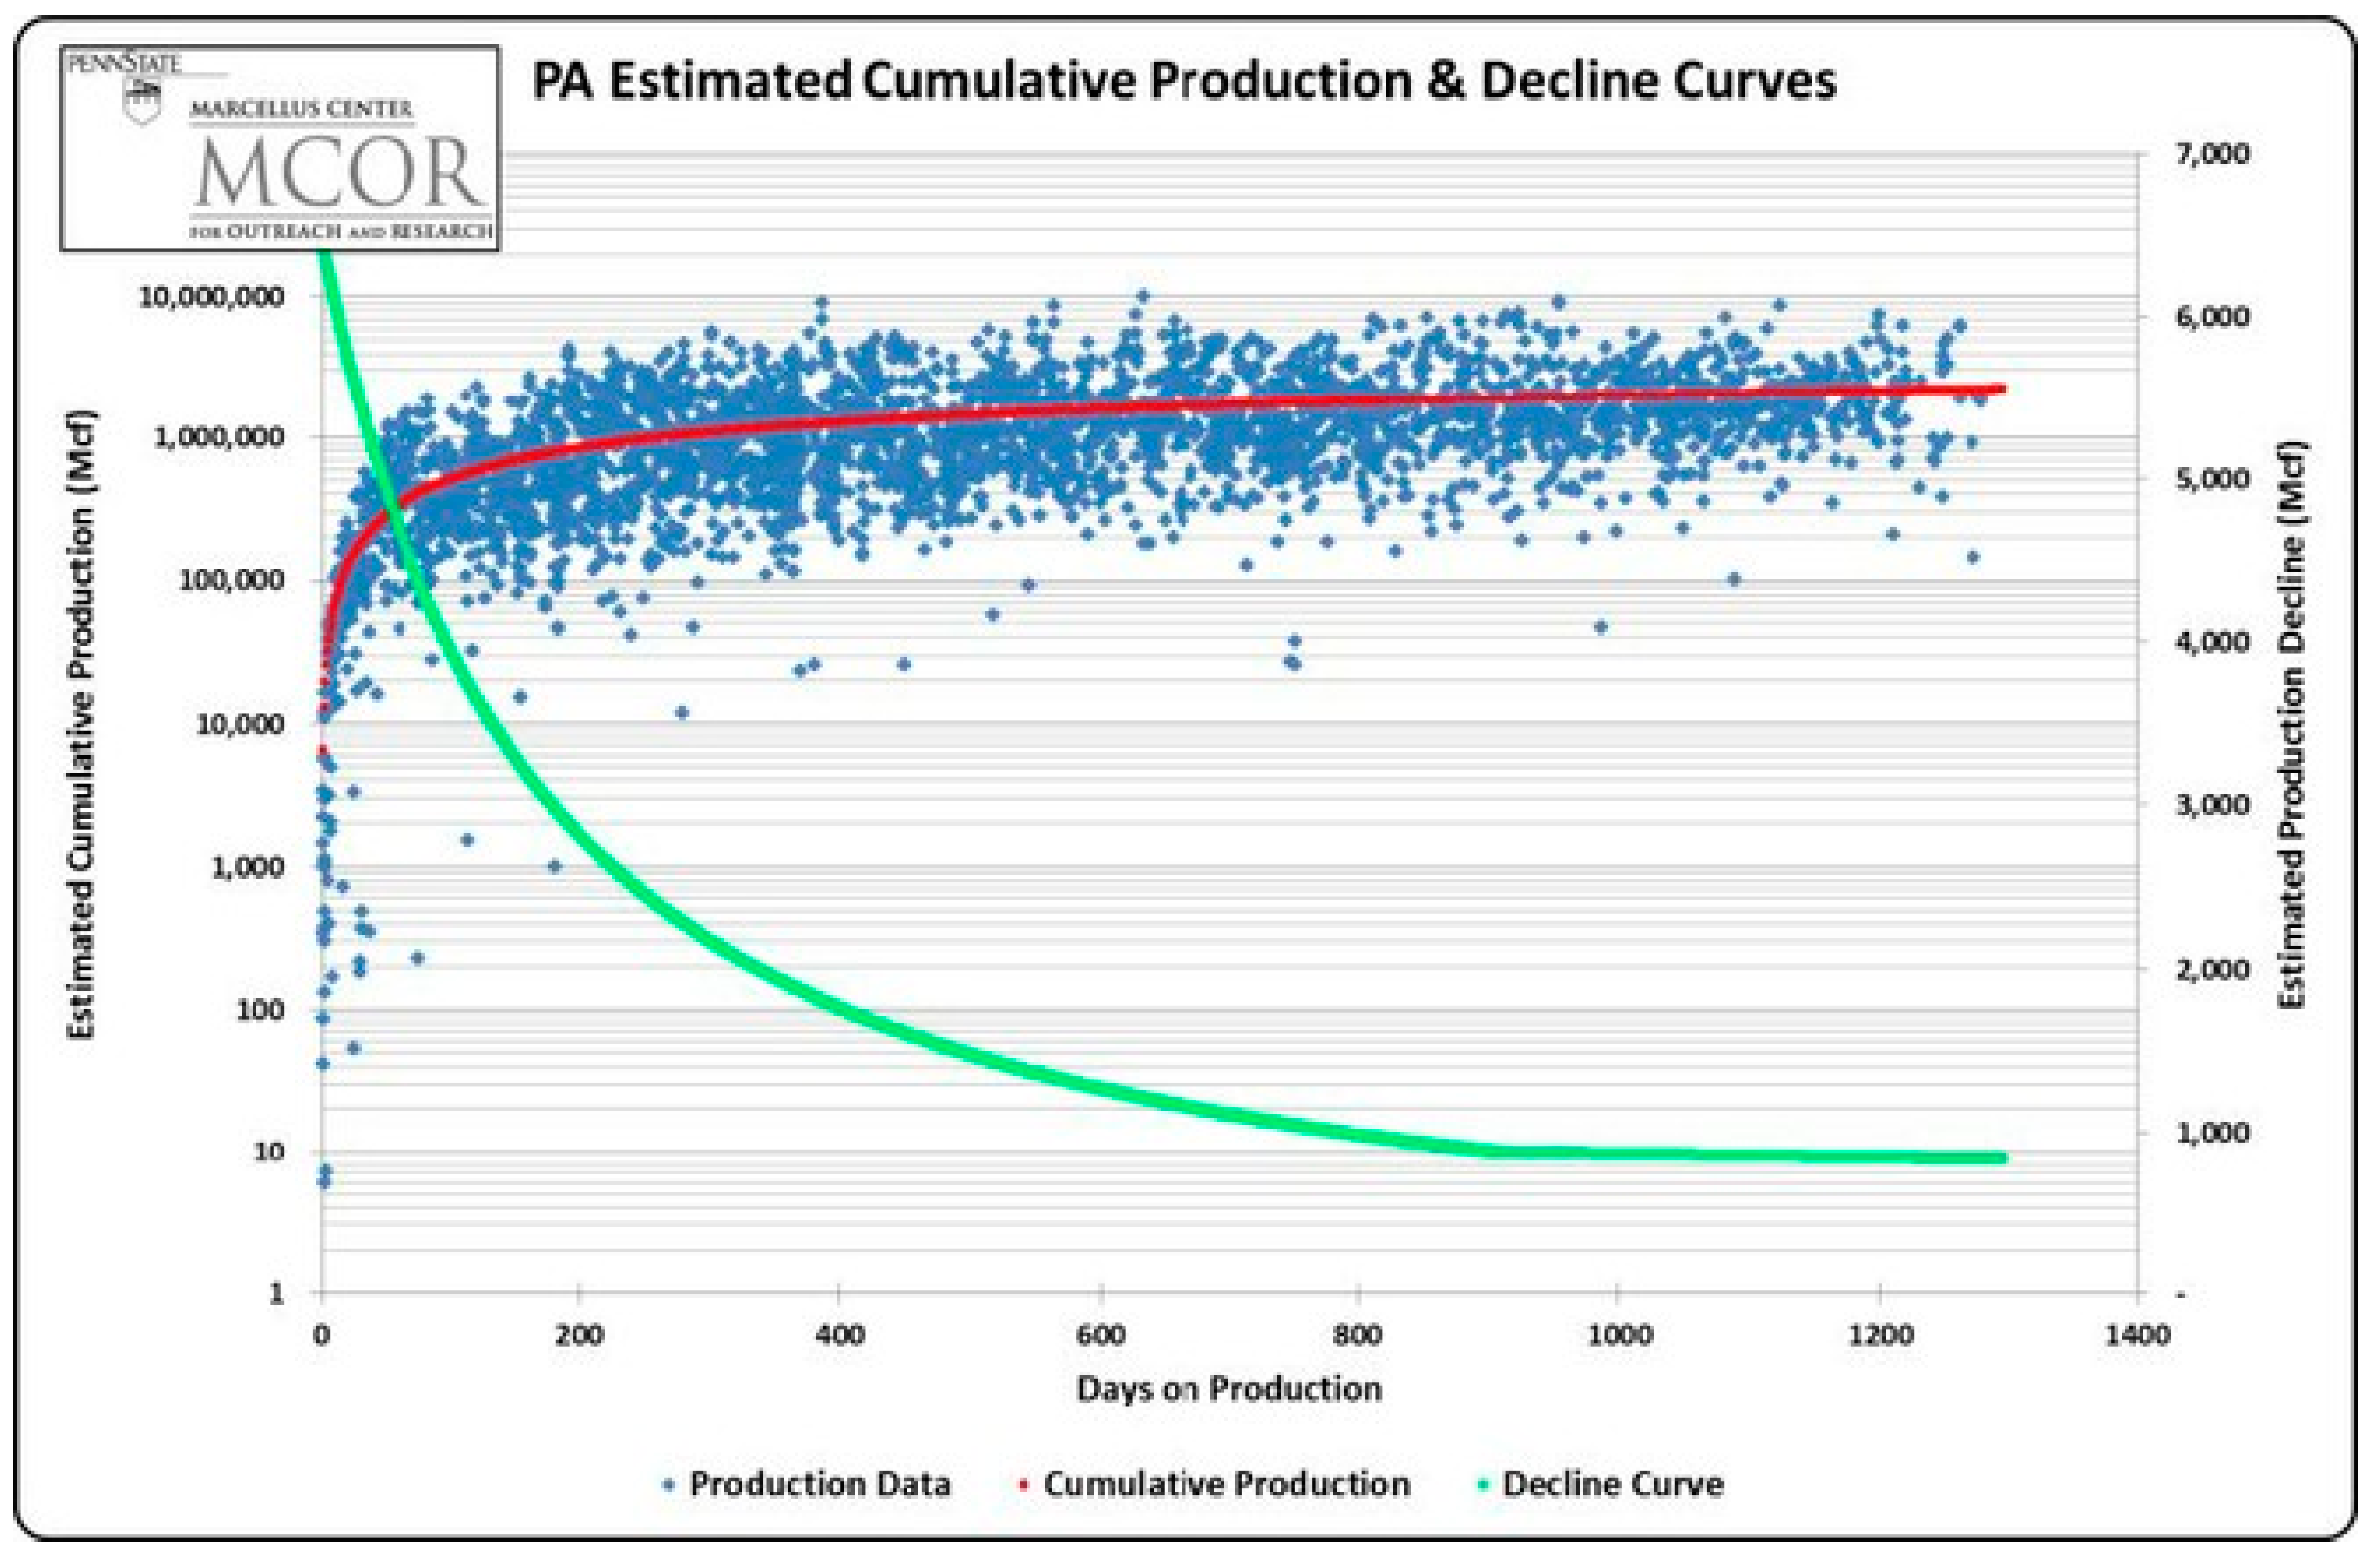
The Annual Energy Outlook 2017 projects the U.S. to be a net exporter of natural gas by 2018 [27], even though fracking production from a newly drilled well drops significantly within several months of initial production [17]. In general, the average first year decline in natural gas production rates across Pennsylvania resemble a hockey stick (Figure 5) with the drop off ranging from 60 to 80 percent. Although analysts expect shale wells to have a 20–30 year life, the drop off in shale well productivity after the first year has profound implications for the number of wells needed to support planned pipelines [28].
Social. Oil and gas jobs in Pennsylvania dropped from about 30,313 to 20,524 in the first quarter of 2016, compared with the same quarter in the previous year [7]. Regarding jobs and the “boom–bust” cycle of extraction industries, the industry strongly supports permitting and constructing of a potential 4600 miles of new interstate pipelines by 2018. The contention that employment will increase in the Marcellus Region when the pipelines are in place finds willing supporters among many hurt by the bust cycle of natural gas. For example, as of October 2016, the gas drilling lobby had made more than half a million dollars in donations to Pennsylvania (political) candidates for office, despite the slowing of natural gas fracking and with only 327 new wells drilled in Pennsylvania (in 2016 by 7 October) [29].
However, local citizens and environmental groups have organized in the areas targeted for pipeline construction and other natural gas infrastructure activities. In one case, two counties attempted to block underground disposal wells of wastewater from fracking by changing their charters to prohibit such activities. The Pennsylvania DEP approved the disposal wells and sued the counties [30]. In another case, the Delaware River Keeper, a nonprofit, sued the Federal Energy Regulatory Commission (FERC), the agency overseeing interstate transmission of natural gas, for alleged corruption and bias, saying, “it is unable to make objective decisions about the industries it regulates, including the natural gas industry, because they are the source of its funding”. This followed EPA criticizing FERC’s environmental impact assessments, the first time such a criticism has occurred [31]. However, compared to New York and Maryland, Pennsylvania local citizens and environmental groups have been unsuccessful in blocking, or even slowing, the progress of natural gas fracking.
Environment and Health. The Susquehanna River Basin provides drinking water to about 6 million people, which is more than half the population [32]. Four possible risks to water resources associated with natural gas fracking involve: (1) contamination of shallow aquifers from leaks due to defects in gas wells; (2) improper handling of wastewaters; (3) accumulation of metals and radioactive elements in sediment from wastewater disposal or spills; and (4) overexploitation of limited or diminished water for shale gas development [33].
The Susquehanna River Basin Commission, the joint governmental agency responsible for approving water withdrawals from the Susquehanna River, estimates that the drilling and development of each production well uses, on average, between 4 and 5 million gallons of water. In addition to the risks already outlined, the SRBC notes these additional water-related risks: (1) impact on local public water supplies; (2) runoff from well pad sites, pipelines and unpaved roads; (3) handling and disposal of fluids that return to the surface after fracking (flowback); and (4) disturbance of sensitive lands adjacent to water bodies [32]. In its final report on the impact of fracking on drinking water, EPA found scientific evidence that fracking can affect drinking water resources under some circumstances [34]. As an indication, of the over 9000 complaints the Pennsylvania Department of Environmental Protection received from areas where fracking development occurred during 2004–2016, over 4100 involved water quality problems [35].
The flowback of wastewater used in the fracking process poses another water-related health risk, as Elliott [36] cited, “Hydraulic-fracturing fluids and wastewater from unconventional oil and natural gas development contain hundreds of substances with the potential to contaminate drinking water.” Under a law called Act 13, passed in 2012, a “physician gag rule” restricted doctors from communicating with patients whose health could be affected by chemicals from fracking. In 2016, the Pennsylvania Supreme Court determined that the “gag rule”, along with no requirement to notify private water well owners of water contamination, was unconstitutional [37], as Article I Section 27 of the Pennsylvania Constitution states:
“The people have a right to clean air, pure water, and to the preservation of the natural, scenic, historic and esthetic values of the environment. Pennsylvania’s public natural resources are the common property of all the people, including generations yet to come. As trustee of these resources, the Commonwealth shall conserve and maintain them for the benefit of all the people”.(Widener University School of Law, 2010) [38]
Consequently, research determined that “the high salinity of the flowback is associated with high concentrations of halides, ammonium, metals, metalloids, and radium nuclides that pose environmental and human health risks upon the release of the hydraulic fracturing fluids to the environment” [33]. As for the quantity of flowback, Marcellus Shale fracked wastewater produces less wastewater per unit of gas than conventional natural gas wells; however, developing the Marcellus Shale has increased the total wastewater generated in the region by approximately 570 percent since 2004, “overwhelming current wastewater disposal infrastructure capacity. This rapid increase in wastewater prompted industry to explore various disposal strategies that have, in many cases, been found to be unacceptable.” [39].
Regarding the relationship between fracking and air quality, a study by the Johns Hopkins School of Public Health and published in JAMA Internal Medicine found that those who “lived closer to a large number or bigger active natural gas wells were significantly more likely—1.5 to four times more likely—to suffer asthma attacks.” While the researchers are uncertain why asthma attacks occur closer to big or more wells, air pollution and stress from noise, traffic and other community impacts are possibilities. The study compared medical records of 35,508 patients treated for asthma exacerbations during 2005–2012 at Geisinger Medical Center [9].
In response to growing evidence that natural gas fracking has “deleterious effects outweighing any economic benefit”, the Pennsylvania Medical Society called for a moratorium on new shale gas drilling and hydraulic fracturing” and urged the state to establish an independent health registry and more science and research to better understand the risks of fracking. Three years earlier, a similar resolution had been rejected by the Pennsylvania Medical Society [40].
Political. The profound contrast in fracking policy between New York and Pennsylvania requires a political analysis. Arnold et al. [41] hypothesize that anti-fracking policy entrepreneurs appear more successful “when they operate in less cohesive networks, act as bridges to relative newcomers to the governance network, and have a larger number of network connections. Conversely, pro-fracking policy entrepreneurs appear more successful when they can forge high-value connections to key decision makers.” This hypothesis holds true generally for New York and Pennsylvania.
In Pennsylvania, Republican Governor Tom Corbett, elected in 2010, received more than $2 million from the natural gas industry from 2007 to 2014 [42]. In his successful 2010 gubernatorial race, Corbett received six times more in campaign contributions from the natural-gas industry than any other gubernatorial candidate did [43].
In New York, the $50,000 contributed to Governor Cuomo by the natural gas industry appears paltry compared to the $76 million Governor Cuomo raised mainly from real estate, law firms, and unions from 2001 to 2012, as well as the more than $45 million raised during his first term leading up to his successful reelection in 2014 [44]. This is particularly remarkable given the significant Marcellus Shale deposits below New York’s Southern Tier.
Both Pennsylvania and New York have significant representation from national, state and local environmental nonprofit groups. However, in New York, state and local groups organized well enough so that when Governor Cuomo appeared anywhere in New York during the year before the fracking ban, he was shadowed by environmentalists vocalizing their opposition to fracking in New York. Governor Cuomo supported a moratorium followed ultimately by the ban on fracking. Some New York residents from the Southern Tier believed powerful New York City politicians with voting blocks in the New York General Assembly controlled their fate from afar. Other residents blamed the fracking ban on “left wing wackos from New York City” and liberal, flower power professors in Ithaca [45].
However, in Pennsylvania, the state Democratic Party approved a ban on fracking in 2014 and urged newly elected Democrat Governor Tom Wolf to approve the ban, to no avail. In Pennsylvania, pro-fracking groups have remained active in countering environmental groups. One such group, The Marcellus Shale Coalition, spent more than $11 million during 2007–2014 to influence legislation and state oversight [42].
3. Methodology
The primary objective of this survey is to update attitudes of stakeholders regarding Marcellus Shale fracking in Susquehanna River Basin. The demographic questions in Table S1, Panel A (Supplementary Materials) are replicated from the 2012 survey with a side-by-side comparison of the 2012 and 2017 results. An omission from the demographics is the industry sector (private, government, and nonprofit), as the sector comparison in the 2012 survey found no significant statistical difference among the sectors for the four major categories (economic opportunity, health and safety, community, and energy security). Therefore, the sector analysis is not repeated in 2017. Additional demographic questions and the results are shown in Table S1, Panel B (Supplementary Materials). These additions include the highest level of education attained, gender, age, employment status and income level.
In order to gain feedback on a balanced set of criteria, a community discussion guide from the Public Issues Forums of Centre County (Pennsylvania) entitled, “The Marcellus Shale: What Does It Mean for Us?”, was utilized [46]. These public issues forums are organized to evaluate different perspectives and to wrestle with the trade-offs and consequences inherent in each approach. The goal is to discover areas of common ground for moving forward.
The survey in this paper utilized the four categories included in the Public Issues Forum: economic opportunity for all, protection of health and safety, preserving communities, and achieving energy security. Using the Public Issues Forum as a guide, the same 21 questions are adopted from the 2012 survey (see Supplementary Materials). The numbering of questions in this paper follows the numbering in the actual survey in order to maintain consistency. The four questions omitted in the category table analysis are demographic type questions that are addressed in Table S1 (Supplementary Materials). The questions are designed to address a range of issues pertinent to each category. The survey was pretested with a Pennsylvania wood products trade association in 2012. This trade association was selected due to the specialized knowledge about forest sustainability issues in the Marcellus Shale region and related environmental regulations. The changes suggested by the trade association were accepted as the final wording. The survey questions were tested for validity and reliability in Heuer and Lee [5] by using standardized factor loading, construct reliability, composite factor reliability and average variance extracted measures.
The survey was administered on-line using Survey Monkey during February and March 2017. We utilized a convenience sampling approach by collecting email addresses for all accessible organizations in the counties included in the Middle Susquehanna and West Branch (Figure 2) of the Susquehanna River Basin, which are the areas where most Marcellus fracking occurs in Pennsylvania. The intent of the survey was to focus on stakeholder attitudes regarding Marcellus Shale fracking and the Susquehanna River Basin. Of the 132 responses received, over 50 percent of the respondents live within 5 miles or less of the Susquehanna River, slightly more than in 2012. We valued proximity to the Susquehanna River because of the dependence by both the gas industry and citizens on the river as a source of water. In so doing, we expected to receive a divergence of opinion from those valuing the Susquehanna River as a water source for fracking and for those who depend on the river for clean drinking water. Thus, the Susquehanna River is the focal point for evaluating the coercive power of the industry and government versus incipient indications of social movement organizations. The organizations contacted by email to respond to the survey were identified through scanning local newspapers and websites of local or regional organizations, attending local conferences and meetings, and word of mouth. The range of organizations varied from local river guide businesses to global oil and gas companies. All responses were anonymous except for approximately 15 individuals who expressed interest in future face-to-face meetings.
This paper applies regression analysis for each question on the demographic variables of homeownership, river visit, education, gender, age, marital status, employment, and salary (see Supplementary Materials). Homeownership utilizes a dummy variable, with 1 = homeowner or landowner, 0 otherwise. River visit is the number of river visits per month. Education is the number of years in school. Gender utilizes a dummy variable, with 1 = male, 0 = female. Age is the median age reported in each category. Employment is a dummy variable, with 1 = employed, 0 = otherwise. Salary is the median salary of each category.
4. Interpreting the Results
The intended focus on stakeholder attitudes regarding the impact of Marcellus Shale activity in close proximity to the Susquehanna River is addressed as more than half of the 132 survey respondents and/or their families visit the Susquehanna River Basin at least monthly. More than two-thirds value the quality of life the ecosystem provides and 39 percent would have concerns about access to clean water should access be limited. More than 25 percent do not believe the ecosystem will be available to future generations in a condition similar to today based on current usage, while only 18 percent believe it will be, with one-third voicing uncertainty and 22 percent not responding.
Table S1, Panel B (Supplementary Materials) provides results for more general demographic data and thereby enables the regression analysis. The variables with the greatest occurrence of statistical significance are education, gender and salary (income). This result holds true for all four categories: Economic Opportunity, Health and Safety, Communities, and Energy and Security. A detailed discussion of the factor analysis and regression results follows below.
Our survey questions are grouped into the four categories from the Public Issues Forum: economic opportunity, health and safety, community, and energy and security. There are five questions in economic opportunity, seven in health and safety, four in community and five in energy and security. We collected responses on each question in all categories and then performed individual regressions for the response to each question on selected demographic control variables. Based on the design of the survey, many responses that were collected belong to the same category; therefore, there are potential unobserved common latent factors causing the variations in responses. To reduce the data magnitude and to provide ease of access to the empirical analysis, we performed factor analysis on the sample responses. We then applied two strategies in the factor analysis: first, factor analysis on each category of questions; and, second, factor analysis on all categories combined. The results are reported in Table 1 and Table 2.
The factor analysis results from Table 2, Panel A indicate that EC1 has an eigenvalue 2.169, which is greater than 1. The Kaiser criterion suggests that EC1 should be retained as a factor for economic opportunity. Likewise, we also have HS1, CM1 and ES1 with eigenvalues greater than 1, which suggests HS1, CM1 and ES1 should be retained as factors.
As evidenced in Table 1, Panel B, EC1 has positive factor loadings to q01, q02 and q03, and negative to q4 and q5. HS1 has positive factor loadings to q07 to q14. CM1 has positive factor loadings to q16 to q19. ES1 has positive factor loadings to q21, q23 to q25, negative to q22. Therefore, we conclude that EC1, HS1, CM1 and ES1 are valid factors in each category and will reduce the data magnitude in the regression analysis.
We also performed the factor analysis to the responses in all categories. The results are reported in Table 2.
As is evident from Table 2, Panel A, FA1 and FA2 should be retained as they have greater than 1 eigenvalues. In Table 2, Panel B, FA1 has negative loadings to q01, q02, q03 and q22, but positive to the remainder. FA2 has negative loadings to q07, q16, q23 and q25, but positive to the remainder. Therefore, FA1 and FA2 are also included in our regression analysis.
Therefore, in Table 3, we can see that education, gender, and salary are significant.
In Table 3, we indicate the regression results of common factors on key demographic variables and found that EC1, HS1, CM1 and ES1 are valid factors. We continue to predict the factors EC1, HS1, CM1 and ES1. We also included FA1 and FA2 as the factors on all responses and ran the regressions on some explanatory variables.
From the factor loading table in Table 1 and Table 2, we can see that most factors have similar signs with the original questions. We can also see the significance level is similar to the previous tables. Overall, we found significant coefficients for education, gender and salary, and the signs of the coefficients are similar to the previous tables. Thus, the factors analysis reduces the data and continues to support our finding in the original regression results (Supplementary Materials).
5. Discussion
A notable outcome regarding the results of the 2012 and 2017 surveys is that both rank “health and safety” first and “economic opportunity” third. Overall, we expected more variance in category responses between 2012 and 2017 because of the scale and scope of changes occurring in the Marcellus Shale during that period. In particular, high profile legislation, such as Act 13, were debated with a great deal of visibility and controversy. A zoning provision in Act 13, which gave the state government significant powers to make zoning decisions in place of local governments, was particularly divisive and visible. Ultimately, the Supreme Court of Pennsylvania struck down several provisions in Act 13, but the process served to ignite environmental opposition. In addition, high profile examples of water contamination allegedly caused by fracking received significant media attention, while movie documentaries opposing fracking and involving well-known movie actors, further galvanized awareness about the rapid growth of fracking and industrialization in the Marcellus Shale. Finally, with the announcements of pipelines and reports of pristine forests being developed for this purpose, a new phase of opposition developed that is currently ongoing. Thus, while categorical responses were similar in 2012 and 2017, differences among demographic groupings were significant for gender, salary, and education.
Some of the largest percentage differences are: in 2012, 28 percent of respondents were retired or unemployed, versus 16.5 percent in 2017; and in 2012, 7.7 percent worked more than 20 miles from the Susquehanna River, versus 17.48 percent in 2017. These two factors together could be explained by an improved economy with more people working and having to travel further to work. In 2012, 10 percent were landowners versus 15 percent in 2017, but the percentage of homeowners was lower in 2017 than 2012. Because the purpose of the 2012 survey was to do a cross-sector analysis, we did not repeat this analysis in 2017, as there was no significant difference among the sectors based on the 2012 survey data. In addition, we did not gather demographic data on gender, education and income in 2012 as we did in 2017. Again, we emphasize that a convenience sample methodology was utilized in this survey and, therefore, the results cannot be generalized beyond the survey sample.
The results of both surveys clearly express concerns about future access to clean water, concerns about wastewater treatment, and a continuing desire to place a moratorium on fracking until the health risks posed by fracking are understood better. However, at the same time, the survey results suggest that more highly paid individuals and males in the Susquehanna River Basin favor neither more regulation of fracking nor a moratorium. While we cannot generalize beyond the survey sample itself, there are ongoing indications that the institutional power structure in terms of business and state government support fracking. The current Democratic Governor, Tom Wolf, proclaimed support for “once in a generation” industrialization opportunities because of natural gas production and infrastructure. In March 2017, Governor Wolf released a report indicating that Pennsylvania could support four additional petrochemical plants beyond the $6 billion Shell Chemicals plant, which will produce plastic pellets from Marcellus Shale natural gas [46].
Even recent research by a Penn State forestry professor seems to acknowledge, at least tacitly, the institutionalization of fracking by suggesting policy changes for regulating well pads, pipelines, and other infrastructure [47], rather than opposing the actual presence of this infrastructure in pristine forest.
The support for fracking by high earners and males may be explained by a lack of economic opportunities in the Susquehanna River Basin and the positive ripple effect of fracking throughout the economy, including support businesses such as hotels, restaurants, and an expanded public infrastructure, such as schools, hospitals, and transportation.
Filteau [48] notes:
“Industry representatives and residents collaborated to legitimize the gas industry as the driving economic force for Marcellus Shale communities. The potential for economic stability encouraged local, male-run businesses and organizations to reinforce the gas industry’s hegemonic pattern by offering ideological support or services that directly accommodated industry’s needs”.(p. 527)
The results of this survey suggest that women generally oppose the institutional dominance of natural gas industry, which is supported by industry and government in general. Women and lower paid individuals oppose exporting natural gas, which possibly can be interpreted as opposition to extending the imbalance in the cost-benefit relationship imposed on the Marcellus Shale area in favor of nations willing to pay more for natural gas than the price natural gas would be for Susquehanna River Basin citizens. Women and lower paid individuals also support the human resource departments of energy resource firms meeting regularly with communities to improve quality of life, as well as requiring natural gas firms to leave areas where drilling occurred in the same or better condition in which they found it. In addition, women and more highly paid individuals want the government to do more in support of renewable energy.
We are not able to explain the support by women of more government involvement, support for a moratorium, and more support for renewable energy in this survey. More than 57 percent of the respondents to the survey were male and more than 87 percent of respondents have at least a college degree. More than 57 percent are older than 55 years of age. These are notable statistics; however, none of these factors helps explain the unified opposition of women to natural gas fracking. While there are national polls that explain the gender attitude differences based on male dominance of the natural gas industry, Cooper et al. [10] report data from the U.S. Department of Labor showing women holding nearly half of the jobs in the oil and gas industry in the U.S.
The consistently strong opposition to fracking by women in terms of supporting a moratorium on fracking suggests the existence of an incipient social movement regarding the environment, particularly water management in the Susquehanna River Basin. The polarization between supporters and opponents of many aspects of fracking suggest that the institutional nature regarding resource extraction may be evolving, although more survey research would be needed beyond the results of this sample to confirm this.
6. Limitations
We limited the geographic focus of this analysis to the Susquehanna River Basin. However, it was necessary to include some extensions to Pennsylvania as a whole because regulatory and policy issues affecting fracking in the Marcellus Shale and Susquehanna River Basin occur at the state level due to the exemption of fracking from some federal environmental laws. Because of the convenience sample used in this survey, we are not able to generalize beyond the sample drawn from the Susquehanna River Basin. Policy issues such as Act 13, which addressed zoning and other regulatory issues specific to Pennsylvania, necessitated this focus.
Additionally, the dynamic of Maryland and New York as neighboring states to the north and south, respectively, which banned fracking while Pennsylvania pursued fracking aggressively, supports a more specific focus. This is particularly the case because the Susquehanna River has its source in New York and flows into the Chesapeake Bay in Maryland. Thus, all three states are tied inextricably to the Marcellus Shale and the Susquehanna River Basin, but Pennsylvania differed in its political and policy responses toward fracking. However, the next survey should include more detail on fracking in Ohio and West Virginia, both of which share Marcellus and Utica Shale with Western Pennsylvania. Including Ohio and West Virginia may provide economic, social, and environmental insights that could explain whether Pennsylvania is an outlier with regard to public policy toward fracking. For example, Pennsylvania has had a Republican and Democrat in successive governorships, both of whom have opposed a ban on franking, while the Maryland governor signing legislation into law to ban fracking is a Republican.
Another limitation of the survey is that the education level of respondents is higher than the general population of the Susquehanna River Basin.
7. Conclusions
The results of this survey generally support recent theoretical, qualitative and empirical research on fracking in the Marcellus Shale region [41,48,49]. Those supportive of fracking tend to be male and have higher incomes, while those opposing fracking tend to be female and have higher education. Arnold et al. [48] posit that pro-fracking policy entrepreneurs tend to succeed where they can get direct, prolonged access to those in power. This provides an explanation for why institutional coercion has become a driver in supporting the Marcellus Shale as the most productive shale gas play in the U.S. Stakeholder attitudes regarding Marcellus Shale activity in the Susquehanna River Basin reflect concern about safety and health not only now, but also for future generations. The 2012 survey supported this conclusion, in that the three sectors—private, government and nonprofit—did not have a statistically significant difference in supporting the ordering of the four categories.
The survey results continue to show strong stakeholder concern about the impact of fracking on the Susquehanna River Basin. We would not expect these concerns to abate going forward. Some experts believe the Marcellus play is just 10 percent of what it is expected to be when fully mature. We will update the survey in 2022 to see if stakeholder attitudes continue to express these concerns.
Supplementary Materials
The following are available online at www.mdpi.com/2071-1050/9/10/1713/s1, Table S1: Demographic Information.
Author Contributions
Mark Heuer collected the data and provided policy and theory insights for this research. Shan Yan provided the regression and factor analysis, as well as the empirical interpretation.
Conflicts of Interest
The authors declare no conflict of interest.
Funding
The authors received no financial support for the research, authorship, and/or publication of this article.
References
- Egan, J.; Rafferty, G. Stuck in the Middle with You. Performed by Stealers Wheel. 1972. Available online: www.allmusic.com/artist/stealers-wheel-mn00000012877 (accessed on 5 May 2017).
- Soeder, D.J.; Kappel, W.M. Water Resources and Natural Gas Production from the Marcellus Shale; Fact Sheet 2009-3032; U.S. Department of the Interior, U.S. Geological Survey: Washington, DC, USA, 2009.
- Witte, B. Maryland Governor Signs Fracking Ban into Law. Available online: www.baltimoresun.com/maryland (accessed on 4 May 2017).
- U.S. EIA. Pennsylvania State Profile and Energy Estimates. 2016. Available online: www.eia.gov (accessed on 4 May 2017).
- Heuer, M.; Lee, Z.C. Marcellus shale development: An exploratory analysis of cross-sector attitudes on natural gas hydraulic fracturing. Organ. Environ. 2014, 27, 25–41. [Google Scholar] [CrossRef]
- U.S. EIA. U.S. Natural Gas Production Resilient to Market Changes in 2015, but Has Fallen in 2016. 2016. Available online: www.eia.gov (accessed on 4 May 2017).
- Pa. Oil and Gas Jobs down 32 Percent Since Last Year. 2016. Available online: www.stateimpact.npr.org (accessed on 4 May 2017).
- Phillips, S. Pipelines: The New Battleground over Fracking. 2015. Available online: www.stateimpact.npr.org (accessed on 4 May 2017).
- Rasmussen, S.; Ogburn, E.; McCormack, M.; Casey, J.A.; Bandeen-Roche, K.; Mercer, D.G.; Schwartz, B.S. Asthma exacerbations and unconventional natural gas development in Marcellus Shale. JAMA Intern. Med. 2016, 176, 1334–1343. [Google Scholar] [CrossRef] [PubMed]
- Cooper, J.; Stamford, L.; Azapagic, A. Shale gas: A review of the economic, environmental and social sustainability. Energy Technol. 2016, 4, 772–792. [Google Scholar] [CrossRef]
- Coase, R.H. The problem of social cost. J. Law Econ. 1960, 56, 837–877. [Google Scholar] [CrossRef]
- Scott, W.R. Introduction: Institutional theory and organizations. In The Institutional Construction of Organizations; Sage: London, UK, 1995. [Google Scholar]
- Kriesi, H. The political opportunity structure of new social movements: Its impact on their mobilization. In The Politics of Social Protest: Comparative Perspectives on States and Social Movements; University of Minnesota Press: Minneapolis, MN, USA, 1995. [Google Scholar]
- Hoffman, A. Institutional evolution and change: Environmentalism and the U.S. chemical industry. Acad. Manag. J. 1999, 42, 351–371. [Google Scholar] [CrossRef]
- Hardy, C.; Maguire, S. Institutional entrepreneurship. In The SAGE Handbook of Organizational Institutionalism; Greenwood, R., Oliver, C., Sahlin, K., Suddaby, R., Eds.; Sage: Thousand Oaks, CA, USA, 2008; pp. 198–217. [Google Scholar]
- Evensen, D.; Stedman, R. Scale matters: Variation in perceptions of shale gas development across national, state, and local areas. Energy Res. Soc. Sci. 2016, 20, 14–21. [Google Scholar] [CrossRef]
- Jew, A.D.; Dustin, M.K.; Harrison, A.L.; Joe-Wong, C.M.; Thomas, D.L.; Maher, K.; Brown, G.E., Jr.; Bargar, J.R. Impact of organics and carbonates on the oxidation and precipitation of iron during hydraulic fracturing of shale. Energy Fuels 2017, 31, 3643–3658. [Google Scholar] [CrossRef]
- Middleton, R.S.; Gupta, R.; Human, J.D.; Viswanathan, H.S. The shale gas revolution: Barriers, sustainability and emerging opportunities. Appl. Energy. 2017, 197, 88–95. [Google Scholar] [CrossRef]
- Results of 2016 Presidential Election by County. Available online: www.politico.com (accessed on 25 July 2017).
- American Rivers. Susquehanna Named Most Endangered River in the Nation; Natural Gas Drilling Posing Unprecedented Threat. Available online: www.americanrivers.org/newsroom/press-releases (accessed on 5 May 2014).
- Warner, B.; Shapiro, J. Fractured, fragmented federalism: A study in fracking regulatory policy. Publius J. Fed. 2013, 43, 474–496. [Google Scholar] [CrossRef]
- Freudenburg, W.R. Women and men in an energy boomtown: Adjustment, alienation, and adaptation. Rural Sociol. 1981, 46, 220–244. [Google Scholar]
- Scott, W.R. The adolescence of institutional theory. Adm. Sci. Q. 1987, 32, 493–511. [Google Scholar] [CrossRef]
- DiMaggio, P.J.; Powell, W.W. The iron cage revisited: Institutional isomorphism and collective rationality in organizational fields. Am. Sociol. Rev. 1983, 48, 147–160. [Google Scholar] [CrossRef]
- Fractracker Alliance. Camp Hill, PA. Available online: www.fractracker.org (accessed on 4 May 2017).
- U.S. EIA. FERC Certificates Several New Natural Gas Pipelines in 2017. 2017. Available online: www.eia.gov/todayinenergy (accessed on 4 May 2017).
- U.S. EIA. Liquefied Natural Gas Exports Expected to Drive Growth in U.S. Natural Gas Trade. Available online: www.eia.gov (accessed on 4 May 2017).
- U.S. EIA. U.S. Crude Oil and Natural Gas Production Both Fell in 2016. 2017. Available online: www.eia.gov/todayinenergy (accessed on 4 May 2017).
- Finnerty, J. Drillers’ donations continue to flow: Slowdown doesn’t affect money for campaign coffers. The Daily Item, 7 October 2016; A1. [Google Scholar]
- Pennsylvania Ok’s New Injection Wells for Oil and Gas Wastewater. 2017. Available online: www.stateimpact.npr.org (accessed on 5 May 2017).
- Hurdle, J. EPA Steps up Pressure on FERC over New Pipeline Assessment. 2016. Available online: https://stateimpact.npr.org (accessed on 26 April 2017).
- Susquehanna River Basin Commission. Natural Gas Well Development in the Susquehanna River Basin. Susquehanna River Basin Commission Information Sheet. 2013. Available online: www.srbc.net (accessed on 4 May 2017).
- Vengosh, A.; Kondash, A.; Harkness, J.; Lauer, N.; Warner, N.; Darrah, T.H. The geochemistry of hydraulic fluids. Procedia Earth Planet. Sci. 2017, 17, 21–24. [Google Scholar] [CrossRef]
- United States Environmental Protection Agency (U.S. EPA). Hydraulic Fracturing for Oil and Gas: Impacts from the Hydraulic Fracturing Water Cycle on Drinking Water Resources in the United States (Final Report); EPA/600/R-16/236F; U.S. Environmental Protection Agency: Washington, DC, USA, 2016.
- Data Trove Offers New Details on Complaints to DEP during Shale Boom. 2017. Available online: www.stateimpact.npr.org (accessed on 5 May 2017).
- Elliott, G.E.; Ettinger, A.S.; Leaderer, B.P.; Bracken, M.B.; Deziel, N.C. HA systematic evaluation of chemicals in hydraulic-fracturing fluids and wastewater for reproductive and development toxicity. J. Expo. Sci. Environ. Epidemiol. 2016, 27, 90–99. [Google Scholar] [CrossRef] [PubMed]
- Hopey, D. Law Unfairly Gave Shale Drillers ‘Special’ Treatment, Pa. Supreme Court Rules. 2016. Available online: http://www.philly.com/philly/business (accessed on 29 September 2016).
- Widener University School of Law. A Citizen’s Guide to Article 1, Section 27 of the Pennsylvania Constitution; The Widener School of Law’s Environmental & Natural Resources Law Clinic: Harrisburg, PA, USA, 2010. [Google Scholar]
- Lutz, B.D. Generation, transport, and disposal of wastewater associated with Marcellus Shale gas development. Water Resour. Res. 2013, 49, 647–656. [Google Scholar] [CrossRef]
- Hopey, D. Doctors Call for State Ban on Drilling and Fracking. Available online: http://www.post-gazette.com/local/region (accessed on 28 April 2017).
- Arnold, G.; Nguyen-Long, L.A.; Gottlieb, M. Social networks and policy entrepreneurship: How relationships shape municipal decision making about high-volume hydraulic fracturing. Policy Stud. J. 2017, 45, 414–441. [Google Scholar] [CrossRef]
- Conservation Voters of Pennsylvania. Natural Gas Industry Gives $7.175 Million to Pennsylvania Politicians. Available online: www.conservationpa.org/news (accessed on 10 May 2011).
- Money in State Politics. Available online: www.followthemoney.org (accessed on 25 May 2015).
- Newsday.com. Available online: www.data.newsday.com/long-island/data/campaign/contributions-cuomo (accessed on 25 May 2015).
- Penn-Live.com. How-Marcellus-Shale-Divided-A-State. Available online: www.pennlive.com (accessed on 25 May 2015).
- Centre County Public Issues Forum. In The Marcellus Shale: What Does It Mean for Us? Public Issues Forums of Centre County: State College, PA, USA, 2012.
- Mullohollem, J. Shale Gas Threat to Forests Can Be Eased by Consolidating Infrastructure. Available online: http://news.psu.edu/story/463088/2017/04/19 (accessed on 5 May 2017).
- Filteau, M.R. “If you talk badly about drilling, you’re a pariah”: Challenging a capitalist patriarchy in Pennsylvania’s Marcellus Shale Region. Rural Sociol. 2016, 81, 519–544. [Google Scholar] [CrossRef]
- Boudet, H.; Clarke, C.; Bugden, D.; Maibach, E.; Roser-Renourf, C.; Leiserowitz, A. “Fracking” controversy and communication: Using national survey data to understand public perceptions of hydraulic fracturing. Energy Policy 2014, 65, 57–67. [Google Scholar] [CrossRef]
Figure 1.
Marcellus Shale Play Boundary (Source: Susquehanna River Basin Commission).

Figure 2.
Susquehanna River Basin (Source: Susquehanna River Basin Commission).
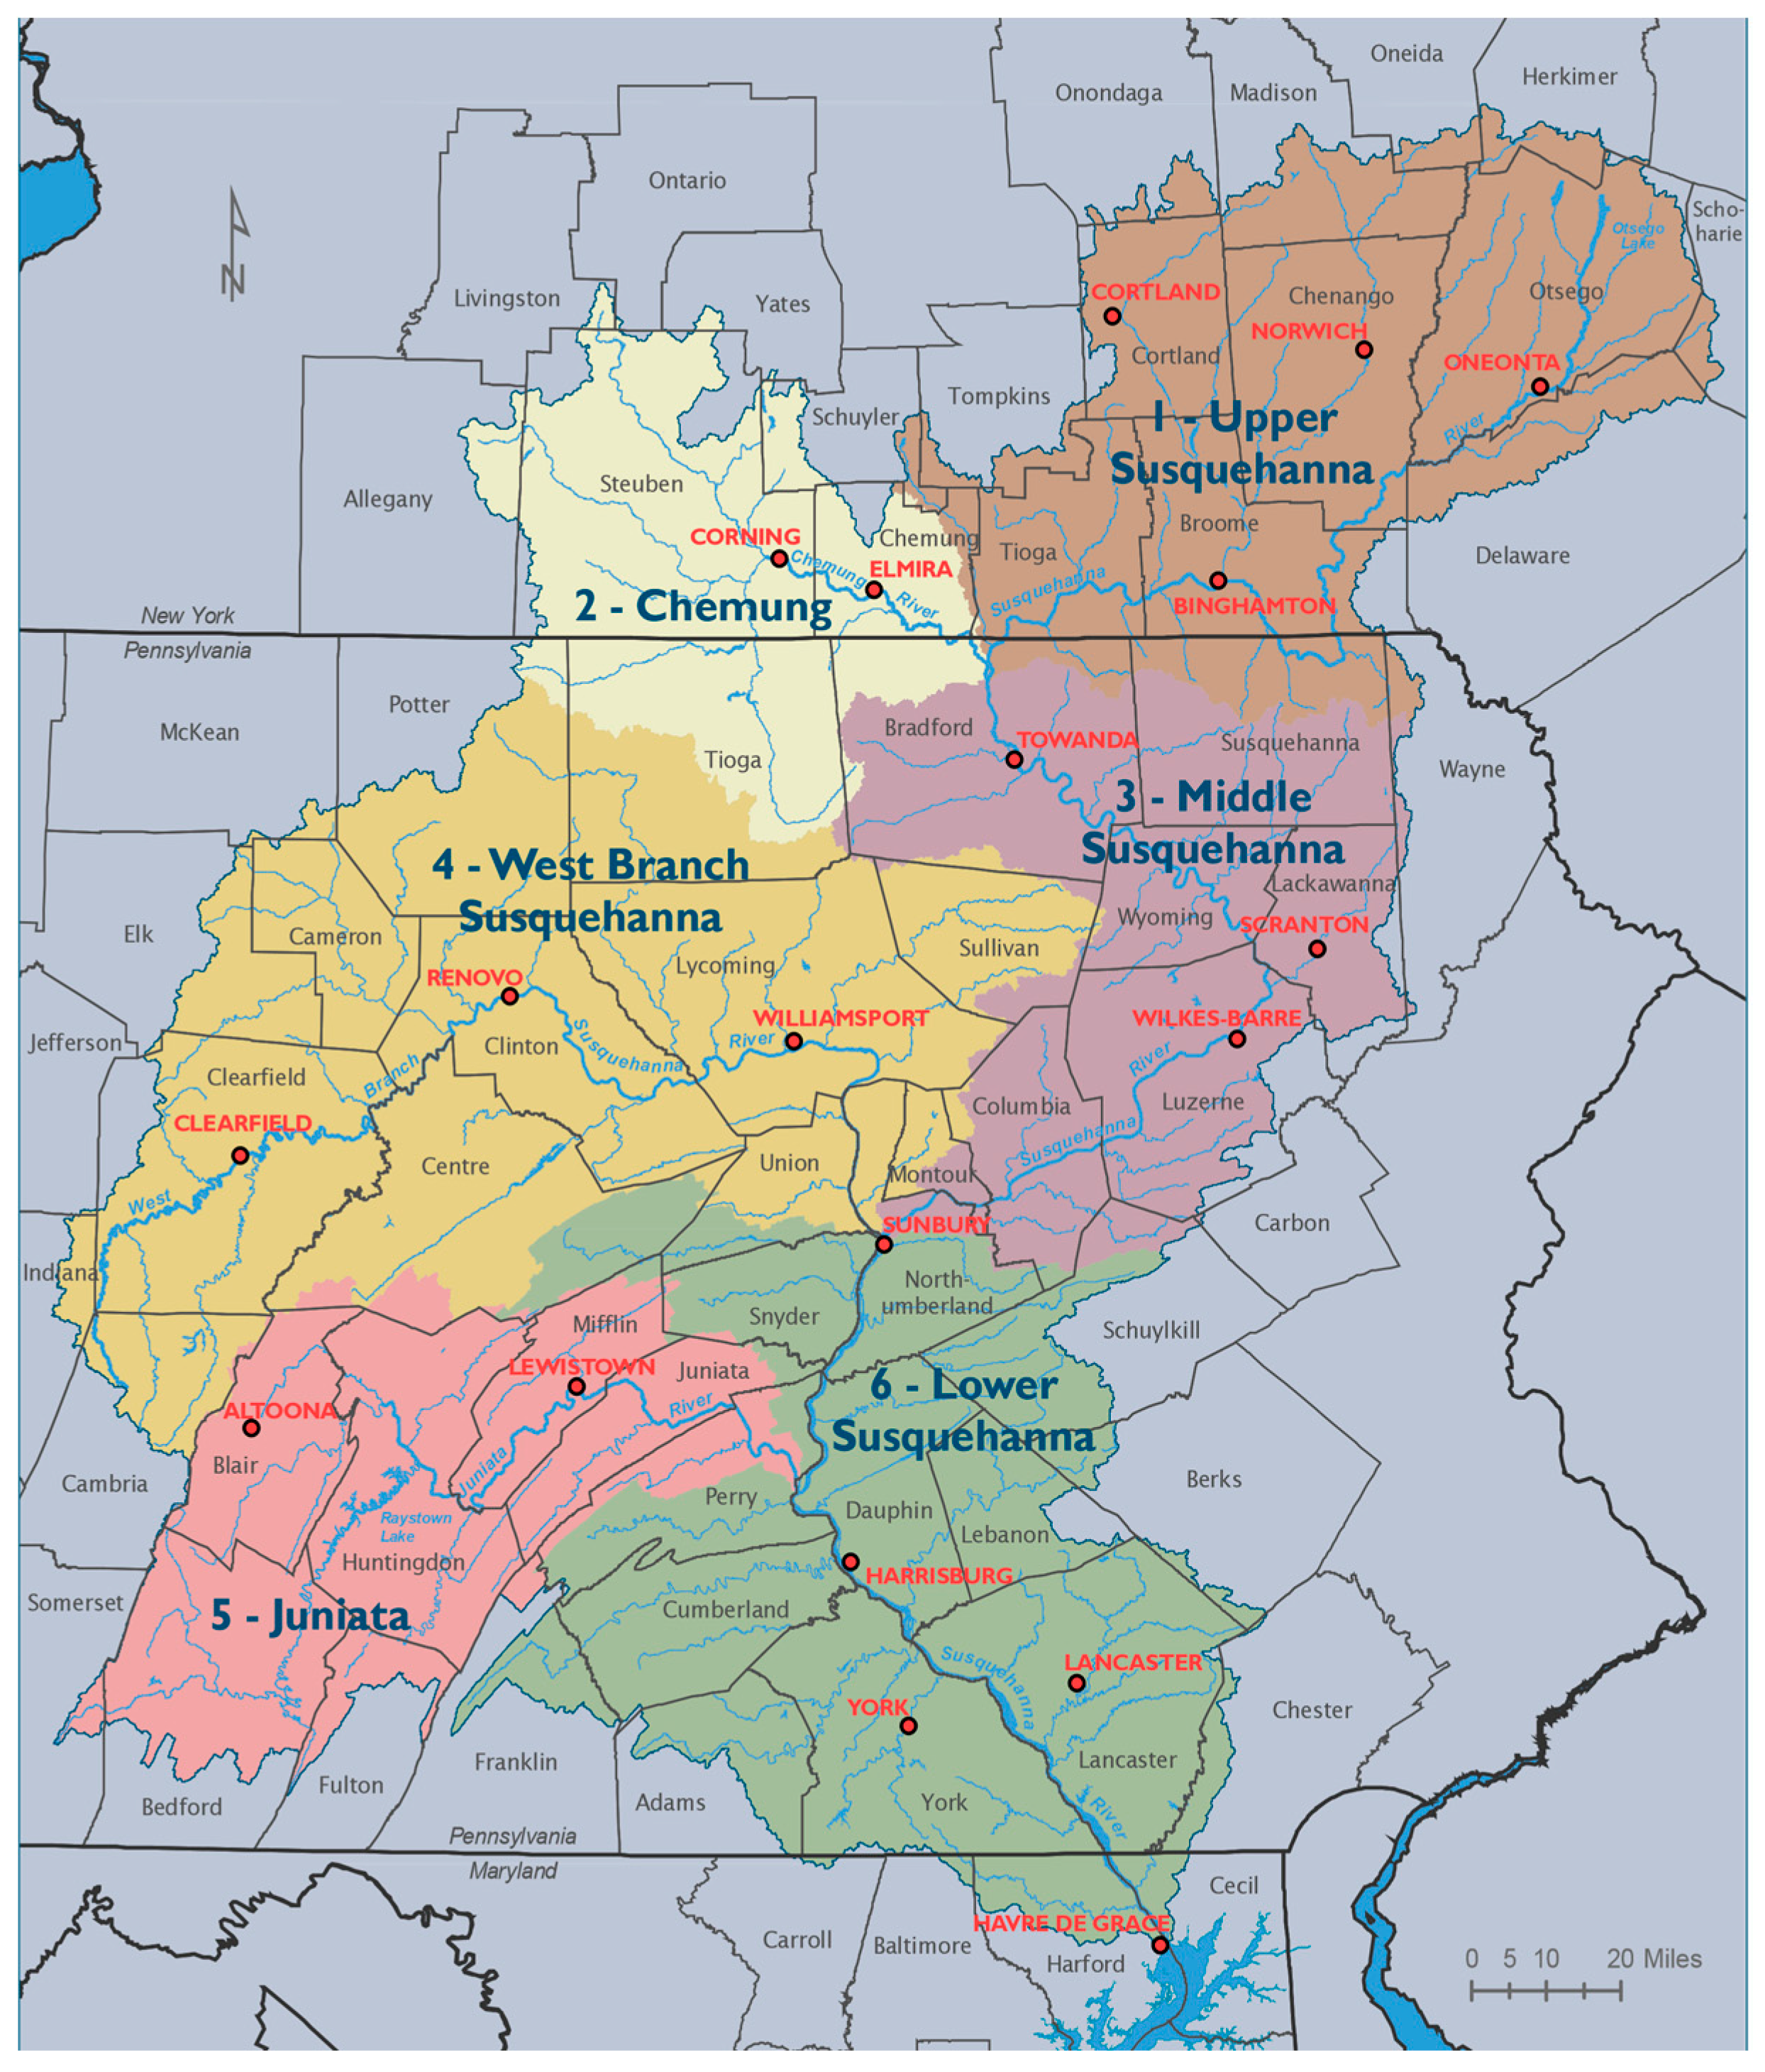
Figure 3.
Distribution of Marcellus Shale wells (Source: Susquehanna River Basin Commission).

Figure 4.
Pennsylvania produces largest total gain in production in 2015 (Source: U.S. Energy Information Administration).
Figure 4.
Pennsylvania produces largest total gain in production in 2015 (Source: U.S. Energy Information Administration).

Figure 5.
Hockey stick decline curve of Pennsylvania natural gas decline after first year drilling (Source: Penn State Marcellus Center for Outreach and Research).
Figure 5.
Hockey stick decline curve of Pennsylvania natural gas decline after first year drilling (Source: Penn State Marcellus Center for Outreach and Research).

Table 1.
Factor analysis of responses to individual categories.
| Panel A. Factor Analysis | |||||||||
| Economic Opportunity | Health and Safety | ||||||||
| Factor | Eigenvalue | Difference | Proportion | Cumulative | Factor | Eigenvalue | Difference | Proportion | Cumulative |
| EC1 | 2.169 | 1.358 | 0.855 | 0.855 | HS2 | 0.462 | 0.246 | 0.168 | 1.117 |
| EC2 | 0.811 | 0.908 | 0.32 | 1.174 | HS3 | 0.216 | 0.239 | 0.079 | 1.195 |
| EC3 | −0.097 | 0.026 | −0.038 | 1.136 | HS4 | −0.023 | 0.052 | −0.008 | 1.187 |
| EC4 | −0.123 | 0.1 | −0.048 | 1.088 | HS5 | −0.075 | 0.079 | −0.027 | 1.159 |
| EC5 | −0.223 | −0.088 | 1 | HS6 | −0.154 | 0.13 | −0.056 | 1.103 | |
| HS7 | −0.285 | −0.103 | 1 | ||||||
| Communities | Energy security | ||||||||
| CM1 | 1.522 | 1.516 | 1.264 | 1.264 | ES1 | 2.05 | 2.001 | 1.193 | 1.193 |
| CM2 | 0.005 | 0.086 | 0.005 | 1.268 | ES2 | 0.049 | 0.15 | 0.028 | 1.221 |
| CM3 | −0.081 | 0.161 | −0.067 | 1.201 | ES3 | −0.102 | 0.017 | −0.059 | 1.162 |
| CM4 | −0.242 | −0.201 | 1 | ES4 | −0.119 | 0.041 | −0.069 | 1.093 | |
| ES5 | −0.16 | −0.093 | 1 | ||||||
| Panel B. Factor Loadings | |||||||||
| Economic Opportunity | Health and Safety | ||||||||
| EC1 | EC2 | Uniqueness | HS1 | HS2 | HS3 | Uniqueness | |||
| q01 | 0.854 | −0.089 | 0.263 | q07 | 0.695 | −0.106 | −0.253 | 0.442 | |
| q02 | 0.811 | 0.228 | 0.291 | q08 | 0.142 | 0.419 | 0.165 | 0.777 | |
| q03 | 0.812 | 0.201 | 0.299 | q09 | 0.737 | −0.237 | 0.169 | 0.372 | |
| q04 | −0.324 | 0.596 | 0.539 | q10 | 0.562 | −0.238 | 0.241 | 0.57 | |
| q05 | −0.134 | 0.596 | 0.627 | q11 | 0.72 | 0.161 | −0.173 | 0.426 | |
| q12 | 0.432 | 0.362 | 0.087 | 0.675 | |||||
| q13 | 0.74 | 0.068 | −0.028 | 0.447 | |||||
| Communities | Energy security | ||||||||
| CM1 | CM2 | Uniqueness | ES1 | ES2 | Uniqueness | ||||
| q16 | 0.548 | 0.051 | 0.698 | q21 | 0.769 | −0.002 | 0.408 0.826 0.722 0.423 0.522 | ||
| q17 | 0.643 | −0.046 | 0.585 | q22 | −0.383 | 0.165 | |||
| q18 | 0.715 | −0.015 | 0.489 | q23 | 0.509 | 0.139 | |||
| q19 | 0.545 | 0.023 | 0.702 | q24 | 0.759 | 0.026 | |||
| q25 | 0.69 | −0.037 | |||||||
Table 2.
Factor analysis on all responses.
| Panel A. Factor Analysis | ||||
| Factor | Eigenvalue | Difference | Proportion | Cumulative |
| FA1 | 7.546 | 5.538 | 0.633 | 0.633 |
| FA2 | 2.008 | 1.044 | 0.169 | 0.802 |
| FA3 | 0.964 | 0.172 | 0.081 | 0.883 |
| FA4 | 0.792 | 0.255 | 0.066 | 0.949 |
| FA5 | 0.537 | 0.155 | 0.045 | 0.994 |
| FA6 | 0.382 | 0.047 | 0.032 | 1.026 |
| FA7 | 0.336 | 0.097 | 0.028 | 1.054 |
| FA8 | 0.239 | 0.058 | 0.020 | 1.074 |
| FA9 | 0.180 | 0.099 | 0.015 | 1.089 |
| FA10 | 0.081 | 0.033 | 0.007 | 1.096 |
| FA11 | 0.048 | 0.039 | 0.004 | 1.100 |
| FA12 | 0.009 | 0.051 | 0.001 | 1.101 |
| Panel B. Factor Loadings | ||||
| Variable | FA1 | FA2 | Uniqueness | |
| q01 | −0.751 | 0.399 | 0.222 | |
| q02 | −0.593 | 0.592 | 0.195 | |
| q03 | −0.647 | 0.497 | 0.212 | |
| q04 | 0.548 | 0.056 | 0.295 | |
| q05 | 0.493 | 0.319 | 0.390 | |
| q07 | 0.823 | −0.149 | 0.213 | |
| q08 | 0.003 | 0.414 | 0.559 | |
| q09 | 0.690 | 0.209 | 0.224 | |
| q10 | 0.436 | 0.234 | 0.570 | |
| q11 | 0.687 | 0.058 | 0.377 | |
| q12 | 0.327 | 0.463 | 0.528 | |
| q13 | 0.729 | 0.168 | 0.315 | |
| q16 | 0.597 | −0.035 | 0.488 | |
| q17 | 0.365 | 0.428 | 0.505 | |
| q18 | 0.532 | 0.337 | 0.407 | |
| q19 | 0.636 | 0.414 | 0.284 | |
| q21 | 0.721 | 0.077 | 0.340 | |
| q22 | −0.485 | 0.291 | 0.525 | |
| q23 | 0.483 | −0.151 | 0.558 | |
| q24 | 0.688 | 0.058 | 0.356 | |
| q25 | 0.760 | −0.150 | 0.317 | |
Table 3.
Regression analysis.
| VARIABLES | (1) | (2) | (3) | (4) | (5) | (6) |
|---|---|---|---|---|---|---|
| EC1 | HS1 | CM1 | ES1 | FA1 | FA2 | |
| Homeownership | 0.023 | 0.091 | 0.072 | 0.088 | 0.103 | 0.396 * |
| (0.231) | (0.219) | (0.233) | (0.240) | (0.276) | (0.208) | |
| River visit | 0.005 | 0.001 | 0.002 | 0.005 | 0.002 | 0.015 |
| (0.009) | (0.009) | (0.008) | (0.008) | (0.009) | (0.011) | |
| Education | −0.088 ** | 0.070 ** | 0.064 ** | 0.074 ** | 0.099 ** | −0.019 |
| (0.035) | (0.029) | (0.028) | (0.034) | (0.039) | (0.036) | |
| Gender | 0.486 *** | −0.695 *** | −0.488 *** | −0.631 *** | −0.795 *** | −0.120 |
| (0.167) | (0.170) | (0.143) | (0.156) | (0.174) | (0.168) | |
| Age | 0.001 | 0.009 | 0.007 | −0.001 | 0.004 | 0.007 |
| (0.006) | (0.006) | (0.005) | (0.005) | (0.006) | (0.006) | |
| Marriage | 0.091 | 0.127 | 0.096 | −0.101 | 0.004 | 0.296 |
| (0.212) | (0.238) | (0.174) | (0.195) | (0.244) | (0.221) | |
| Employment | −0.301 | 0.002 | −0.034 | −0.046 | 0.066 | −0.291 |
| (0.256) | (0.181) | (0.200) | (0.197) | (0.215) | (0.252) | |
| Salary | 0.018 *** | −0.013 ** | −0.009 | −0.016 *** | −0.019 *** | 0.007 |
| (0.005) | (0.006) | (0.006) | (0.006) | (0.006) | (0.008) | |
| Constant | 0.806 | −1.196 * | −1.154 * | −0.55 | −1.186 | −0.733 |
| (0.657) | (0.642) | (0.591) | (0.652) | (0.760) | (0.712) | |
| Observations | 131 | 113 | 112 | 105 | 102 | 102 |
| R-squared | 0.186 | 0.277 | 0.184 | 0.306 | 0.364 | 0.115 |
Robust standard errors in parentheses *** p < 0.01, ** p < 0.05, * p < 0.1.
© 2017 by the authors. Licensee MDPI, Basel, Switzerland. This article is an open access article distributed under the terms and conditions of the Creative Commons Attribution (CC BY) license (http://creativecommons.org/licenses/by/4.0/).
Share and Cite
MDPI and ACS Style
Heuer, M.; Yan, S. Marcellus Shale Fracking and Susquehanna River Stakeholder Attitudes: A Five-Year Update. Sustainability 2017, 9, 1713. https://doi.org/10.3390/su9101713
AMA Style
Heuer M, Yan S. Marcellus Shale Fracking and Susquehanna River Stakeholder Attitudes: A Five-Year Update. Sustainability. 2017; 9(10):1713. https://doi.org/10.3390/su9101713
Chicago/Turabian StyleHeuer, Mark, and Shan Yan. 2017. "Marcellus Shale Fracking and Susquehanna River Stakeholder Attitudes: A Five-Year Update" Sustainability 9, no. 10: 1713. https://doi.org/10.3390/su9101713
Note that from the first issue of 2016, this journal uses article numbers instead of page numbers. See further details here.