Article

The Effect of Geometry Parameters on Energy and Thermal Performance of School Buildings in Cold Climates of China

1
School of Architecture, Tianjin University, No. 92 Weijin Street, Nankai District, Tianjin 300072, China
2
Department of Architectural Engineering and Technology, Faculty of Architecture and the Built Environment, Delft University of Technology, P.O. Box 5043, 2600 GA Delft, The Netherlands
*
Author to whom correspondence should be addressed.
Sustainability 2017, 9(10), 1708; https://doi.org/10.3390/su9101708
Submission received: 7 August 2017 / Revised: 16 September 2017 / Accepted: 20 September 2017 / Published: 24 September 2017

Abstract

:
This paper discusses the role of geometry parameters including building shape, window to wall ratio, room depth, and orientation on the energy use and thermal comfort of school buildings in cold climates of China. The annual total energy demand and summer thermal discomfort time were compared through computer simulations with DesignBuilder. Furthermore, a questionnaire was conducted that related to the students’ subjective preference for various building geometry parameters. Results showed that a maximum of 13.6% of energy savings and 3.8% of thermal comfort improvement when compared to the reference case could be achieved through variations in geometry parameters. The H shape performed the best when the building thermal performance and students’ preferences were considered, as well as the various design options for architects. Window to wall ratio, room depth, and orientation should also be carefully addressed in terms of different building types. The results of this study can serve as a reference for architects and school managers in the early design stages of schools in cold climates of China.

1. Introduction

Today, energy efficiency is a crucial factor in building design due to increasing energy demand for building services and thermal comfort levels. Energy consumption of non-domestic buildings account for 24.8% of total building energy consumption in China [1], and school buildings account for a large proportion of all kinds of non-domestic buildings, and thus play an important role in energy saving. The U.S. Department of Energy (DOE) estimated that through better energy management, at least 25% of the USD $6 billion that colleges and universities spend annually on energy could be saved [2]. Furthermore, it has been proven that indoor environments can contribute significantly to the learning efficiency and health of those in classrooms [3,4].
In many previous studies, emphasis has been placed on materials, construction, and air conditioning to improve the energy use and thermal performance of buildings. However, as the only elements that do not change exhaustively during the life cycle of a building, building geometry factors could also have a potential impact on its lifetime performance. Most research has addressed the effects of building form on energy consumption for dwellings and office buildings [5,6,7,8], while school buildings have been much less studied. Steadman [9] proposed five theoretical English school plan types and compared their compactness, south wall ratio, percentage of circulation area, and traffic distances. He concluded that open-air schools performed best for air quality, daylight, and contact with nature among these five archetypes. Montenegro et al. [10] proposed nine spatial typologies of school buildings for cold (Montreal, QC, Canada) and temperate (Santiago, Chile) climates and studied their visual, thermal, and energy performance. They found that the best performances were consistently related to linear typologies under both climates. Da Graça et al. [11] classified school building plan types in São Paulo, Brazil and presented a method for evaluating and optimizing the parameters of school buildings by considering four aspects of comfort: thermal, acoustic, natural lighting, and functionality. The simultaneous maximization of various aspects of comfort was shown to be impossible; however, compromises were found. Furthermore, Dimoudi et al. [12] summarized school types in terms of building plan in the C’ climatic zone of Greece—a region with the lowest air temperature during the winter period—and studied the thermal performance of the ‘ATHINA’ type before suggesting a combination of different energy saving measures. Zomorodian et al. [13] investigated the architectural parameters of school buildings in the hot and dry climate of Iran, including some geometry factors such as building shape, space organization, and window-to-wall ratio. The primary energy demand of the studied case was found to decrease by 31% by only applying optimum architectural strategies, without any change in the building materials and construction parameters. Perez and Capeluto [14] assessed the influence of different design variables on the energy consumption of school buildings in the hot–humid climatic zone of Israel. Comparative tests were undertaken to determine which variables had the greatest impact on energy consumption and thermal comfort in the classroom. Complex interdependence among the design variables was found, and some recommended values for each variable required to achieve a high-performance classroom were determined. Cantón et al. [15] applied an experimental and theoretical model for the assessment of courtyard shape as a passive strategy for interior classroom conditioning in Mendoza, Argentina. Results indicated that the shading pattern of the courtyard was the strategy that most highly impacted the thermal and energy conditions in classrooms. Su [16] studied the relationships between winter extra energy data and school building design elements in Auckland, New Zealand. Results showed that conventional school designs in Auckland (with a high ratio of building surface to volume) were not suitable for the local climate. Therefore, it was suggested that minimizing the number of isolated buildings and increasing the height and volume of school buildings on a school campus could save energy in winter. Finally, Zhang et al. [17] adopted a multi-objective genetic algorithm to optimize both the thermal and daylight performance of school buildings in cold climate areas in China. Three kinds of layout plans—together with different glazing and shading types, room and corridor depths, etc.—were simulated and compared, where the double-sided corridor school was found to have the best performance. Relevant design parameters were also suggested.
The abovementioned studies have shown that geometry parameters can have a significant impact on the thermal performance of school buildings. However, few general guidelines are available for architects on the impact of building form on thermal performance. Moreover, the heating, ventilation, and air conditioning (HVAC) pattern of buildings differs in terms of climate. In cold climate areas of China, district heating is generally provided by the government in winter while in summer, most schools are naturally ventilated without air conditioning. From the perspective of a whole year, both energy use and summer thermal comfort need to be considered to assess the annual building thermal performance.
Additionally, geometry design can have a potential effect on the users’ subjective feelings [18]. The complexity and symmetry [19], golden ratio factor [20], and categorical prototype [21] of a shape have all been proven to have certain effects on the human aesthetic preference. As for buildings, both the external appearance and the interior spaces [22] influence the occupants’ sensation and stimulate positive or negative feelings, which might have a further impact on the working efficiency. Thus, the users’ preference of geometry parameters should also be addressed.
The main goal of this study was to evaluate the role of geometry parameters on the thermal performance of school buildings by performing energy simulations for various design combinations. Moreover, a questionnaire was conducted to investigate the students’ subjective preferences for building geometry parameters. Finally, school design proposals were presented that consider both the building thermal performance and students’ preferences.

1.1. Typical Features of School Buildings

To better understand the geometry parameters of school buildings, information regarding 170 local school designs (including 207 teaching buildings) from eight cities located in the cold climate zone of China was collected and analyzed in this study. This information included school building plans, the number of classrooms, number of stories, orientation, window to wall ratio, and room depth. The 207 school buildings were divided into seven categories in terms of floor plans, as shown in Table 1. Some of the 207 school buildings did not fall under one of these categories and were considered to have an irregular shape.
The rectangular shape design was the most common typology, accounting for 36% of the investigated buildings. The C shape ranked second with 20% of the total school buildings, while L shape and courtyard type accounted for 12% and 11%, respectively. Moreover, there was a small proportion of buildings with an H shape or H shape with an atrium. Most school buildings had a maximum of six stories, while some buildings had seven to 10 stories and usually had a compact floor plan, which was classified as a high-rise in this study. It was noted that the seven major types of school buildings accounted for a vast majority of local school buildings (86%) with the irregular type only accounting for 14%. The number of school classrooms ranged between 6–133, and each type varied greatly. However, schools with classrooms between 20 and 40 accounted for approximately half of the investigated schools. Schools composed of 24 classrooms were among the most common, and thus were selected in this study.
The most common orientation that appeared in every building type was south. There were also a number of buildings with a west and east orientation. Orientation to the north, southeast, southwest, and sometimes northwest occurred least. The range of window to wall ratio differed little between building types, with values generally ranging from approximately 20% to a maximum of 90%. In addition, the range of room depth for all building types was also similar, with the minimum room depth around 6.0 m and the maximum room depth around 11.0 m. In summary, there was not much difference in orientation, window to wall ratio, and room depth between the various building types.

1.2. Thermal Behavior of School Buildings

According to the National Standard of Climatic Regionalization for Architecture [23], China is divided into five zones based on climate characteristics: very cold, cold, hot summer and cold winter, hot summer and warm winter, and moderate. The cold climate zone of China studied in this paper features a cold and dry winter, as well as a hot and humid summer. Seasonal variations were obvious due to its continental properties, of which the average temperature of the coldest month (January) ranged between –10 °C and 0 °C, and the average temperature of the hottest month (July) ranged between 18 °C and 28 °C.
The thermal design code prescribes that buildings in the cold climate zone of China should meet the insulation requirements in winter, while taking into account the heat resistance in summer [24], which indicates that heat preservation in winter is as important as heat protection in summer. In actual fact, most schools in the cold climate zone are equipped with district heating systems in winter, while most schools in summer are naturally ventilated without a cooling system. In terms of the survey on the energy consumption of 270 schools in Tianjin—a city in the cold climate of China—space heating energy consumption accounted for approximately 64–79% of the total primary energy consumption [25]. The space heating energy consumption of schools adopting district heating or gas boilers were 92.0 kWh/(m2∙a) and 64.3 kWh/(m2∙a), respectively.
On the other hand, since air conditioning is generally not provided for classrooms in summer, students were accustomed to opening or closing windows to control the indoor temperature and ventilation. This might reduce the total energy use, as there is no cooling energy consumption; however, the thermal environment is not always acceptable to the students. A field study on the summer indoor environment in Tianjin showed that most of the 180 participants felt hot and slightly moist in the main teaching building under natural ventilation [26]. Another local investigation into the summer indoor environment in Xi’an (also a city in the cold climate zone) showed that the Predicted Mean Vote (PMV) values of most classrooms in a school were above 3.0 in summer [27], which is considered as very hot based on the seven grades of thermal perception.
Both the winter and summer thermal performance should be considered when designing or retrofitting a school building. In this study, the annual total energy consumption and summer thermal comfort were chosen as the evaluation criteria to assess the annual performance of school buildings.

2. Methodology

Our approach was illustrated by using a prototypical secondary school building composed of 24 classrooms, which was among the most common configuration according to the field survey. DesignBuilder, an energy analysis software package using the EnergyPlus simulation engine, was chosen to simulate the annual energy consumption and summer thermal comfort. It is worth mentioning that the accuracy of the DesignBuilder software has been validated using the BESTest (Building Energy Simulation TEST) procedure developed by the International Energy Agency [28]. It has also been adopted to simulate the energy balance and thermal comfort level of school buildings in different countries [29,30]. Moreover, its applicability in the cold climate of China has also been validated [31].

2.1. School Building Models

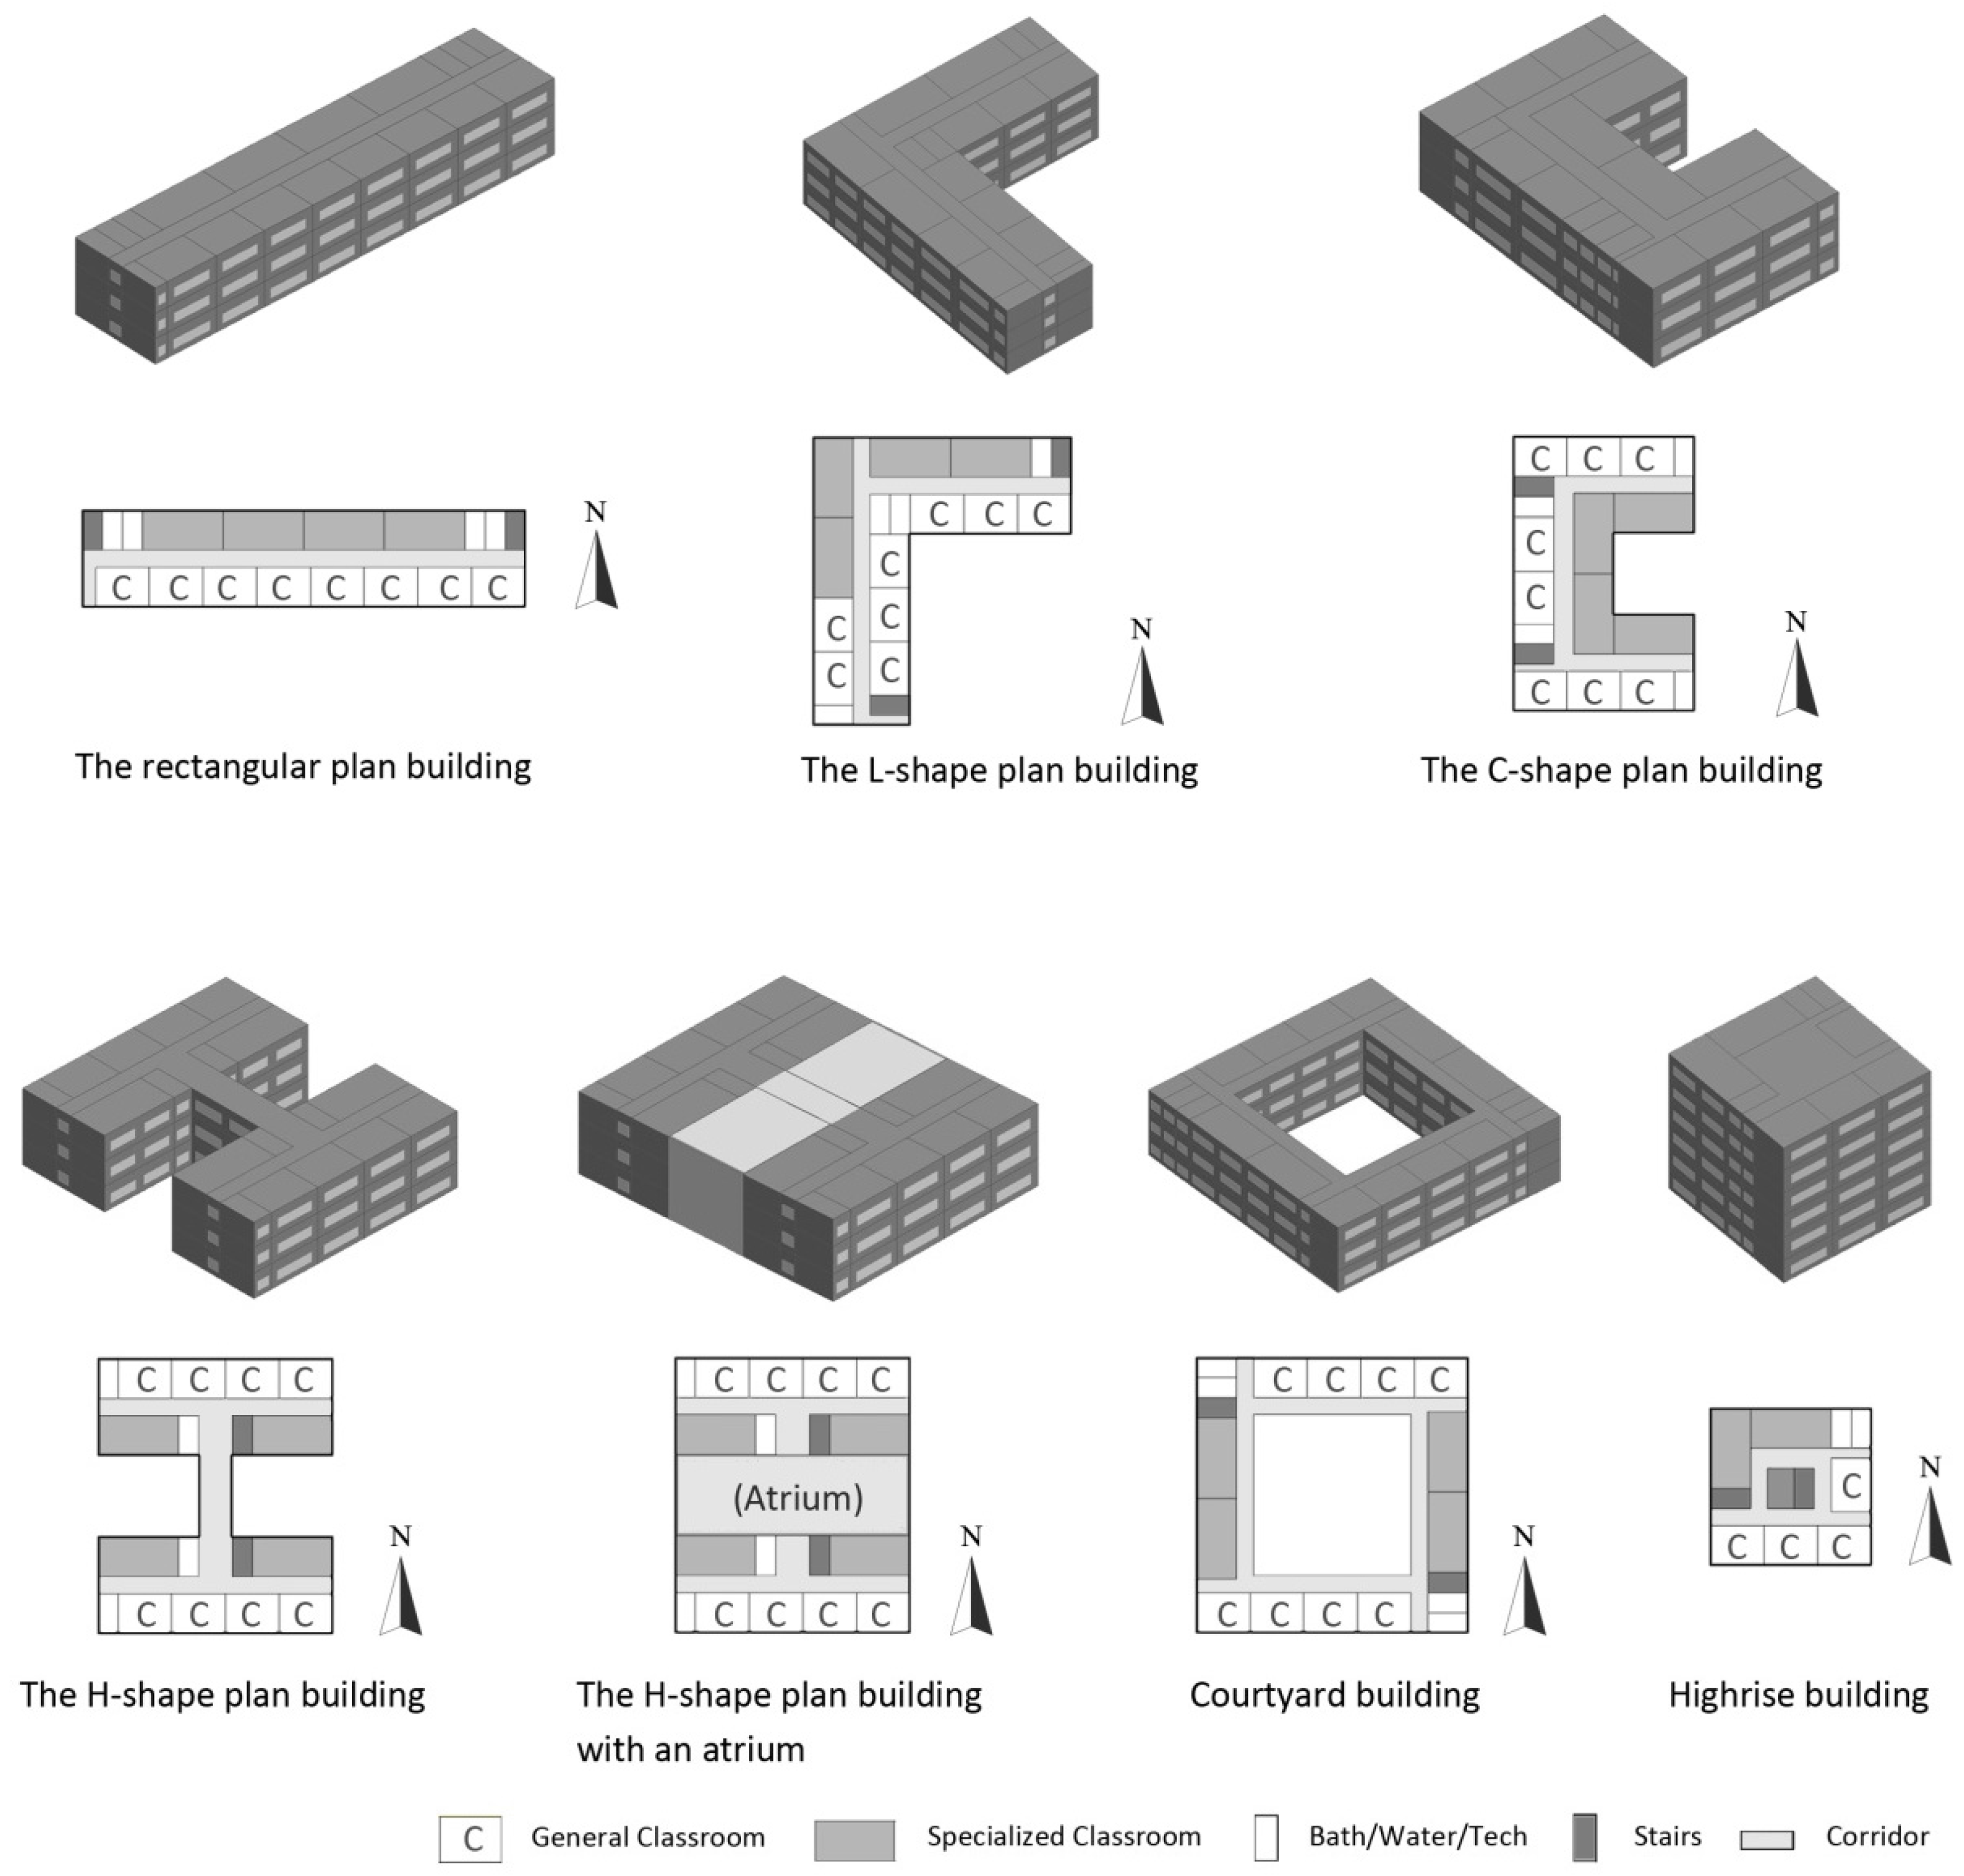
Seven school building models were built in DesignBuilder according to the abovementioned analysis, including the rectangular shape, L shape, C shape, H shape, H shape with an atrium (Ha shape), courtyard, and high-rise. Each of the seven archetypes had the same spatial composition: general classroom, specialized classroom, bathroom, water room, plant room, and circulation space, among which the specialized classroom could also be further categorized into laboratory, history room, etc. The specific environmental requirements for these rooms are presented in Table 2, according to local norms. Moreover, the size and numbers of different kinds of rooms were kept identical for each configuration. The width of the corridor was set at a constant of 2.5 m for all models.
Figure 1 shows the seven building models as well as their internal spatial organization patterns. General classrooms were placed on one side of the building, with the specialized classrooms on the other side in terms of common functional zoning. Auxiliary spaces were arranged in the corner or connection of buildings. The first six models were three-stories high, with each floor having eight general classrooms, four specialized classrooms, four service rooms, and two staircases, while the high-rise model had six floors, with each floor consisting of four general classrooms, two specialized classrooms, two service rooms, and two staircases. The general classrooms were modeled with a net size of 8 m × 6 m and the specialized classrooms were 12 m × 6 m.
Three related design parameters were varied in calculating the energy and thermal comfort of the seven building shapes. The building model was rotated by 90°, 180°, and 270° representing west, north, and east, respectively, to test the orientation effect. Another tested parameter was window to wall ratio (WWR), which indicates the percentage of an exterior wall area occupied by glazing material. WWR is a key factor that affects the solar irradiation entering a building through façades. Nine WWR values were tested, ranging from 10–90% with a 10% interval according to the above field survey. The last parameter evaluated by this study was room depth (RD), an important geometry parameter which affects heat storage and daylight penetration of a space. The school building models tested four values of room depth, 6 m, 8 m, 10 m, and 12 m, based on typical spans of column grid for the investigated school buildings. Though the large room depths (e.g., 12 m) might have been too narrow for the auxiliary rooms, our aim was only to investigate the effect of room depth. Additionally, the 12-m room depth was not applicable to the C shape, H shape, and Ha shape due to the size limit of these three types. In total, 900 energy simulations were performed for various combinations of building and fenestration geometry parameters. Other details of the sub-models were also introduced as follows.
• Construction
The details of the wall, roof, and glazing materials used in the simulations are presented in Table 3. The heat transfer calculations were carried out using steady-state methods.
• HVAC
District heating systems are widely used in the cold climate zone of China. The heating system considered for models was based on radiators, which reflects actual Chinese school buildings. For the simulations, the radiant fraction was assumed to be 0.65. The heating set points for different rooms are described in Table 2 in terms of design code [32], and the heating setbacks were 5 °C [33]. For the H shape with an atrium, the atrium spaces were considered as circulation areas.
The models were not equipped with a cooling system, since a substantial fraction of school buildings is naturally ventilated in summer in the cold climate zone of China. Students are accustomed to opening or closing windows to control the indoor temperature and ventilation. The duration of the free running mode period was based on the local standard and weather conditions. The government generally provides heat from November to March in Tianjin, yet the heating period of schools and hospitals is often extended [34]. In this study, it was assumed that the heating season was from 1 November to 30 April of the next year. Thus, the other six months from 1 May to 31 October, were free running seasons. In the free running period, it was assumed that natural ventilation would be employed, by opening up to 60% of total windows when the indoor air temperature rose above 22 °C. For the H shape with an atrium, the operation of the internal windows between classrooms and atria was the same as the external windows. The natural ventilation flow rate was calculated using wind and buoyancy-driven pressure, opening sizes and operation, crack sizes, etc.
The zones were assumed to be occupied between 8:00–12:00 and 14:00–17:00 (Monday to Friday). It is also worth noting that typical Chinese school holidays (which account for 95 days throughout the year) were also considered, including vacations during the hot summer days and the cold winter period. The heating system was set to operate except for the free running period. The set points should be met when the zones are occupied and the setback points should be met at night or during holidays.
• Glazing type and lighting
The external window type for the models was a double-glazed window with an air gap in between layers (U-value = 2.67 W/(m2 K)). The solar heat gain coefficient (SHGC) was 0.70, and the visible transmittance (VT) was 0.78. Table 4 shows the input data used for the lighting simulations. In this project, the minimum required illuminance level for general classrooms was 300 lx and the corridor or staircase requires at least 100 lx [35]. Some special requirements for specific rooms prescribed by the energy code are listed in Table 2. Moreover, a suspended luminaire type with a 0.42 radiation fraction was assumed (this is the fraction of heat from lights that goes into the zone as long wave radiation). The visible fraction was set at 0.18, representing the fraction of heat from lights that goes into the zone as short-wave radiation. The lighting density for different rooms is shown in Table 2. As electric lights are controlled according to the availability of natural light, illuminance levels were calculated at every timestep during the simulation and then used to determine how much the electric lighting could be reduced. In addition, the overhead lights dimmed continuously and linearly from the maximum electric power to save energy.
• Internal loads
The occupancy density and office equipment for different rooms are shown in Table 2. The latent heat gain fraction from people was set at 0.50. The radiation fraction of office equipment was set at 0.20.

2.2. Climatic Data

Tianjin, a typical city in the cold climate zone of China, was selected as the study site. The monthly average temperature ranges from 26.8 °C in July to −3.4 °C in January, with an annual mean of 12.9 °C (Table 5). The mean relative humidity ranges from 50% (April) to 76% (August). During summer, the most frequent wind direction is from the southeast, and in winter the highest frequency of excessive wind speed appears from the northwest. The average outdoor wind speed (WS) is approximately 4.0 m/s annually [36].

2.3. Thermal Comfort Calculation

The adaptive thermal comfort model in the American Society of Heating, Refrigerating and Air-Conditioning Engineers (ASHRAE) 55-2010 was used in this study to evaluate the summer thermal comfort of school buildings. The standard was based on the database compiled from several countries worldwide and has proven to be more reliable than the Predicted Mean Vote (PMV) index in free running buildings [37,38,39]. Moreover, its applicability in the cold climate zone of China has also been recently verified [40]. The standard uses the relationship between the indoor thermal comfort temperature and the outdoor temperature to define acceptable zones for indoor temperature in naturally conditioned buildings. The zones are based on the following equation for calculating the indoor thermal comfort temperature (Tco) according to the outdoor reference temperature (Tref):
Tco = 0.31 × Tref + 17.8 °C
where Tref = prevailing mean outdoor air temperature for a time period between the last 7–30 days before the day in question [41]. This equation can be used when the outdoor dry bulb temperatures range from 10–33.5 °C. In this study, the 80% acceptability limit used for typical applications was employed for the thermal comfort assessment of school buildings.

2.4. Questionnaire

A survey was conducted that related to the students’ subjective evaluation of the building geometry parameters. Studies have proven that participants responded identically to the slides and pictures displayed as if they were on site [42,43]. The reliability of pictures in comparison to real situations has also been validated for buildings [44] and urban environments [45]. Moreover, computer graphics or modified colored pictures are considered as the most efficient way to manipulate and control research variables, and have been widely used as a research tool for environmental aesthetics [46,47,48]. Therefore, SketchUp software modeling was chosen to gather accurate and viable data and collect results from participants when evaluating aesthetic perceptions of the built environment [49]. Images were produced in SketchUp based on the four investigated factors (namely shape, WWR, room depth, and orientation) and then printed.
In addition, the students’ attention to these four parameters and their impact on learning efficiency were also investigated. Three classes of students from the high school attached to Tianjin University were asked to rate the geometry parameters that they would prefer. A seven-point-Likert scale was used to measure the level of aesthetics, ranging from extremely attractive (7), moderately attractive (6), slightly attractive (5), neutral (4), slightly unattractive (3), moderately unattractive (2), and extremely unattractive (1). Higher scores indicated more attraction to the participants. The questionnaire is provided in Supplementary Data. Questionnaires were collected immediately afterwards, with a total of 156 valid questionnaires. The statistical software SPSS 22.0 was used for reliability and validity analysis.

3. Results and Discussion

Both the energy use and summer thermal comfort were calculated to assess the annual performance of a school building. For energy evaluation, the sum of heating, lighting, and other interior electrical equipment, etc. was calculated as the total annual energy consumption (Et). Cooling energy consumption was not included since the school building models were not equipped with a cooling system in summer. Summer thermal comfort was evaluated using the percentage of discomfort hours averaged for all thermal zones of the school building (Cd). To facilitate comparison, both Et and Cd were normalized relative to a reference building, which was the rectangular type of building with a room depth of 6 m and no rotation. The WWR was set at 40%, which is the maximum allowable window area prescribed by the energy standard [50]. The annual energy consumption and percentage of discomfort time of the reference building (Eref and Cref) were 54.1 kWh/m2 and 33.9%, respectively.

3.1. Energy Consumption and Thermal Comfort

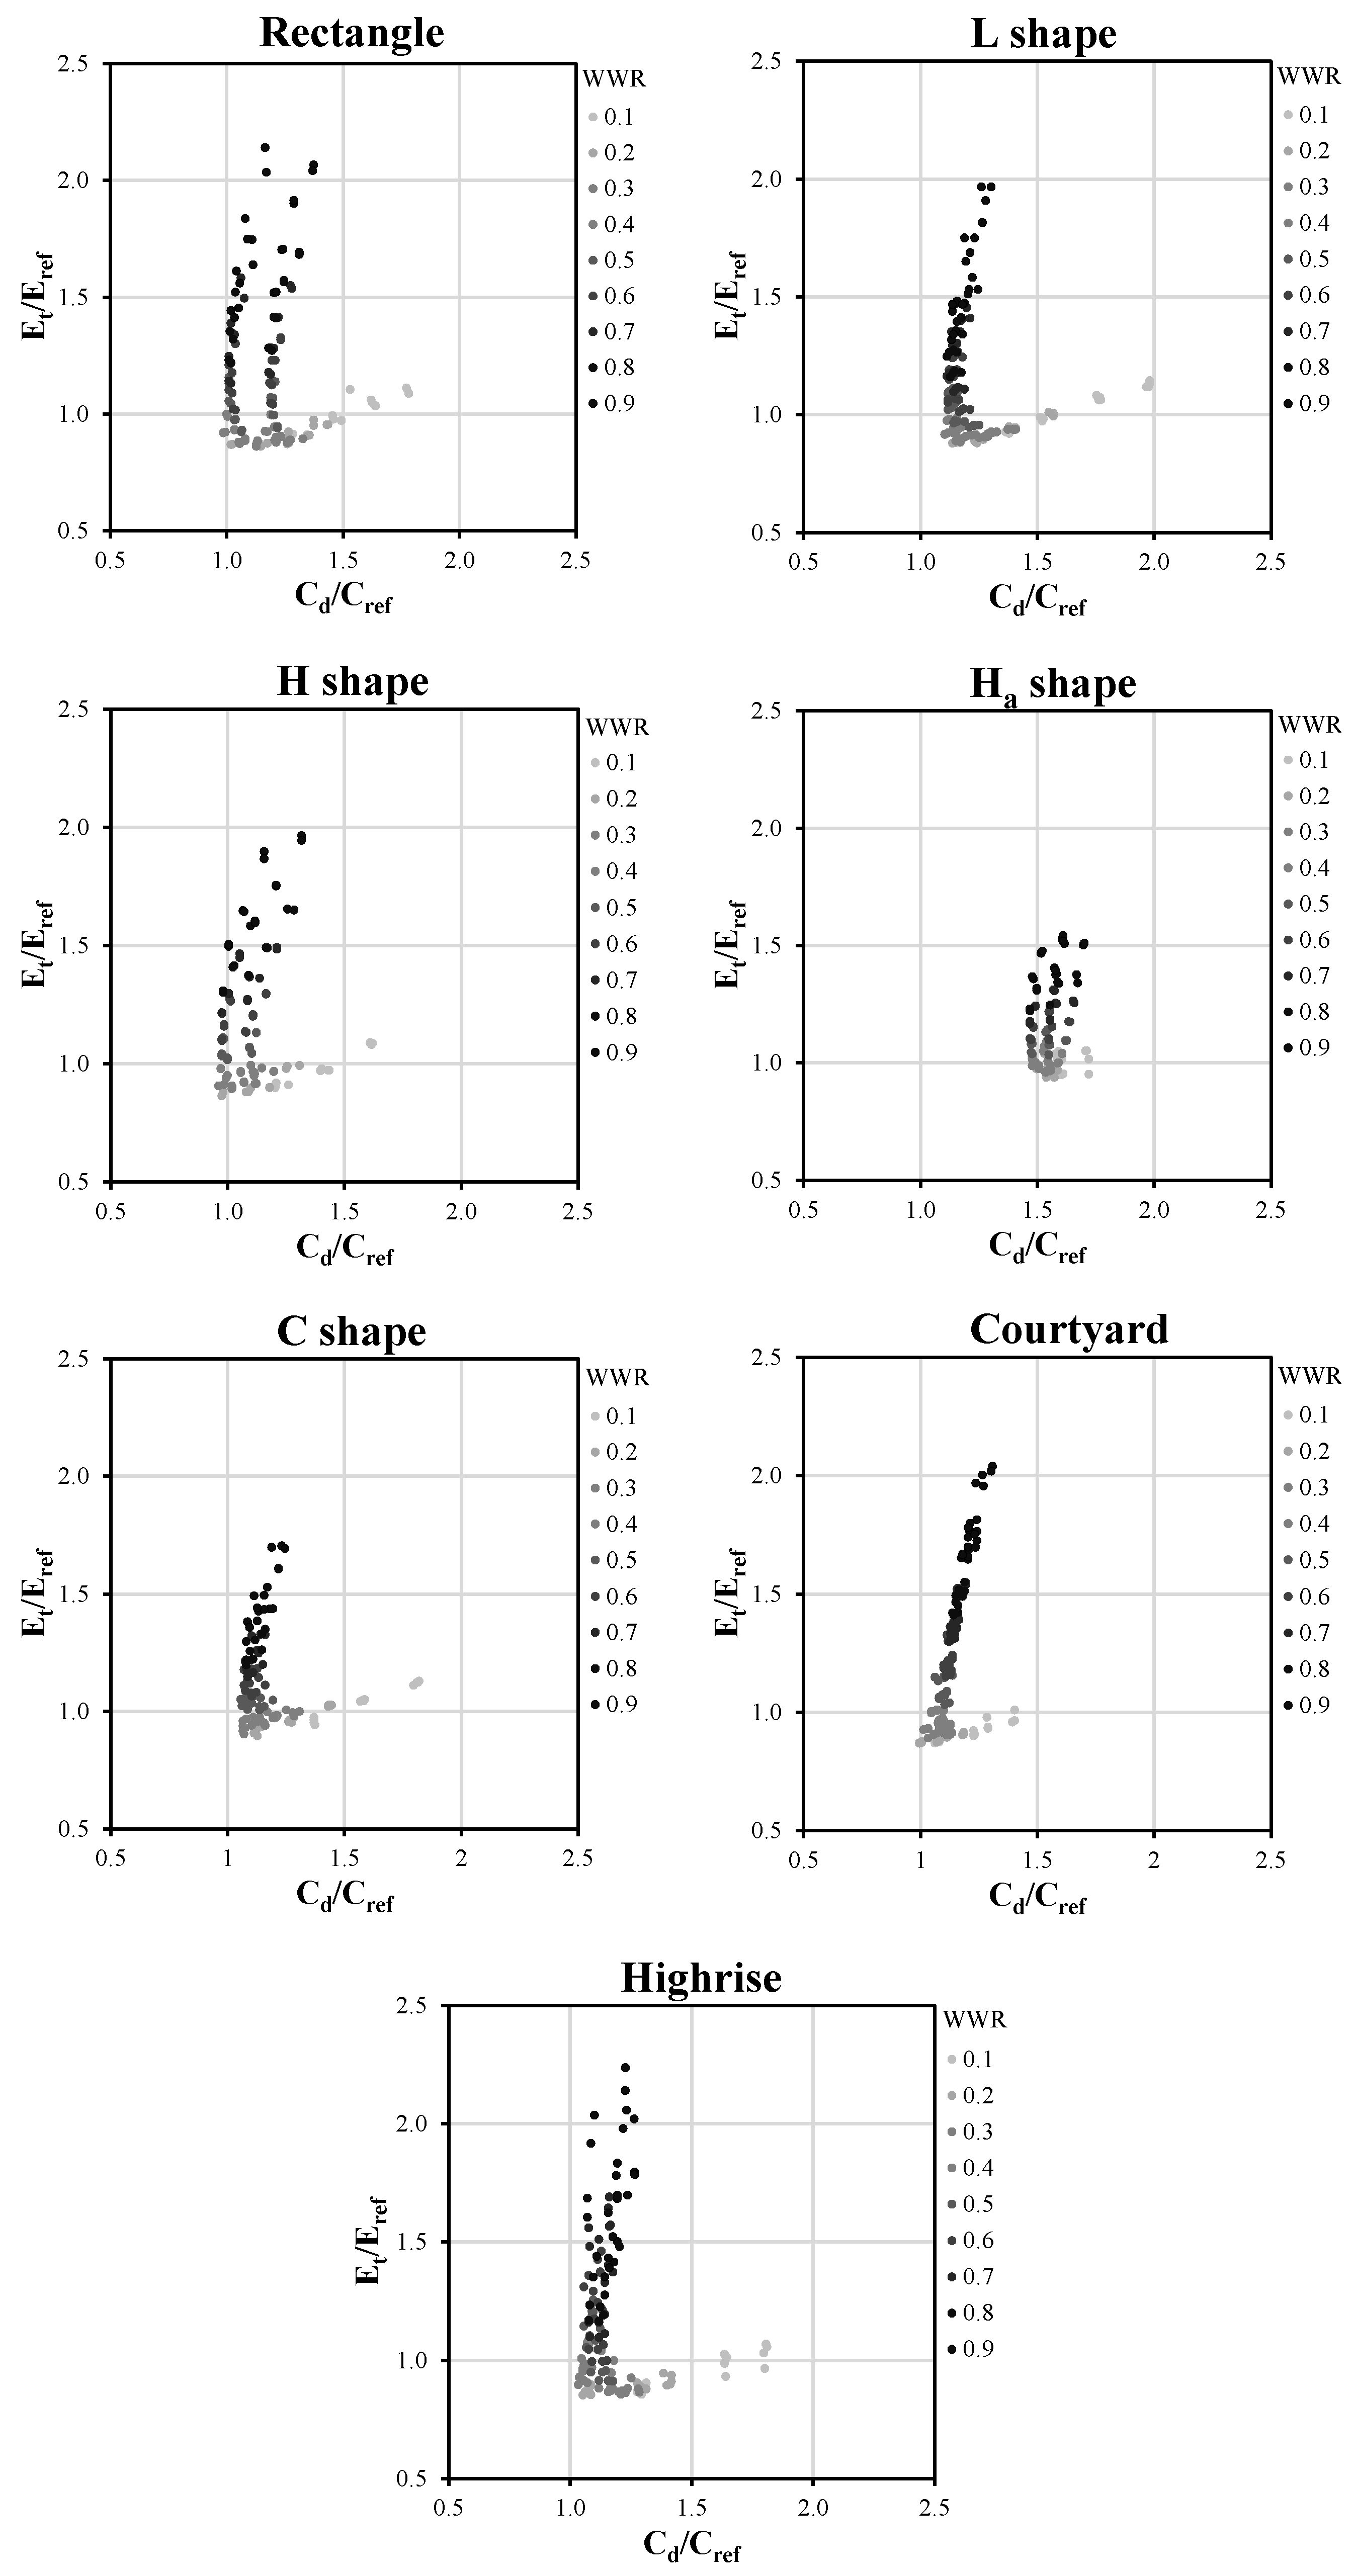
Figure 2 illustrates both the normalized annual total energy consumption (Y-axis) and summer discomfort time (X-axis) in terms of WWR for all building shapes. Each point corresponded to the result of a design combination. The closer the points were to the origin of the axes, the lower the energy consumption and summer discomfort time. The depth of color indicated the size of WWR; a darker color indicated a larger WWR and vice versa.
As seen in Figure 2, the results of most building shapes were similar to a hyperbolic curve. When WWR increased from 10% to approximately 40%, the summer discomfort time decreased significantly, while the total energy consumption lowered marginally. The increased WWR promoted indoor air circulation and heat dissipation, which leads to the decrease of summer discomfort. Furthermore, the reduced total energy demand was caused by the decreased lighting demand when the WWR increased.
As WWR increased from 40% to 90%, the total energy consumption increased rapidly with a relatively lower rise in summer discomfort time. In this process, the heating demand (the main part of total energy demand) increased rapidly due to the increased high-U-value glazing area, while the lighting demand remained constant as the requirement of illuminance level was met. Therefore, the total energy demand rapidly increased. For summer thermal comfort, oversized windows resulted in a higher air exchange between the indoor and outdoor environment, bringing the indoor temperature closer to the high outdoor temperature, thereby reducing the indoor thermal comfort time.
For all building shapes, a WWR of approximately 40% resulted in both the minimum energy consumption and the summer discomfort time. However, the position and degree of extension of the point sets in the quadrant for various shapes were different. Most obviously, the Ha type was more to the right on the X-axis than the other types, with a minimum Cd/Cref around 1.5. This indicated that the discomfort time of the Ha type was generally higher than other types; however, its range of values on the Y-axis was the smallest, suggesting that its energy consumption overall was lower than the other types. The reason for this is its unique spatial structure; it has a glass-enclosed atrium, which results in more solar heat gain in summer, leading to an increase in discomfort time, while in winter the atrium acts as a solar collector and distributor, contributing to passive heating and decreased heating energy demand.
For the other building shapes, the best design combinations (namely the inflection points of the point set at the bottom left in Figure 2) had similar values around point (1.0, 1.0) in the coordinate system. Nevertheless, the maximum values of Cd/Cref and Et/Eref were different. The courtyard shape had a smaller (Cd/Cref)max (1.4) than the others due to its small building depth, which promotes indoor air convection and helps dissipate indoor heat. In addition, the C shape exhibited the lowest (Et/Eref)max of 1.7. The rectangle and high-rise type had the highest (Et/Eref)max of approximately 2.2, which indicated that for these two types of buildings, inappropriate geometry design led to larger energy consumption than for other building shapes.
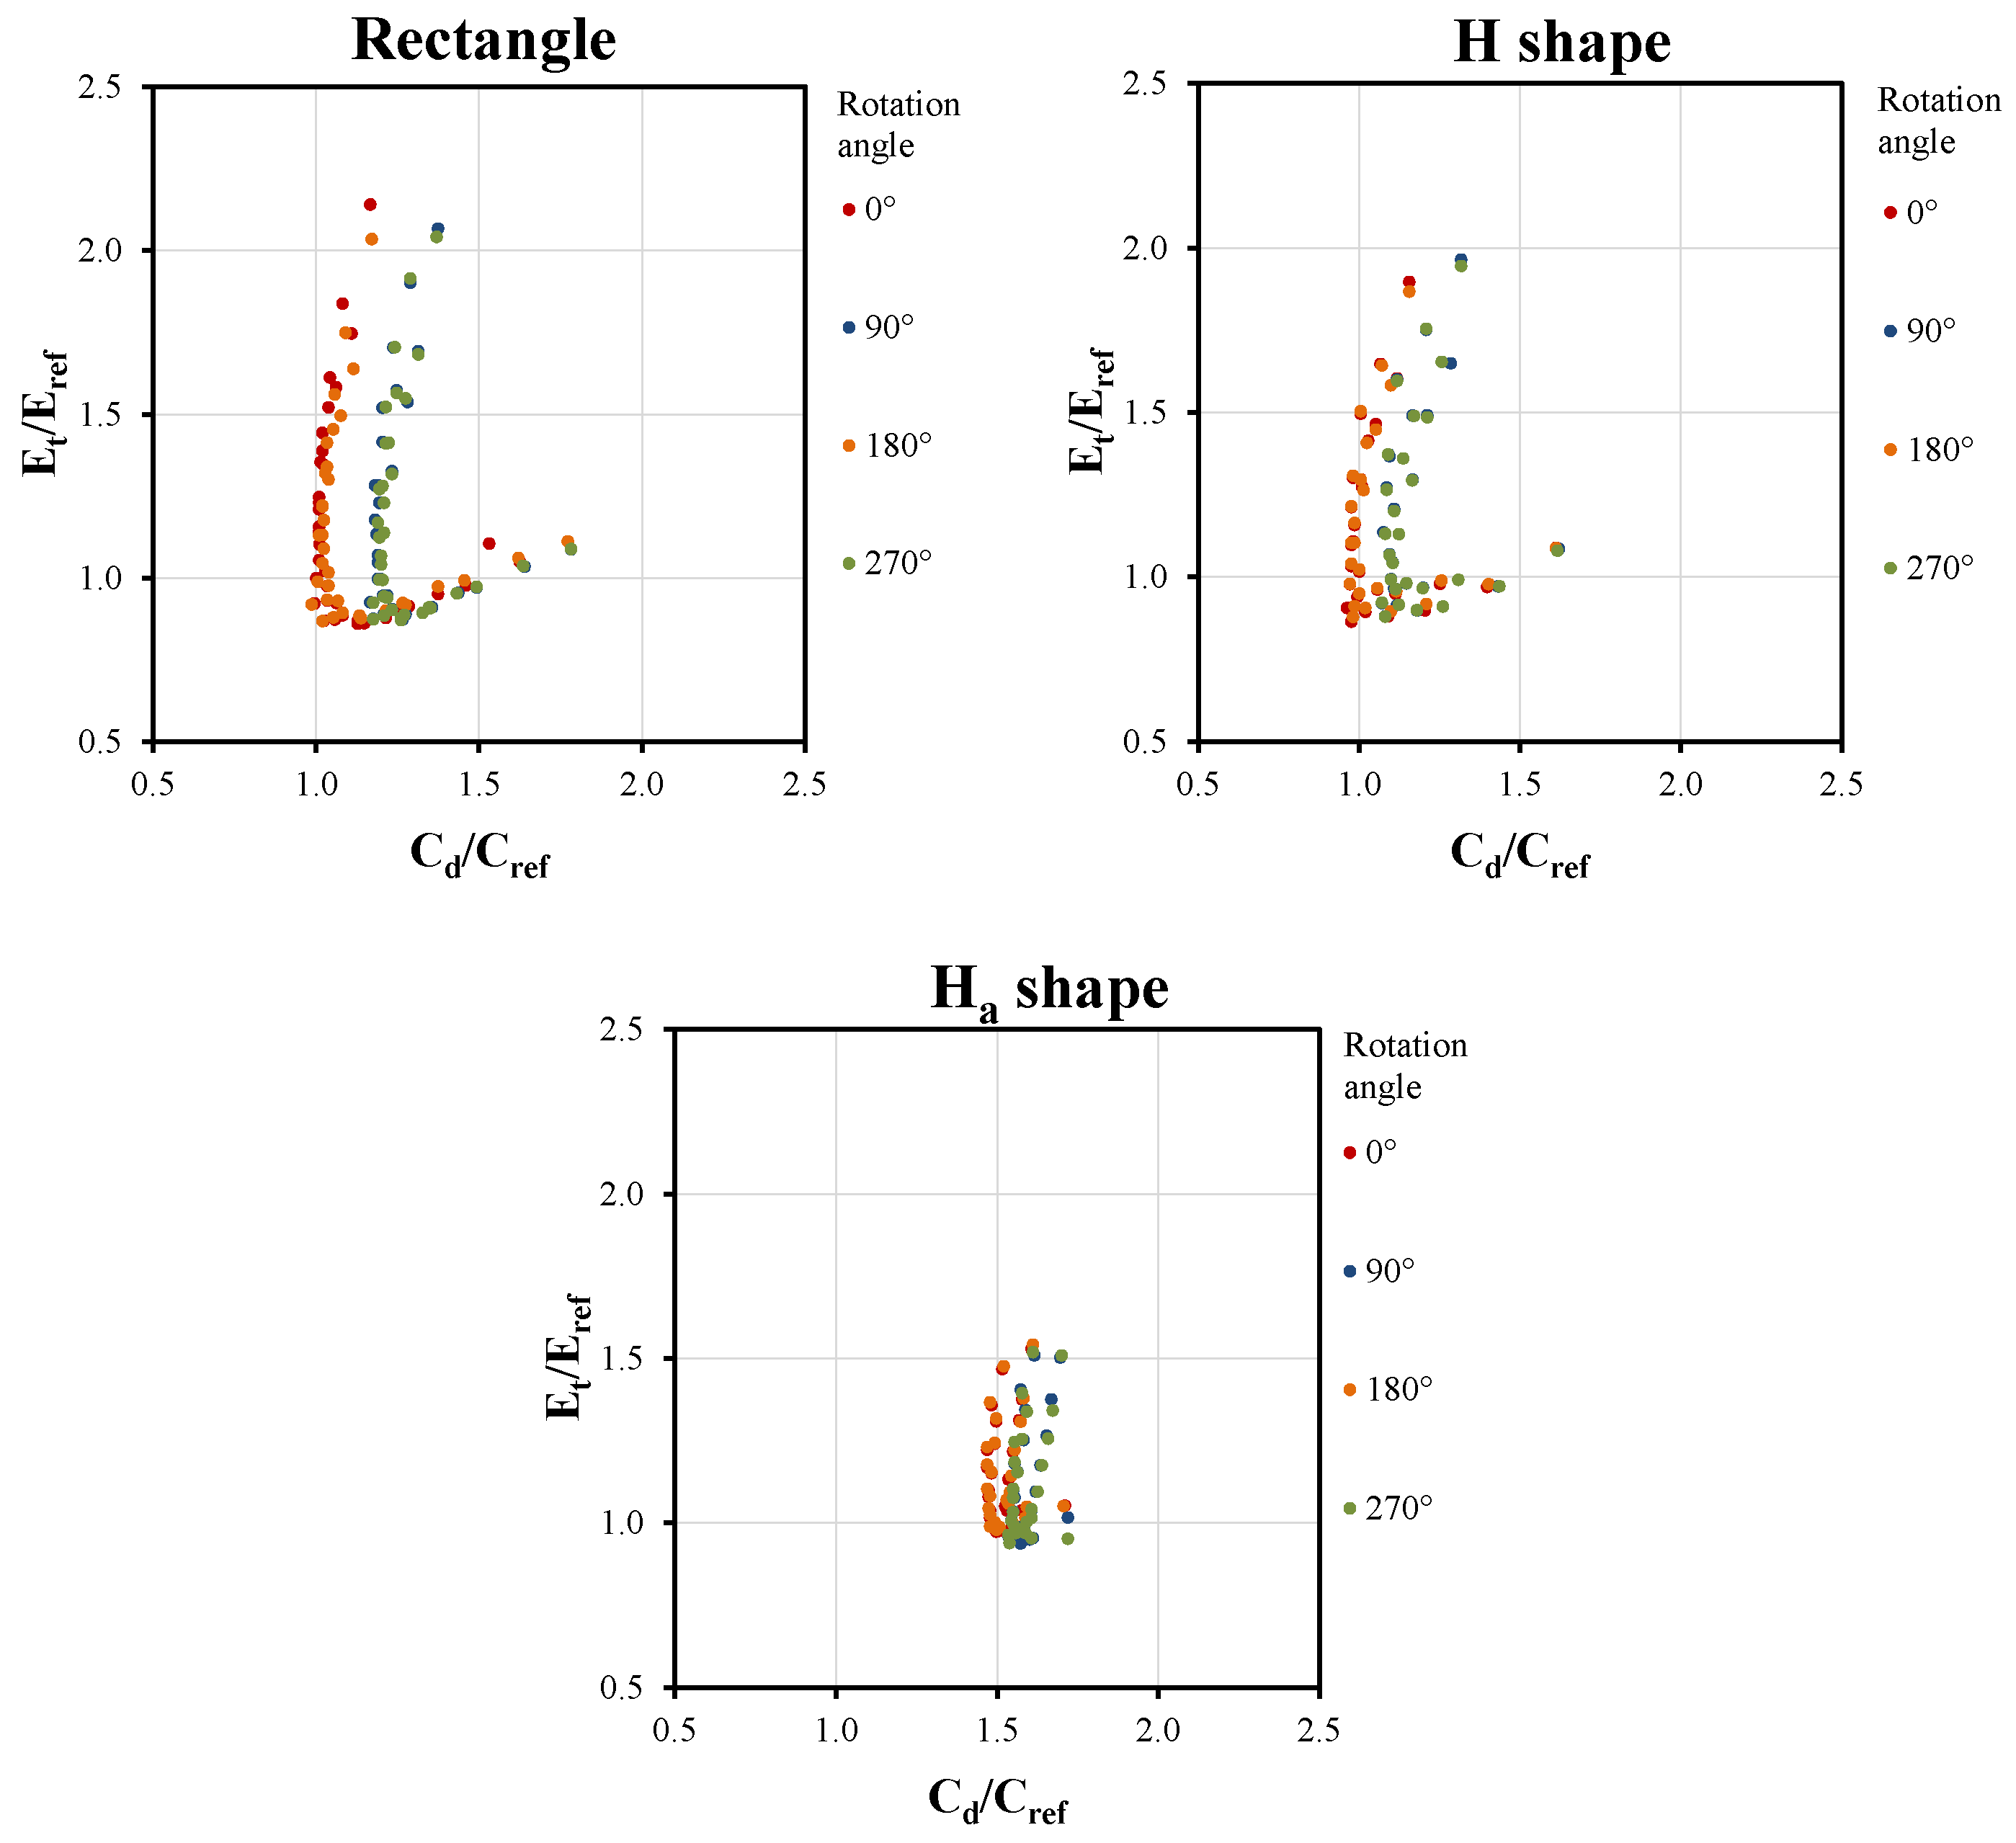
It is also worth noting that the results of the rectangle, H, and Ha shapes were clearly grouped into several lines. This phenomenon was caused by the orientation effect. Figure 3 distinguishes the design results in terms of four rotation angles, where results consisting of 0° and 180° were more to the left on the X-axis than those of 90° and 270°, indicating that the summer discomfort time at 90° and 270° was relatively higher. The 90° and 270° rotated models had more west-oriented rooms where the direct sunlight time is prolonged in the afternoon, thus increasing indoor temperature. It was particularly obvious for the rectangle shape, since it varied the most in the different-facing rooms due to orientation change. Table 6 presents the ranges of the south window area ratio for all shapes. The south window area ratio refers to the percentage of windows on the south walls of the building, indicating the geometric anisotropy of the buildings as well as the solar heat gain variation from openings due to orientation change. The rectangle shape had the maximum variation range, followed by the H and Ha shapes. On the other hand, energy demand was much less affected by orientation since the results had no significant deviation on the Y-axis.
Moreover, it can be seen from Figure 3 that the results of a 0° rotation angle (red dots) were very similar to the results of 180° (orange dots) for the three building types. The results at 90° (blue dots) and 270° (green dots) exhibited the same phenomenon. From a geometric point of view, these two pairs were completely symmetrical, with the only difference being the organization of the internal space. This reflected that the arrangement of internal spaces only had a marginal effect on building energy demand and indoor thermal comfort.
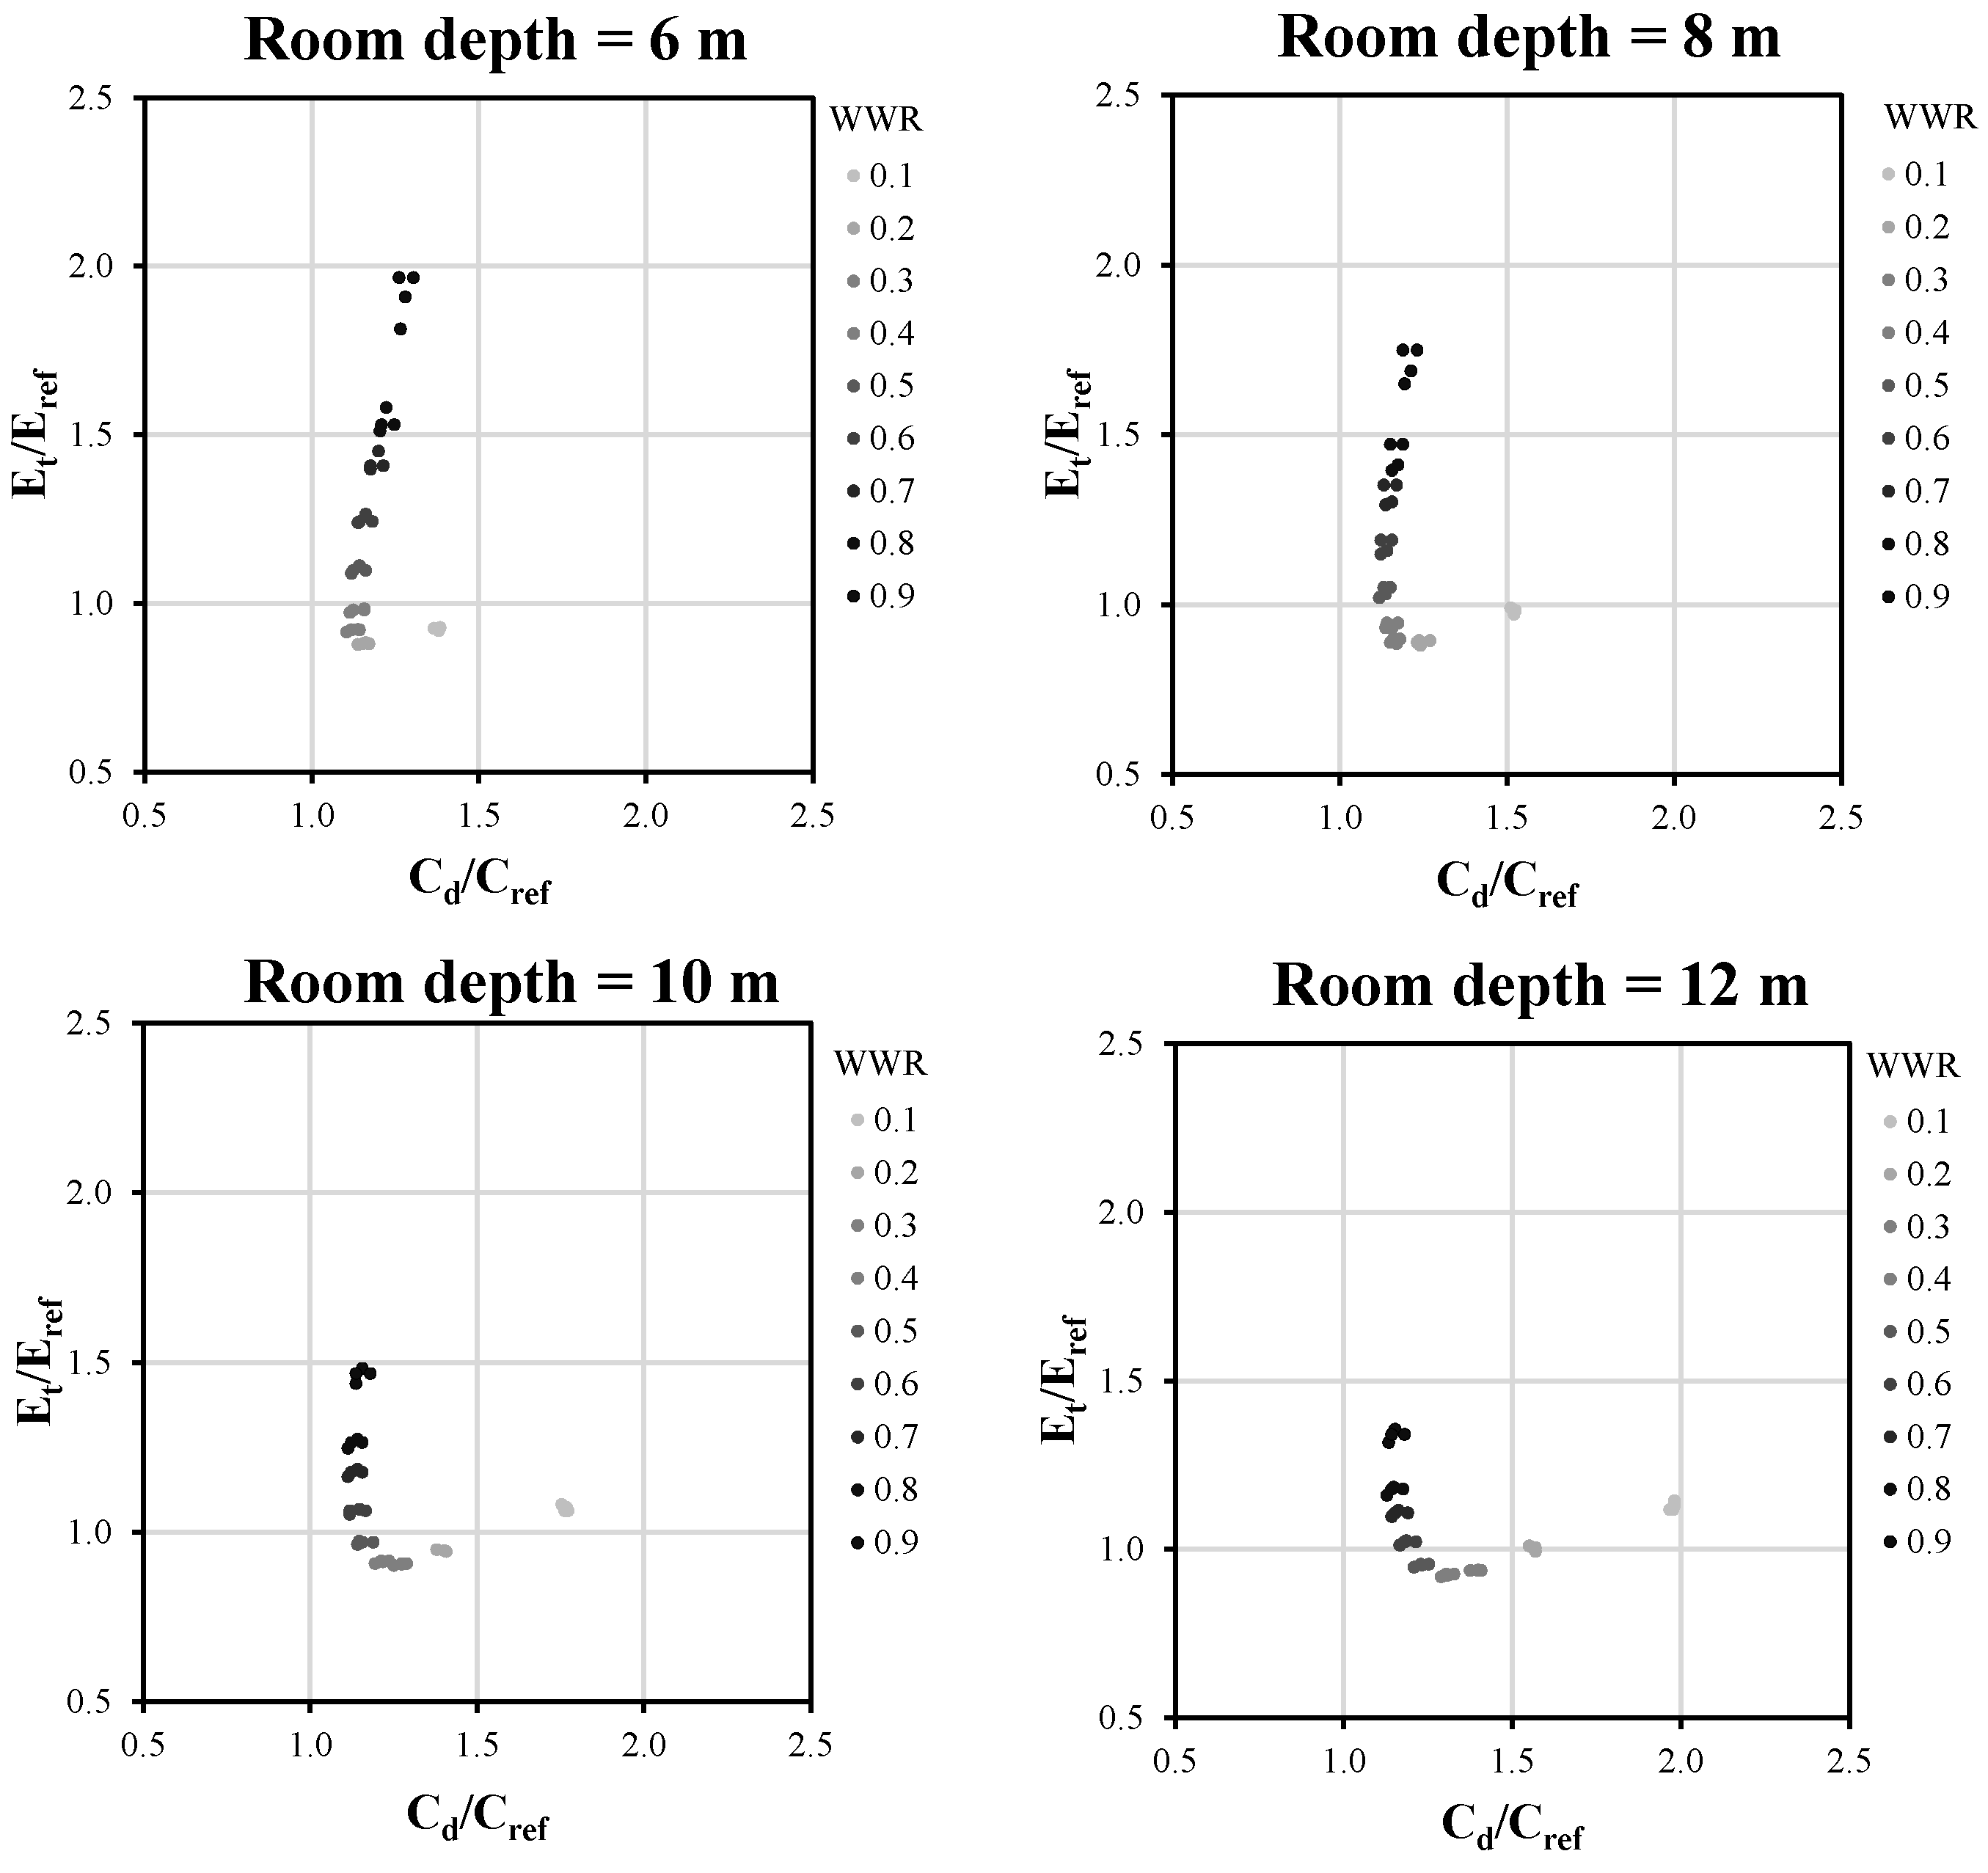
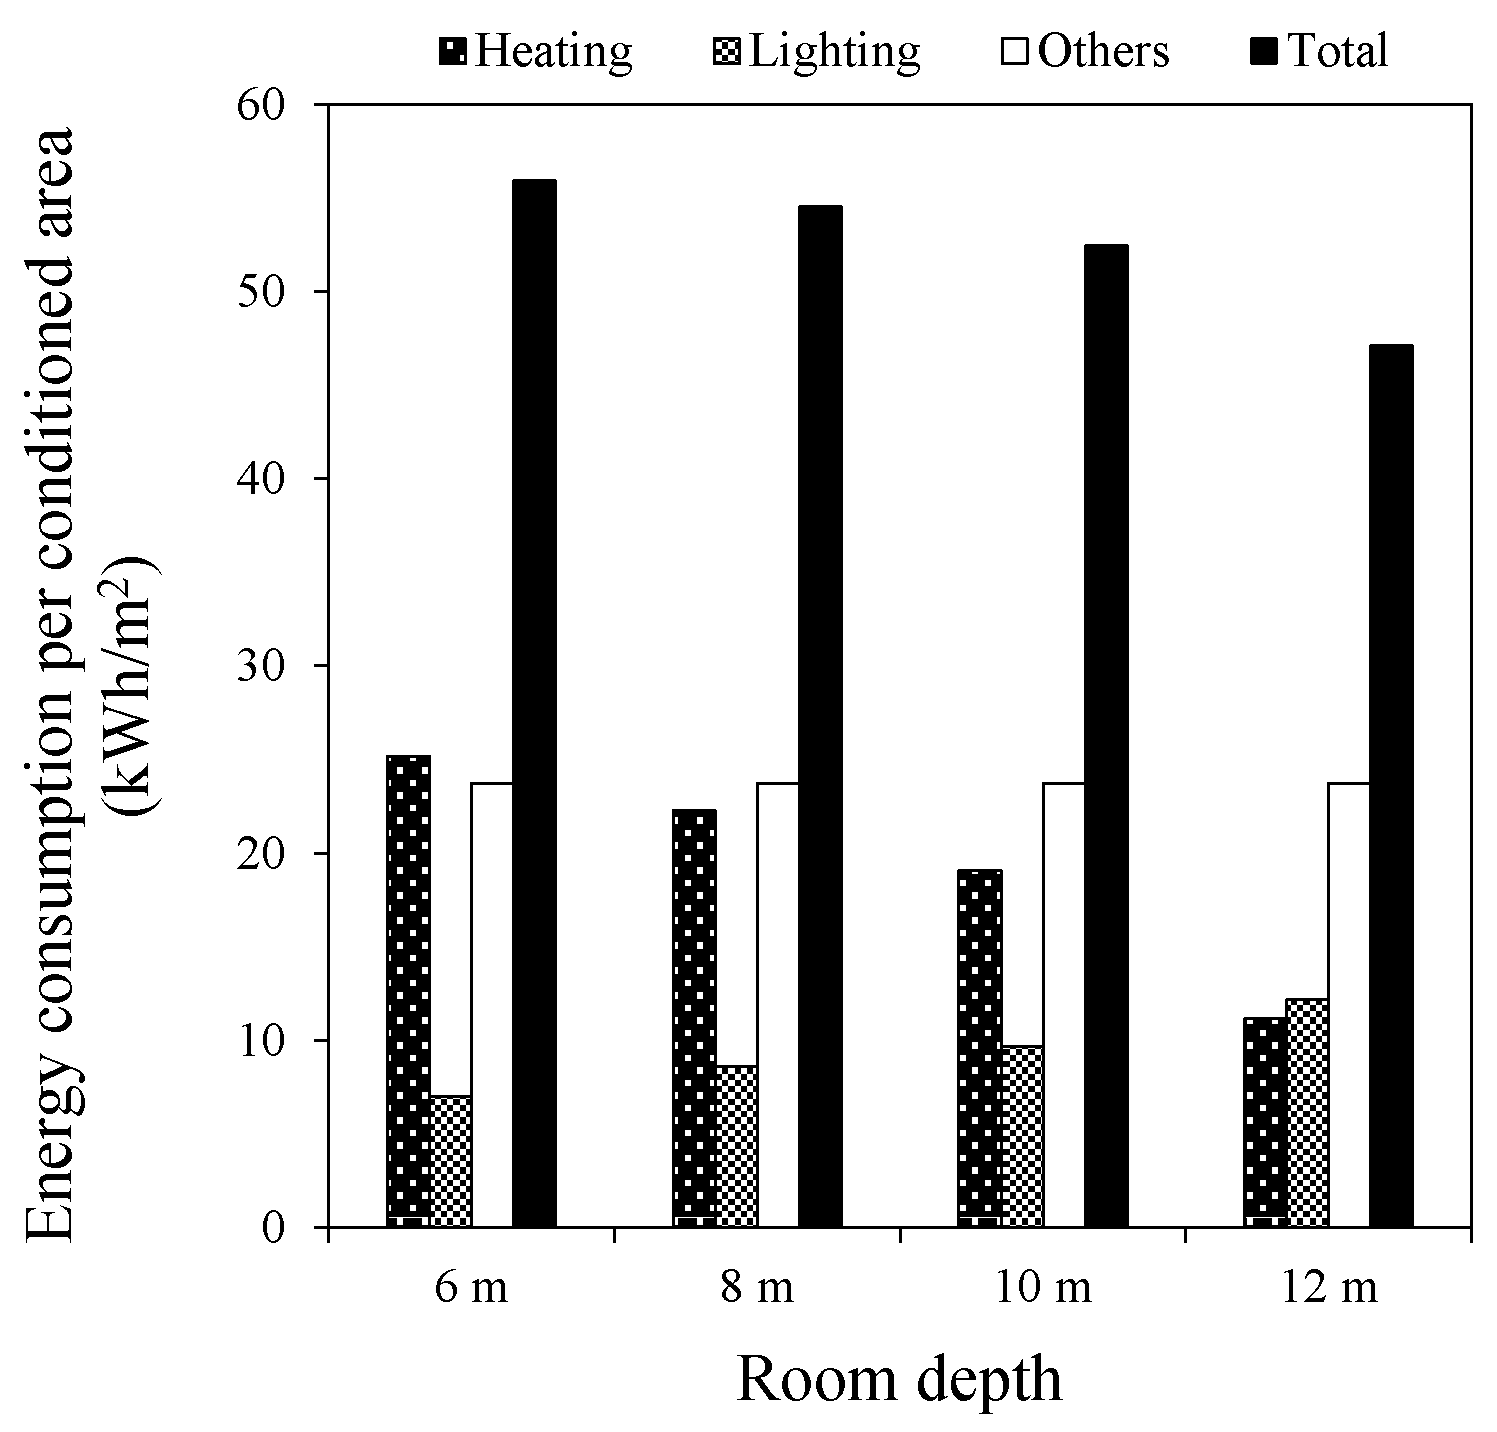
To explore the effect of room depth on energy demand and thermal comfort, the results of the L shape were used as an example and classified according to the four investigated room depths (Figure 4), and the distribution of the results differed as the room depth increased. The results varied along a hyperbolic trajectory as the room depth varied: when the room became deeper, the points extended towards the X-axis direction; when the room became shallower, the points extended towards the Y-axis direction. For a room depth of 6 m, the maximum Et/Eref reached around 2.0 and the maximum Cd/Cref was only 1.4. When the room depth increased to 12 m, the maximum Et/Eref reduced to 1.3 and the maximum Cd/Cref rose to 2.0. This indicated that the deep-plan buildings generally had a lower energy demand and higher summer discomfort time than the shallower buildings. Figure 5 shows the energy consumption for the L shape buildings (south-oriented, 40% WWR) in terms of different room depths. When the room became deeper, the lighting energy increased, while heating and total energy consumption both decreased. The increased lighting energy consumption increased the internal heat gain of buildings. In summer, this contributes to the increase of indoor discomfort time, while in winter the heating energy consumption of buildings can be saved, leading to a decrease in total energy consumption.
Furthermore, it was seen that the WWR distribution differed for various room depths. For the 6-m room depth, the best design solutions, namely the closest points to the origin, had a WWR of 0.3. However, when the room depth increased to 8 m, 10 m, and 12 m, the WWR of the best design solutions changed to 0.4, 0.5, and 0.6, respectively. This indicated that deeper rooms required larger windows to save energy demand and improve thermal comfort. The reason for this is that larger windows reduce the additional lighting demand caused by the increased room depth as well as the internal heat gain from lighting. Moreover, deep plan buildings also need large windows to promote indoor air circulation and dissipate internal heat, thus reducing the summer discomfort time.
To better understand the effect of geometry parameters on energy and thermal comfort, we performed a detailed analysis where combinations of building shape, window to wall ratio, room depth, and orientation parameters showed that an increase occurred both in energy savings and thermal comfort hours when compared to the reference building. The results are summarized in Table 7, where the bold figures indicate the designs that achieved the maximum energy savings, while the italic figures indicate the designs that achieved the maximum thermal comfort improvement. This can provide a reference for architects on utilizing building geometry as a thermal improvement measure in the design of school buildings.
Three building types—rectangle, H shape, and courtyard—exhibited potential for simultaneously reducing energy consumption and improving summer thermal comfort. The H shape is most likely to save energy and improve thermal comfort, as it has the most parameter combinations that can influence both energy and thermal comfort improvement. Moreover, its maximum energy savings and thermal comfort increase can reach 13.6% and 3.8%, respectively. The courtyard type can also achieve a similar maximum in energy saving (13.1%) and thermal comfort (4.7%), but the passive design options are much less as the WWR is limited to around 20% and the room depth to around 6 m. The design options of the rectangle shape are also limited, and the energy and thermal improvement are less (maximum of 8.0% and 1.4%, respectively). Compared to a previous study described in Reference [10] where the H shape and courtyard type were not included, the results of this study found that the above two building types performed better than the rectangle type and provided more choices for architects.
On the other hand, energy savings and thermal comfort improvements mainly occurred at 20–40% WWRs, suggesting that higher WWR could cause either more energy consumption or the risk of overheating. Deep rooms (room depth > 8 m) also had fewer possibilities in saving energy and improving thermal comfort improvement. Moreover, energy savings and thermal comfort enhancement occurred more often in the 0° and 180° rotation angles than the 90° and 270° rotation angles.

3.2. Subjective Preferences of Students

In this section, the students’ preference towards the building geometry design was analyzed. The reliability analysis showed that Cronbach α = 0.757, which was considered as acceptable based on the George and Mallery rules of thumb [51]. For the factor analysis, the Kaiser-Meyer-Olkin (KMO) and Bartlett’s test indicated that KMO = 0.732, which exceeded the recommended value of 0.6, indicating that the sampling was adequate. The chi-square distribution was 1989.866, and the p-value was 0.000, which was below 0.05, so we could declare the result to be statistically significant. Overall, the data were suitable for factor analysis.
Students paid more attention to the four building geometry parameters by means of ratings ranging from 4.8–5.4 (Figure 6). Orientation had the lowest ratings, while the ratings of the other parameters were almost the same. One of the reasons for the high ratings might have been their potential effects on learning efficiency given that very few students (7%) thought that the building geometry design had “obviously no effect” on learning efficiency. Approximately 42% of students thought that it had an “obviously effect” on their leaning efficiency, and 50% of students thought that the effect could “possibly exist”.
The above analysis reflects that building geometric parameters also play an important role in the students’ feelings and possibly learning efficiency, and thereby need to be carefully addressed.
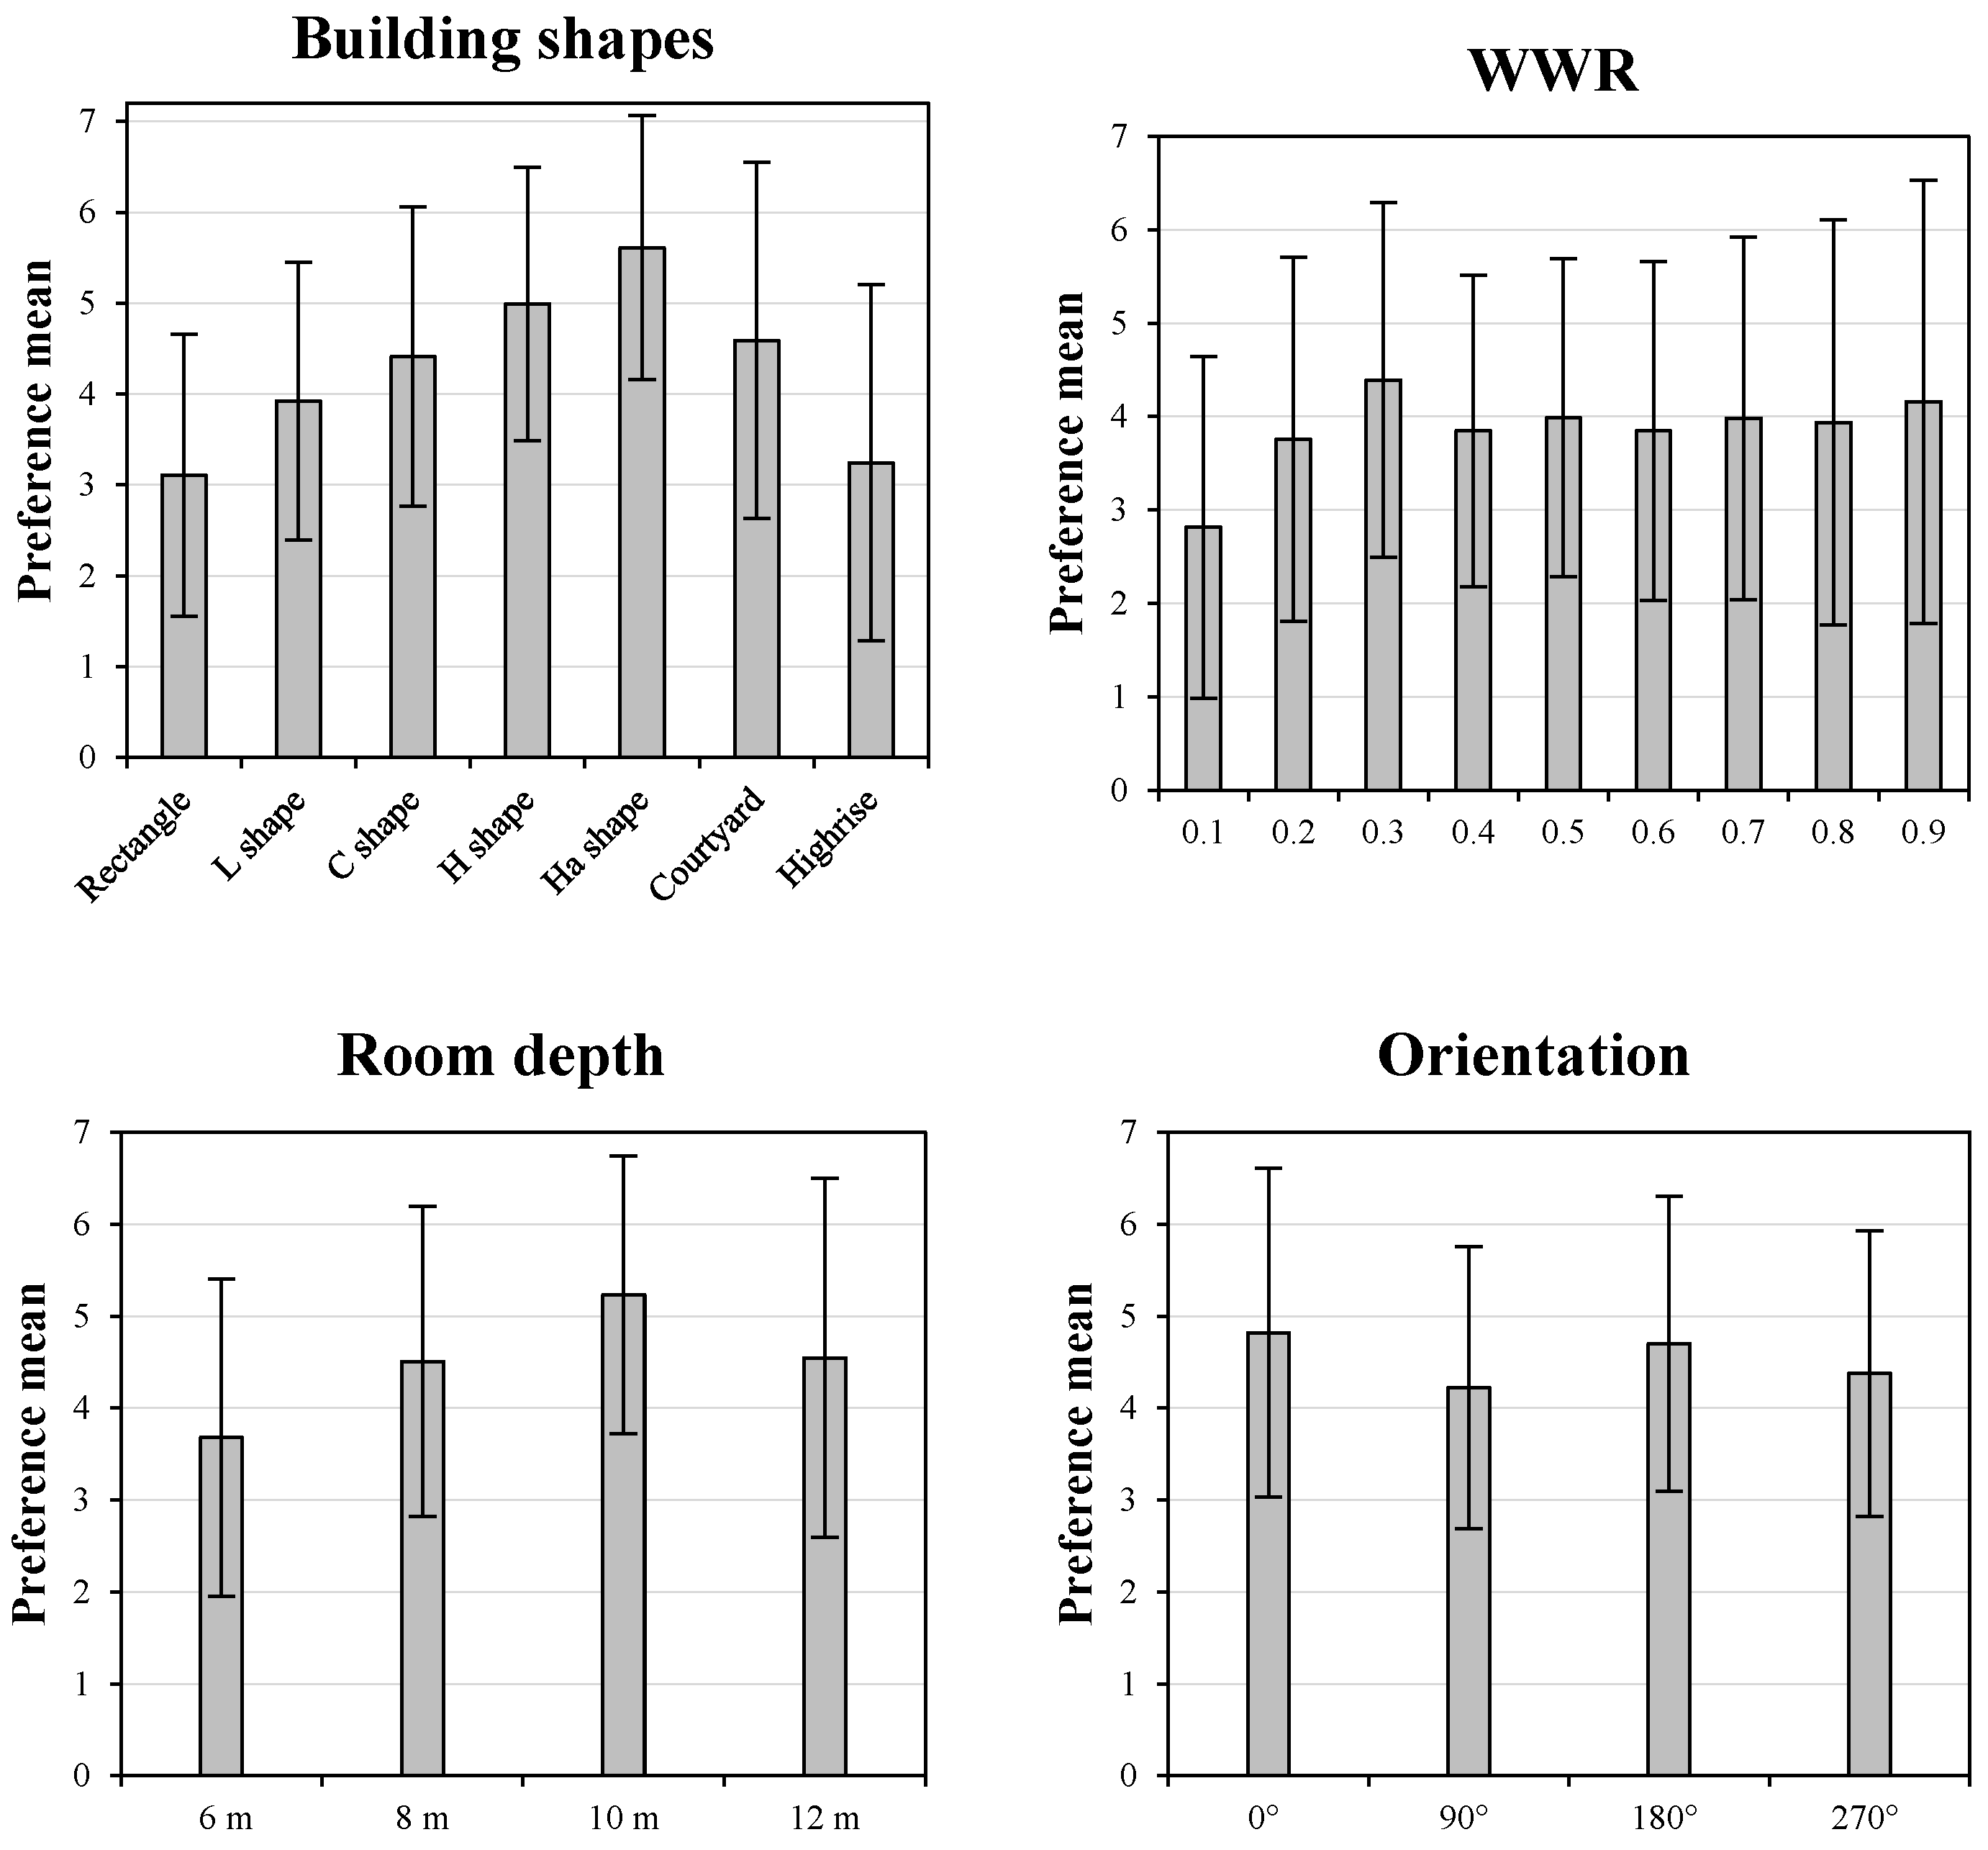
Figure 7 shows the mean and standard deviation of the student ratings for various building geometry factors. For building shape, the Ha shape exhibited the highest mean score (5.6), while the rectangle and high-rise type had the lowest score (3.1 and 3.2, respectively). The H shape ranked second with a high score of 5.0. This indicated the students’ fondness for complex forms, and tiredness of monotonous shapes, which was consistent with Aitken and Hutt’s findings for 7–10 year old children [52]. In addition, the L, C, and courtyard types ranked in the middle with scores around 4.00. Furthermore, there was disagreement in rating the courtyard and high-rise type, since their standard deviations were the highest (2.0). The standard deviations of the other shapes were smaller (approximately 1.5), indicating less disagreement.
As for windows, a score of WWR with 0.1 was obviously the lowest (mean = 2.8), while the other WWRs all had similar scores around 4.00. This suggested that students did not like very small windows, yet they had no obvious antagonistic sentiments to the large windows. However, the standard deviation gradually increased from 1.66 to 2.37 when the WWR increased from 0.3 to 0.9, meaning there that there was more disagreement on preferences of larger WWRs.
The classroom with a 10-m depth had the highest score of 5.2, while the classroom depth of 6 m showed the lowest score of 3.7, indicating the students’ demand for spacious learning spaces. However, classrooms that were too stubby were undesirable, i.e., the classroom with a depth of 12 m only scored 4.5.
Considering orientation, orientations with 0° and 180° rotation angles had slightly higher ratings than the other two rotation angles. The standard deviations were similar for all room depths and orientations (approximately 1.6), indicating no significant disagreement between the different room depths or orientations.
In addition, the minimum and maximum ratings for preference of options for all four parameters always ranged from 1–7. Thus, at least one of the 156 respondents always felt extremely attracted or unattracted every time.

3.3. Proposal for School Building Geometry Design

Architectural design should consider both the building thermal performance, and the subjective preference of users. However, from the above analysis, we found that high-performance school building design options in terms of the indoor physical environment were partly contradictory to the subjective preferred designs of the students.
The student’s favorite type, the Ha shape, showed poor performance, particularly in summer thermal comfort. Conversely, the least favorite type, the rectangle shape, showed improvement in energy use and thermal comfort. Considering both the thermal environment and user preference, the H shape performed the best due to its high potential and various options for energy savings and thermal comfort improvements, as well as its second-place ranking in student preferences. The courtyard is also suggested, given its potential for energy saving and thermal comfort improvement and ranked highly with the students.
On the other hand, for WWR design, the most promising range for thermal improvement, 20–40%, had similar preference ratings for most WWRs, with the exception of a WWR of 10%. This simplifies the WWR design in improving thermal performance without needing to consider the preferences of students too much. However, this becomes difficult when designing classroom depth. The high-thermal-performance designs mainly have a room depth of 6 m, which was the least favored type of room depth for students; therefore, the students’ demand for spacious classrooms is in conflict with energy usage and thermal improvement. Finally, regarding orientation, the 0° and 180° rotation angles showed better thermal performance and higher ratings of student preference than the 90° and 270°, indicating that the 0° and 180° rotation angle are more suitable when designing school buildings than the other two orientations.
4. Conclusions

Our research highlighted the importance of geometry parameters in school buildings in the cold climate zone of China. These geometry parameters included building shape, window to wall ratio, room depth, and orientation. A large number of computer simulations were run to evaluate their energy-saving and thermal comfort-improvement potential. Additionally, a questionnaire-based survey was conducted that related to the subjective evaluation of the geometric design of school buildings. The main findings of this study are outlined below:
  • The H shape was the best design when considering both thermal performance and subjective preferences. It achieved a maximum of 13.6% in energy savings and 3.8% in thermal comfort improvement with various design options. Furthermore, it had a high ranking among the students’ preferences. The courtyard type is also suggested due to its large potential for energy saving and thermal comfort improvement.
  • Generally, a WWR of 20–40% had the best performance in both energy demand and thermal comfort. However, deeper rooms required a higher WWR to reduce the lighting demand and to promote indoor heat dissipation to reduce summer discomfort.
  • Long rooms (depth ≤ 8 m) have more possibilities to achieve both energy savings and thermal comfort improvement. However, students prefer spacious classrooms, though the preference of too stubby rooms (depth > 10 m) declined.
  • Orientation had an obvious effect on the summer thermal comfort of buildings with large geometric anisotropy. The proportion of west-oriented rooms should be reduced due to the potential summer heat risk. Meanwhile, the energy demand of buildings is much less affected by orientation, indicating that emphasis should be put on summer thermal comfort when planning building orientation.
  • The interior space organization of buildings only had a marginal effect on building energy demand and indoor thermal comfort.
These conclusions emphasize that proper design of geometry parameters in school buildings in the cold climate zone will not only obtain energy savings and improvements in thermal comfort, but also enhance the subjective feelings of the students. The findings of this study can provide a reference and a better understanding of the influence of geometry on designs for energy demand and thermal comfort of school buildings, as well as the students’ preferences in the cold climate of China. One final note: one of the limitations of this study was that it did not include any shading systems in the school building models. Future research will try to clarify this.

Supplementary Materials

The following are available online at www.mdpi.com/2071-1050/9/10/1708/s1.

Acknowledgments

This research was funded by the National Key Research and Development Program of China (Grant No. 2016YFC0700201) and the National Natural Science Foundation of China (Grant No. 51338006). We would like to thank the China Scholarship Council for providing us with financial support to carry out the study at the Faculty of Architecture and the Built Environment at the Delft University of Technology. Thanks also to Lei Chen at the high school attached to Tianjin University for the coordination of the questionnaire-based survey.

Author Contributions

Anxiao Zhang carried out the simulations, collected data, and prepared drafts. Regina Bokel, Andy van den Dobbelsteen and Qiong Huang supervised data analysis and edited the manuscript. Yanchen Sun carried out the questionnaire-based survey and collected data. Qi Zhang gave conceptual advice and provided logistical support in the field. All authors discussed the results and implications and commented on the manuscript at all stages.

Conflicts of Interest

The authors declare no conflict of interest.

References

  1. Evans, M.; Yu, S.; Song, B.; Deng, Q.; Liu, J.; Delgado, A. Building energy efficiency in rural China. Energy Policy 2014, 64, 243–251. [Google Scholar] [CrossRef]
  2. U.S. Department of Energy. Available online: http://www.rebuild.gov/index.asp (accessed on 18 December 2003).
  3. Küller, R.; Lindsten, C. Health and behavior of children in classrooms with and without windows. J. Environ. Psychol. 1992, 12, 305–317. [Google Scholar] [CrossRef]
  4. Heschong, L. Daylighting in Schools: An Investigation into the Relationship between Daylighting and Human Performance. Detailed Report; George Loisos Pacific Gas and Electric: San Francisco, CA, USA, 1999. [Google Scholar]
  5. Ratti, C.; Raydan, D.; Steemers, K. Building form and environmental performance: Archetypes, analysis and an arid climate. Energy Build. 2003, 35, 49–59. [Google Scholar] [CrossRef]
  6. Ourghi, R.; Al-Anzi, A.; Krarti, M. A simplified analysis method to predict the impact of shape on annual energy use for office buildings. Energy Convers. Manag. 2007, 48, 300–305. [Google Scholar] [CrossRef]
  7. AlAnzi, A.; Seo, D.; Krarti, M. Impact of building shape on thermal performance of office buildings in Kuwait. Energy Convers. Manag. 2009, 50, 822–828. [Google Scholar] [CrossRef]
  8. Van den Dobbelsteen, A.; Thijssen, S.; Colaleo, V.; Metz, T. Ecology of the building geometry-environmental performance of different building shapes. In Proceedings of the CIB World Building Congress, Cape Town, South Africa, 14–17 May 2007. [Google Scholar]
  9. Steadman, P. Building Types and Built Forms; Troubador Publishing Ltd: Leicester, UK, 2014. [Google Scholar]
  10. Montenegro, E.; Potvin, A.; Demers, C. Impact of school building typologies on visual, thermal and energy performances. In Proceedings of the Passive and Low Energy in Architecture (PLEA), Lima, Peru, 7–9 November 2012. [Google Scholar]
  11. Da Graça, V.A.C.; Kowaltowski, D.C.C.K.; Petreche, J.R.D. An evaluation method for school building design at the preliminary phase with optimisation of aspects of environmental comfort for the school system of the State São Paulo in Brazil. Build. Environ. 2007, 42, 984–999. [Google Scholar] [CrossRef]
  12. Dimoudi, A.; Kostarela, P. Energy monitoring and conservation potential in school buildings in the C′ climatic zone of Greece. Renew. Energy 2009, 34, 289–296. [Google Scholar] [CrossRef]
  13. Zomorodian, Z.S.; Nasrollahi, F. Architectural design optimization of school buildings for reduction of energy demand in hot and dry climates of Iran. Int. J. Archit. Eng. Urban Plan. 2013, 23, 41–50. [Google Scholar]
  14. Perez, Y.V.; Capeluto, I.G. Climatic considerations in school building design in the hot–humid climate for reducing energy consumption. Appl. Energy 2009, 86, 340–348. [Google Scholar] [CrossRef]
  15. Cantón, M.A.; Ganem, C.; Barea, G.; Llano, J.F. Courtyards as a passive strategy in semi dry areas. Assessment of summer energy and thermal conditions in a refurbished school building. Renew. Energy 2014, 69, 437–446. [Google Scholar] [CrossRef]
  16. Su, B. Impacts of building design factors on Auckland school energy consumptions. Int. J. Civil Archit. Sci. Eng. 2013, 7, 264–270. [Google Scholar]
  17. Zhang, A.; Bokel, R.; van den Dobbelsteen, A.; Sun, Y.; Huang, Q.; Zhang, Q. Optimization of thermal and daylight performance of school buildings based on a multi-objective genetic algorithm in the cold climate of China. Energy Build. 2017, 139, 371–384. [Google Scholar] [CrossRef]
  18. Palmer, S.E.; Schloss, K.B.; Sammartino, J. Visual aesthetics and human preference. Annu. Review Psychol. 2013, 64, 77–107. [Google Scholar] [CrossRef] [PubMed]
  19. Birkhoff, G.D. Aesthetic Measure; Harvard University Press Cambridge: Cambridge, MA, USA, 1933; Volume 9. [Google Scholar]
  20. Green, C.D. All that glitters: A review of psychological research on the aesthetics of the golden section. Perception 1995, 24, 937–968. [Google Scholar] [CrossRef] [PubMed]
  21. Rosch, E. Cognitive representations of semantic categories. J. Exp. Psychol. Gen. 1975, 104, 192. [Google Scholar] [CrossRef]
  22. Scott, S.C. Visual attributes related to preference in interior environments. J. Inter. Design 1993, 18, 7–16. [Google Scholar] [CrossRef]
  23. China Ministry of Construction. Standard of Climatic Regionalization for Architecture. In GB 50178-93; Chinese Plan Publication House: Beijing, China, 1993. [Google Scholar]
  24. China Ministry of Construction. Thermal design code for civil building. In GB 51076-93; China Plan Press: Beijing, China, 1993. [Google Scholar]
  25. Xing, J.; Chen, J.; Ling, J. Energy consumption of 270 schools in Tianjin, China. Front. Energy 2015, 9, 217–230. [Google Scholar] [CrossRef]
  26. Yan, B.-H.; Yang, H.; Sun, C.-H. Analysis and Numerical Simulation of Indoor Thermal Environments in Some University Classrooms. J. Southeast Univ. 2010, 26, 262–265. (In English) [Google Scholar]
  27. Hongguang, W. Study on the Indoor Thermal Environment of University’s Classroom in Xi’an Region; Xi’an University of Architecture and Technology: Xi’an, China, 2005. [Google Scholar]
  28. Taleb, H.M.; Sharples, S. Developing sustainable residential buildings in Saudi Arabia: A case study. Appl. Energy 2011, 88, 383–391. [Google Scholar] [CrossRef]
  29. Martinez-Molina, A.; Boarin, P.; Tort-Ausina, I.; Vivancos, J.-L. Post-occupancy evaluation of a historic primary school in Spain: Comparing PMV, TSV and PD for teachers’ and pupils’ thermal comfort. Build. Environ. 2017, 117, 248–259. [Google Scholar] [CrossRef]
  30. Bilir, L.; Yildirim, N. Photovoltaic system assessment for a school building. Int. Hydrogen Energy 2017, 42, 17856–17868. [Google Scholar] [CrossRef]
  31. Liu, L.; Zhao, J.; Liu, X.; Wang, Z. Energy consumption comparison analysis of high energy efficiency office buildings in typical climate zones of China and U.S. based on correction model. Energy 2014, 65, 221–232. [Google Scholar] [CrossRef]
  32. Ministry of Housing and Urban-Rural Development of the Peoples’ Republic of China. Code for Design of School. In GB 50099-2011; China Architecture & Building Press: Beijing, China, 2011. [Google Scholar]
  33. Ministry of Housing and Urban-Rural Development of the Peoples’ Republic of China. Design Code for Heating Ventilation and Air Conditioning of Civil Buildings. In GB 50736-2012; China Architecture & Building Press: Beijing, China, 2012. [Google Scholar]
  34. Tianjin Municipal People’s Government. Regulations for District Heating in Tianjin; Tianjin Urban & Rural Construction Committee: Tianjin, China, 2004.
  35. Rea, M.S. The IESNA Lighting Handbook: Reference & Application; Illuminating Engineering Society of North America: New York, NY, USA, 2000. [Google Scholar]
  36. China Meteorological Administration. Available online: http://www.cma.gov.cn (accessed on 20 November 2010).
  37. De Dear, R.J.; Brager, G.S.; Reardon, J.; Nicol, F. Developing an adaptive model of thermal comfort and preference/discussion. ASHRAE Trans. 1998, 104, 145. [Google Scholar]
  38. Nicol, J.F.; Humphreys, M.A. Adaptive thermal comfort and sustainable thermal standards for buildings. Energy Build. 2002, 34, 563–572. [Google Scholar] [CrossRef]
  39. Moujalled, B.; Cantin, R.; Guarracino, G. Comparison of thermal comfort algorithms in naturally ventilated office buildings. Energy Build. 2008, 40, 2215–2223. [Google Scholar] [CrossRef]
  40. Wang, Z.; Zhang, L.; Zhao, J.; He, Y. Thermal comfort for naturally ventilated residential buildings in Harbin. Energy Build. 2010, 42, 2406–2415. [Google Scholar] [CrossRef]
  41. Standard, A. Standard 55–2010:“Thermal Environmental Conditions for Human Occupancy”; ASHRAE: Atlanta, GA, USA, 2010. [Google Scholar]
  42. Kaplan, R.; Kaplan, S. The Experience of Nature: A Psychological Perspective; Cambridge Univeristy Press: New York, NY, USA, 1989. [Google Scholar]
  43. Seaton, R.; Collins, J. Validity and reliability of ratings of simulated buildings. Environ.Design Res. Pract. 1972, EDRA2. 6-10-1–6-10-12. [Google Scholar]
  44. Hershberger, R.G.; Cass, R.C. Predicting user responses to buildings. In Man-Environment Interactions: Evaluations and Applications (Part 2), Stroudsburg: Dowden, Hutchinson and Ross; Halsted Press: New York, NY, USA, 1974. [Google Scholar]
  45. Oostendorp, A. The Identification and Interpretation of Dimensions Underlying Aesthetic Behaviour in the Daily Urban Environment; Univerisity of Torono: Toronto, ON, Canada, 1980. [Google Scholar]
  46. Dosen, A.S.; Ostwald, M.J. Lived space and geometric space: Comparing people’s perceptions of spatial enclosure and exposure with metric room properties and isovist measures. Archit. Sci. Rev. 2017, 60, 62–77. [Google Scholar] [CrossRef]
  47. Alkhresheh, M.M. Preference for void-to-solid ratio in residential facades. J. Environ. Psychol. 2012, 32, 234–245. [Google Scholar] [CrossRef]
  48. Montero-Parejo, M.J.; García-Moruno, L.; López-Casares, S.; Hernández-Blanco, J. Visual impact assessment of colour and scale of buildings on the rural landscape. Environ. Eng. Manag. J. (EEMJ) 2016, 15, 1537–1550. [Google Scholar]
  49. Partin, S.; Burley, J.B.; Schutzki, R.; Crawford, P. Concordance between Photographs and Computer Generated 3D Models in a Michigan Highway Transportation Setting; Anhalt University of Applied Sciences, Wichmann: Köthen, Germany, 2012; pp. 482–489. [Google Scholar]
  50. Standard, A. Energy standard for buildings except low-rise residential buildings. ASHRAE/IESNA Standard 1999, 90, 5. [Google Scholar]
  51. George, D.; Mallery, M. Using SPSS for Windows Step by Step: A Simple Guide and Reference; Allyn & Bacon: Boston, MA, USA, 2003. [Google Scholar]
  52. Aitken, P.P.; Hutt, C. Do Children Find Complex Patterns Interesting or Pleasing? Child Dev. 1974, 45, 425–431. [Google Scholar] [CrossRef] [PubMed]
Figure 1. The school building shapes analyzed in the study.
Sustainability 09 01708 g001
Figure 2. Normalized total annual energy consumption and summer discomfort time for all building shapes in terms of window to wall ratio.
Sustainability 09 01708 g002
Figure 3. Normalized total annual energy consumption and summer discomfort time for rectangle, H, and Ha building shapes in terms of rotation angle.
Sustainability 09 01708 g003
Figure 4. Normalized total annual energy consumption and summer discomfort time for the L shape building in terms of room depth.
Sustainability 09 01708 g004
Figure 5. The energy consumption for the south-oriented L shape building with a 40% window to wall ratio (WWR) in terms of room depth.
Sustainability 09 01708 g005
Figure 6. Mean of ratings for students' attention on geometry parameters and their effect on learning efficiency.
Sustainability 09 01708 g006
Figure 7. Mean and standard deviation of ratings for building geometry preferences, including building shape, WWR, room depth, and orientation.
Sustainability 09 01708 g007
Table 1. Summary of school buildings typologies and design parameters.
School Building TypeSchematic PlanProportionNumber of ClassroomsNumber of StoriesOrientationWindow to Wall RatioRoom Depth (m)
Rectangle shapeSustainability 09 01708 i00136%12–1073–6S/E/W/N/SE20–90%6.0–11.0
L shapeSustainability 09 01708 i00212%12–813–6S/W/E/NW20–60%6.5–10.5
C shapeSustainability 09 01708 i00320%6–1333–6S/W/E/SW20–70%6.0–12.5
H shapeSustainability 09 01708 i0045%23–904–6S/SW20–80%5.0–9.0
H shape with an atriumSustainability 09 01708 i0051%18–244–6S20–30%6.0–8.0
CourtyardSustainability 09 01708 i00611%12–902–6S/W/E/SE30–80%5.5–11.0
High-riseSustainability 09 01708 i0072%20–817–10S/E20–40%7.5–9.5
Irregular shape-14%12–1142–6S/E/SE20–70%6.5–10.0
Table 2. Brief for spatial program (taking 6 m of room depth as an example).
Room TypesSize (m2)NumberHeating Temperature (°C)Lighting (lx)Minimum Fresh Air * (m³/h·per)Occupancy Density (m2/person)Equipment (W/m2)Lighting Power Density (W/m2)
Teaching Space
General classroom482418300191.394.711
Laboratory room: Comprehensive; Demonstration72218300192.8811.011
Laboratory room: Chemistry; Physics; Biology72318300201.9211.011
History room72118300191.926.211
Calligraphy room72118300201.926.211
Computer room72116300201.9230.011
Reading room72120300201.906.211
Music room72118300201.646.211
Art room72118500201.926.218
Dancing room72122300193.156.211
Service Space
Bathroom18616100309.005.011
Hot water supply room18316100309.0050.011
Mechanical room18316100309.0050.011
Corridor/stairs/elevator--16100199.002.011
* The minimum fresh air rate was only used to obtain an estimation of the heat loss or gain from the outside air to calculate the zone energy balance when naturally ventilated.
Table 3. The wall and roof properties used in the simulations.
SectionU-Value W/(m2 K)
Wall:0.35
- Brickwork Outer Leaf (100 mm)
- EPS Expanded Polystyrene—CO2 Blowing (79.4 mm)
- Concrete Block (100 mm)
- Gypsum Plastering (13 mm)
Internal Wall:1.05
- Gypsum Plastering (13 mm)
- Concrete Block (100 mm)
- Gypsum Plastering (13 mm)
Roof:0.49
- Asphalt (19 mm)
- Fiberboard (13 mm)
- XPS Extruded Polystyrene—CO2 Blowing (48 mm)
- Cast Concrete (100 mm)
Glazing:2.67
- Generic Clear (6 mm)
- Air (13 mm)
- Generic Clear (6 mm)
Table 4. Monthly average global radiation levels in Tianjin.
MonthJan.Feb.Mar.Apr.May.Jun.Jul.Aug.Sep.Oct.Nov.Dec.
Direct solar radiation (kWh/m2)64.777.896.2122.2135.8135.6116.0103.3109.681.153.862.2
Diffuse solar radiation (kWh/m2)32.437.061.457.557.548.854.161.546.846.630.531.6
Table 5. Mean outdoor dry bulb temperature and mean wind speed of Tianjin as used for calculations.
MonthJan.Feb.Mar.Apr.May.Jun.Jul.Aug.Sep.Oct.Nov.Dec.
Mean outdoor dry bulb temperature (°C)–2.36–1.616.8014.4120.6824.2026.1225.5420.7414.375.33–0.61
Mean wind speed (m/s)2.091.912.592.762.352.141.731.742.092.061.971.89
Table 6. South window area ratios for different building shapes.
Building ShapeRectangleH ShapeHa ShapeL ShapeC ShapeHigh-riseCourtyard
Minimum value0.010.060.100.150.060.240.24
Maximum value0.480.440.390.350.360.250.25
Median value0.250.250.250.280.290.250.25
Table 7. Combinations of building shape, window to wall ratio, room depth, and orientation parameters showing both energy savings and thermal comfort improvements compared to the reference case.
Building ShapeOrientationRoom DepthMaximum Energy SavingMaximum Comfort Improvement
6 m8 m
Rectangle30% 8.0%1.4%
180°30%
H shape20%, 30%, 40%40%13.6%3.8%
180°20%, 30%, 40%40%
Courtyard90°20% 13.1%4.7%
270°20%