
Environmental Efficiency and Its Determinants for Manufacturing in China


1
School of Economics and Management, Beihang University, 37 Xueyuan Road, Haidian District, Beijing 100191, China
2
School of Finance, Central University of Finance and Economics, 39 South College Road, Haidian District, Beijing 100081, China
*
Author to whom correspondence should be addressed.
Sustainability 2017, 9(1), 47; https://doi.org/10.3390/su9010047
Submission received: 27 October 2016
/
Revised: 24 December 2016
/
Accepted: 26 December 2016
/
Published: 29 December 2016
Abstract
:In this study, we analyze the environmental efficiency performance and its determinants of 29 manufacturing industries in China from 2006 to 2011 by employing a two-stage DEA (data envelopment analysis)-Tobit model. For providing comparative and robust evidence, the 29 manufacturing industries are classified into three groups based on the pollution intensity. In the first stage, a SBM (slacks-based measure)-DEA model is applied to assess economic efficiency and environmental efficiency scores to illustrate the effects of the environmental factors, while taking into consideration the undesirable output. In the second stage, utilizing these calculated environmental efficiency scores as dependent variables, we employ a Tobit regression model to study the determinants of the environmental efficiency by selecting three independent variables including the industry scale, the openness degree and the energy structure. It turns out that the environmental factors have a positive effect on the lightly polluted industries and a negative effect on the moderately polluted industries, the heavily polluted industries, and the overall industries, while the openness degree, the industry scale, and the energy structure can be effective measures to improve environmental efficiency. Based on these findings, we propose policy measures to enhance the environmental efficiency of manufacturing in China.
1. Introduction
In recent years, environmental problems have become a great challenge with the economic growth in China. With 15.5% of global GDP in 2015, China has turned into the largest manufacturing power in the world. Meanwhile, China’s industry has basically completed mid-stage industrialization and has entered its late stage. However, accompanied with the high-speed development of manufacturing, China has paid enormous costs for energy over-consumption and serious environmental pollution. Thus, the environmental risk of manufacturing in China increases rapidly. In accordance with the investigation of the World Bank [1], China’s environmental cost is between 8% and 12% of GDP. This implies that the large cost of resources and energy has become one of the most serious problems of China’s sustainable development.
The purpose of this paper is to measure the environmental efficiency and its impact factors at China’s industrial level while considering undesirable outputs. By classifying China’s 29 manufacturing industries into lightly polluted, moderately polluted and heavily polluted industries according to the pollution intensity, we utilize a two-stage DEA-Tobit model to calculate the environmental efficiency and its determinants. In the first stage, in order to analyze the influence of environmental factors as undesirable outputs to different industries, we use SBM-DEA model to calculate the economic efficiency scores and the environmental efficiency scores of three groups of industries classified above from 2006 to 2011. In the second stage, utilizing the calculated environmental efficiency scores as dependent variables, we employ a Tobit regression model to analyze the impact of the openness degree, the industry scale, and the energy consumption on environmental efficiency. Finally, we propose policy measures to enhance the environmental efficiency of manufacturing in China.
Many previous studies focused on the environmental performance. The concept of environmental efficiency can be traced back to the 1970s [2]. Since then, different definitions of environmental efficiency have been provided. Eco-efficiency is generally defined as the ratio of the economic value of goods and services that satisfy human needs to environmental burden [3,4,5]. However, Kortelainen [6] defines the eco-efficiency as the ratio of added value to the environmental detrimental inputs. Additionally, environmental efficiency is commonly defined as the ratio of minimum feasible environmental damage to the observed level of inputs [7,8]. Despite the different definitions, the environmental efficiency is a comprehensive evaluation of the impact of resource utilization and economic activity to the environment. Therefore, considering the above definitions and the actual situation of our research, we define the environmental efficiency as the ability of a producer to contract undesirable byproducts and inputs while expending the desirable outputs simultaneously. Correspondingly, the economic efficiency can be defined as the ability of a producer to contract inputs while expending desirable outputs without considering undesirable outputs.
Several methods of environmental efficiency evaluation have been proposed in the past several decades. The environmental performance index (EPI) plays a significant role in environmental efficiency evaluation, which can be both simple and comprehensive, depending on the real condition of environmental efficiency evaluation [9,10,11,12]. It basically focuses on reducing the pressure of environment on human health and improving the vitality of ecosystem and the management of natural resources [13]. An important method of environmental efficiency evaluation is the life cycle analysis (LCA) [14,15,16,17,18]. This is called a “cradle-to-grave analysis” that analyzes the environmental impact of the use of raw materials and energy consumption over the life cycle of a given production [19,20,21]. Another evaluation method is stochastic frontier analysis (SFA) which is a parametric approach regarding the environmental damage as an independent variable or input [7]. In SFA, a production function needs to be confirmed [22,23]. However, it cannot always be correct with respect to subjective perception [24].
Recently, DEA has gained popularity in environmental efficiency analysis. DEA, proposed by Chanes et al. [25], is an effective nonparametric approach to evaluate the relative efficiency with multi-inputs and multi-outputs. Ramanathan [26] utilizes the DEA model to analyze the performance of energy consumption and CO2 emission in 17 countries of North Africa and the Middle East. Zhou et al. [27] apply two slacks-based measurements to estimate the CO2 emission of 30 Organization for Economic Co-operation and Development (OECD) countries. Zhou et al. [28] discuss the different performance of environmental DEA technologies under the assumption of variable return to scale (VRS) and non-increasing return to scale (NIRS). Zhang et al. [11] analyze the eco-efficiency of regional industrial systems of 30 provinces in China by using DEA model taking various undesirable outputs into account. Bian and Yang [29] adopt the Shannon-DEA procedure to analyze the resource and environmental efficiency of 30 provinces in China. Song and Wang [30] analyze the environmental efficiency of different regions in China by using the ratio-DEA decomposition algorithm and conclude that the environmental regulation and technological progress affect environmental efficiency in different ways. However, many previous studies focused on calculating the environmental efficiency scores without analyzing the influencing factors. Thus, we can hardly find a way to improve the environmental efficiency.
This paper extends the existing studies to three aspects. First, our study focuses on the environmental efficiency of the entire manufacturing in China. The present studies mostly focus on regions or countries; a few studies cover specific industries. Second, we incorporate the environmental factor as an undesirable output in the environmental efficiency calculation. Third, we investigate the effect of the openness degree, the industry scale and the energy structure on environmental efficiency.
2. Methodology
2.1. SBM-DEA Model for Economic-Environment Efficiency
We employ DEA to evaluate efficiency. The basic idea of DEA is forming an evaluation system and determining the most effective frontier by comprehensive analysis of input and output ratio with the decision-making units (DMUs). DEA can overcome the influence of subjective factors when setting weights in the traditional efficiency evaluation method.
When dealing with undesirable outputs, classic DEA models based on the assumption of producing more outputs relative to less input resources [25] are no longer suitable. However, undesirable outputs of social activities and productions, i.e., hazardous wastes and water pollutants, have been strongly considered as societal evils. Thus, the efficient production technologies should be recognized as less bad (undesirable) outputs and more good (desirable) outputs relative to fewer input resources [31].
Moreover, the DEA model can be divided into four types according to its measurement: radial and oriented, non-radial and oriented, radial and non-oriented, non-radial and non-oriented. Oriented denotes to the perspective of input or output. Radial implies that inputs and outputs should be amplified or reduced proportional to achieve efficiency. Most original DEA models are radial and oriented which cannot take into account of slackness sufficiently. Thus, there may be bias of efficiency [32].
Therefore, SBM, which is non-oriented and non-radial, employs input and output slacks directly into an efficiency measurement. The advantages of SBM is solving the problem of input and output slackness and avoiding bias from the selection of radial and oriented.
First, we introduce the original SBM to estimate the economic efficiency. Suppose there are n DMUs with m inputs and s outputs and each DMU has two factors: inputs () and outputs (). We define the two matrices as and , respectively. In accordance with the real condition of inputs and outputs, assume that and . The production possibility set (P) should be defined as follows:
where is a nonnegative vector where constrains can be imposed on.
For describing a certain DMU , according to the approach proposed by Tone [33], SBM is modeled as follows.
Subject to:
where vector expresses excesses in inputs while vector correspond to shortages in outputs. and are called slacks. denotes the number of elements in and denotes the number of elements in .
The objective function is strictly decreasing satisfying . If and only if = 1 (), the evaluated DMU is efficient. If , the evaluated DMU is weakly-efficient or inefficient. Second, we introduce the undesirable-SBM model for estimating the environmental efficiency [32]. The main idea of the undesirable-SBM model is to decompose the output matrix into () where and denote a good (desirable) output matrix and a bad (undesirable) output matrix, respectively. Specifically, assuming that there are n DMUs and each DMU has three factors: inputs (X), good outputs (), and bad outputs (), supposing there are m inputs, s1 good outputs and s2 bad outputs, we define the three matrices as , and , respectively.
Assuming that and , we define the production possibility set (P*) as follows.
where is a nonnegative vector.
For a DMU (), the undesirable-SBM model is modified as follows [32]:
Subject to:
where vector expresses excesses in inputs while denotes the number of elements in . Vector corresponds to shortages in good outputs and vector corresponds to excesses in bad outputs. and denote the number of elements in and , and .
The objective function is strictly decreasing, satisfying . If and only if = 1 ( = 0, = 0 and = 0), the evaluated DMU is efficient. If , the evaluated DMU is weakly-efficient or inefficient which can be improved to be an efficient DMU by augmenting the good output shortfall while deleting the input excess and bad output excess.
2.2. Tobit Model for Economic-Environment Efficiency Determinants
The Tobit regression model (also known as the censored regression model) devised by Tobin [34] assumes that the value of dependent variable is limited. The model is first used by Goldberger [35]. If the value of the variable is censored, OLS is no longer applied to estimate regression parameters. The Tobit regression model estimated by the maximum likelihood method is a better choice [34]. Since the efficiency scores calculated by DEA are limited in the interval (0, 1), OLS leads to inconsistent estimates [36]. Thus, the Tobit regression model is appropriate to analyze the determinants of environmental efficiency since it can make up the shortage of parameter estimation bias from direct OLS regression.
The Tobit regression model is described as follows:
where t denotes time and i is the serious number of variables. is a (r × 1) vector of explanatory variables, and is a (r × 1) vector of parameters needs to be estimated. is a latent variable whose value ranges from 0 to 1.
3. Empirical Analysis
In this section, we analyze the empirical results of the influencing factors of the environmental efficiency. First, the manufacturing industries are classified according to the pollution intensity. Second, we describe the data and propose the hypotheses. Third, we utilize a two-stage approach to analyze the efficiency. In the first stage, we use the SBM-DEA model to measure environmental efficiency and economic efficiency of manufacturing in China. The score falls between 0 and 1. In the second stage, we use the Tobit regression model to analyze the driving factors which influence the efficiency.
3.1. Manufacturing Classification
In this section, we establish a pollution intensity index to measure the pollution extent of manufacturing industries in China. Thus, 29 manufacturing industries are classified into three groups mainly: heavily polluted industries, moderately polluted industries, and lightly polluted industries. The pollution extent of manufacturing industries has a different effect on environment due to the diverse characteristics. Therefore, it is difficult to use for analyzing the effect of determinants on environmental efficiency from the perspective of overall manufacturing industries only. In order to make the research more concrete, it is necessary to understand the pollution condition of subdivided manufacturing industries.
Industrial pollution mainly includes the emission of wastewater, waste gas, and solid waste. However, Zaim [37] pointed out that air pollution is a main byproduct of the manufacturing activity process. Thus, waste gas is used as a proxy for industrial wastes to participate in the following calculation. Higher pollution intensity index means that manufacturing pollutes the environment more seriously.
(1) We define the pollutant emission intensity as follows:
where q is the serial number of the manufacturing industries, PI is the pollution emission intensity of each manufacturing industry, PEq denotes industrial wastes and we use total volume of industrial waste gas emission as proxy, GVq denotes gross industrial output value.
(2) The indices mentioned above are converted into proper dimensionless ones [38] whose value ranges from 0 to 1:
where Max(PIq) and Min(PIq) denote the maximum and minimum values of PIq, and PIIq is the pollution emission intensity index which is used to classify the manufacturing industries. The specific classification standard is shown in Table 1.
3.2. Data Description
3.2.1. Environment Efficiency Measurement Data
In this section, in order to estimate the economic efficiency and the environmental efficiency, the data selected from inputs and outputs is described. All data cover 30 manufacturing industries in China from 2006 to 2011 excluding the Recycling and Disposal of Waste Industry due to a lack of relevant data. Thus, there are 29 industries to be evaluated in all. According to a rule Golany and Roll [39] proposed, the number of evaluated DMUs should be more than five times the total selected number of inputs and outputs; otherwise, the study results’ credibility and validity of the results will be seriously compromised.
As for the input indicators, we employ capital, labor, energy consumption, and technology as inputs, since capital and labor are important production input factors according to modern Western economics [40]. Thus, we employ total assets as an indicator for capital and annual average employed person as an indicator for labor. Since Li et al. [40] using energy consumption as an input to evaluate the regional environmental efficiency, we chose energy consumption as an indicator. Meanwhile, Zhou et al. [28] indicate that environmental performance improved mainly from the technological change and technology development can improve environmental efficiency obviously. Thus, we employ the expenditure on R&D as a technology indicator [40].
As for output indicators, we use gross industrial output value as a desirable output and the total volume of industrial waste gas emission as an undesirable output. Some literature uses gross domestic product (GDP) as a desirable output to evaluate the regional environmental performance [27,28,40]. Thus, we utilize the gross industrial output value to evaluate the economic and environmental efficiency of manufacturing industries. We employ the total volume of industrial waste gas emission as an undesirable output because the waste gas is the main byproduct of production activity [37,41].
Among those variables, total assets, annual average employed persons, and gross industrial output value are from the China Statistical Yearbooks. Energy consumption is obtained from China Energy Statistical Yearbooks. Expenditure on R&D is from the China Statistical Yearbooks on Science and Technology. The volume of industrial waste gas is obtained from the China Statistical Yearbooks on Environment.
3.2.2. Tobit Regression Data and Its Hypotheses
The dataset used in this stage covers annual data of 29 manufacturing industries over the six-year period from 2006 to 2011. We analyze the explanatory variables of environmental efficiency from three factors, such as the openness degree, the industry scale and the energy structure. We define the technology development level and profitability as the control variables. The dataset is obtained from the China Statistical Yearbooks, China industry Economy Statistical Yearbook, China Statistical Yearbooks on Science and Technology and the China Energy Statistical Yearbooks.
Our regression analysis centers on the following four hypotheses:
Hypothesis 1.
A higher openness degree improves environmental efficiency.
In the process of economic globalization, the openness degree has a healthy impact on economy and environmental development. For one country, researching and developing the technology by itself and purchasing it from overseas are the two effective ways to gain the green technology. However, for a developing country, it is a lower risk way to purchase than to research and develop. By increasing the income, free trade can bring more resource and technology to improve the environment. Additionally, it can also benefit to the international exchange of cleaning technology, production, and service [42,43,44,45] considered that trade liberalization can reduce the energy market distortion and decrease the carbon emission worldwide. Some researches argue that foreign trade has made a great process in environmental and energy efficiency [29,46,47,48]. We define the percentage of industrial export value as the index of the openness degree [49,50].
Hypothesis 2.
A greater industry scale results in higher environmental efficiency.
Industry scale plays an important role in China’s industrial economy and environment. Large scale industries mainly are industries with high entering berries, high monopoly, and strong economy strength. The extent of investment scale of fixed assets in plant and equipment will accelerate the speed of improving and updating the technology in energy saving and emission reduction. As a result, large industry scale will weaken the carbon emission intensity and improve the energy and environment efficiency [51,52,53]. Zhu [54] argues that fixed capital is a very important factor for developing the economy. We define the percentage of industrial investment in fixed assets as the index of the industry scale.
Hypothesis 3.
The energy structure has a negative effect on environmental efficiency.
Since the resource characteristic is that the coal is fat and the oil is scarce in China, the energy structure in China is mainly composed by coal consumption and it has an effect on China’s economy and environment. Pan et al. [41] provides that coal consumption results in lower energy efficiency. Thus, we conclude that it has a negative effect on economy and environment. We define the percentage of industrial coal consumption as the index of the energy structure.
Hypothesis 4.
Technology development level has a positive effect on environmental efficiency.
The degree of industrial environment improvement can be considered as a proxy for the level of technological development. Bian and Yang [29] provide that technological innovation is closely related to resource and environment efficiency. We define the percentage of industrial invention patents as the index of the technology development level.
Hypothesis 5.
Higher profitability improves environmental efficiency.
Russo and Fouts [55] argue that there is a positive link between economic and environmental performance. Thus, we believe profitability has a positive effect on environmental efficiency. We define the ratio of total profits to revenue from principle businesses as the index of profitability.
The definitions of the variables mentioned above are shown in Table 2.
To define the effect of the influencing factors on the environmental efficiency, we define the Tobit model as follows:
where t denotes time and i is the serial number of the manufacturing industries. is a dependent variable which denotes the environmental efficiency considering undesirable outputs with the value ranges from 0 to 1. The meaning of EV, IFA, CC, IP and PTR is shown in Table 2. The openness degrees (EV), the industry scale (IFA) and the energy structure (CC) are explanatory variables. Additionally, the control variables are the technology development level (IP) and profitability (PTR) based on the present literature. is a constant term and are parameters to be estimated. is an error term and .
3.3. Environmental Efficiency Measurement of Manufacturing in China
We analyze the efficiency in two steps in this section. First, we calculate the manufacturing environmental efficiency using SBM-DEA model, considering undesirable output (volume of industrial waste gas); Second, we compute only economic efficiency taking no account of undesirable output. According to the efficiency scores we have obtained, we analyze the effect of the environmental factors on the economic performance of manufacturing industries.
Table 3 presents environmental efficiency scores considering undesirable output. These scores are used as the independent variables in the Tobit regression model. In Table 3, most of the environmental efficiency scores of manufacturing in China rise steadily from 2006 to 2011. It shows that in recent years, the development of manufacturing industry in China is in good condition.
As the results shown in Table 3 cannot reflect the effects of environmental factors on environmental efficiency evaluation, we calculate the pure economic efficiency scores by the SBM-DEA model mentioned above, without considering the environmental factors. We employ total assets, industrial labor, energy consumption, and expenditure on R&D as inputs, and gross industrial output value as the output. All data covers manufacturing in China from 2006 to 2011. The new calculation results are shown in Table 4.
Table 4 indicates that without considering environmental factors, the efficiency results calculated by the SBM-DEA model can also reflect the gradual increasing of manufacturing efficiency during 2006 and 2011. It shows that the environmental factors do not change the overall development trends of manufacturing environmental efficiency.
In Table 3 and Table 4, whether consider environmental factors or not, most of China’s manufacturing industries’ efficiencies rise steadily. Although some industries fluctuate in separate years, the overall condition goes well.
In Table 3, the environmental efficiency scores of Printing, Reproduction of Recording Media and Manufacture of Articles for Culture, Education and Sport Activity decrease significantly in Table 4, while they perform well without considering environmental factor. This indicates that environmental factors cause the efficiency to decline in the two industries mentioned above. Although these two industries are lightly polluted, the development still has a negative effect on the environment. According to the data from the China Statistical Yearbooks on Environment, the waste gas emission of Printing, Reproduction of Recording Media increases sharply from 11 billion m3 to 25.1 billion m3 during 2010 and 2011 which is 2.28 times higher than the previous year. In addition, the total volume of industrial waste gas emission of Manufacture of Articles for Culture, Education and Sport Activity increases sharply from 2009 to 2011. The emission in 2009 is 2.37 times higher than the year before. While in 2011, the emission is more than four times as high as in the previous year. Thus, the environmental efficiency of Manufacture of Articles for Culture, Education and Sport Activity drops constantly, and these two industries are high environmental risks.
Additionally, the environmental efficiency scores of the Manufacture of Measuring Instrument, Machinery for Cultural and Office Work increase sharply from 0.42 to 1.00 during 2010 and 2011, while the economy efficiency scores drop less. According to the original data from China Statistical Yearbooks on Environment, the waste gas emission drops sharply from 55.5 billion m3 to 10.1 billion m3 during 2010 and 2011, with 81.8% down from the previous year. In 2011, the environment of Manufacture of Measuring Instrument, Machinery for Cultural and Office Work has improved significantly and environmental factors have great influence on that industry. Thus, its environmental efficiency enhanced greatly.
Table 3 and Table 4 demonstrate that as an undesirable output, environmental factors have little influence on overall evaluation of environmental efficiency, but have great influence on some industries’ economic efficiencies.
However, from Table 3 and Table 4, we still cannot analyze the difference between environmental efficiency and economic efficiency of heavily polluted, moderately polluted, and lightly polluted industries. Thus, we will make a comparative study on different industries according to classification by pollution intensity. First, the heavily polluted industries are analyzed as follows:
Figure 1 demonstrates the comparison of average efficiency of manufacturing in six heavily polluted industries from 2006 to 2011. Industries which are classified as heavily polluted industries are mainly composed of pollution-intensive industries and traditional heavy chemical industries such as Manufacture and Processing of Ferrous Metals; Manufacture and Processing of Non-ferrous Metals and Paper Products and Manufacture of Chemical Raw Material and Chemical Products. This classification is basically in accordance with the conclusion of Copeland and Taylor [56]. The main characteristics of such industries are with greater resource consumption and higher pollution intensity. The efficiency scores of heavily polluted industries are rather low and there is little difference between the scores with or without considering undesirable outputs. Additionally, the environmental efficiency scores are slightly higher than that without considering environmental factors, since environmental factors brings down efficiency scores as undesirable outputs. This result indicates that heavily polluted industries are basically inefficient ones. Input and output efficiency of heavily polluted industries needs to be improved as the coordination between economy and environment is poor and the environmental risk is still high.
Figure 2 demonstrates the comparison of average efficiency of manufacturing in 15 moderately polluted industries from 2006 to 2011. The industries which are classified as moderately polluted industries mainly consist of two parts: (1) traditional labor-intensive industries and light industries, such as Processing of Food from Agricultural Products; Manufacture of Foods and Manufacture of Textile; and (2) some heavy industries whose pollutant emission intensity are second only to heavy chemical industries because of low environmental technology content such as the Manufacture of Rubber; Manufacture of Plastic, Manufacture of Metal Products. The efficiency scores of most moderately polluted industries are rather low and there is little difference between the scores with or without considering undesirable output. Additionally, the environmental efficiency scores are slightly higher than that without considering environmental factors. This is because the environmental factors can also bring down the economic efficiency scores as an undesirable output. However, two special industries are Processing of Petroleum, Coking, Processing of Nucleus Fuel and Processing of Food from Agricultural Products. The efficiency scores of these two industries are apparently higher than other moderately polluted industries. This implies these two industries are of good environmental benignity and the environment governance of other moderately polluted industries still needs to be improved.
Figure 3 demonstrates the comparison of average efficiency of manufacturing in eight lightly polluted industries from 2006 to 2011. The industries which are classified as lightly polluted industries are mainly composed of high technology industries (i.e., Manufacture of Electrical Machinery and Equipment; Manufacture of Communication, Computer, Other Electronic Equipment and Manufacture of Artwork, Other Manufacture) and clean industries (i.e., Manufacture of Tobacco; Printing, Reproduction of Recording Media and Manufacture of Articles for Culture, Education and Sport Activity). The main characteristics of such industries are less resource consumption and pollutant emission. This classification is basically in accordance with Li and Tao [57]. The efficiency scores of most lightly polluted industries are generally high. Only the efficiency of Printing, Reproduction of Recording Media industry is rather low, which implies its production characteristics bring about serious environmental problem and its environmental condition needs to be improved. Additionally, Figure 3 shows that different from heavily polluted and moderately polluted industries, more than half of the lightly polluted industries’ environmental efficiency scores are higher than the economic ones which implies these industries’ environmental conditions have been greatly improved during the production process. Thus, the environmental and the economic condition of these industries can coordinate well.
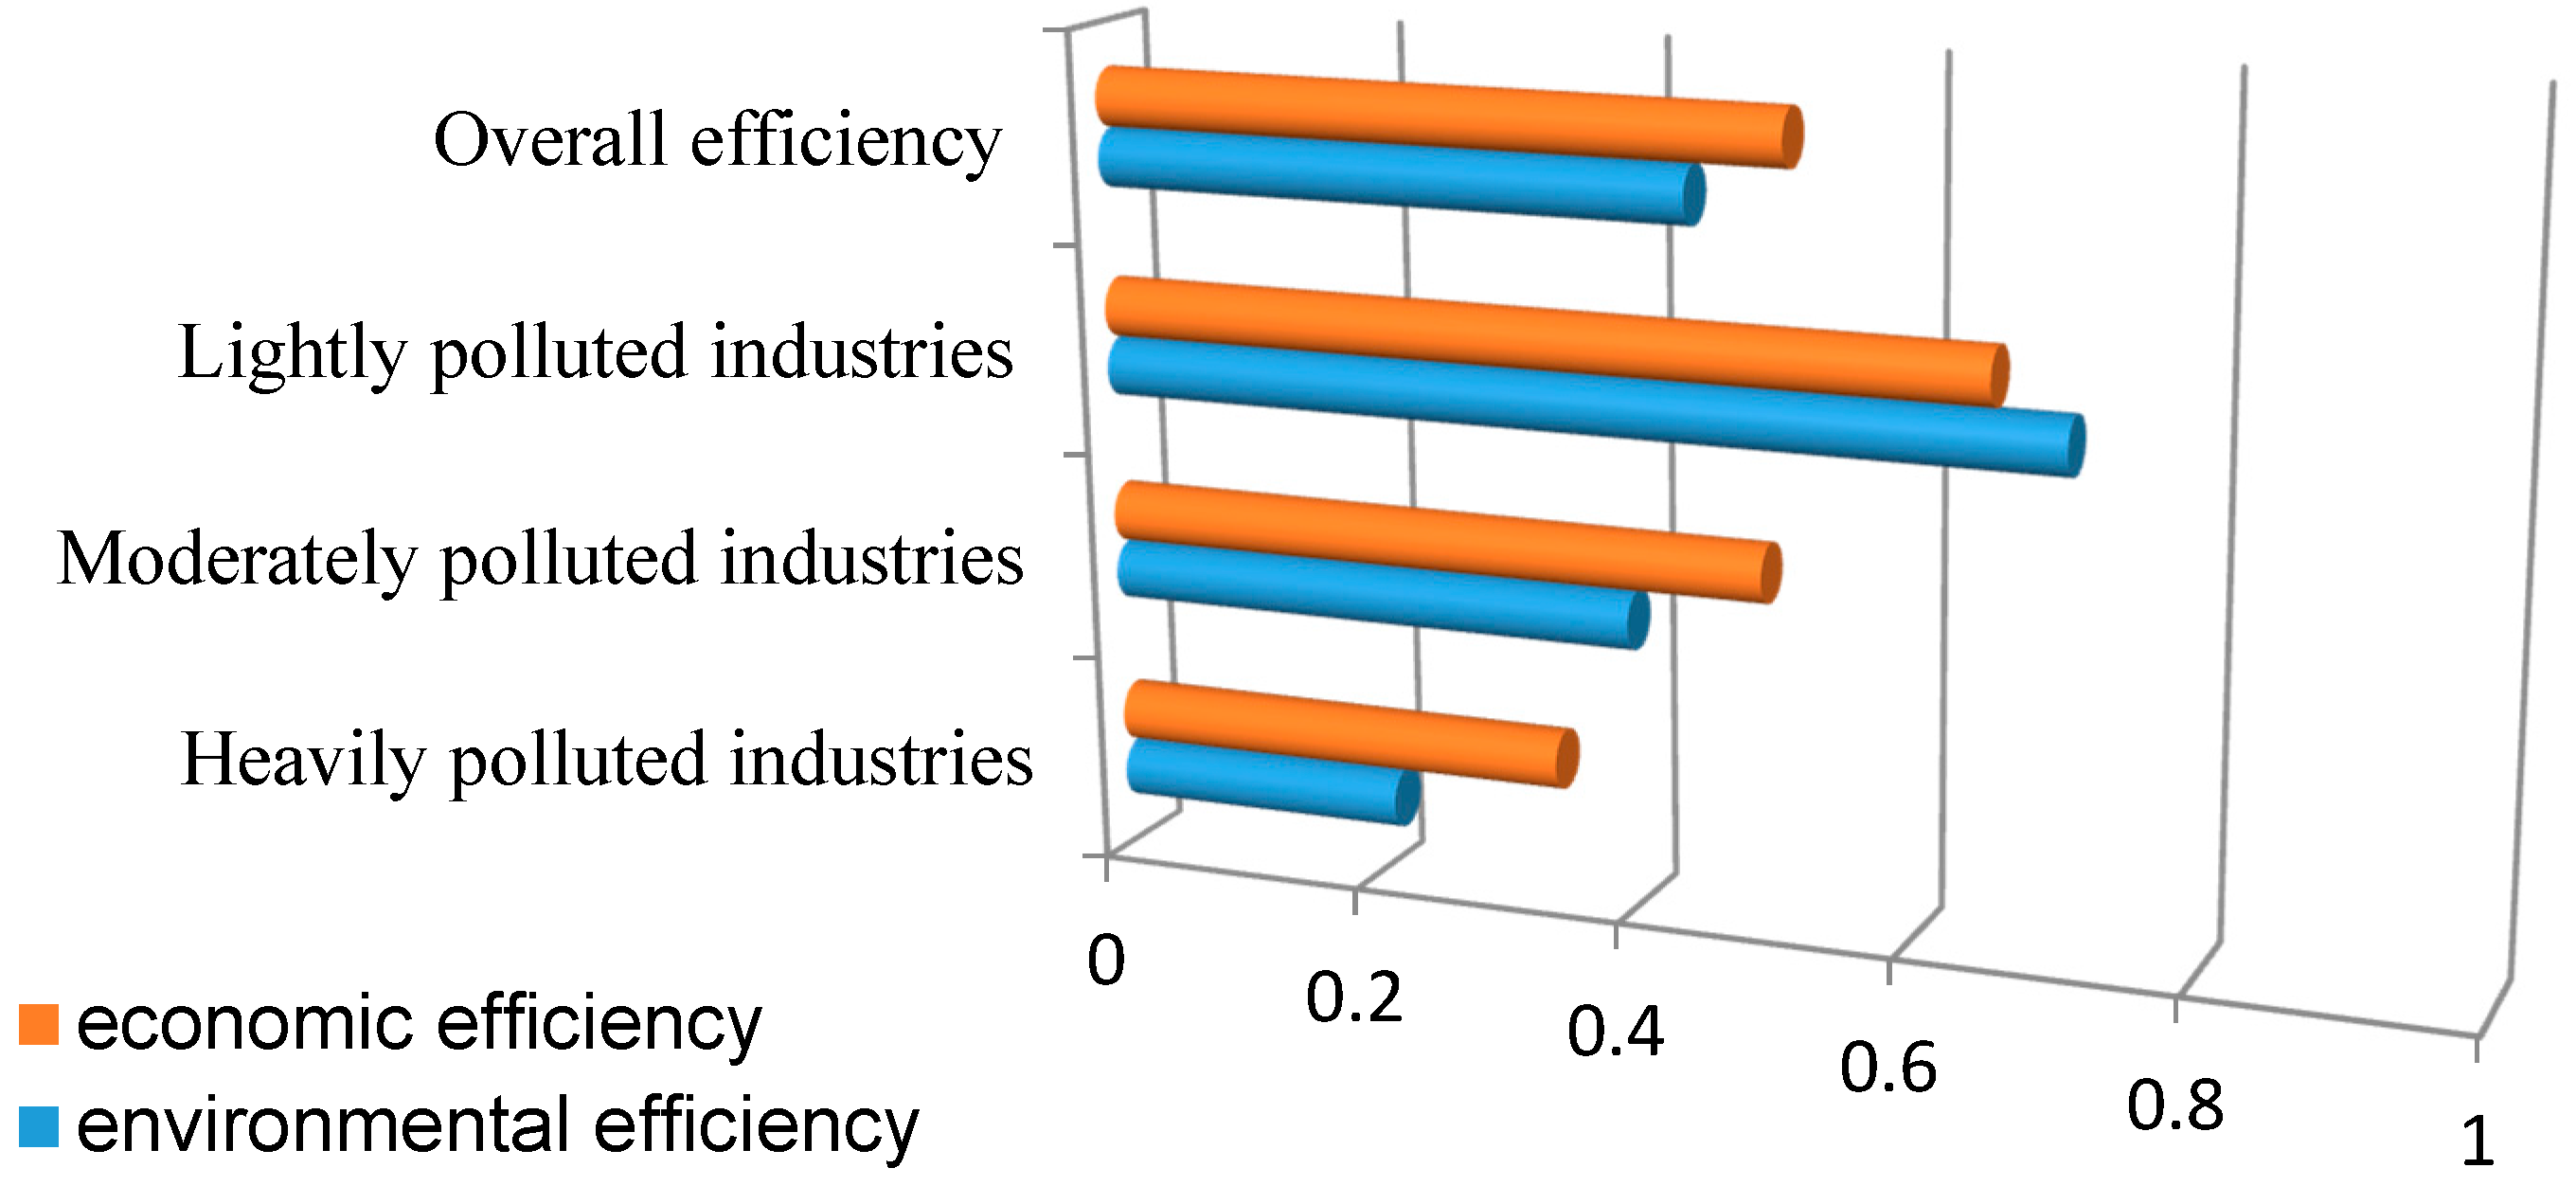
Figure 4 shows that the average level of total environmental efficiency of manufacturing in China from 2006 to 2011. In Figure 4, we can see that the efficiency scores of three types of industries are rising in the same trend. Among them, the economic efficiency scores of heavily polluted industries and the moderately polluted industries are higher than the economic-environmental ones. This implies that the environmental condition of these two types of industries still needs to be improved. Only the lightly polluted industries’ environmental efficiency scores are higher than the pure economic ones. It implies that a balanced development of economy and environment has been achieved in these industries. However, the overall economic efficiency scores are still higher than the economic-environmental ones which implies that the environmental condition of manufacturing in China still needs to be improved.
3.4. Tobit Regressions Analysis
Since the environmental efficiency scores of manufacturing in China are calculated by help of SBM-DEA model, we can assess the effects of different determinants on these efficiency scores. To this aim, a Tobit model is specified. Table 5 presents the estimation results.
Table 5 reports the Tobit regression results of the overall environmental efficiency. At the industrial level, the variable of the openness degree defined as percentage of industrial export value (EV) is a significant positive determinant of environmental efficiency at the 10% significance level, as theoretically expected. The variable of the industry scale defined as percentage of industrial investment in fixed assets (IFA) has a statistically significant, but negative coefficient at the 1% significance level, which does not conform to the hypothesis. We consider the reason for the results mentioned above is that industries with large-sized, low-efficiency, highly polluted, and high-energy consumption account for a large proportion of manufacturing in China. The variable of the energy structure defined as the percentage of industrial coal consumption (CC) is insignificant which does not conform to the hypothesis. This anomaly likely arises from the improvement of energy over-exploitation in recent years. Meanwhile, manufacturing industries strengthen the environmental governance to reduce the polluting emission, but with little influence. Thus, energy consumption has an insignificant negative impact on the environment. This implies that the energy structure and environmental governance of manufacturing in China still need to be improved. However, the variable of the technological development level defined as a percentage of industrial invention patents (IP) has a negative and insignificant coefficient on environmental efficiency. In order to find out the reason for the phenomenon, we tested the correlation of the variables. It turns out that only the technology development level and the openness degree are highly correlated with the coefficient of 0.97. This implies that the technology development level is substituted by the openness degree to a great extent. The variable of profitability defined as the ratio of total profits to revenue from principle business is insignificant for overall industries and other three types of industries. The main reason for this condition is that good pollution control cannot bring the company a high stock valuation [58]. Some scholars support our empirical findings. They believe there is no significant link between profitability and environment performance [58,59].
For the lightly polluted industries, the industry scale has a positive effect on the economic-environmental efficiencies as expected since most lightly polluted industries are high technology and clean industries. Additionally, the energy structure has a negative effect on the efficiency scores, which also conforms to the hypothesis. It implies that the energy structure is unreasonable, which needs to be improved at this level.
As for the moderately polluted industries, the coefficients of the openness degree and the industry scale are insignificant since most of the moderately polluted industries are traditional labor-intensive industries with poor economic and environmental benefits generally. The energy structure has a significant positivity effect on the efficiency scores. It implies that the energy structure is reasonable and it can improve the environment at this level. Additionally, the technological development level has a significant negative effect on environmental efficiency. This demonstrates that technology development decreases the economic-environmental efficiencies at this level.
For the heavily polluted industries, only industry scale has a significant negative effect on environmental efficiency, as well as for all industries mentioned above. This implies that most highly polluted industries belong to industries with large-sized, low-efficiency, and high energy consumption. As for other influence factors, they are insignificant.
According to the Tobit regression model, the openness degree has a positive significant impact on environmental efficiency of manufacturing industries, overall. The industry scale is a significant determinant for all kinds of industries, except for the moderately polluted industries which influence the overall and heavily polluted industries negatively, and influence the lightly polluted industries positively. The energy structure is a significant determinant of environmental efficiency for lightly polluted and moderately polluted industries, which lose its explanatory power for overall industries and heavily polluted industries. It influences the efficiency scores of moderately polluted industries positively, while influencing lightly polluted industries negatively.
4. Conclusions
By classifying 29 Chinese manufacturing industries into lightly polluted, moderately polluted and heavily polluted industries according to the pollution intensity, we utilize a two-stage DEA-Tobit model to analyze the environmental efficiency and its determinants.
In the first stage, we use the SBM-DEA model to compare environmental efficiency considering undesirable outputs with economic efficiency without considering environmental factors. It turns out the environmental factors have a positive effect on the lightly polluted industries and has a negative effect on the moderately polluted industries, the heavily polluted industries and the overall industries.
In the second stage, we employ the Tobit model to confirm the determinants of environmental efficiency and their explanation power. Hypothesis tests show that the overall manufacturing environmental efficiency is positively related to the openness degree, while negatively related to the industry scale. The lightly polluted industries’ environmental efficiency is positively related to the industry scale, while negatively related to the energy structure. The energy structure has a positive effect on the moderately polluted industries, while the industry scale has a negative impact on the heavily polluted industries.
Our empirical findings show that the openness degree, the industry scale and the energy consumption are key measures to improve the environmental efficiency. Therefore, in order to realize the harmonious coexistence between the development of economy and environment, our policy recommendations are as follows: First, we should promote more healthy development of Chinese foreign trade and investment especially in products and technology of energy conservation and environmental protection; Second, achieving industrial transformation and upgrading should first emphasize larged-sized and medium-sized industries for the purpose of environmental improvement. At the same time, we need further to advance energy-light industries without increasing undesirable outputs; Third, we should adopt appropriately differentiated policy measurements according to specific circumstances of different industries. In addition, industry-specific economic-environmental efficiencies provide more information for commercial banks to measure the environmental risk for their corporate financial services in term of environmental finance.
It may be possible to extend this study in some directions. First, we can get dynamic measures for the environmental efficiency across industries over time, especially considering sustainable R&D in green technologies. Second, we need more concrete research on the environmental risk measurement varying with different industries, which benefits the development of environmental finance. In this study, we consider only one undesirable output as a proxy variable and define only three influencing factors. We can consider additional undesirable output variables and make more comprehensive hypotheses in further studies. In addition, lengthening the time span can also extend our study.
Acknowledgments
This work has been financially supported by the National Natural Science Foundation of China (71173008, 71673020, 71671193) and the Social Science Foundation of China (No. 15ZDA058). The authors are very grateful to have the paper manuscript reviewed by the journal reviewers.
Author Contributions
Xu Wang conceived, designed, and performed the experiments, analyzed the data, wrote the paper and revised the paper; Liyan Han designed the research, supervised the whole process and revised the paper. Libo Yin worked for modeling and revised the paper. All authors have read and approved the final manuscript.
Conflicts of Interest
The authors declare no conflict of interest.
References
- World Bank. Cost of Pollution in China; The World Bank: Washington, DC, USA, 2007. [Google Scholar]
- Shephard, R.W. Theory of Cost and Production Functions; Princeton University Press: Princeton, NJ, USA, 1970. [Google Scholar]
- Schmidheiny, S. Changing Course: A Global Business Perspective on Development and the Environment; MIT press: Cambridge, MA, USA, 1992; Volume 1. [Google Scholar]
- Jollands, N. An Ecological Economics of Eco-Efficiency: Theory, Interpretations and Applications to New Zealand. Ph.D. Thesis, Massey University, Palmerston North, New Zealand, 2003. [Google Scholar]
- Henriques, J.; Catarino, J. Sustainable value—An energy efficiency indicator in wastewater treatment plants. J. Clean. Prod. 2017, 142, 323–330. [Google Scholar] [CrossRef]
- Kortelainen, M. Dynamic environmental performance analysis: A Malmquist index approach. Ecol. Econ. 2008, 64, 701–715. [Google Scholar] [CrossRef]
- Reinhard, S.; Lovell, C.K.; Thijssen, G.J. Environmental efficiency with multiple environmentally detrimental variables; estimated with SFA and DEA. Eur. J. Oper. Res. 2000, 121, 287–303. [Google Scholar] [CrossRef]
- Mandal, S.K.; Madheswaran, S. Environmental efficiency of the Indian cement industry: An interstate analysis. Energy Policy 2010, 38, 1108–1118. [Google Scholar] [CrossRef]
- Diaz Mandal Diaz-Balteiro, L.; Romero, C. In search of a natural systems sustainability index. Ecol. Econ. 2004, 49, 401–405. [Google Scholar] [CrossRef]
- Fare, R.; Grosskopf, S. Modeling undesirable factors inefficiency evaluation: Comment. Eur. J. Oper. Res. 2004, 157, 242–245. [Google Scholar] [CrossRef]
- Zhang, B.; Bi, J.; Fan, Z.; Yuan, Z.W.; Ge, J.J. Eco-efficiency analysis of industrial system in China: A data envelopment analysis approach. Ecol. Econ. 2008, 68, 306–316. [Google Scholar] [CrossRef]
- Vachon, S. Technological capacity and environmental performance: A research note using country level data. J. Oper. Supply Chain Manag. 2012, 1, 21–28. [Google Scholar]
- Esty, D.C.; Levy, M.A.; Srebotniak, T.; de Sherbinin, A.; Kim, B.; Anderson, B. Pilot 2006 Environmental Performance Index; Yale Center for Environmental Law & Policy: New Haven, CT, USA, 2006. [Google Scholar]
- Miettinen, P.; Hamalainen, R.P. How to benefit from decision analysis in environmental life cycle assessment (LCA). Eur. J. Oper. Res. 1997, 102, 279–294. [Google Scholar] [CrossRef]
- Finnveden, G.; Ekvall, T. Life-cycle assessment as a decision-support tool—The case of recycling versus incineration of paper. Resour. Conserv. Recycl. 1998, 24, 235–256. [Google Scholar] [CrossRef]
- Ayalon, O.; Avnimelech, Y.; Shechter, M. Application of a comparative multidimensional life cycle analysis in solid waste management policy: The case of soft drink containers. Environ. Sci. Policy 2000, 3, 135–144. [Google Scholar] [CrossRef]
- Poeschl, M.; Ward, S.; Owende, P. Environmental impacts of biogas deployment–Part II: Life cycle assessment of multiple production and utilization pathways. J. Clean. Prod. 2012, 24, 184–201. [Google Scholar] [CrossRef]
- Carvalho, A.; Mimoso, A.F.; Mendes, A.N.; Matos, H.A. From a literature review to a framework for environmental process impact assessment index. J. Clean. Prod. 2014, 64, 36–62. [Google Scholar] [CrossRef]
- Kirkpatrick, N. Selecting a waste management option using a life-cycle analysis approach. Packag. Technol. Sci. 1993, 6, 159–172. [Google Scholar] [CrossRef]
- Cornelissen, R.L.; Hirs, G.G. The value of the exergetic life cycle assessment besides the LCA. Energy Convers. Manag. 2002, 43, 1417–1424. [Google Scholar] [CrossRef]
- Bohlmann, G.M. Biodegradable packaging life-cycle assessment. Environ. Prog. 2004, 23, 342–346. [Google Scholar] [CrossRef]
- Aigner, D.; Lovell, C.K.; Schmidt, P. Formulation and estimation of stochastic frontier production function models. J. Econ. 1977, 6, 21–37. [Google Scholar] [CrossRef]
- Dyson, R.G.; Shale, E.A. Data envelopment analysis, operational research and uncertainty. J. Oper. Res. Soc. 2010, 61, 25–34. [Google Scholar] [CrossRef]
- Chen, L.; Jia, G. Environmental efficiency analysis of China’s regional industry: A data envelopment analysis (DEA) based approach. J. Clean. Prod. 2017, 142, 846–853. [Google Scholar] [CrossRef]
- Charnes, A.; Cooper, W.W.; Rhodes, E. Measuring the efficiency of decision making units. Eur. J. Oper. Res. 1978, 2, 429–444. [Google Scholar] [CrossRef]
- Ramanathan, R. An analysis of energy consumption and carbon dioxide emissions in countries of the Middle East and North Africa. Energy 2005, 30, 2831–2842. [Google Scholar] [CrossRef]
- Zhou, P.; Ang, B.W.; Poh, K.L. Slacks-based efficiency measures for modeling environmental performance. Ecol. Econ. 2006, 60, 111–118. [Google Scholar] [CrossRef]
- Zhou, P.; Poh, K.L.; Ang, B.W. A non-radial DEA approach to measuring environmental performance. Eur. J. Oper. Res. 2007, 178, 1–9. [Google Scholar] [CrossRef]
- Bian, Y.; Yang, F. Resource and environment efficiency analysis of provinces in China: A DEA approach based on Shannon’s entropy. Energy Policy 2010, 38, 1909–1917. [Google Scholar] [CrossRef]
- Song, M.L.; Wang, S.H. DEA decomposition of China’s environmental efficiency based on search algorithm. Appl. Math. Comput. 2014, 247, 562–572. [Google Scholar] [CrossRef]
- Cooper, W.W.; Seiford, L.M.; Tone, K. Data Envelopment Analysis: A Comprehensive Text with Models, Applications, References and DEA-Solver Software, 2nd ed.; Kluwer Academic Publishers: Boston, MA, USA, 2007. [Google Scholar]
- Tone, K. Dealing with Undesirable Outputs in DEA: A Slacks-based Measure (SBM) Approach. Available online: https://grips.repo.nii.ac.jp/?action=repository_uri&item_id=955&file_id=20&file_no=1 (accessed on 29 December 2016).
- Tone, K. A slacks-based measure of efficiency in data envelopment analysis. Eur. J. Oper. Res. 2001, 130, 498–509. [Google Scholar] [CrossRef]
- Tobin, J. Estimation of relationships for limited dependent variables. Econometrica 1958, 26, 24–36. [Google Scholar] [CrossRef]
- Goldberger, A.S. Econometric Theory; Wiley: New York, NY, USA, 1964. [Google Scholar]
- Kirjavainen, T.; Loikkanent, H.A. Efficiency differences of Finnish senior secondary schools: An application of DEA and Tobit analysis. Econ. Educ. Rev. 1998, 17, 377–394. [Google Scholar] [CrossRef]
- Zaim, O. Measuring environmental performance of state manufacturing through changes in pollution intensities: A DEA framework. Ecol. Econ. 2004, 48, 37–47. [Google Scholar] [CrossRef] [Green Version]
- Kheder, S.B.; Zugravu, N. The Pollution Haven Hypothesis: A Geographic Economy Model in a Comparative study; FEEM: Milan, Italy, 2008; Available online: https://halshs.archives-ouvertes.fr/halshs-00344845/document (accessed on 29 December 2016).
- Golany, B.; Roll, Y. An application procedure for DEA. Omega-Int. J. Manag. Sci. 1989, 17, 237–250. [Google Scholar] [CrossRef]
- Li, H.; Fang, K.; Yang, W.; Wang, D.; Hong, X. Regional environmental efficiency evaluation in China: Analysis based on the Super-SBM model with undesirable outputs. Math. Comput. Model. 2013, 58, 1018–1031. [Google Scholar] [CrossRef]
- Pan, H.; Zhang, H.; Zhang, X. China’s provincial industrial energy efficiency and its determinants. Math. Comput. Model. 2013, 58, 1032–1039. [Google Scholar] [CrossRef]
- Selden, T.M.; Song, D. Environmental quality and development: Is there a Kuznets curve for air pollution emissions? J. Environ. Econ. Manag. 1994, 27, 147–162. [Google Scholar] [CrossRef]
- Werner, A.; Brian, C.; Scott, T. Is free trade good for the environment. Am. Econ. Rev. 2001, 91, 877–908. [Google Scholar]
- Dean, J.M.; Lovely, M.E. Trade Growth, Production Fragmentation, and China’s Environment. In China’s Growing Role in World Trade; University of Chicago Press: Chicago, IL, USA, 2010; pp. 429–469. [Google Scholar]
- Burniaux, J.M.; Martin, J.P.; Nicoletti, G.; Martins, J.O. GREEN a Multi-Sector, Multi-Region General Equilibrium Model for Quantifying the Costs of Curbing CO2 Emissions. 1992. Available online: http://www.oecd-library.org/docserver/download/744101452772.pdf?expires=1482897609&id=id&accname=guest&checksum=9CCF8B8E2E7DFBE2FCE12A5094DAD90F (accessed on 29 December 2016).
- Mielnik, O.; Goldemberg, J. Foreign direct investment and decoupling between energy and gross domestic product in developing countries. Energy Policy 2002, 30, 87–89. [Google Scholar] [CrossRef]
- Welsch, H.; Ochsen, C. The determinants of aggregate energy use in West Germany: Factor substitution, technological change, and trade. Energy Econ. 2005, 27, 93–111. [Google Scholar] [CrossRef]
- Hubler, M. Energy Saving Technology Diffusion via FDI and Trade: A CGE Model of China; Institute for the World Economy: Kiel, Germany, 2009. [Google Scholar]
- Lai, M.; Xu, H.; Bao, Q. Export Trade and Economic Growth; Shanghai Sanlianc Book Store: Shanghai, China, 2003. [Google Scholar]
- Zhang, Q. Wages, Export Trade and Total Factor Productivity: From 1979 to 2009. J. Financ. Econ. 2011, 4, 26–36. [Google Scholar]
- Cole, A.M.; Elliott, R.J.; Wu, S. Industrial activity and the environment in China: An industry-level analysis. China Econ. Rev. 2008, 19, 393–408. [Google Scholar] [CrossRef]
- Shao, S.; Yang, L.L.; Cao, J.H. Study on Influencing Factors of CO2 Emissions from Industrial Energy Consumption: An Empirical Analysis Based on STIRPAT Model and Industrial Sectors’ Dynamic Panel Data in Shanghai. J. Financ. Econ. 2010, 11, 16–27. [Google Scholar]
- Wang, S.; Qu, X. Research on Total Factor Energy Efficiency Change of China Manufacturing Industry Considering Environmental Effects: Based on DEA-Malmquist Index Empirical Study. China Popul. Resour. Environ. 2011, 8, 130–137. [Google Scholar]
- Zhu, J. Data envelopment analysis with preference structure. J. Oper. Res. Soc. 1996, 47, 136–150. [Google Scholar] [CrossRef]
- Russo, M.V.; Fouts, P.A. A resource-based perspective on corporate environmental performance and profitability. Acad. Manag. J. 1997, 40, 534–559. [Google Scholar] [CrossRef]
- Copeland, B.R.; Taylor, M.S. Trade, growth, and the environment. J. Econ. Lit. 2004, 42, 7–71. [Google Scholar] [CrossRef]
- Li, L.; Tao, F. Slection of optimal environmental regulation intensity for Chinese manufacturing industry-based on the green TFP perspective. China Ind. Econ. 2012, 290, 70–82. [Google Scholar]
- Fogler, H.R.; Nutt, F. A note on social responsibility and stock valuation. Acad. Manag. J. 1975, 18, 155–160. [Google Scholar] [CrossRef]
- Rockhess, J.; Schlachter, P.; Rockness, H.O. Hazardous waste disposal, corporate disclosure, and financial performance in the chemical industry. In Advances in Public Interest Accounting; Neimark, M., Ed.; JAI Press: Greenwich, UK, 1986; Volume 1, pp. 167–191. [Google Scholar]
Figure 1.
Average economy efficiency and average environmental efficiency in heavily polluted industries.
Figure 1.
Average economy efficiency and average environmental efficiency in heavily polluted industries.
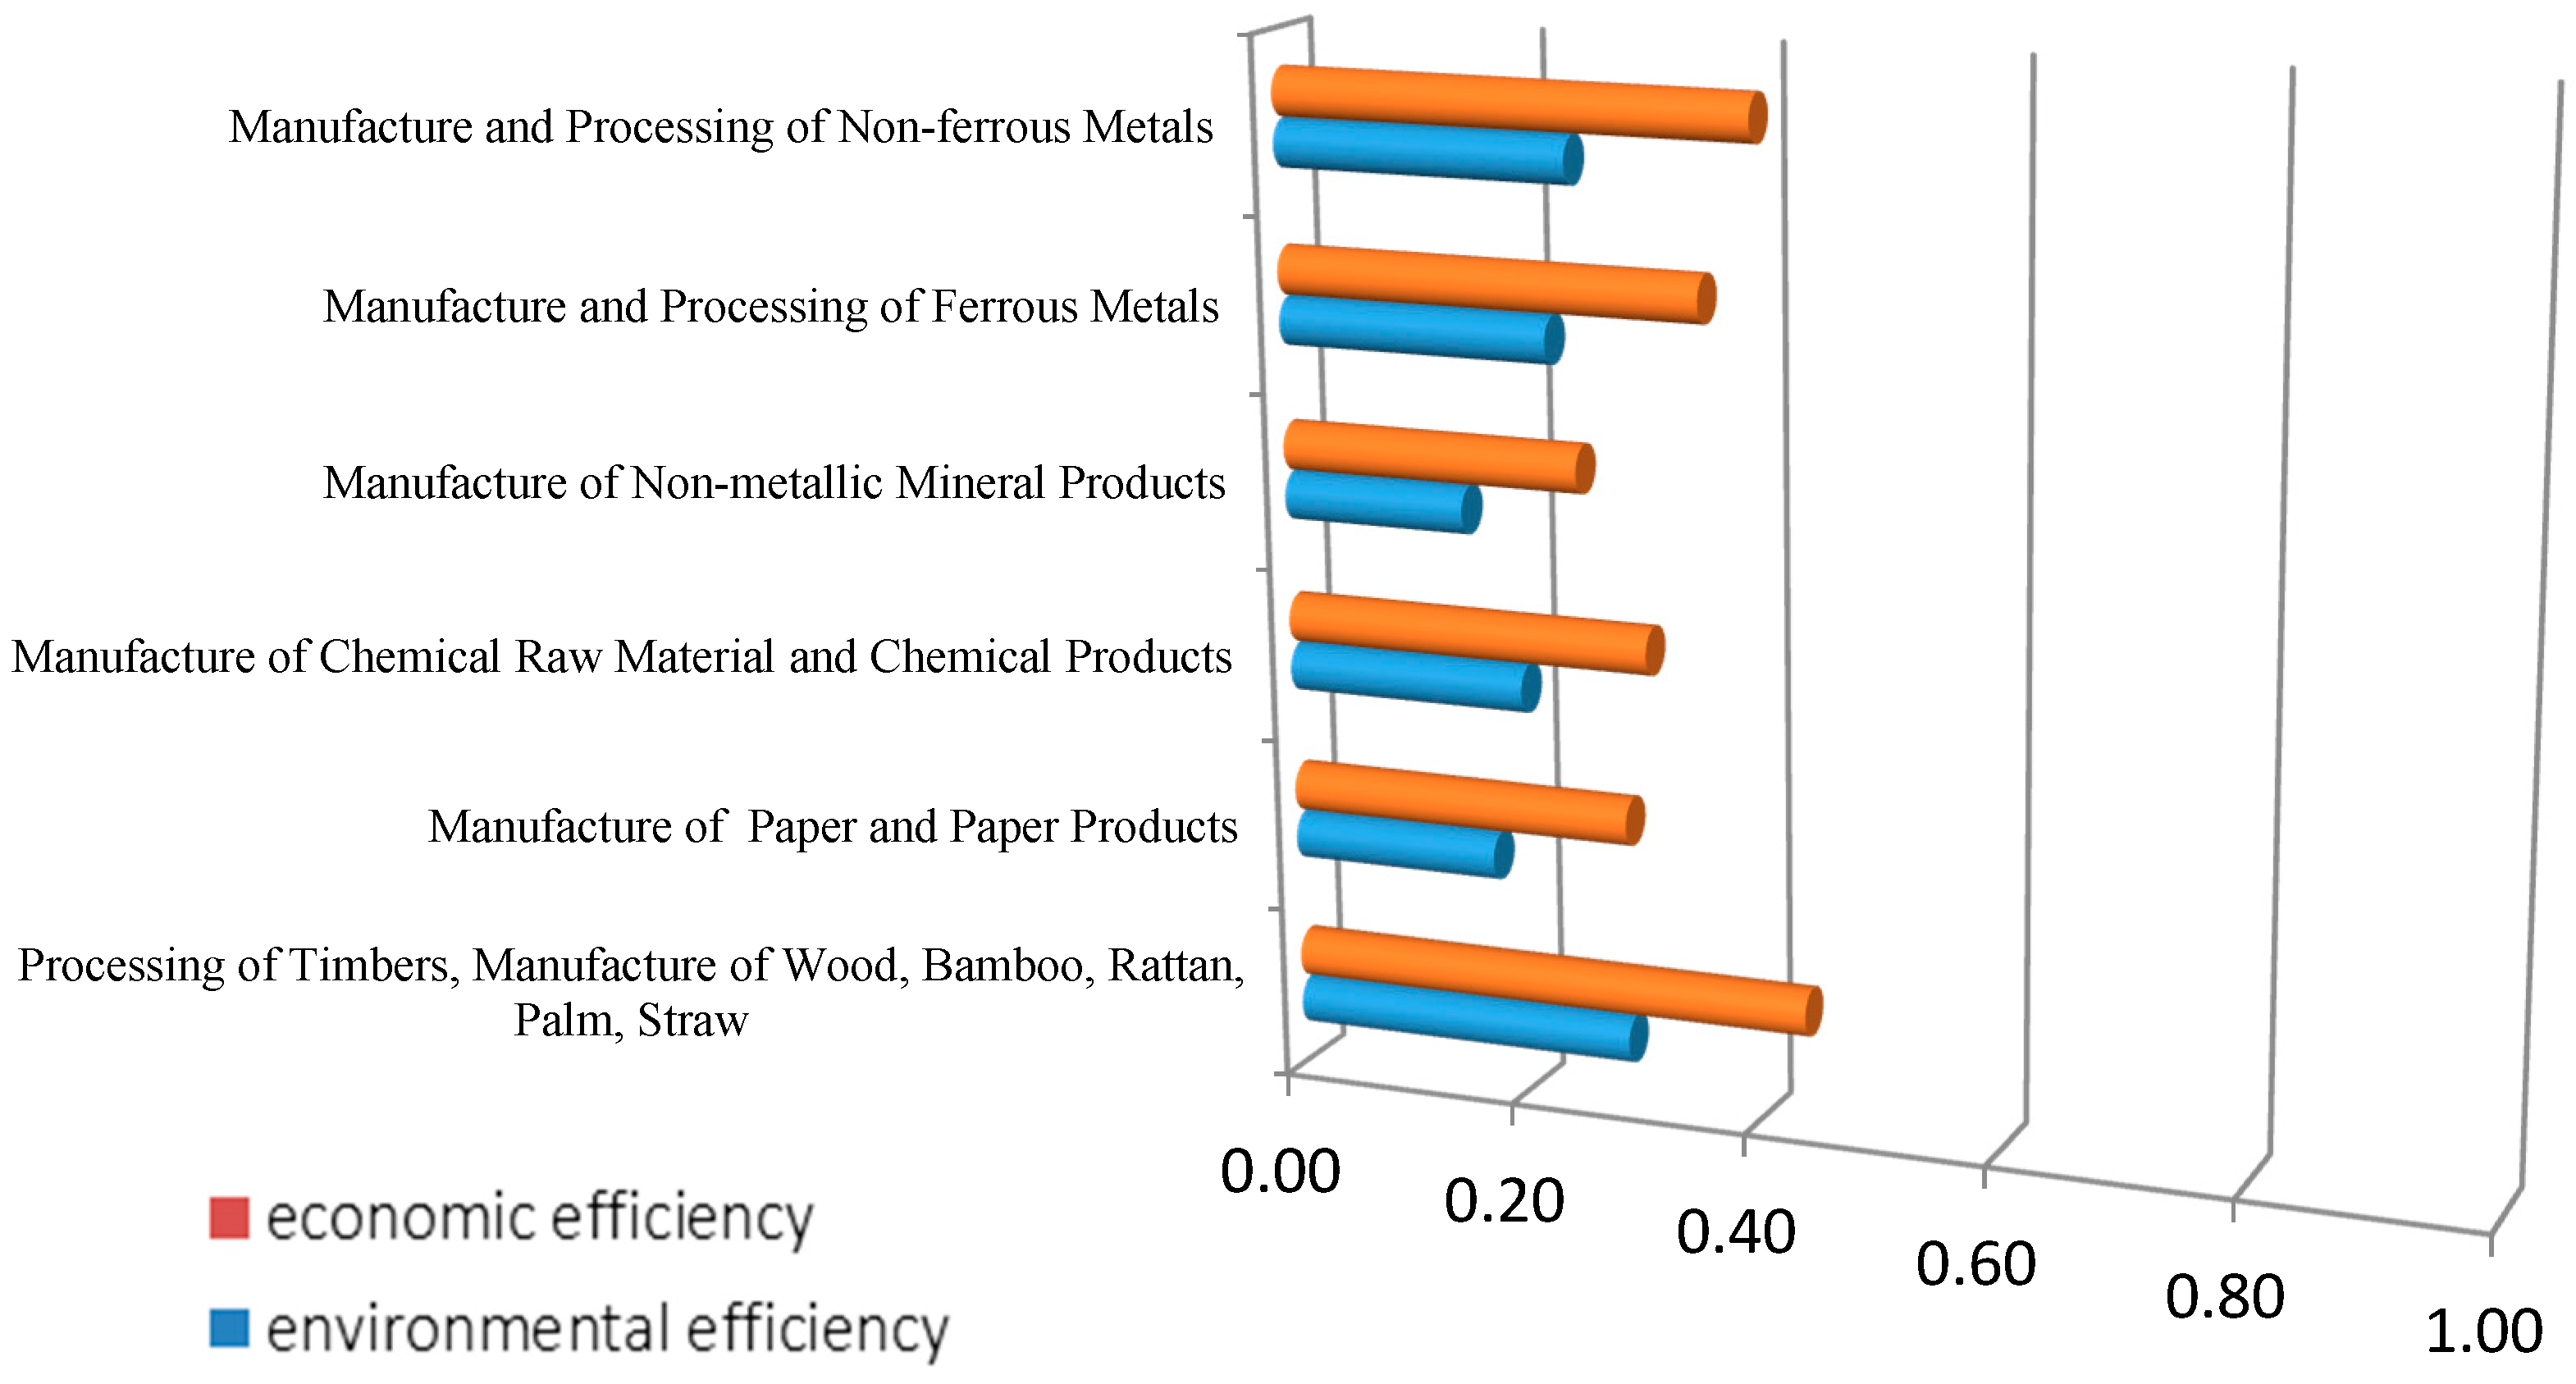
Figure 2.
Average economy efficiency and average environmental efficiency in moderately polluted industries.
Figure 2.
Average economy efficiency and average environmental efficiency in moderately polluted industries.
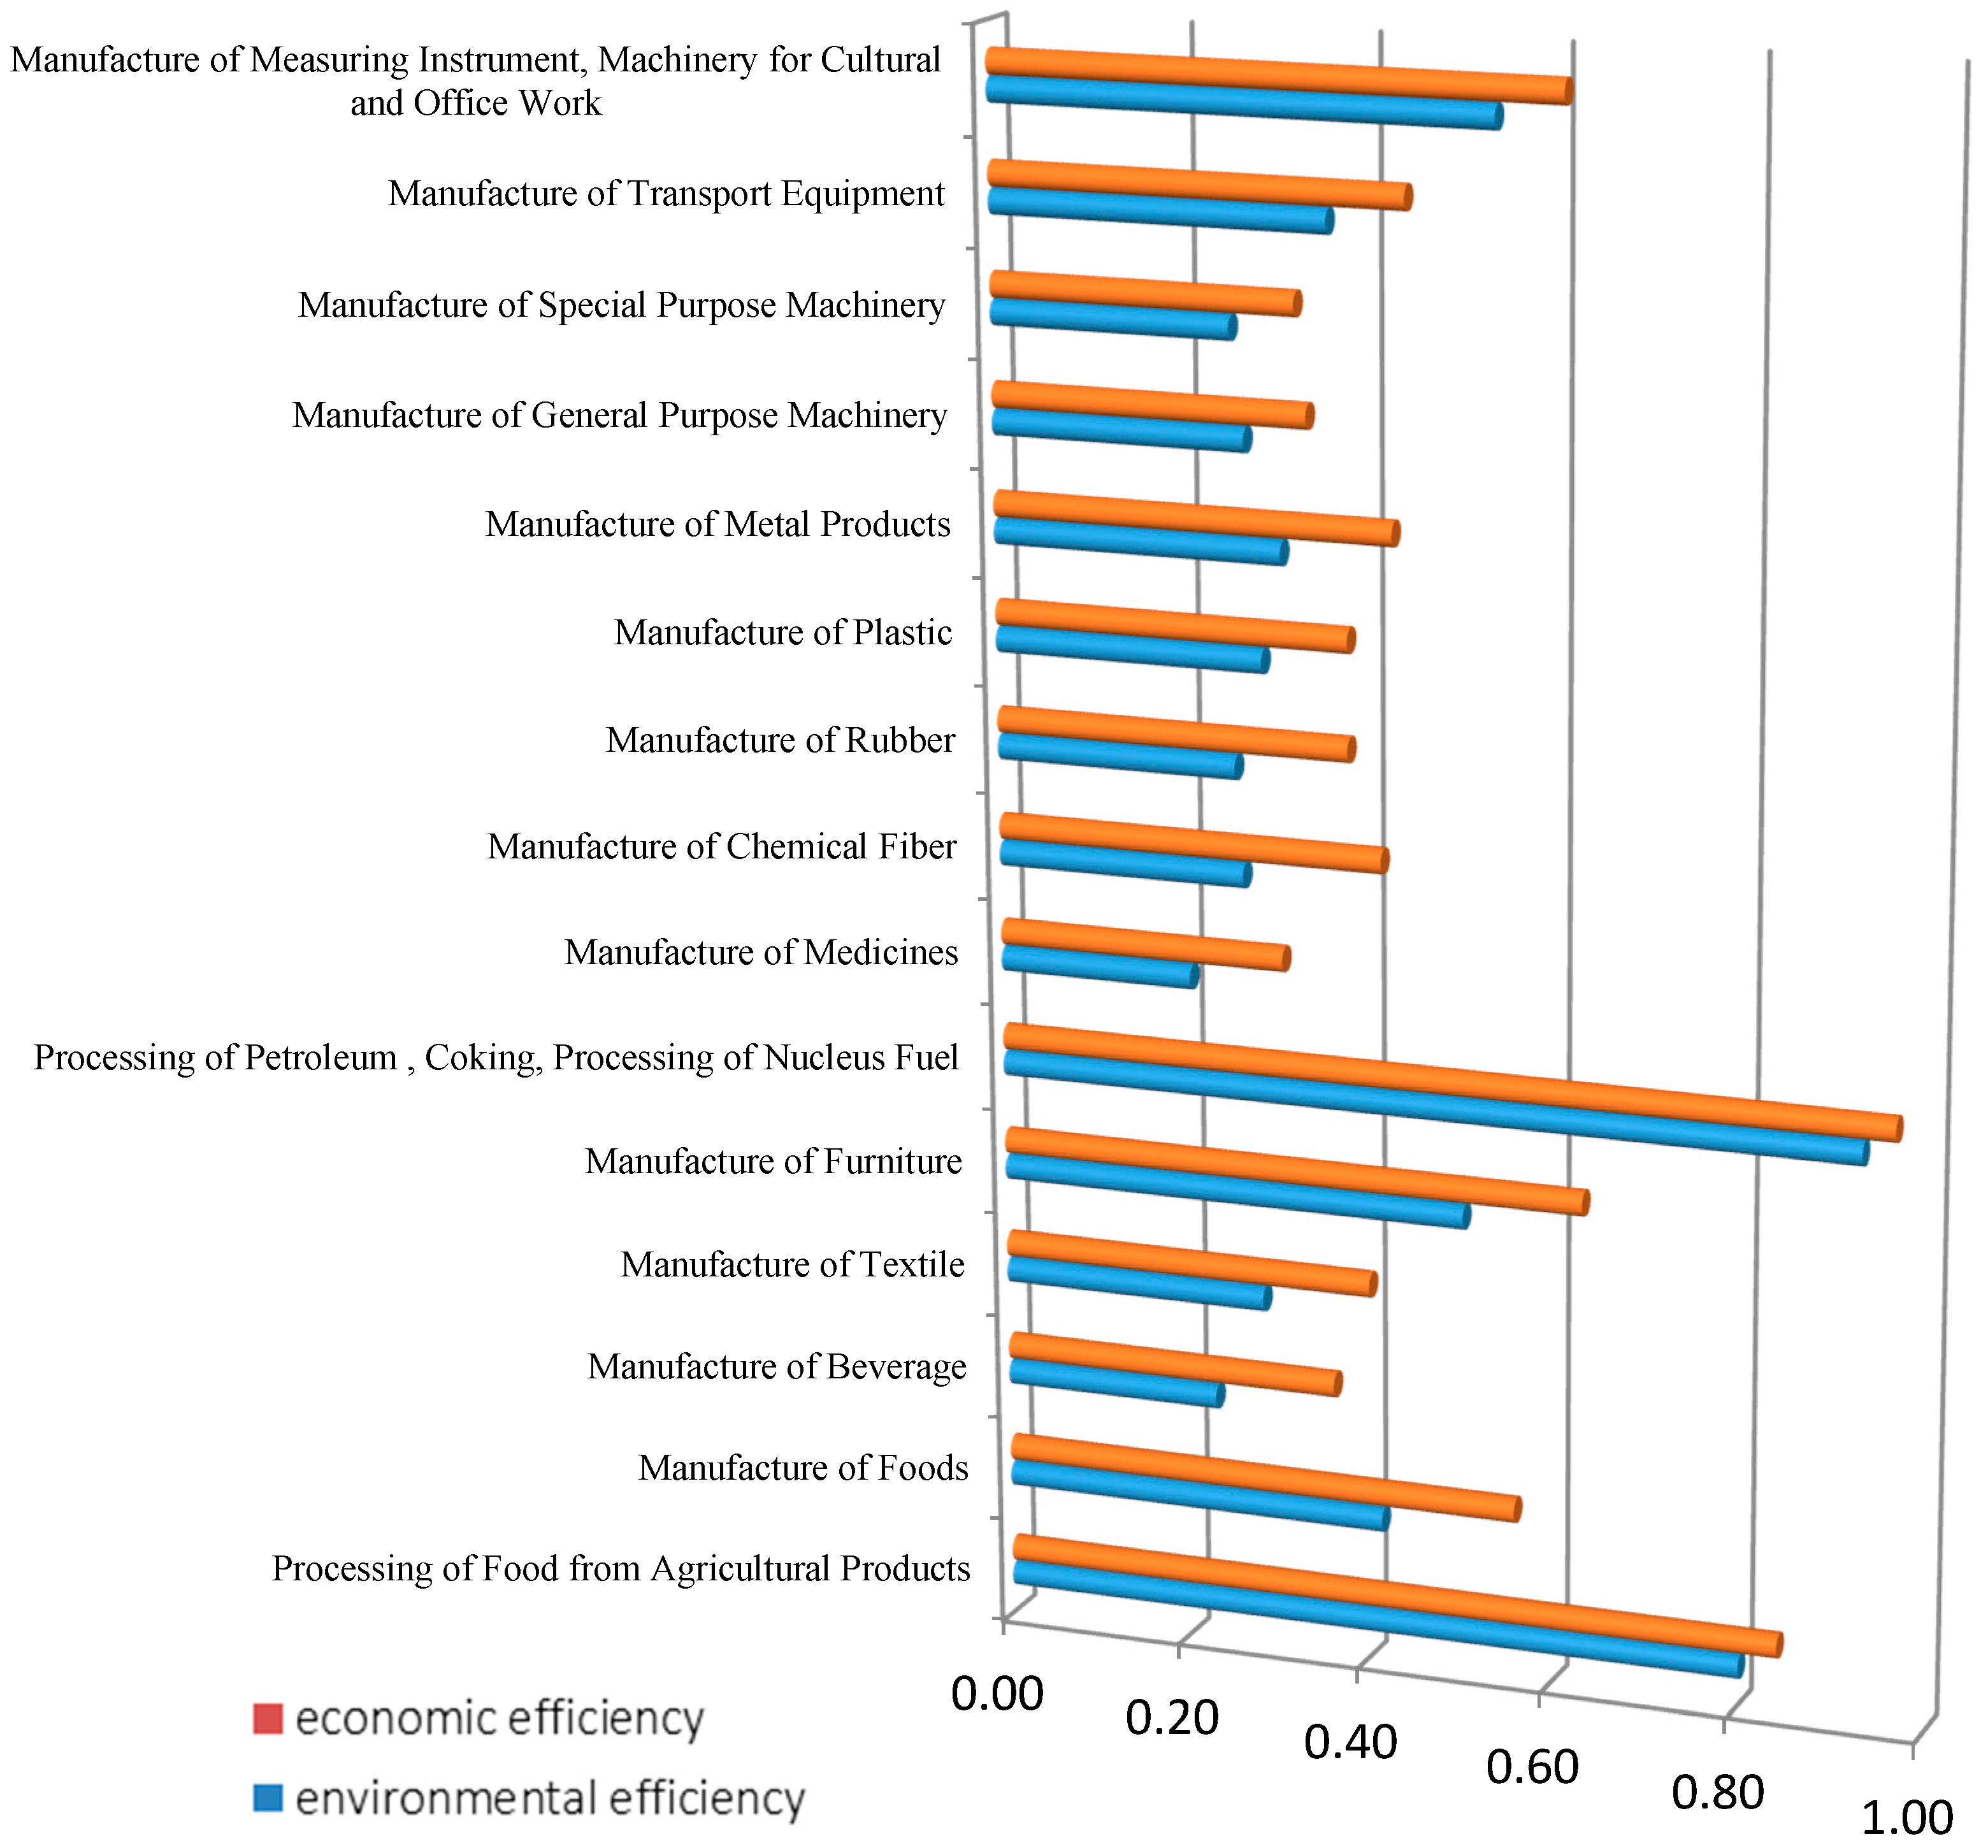
Figure 3.
Average economy efficiency and average environmental efficiency in lightly polluted industries.
Figure 3.
Average economy efficiency and average environmental efficiency in lightly polluted industries.
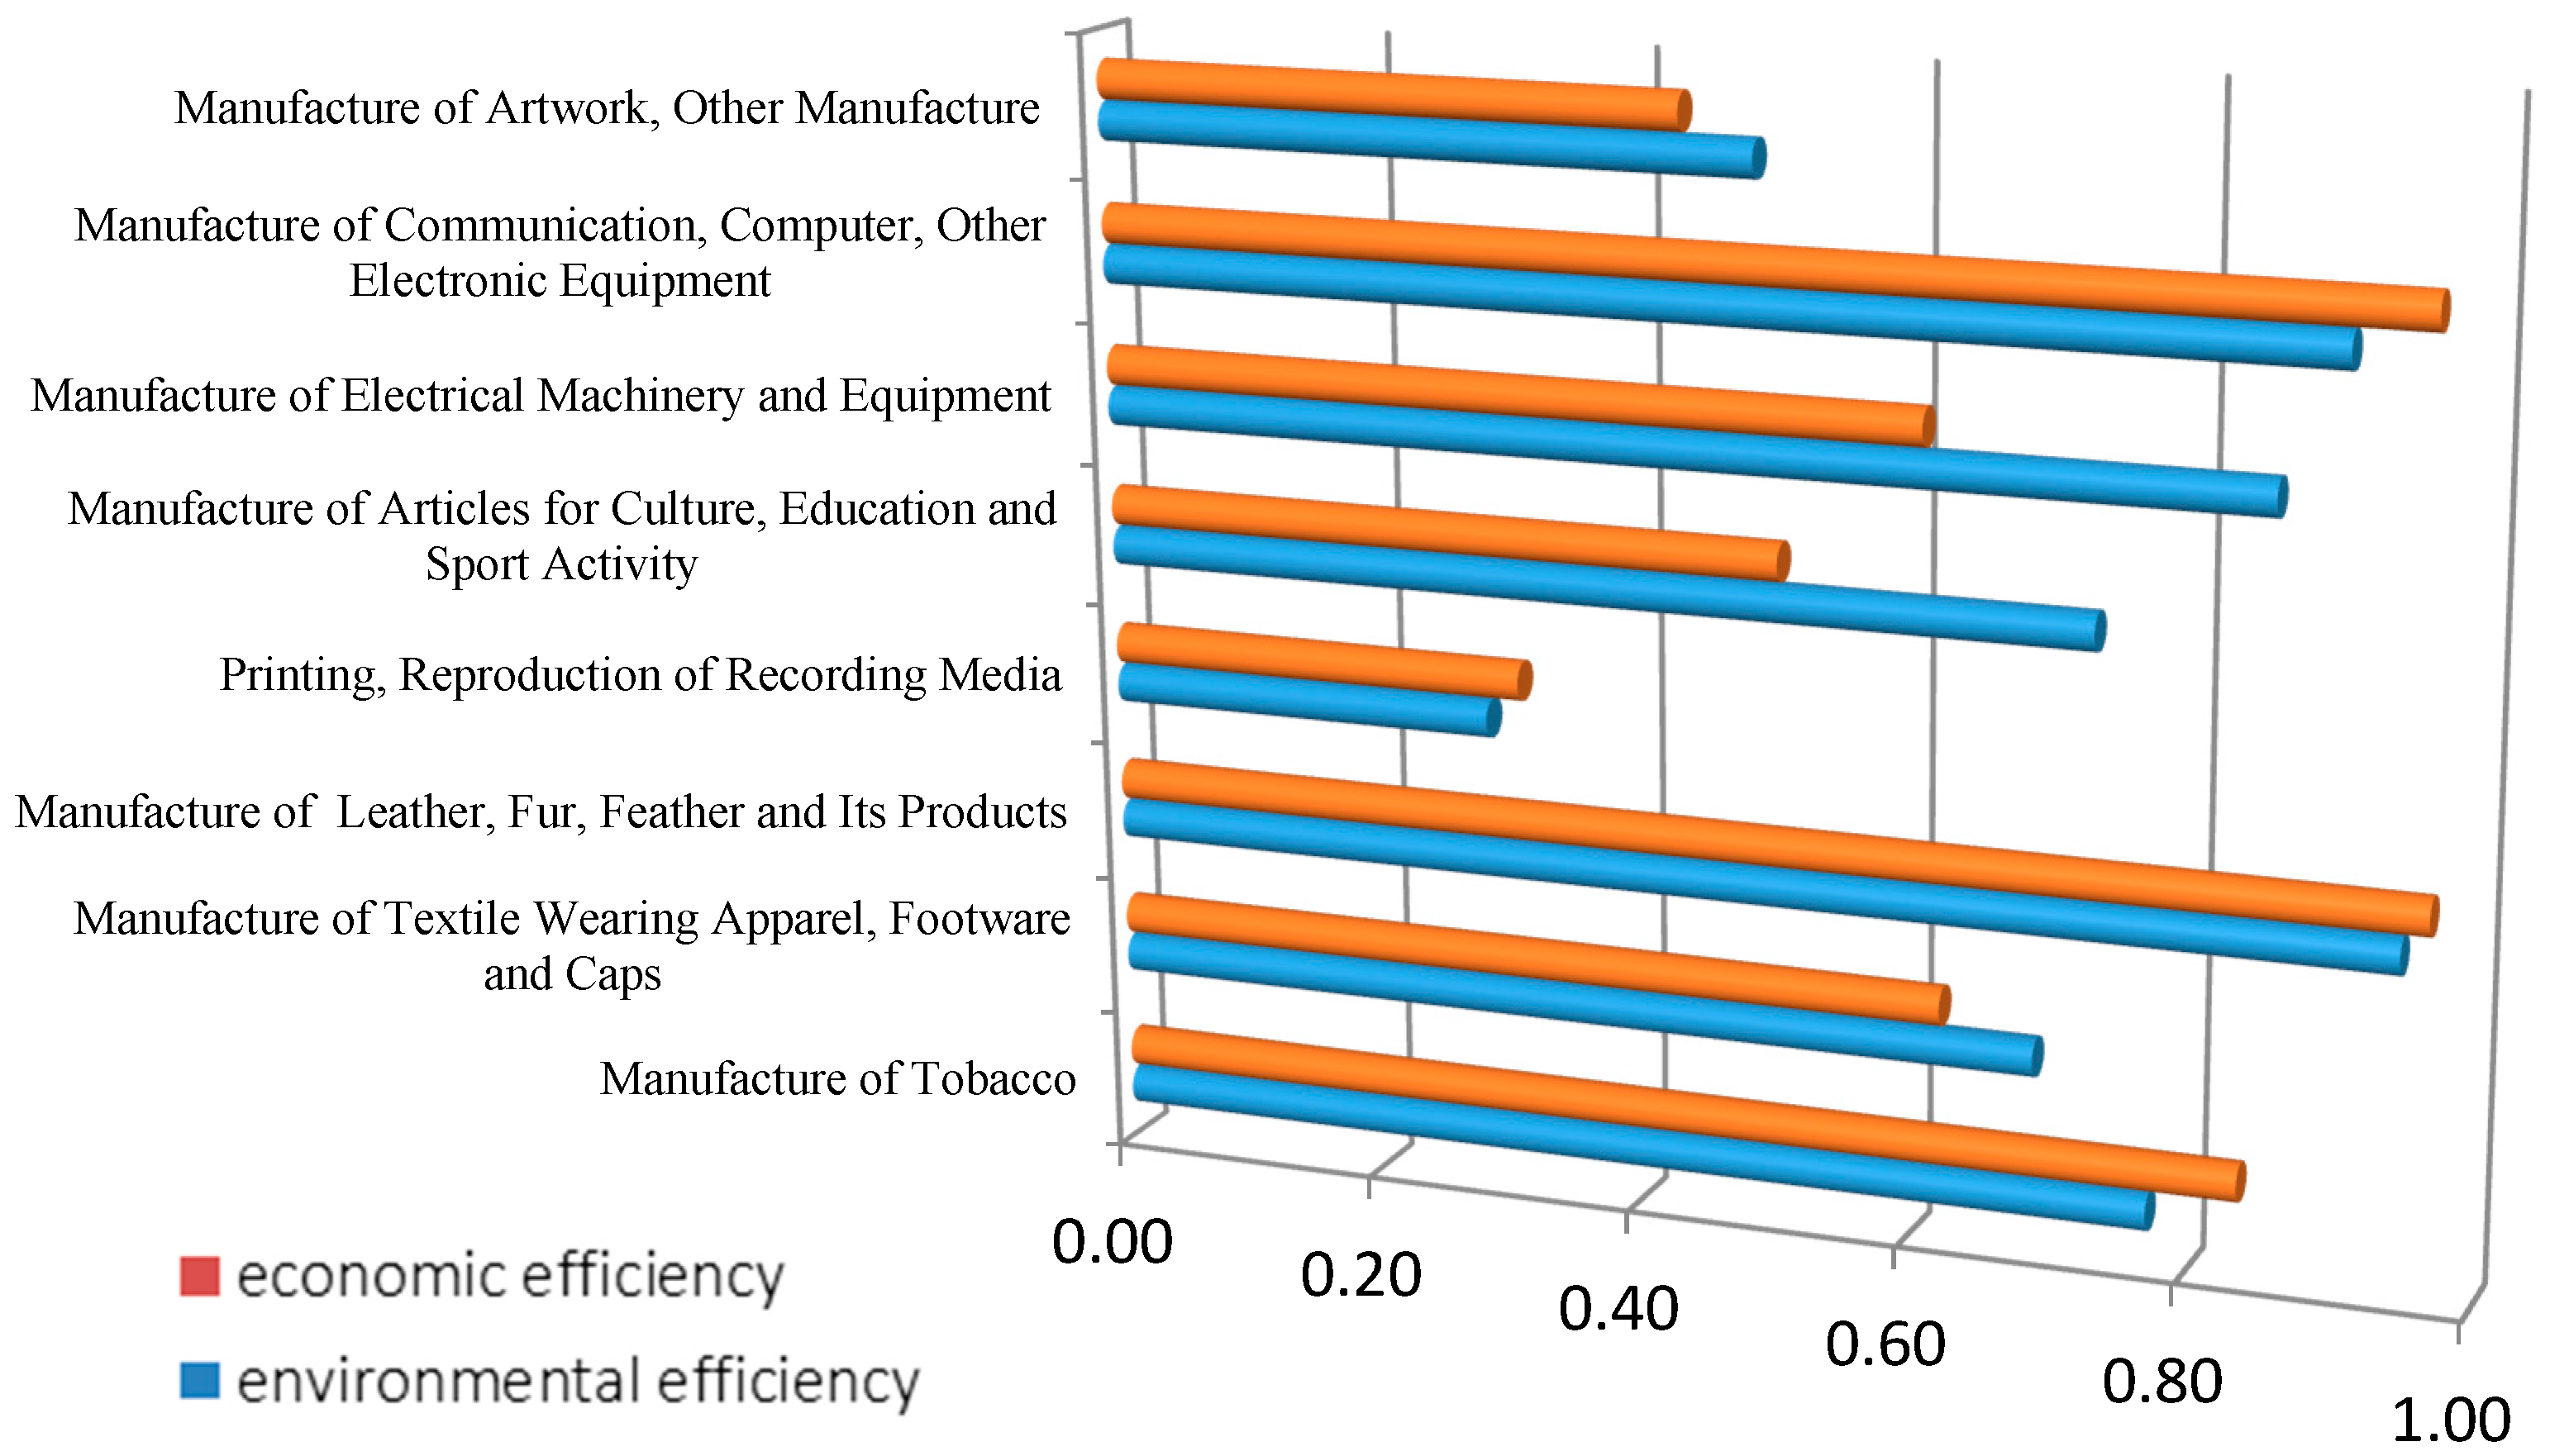
Figure 4.
Total average efficiency of manufacturing in China from 2006 to 2011.

| Standard | PIIq ≥ 0.1 | 0.01 ≤ PIIq < 0.1 | PIIq < 0.01 |
|---|---|---|---|
| Classification | Heavily polluted industries | Moderately polluted industries | Lightly polluted industries |
| Variables | Definition and Unit of Variable | Abbreviation | Hypothesis |
|---|---|---|---|
| Openness degree | Percentage of industrial export value (%) | EV | Positive |
| Industry scale | Percentage of industrial investment in fixed assets (%) | IFA | Positive |
| Energy structure | Percentage of industrial coal consumption (%) | CC | Negative |
| Technology development level | Percentage of industrial invention patents (%) | IP | Positive |
| Profitability | Ratio of total profits to revenue from principle business (%) | PTR | Positive |
| Classification | Industry | 2006 | 2007 | 2008 | 2009 | 2010 | 2011 |
|---|---|---|---|---|---|---|---|
| Heavily Polluted Industries | Processing of Timbers, Manufacture of Wood, Bamboo, Rattan, Palm, Straw | 0.21 | 0.23 | 0.24 | 0.29 | 0.36 | 0.41 |
| Manufacture of Paper and Paper Products | 0.16 | 0.18 | 0.18 | 0.17 | 0.18 | 0.18 | |
| Manufacture of Chemical Raw Material and Chemical Products | 0.18 | 0.19 | 0.20 | 0.19 | 0.21 | 0.24 | |
| Manufacture of Non-metallic Mineral Products | 0.13 | 0.15 | 0.15 | 0.15 | 0.17 | 0.18 | |
| Manufacture and Processing of Ferrous Metals | 0.19 | 0.21 | 0.25 | 0.22 | 0.24 | 0.26 | |
| Manufacture and Processing of Non-ferrous Metals | 0.24 | 0.26 | 0.24 | 0.21 | 0.24 | 0.29 | |
| Moderately Polluted Industries | Processing of Food from Agricultural Products | 0.55 | 0.61 | 0.89 | 0.83 | 0.93 | 1.00 |
| Manufacture of Foods | 0.31 | 0.35 | 0.43 | 0.40 | 0.43 | 0.58 | |
| Manufacture of Beverage | 0.20 | 0.21 | 0.22 | 0.24 | 0.24 | 0.29 | |
| Manufacture of Textile | 0.23 | 0.24 | 0.26 | 0.25 | 0.32 | 0.42 | |
| Manufacture of Furniture | 0.37 | 0.35 | 0.43 | 0.51 | 0.71 | 0.66 | |
| Processing of Petroleum, Coking, Processing of Nucleus Fuel | 1.00 | 0.93 | 0.91 | 0.72 | 1.00 | 1.00 | |
| Manufacture of Medicines | 0.17 | 0.19 | 0.21 | 0.22 | 0.23 | 0.24 | |
| Manufacture of Chemical Fiber | 0.24 | 0.28 | 0.25 | 0.22 | 0.26 | 0.36 | |
| Manufacture of Rubber | 0.21 | 0.23 | 0.23 | 0.26 | 0.30 | 0.33 | |
| Manufacture of Plastic | 0.23 | 0.26 | 0.26 | 0.28 | 0.31 | 0.40 | |
| Manufacture of Metal Products | 0.31 | 0.31 | 0.34 | 0.28 | 0.34 | 0.30 | |
| Manufacture of General Purpose Machinery | 0.24 | 0.26 | 0.25 | 0.24 | 0.26 | 0.38 | |
| Manufacture of Special Purpose Machinery | 0.23 | 0.27 | 0.32 | 0.21 | 0.26 | 0.27 | |
| Manufacture of Transport Equipment | 0.28 | 0.30 | 0.32 | 0.39 | 0.46 | 0.43 | |
| Manufacture of Measuring Instrument, Machinery for Cultural and Office Work | 0.48 | 0.50 | 0.46 | 0.38 | 0.42 | 1.00 | |
| Lightly Polluted Industries | Manufacture of Tobacco | 0.46 | 0.55 | 0.62 | 1.00 | 1.00 | 1.00 |
| Manufacture of Textile Wearing Apparel, Footware and Caps | 0.50 | 0.67 | 0.59 | 0.69 | 1.00 | 0.69 | |
| Manufacture of Leather, Fur, Feather and Its Products | 1.00 | 1.00 | 1.00 | 0.67 | 1.00 | 1.00 | |
| Printing, Reproduction of Recording Media | 0.40 | 0.28 | 0.27 | 0.25 | 0.28 | 0.24 | |
| Manufacture of Articles for Culture, Education and Sport Activity | 1.00 | 0.80 | 1.00 | 0.44 | 0.68 | 0.46 | |
| Manufacture of Electrical Machinery and Equipment | 0.74 | 0.83 | 0.81 | 0.80 | 1.00 | 0.94 | |
| Manufacture of Communication, Computer, Other Electronic Equipment | 0.93 | 1.00 | 1.00 | 0.79 | 0.68 | 1.00 | |
| Manufacture of Artwork, Other Manufacture | 0.26 | 0.37 | 0.52 | 0.55 | 0.67 | 0.56 |
| Classification | Industry | 2006 | 2007 | 2008 | 2009 | 2010 | 2011 |
|---|---|---|---|---|---|---|---|
| Heavily Polluted Industries | Processing of Timbers, Manufacture of Wood, Bamboo, Rattan, Palm, Straw | 0.34 | 0.38 | 0.38 | 0.44 | 0.51 | 0.60 |
| Manufacture of Paper and Paper Products | 0.27 | 0.30 | 0.29 | 0.28 | 0.30 | 0.31 | |
| Manufacture of Chemical Raw Material and Chemical Products | 0.26 | 0.28 | 0.30 | 0.29 | 0.34 | 0.38 | |
| Manufacture of Non-metallic Mineral Products | 0.21 | 0.24 | 0.24 | 0.25 | 0.27 | 0.30 | |
| Manufacture and Processing of Ferrous Metals | 0.29 | 0.32 | 0.38 | 0.34 | 0.37 | 0.42 | |
| Manufacture and Processing of Non-ferrous Metals | 0.38 | 0.41 | 0.39 | 0.35 | 0.40 | 0.46 | |
| Moderately Polluted Industries | Processing of Food from Agricultural Products | 0.63 | 0.71 | 0.88 | 0.87 | 0.97 | 1.00 |
| Manufacture of Foods | 0.44 | 0.48 | 0.58 | 0.58 | 0.61 | 0.67 | |
| Manufacture of Beverage | 0.32 | 0.34 | 0.34 | 0.37 | 0.38 | 0.43 | |
| Manufacture of Textile | 0.36 | 0.37 | 0.37 | 0.37 | 0.43 | 0.52 | |
| Manufacture of Furniture | 0.56 | 0.52 | 0.60 | 0.58 | 0.74 | 0.81 | |
| Processing of Petroleum , Coking, Processing of Nucleus Fuel | 1.00 | 0.98 | 0.93 | 0.87 | 1.00 | 1.00 | |
| Manufacture of Medicines | 0.25 | 0.28 | 0.31 | 0.32 | 0.33 | 0.36 | |
| Manufacture of Chemical Fiber | 0.39 | 0.43 | 0.40 | 0.37 | 0.41 | 0.51 | |
| Manufacture of Rubber | 0.33 | 0.34 | 0.34 | 0.38 | 0.41 | 0.50 | |
| Manufacture of Plastic | 0.33 | 0.39 | 0.37 | 0.37 | 0.39 | 0.44 | |
| Manufacture of Metal Products | 0.41 | 0.43 | 0.45 | 0.39 | 0.43 | 0.47 | |
| Manufacture of General Purpose Machinery | 0.32 | 0.33 | 0.34 | 0.32 | 0.35 | 0.37 | |
| Manufacture of Special Purpose Machinery | 0.30 | 0.30 | 0.32 | 0.32 | 0.35 | 0.37 | |
| Manufacture of Transport Equipment | 0.38 | 0.41 | 0.42 | 0.45 | 0.50 | 0.51 | |
| Manufacture of Measuring Instrument, Machinery for Cultural and Office Work | 0.69 | 0.72 | 0.66 | 0.52 | 0.54 | 0.54 | |
| Lightly Polluted Industries | Manufacture of Tobacco | 0.58 | 0.68 | 0.75 | 1.00 | 1.00 | 1.00 |
| Manufacture of Textile Wearing Apparel, Footware and Caps | 0.51 | 0.59 | 0.60 | 0.63 | 0.64 | 0.77 | |
| Manufacture of Leather, Fur, Feather and Its Products | 1.00 | 0.99 | 1.00 | 0.86 | 0.93 | 1.00 | |
| Printing, Reproduction of Recording Media | 0.32 | 0.30 | 0.31 | 0.31 | 0.31 | 0.33 | |
| Manufacture of Articles for Culture, Education and Sport Activity | 0.48 | 0.50 | 0.49 | 0.45 | 0.53 | 0.59 | |
| Manufacture of Electrical Machinery and Equipment | 0.53 | 0.62 | 0.65 | 0.60 | 0.62 | 0.62 | |
| Manufacture of Communication, Computer, Other Electronic Equipment | 0.97 | 1.00 | 1.00 | 0.90 | 0.89 | 1.00 | |
| Manufacture of Artwork, Other Manufacture | 0.33 | 0.37 | 0.43 | 0.42 | 0.48 | 0.57 |
| Variables | All | Lightly Polluted Industries | Moderately Polluted Industries | Heavily Polluted Industries | ||||
|---|---|---|---|---|---|---|---|---|
| Cons | 0.51 *** (16.69) | 0.56 *** (9.32) | 0.68 *** (12.03) | 0.66 *** (6.79) | 0.34 *** (9.85) | 0.36 *** (6.87) | 0.25 *** (15.07) | 0.27 *** (7.89) |
| EV | 1.52 *** (6.20) | 1.91 * (2.04) | 0.14 (0.40) | 0.54 (0.47) | −0.16 (−0.10) | 0.31 (0.20) | 2.37 ** (2.19) | 1.43 (1.13) |
| IFA | −3.59 *** (−4.70) | −3.60 *** (−4.07) | 4.60 ** (1.78) | 4.97 * (1.80) | 0.11 (0.09) | 1.65 (1.20) | −0.78 *** (−2.02) | −1.28 ** (−2.49) |
| CC | 0.56 * (1.81) | 0.39 (1.18) | −49.99 * (−1.84) | −51.10 * (−1.87) | 2.35 *** (7.29) | 2.15 *** (6.59) | −0.22 (−1.48) | −0.14 (−0.90) |
| IP | −0.52 (−0.55) | −0.44 (−0.36) | −2.70 ** (−2.24) | 1.19 (1.33) | ||||
| PTR | −0.80 (−1.14) | 0.20 (0.21) | −0.34 (−0.57) | −0.28 (−0.68) | ||||
| N | 174 | 174 | 48 | 48 | 90 | 90 | 36 | 36 |
| Group | 29 | 29 | 8 | 8 | 15 | 15 | 6 | 6 |
Notes: T-statistics given in parentheses. Values given out of parentheses in a cell show the estimated parameters . * indicates significance at the 10% level; ** indicates significance at 5% the level; *** indicates significance at the 1% level. A positive value indicates that the independent variable is positive correlated with the dependent variable . A negative value indicates that the independent variable is negative correlated with the dependent variable. Cons indicate the estimated parameters . EV, IFA, CC, IP, and PTR are abbreviations of the independent variables which is mentioned in Table 2.
© 2016 by the authors; licensee MDPI, Basel, Switzerland. This article is an open access article distributed under the terms and conditions of the Creative Commons Attribution (CC-BY) license (http://creativecommons.org/licenses/by/4.0/).
Share and Cite
MDPI and ACS Style
Wang, X.; Han, L.; Yin, L. Environmental Efficiency and Its Determinants for Manufacturing in China. Sustainability 2017, 9, 47. https://doi.org/10.3390/su9010047
AMA Style
Wang X, Han L, Yin L. Environmental Efficiency and Its Determinants for Manufacturing in China. Sustainability. 2017; 9(1):47. https://doi.org/10.3390/su9010047
Chicago/Turabian StyleWang, Xu, Liyan Han, and Libo Yin. 2017. "Environmental Efficiency and Its Determinants for Manufacturing in China" Sustainability 9, no. 1: 47. https://doi.org/10.3390/su9010047
Note that from the first issue of 2016, this journal uses article numbers instead of page numbers. See further details here.