1. Introduction
Since the Kyoto protocol came to effect in 2005, both developed countries and developing countries around the world have made much effort to reduce greenhouse gas emissions. In 2005, the European Union (EU) member states established a carbon emissions trading system and began carbon quotas trading. So far, the European Union Emissions Trading System (EUETS) has become the world’s largest carbon emissions trading market, playing an exemplary role for other countries. It is also well known that China has been the top carbon emitter in the world since 2008 [
1], therefore, China has promised to shoulder more reduction responsibility in the future. In 2009, China promised to reduce its carbon intensity by 40%–45% in 2020 based on the level of 2005 at the Copenhagen climate conference [
2]. Moreover, at the Paris climate conference in 2015, China once again made a commitment to reduce carbon intensity by 60%–65% in 2030 based on the level of 2005 [
3]. At the 22nd Conference of the Parties to the United Nations Framework Convention on Climate Change (UNFCCC) in 2016, the Chinese government claimed that it will actively implement the commitments to the Paris Agreement [
4].
To reach the reduction target, the Chinese government is taking effective measures to reduce emissions. In early 2013, China launched carbon emission trading in seven pilots. After three years of pilot phase, the Chinese government has accumulated much experience in carbon markets [
5]. Based on the experience of EUETS and China’s seven pilots, China’s National Development and Reform Commission (NDRC) claims that China will establish a unified national level carbon emission trading market in 2017. By then, it is expected this market will become the largest carbon emission trading market in the world. Moreover, China has made efforts to enhance energy efficiency and develop clean energy to reach the reduction target [
6].
Many studies have addressed the burden sharing problem for carbon emissions reduction. For China, many researches have studied the allocation of carbon emissions among provinces or regions [
7,
8]. In a unified carbon market, the allocation of carbon emission quotas is the most important issue [
9]. The responsibility sharing of carbon emission reduction should be discussed at different levels [
10], which include region level, industry level and firm level. In recent years, researches in sector-based approaches to reduction are increasing [
11,
12,
13]. Reasonable allocation of carbon emissions reduction among different industrial sectors is of great significance [
11]. A clear carbon intensity reduction target should be set among different industrial sectors [
14].
In this paper, we study how to allocate the carbon intensity reduction burdens among 35 industrial sectors according to three indicators based on equity and efficiency principle. We also study the access order of the carbon market covering other industries in the future. In the start-up phase, China’s unified carbon market will cover eight industrial sectors, petrochemical, chemical, building materials, steel, nonferrous metals, paper, electric power and aviation, which are all high-emission industrial sectors, accounting for 40%–50% of China’s carbon emissions [
15]. Thus, the total amount of the eight industrial sectors’ carbon quotas should be calculated and controlled by the government.
The rest of the paper is organized as follows.
Section 2 presents a brief overview of related literature.
Section 3 introduces the indicator selection and methodologies.
Section 4 puts forward the results.
Section 5 presents the discussions. Conclusions and policy implications are given in
Section 6.
2. Literature Review
Many scholars have studied the allocation of carbon emission among different regions. The first category focuses on the allocation among different countries. den Elzen and Höhne [
16] discuss the reduction burdens allocation between Annex I and non-Annex I countries under the Kyoto protocol for 2020 and 2050. Person et al. [
17] use an energy-economy systems model to assess the economic impacts on developing regions following a global cap and trade system for carbon dioxide and put forward an allocation method based on equal per capita or contraction and convergence for developing countries. Böhringer and Lange [
18] propose two kinds of allocation rules for dynamic grandfathering schemes with concretions to an open or a closed trading system in EUETS. Marklund and Samakovlis [
19] discuss how to redistribute the reduction target among the member states in EUETS. Their conclusion resulted in a differentiation of the EU greenhouse gases (GHGs) emission reduction target, where half of the member states reduce their emissions while the rest stabilize, or even are allowed to increase emissions. The second category focuses on the allocation among different provinces in China. Yi et al. [
2] study the issue of how to allocate carbon intensity reduction targets among provinces of China to meet the national reduction target. They construct an allocation model based on three indicators and give the indicators different weights, analyzing the results using cluster analysis. Some researchers allocate the carbon emission quotas among regions in China in light of the collaborations. They use Shapley value method to define the value of regional emission reduction connection and find that the Central region has the largest radiation effect on others among all regions [
14]. Wang et al. [
20] allocate the emission allowance among China’s 30 administrative regions based on zero sum gains data envelopment analysis model to realize national reduction target by 2020. They propose an efficient emission allowance allocation scheme on provincial level and give several scenarios of China’s regional economy, emission, energy consumption in the future.
When allocating the carbon emissions, three major principles are used. The first category is based on the principle of equity. Ringius et al. [
21] say that burden sharing rule is compatible with the three principles of responsibility, capacity, and need. They allocate carbon emission allowance based on three different but complementary notions of distributive fairness: equality, equity and exemption. Ding et al. [
22] regard cumulative emissions per capita as the indicator of equity principle and allocate carbon allowance among different countries based on the standard of fairness and justice. It seems that using accumulative per capita emission instead of national accumulative emissions is more equitable for developing countries. He et al. [
23] also prefer to use accumulative emission per capita as the indicator of equity principle for carbon allowance allocation. Miketa and Schrattenholzer [
24] carry out a quantitative emission entitlements allocation study based on three major equity principles, which are egalitarian equity, horizontal equity, and proportional equality. Yi et al. [
2] develop a comprehensive index based on three indicators of per capita GDP, accumulated carbon emissions and energy consumption per unit of industrial added value for reduction capacity, reduction responsibility and reduction potential, respectively. These three indicators reflect the vertical equity principle, historical egalitarian equity principle and polluter pays equity principle, respectively. The second category is based on the principle of efficiency. Choi et al. [
25] employ a non-radial slacks-based data envelopment analysis (DEA) model for estimating the potential reductions and efficiency of carbon emissions for China. Then they use this model to estimate the marginal abatement costs of carbon emissions. Wang et al. [
26] establish several efficiency models to estimate the environmental efficiency, economic efficiency, economic environmental efficiency of different provinces in China by considering carbon dioxide emissions. They find that half of the provinces are in the status of high incoordination between environment and economic efficiency. The third category is based on the principle of both equity and efficiency. Wei et al. [
7] discuss which provinces will be allocated more of a carbon dioxide reduction burden in China using an extended Slacks-Based Measure (SBM) model. They construct an emission abatement capacity index which is based on weighted equity and efficiency indexes.
When allocating the carbon quotas to the covered firms, two major approaches of allocation are adopted: free allocation and auction. Within a free allocation, there are two acceptable ways to allocate carbon quotas: (i) grandfathering, carbon quotas based on the historical emissions; and (ii) benchmarking, carbon quotas based on product output [
27]. The EUETS has been implemented in three separate phases. The carbon emission quotas were predominantly allocated for free in the first two phases. In the third phase, the majority of the quotas are sold by auction [
28]. Oestreich and Tsiakas [
29] find that there is a large and statistically significant carbon premium in stock returns, which is primarily driven by the free allocation of carbon quotas. Therefore, the Chinese government should allocate the carbon quotas for free in the first phase to reduce the firms’ resistance and emission reduction cost [
30].
However, China should also learn lessons from EUETS. In the first two phases, the carbon quotas were allocated to the Member states, who have the authority to allocate the quotas to the firms [
31]. In the third phase, the EUETS cancels off the allocation power of each country, and directly allocate the carbon quotas to the firms of each covered industry, mostly by means of auction [
32]. This is because every Member state hopes to protect their own firms and declare too many carbon quotas during the first two phases. This is the main reason of the low price of carbon quota [
28]. Moreover, this has led to the different emission benchmark of the same industry in different countries [
33]. Therefore, due to the limitations of allocation among regions, researches in sector-based approaches to carbon emissions reduction are increasing. Cai et al. [
34] assess the carbon emission mitigation opportunities in China’s five sectors. Wang and Liang [
35] identify China’s twelve key economic sectors and investigate contributing factors in carbon emissions reduction. Chen and He [
11] study the inter-sectoral burden sharing of carbon emission reduction in China in 2020. Xia and Chen [
36] allocate the reduction burden of China’s energy intensity from both sectoral and regional perspectives, finding that the sector-based reduction methods could lower costs. The allocation of carbon emissions among the industries can help to set up different emission reduction targets for each industrial sector. This will also assign the allocation authority to the central government and be conducive to the regulation of the carbon market. Thus, it is an important issue to be studied, and it is also meaningful because different industrial sectors will be included in China’s unified carbon market gradually.
To sum up, previous literature provides important foundation for this paper, but there are still some problems to be solved. First, some studies focus on the allocation among regions or industrial sectors, but the authors do not set a clear carbon intensity reduction target among 35 industrial sectors in China. It is an important aspect worthy of further studying because the government should control the total amount of carbon emissions of each industrial sector and allocate the carbon quotas rationally. Second, many scholars use equity principle to allocate the carbon emission quotas. However, few studies solve this problem based on both equity and efficiency principles. Third, many scholars construct the reduction comprehensive index with some indicators, whose weights are given by subjective experience of researchers, lacking an objective weights.
Based on the limitations of existing studies, this paper mainly makes three contributions. First, we quantitatively study how to allocate the carbon intensity reduction burdens among 35 industrial sectors in China. Second, we ensure a fair and efficient allocation by considering both equity and efficiency principles. Third, we construct a clear and comprehensive reduction index with objective weights based on the entropy method.
3. Indicator Selection and Methodologies
3.1. Indicator Selection
Under the definition of equity principle [
37] and efficiency principle [
5,
38,
39], we try to construct a comprehensive index to take both equity principle and efficiency principle into consideration. Then we use the comprehensive reduction index to analyze how to allocate CO
2 intensity reduction burdens among different industrial sectors. The comprehensive index consists of per capita industrial added value, historical accumulated CO
2 emission and carbon intensity as indicators for emission reduction capacity, responsibility and potential, respectively. Ringius et al. [
37] briefly review the principles of equity. We select two equity indicators to quantify the reduction burdens among different industries. The indicator of per capita industrial added value is for the dimension of reduction capacity, reflecting the vertical equity. The indicator of historical accumulated CO
2 emission is for the dimension of reduction responsibility, which means all the industries have the equal rights to use atmospheric resources among generations. Kaya and Yokobori [
38] first propose the concept of carbon emission efficiency, and define carbon emission efficiency as CO
2 emission divided by nominal GDP. Sun [
39] considers carbon intensity as an efficiency indicator to evaluate a country’s energy saving and emission reduction. Zhang et al. [
5] use carbon intensity as an efficiency indicator to allocate carbon quotas. It should be noted that the carbon emission efficiency has an opposite relationship with carbon intensity. If an industrial sector has a high carbon intensity, it means its emission efficiency is low. In addition, the indicator of carbon intensity is for the dimension of reduction potential, which means one industry with high carbon intensity has more room to increase the emission reduction efforts and to increase carbon emission efficiency. Thus, the assumptions of our model are as follows:
(1) Emission reduction capacity
It has a significant meaning by using per capita industrial added value as the indicator to quantify emission reduction capacity, because per capita industrial added value represents the economic strength and development level of the industry. One industry will have strong power to pay for the costs of emission reduction if it has a high per capita industrial added value.
In this study, we use industrial added value instead of industrial output value. This is because the industrial added value is equal to the output value minus the middle input, which can reflect the created value of an industry and avoid repeated calculation.
Many scholars prefer to use per capita GDP instead of GDP to measure the economic strength of a region and to quantify emission reduction capacity [
2,
5,
14]. This is because the concept of per capita is more able to reflect people’s willingness and the economic level to reduction. Similarly for the industry, labor remuneration and operating surplus are two important parts of industrial added value. Any abatement costs will affect the managers’ income and the employees’ remuneration. If two industrial sectors have the same amount of industrial added value, the industrial sector with fewer employees will have stronger ability and willingness to reduce emissions.
(2) Emission reduction responsibility
We choose historical accumulated CO2 emission as the indicator to quantify emission reduction responsibility, which reflects the historical egalitarian principle. Since GHGs can stay in the atmosphere for a long time, we should use historical accumulated CO2 instead of emission of just one year. Industries with higher historical accumulated CO2 emission should bear more reduction burden.
In order to ensure a more accurate calculation, we calculate 35 industrial sectors’ 18 species of energy consumption from 1996 to 2012. According to the CO
2 calculation method by Intergovernmental Panel on Climate Change [
40], we precisely calculate the CO
2 emissions of the 35 industrial sectors from 1996 to 2012 [
41].
(3) Emission reduction potential
Carbon intensity, which is selected as the indicator of emission reduction potential, refers to the CO
2 emission per unit of industrial added value. We use per value added instead of per output value to define carbon intensity of an industrial sector. This is because we want to analyze the carbon emission in the process of industrial value creation. This definition of carbon intensity is usually used in the literature [
11,
42,
43].
Carbon intensity is used as the indicator of reduction potential in many studies [
5,
11,
14]. China’s industrial sector proves carbon-intensive overall and its carbon emissions are almost 10 times larger than those of the service sector up to now. Each industrial sector has emitted a large amount of carbon emissions during the industrialization process, and thus there is much carbon emission reduction potential in the industrial sector. Therefore, carbon emission reduction potential is represented by carbon emissions per unit of industrial value added in this paper [
14]. A sector’s carbon intensity is primarily determined by the sector’s energy consumption and energy structure. The bigger a sector’s carbon intensity, the lower its emissions efficiency is, and the larger the reduction burden it should bear [
11].
Many of China’s industrial sectors have high carbon intensity because of unreasonable energy structure and low level of emission reduction technology. Industrial sectors with higher carbon intensity can reduce the carbon intensity relying on increasing reduction capital investment and rationalizing energy structure. Thus, the higher carbon intensity an industrial sector has, the more reduction room there will be, which reflects the carbon emission efficiency principle.
We summarize the contents of the above, the indicators and principles are shown in
Table 1.
3.2. The Construction of Emission Reduction Comprehensive Index
The comprehensive index of emission reduction
, is constructed based on the three indicators of per capita industrial added value, historical accumulated CO
2 emission and carbon intensity. Some researchers have selected some other indicators to construct a comprehensive index in the study of interregional carbon emission allocation [
2]. The index represents a comprehensive evaluation of an industrial sector’s reduction burden in the future. The higher the index is, the more reduction burden an industrial sector need to shoulder. The index of
is calculated by the following formula:
where
is the comprehensive index for
is the proportion of per capita industrial added value of
industrial sector to the sum of the per capita industrial added value of 35 industrial sectors;
Bi is the proportion of historical accumulated CO
2 emission of
i industrial sector to the sum of historical accumulated CO
2 emission of 35 industrial sectors; and
Ci is the proportion of carbon intensity of
i industrial sector to the sum of carbon intensity of 35 industrial sectors.
w1,
w2,
w3 are the weights for the three indicators, the sum of which equals one.
3.3. Determine the Weights of the Three Indicators
3.3.1. Equal Weights of the Three Indicators
In this study, we give an objective weight to allocate the carbon quotas more accurately. Thus, we adopt the entropy method to determine the weights. However, in order to make a contrast with this method, we also give an equally weighted system, in which the weights of the indicators are all .
3.3.2. The Entropy Method to Determine the Weights
Entropy method is a kind of objective weighting method. According to information theory, the information entropy is defined as the uncertainty measure of random variables. The higher order degree of a system is, the smaller the entropy is; on the contrary, the higher disorder degree of a system is, the larger the entropy is. Therefore, we can examine the disorder degree of the indicators based on the concept of entropy. The larger disorder degree of an indicator is, the larger influence it may have on the comprehensive evaluation, and thus it should be given more weight [
14,
44,
45]. The advantage of entropy method is that it can calculate more accurate and more objective weights than the subjective evaluation method. The entropy method can be used in conjunction with other methods. The disadvantage is that the entropy method is only used in the determination of weight so far [
46].
Entropy method is frequently used in management science to determine the weights. It makes use of the inhomogeneity of data itself to reflect the importance of indicators [
47]. Wang and Lee [
46] adopt the information entropy concept to confirm the weight of evaluating attribute based on Shannon’s entropy theory. Sun et al. [
45] introduce the information entropy method into the basin level waste water permits allocation. Zhang et al. [
14] combine the entropy method with the Shapley value method to allocate the carbon quotas in China. Sun et al. [
48] adopt the entropy weighted method to evaluate the impact of green technology innovation on ecological-economic efficiency of strategic emerging industries.
Thus, in this study, we can calculate the entropy of the three indicators for carbon emission reduction capability, responsibility and potential, respectively. Then we can determine the final weights of these three indicators accurately. First, we develop the decision making matrix
of the three indicators for China’s 35 industrial sectors.
where
represents the value of indicator
for industry sector
(
= 1, 2, 3,…, 35;
= 1, 2, 3). Then, we conduct a normalization operation as follows:
As a result, the standardized decision making matrix
of the three indicators is as follows:
denotes the entropy of indicator
in the standardized decision making matrix.
is defined as Equation (5)
where
,
, denotes the 35 industrial sectors.
The dispersity of evaluation value of indicator
can be represented [
46]:
If
is more dispersed,
is bigger, indicator
is more important. If
is relatively concentrated, indicator
is less important. If all
are equal and the distribution is absolutely concentrated, indicator
is invalid. Thus, when there is no subjective preference for indicator
, its weight factor is obtained as Equation (6) [
48].
where
,
.
Thus, we can calculate the final weights of the three indicators, which are reduction capacity, reduction responsibility and reduction potential. Then we will establish an allocation model based on equity and efficiency principle.
3.4. Inter-Industrial Allocation of China’s 2020 Intensity Reduction Target
In 2009, the Chinese government has committed to decrease its carbon intensity by 40%–45% in 2020 based on the level of 2005. According to the China Statistical Yearbook, the national economy is composed of primary sector, secondary sector and the tertiary sector. The primary sector comprises agriculture (farming, fishery, forestry, animal husbandry, and water conservation). The secondary sector includes industry and construction, with industry divided into three parts: manufacturing, mining, and electric power, gas and water production and supply. The tertiary sector includes business (wholesale, retail trade and hotel, restaurants), transport (transport, storage and post), and other services (other tertiary sectors) [
11].
The secondary sector consists of 35 sub-sectors, which are shown in
Table 2. Since the secondary sector industry in China has the largest CO
2 emission and the largest carbon intensity, the 35 industrial sectors must reach the intensity reduction target [
11]. In this study, we select 45% intensity reduction as the example target.
I2020 is the carbon intensity of the secondary sector in 2020, I2005 is the carbon intensity of the secondary sector in 2005, and is the residual coefficient. equals 1 minus the intensity reduction target. If the secondary sector’s intensity reduction target is 45%, the value of is 0.55, which means that the carbon intensity in 2020 is 0.55 times that of 2005.
As for each industrial sector, the further relationships can be expressed as follows:
where
represents the 35 industrial sectors.
is the carbon intensity of
industrial sector in 2020;
is the carbon intensity of
industrial sector in 2005.
is the residual coefficient for each industrial sector, which means the carbon intensity in 2020 is the number of times that of 2005. Thus, a larger value of
means a smaller reduction burden and a smaller reduction comprehensive index. That is, when the value of
increases, the value of
will become smaller.
In other words, the larger the index
is, the greater the carbon intensity reduction burden the industrial sector might take, and the smaller
will be.
In Equation (9), this negative relationship between
and
is described. Why do we use a natural logarithm form to describe this relationship? This is because when
increases, the marginal abatement cost increases, so the cost of cutting one more unit of emission rises. It is not a linear relationship between
and abatement costs. It is also not a linear relationship between
and the reduction burden. The marginal reduction burden should be decreased when the
increases. The greater the reduction burden is, the smaller
will be. Therefore, the larger
is, the smaller
will be. Thus, we use a natural logarithm form to describe this relationship, which is used in some studies [
2,
49,
50].
is the coefficient which will be calculated at last [
2].
The total CO
2 emission of China’s industrial sectors in 2020 can be expressed as Equations (10) and (11).
is the total CO
2 emissions of China’s secondary sector in 2020.
is the industrial added value of China’s secondary sector in 2020.
is the industrial added value of each industrial sector in 2020.
and
are predictive values. In addition, we find that the industrial added value growth of each industrial sector are not the same. If we use the average annual growth rate of 7% to predict the values will cause large errors, so we adopt ARIMA forecasting method to predict the values [
51,
52]. From Equations (7)–(11), we obtain the mathematical expressions of parameter
as follows:
According to Equation (9), we can get the residual coefficient of . is the carbon intensity reduction burden of each industrial sector.
3.5. Data Source and Processing
The data set in this study consists of per capita industrial added value, historical accumulated CO2 emission and carbon intensity of each industrial sector.
● (a) Per capita industrial added value
We use industrial added value divided by the number of industrial employees to calculate per capita industrial added value of each year. The industrial added value data (1996–2007) are collected from Chinese Statistical Yearbook [
53]. However, since these data are only counted to year 2007, the industrial added value data from 2008 to 2012 is calculated using the officially released annual average growth rate of added values [
54]. All of the industrial added value data from 1996 to 2012 are converted into 1995 constant price (RMB). The data of industrial employees’ number is collected from
Wind database. Thus, the final per capita industrial added value of each industrial sector is obtained through accumulated industrial added value divided by accumulated numbers of industrial employees from 1996 to 2012.
● (b) Historical accumulated CO2 emission
To calculate the annual CO
2 emission of each industrial sector from 1996 to 2012 accurately, we collected 18 types of energy sources consumption from Chinese Energy Statistical Yearbook [
41]. Eighteen types of fuels were considered in this study, including raw coal, cleaned coal, washed coal, coke, coke oven gas, other gas, other coking products, crude oil, gasoline, kerosene, diesel oil, fuel oil, LPG, refinery gas, natural gas, other petroleum, heat, and electricity. CO
2 emissions come from our calculations based on the energy consumption and emission coefficients which are collected from the Intergovernmental Panel on Climate Change [
40]. The historical accumulated CO
2 emission of each industrial sector is the summation of its seventeen years’ emission from 1996 to 2012.
● (c) Carbon intensity
The carbon intensity of each industrial sector is obtained through accumulated CO2 emission divided by accumulated industrial added value from 1996 to 2012.
4. Results
4.1. The Accurate Calculation Results of the Three Indicators
According to the data and processing methods, we calculate the values of three indicators in 35 industrial sectors in China. We present the results in
Table 2.
In the remainder of this paper, we will use the sector code of each industrial sector to replace their names. Of these 35 industrial sectors, S1, S2, S6, S7, S17, S25, S27, and S31 will be covered in the unified carbon market in the start-up phase.
4.2. The Weights Based on Entropy Method
We calculate the weights of carbon reduction capacity, responsibility and potential based on Equations (2)–(6). The calculation result is
,
, and
, respectively. Meanwhile, we set up a scheme of equal weights for comparison. The calculation results are shown in
Table 3.
We can find that the weight of reduction responsibility is higher when the weights are determined by entropy method, which means that an industrial sector with more historical accumulated emissions may shoulder more intensity reduction burden. The weight of reduction potential, which is the efficiency indicator, is 0.37. It is a little smaller than the weight of reduction responsibility, which means the carbon intensity of each industrial sector will also affect the allocation results, to a certain extent. The weight of reduction capacity is the smallest, which means the per capita industrial added value may not play a major role in the allocation model.
4.3. The Allocation Results Based on Equal Weights
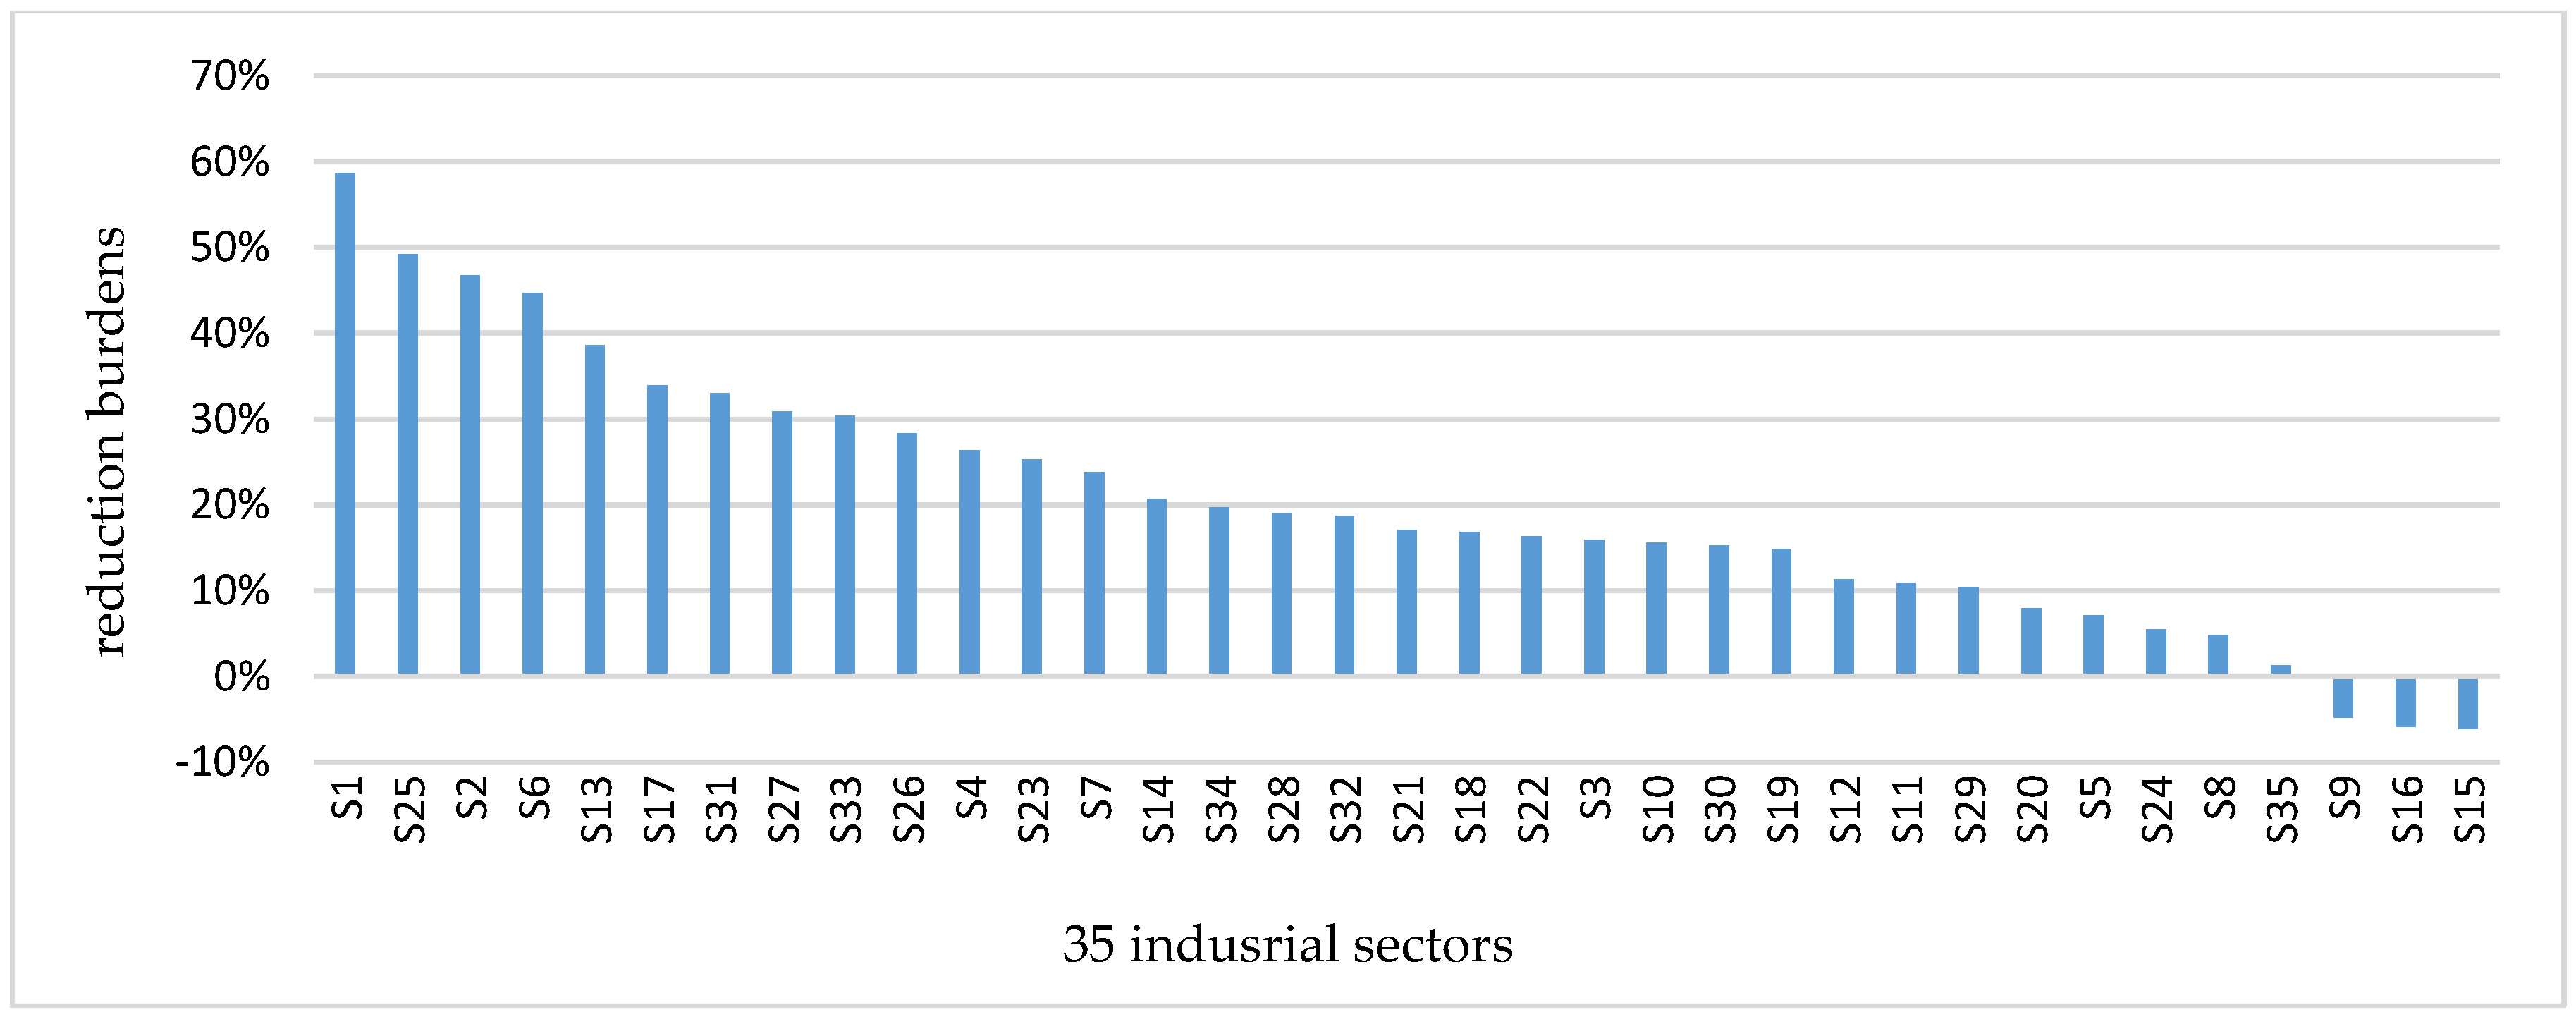
We allocate the carbon intensity reduction burdens among 35 industrial sectors, and draw
Figure 1. Several findings can be obtained as follows.
The carbon intensity reduction burdens of each industrial sector in 2020 are shown in
Figure 1, which are based on the level of 2005. According to the allocation results, the 35 industrial sectors can be divided into four categories. The first category contains four industrial sectors, whose intensity reduction burdens are more than 40%. The second and the third categories contain 10 industrial sectors with intensity reduction burdens from 20% to 40% and 18 industrial sectors with intensity reduction burdens from 0% to 20%, respectively. The fourth category contains three industrial sectors, whose intensity reduction burdens are negative.
Then, we make a comparison analysis of the first category and the fourth category in the ranking of the three indicators. The results are shown in
Table 4.
Through the comparison, we find that the four industrial sectors of the first category are all ranked high in the two indicators of historical accumulated emission and carbon intensity. Their rankings in the indicator of per capita industrial added value are relatively low. Thus, if an industrial sector ranked high in two indicators, it will shoulder more intensity reduction burden.
The intensity reduction burdens of the three industrial sectors in the fourth category are all negative, which means that the carbon intensity of each industrial sector can have an increase in 2020. According to the three indicators’ ranking, we can find that in the process of the development of these three industrial sectors, they did not have a strong economic strength, but also did not produce a large amount of carbon emissions. Their carbon intensity is low. Therefore, under the consideration of the equity principle, these three industrial sectors can maintain a slight increase in carbon intensity in 2020 to make up for the lack of development process.
The allocation results based on equal weights also have some unreasonable phenomena. For example, Manufacture of Tobacco is one of the richest industrial sectors because of its highest ranking in per capita industrial added value. Its intensity reduction burden is 38.58%, ranking fifth. However, Manufacture of Tobacco is ranked 32 and 34 in the indicator of historical accumulated emission and carbon intensity, respectively. This proves that it does not produce a large amount of carbon emissions historically and that it has high emission efficiency. We cannot give it too much reduction pressure, simply because it is the richest industrial sector. It seems like “overthrow the local despots and distribute land”. In our opinion, this unreasonable result is mainly ascribed to the equally weighted indicator system, in which the importance of reduction responsibility and reduction potential has not been fully recognized.
To sum up, the allocation method based on equal weights give us the accurate intensity reduction burden of 35 industrial sectors. It also verifies our previous hypothesis; that is, the industrial sector with greater reduction capacity, reduction responsibility and reduction potential will shoulder higher reduction burdens. Then, we will use the allocation model based on entropy method to make a comparison.
4.4. The Allocation Results Based on Entropy Method
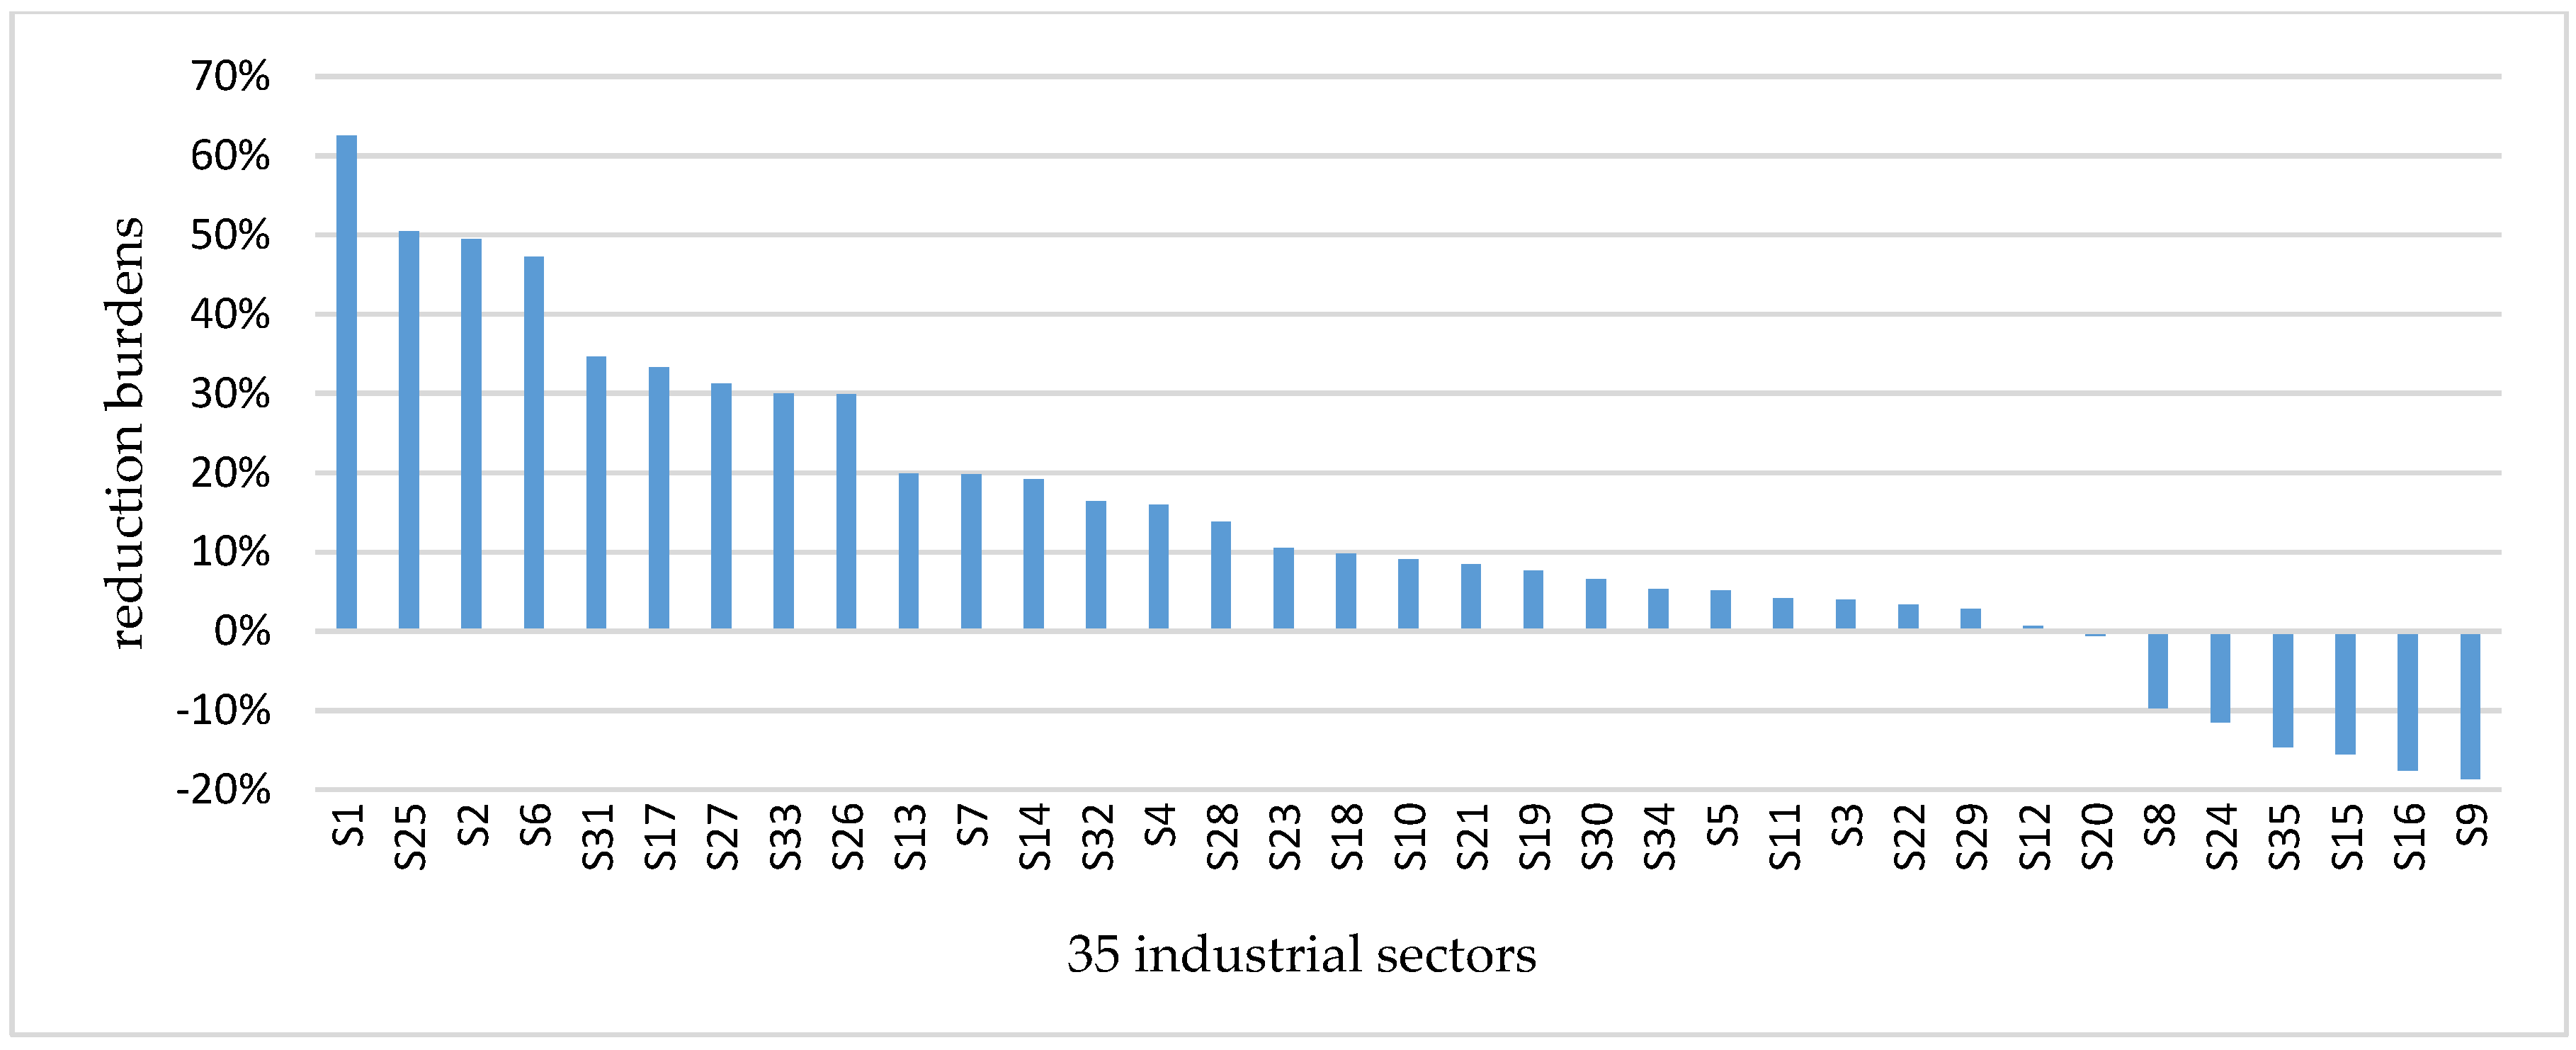
We use entropy method to distinguish the importance of different indicators. The weights of reduction capacity, reduction responsibility and reduction potential are 0.15, 0.48 and 0.37, respectively. We bring the weights into the allocation method. The results of intensity reduction burdens are shown in
Figure 2.
According to the allocation results in
Figure 2, we can also divide these 35 industrial sectors into four categories. The first category contains four industrial sectors, whose intensity reduction burdens are more than 45%. The second category contains five industrial sectors, whose intensity reduction burdens are from 20% to 40%. The third category contains 19 industrial sectors with intensity reduction burdens from 0 to 20%. The fourth category contains seven industrial sectors, whose intensity reduction burdens are negative. In this case, S1 (Smelting and Pressing of Ferrous Metals) may take the highest intensity reduction burden, which is 62.49%. S25 (Processing of Petroleum, Coking, Processing of Nuclear Fuel), S2 (Manufacture of Raw Chemical Materials and Chemical Products) and S6 (Manufacture of Non-metallic Mineral Products) also have much higher burdens than the other industrial sectors.
Comparing to the allocation method based on equal weights, the allocation results based on entropy method seems more reasonable. First, the variance of allocation results is larger. It means that heavy industrial sectors such as Smelting and Pressing of Ferrous Metals are given more reduction burden, while industrial sectors with less accumulated historical emissions including Manufacture of Beverages are given less reduction burden. Some industrial sectors’ reduction burdens are negative. Thus, it not only decreases the carbon intensity of high emission industrial sectors, but also protects the small industrial sectors which have not fully developed. Second, as we discussed in
Section 4.3, the industrial sector of Manufacture of Tobacco with the highest per capita industrial added value is given too much reduction burden in equal weighting method. This is unreasonable because the indicators of reduction responsibility and reduction potential have not been attached more importance. In the entropy method, the weights of reduction capacity, responsibility and potential are 0.15, 0.48, 0.37, respectively. The allocation results are more reasonable.
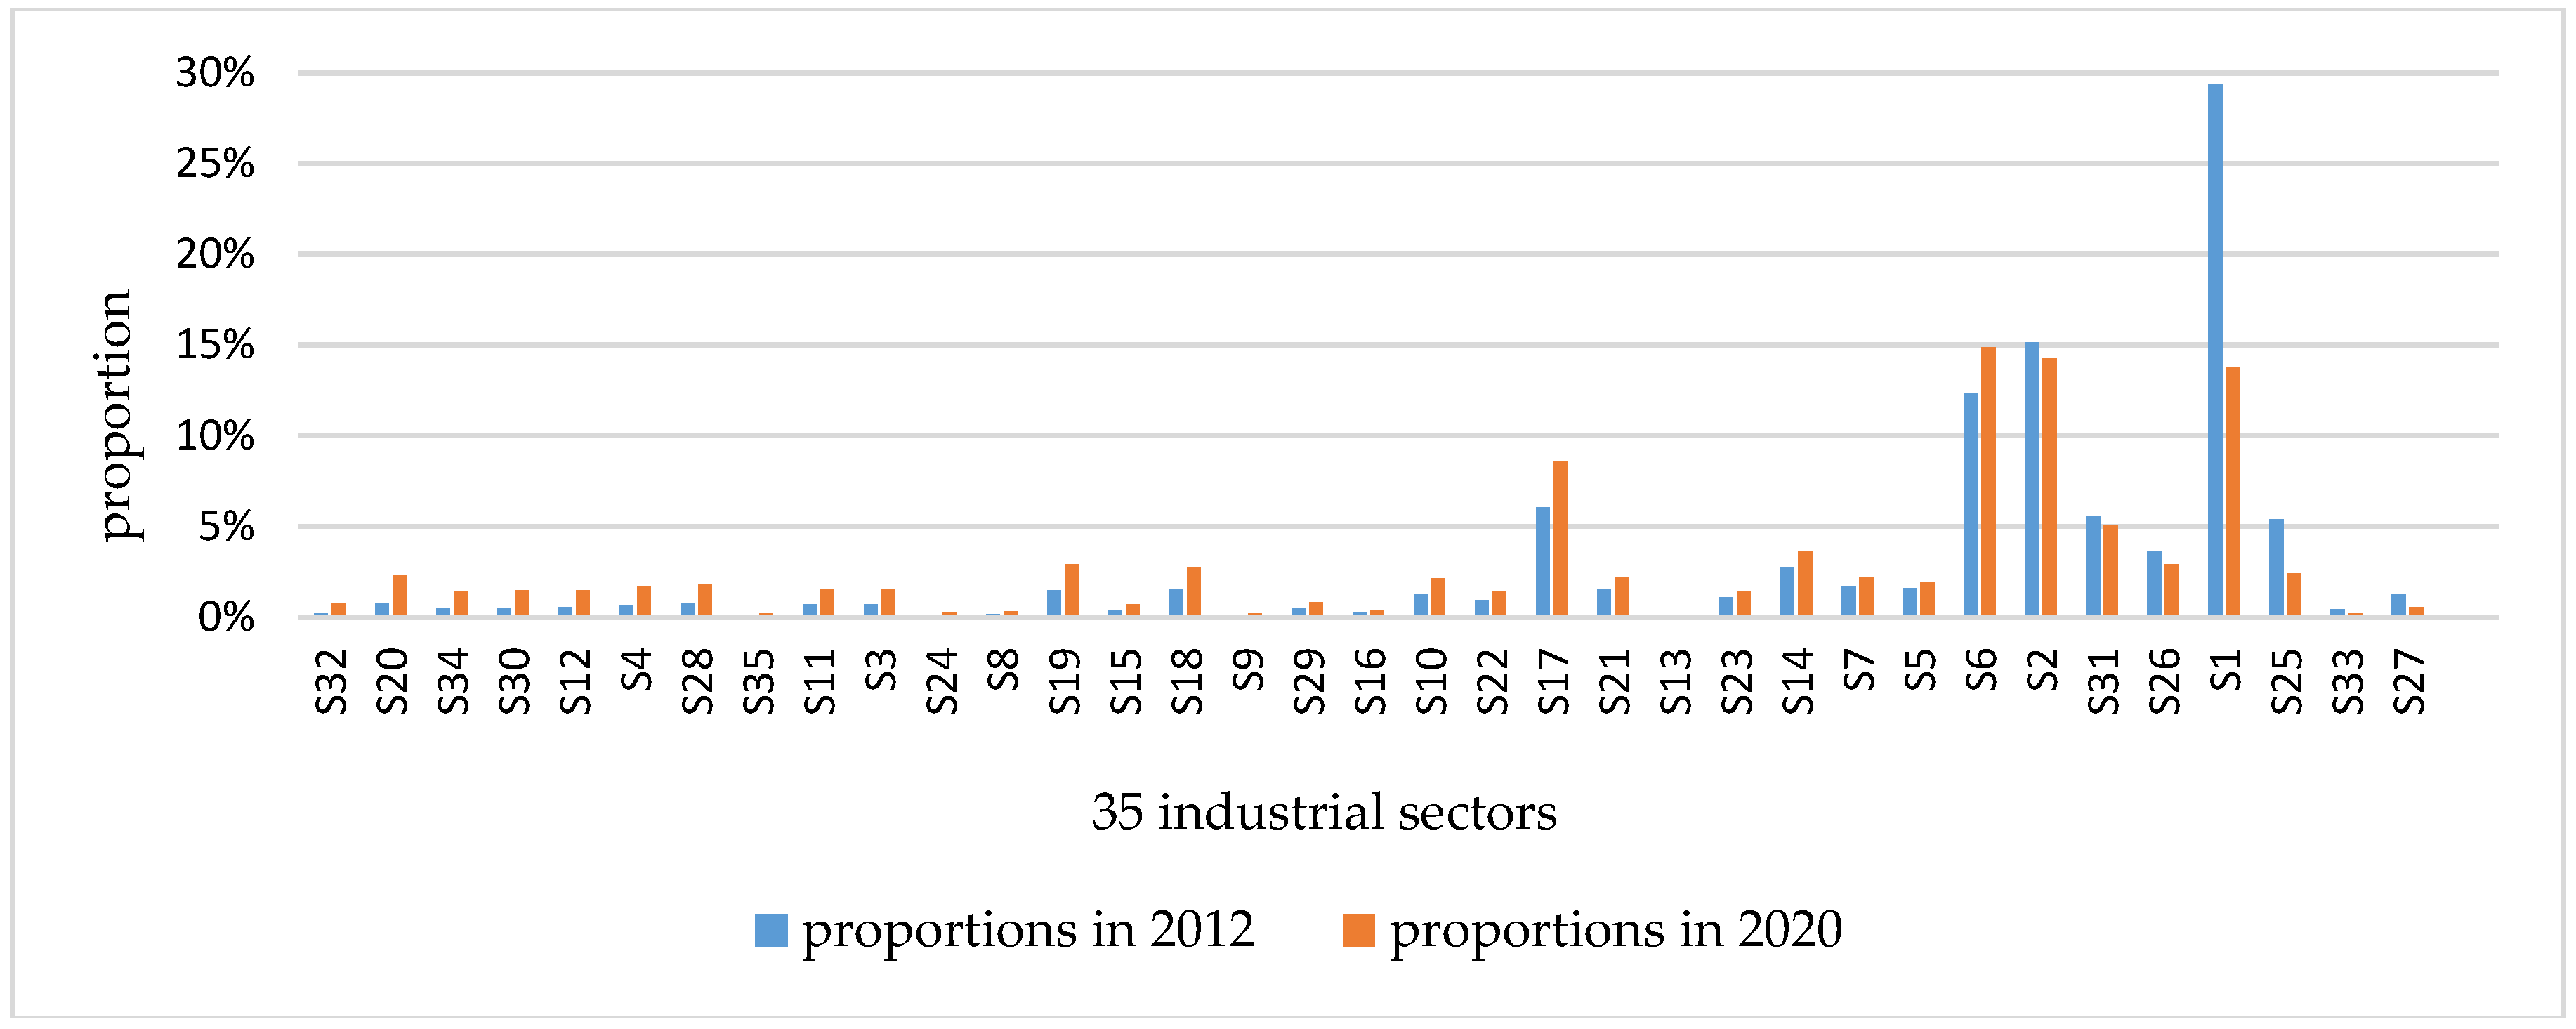
According to the above allocation results and historical data, we calculate every industrial sector’s carbon emission quotas in 2012 and 2020. The proportion of every industrial sector’s carbon emission in the secondary sector’s total carbon emissions in 2012 and 2020 is shown in
Figure 3.
Through the comparative analysis, we can see that 28 industrial sectors’ proportions in carbon emissions have increased, while eight industrial sectors have a decrease in the proportions in carbon emissions. Most obviously, the proportion of S1 (Smelting and Pressing of Ferrous Metals) fall sharply from 29.40% in 2012 to 13.76% in 2020. This is mainly due to the high carbon intensity and high historical accumulated emissions from Smelting and Pressing of Ferrous Metals. However, is this result in line with the actual situation? We investigate the current situation of China’s industry. China is carrying on the supply-side structural reform. The policy of cutting excessive industrial capacity is the main task of the supply-side structural reform. The current capacity utilizations of steel industry, coal industry, cement industry and chemical industry are only 67%, 68%, 67% and 60%, respectively. Other high energy consuming industries are also facing the problem of excess capacity. China’s government has shut down a number of small enterprises and limited the production of large enterprises in steel industry and coal industry. More actions will be done to cut excessive industrial capacity in other industrial sectors in the future. Therefore, the carbon emissions of these industrial sectors will have a decrease. Thus, our allocation results are in line with the current policy orientation.
Based on the above results, from the perspective of allocation equity, twenty-eight industrial sectors will increase the proportions of carbon emissions. Seven high emission industrial sectors will have a decrease in the proportion of carbon quotas. They are S1, S2, S25, S26, S27, S31, and S33, which are all industrial sectors with higher per capita industrial added value, historical accumulated carbon emissions or carbon intensity. These seven industrial sectors should pay more efforts to decrease carbon emissions; otherwise, they will need to buy quota in the carbon market. If this is the case, it will also increase the quota demand and liquidity in carbon market. From the perspective of allocation efficiency, our allocation result shows that most of the industrial sectors’ carbon intensity will have a decline in 2020. These carbon intensity reduction targets will encourage the industrial sectors to improve their emission efficiency.
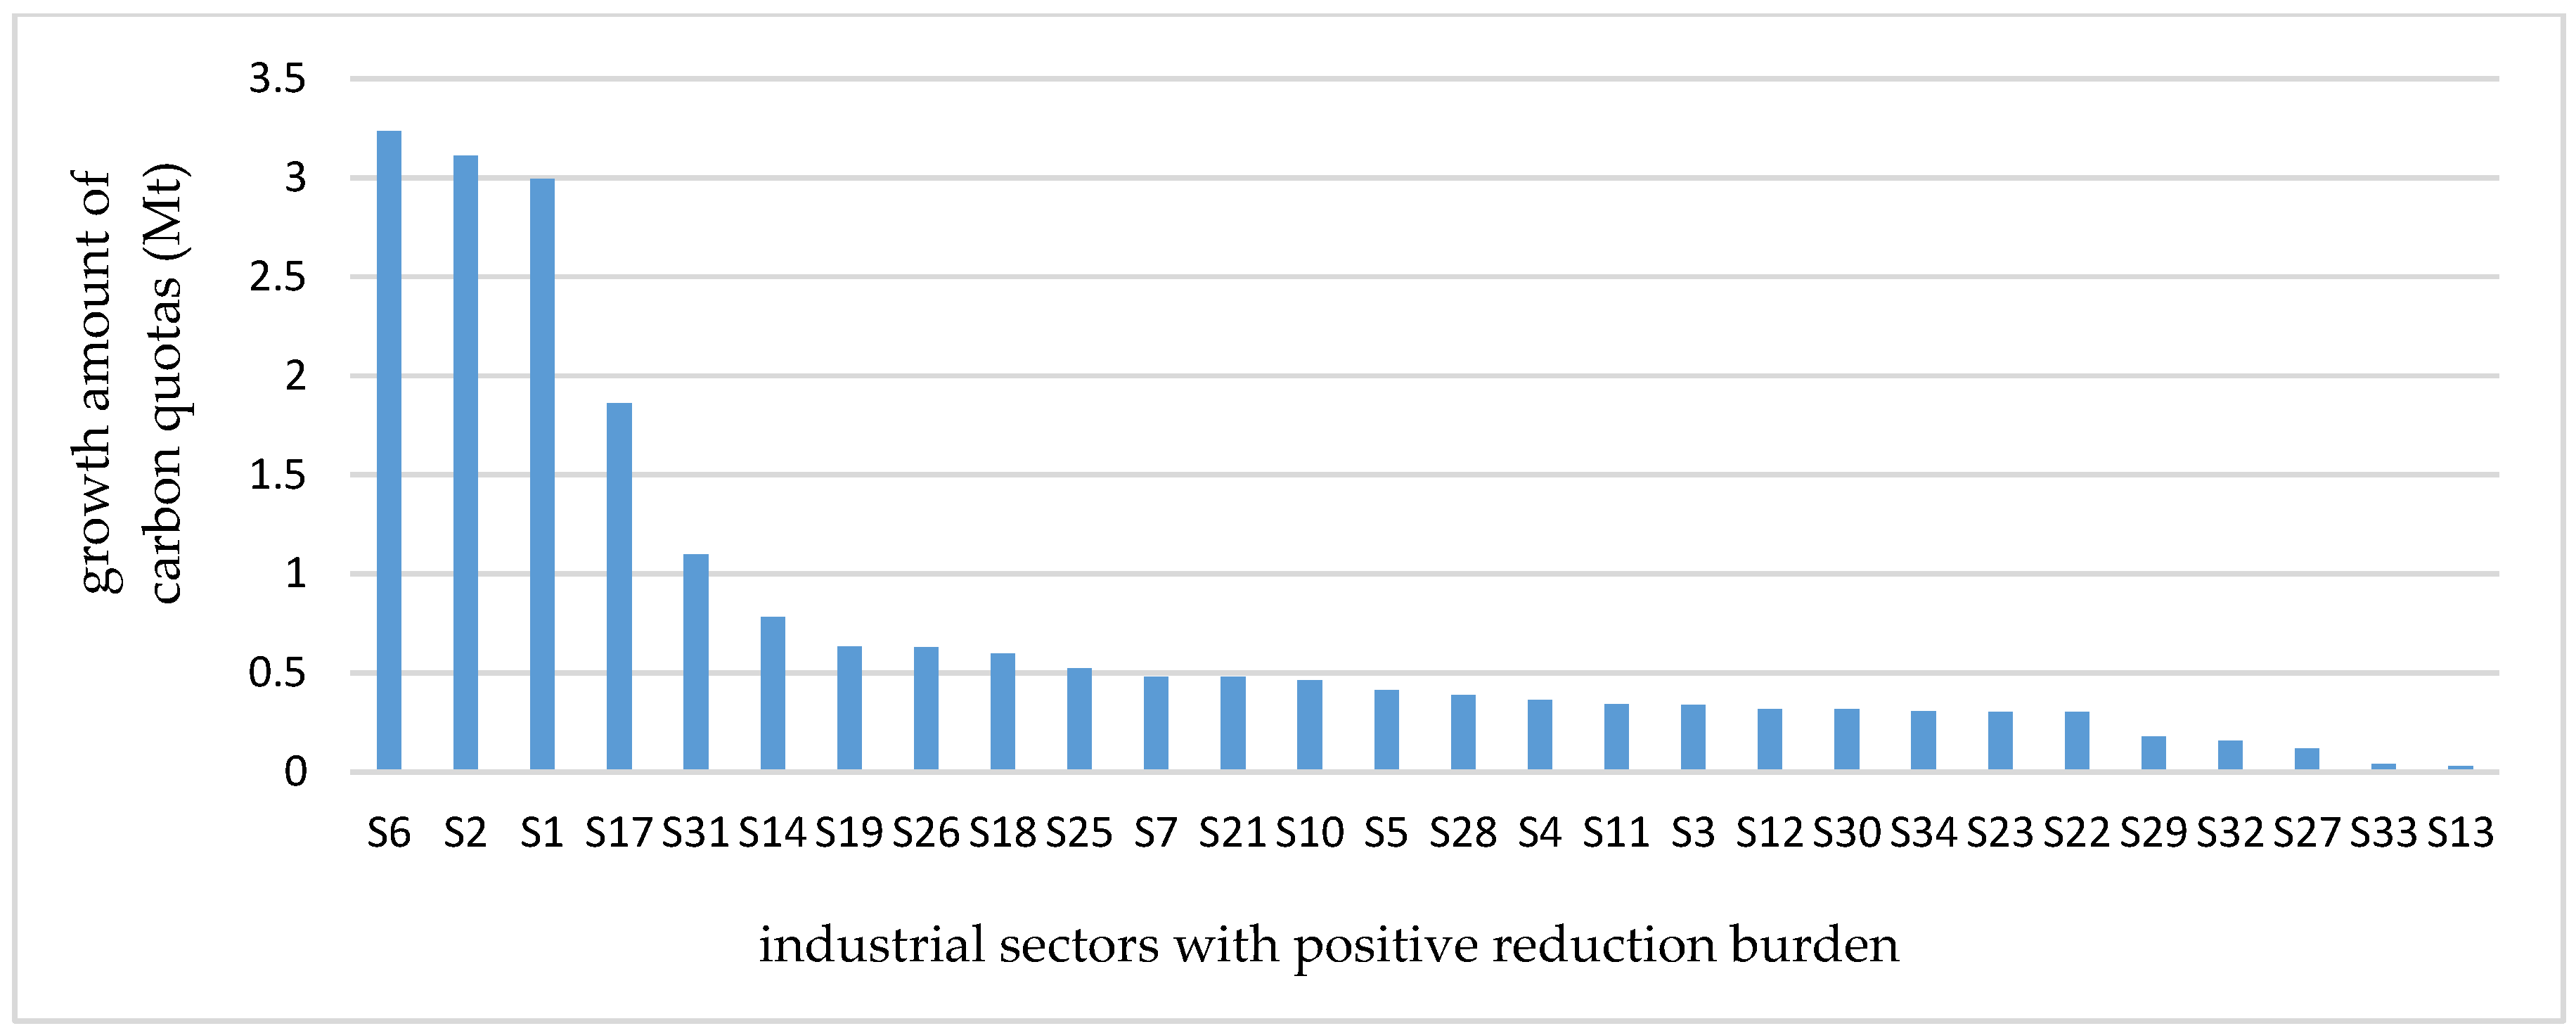
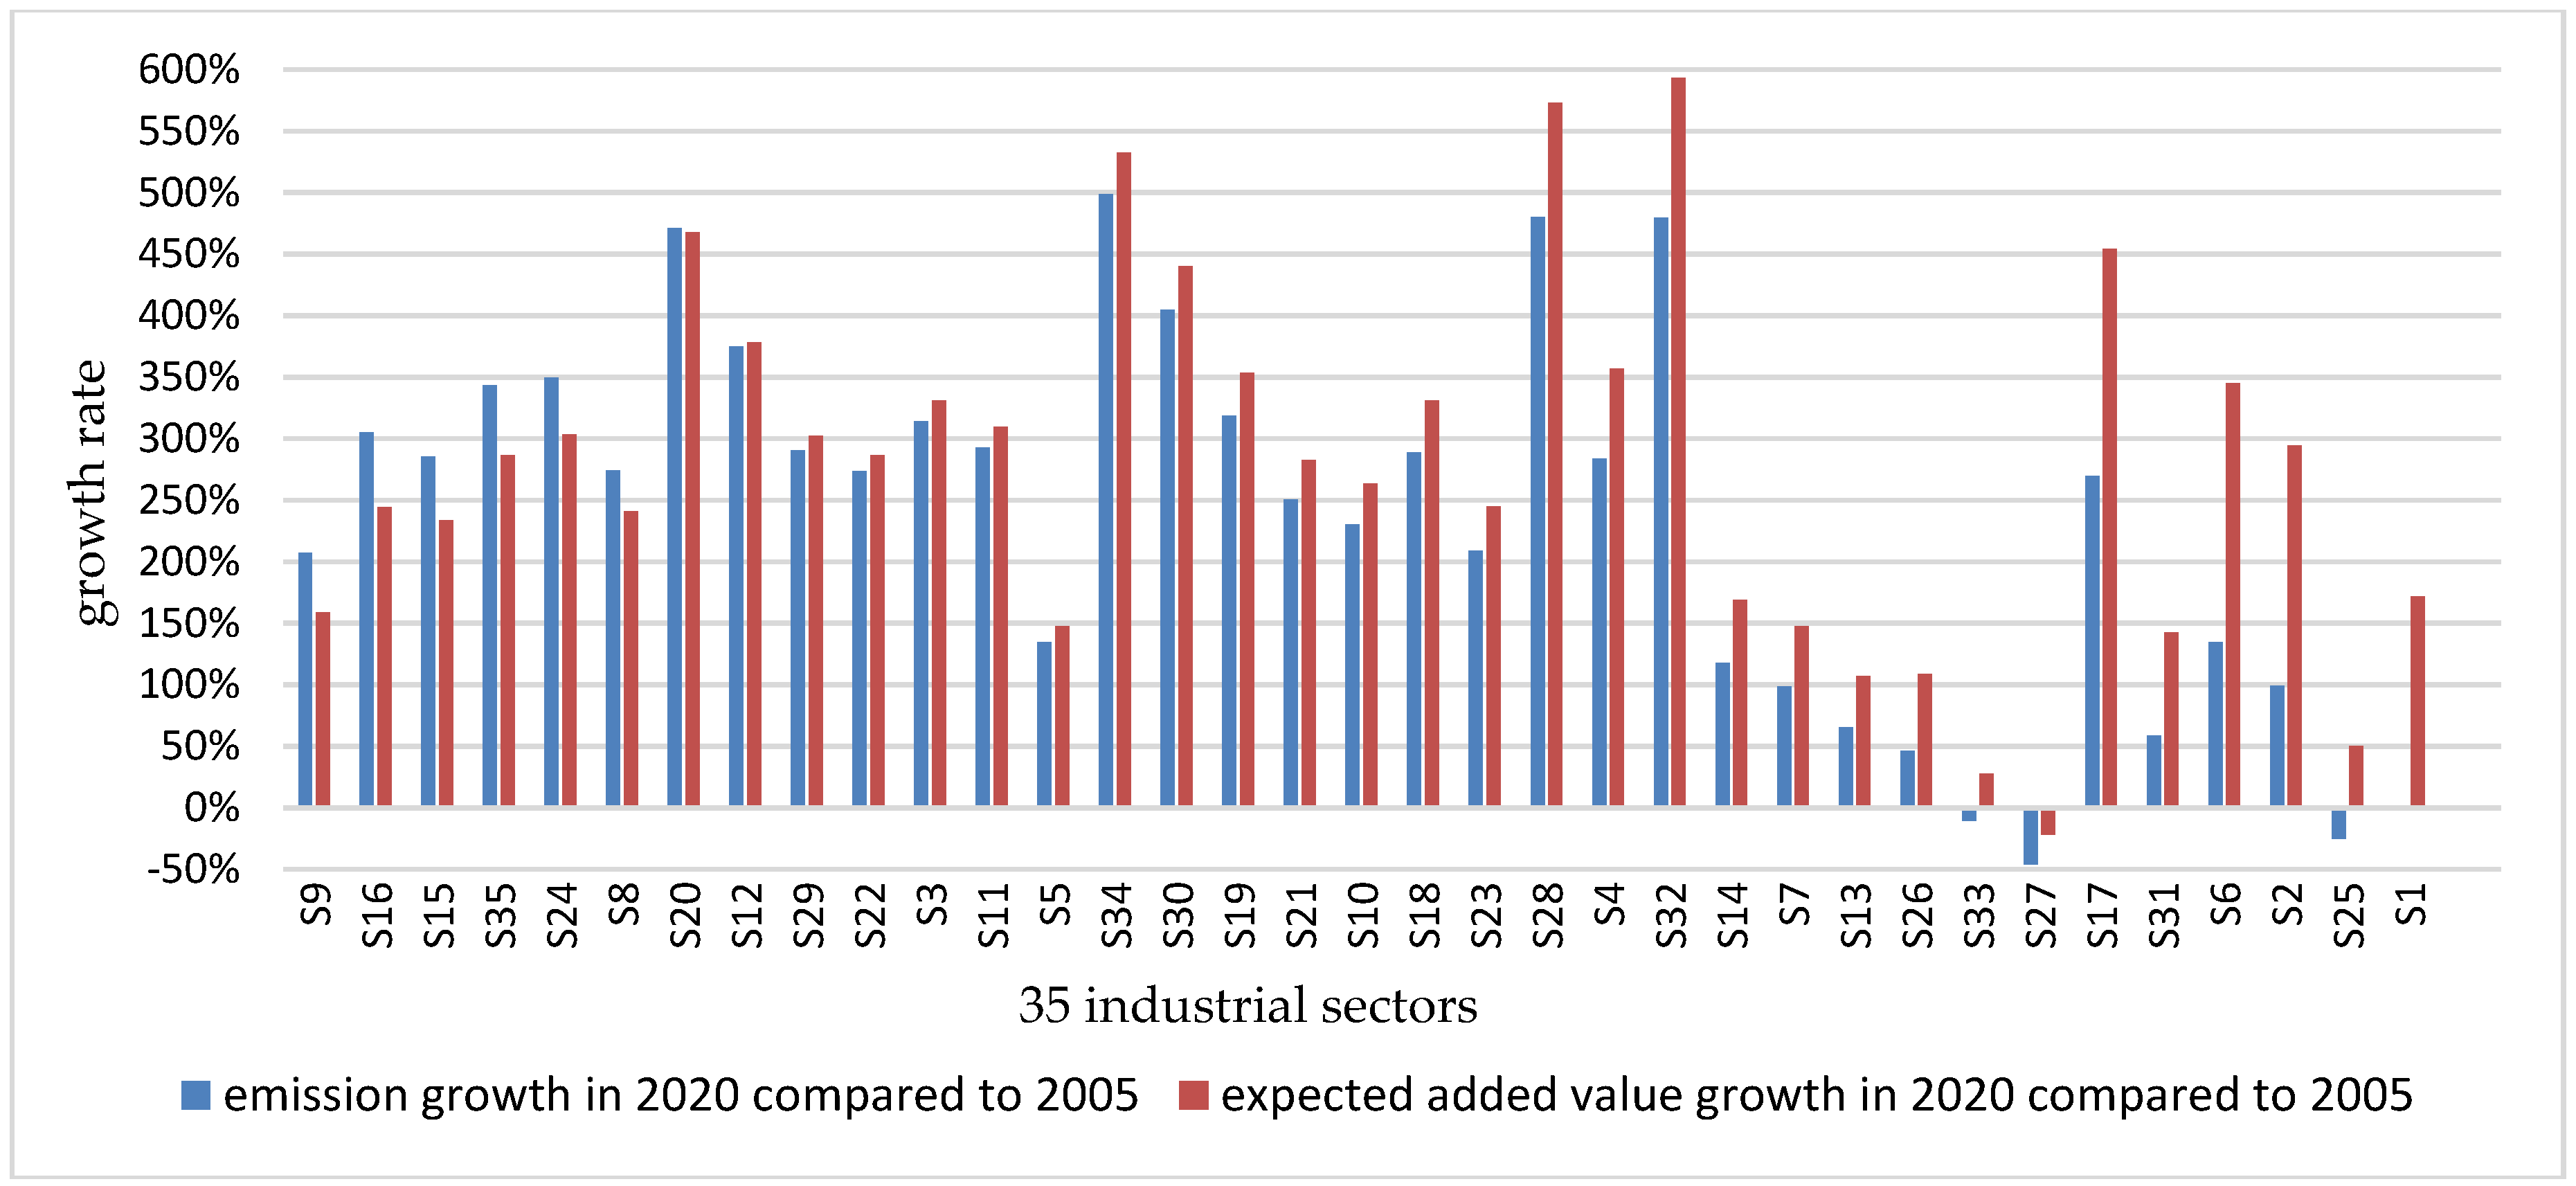
Although most of the 35 industrial sectors’ carbon intensity will be cut down in 2020, the amount of the emissions will not reduce; on the contrary, most of the 35 industrial sectors’ emissions will have a small amount of growth in 2020 compared to 2005. This is because China is still a developing country, whose first task is to develop the economy and improve people’s living standard. We use
Figure 4 to show the growth rate of each sector’s emission.
In
Figure 4, we also include the expected added value growth next to the expected emission growth in 2020 compared to 2005. We can find that most of the industrial sectors have an amount of growth in emission and industrial added value. However, the emission growth rates of the seven industrial sectors on the left (S9, S16, S15, S35, S24, S8, and S20) are larger than their expected added value growth rates. This is because the carbon intensity reduction burdens of these seven industrial sectors are negative; therefore, their carbon intensity in 2020 will have an increase. In addition, the other twenty-eight industrial sectors’ added value growth rates are larger than their emission growth rates. This is because their carbon intensity reduction burdens are all positive, resulting in the decrease in carbon intensity. This proves that our allocation method not only decreases the carbon intensity of most industrial sectors, but also maintains their economic growth. However, we should pay more attention to the development of the last eight industrial sectors on the right, i.e., S1, S25, S2, S6, S31, S17, S27 and S33. The gap between the emission growth rate and the added value growth rate is obvious, even the emission growth rates of S25, S27 and S33 are negative. As these industrial sectors have high intensity reduction burdens, we suggest that the government should provide them with certain subsidies and financial support to promote the improvement of emission reduction technology.
6. Conclusions and Policy Implications
To complete the emission intensity reduction commitment, the Chinese government is preparing for the establishment of a unified carbon emissions trading market, which will cover different industrial sectors gradually. In this study, we develop an allocation model to allocate the national carbon intensity reduction target among 35 industrial sectors based on equity and efficiency principle. Some main conclusions are obtained as follows.
First, we construct a reduction comprehensive index consisting of three indicators, reduction capacity, reduction responsibility and reduction potential. The first two indicators represent the principle of equity, and the third principle represents the principle of efficiency. Our allocation result shows that the industrial sector with greater reduction capacity, responsibility and potential will shoulder higher intensity reduction burdens, whether it is based on the equal weight method or the entropy weight method.
Second, we adopt entropy method to obtain the objective weights. The allocation results are more reasonable compared to the method based on equal weight. Under allocation based on entropy method, we obtain the intensity reduction burdens of each industrial sector, then we divide the 35 industrial sectors into four categories. Smelting and Pressing of Ferrous Metals is given the heaviest reduction burden and its proportion in carbon emissions will drop sharply. Although our allocation method will result in the reduction in carbon intensity, the amount of the emissions will not reduce; on the contrary, most of the 35 industrial sectors’ emissions will have a small amount of growth in 2020 compared to 2005. This is because China is still a developing country, whose first task is to develop the economy.
Third, twenty-eight industrial sectors will have an increase in the proportion of carbon emissions in 2020, while seven high emission industrial sectors’ proportions will have a decrease. This will promote the equity of carbon emissions allocation. From the perspective of allocation efficiency, our allocation result shows that most of the industrial sectors’ carbon intensity will have a decline in 2020. These reduction targets will encourage the industrial sectors to improve their emission efficiency.
Based on the conclusions above, we can provide some policy implications for the decision makers in China. For one thing, according to our allocation results, the industrial sectors in the first and the second categories should be included in the unified carbon emission trading market at the initial stage. The industrial sectors in the third category should be covered gradually in the future. The industrial sectors in the fourth category should not be included, but help to protect their development. Besides, the industrial sectors in the first category will face enormous pressure to reduce emissions in the short term. The government should provide them with certain subsidies and financial support to promote the improvement of emission reduction technology.
Furthermore, if the Chinese government prefers to adopt benchmarking approach to allocate carbon quotas from industry-level to firm-level, our allocation results can be helpful for the calculation of each industrial sector’s adjustment factor. The government should be clear that the industrial sector with high reduction burden should be given a more stringent emission reduction benchmark. The government should aggregate the carbon emission quotas of every enterprise in each industrial sector, and strictly control the total allocation quotas of each industrial sector according to the reduction burdens.
Overall, it should be noted that the allocation of carbon emissions quotas is the key aspect in the successful operation of the carbon market. In this paper, we allocate the carbon emission quotas from the perspective of industrial sector, but do not take into account the problem of how to decide the proportion of free allocation and auction, which may be an important research direction in the future.


