Article

Development and Application of a Low Impact Development (LID)-Based District Unit Planning Model

1
Department of Urban Engineering, Chungbuk National University, Cheongju 28644, Korea
2
Department of Urban Environment Research, Land & Housing Institute, Daejeon 34047, Korea
3
Korea Adaptation Center for Climate Change, Korea Environment Institute, Sejong 30147, Korea
*
Author to whom correspondence should be addressed.
These authors contributed equally to this work.
Sustainability 2017, 9(1), 145; https://doi.org/10.3390/su9010145
Submission received: 10 November 2016 / Revised: 4 January 2017 / Accepted: 13 January 2017 / Published: 19 January 2017

Abstract

:
The purpose of this study was to develop a low impact development-based district unit planning (LID-DP) model and to verify the model by applying it to a test site. To develop the model, we identified various barriers to the urban planning process and examined the advantages of various LID-related techniques to determine where in the urban development process LID would provide the greatest benefit. The resulting model provides (1) a set of district unit planning processes that consider LID standards and (2) a set of evaluation methods that measure the benefits of the LID-DP model over standard urban development practices. The developed LID-DP process is composed of status analysis, comprehensive analysis, basic plan, and sectoral plans. To determine whether the LID-DP model met the proposed LID targets, we applied the model to a test site in Cheongju City, Chungcheongbuk-do Province, Republic of Korea. The test simulation showed that the LID-DP plan reduced nonpoint source pollutants (total nitrogen, 113%; total phosphorous, 193%; and biological oxygen demand, 199%); reduced rainfall runoff (infiltration volume, 102%; surface runoff, 101%); and improved the conservation rate of the natural environment area (132%). The successful application of this model also lent support for the greater importance of non-structural techniques over structural techniques in urban planning when taking ecological factors into account.

1. Introduction

1.1. Study Background and Objectives

Low Impact Development (LID) has recently garnered a growing interest in the field of urban planning. LID is a management approach that facilitates recovery of pre-development water cycle system conditions through various strategies and elements [1,2]. LID technologies encompass non-structural techniques, which foster the protection and establishment of green space (e.g., preserving natural flow pathways and patterns, cluster development, reducing impervious surfaces, and protecting riparian buffer areas and sensitive areas), and structural techniques, which require installation of facilities supporting the water cycle (e.g., infiltration trenches, dry wells, green roofs, vegetation beds, water courses for vegetation, rain gardens, permeable paving, and permeable blocks) [3,4]. Some studies report the indirect social and economic effects of LID, including improving public health [5,6,7], ecosystem diversity [6,8], and increasing land value [9,10] as well as reducing rainfall runoff and nonpoint source pollution. The results of these studies offer implications for the need to go beyond conventional water management systems and apply LID more universally in urban planning.
There are certain difficulties in implementing LID in urban planning [11]. A study by Earles, et al. [12] listed the major barriers to the incorporation of LID into urban planning as follows: (1) LID is typically not integrated early in the planning process; (2) LID is recommended, not mandated; and (3) there is no consensus about LID protocol between different governmental departments. Jia, et al. [13] argued that the process of LID planning should consider not only land-use planning, but also urban development planning, such as urban master plans, the cityscape, and water pollution management. Additionally, Kang, et al. [14] argued that there is a need to revise the basic urban planning guidelines to reflect the essential connection between urban planning, structural, and non-structural techniques to effectively fulfill LID. Seo and Kim [15] pointed out that LID is applied in urban planning mainly through structural techniques and that suitable standards for LID are missing. A study by Lewinsohn [16] argued that even a well-formulated LID policy would face the challenge of interpreting LID standards and that the process of planning must be considered. These studies indicated that a reasonable model of LID-based urban planning must be developed and that the various strategic barriers of LID should be considered in the planning process.
This study aims to (1) develop an LID-based urban planning model and (2) conduct applications to examine the practicality and effects of the LID-based urban planning model.

1.2. Study Method

This study was conducted in three stages: (1) examining the strategic barriers that hinder the integration of LID into urban planning and identifying principles; (2) analyzing the existing LID and urban planning process, identifying the planning elements necessary for an LID-based urban planning model, and developing an LID-based model; and (3) selecting a test site and conducting test applications of the developed LID-DP model. The test site was selected based on criteria identified for preferential application. The test application considered both structural and non-structural techniques to estimate the benefits of the LID-based development at the site to and examine its effects in comparison to the existing development approach.

2. Literature Review

Research integrating LID into urban planning began in Prince George’s County, Maryland, USA in 1999. The stages of land-use planning developed in Prince George’s County provided the foundation for further research into the process of LID planning [4,17,18,19,20]. The LID planning process is similar to the process of general land-use planning. However, it is distinguished by its consideration of elements related to the water cycle. It also considers the suitability of development alternatives through pre- and post-tests on the land application of LID.
Although the LID planning processes outlined in many studies consist of detailed stages, they are limited to land-use planning and do not suggest approaches for use in urban planning [13]. Conversely, LID should be considered in different ways according to the hierarchy of urban planning. In higher-level plans (Figure 1), which encompass a wide variety of planning space types, a plan should include policy and strategy. Consideration of LID in a higher-level plan offers the direction of LID standards and facilitates its application in a lower-level plan. However, it does not contribute to establishing a detailed plan. On the contrary, a detailed plan can be established at a lower level that covers a smaller range of planning space types. Both non-structural and structural techniques can be applied to land-use planning and to higher-level plans. The implementation of lower-level plans is legally binding, which is an important element in the universal application of LID. In Korea, district unit planning, which is the lowest level of planning and is enforceable, must be implemented for every urban development project (Figure 1).
Previous studies [5,6,7,8,9,10] have shown that LID generates a range of social and economic benefits; however, since LID is a technique for minimizing the environmental impacts of development in cities [2], studies have focused mainly on analyzing its environmental benefits. These benefits include the reduction of rainfall runoff [1,21,22], reduction of nonpoint source pollution [1,6,23], and conservation of natural environments [19,24]. These environmental benefits enable improvement of the water cycle and maintenance of a post-development hydrological environment in a state similar to its pre-development condition. Lowe [25] employed a SWMM-LID (Storm Water Management Model—LID) to simulate change in rainfall runoff in Raymore Town, Missouri, USA after a hypothetical application of porous pavement to parking lots in residential and commercial zones. Jia, Yao, Tang, Shaw, Field and Tafuri [13] proposed a SUSTAIN (System for Urban Stormwater Treatment and Analysis Integration) model as a comprehensive decision making support tool in designing a LID facility layout that is optimal for reducing rainfall runoff and nonpoint source pollution. Bedan and Clausen [26] and Dietz and Clausen [27] mentioned the effect of the non-structural technique in reducing rainwater runoff and nonpoint source pollution, however they were limited to a declarative alternative. ASLA (American Society of Landscape Architects), provides information regarding 479 LID application case studies in the USA and Canada, including measurements of reduced rainfall runoff, the economic contribution to local communities, and the aesthetic impact for a wide range of development sizes, from building unit to city unit scale [15]. Many of the peer-reviewed LID studies were limited to structural techniques. Furthermore, studies that evaluated the benefits of LID prioritized environmental factors over urban planning principles and processes. With little information on the benefits of LID to urban development, implementing LID solely for an excessive environmental zed, an excessive environmental goal could necessitate an unnecessary application of LID at achievement goal should be avoided. This is because in projects where development benefits are prioritized at the expense of practicality. Accordingly, it is better to apply an integrated process that considers the relationship between LID and urban planning rather than planning solely for LID.
Regarding the above limitations of previous LID studies and the barriers to LID applications, the following principles should be considered in the integration of LID into urban planning. First, LID should be considered throughout the entire process of land-use planning and urban planning. This will contribute to establishing mutually complementary plans that consider the institutions related to LID, and will enable the formulation of consistent plans. Second, the environmental benefits of structural and non-structural techniques (reduction of rainfall runoff, reduction of nonpoint source pollutants, and conservation of the natural environment) should be quantitatively analyzed. In this way, the benefits will be reflected in the planning process, allowing for suitable LID arrangements and volumes. Third, the quantitative analysis of barriers and benefits should be considered in district unit planning. District unit planning is the level of the urban planning hierarchy that establishes detailed spatial plans and therefore both non-structural and structural techniques should be considered in this process. Further, at this stage higher-level plans and LID-related plans can be considered as they should be legally enforceable.

3. LID-Based District Unit Planning Model

In this study, to create a blueprint, planning elements were identified based on the Guidelines for District Unit Planning (Ministry of Land, Infrastructure, and Transport of Korea) and studies that discuss the process of LID planning [4,17,18,19,20]. An LID-based district unit plan (LID-DP hereinafter) was established based on the principles stated in Section 2.
  • LID should be considered throughout the entire process of urban planning.
  • The environmental benefits should be quantitatively analyzed.
  • LID-DP should be developed at the level of district unit planning.
A model was then developed and its application was tested (Figure 2). The planning process of the LID-DP model was divided into four categories: (1) status analysis; (2) comprehensive analysis; (3) basic plan; and (4) plans for each sector. Each of these categories possessed sub-level planning elements which are described in detail in the following sections. Each planning element was assessed and analyzed with a focus on achieving the three LID objectives: rainfall runoff reduction, nonpoint source pollution reduction, and conservation of natural areas.

3.1. Status Analysis

The status analysis stage is conducted as follows:
(1)
LID-related laws, institutions, and municipal ordinances are investigated together with topography, hydraulics and hydrology, water quality, and ecological status (Table 1).
(2)
Available legal provisions or official data previously produced by public organizations can be utilized in the analyses.
(3)
Based on the preliminary surveys, past and present trends and future outlook are analyzed and organized.

3.2. Comprehensive Analysis

The comprehensive analysis stage is conducted as follows:
  • Use a new approach for the application of LID in targeting development areas; conduct an analysis from a perspective that links necessary elements to LID techniques.
  • Identify opportunities and constraints in target areas for the application of LID and assess the development potential.
  • Assess various techniques available for the comprehensive analysis.
  • Analyze the validity and legal hierarchy of the procedures suggested in LID-related plans and programs.

3.3. Basic Plan

The basic plan stage is conducted as follows:
  • Set directions for development based on the data drawn from the comprehensive analysis.
  • Set targets for the benefits that should be yielded by the development.
  • If target standards provided by LID-related plans are available, targets shall be set according to the hierarchy of corresponding laws.

3.4. Sectoral Plans

The sectoral plans stage is conducted as follows:
  • Design a plan that embraces the project objectives and basic directions of the LID application.
  • Design a plan that details zoning and land-use schemes. The plans should be designed in consideration of non-structural techniques to meet desired targets.
  • Apply structural techniques. Types and the quantity of LID facilities should be selected in consideration of targets.
  • Complete the draft of the site plan. Measure the benefits (B in Figure 2) generated by the site plan draft. The benefits should be compared to the targets (A in Figure 2) of LID-DP, which were set in the basic plan stage (Section 3.3). This is the stage to assess whether the targets have been met.
  • Based on the assessment results, complement the non-structural and structural techniques corresponding to the targets. If necessary, modify the development plan to change the land-use scheme and zoning districts.

3.5. Assessment of Benefits of the LID-DP Model

The following indicators were selected for assessment of the benefits of the LID-DP model: (1) reduction of rainfall runoff; (2) reduction of nonpoint source pollutants; and (3) conservation of the natural environment. In this study, the basic unit (generation load per unit area) was used. The basic unit is used to estimate the volume depending on the land use type and is universally used at in Korea and abroad [28].

3.5.1. Reduction of Rainfall Runoff

Infiltration volume (mm/year) and surface runoff volume (mm/year) were selected as indicators for measuring rainfall runoff in accordance with Zielinski [29]. Rainfall runoff, which is the excess water flowing over the surface after a rainfall event, can be determined as the sum of these two variables. Both non-structural and structural techniques generate rainfall. The runoff generated via non-structural techniques is calculated as the basic unit generated per land-use while that generated via structural techniques is calculated as the basic unit generated per facility.
Infiltration and surface runoff volumes generated by nonstructural techniques were calculated using the SCS effective rainfall estimation method. This method calculates an effective rainfall by subtracting the loss of rainfall due to infiltration from the total rainfall in basins for which there are no runoff observation data. The 30-year (1981–2010) mean rainfall for South Korea, which was 1307.7 mm, was used for the total rainfall quantity. A runoff curve was adopted for each land use type in accordance with the document, Calculation Method of Design Flood [30]. The correlation equation that was applied in the SCS effective rainfall estimation method is as follows:
Q = ( P I a ) 2 ( P I a ) + S ,   I a = 0.2 S ,   S = 25400 C N 254 ,
where P is the total rainfall (mm); Ia is the initial loss (mm) due to surface detention storage and infiltration; S is the potential maximum retention within the basin (mm); Q is the direct runoff (mm); and CN is the runoff curve index.
Infiltration and surface runoff volumes generated by non-structural techniques were calculated using the LID monitoring results reported by the Water Environment Management Bureau (Source: http://keco.or.kr/kr). The Water Environment Management Bureau is affiliated with the Korean Ministry of Environment, which monitored the rainfall, rainfall runoff, and rainfall inflow related to LID facilities over the period of 2006 to 2008.
The total rainfall runoff generated by an LID application can be expressed via the following equation:
B a s i c   u n i t   o f   r a i n f a l l   r u n o f f = P i ( L A i × U i j ) + Q n = 1 N ( n s × U ' s k ) ,
where P is the runoff volume generated through non-structural techniques; LA is the area of impacted land cover (Land cover map was used for classification (Ministry of Environment) (Source: https://egis.me.go.kr)).; U is the basic unit of land cover ( per   m 2 ); i is the land cover type; j is the infiltration and runoff volume, Q is the runoff volume generated through structural techniques; n is the number of LID facilities installed; U’ is the basic unit of the LID facility ( per   m 2 ); s is the LID facility type; and k is the infiltration and runoff volume.

3.5.2. Reduction of Nonpoint Source Pollutants

To measure the volume of nonpoint source pollutants generated by LID and standard development, total nitrogen (T-N, kg/year), total phosphorus (T-P, kg/year), and biological oxygen demand (BOD, kg/year) were selected in accordance with the Total Water Pollution Program. The total measured nonpoint source pollutant volume was split into volumes generated via non-structural and structural techniques. The runoff generated via non-structural techniques was measured using the basic unit generated per land-use, and the runoff generated through structural techniques was measured using the basic unit per facility.
The T-N, T-P, and BOD quantities generated by non-structural techniques were determined in accordance with the criteria proposed by Kwon [31]. Kwon [31] classified nonpoint source pollution runoff measurements acquired during rainfall events from 2007 to 2009 according to the land cover. For each rainfall event, a runoff flow measurement was conducted at least 10 times per 15-min interval until event completion. The total runoff volume was then determined via Hydrologic Simulation Program Fortran (HSPF) modeling and was tested and adjusted via a trial and error method. The infiltration and surface runoff volumes generated by non-structural techniques were determined as described in the Section 3.5.1, via monitoring results from the Water Environment Management Bureau. The total volume of nonpoint source pollution generated by a LID application can be expressed via the following equation:
B a s i c   u n i t   o f   n o n p o i n t   s o u r c e   p o l l u t a n t s = N S i ( L A i × U i j ) + S A n = 1 N ( n s × U ' s k ) ,
where N S is the volume of nonpoint source pollution generated via non-structural techniques; LA is the area of land cover; U is the basic unit of land cover ( per   m 2 ); i is the land cover type; j is the T-N, T-P, and BOD volume; S A is the volume of nonpoint source pollution generated through structural techniques; n is the number of LID facilities installed; U’ is the basic unit of the LID facility ( per   m 2 ); s is the LID facility type; and k is the T-N, T-P, and BOD volume.

3.5.3. Conservation of the Natural Environment

The Korean Environmental Conservation Value Assessment Map (ECVAM) (Fifty-seven legislative evaluation items and eight ecological environment evaluation items were used to evaluate the country in five grades (Ministry of Environment) (Source: http://ecvam.kei.re.kr)) and land drainage ratings (It is classified into six drainage ratings according to soil characteristics (Rural Development Administration) (Source: http://rda.go.kr)) were selected as indicators for measuring the degree of conservation of the natural environment. These indicators demonstrate natural areas that should be conserved and those that can be developed. The division of areas was employed by using the land-use matrix. This matrix is an assessment method that classifies the indicators by rating on horizontal and vertical axes, and then overlaying them for a comprehensive assessment. Higher ratings of ECVAM on the horizontal axis and higher ratings of land drainage on the vertical axis indicate a greater degree of environmental conservation. Considering the relationship between development pressure and conservation, the rating system was categorized into four areas: Active conservation area (rating 1); optional conservation area (rating 2); optional development area (rating 3); and active development area (rating 4). In the ECVAM, an active conservation area (rating 1) indicates no development (Table 2).

4. Application of the LID-DP Model

4.1. Study Test Site

To select suitable test sites for our model, the regions requiring LID were identified among 244 local governments in Korea. The following elements, which were identified in previous studies as influencing LID policy, were set as selection criteria:
(1)
Local governments chosen for projects concerning flooding through public competitions in the last 10 years were selected because the will of local governments for environmental protection is crucial for bringing success to governmental policies [32];
(2)
Areas with a history of flood damage, water quality management districts, higher impermeable surface rates, and conserved green space were selected.
Spatial analysis was conducted through ArcGIS to select a test site that satisfied both conditions. The Uncheon district of Uncheon-dong in Cheongju City of Chungcheongbuk-do Province, Republic of Korea was selected as the final study site. The area of the district is 968,661 m2. A forest is located to the west of the study site and the Musimcheon River runs from the northwest to the southeast of the site. Between the forest and the river lies the built-up urban area (Figure 3).

4.2. Status Analysis

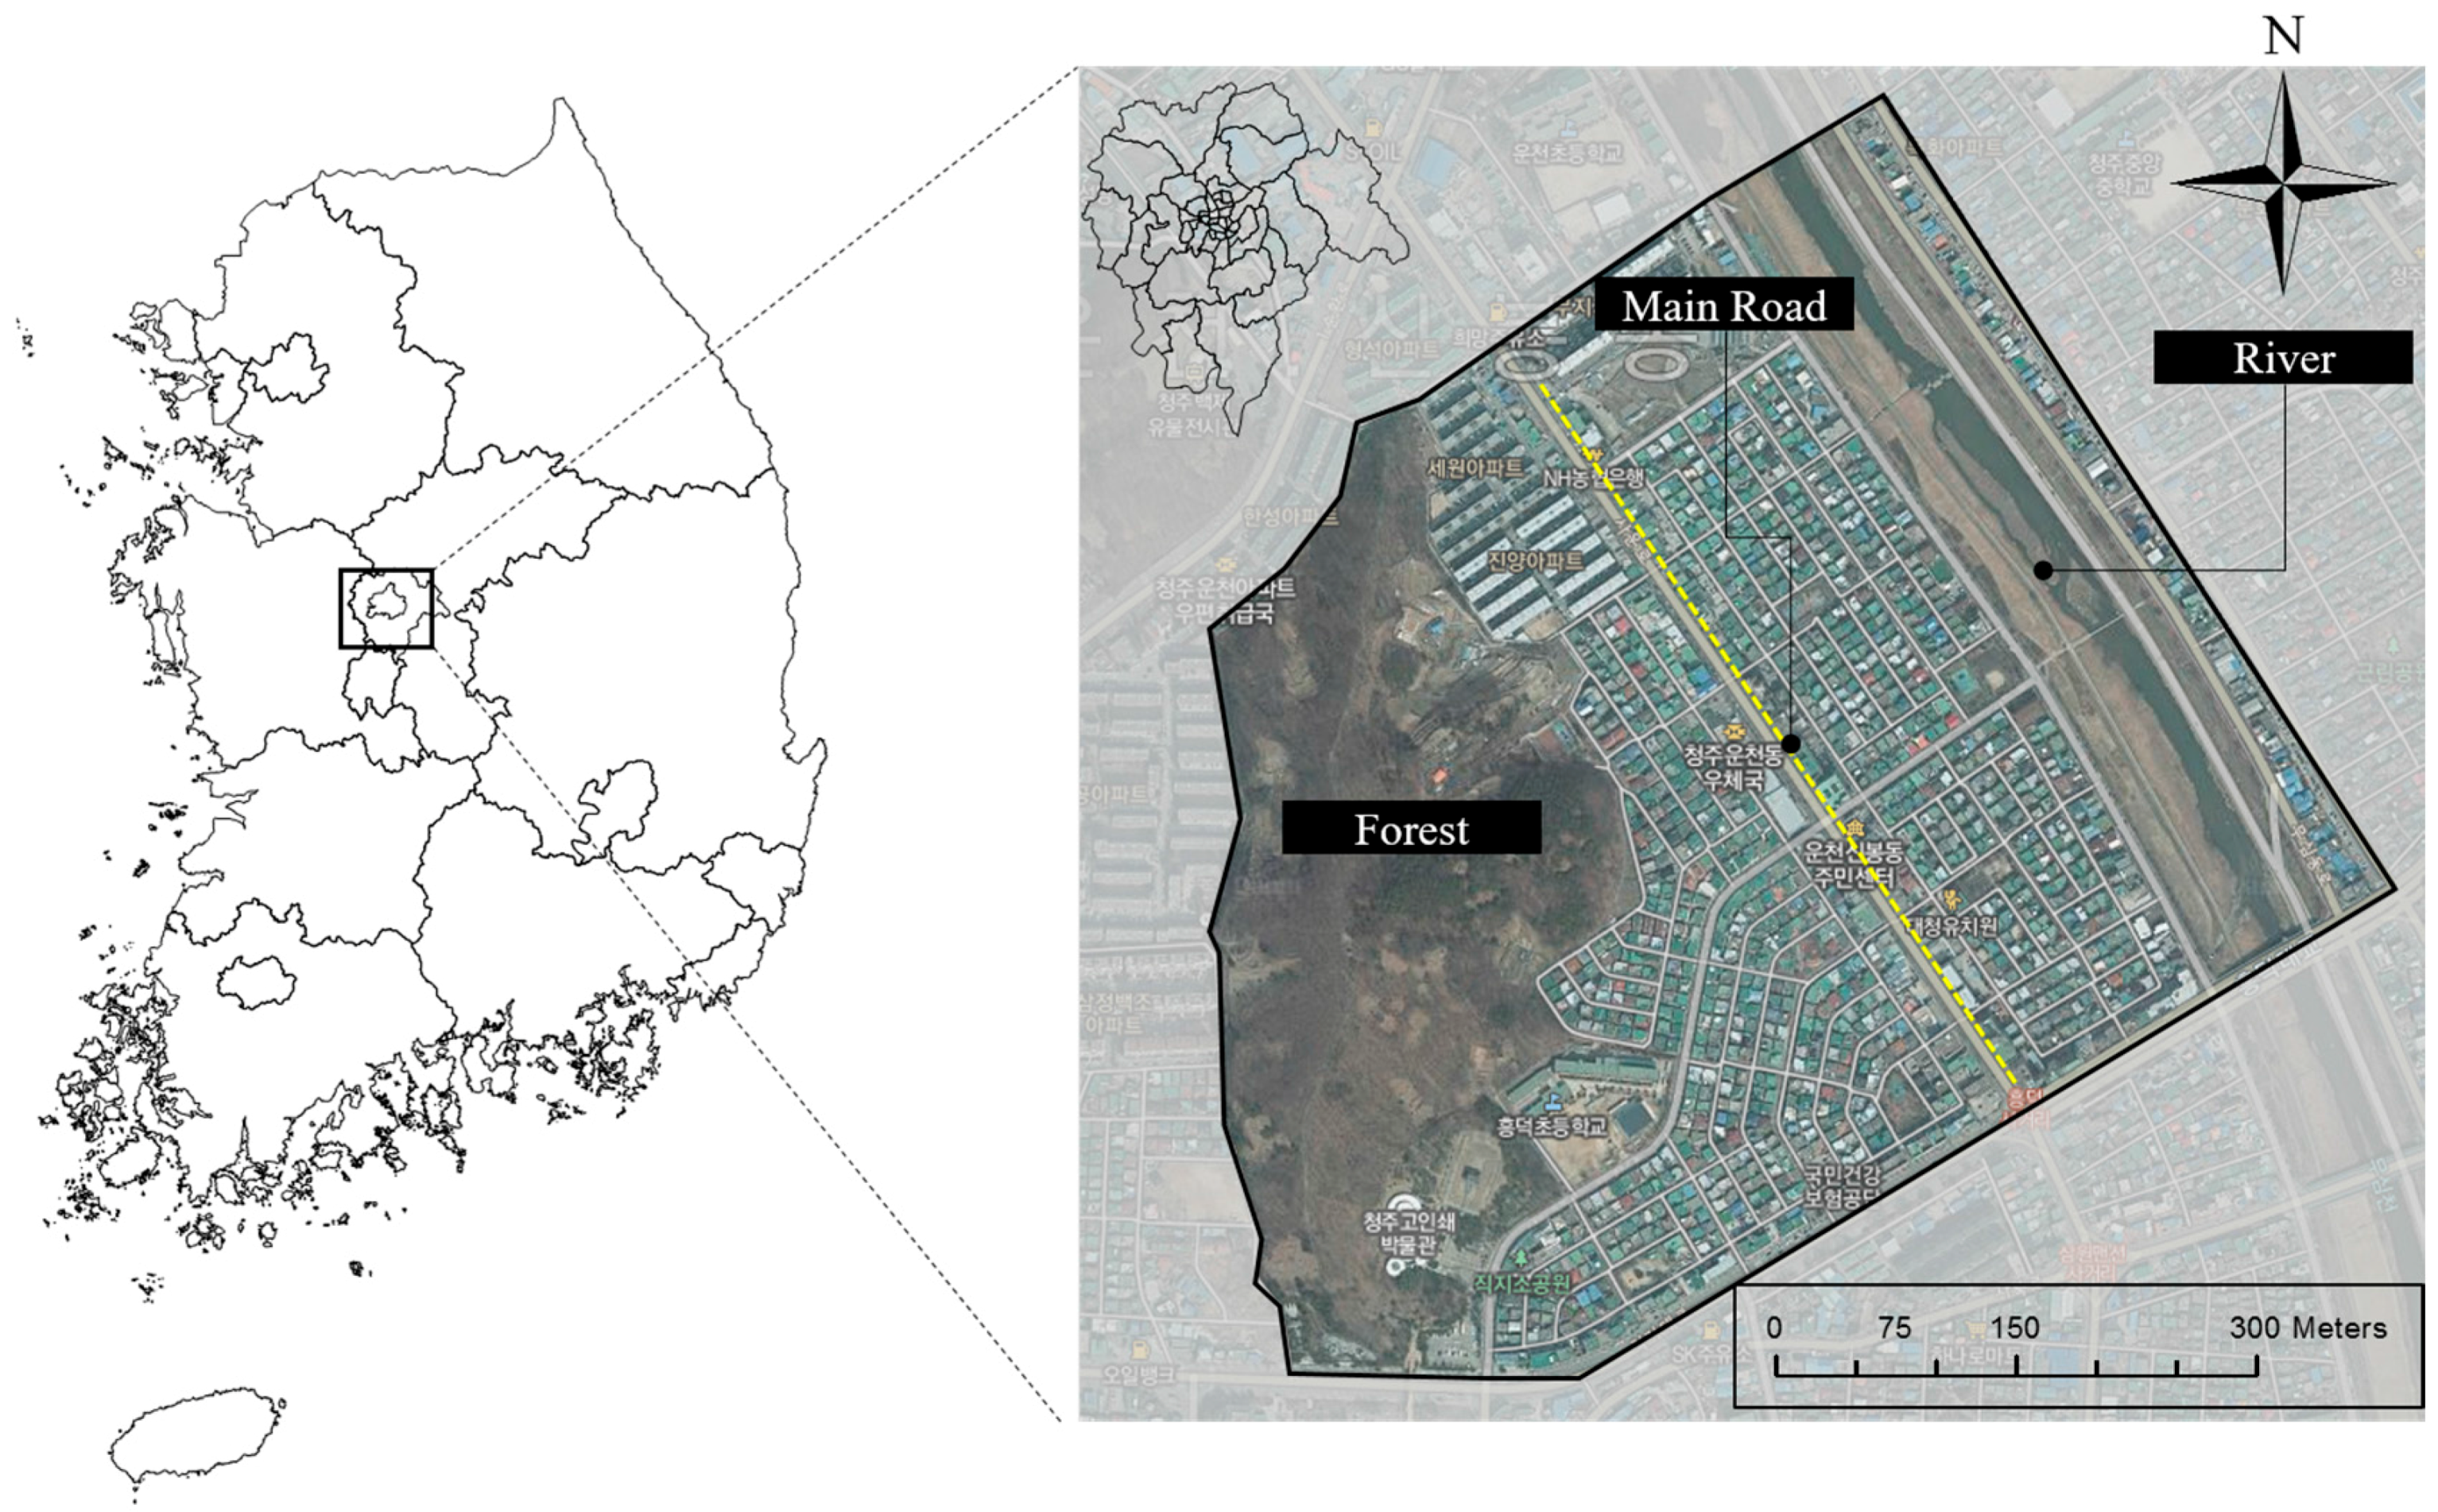
The study site had an region with a mild slope of about 0–2.0 degrees, which accounted for 76.8% of the entire area, and the forested region contained slopes of steeper grades (27.9–30 degrees). Land-use units consisted of forests (34.67%), residences (35.62%), roads (20.55%), river (3.97%), and other (5.19%). According to the Korean Water Environment Information System, the water quality of the site was seriously degraded in 1994 (Korean Water Environment Information System (Source: http://water.nier.go.kr)) but the pollution level has been gradually decreasing since then. In 2015, BOD was measured at 1.6 mg/L, chemical oxygen demand (COD) at 3.4 mg/L, and suspended solids at 5 mg/L. Drainage gates were installed at final water discharge points. The catchment area was 0.47 km2 and the invert of the drainage gate elevation level (EL) was 39.09 m. The built-up urban area was lowland and the residential and commercial areas were concentrated. The buildings were mainly low-rise structures of four or less floors and there was no open space. The roads and streets were covered mainly with impermeable paving materials such as asphalt and sidewalk blocks.
LID-related proposals in the study area included comprehensive plans for storm and flood damage and an open space plan. LID-related policies included an environmental impact assessment program, a land suitability assessment program, a total water pollution program, and a disaster vulnerability assessment program. A rainwater management master plan and a disaster prevention plan were yet to be designed at the time of this study. Because the site had been designated as a water pollution management area, the total pollution caused by urban development was limited to a certain degree. A LID-related municipal ordinance was not in place. According to the 2012 Storm and Flood Damage Reduction Plan of Cheongju City, the site and its vicinity have been designated as a flood risk area.

4.3. Comprehensive Analysis

The study site was located within a project district where construction took place along a river levee (Musimcheon) and the area was considered a flood plain consisting of alluvium. The urban development in the lowlands fell under a large-scale disaster risk in the event of a levee breach or river flooding. Areas with a high risk of flood damage should not be developed but if they are already developed, then the infrastructure should be strengthened. The study site was restricted for development as it had been designated as the water quality management area by the Ministry of Environment. Therefore, it was deemed that a plan should be established to maximize the reduction of nonpoint source pollutants in case of development. It is possible for nonpoint source pollution to increase with increased precipitation in areas with poorly distributed green space and vegetation within built-up urban areas. Lands with a high level of forest fragmentation are often adjacent to existing development areas, thus they might be used for development if necessary. The green networks of the lands with a low level of forest fragmentation in the study area were maintained relatively well (Table 3).

4.4. Basic Plan

Based on the comprehensive analysis, the development directions and targets of the LID-DP were set as presented in Table 4. The targets were set to maintain pre-development levels of each target variable to reduce the rainfall runoff and nonpoint source pollution impact of development. To meet the objective of conserving the natural environment, the law enforcement regulation standard of securing 12% of the development area as green space was adopted. This regulation maintains the green space within a city and protects healthy green zones. The protection of top-level green spaces holding great ecological value was set as an objective.

4.5. Plans for Each Sector

The non-structural techniques applied in the site plan are summarized as follows:
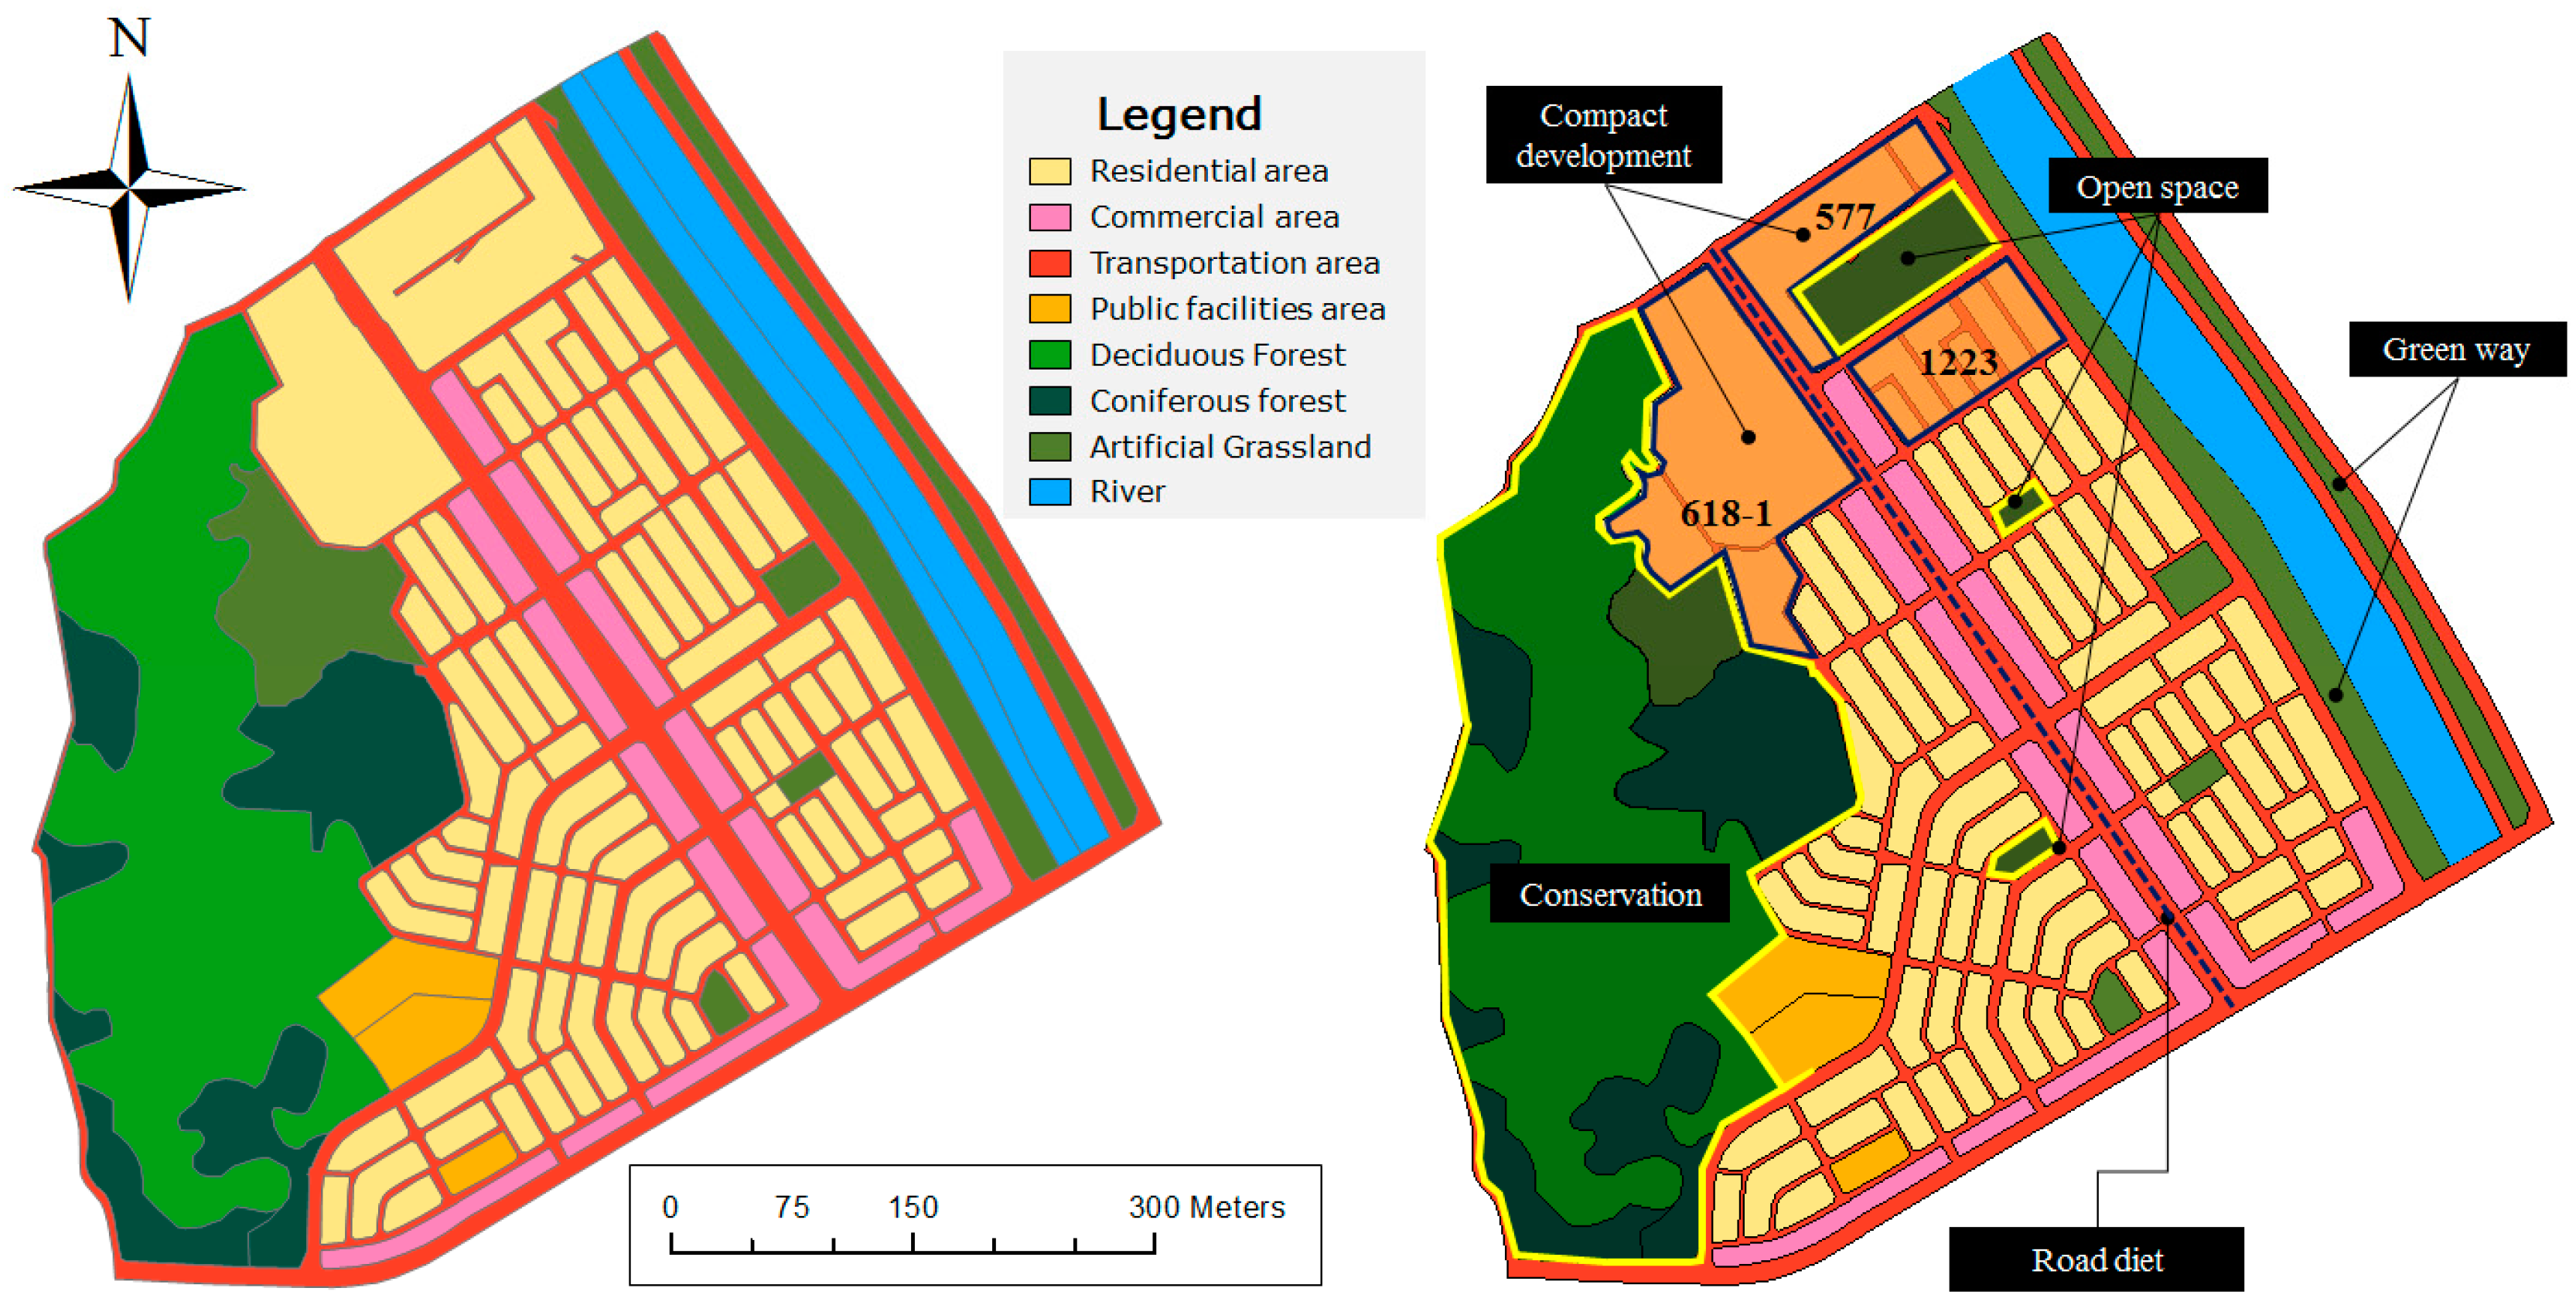
  • The plan was to construct a common residential area in the northern part of the land area allotted for residential use. The area at the address 618-1 was 14,673 m2 and could house nine dongs (districts) and 400 households. The area at the address 577 was 19,166 m2 and could house four dongs and 400 households. The area of land allotted for multi-family houses of four or fewer stories at the address 1223 was 17,219 m2 was switched to a common residential area and then a highly-concentrated development plan was designed. Buildings constructed in the common residential area should have a building coverage ratio of 35% or less, a floor-area ratio of 250% or less, and have 15 floors or less. The high flood risk area was not developed.
  • Considering of the role of business service functions in the biotope and highly concentrated development, 5.8% of the total project area of 56,079 m2 was assigned as semi-residential use.
  • In the entire green project area of 248,332 m2, it was decided that a total of 206,105 m2 was not to be developed. Rather, it was classified as a sensitive area with broadleaf forest, coniferous forest, mixed forest, and marsh. It was decided that a greenway would be installed along the edge of the common residence area and riverside to prevent the influx of nonpoint source pollutants into the river and to connect the space.
  • Parking lots and off-street parking spots were set to be planned. The required allotment of 0.6% of total area (61,183 m2 in this case) as set by the parking lot law was added to the plans. Because of the designed green buffer, the area of the main road was reduced.
  • According to the existing open space plan, 29,506 m2 of park area was set to be designed for the area.
Table 5 presents the land-use planning indicators that apply to the non-structural techniques. Figure 4 presents the land cover map of the initially planned and the plan.
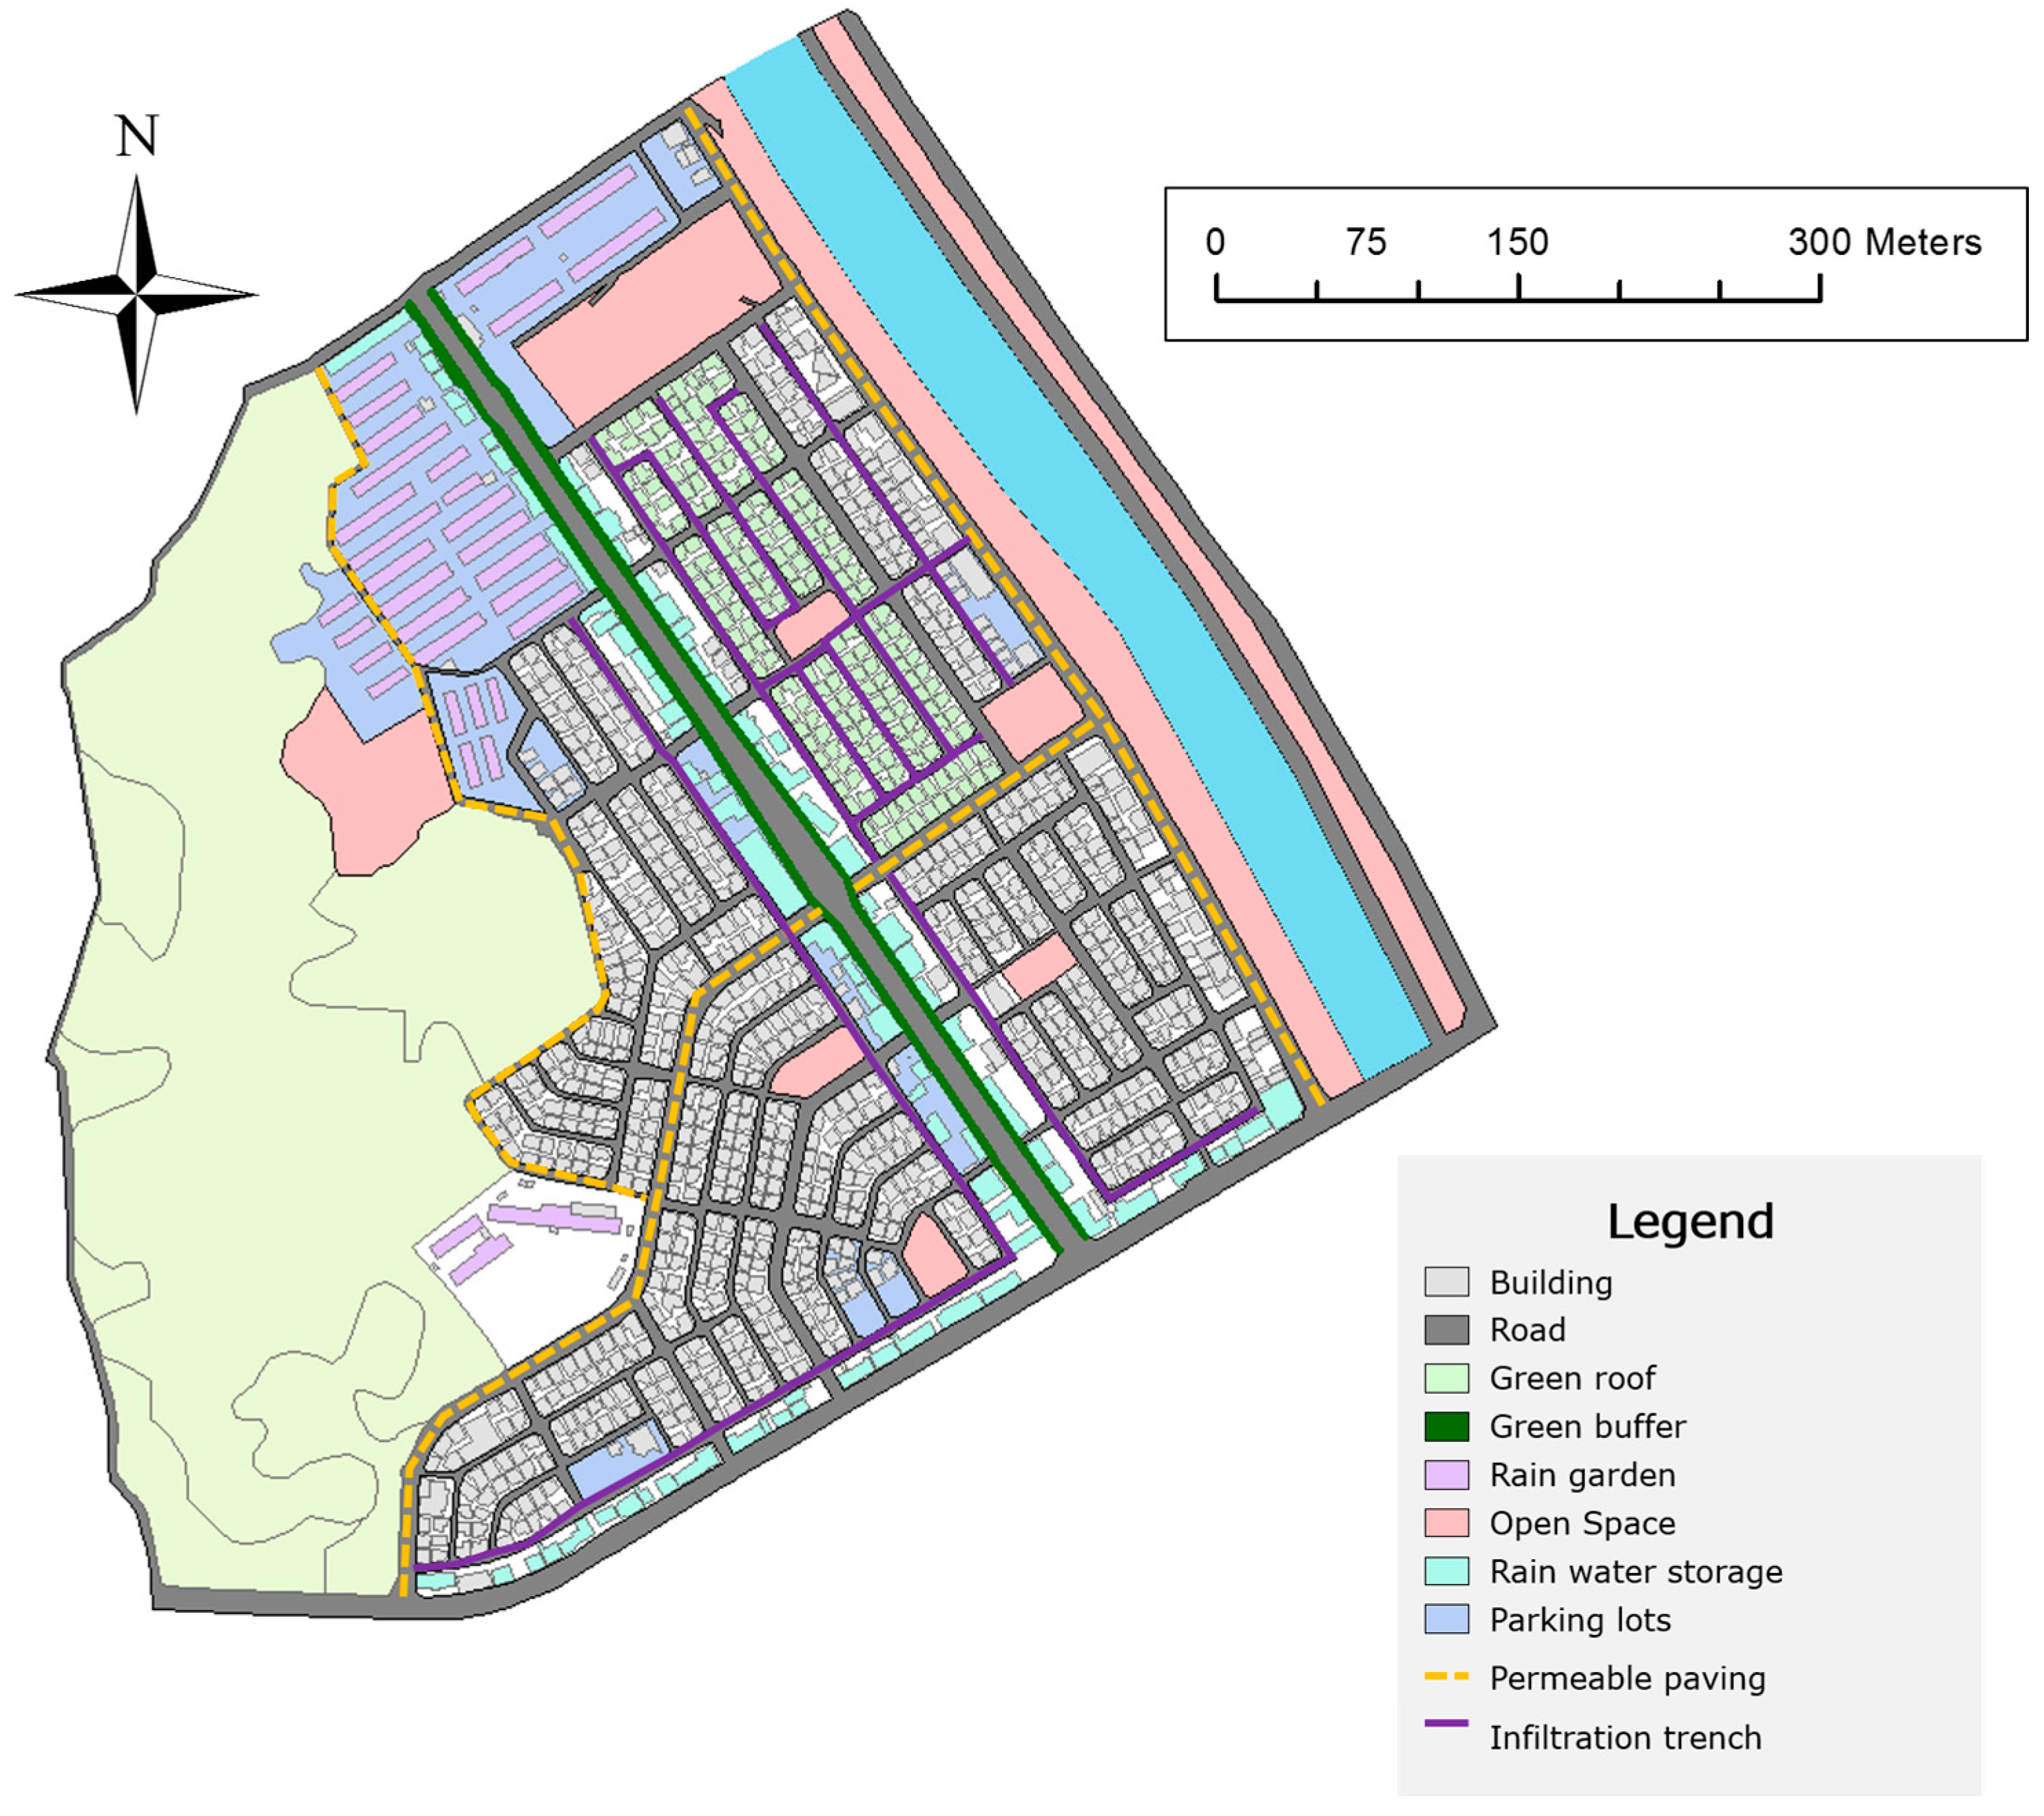
The structural techniques applied to the site plan are as follows:
  • All the parking lots inside the site had permeable paving and beds of vegetation. Permeable paving was not applied to the main roads with considerable traffic.
  • Infiltration trenches and dry wells were installed along the roads and were arranged in a linear form based on the river bearing the flood risk and the forest as a possible water catchment.
  • Considering the site area, rain retention facilities were installed at a commercial arcade where sufficient amounts of rain could be amassed.
  • Green roofs were applied to the buildings that had a sufficient load capacity without the risk of urban flooding.
  • Parks were designed to include vegetation beds, water courses, and permeable paving.
  • Roadway noise prevention facilities and green networks were formed around the roadsides of the south-north arterial roads, which reflected the previously designed green buffer plan (5 m in width).
Table 6 shows the quantified area of each planned LID facility and the basis of calculation according to zoning. Figure 5 presents the plan for the LID facility application according to zoning districts.
After completing the draft of the site plan, it was assessed for its capacity to meet the benefit targets generated in the initial phases of the plan. The assessment results are summarized in Table 7. In the case of reducing nonpoint source pollution, the volume of nonpoint source pollutant generated in the site (Table 7) after application of LID-DP was found to be T-N 1435 kg/year, T-P 70 kg/year, and BOD 1496 kg/year. These figures indicate that the reduction was greater than the planned target (Table 7), with an additional T-N, T-P, and BOD reduction of 584 kg/year, 75 kg/year, and 2404 kg/year, respectively. Compared with the conventional urban development method (Table 7), the volume of nonpoint source pollutant generated in the site after LID-DP (Table 7) showed a maximum (f-100%) reduction of T-N, T-P, and BOD at 37%, 56%, and 72%, respectively (Table 7).
In the case of rainfall runoff reduction, the rainfall runoff generated in the site following the establishment of LID-DP was 14,072,800 mm/year of infiltration and 275,898,290 mm/year of surface runoff. In other words, the infiltration increased by 203,180 mm/year (1.4%) compared to target (Table 8) and the surface runoff decreased by 2,620,551 mm/year (0.9%). Additionally, LID-DP created a maximum 289% increase of infiltration and 40% decrease of surface runoff compared to the conventional urban development method (Table 8).
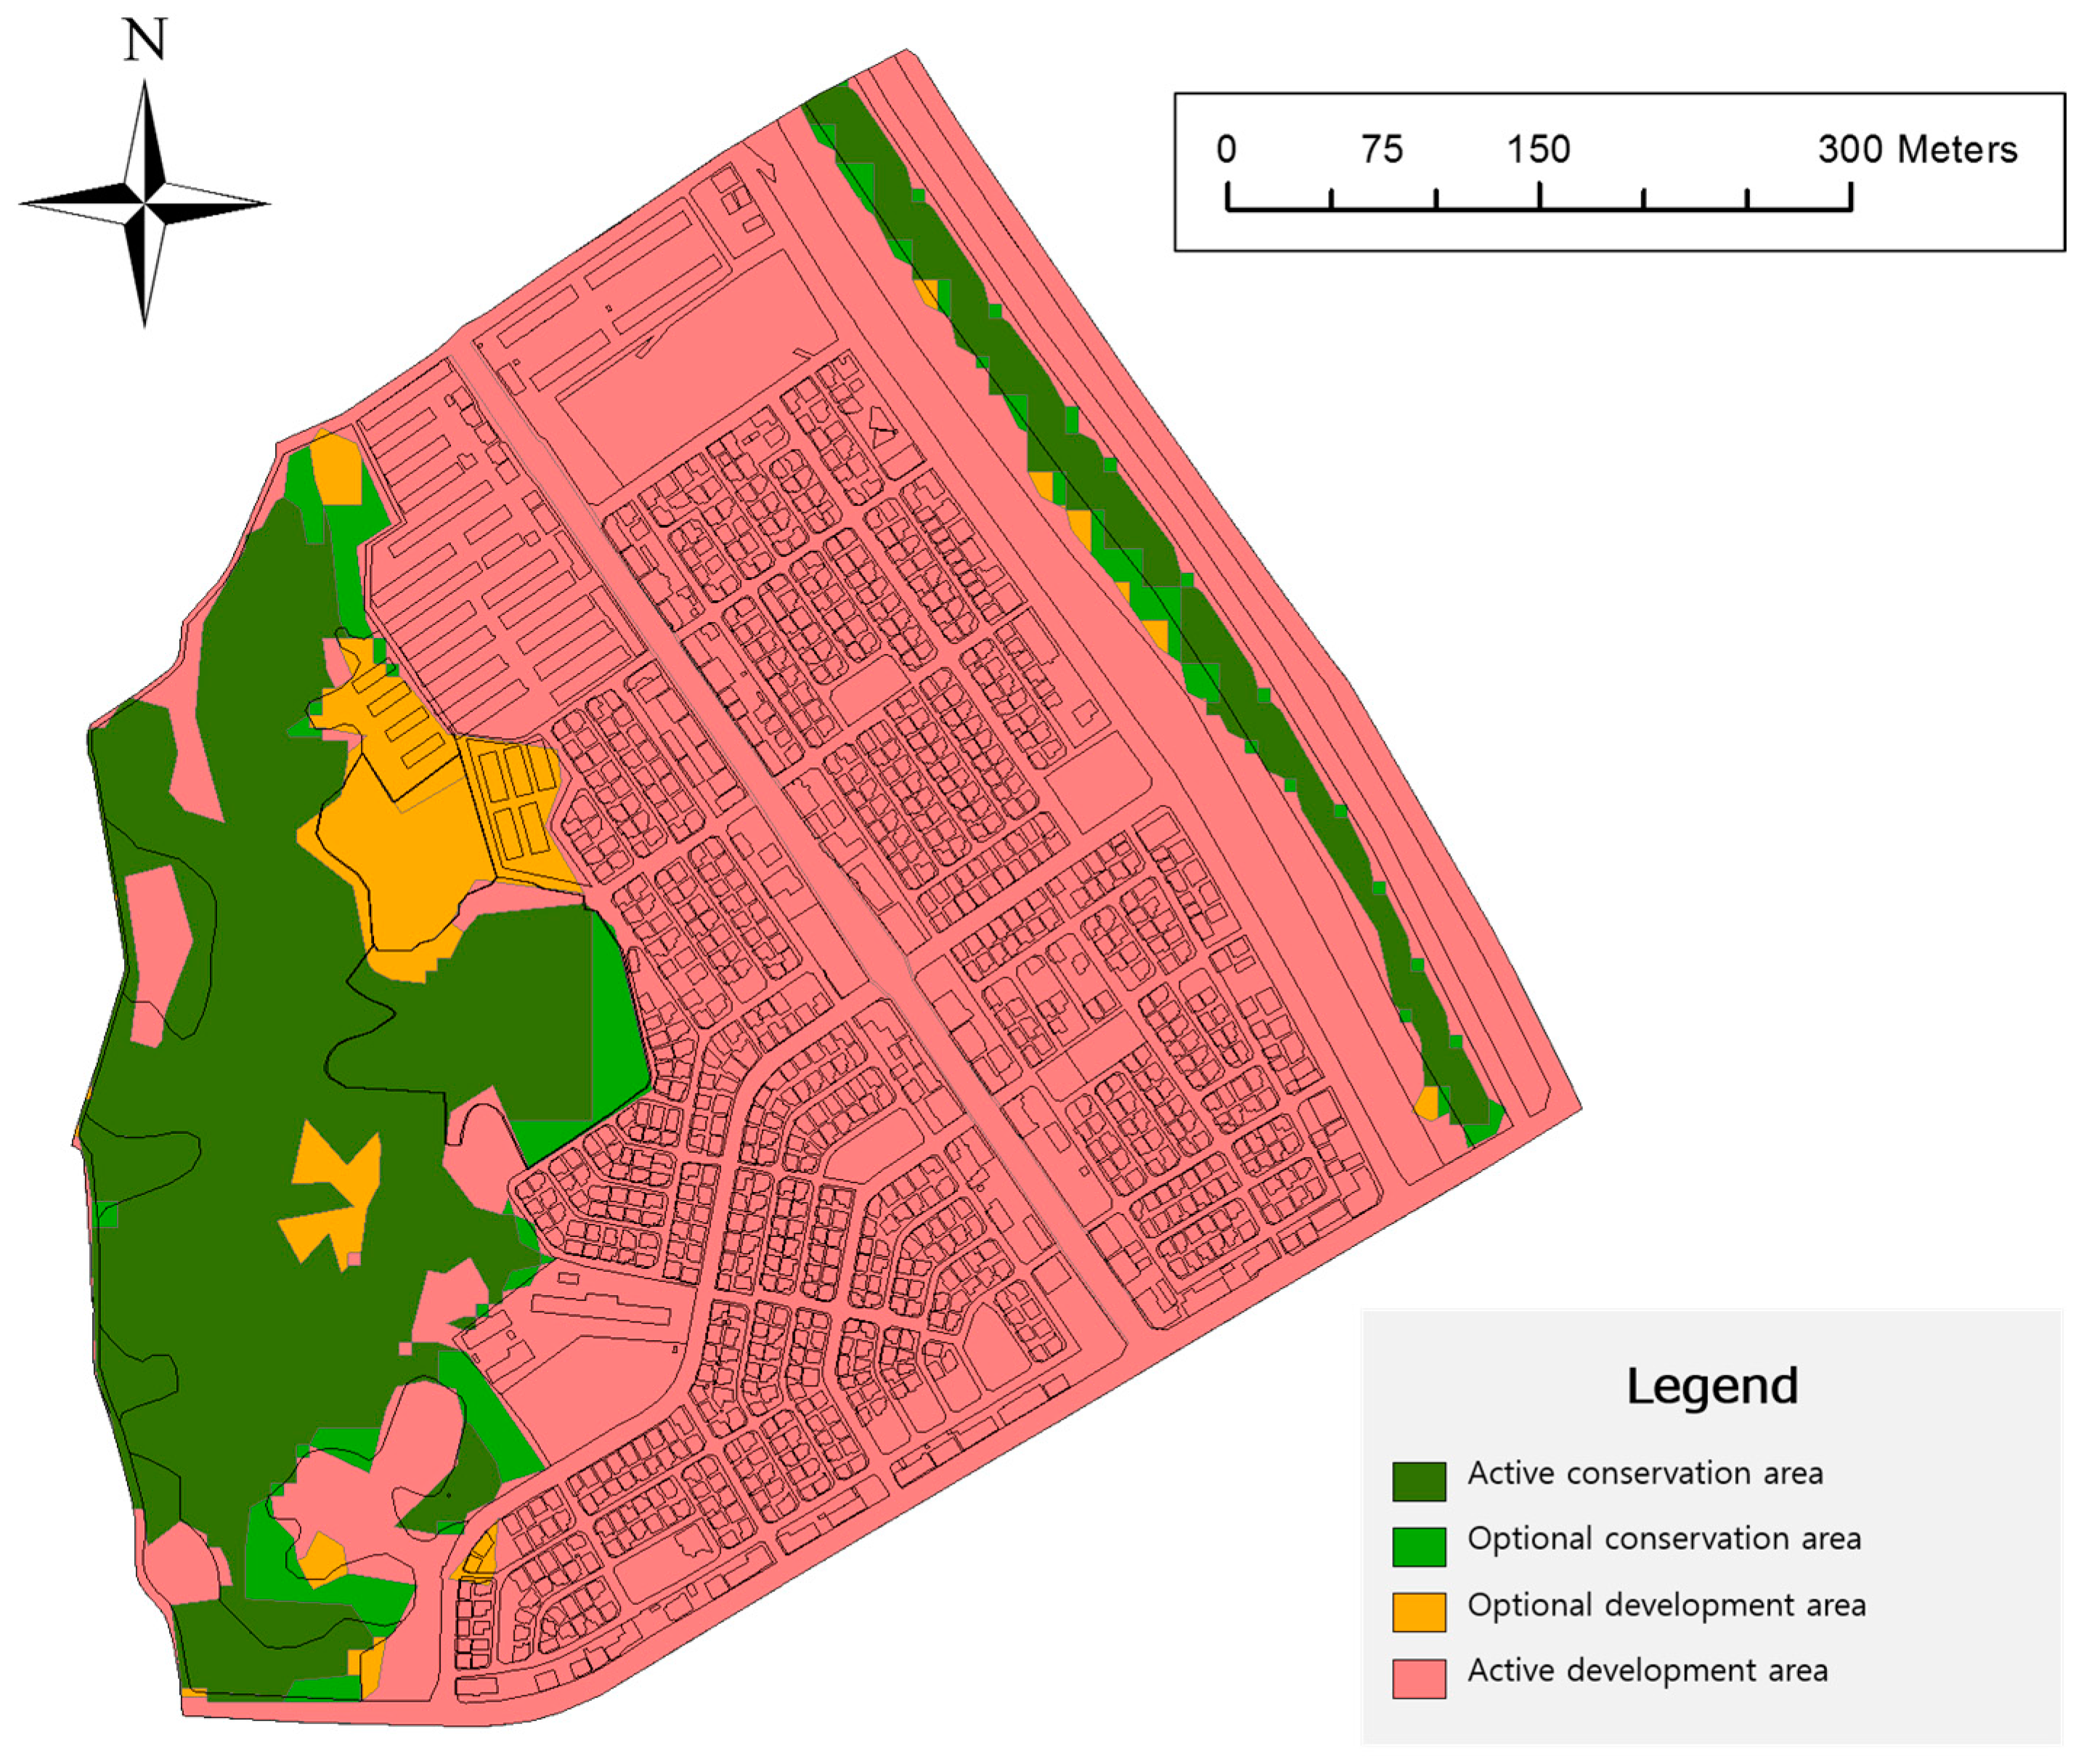
For conservation of the natural environment, the degree of target success was obtained by carrying out spatial overlapping (matching) of the planned land cover map (Figure 4) and land use matrix (Figure 6). According to the LID-DP, the area conserved was 363,373 m2 with an active conservation area of 198,717 m2. This area covered 150,000 m2 of protected green space with high ecological quality and 48,717 m2 of additional conservation area. The optional conservation area also had secured green space at a ratio of 0.94. This is a reduced figure as part of the green space was developed into multi-family housing. Additionally, the ratio of the area for active development was 0.79 and that for the optional development 0.41. This is because the areas set for active development and optional development were not entirely developed, but were instead changed into parks and conservation areas.
In this study, LID-DP has shown that LID in the study area would provide a benefit of reduced T-N, T-P and BOD (113%, 193%, and 199%, respectively), reduced effects of infiltration volume (102%) and surface runoff (101%) and a 132% conservation rate of the natural environment.
Several non-structural techniques were applied in the planning process and it was demonstrated that no target required the implementation of structural techniques. Regarding the nonpoint source pollution, the target to be met through structural techniques (b − a, Table 7) after the application of non-structural techniques was T-N 16 (kg/year), T-P –13 (kg/year), and BOD 146 (kg/year). Regarding the rainfall runoff, (b′ − a′, Table 8), the infiltration was 126,710 (mm/year) and surface runoff was −2,499,908 (mm/year). These figures are quite insignificant considering the basic unit of the LID.
Further, if the entire developable area was developed, the volume of the nonpoint source pollution generated compared to the target, [(f-100%)/(a), Table 7], increased by 140%, 117%, and 176% for T-N, T-P, and BOD, respectively. The volume of rainfall runoff generated compared to the target, [(f′-100%)/(a′), Table 8], increased the surface runoff by 164% and decreased infiltration by 26%.
The land-use matrix, which assesses the conservation of natural environment, not only identified areas for conservation and development, but also offered development directions and standards for the LID depending on the land characteristics in the redesign stage of the site plan draft. This study prioritized active conservation in the areas classified as first-grade for their high ecological value. Here, the water cycle function was maintained for the non-structural techniques. The second-grade areas were set to either be conserved or developed depending on the plans and development objectives. The third- and fourth-grade areas were set to be developed first if necessary. Here, the decline of water cycle function could be minimized or improved with structural and non-structural techniques.
The overall analysis of the study site results showed that the LID-DP in this study sufficiently met set objectives and targets, and the plan was rational based on the direction of development. There is great development pressure on the green space of the study site because the area available for development covers 248,332 m2 (25.6% of the total area), except for the river. Nonetheless, a plan was designed through LID-DP that minimizes pollution and environmental impact following development.

5. Discussion

The LID-DP model was developed and applied in this study and the implications of the results are discussed in this section. The LID-DP model is a flexible technique that mitigates the conflict between development interests and environmental conservation. The results of the application of the LID-DO model demonstrated that the site for this study was capable of meeting environmental standards despite being under pressure for development. It is possible to design or modify a plan according to set objectives that considers ecological aspects of the site. This is because a quantitative analysis of the benefits afforded by structural and non-structural applications was possible and the plan was designed based on the results of the analysis. However, the basic units of LID used in this study were developed for Korea and they may not be equally applicable to other countries. Nonetheless, the simulation of the integrated LID planning process is significant for urban planning because precedent studies have not addressed this.
The application results highlight the importance of non-structural techniques over structural techniques. Many of the established targets were met exclusively or nearly entirely by non-structural techniques applied in the planning process of this study. It was demonstrated that there were few targets to be met through structural techniques. It was also shown that the targets concerning rainfall runoff and nonpoint source pollutants could not be addressed solely through structural techniques in the case of additional development. This indicates that non-structural techniques generate many more environmental benefits than structural techniques. It also indicates that the non-structural techniques preliminarily applied in land-use planning determine the number of structural techniques required. These results are supported by the precedent studies of Blick, Kelly and Skupien [3] Blick, Kelly and Skupien [3] and SEMCOG [4], which showed the importance of non-structural techniques, including the cluster development method and green space conservation. Effective application of non-structural techniques can minimize the need for structural techniques, enhance environmental quality, and increase the feasibility of projects.
The LID-DP model developed in this study is a tool for the application of LID in urban planning. The problem with the existing LID planning process is that it ignores the mechanism of establishing urban plans. For example, it is possible to apply LID in the planning process of pilot projects or certain urban development projects led by public entities. However, development projects directed by private enterprises do not perceive LID as a procedure integrated into the planning process. Related-LID regulations are reviewed only after development plans are completed at the final stage of approval. Project leaders are not held accountable for the environmental problems associated with the development; they are mostly concerned about passing the environmental regulation standards out of business interests. The claim to enhance the incentives for LID is not valid in the circumstances where there is no model established for LID application. If the incentive has already been secured or is not needed, funds cannot be invested for obtaining more incentives through LID applications. Raising the cap on the incentive is not feasible because it would affect the concept of the entire city and its urban planning.
Another reason for the development of an integrated model is the need to link LID with other planning processes and institutions such as the Environmental Impact Assessment Program, Total Water Pollution Program, Rainwater Management Program, and Flood Management Plan. The relationship between these elements is not very strong because the range of their range of procedures in application to urban planning are largely different, and thus, confusion is created between governmental institutions. In the LID-DP model established throughout this study, LID-related plans can be classified for assessment according to the chosen principles and objectives, and the content of LID-related plans can be materialized for application through target setting. Once a series of standardized processes is set, conflicts between the government ministries will be minimized.

6. Conclusions

The objective of this study was to develop and apply an LID-based district unit planning model (LID-DP). The study results can be summarized as follows: (1) The developed LID-DP model reduced the amount of post-development nonpoint source pollutants and rainfall runoff. The model could also minimize the environmental impact of the development. Additionally, it is possible to carry out systematic planning according to development direction and targets whole considering ecological aspects; (2) The importance of non-structural techniques was tested in this study. Non-structural techniques, which are usually applied in preliminary terms in land-use planning, were shown to achieve environmental benefits more effectively than structural techniques do. They also allowed for the enhancement of project economic feasibility by minimizing the required application of structural techniques; (3) Our LID-DP model minimizes the procedural conflicts between government institutions and prevents the vested interest of businesses through enforceable laws.
The LID-DP model supports public policies in determining the direction of community growth and environmental outcomes. Environmental regulations are policies that proactively manage the environmental pollution caused by development. Residents in regions where environmental regulations are enforced sometimes express strong opposition to the environmental regulation because it can limit regional development.
For this reason, the government has introduced several incentives for developing communities under environmental regulations; however this contrarily reduced the effectiveness of environmental policies. LID holds a special implication to communities exposed to tough environmental regulations. The application of LID assists communities in meeting environmental standards and at the same time contributes to economic and social urban regeneration. Previous studies also suggest that LID application generated economic and social benefits as well as environmental benefits. In future studies, development of methodologies for ecosystem service analysis are recommended to explore the social and economic benefits of LID. This research will help urban development meet environmental standards and create a decision-making tool that guarantees the continued development of communities.

Acknowledgments

This work is supported by the Korea Agency for Infrastructure Technology Advancement (KAIA) grant funded by the Ministry of Land, Infrastructure, and Transport (Grant 1615007273). Furthermore, this paper was published as a conference article presented at the International Low Impact Development Conference 2016, held in Portland, Maine, 29–31 August 2016.

Author Contributions

Cheol Hee Son and Kyoung Hak Hyun conceived the idea for the analysis and drafted the manuscript. Jong In Back contributed to data collection of socioeconomic factors. Yong Un Ban was the supervisor of the original thesis from which this paper is drawn. All authors have read, provided feedback on, and approved the final manuscript.

Conflicts of Interest

The authors declare no conflict of interest.

References and Notes

  1. Environmental Protection Agency (EPA). Low-Impact Development Design Strategies: An Integrated Design Approach; Department of Environmental Resources, Programs and Planning Division: Prince George’s County, MD, USA, 1999.
  2. Environmental Protection Agency (EPA). Reducing Stormwater Costs through Low Impact Development (Lid) Strategies and Practices; United States Environmental Protection Agency: Washington, DC, USA, 2007.
  3. Blick, S.A.; Kelly, F.; Skupien, J.J. New Jersey Stormwater Best Management Practices Manual; Department of Environmental Protection, State of New Jersey: New Jersey, NJ, USA, 2004.
  4. Southeast Michigan Council of Governments (SEMCOG). Low Impact Development Manual for Michigan: A Design Guide for Implementors and Reviewers; Southeast Michigan Council of Governments: Detroit, MI, USA, 2008. [Google Scholar]
  5. Tzoulas, K.; Korpela, K.; Venn, S.; Yli-Pelkonen, V.; Kazmierczak, A.; Niemela, J.; James, P. Promoting ecosystem and human health in urban areas using green infrastructure: A literature review. Landsc. Urban Plan. 2007, 81, 167–178. [Google Scholar] [CrossRef]
  6. Cirillo, C.; Podolsky, L. Health, Prosperity and Sustainability: The Case for Green Infrastructure in Ontario; Green Infrastructure Ontario Coalition: Downsview, ON, Canada, 2012. [Google Scholar]
  7. Hyun, K.-H.; Lee, J.-M. Characteristics of heavy metals in soil in infiltration splash blocks and rain gardens for management of roof runoff from apartment buildings. Desalin. Water Treat. 2013, 51, 4146–4154. [Google Scholar] [CrossRef]
  8. Ahern, J. Green infrastructure for cities: The spatial dimension. In Cities of the Future: Towards Integrated Sustainable Water and Landscape Management; IWA Publishing: London, UK, 2007. [Google Scholar]
  9. Grant, J.; Gallet, D. The Value of Green Infrastructure: A Guide to Recognizing Its Economic, Environmental and Social Benefits; Center for Neighborhood Technology: Chicago, IL, USA, 2010. [Google Scholar]
  10. Clements, J.; St Juliana, A.; Davis, P. The Green Edge: How Commercial Property Investment in Green Infrastructure Creates Value; Natural Resources Defense Council: New York, NY, USA, 2013. [Google Scholar]
  11. Godwin, D.; Parry, B.; Burris, F.; Chan, S.; Punton, A. Barriers and Opportunities for Low Impact Development: Case Studies from Three Oregon Communities; Oregon Sea Grant: Corvallis, OR, USA, 2008. [Google Scholar]
  12. Earles, A.; Rapp, D.; Clary, J.; Lopitz, J. Breaking down the barriers to low impact development in Colorado. In Proceedings of the World Environmental and Water Resources Congress 2009, Kansas City, MO, USA, 17–21 May 2009.
  13. Jia, H.; Yao, H.; Tang, Y.; Shaw, L.Y.; Field, R.; Tafuri, A.N. Lid-bmps planning for urban runoff control and the case study in China. J. Environ. Manag. 2015, 149, 65–76. [Google Scholar] [CrossRef] [PubMed]
  14. Kang, J.-E.; Hyun, K.-H.; Park, J.-B. Assessment of low impact development (lid) integrated in local comprehensive plans for improving urban water cycle. J. Korean Soc. Civ. Eng. 2014, 34, 1625–1638. [Google Scholar] [CrossRef]
  15. Seo, H.-J.; Kim, D. A methodology of land suitability assessment for green infrastructure applications. J. Korea Plan. Assoc. 2015, 50, 91–108. [Google Scholar] [CrossRef]
  16. Lewinsohn, L. Planning Policy and Low Impact Developments. Master’s Thesis, CAT and University of East London, London, UK, 2008. [Google Scholar]
  17. Environmental Protection Agency (EPA). Low Impact Development (Lid): A Literature Review; United States Environmental Protection Agency: Washington, DC, USA, 2000.
  18. Commission, A.R. Georgia Stormwater Management Manual; Atlanta Regional Commission: Atlanta, GA, USA, 2001. [Google Scholar]
  19. Hinman, C. Low Impact Development. Technical Guidance Manual for Puget Sound. Available online: http://www.psp.wa.gov/downloads/LID/LID_manual2005.pdf (accessed on 16 Janurary 2016).
  20. Minnesota Stormwater Steering Committee. The Minnesota Stormwater Manual; Minnesota Pollution Control Agency: Baxter, MN, USA, 2005. [Google Scholar]
  21. Ackerman, D.; Stein, E.D. Evaluating the effectiveness of best management practices using dynamic modeling. J. Environ. Eng. 2008, 134, 628–639. [Google Scholar] [CrossRef]
  22. Abi Aad, M.P.; Suidan, M.T.; Shuster, W.D. Modeling techniques of best management practices: Rain barrels and rain gardens using epa swmm-5. J. Hydrol. Eng. 2009, 15, 434–443. [Google Scholar] [CrossRef]
  23. Bean, E.Z.; Hunt, W.F.; Bidelspach, D.A. Evaluation of four permeable pavement sites in eastern north Carolina for runoff reduction and water quality impacts. J. Irrig. Drain. Eng. 2007, 133, 583–592. [Google Scholar] [CrossRef]
  24. Guillette, A.; Studio, L.I.D. Achieving Sustainable Site Design through Low Impact Development Practices; National Institute of Building Sciences: Washington, DC, USA, 2010. [Google Scholar]
  25. Lowe, S.A. Sanitary sewer design using epa storm water management model (SWMM). Comput. Appl. Eng. Educ. 2010, 18, 203–212. [Google Scholar] [CrossRef]
  26. Bedan, E.S.; Clausen, J.C. Stormwater runoff quality and quantity from traditional and low impact development watersheds. J. Am. Water Resour. Assoc. 2009, 45, 998–1008. [Google Scholar] [CrossRef]
  27. Dietz, M.E.; Clausen, J.C. Stormwater runoff and export changes with development in a traditional and low impact subdivision. J. Environ. Manag. 2008, 87, 560–566. [Google Scholar] [CrossRef] [PubMed]
  28. Novotny, V. Non Point Pollution and Urban Stormwater Management; CRC Press: Boca Raton, FL, USA, 1995; Volume 9. [Google Scholar]
  29. Zielinski, J. The benefits of better site design in residential subdivisions. Watershed Protect. Tech. 2000, 3, 633–646. [Google Scholar]
  30. Ministry of Land, T.A.M.A. Calculation Method of Design Flood Quantity. 2012. [Google Scholar]
  31. Kwon, H. Quantitative Assessment of Nonpoint Source Load by Applying Watershed Model andl Level-2ll and Cover Map; Kyungpook National University: Daegu, Korea, 2012. [Google Scholar]
  32. Lester, J.P. A New Federalism? Environmental Policy in the States; Environmental Policy in the 1990s. In Proceedings of the Annual Meeting of the Western Political Science Association, Salt Lake City, UT, USA, March–April 1989.
  33. Rainwater Management Master Plan: Seoul, Korea, 2013. Available online: http://env.seoul.go.kr/files/2013/08/5201a239c39671.91886698.pdf (accessed on 18 Janurary 2017).
  34. Ministry of Environment. Law Enforcement Regulation Related to Water Reuse Promotion and Support: Sejong, Korea. 2016. Available online: http://www.law.go.kr/lsInfoP.do?lsiSeq=180416&efYd=20160728#0000 (accessed on 18 Janurary 2017). [Google Scholar]
Figure 1. The Korean Urban Planning System.
Sustainability 09 00145 g001
Figure 2. Low impact development based district unit planning model.
Sustainability 09 00145 g002
Figure 3. Study test site, the Uncheon district of Uncheon-dong in Cheongju City of Chungcheongbuk-do Province, Republic of Korea.
Sustainability 09 00145 g003
Figure 4. Land cover map of the initially planned (left) and plan (right).
Sustainability 09 00145 g004
Figure 5. The plan for the LID facility application.
Sustainability 09 00145 g005
Figure 6. The results of the evaluation by land use matrix.
Sustainability 09 00145 g006
Table 1. Items for preliminary survey, based on Korean Planning System.
Study ItemRelated PlanRelated Institution
[Topography]
Slope, impervious surface rate; land-use status; and land cover map
[Hydraulics and hydrology]
Precipitation; locations of retarding basins, reservoirs, and sewer pipes; inundation trace map; and records of wind and flood damages (flood risk factors)
[Water quality]
Status of domestic and industrial waste waters; location of waste and waste materials facilities; and river water quality (total nitrogen, TN; total phosphorous, TP; and biological oxygen demand, BOD)
[Ecology and green belt]
Ecology, vegetation, green belt, sensitive areas, protected plants, and biotope
[Higher-level urban planning]
Metropolitan city plan; city master plan; and urban management plan
Review of LID-related elements (land-use plan, park, infrastructure, and environmental conservation)
[Related plans]
Rainwater management master plan, comprehensive wind and flood reduction plan, disaster prevention plan, comprehensive water resources plan, waterfront construction plan, and sustainable new town plan
[Other elements]
Open space survey plan, mapping plan for sensitive areas, road width plan, infrastructure plan, and materials plan
Total Water Pollution Program
Environmental Impact Assessment Program
Land Suitability Assessment Program
Disaster Vulnerability Assessment Program
Table 2. The division of areas by land drainage and environmental conservation value using the land-use matrix.
CategoryKorean Environmental Conservation Value Assessment Map (ECVAM) Score
Very HighHighModerateLowVery Low
Land drainage rateVery good11134
Good11234
Moderate11234
Not moderate12344
Bad12344
Very bad12444
Table 3. Development issues and potential of the study area.
CategoryReduction of Rainfall RunoffReduction of Nonpoint Source PollutantsConservation of Natural Environment Areas
Issue
Poor inner basin drainage
Cross-sectional area of good pipes insufficient
Drainage basin houses residential and commercial areas
Large impervious surface in the built-up area
Flood level EL of Musimcheon River in every 100 years is 42.20 m
Areas controlled by total water pollution program
Many nonpoint source pollutants are generated in the urban area
The level of forest fragmentation in the built-up urban area is high
The level of impermeable paving in the built-up urban area is high (A 100% impermeable surface accounts for 57.7% of the total area).
Development potential
Possible to integrate to comprehensive plans for storm and flood damage
71% of the area contains good quality soil
Good water quality (Level 2)
Plan for open space and possible to link to land suitability assessment.
Distribution of development in the built-up urban area is small thus little environmental damage to date
Table 4. Development direction targets of the LID-DP.
CategoryReduction of Rainfall RunoffReduction of Nonpoint Source PollutantsConservation of Natural Environment Areas
Development direction
Maintain the pre-development rainfall runoff level
Maintain the pre-development nonpoint source pollutant level
Actively protect ecologically excellent green space
Prioritize the development of areas with low conservation value
Achievement target through LID
Target volume of permeation: 13,869,620 mm/year
Target volume of surface runoff: 278,518,841 mm/year
TN: 2019 kg/year
TP: 145 kg/year
BOD: 3900 kg/year
Conservation of natural environment areas of over 150,000 m2
Table 5. Land use planning indicators relevant to the study area that apply to non-structural techniques.
CategoryArea (m2)Percentage (%)Comments
InitiallyPlanInitiallyPlan
Total968,661968,661100.0100.0-
Site for residencesSubtotal338,602335,58635.0 34.6 -
Single-family house245,263191,18725.3 19.7 Additional plan for one management office (260 m2), one seniors center (260 m2), and fitness facilities for residents (750 m2)
Multi-family house37,26088,3203.8 9.1 35% or less building coverage ratio, 250% or less floor area ratio, and 15 or fewer floors in height
Semi-residence56,07856,0785.8 5.8 Renovate the infrastructure in the commercial district
Site for public facilitiesSubtotal563,761566,77758.2 58.5 -
Roads143,665137,69314.8 14.2 Newly constructed
Parking lot58,11961,1836.0 6.3Additional plan for off-street parking areas
Government office21,23621,2362.2 2.2 -
Open space63,98793,4936.6 9.7 Additional construction of a park of 29,506 m2
Green space248,332253,17025.6 26.1 Integrate the green buffer plan which had been previously designed.
OtherFarmland28,42002.9 0.0 -
River66,29766,2976.8 6.8 -
Table 6. Quantified area of planned LID facilities and basis of the calculation.
Structural TechniqueArea of Application (m2)Basis of Calculation (References: [33,34])
Permeable paving and permeable blocks109,498Area of paved section × 90%
Infiltration trench26,710Course of installation section
Dry well and infiltration gutter66,700One per 20 m of infiltration trench
Rain water storage and filtering system6441Area × 0.05
Green roof78,78060% of the area of roof top floor × 0.05
Vegetated ditch10,000Area of installation section
Rain garden (bioslope)28,000Area of installation section
Vegetation bed35,000Area of installation section
Green buffer4832Area of installation section
Table 7. The results of nonpoint source pollutants reduction for LID and conventional urban development.
CategoryT-NT-PBOD
Target (a)16201352986
Volume generated through the application of non-structural techniques (b)16361223132
Volume generated through the application of structural techniques (c)2011921636
Non-structural and structural techniques (b) + (c) = (d)1435701496
Development of additional 30% of the developable area (f-30%)18481293721
Development of additional 60% of the developable area (f-60%)20351424385
Development of additional 90% of the developable area (f-90%)22221555048
Development of additional 100% of the developable area (f-100%)22841595269
Table 8. The results of rainfall runoff reduction for LID and conventional urban development.
CategoryInfiltrationSurface Runoff
Target (a′)13,869,620278,518,841
Volume generated through the application of non-structural techniques (b′)13,996,330276,018,933
Volume generated through the application of structural techniques (c′)76,470120,643
Non-structural and structural techniques (b′) + (c′) = (d′)14,072,800275,898,290
Development of additional 30% of the developable area (f′-30%)10,435,181341,452,638
Development of additional 60% of the developable area (f′-60%)7,514,474391,313,152
Development of additional 90% of the developable area (f′-90%)4,593,767441,173,667
Development of additional 100% of the developable area (f′-100%)3,620,198457,793,839

