Article

Assessment of Ammonia Volatilization Losses and Nitrogen Utilization during the Rice Growing Season in Alkaline Salt-Affected Soils

1
Northeast Institute of Geography and Agroecology, Chinese Academy of Sciences, Changchun 130102, China
2
University of Chinese Academy of Sciences, Beijing 100049, China
*
Authors to whom correspondence should be addressed.
Sustainability 2017, 9(1), 132; https://doi.org/10.3390/su9010132
Submission received: 2 November 2016 / Revised: 12 December 2016 / Accepted: 11 January 2017 / Published: 18 January 2017
(This article belongs to the Section Sustainable Agriculture)

Abstract

:
The objectives of this study were to evaluate the effects of different fertilizer types and application rates on ammonia volatilization loss and to explore nitrogen distribution and nitrogen use efficiency using the 15N isotope tracing technique in different alkaline salt-affected conditions in the Songnen Plain, Northeast China. The results showed a decreasing trend in ammonia volatilization loss from ammonium nitrate and ammonium sulfate, but not that from urea, as the electrical conductivity gradient increased, whereas the reverse trend was found as the pH gradient increased. Ammonia volatilization loss increased in moderately salt-affected soil compared with that in slightly salt-affected soil, particularly during the tillering stage, regardless of the N fertilizer rate. The percentage of N absorbed by rice plants increased from urea but decreased from the soil as the amount of nitrogen was increased. Interestingly, the N retention rate in soil decreased and rice grain yield and nitrogen agronomic efficiency increased as the amount of nitrogen increased in both salt-affected soil conditions. The nitrogen application amount of highest N physiological efficiency was 225 kg·N/ha. Considering high rice production and a minimal environmental threat, we should fully consider controlling ammonia volatilization losses by adjusting the fertilizer type and the crop stage when the fertilizer is applied.

1. Introduction

In modern agriculture, the application of nitrogen (N) fertilizer is important to maintain a high rate of grain production [1]. However, the extensive use of N fertilizer can result in serious environmental problems [2]. The efficiency of the use of nitrogen is important to meet the dual needs of increasing productivity and reducing pollution due to nitrogen losses [3]. Nitrogen use efficiency (NUE) is commonly used to estimate the utilization situation of N in crops at the farm scale and is defined as the ratio of N output and input [4]. Improving NUE and decreasing N loss are critical for sustainable agriculture [5]. Agriculture is the primary source of ammonia volatilization to the atmosphere, accounting for >50% of the global ammonia volatilization, and N fertilizer applications to crops account for the majority of agriculture-related ammonia volatilization [6]. Ammonia emissions from agricultural nitrogen fertilizer application negatively impact both the quality of the environment and human health; therefore, there is a need to develop methods to reduce ammonia volatilization, to reduce the wastage of fertilizer resources, and to improve NUE [7]. Ammonia volatilization through N fertilizer application into soils has been extensively investigated [8,9]. It has been previously reported that cumulative ammonia volatilization is greater in no-tillage soils than in moldboard-plowed soils in laboratory conditions [10]. In direct seeding paddy fields, the type of nitrogen fertilizer was found to be the main factor responsible for ammonia volatilization loss. Control-released urea and N fertilizer deep placement was the suitable N fertilizer type and application method for direct seeding paddy fields in the basal fertilizer stage [11]. Higher rates of ammonia volatilization have been noted in Eastern China, particularly in the paddy fields of the Taihu Lake region [12]. The objective of the previous study was to elucidate the mechanisms involved in ammonia volatilization and the factors (soil properties, climatic conditions, and management practices) that affect ammonia volatilization [13,14]. Rice yield and NUE can be increased, to some extent, by improving fertilization measurement, irrigation, and crop cultivation management levels [15]. To reduce ammonia volatilization, there have been a number of efforts to achieve these goals [16]. Nitrogen losses can be decreased by the application of the main part of N fertilizer later in the growing season than currently practiced [17]. Deep placement of nitrogen fertilizer affects the fate of fertilizer nitrogen through influencing nitrogen transformation and significantly decreasing cumulative ammonia volatilization [18].
In alkaline salt-affected soils, rice has low nitrogen recovery efficiency (RE), mainly due to losses of ammonia volatilization. An important measure improving N agronomic efficiency and reducing the environmental effects of N fertilizers from farmland is to decrease N losses [19]. However, in salt-affected land in Northeast China, there is little published data regarding ammonia volatilization specific to alkaline salt-affected soils, climate, and agricultural practices. Moreover, there is currently no optimum fertilizer application measurement for improving rice yield and NUE. Understanding the interactions among soil salinity, alkalinity and the nitrogen application level is great importance for improving rice yield and fertilizer use efficiency in alkaline salt-affected soils. The objectives of the present study were to (1) evaluate ammonia volatilization loss from alkaline salt-affected soils under different fertilizer applications in the Songnen Plain; (2) assess the influence of environmental conditions on ammonia emissions to reduce environmental pollution; and (3) use the 15N trace technique to investigate nitrogen distribution in rice.

2. Materials and Methods

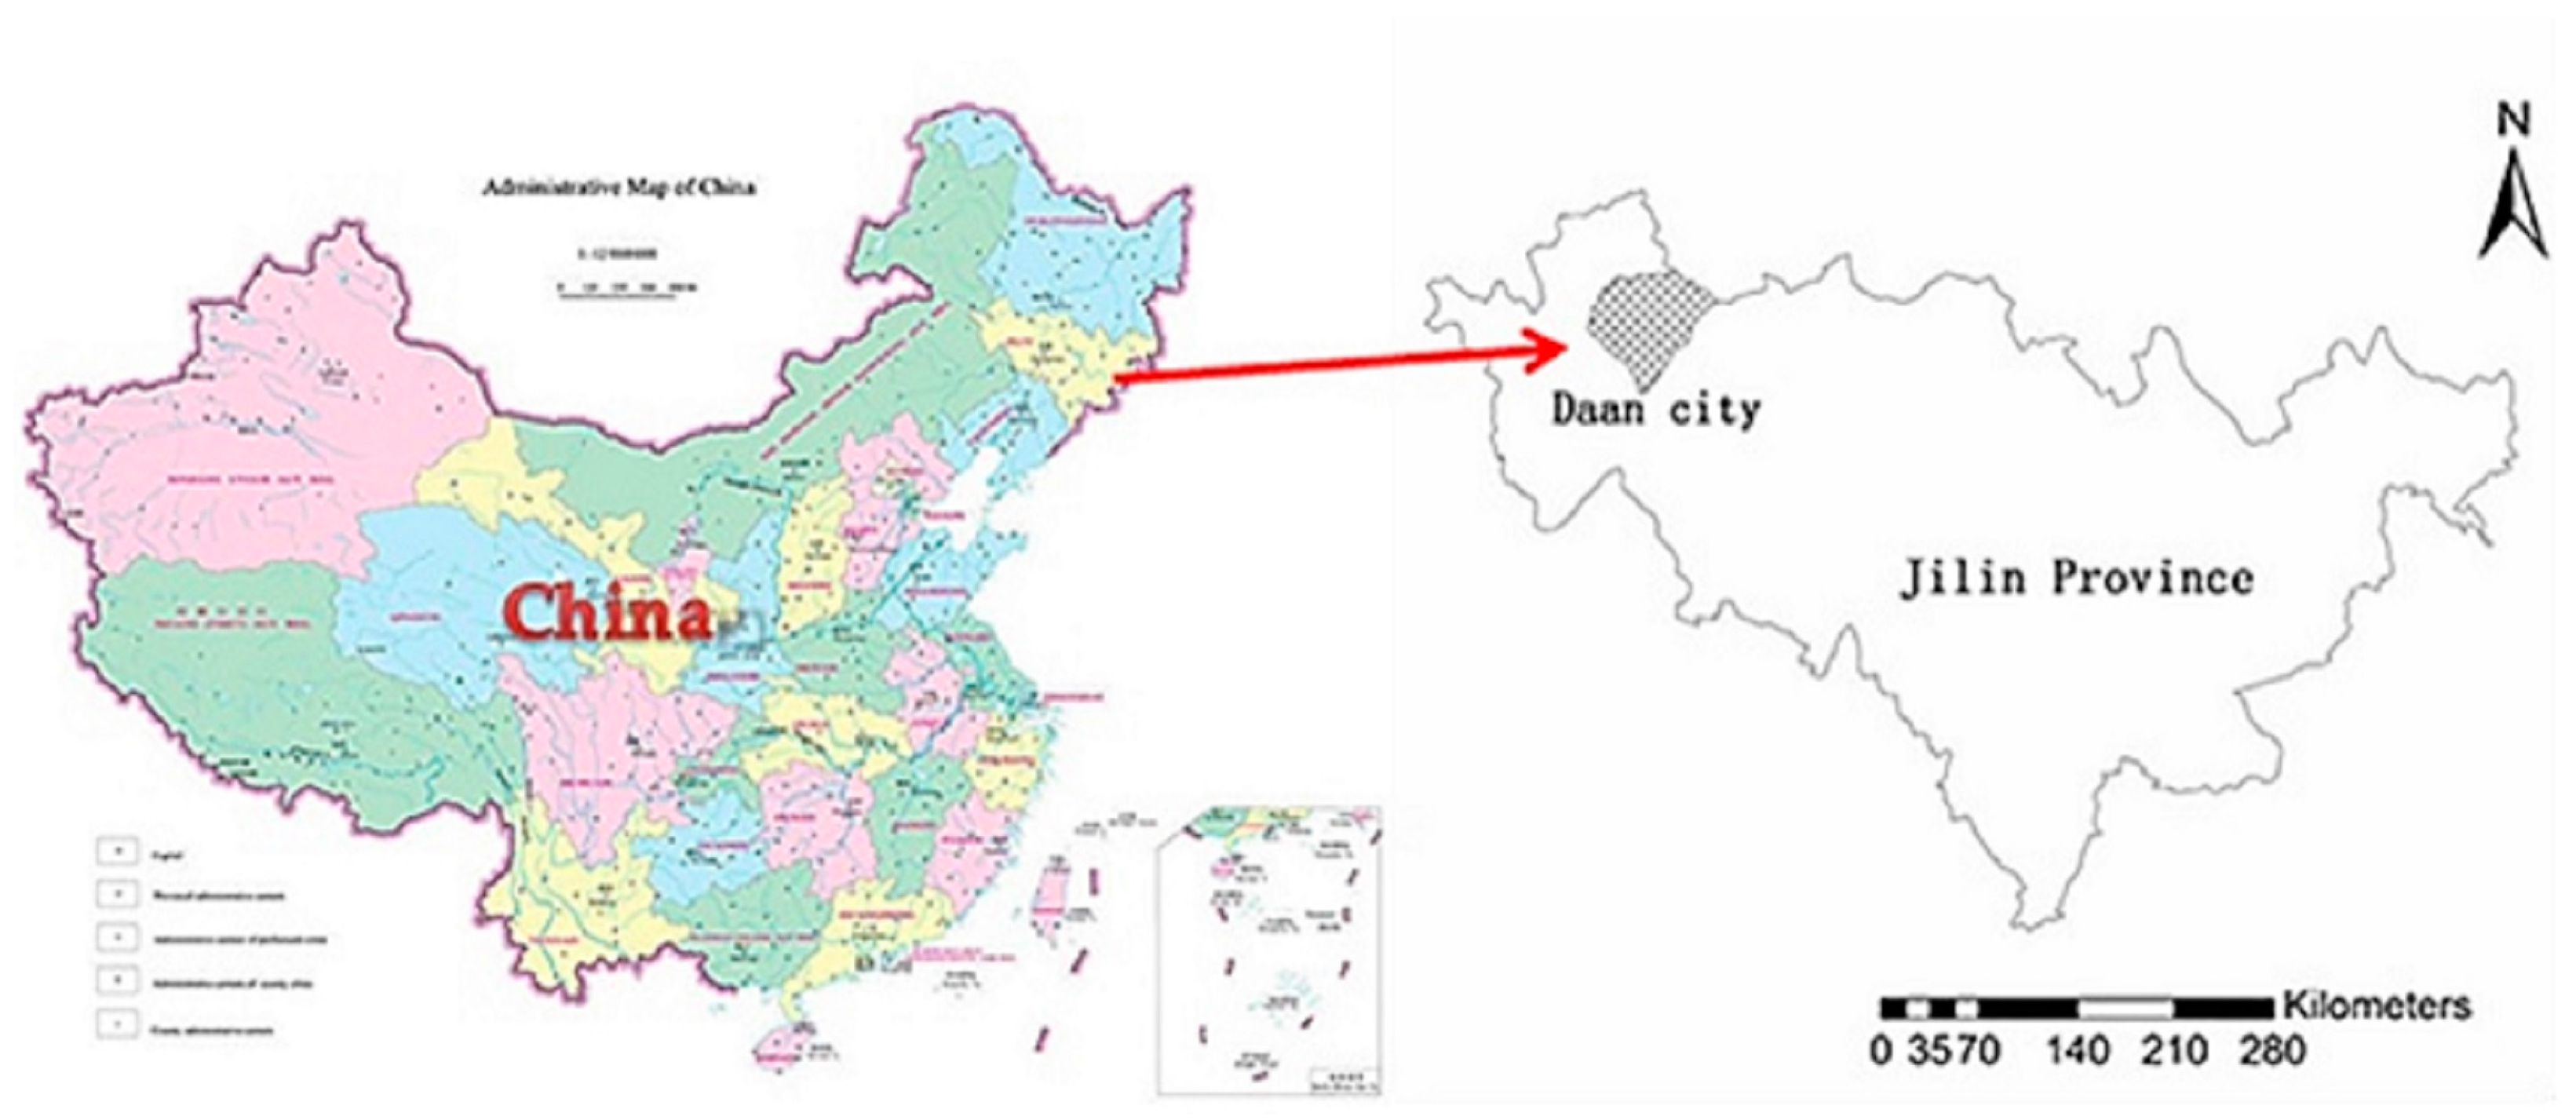
2.1. Experimental Site Description

Two experiments were conducted at the Da’an sodic land experimental station (45°35′N, 123°50′E), Da’an, Jilin, China. The geographical location of the site is shown in Figure 1. The site has a temperate continental monsoon climate with an average annual air temperature of 4.3 °C. The average air temperature during the growing season is 13.7 °C, whereas the average air temperature during the non-growing season is −4.4 °C. The mean annual rainfall is 431.7 mm with approximately 56% concentrated from July to August and annual frost-free period is about 137 days. The soil of the experimental site is classified as alkaline salt-affected soil. The salt component in the soil consists mainly of soda (NaHCO3 and Na2CO3).

2.2. Experiment Design

The effects of fertilizer (application rate of 200 kg·N/ha) on ammonia volatilization losses in a mixture solution were evaluated in a laboratory simulation experiment. Within this experiment, the three factors manipulated were electrical conductivity (EC), pH, and the type of N fertilizer. Three types of N fertilizer were applied: urea (U, N = 46.2%), ammonium nitrate (AN, N = 35%), and ammonium sulfate (AS, N = 21.2%). We used various chemical reagents, namely 0.1 mol/L NaCl, 0.1 mol/L Na2CO3, and 0.1 mol/L NaHCO3 to adjust the pH and EC of the mixture solution. Furthermore, we adjusted each treatment of the mixed solution with deionized water. The adjustments of the mixed solutions were related to the pH and EC required for the chemical reagent dosage and are shown in Table 1 and Table 2. Three types of N fertilizer were applied at the each treatment of the mixed solution. The amount of fertilizer application to the container in this study was determined according to the mixed solution volume. This mixed solution was placed inside of a large, clear glass container. Moreover, a smaller container containing 20 mL dilute sulfuric acid solution (0.05 mol/L) was placed inside the large container. The large containers were preserved by sealing with film. Ammonia in the sealed container was absorbed into the dilute sulfuric acid solution. The experimental containers were placed in an artificial climate box with daytime air temperature maintained at 25 °C and lights on from 06:00 a.m. to 06:00 p.m., and night time air temperature maintained at 16 °C and lights off from 06:00 p.m. to 06:00 a.m. The temperature of the mixture solutions changed with the changes in air temperature. At the same time, the absorption solution was changed every 24 h, and the old solution was tested for ammonia content. All treatments are reported in Table 3 and Table 4. Each treatment had three replications. Ammonia volatilization was evaluated for five consecutive days.
The second experiment conducted in the present study was a pot experiment. Soil was collected from the top 20 cm soil profile of the field containing local alkaline salt-affected soils. According to the content of soil salt and the degree of soil alkaline, there were two soil conditions. One soil was defined as slightly salt-affected soil with lower pH and EC (Table 5), while the other one was defined as moderately salt-affected soil with relatively higher pH and EC (Table 5). The soil properties are listed in Table 5. Experiment soil pH was measured by a pH meter in soil-water suspension in a ratio of 1:5. Soil electrical conductivity (EC) was measured by a DDS-11A conductivity meter in a soil-water suspension ratio of 1:5. The soil organic matter was measured by the potassium dichromate oxidation method. Soil total nitrogen was determined using the Kjeldahl method. Soil alkaline hydrolysis N was measured by the alkali solution diffusion method. Available phosphorus content in samples from soil was measured by the Mo-Sb colorimetric method. Readily available potassium of soil was extracted using 1 mol/L ammonium acetate and measured by a flame photometer. The experiment was conducted during the rice growing season in 2014. All treatments also received a basal application of calcium superphosphate (P2O5 14%) and potassium chloride (K2O 60%) of 100 kg/ha, respectively. The 15N-labeled fertilizer used was urea. (U = 10 atom %). The fertilizer application method used was surface broadcasting. The urea application rates for the treatments are shown in Table 6. The transplanting and basal fertilization (BF), first supplemental fertilization (SF1), and second supplemental fertilization (SF2) application dates were 31 May, 16 June, and 2 July 2014, respectively. At the same time, the corresponding phenological phases of rice were the regreening stage, the tillering stage, and the booting stage, respectively. Ammonia volatilization was tested in the following nine consecutive days after each of fertilizer application dates. The rice variety used throughout the present study was Japonica rice Dongdao 4, one of the elite cultivars used in the alkaline salt-affected soil area in China. The growth period of Dongdao 4 is about 131 days and it is, therefore, one of the earlier middle maturity varieties. Sowing of rice seeds and cultivation of seedlings occurred on 25 April 2014. The rice seedlings were transplanted to pots on 26 May 2014. Each pot was separated into four hills, with each hill containing five seedlings. During the mature period, one hill plant was taken from each pot for every treatment, along with topsoil of 0–20 cm in depth for each pot. Each rice plant was divided into the stem, leaves, and grains and dried for 72 h at 80 °C to a constant weight and weighed. The rest of the three hills’ rice plants in each pot were harvested, and the grain yield statistics were calculated. A randomized complete block design with five treatments was used: a control treatment (CK) and four nitrogen application rates of 75 kg·N/ha (N75), 150 kg·N/ha (N150), 225 kg·N/ha (N225), and 300 kg·N/ha (N300). Each treatment had three replicates. Two kinds of alkaline salt-affected soils were used in 30 pots (60 cm diameter with a depth of 50 cm). The pots were sealed at the bottom and were placed under a portable rainout shelter. The pots were divided into five groups according to fertilizer management. The pots with the same fertilizer management were placed together and buried in the field with 30 cm projecting above ground.
Daily meteorological data, including rainfall, air temperature, wind speed, and soil surface temperature, from 25 May to 20 July in 2014, are shown in Figure 2. During the experiment period, the mean minimum and maximum air temperatures were 17.8 °C and 30.1 °C, respectively. Total rainfall during the experimental period was 140.5 mm from 25 May to 20 July in 2014. The average soil surface temperatures at 8:00 a.m., 02:00 p.m., and 08:00 p.m. were 28.5 °C, 36.8 °C, and 22 °C, respectively. The mean wind speeds at 8:00 a.m., 02:00 p.m., and 08:00 p.m. were 4.7, 5.5, and 3.7 m/s, respectively.

2.3. Measurement of Soil Ammonia Volatilization

Ammonia volatilization was evaluated using the enclosure and indophenol blue spectrophotometry techniques [20,21]. Ammonia in the sealed container was absorbed into a dilute sulfuric acid solution, following which the absorption solution was analyzed by spectrophotometry. Air was passed through a 0.05 mol/L H2SO4 solution to eliminate traces of ammonia.

2.4. Nitrogen Analysis

The total nitrogen contents in rice plant samples and soil samples were determined by the Kjeldahl method. Rice samples (stems, leaves, and grains) were dried, milled, and passed through a sieve. Soil samples were dried at room temperature, milled, and passed through a sieve. All samples were passed through a 100 mesh sieve to determine the concentration of 15N. The 15N concentrations of samples were determined by an isotope ratio mass spectrometer (MAT253). Rice RE, nitrogen derived from fertilizer (Ndff), nitrogen derived from soil (Ndfs), and soil 15N retention rate were estimated using methods described by Hauck and Bremner [22] as shown below:
NA (g/pot) = N (%) × W (g/pot)
15N (g/pot) = NA × ASample (%)/AFertilizer (%)
Ndff (%) = Aplant (%)/AFertilizer (%) × 100
Ndfs (%) =1 − Ndff (%)
15NRPlant (%) = 15NPlant (g/pot)/15NFertilizer (g/pot) × 100
15NRSoil (%) = 15NSoil (g/pot)/15NFertilizer (g/pot) × 100
where NA (nitrogen amount) represents the total nitrogen of a sample, N represents the nitrogen percentage of a sample, W (weight) represents the dry weight of a sample, 15N represents the total 15N in a plant or soil sample, ASample (abundance of sample) represents the 15N abundance in a sample, Aplant (abundance of plant sample) represents the abundance of the 15N in plant samples, AFertilizer (abundance of fertilizer) represents the abundance of 15N in the labeled nitrogen fertilizer, Ndff represents nitrogen derived from fertilizer, Ndfs represents the nitrogen derived from soil , 15NRPlant represents the 15N recovery by the plant, 15NRSoil represents the 15N retention in the soil, and 15NFertilizer represents the total amount of 15N in the 15N-labeled fertilizer per unit area.

2.5. Data Analysis

The effects of different environmental conditions on ammonia volatilization emissions and N uptake by crops were compared by one-way analysis of variance, and the Duncan test was used for separation of means between treatments with IBM SPSS 20.0 statistics software (Armonk, NY, USA, 2011) for Windows. p < 0.05 was considered statistically significant. Graphical presentations were conducted in the R 3.3.2 version(R Development Core Team, Vienna, Austria, 2008) environment, including use of the ggplot2 package, and with Origin 9.1 software (OriginLab Corporation, Northampton, MA, USA, 2013) for Windows.

3. Results

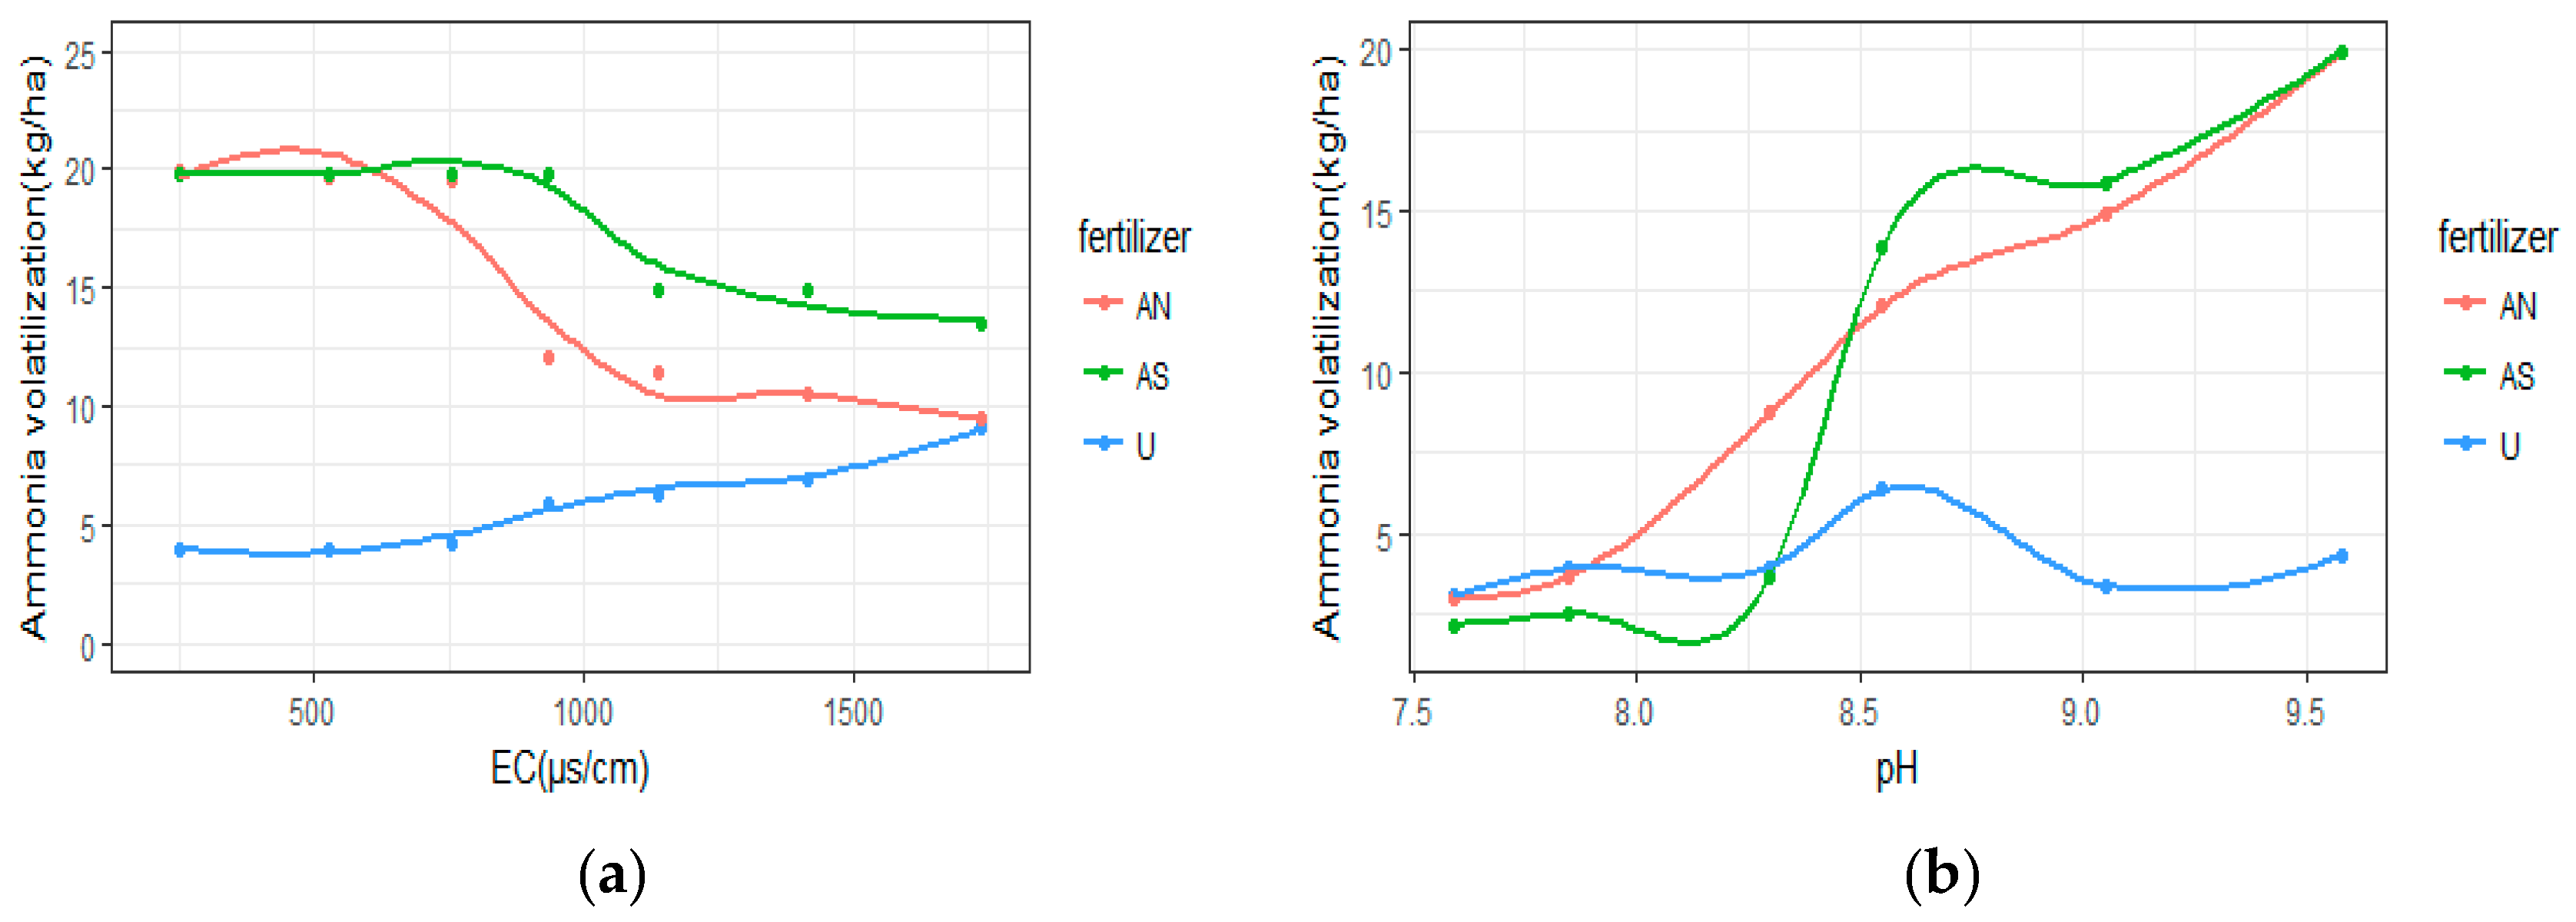
3.1. Simulation Experiments to Quantify Ammonia Volatilization

The ammonia volatilization losses varied greatly with the same N fertilizer levels under different EC and pH conditions (Figure 3). In the U treatment, the ammonia volatilization losses showed a positive relationship with EC. Figure 3 showed that ammonia volatilization losses obviously reduced with increased EC in the AN and AS treatments. The results showed that ammonia volatilization was significantly higher in the AN and AS treatments than in the U treatment at EC values of 250, 528, 754, 934, 1137, and 1415 μS/cm, respectively. However, the differences between AN treatment and AS treatment were less at EC of 250–754 μS/cm. There were less differences between the ammonia volatilization amounts in the AN and U treatments at an EC of 1736 μS/cm. The amounts of ammonia volatilization in different types of nitrogen fertilizer followed the order of AS >AN > U when the mixture solution had EC of 934–1736 μS/cm. Figure 3 showed that the ammonia volatilization losses increased with increased pH in the AN and AS treatments. The ammonia volatilization losses showed an initial increase, following which they decreased in the U treatments, and the peak occurred at pH 8.55. Ammonia volatilization of the U and AS treatments increased rapidly with increased pH up to 8.55. The amounts of ammonia volatilization in different types of nitrogen fertilizer showed the order of AS > AN > U when the mixture solution pH ranged from 8.55 to 9.58.

3.2. Rice Nitrogen Migration and NUE

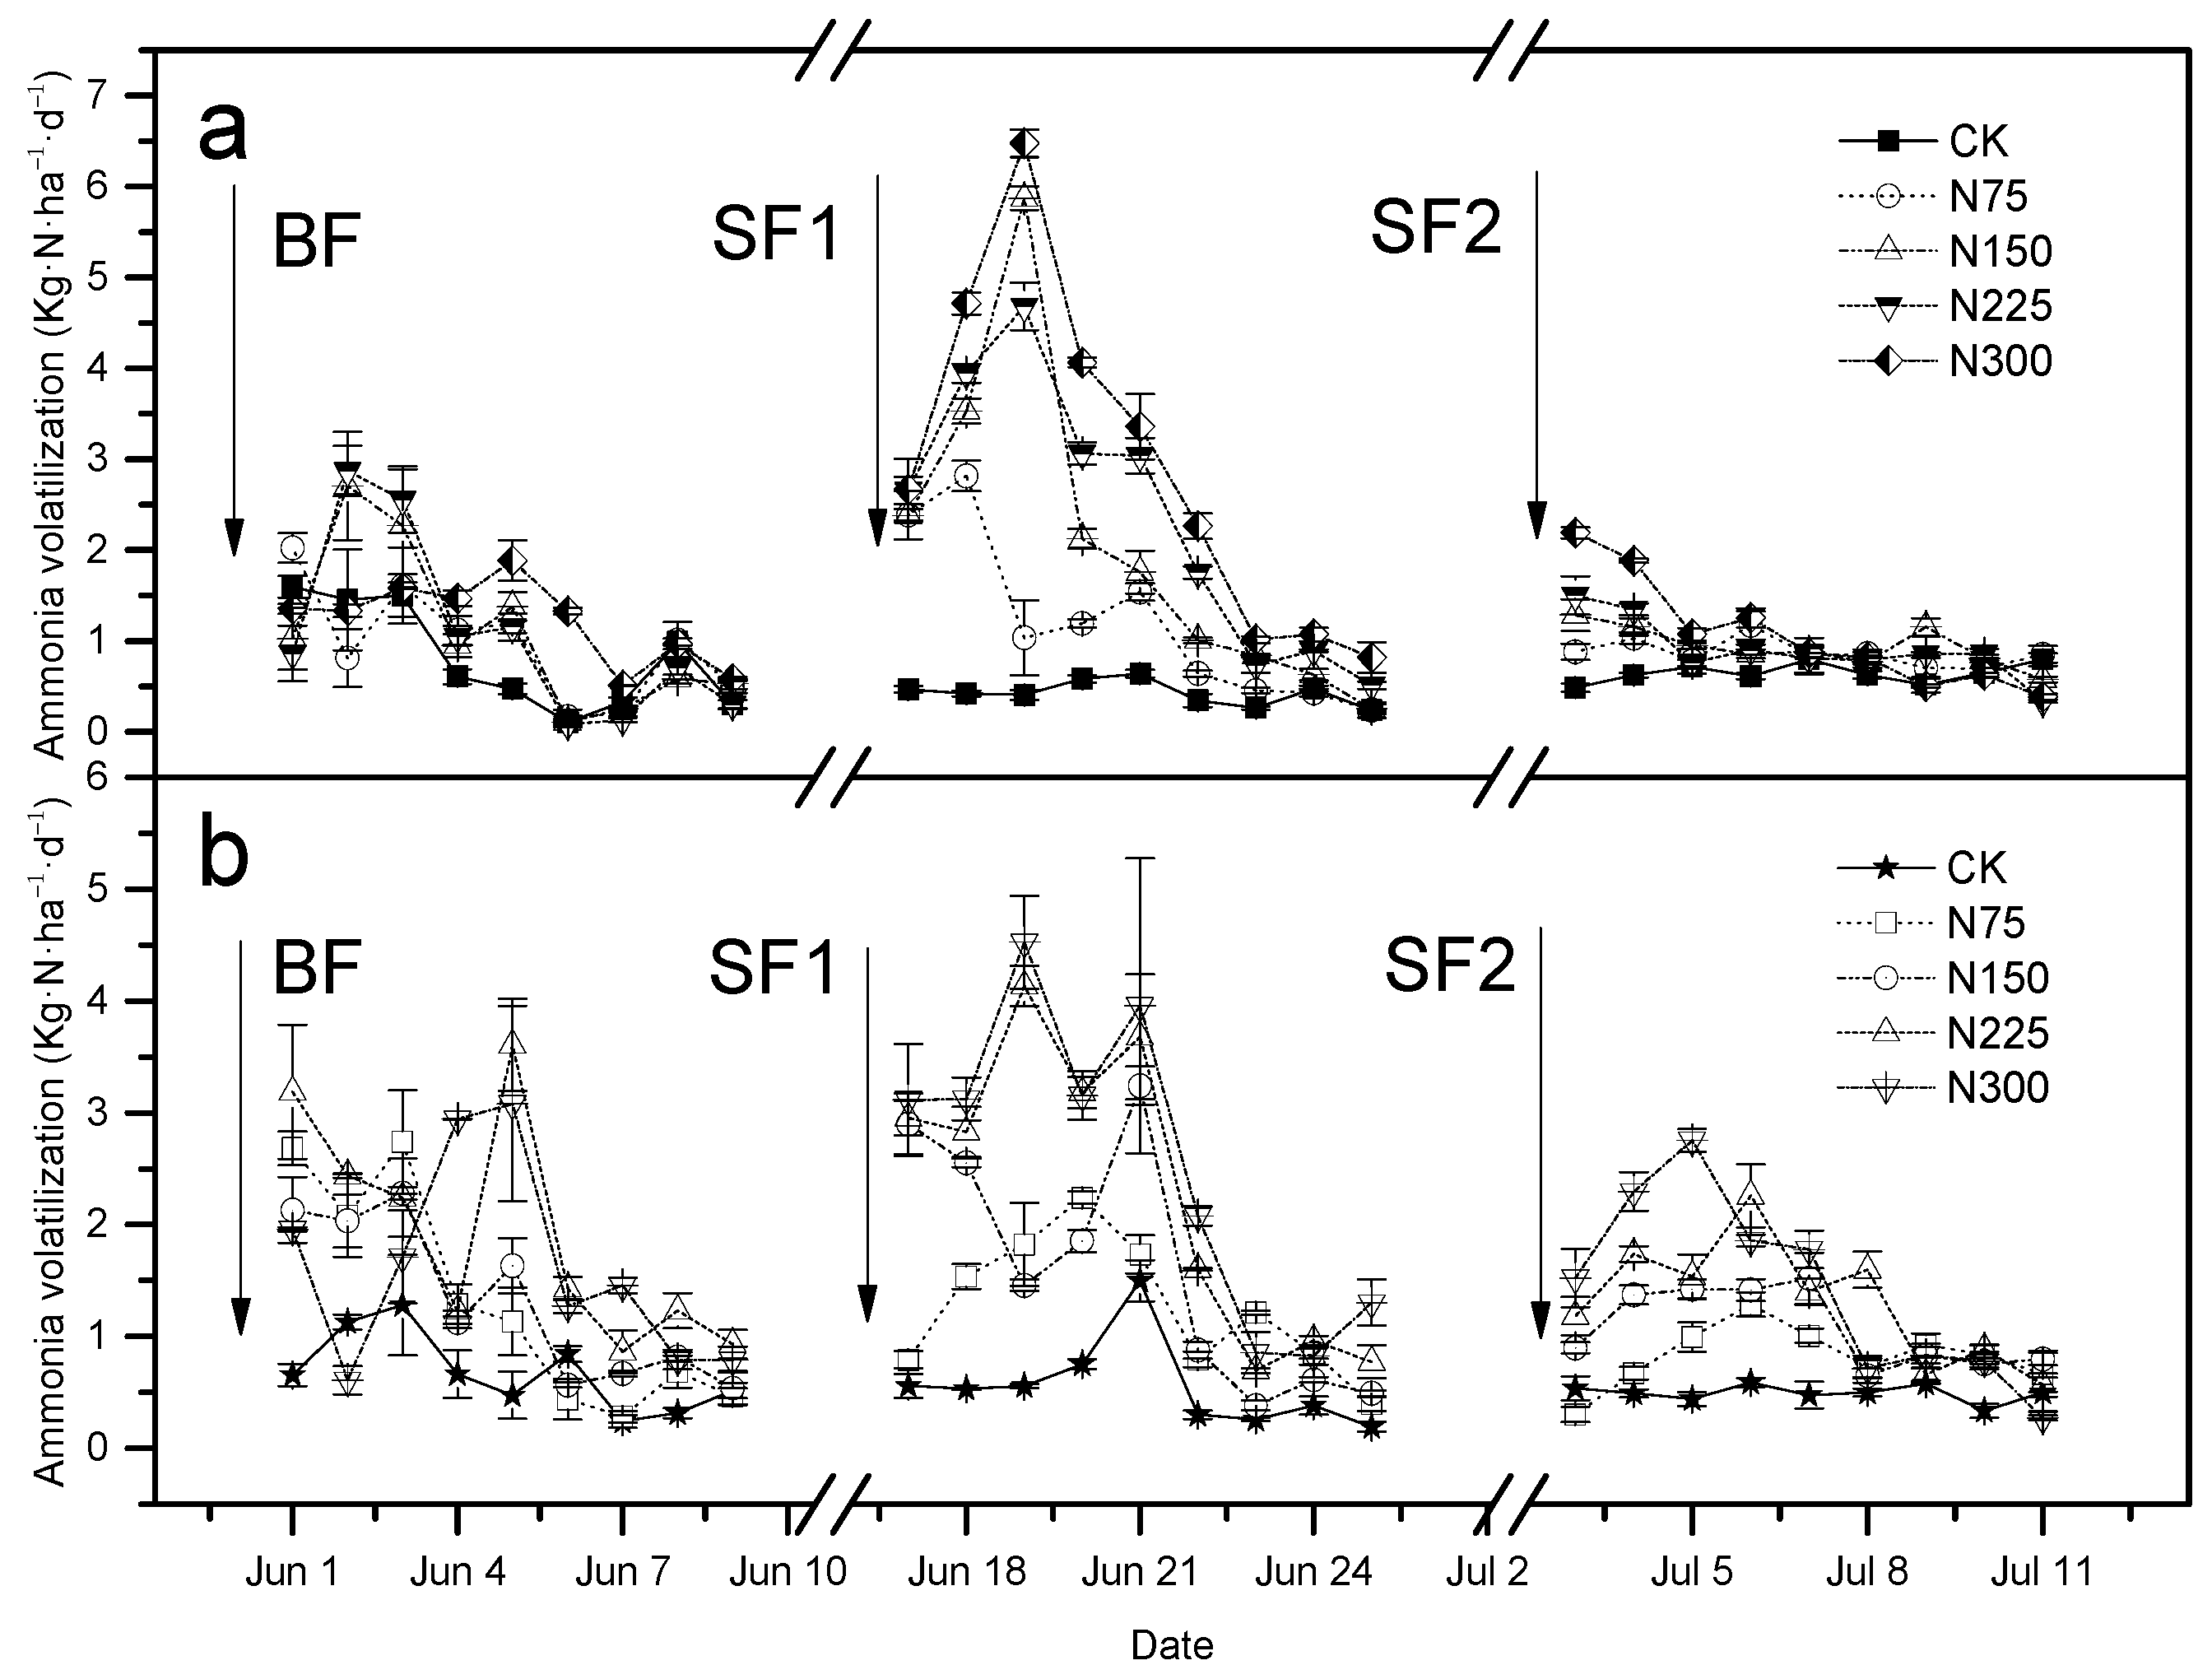
3.2.1. Pot Experiment to Quantify Ammonia Volatilization

The variations in ammonia volatilization losses from different N treatments during the rice-growing periods are shown in Figure 4. The ammonia volatilization values from two test soils were significantly affected by N fertilizer application. Figure 4 shows the diurnal variation in ammonia volatilization at every stage of fertilization. The highest ammonia volatilization rates were observed in slightly salt-affected soil (N300 treatment) and were reached on the third day after the first supplementary fertilizer application. The peak of the ammonia volatilization reached almost 6.5 kg·N/ha a day in slightly salt-affected soil. The same trend was presented in moderately salt-affected soil after the first supplementary fertilizer application. The ammonia volatilization losses showed a positive relationship with nitrogen application rates. Higher ammonia volatilization losses from the high nitrogen treatment occurred after the basal, first, and second additional fertilizer applications. Similar patterns were observed in slightly salt-affected soil and moderately salt-affected soil, largely due to the higher N inputs during these periods (related to the CK treatment).
The N losses through ammonia volatilization from the different treatments during rice-growing periods are presented in Table 7. The total ammonia losses from the CK treatment were 17.18 and 15.91 kg·N/ha in slightly salt-affected soil and moderately salt-affected soil, respectively. The highest total ammonia losses were recorded in the N300 treatment that reached up to 47.82 and 50.17 kg·N/ha in slightly salt-affected soil and in moderately salt-affected soil, respectively, accounting for 15.9% and 16.7% of total N inputs into pots, respectively. The cumulative ammonia losses in the N300 treatment during the first additional fertilization period accounted for 55.3% and 45.7% of the total ammonia losses in the slightly salt-affected soil and in moderately salt-affected soil, respectively. The total ammonia losses were much higher than those during the BF period and SF2 period. The ammonia volatilization losses during the second additional fertilization periods comprising the total seasonal ammonia losses throughout the rice growth season were lower because of the relatively lower N inputs during the booting stage in rice.

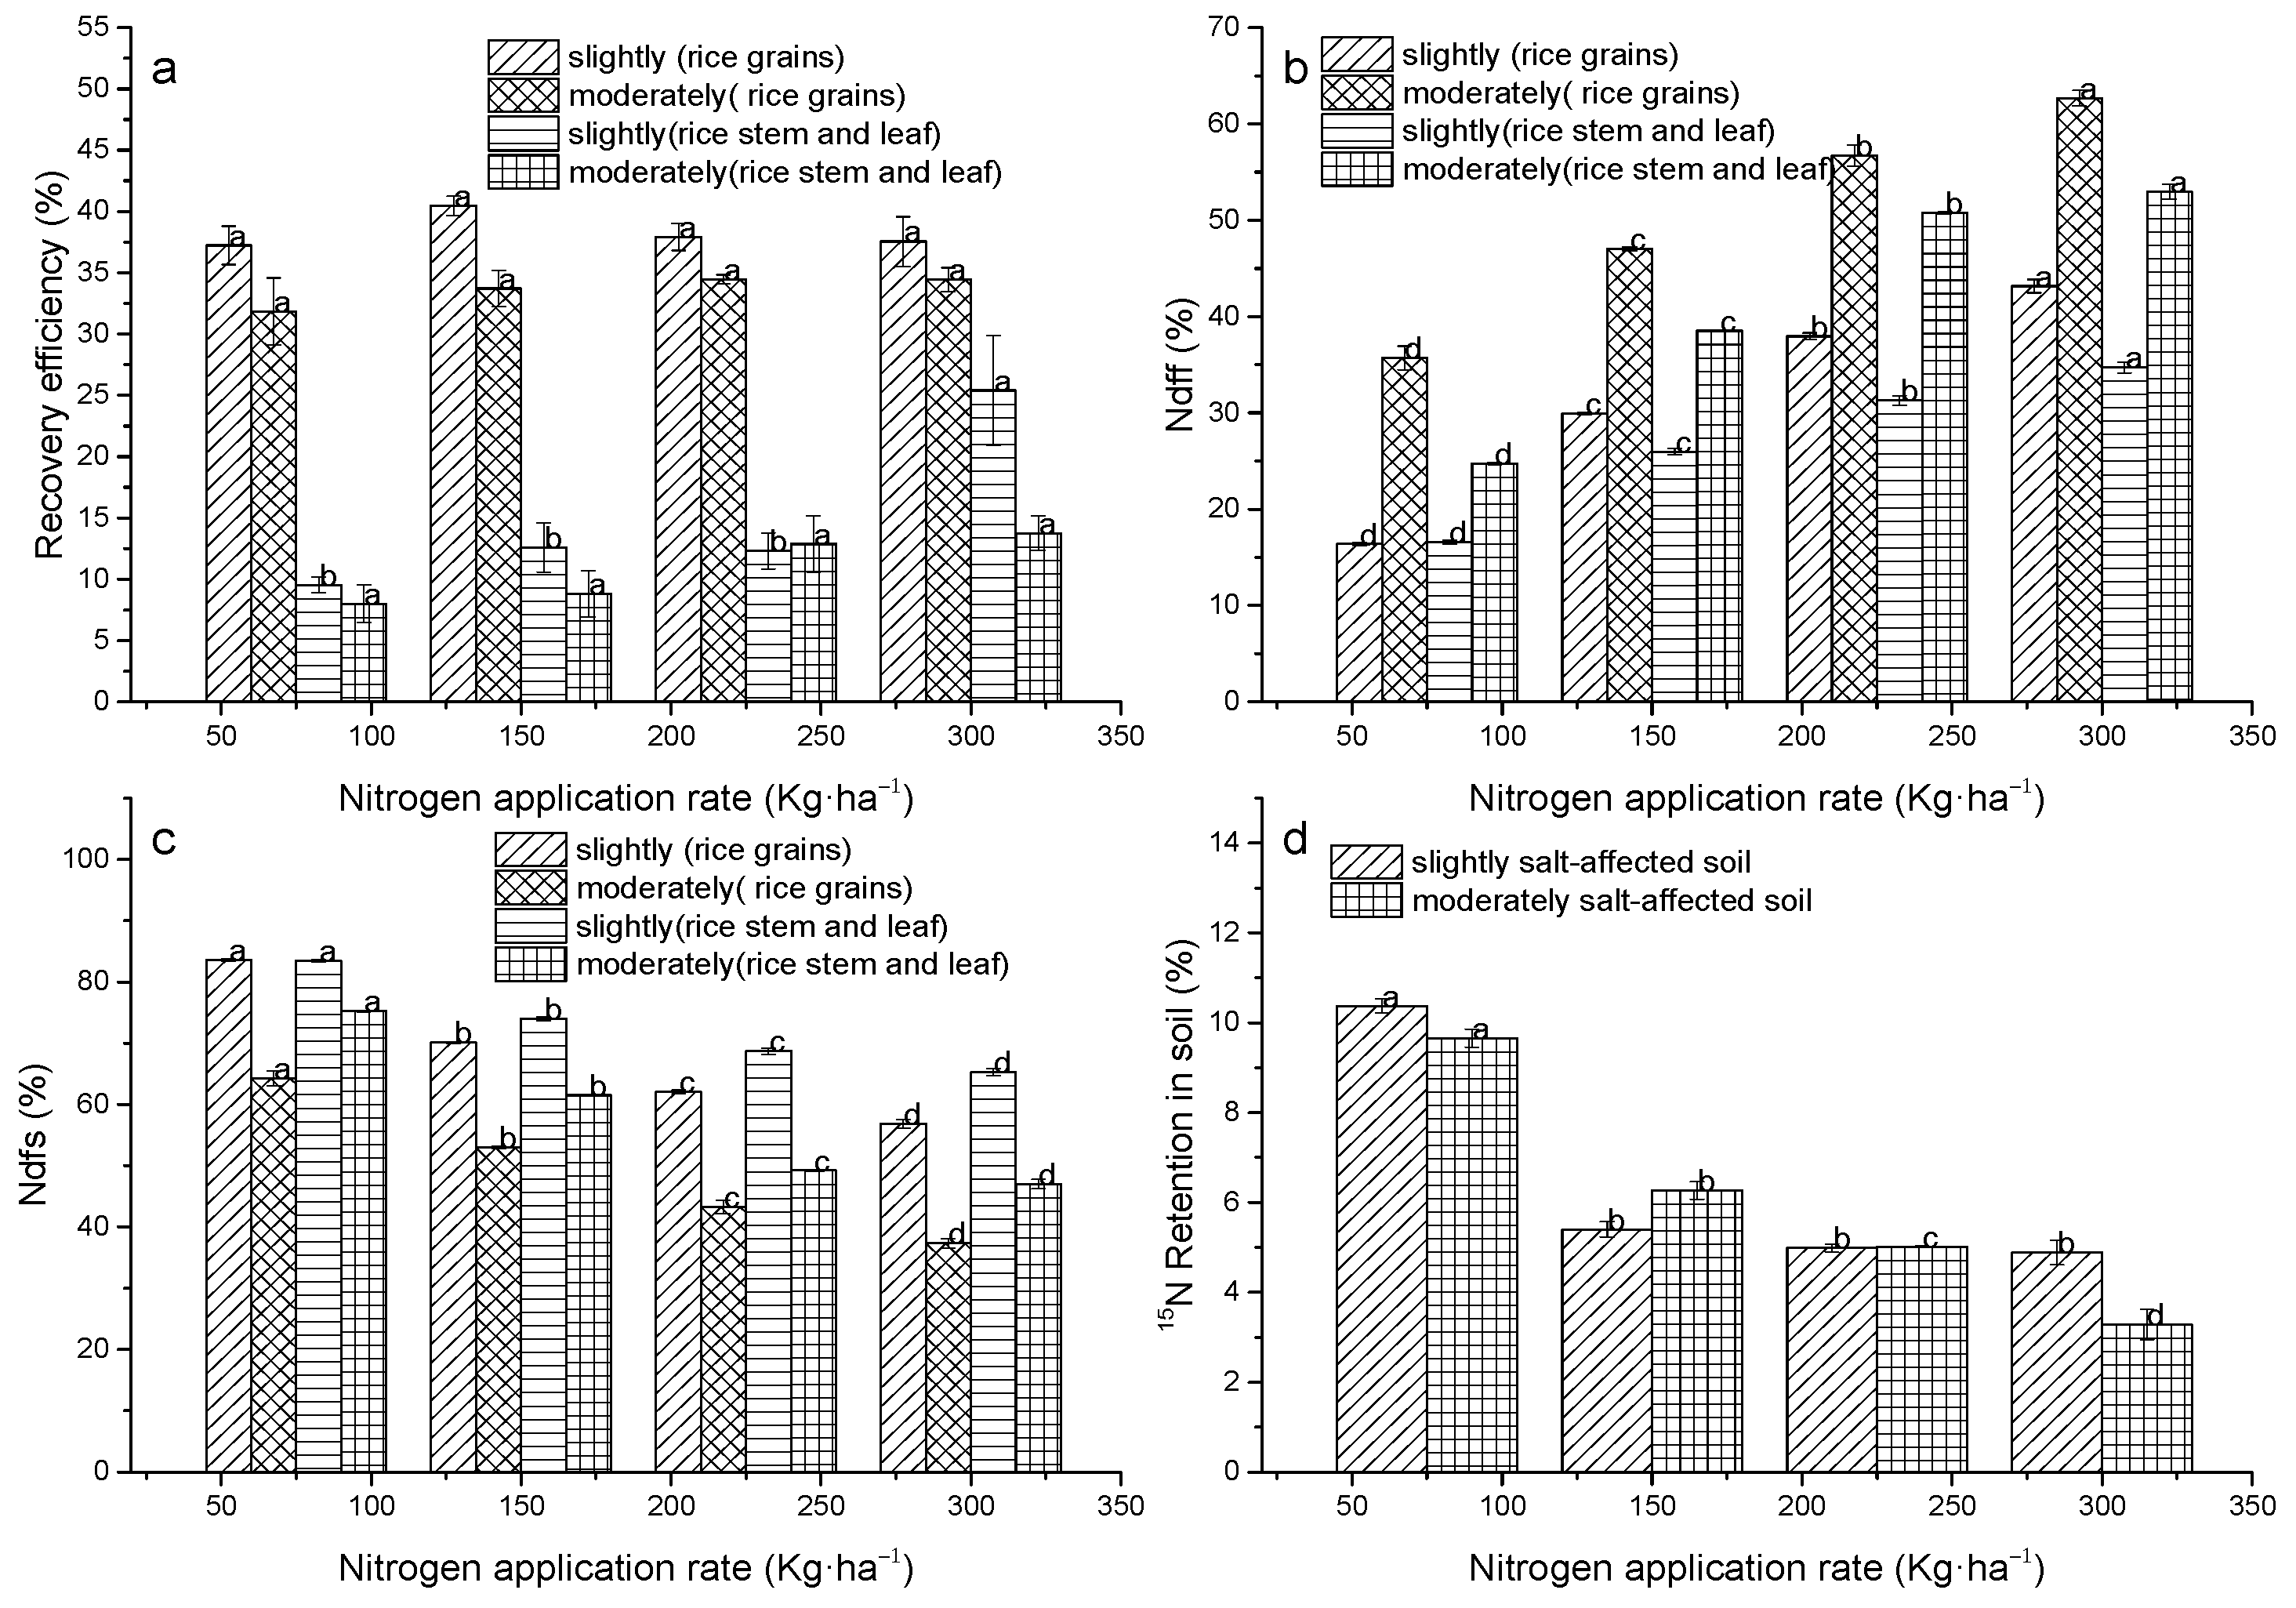
3.2.2. Nitrogen Absorption and Distribution in Rice Plants

Different 15N accumulation, absorption, and distribution amounts were measured in different parts of the harvested rice plants (Figure 5). The results of the pot experiment and 15N trace technique showed that the recovery efficiencies of 15N in grain showed no significant differences with increasing N fertilizer inputs. The recovery efficiencies of 15N in stems and leaves showed no significant differences with increasing N fertilizer in the moderately salt-affected soil. For the slightly salt-affected soil, the recovery efficiencies of 15N in stems and leaves (nitrogen application rate of 300 kg/ha) at different N fertilizer input levels were significantly different (Figure 5a). For the slightly salt-affected soil, the overall plant RE ranged from 46.75% to 62.95%, increasing with the increase of N fertilizer input level. For the moderately salt-affected soil, RE ranged from 39.84% to 48.21%, increasing with the increase of N fertilizer input level. Plant RE was the highest in the high N treatment. Recovery efficiencies correlated negatively with the ratios of nitrogen distribution in stems and leaves, and positively correlated with the ratio of nitrogen accumulation in grain. Grain obtained a higher performance than stems and leaves with regard to the content of 15N. In the moderately salt-affected soil (rice grains or stems and leaves), the treatment uptake of Ndff was higher than the slightly salt-affected soil treatment, respectively. In the slightly salt-affected soil, the uptake of Ndff in different parts of rice showed a positive relationship with the nitrogen application level, and a significant difference with different N fertilizer input levels was evident. Similar results were obtained for Ndff in different parts of rice under the moderately salt-affected soil condition.
Under the condition of the same degree of soil salinization, grain uptake of Ndfs was lower than the proportion of the rice stems and leaves in the same application levels of nitrogen (Figure 5c). The slightly salt-affected soil (rice grains or stems and leaves) treatment uptake of Ndfs was higher than the proportion of the moderately salt-affected soil treatment. Under the condition of different degrees of soil salinization (slightly salt-affected soil and moderately salt-affected soil), the uptake of nitrogen derives from soil by different parts of rice decreased with the increase in the level of nitrogen application, and a significant difference with the different N fertilizer input level was evident. A reduction in soil 15N retention rate could be observed in two kinds of alkaline salt-affected soils with the increase of nitrogen input level (Figure 5d). The 15N assimilated by rice and retained in the slightly salt-affected soil was higher than that in the moderately salt-affected soil. The average soil 15N retention rates under four kinds of nitrogen application levels of 75, 150, 225, and 300 kg·N/ha were 10.0%, 5.8%, 5.0%, and 4.1%, respectively. Under the condition of moderately salt-affected soil, there was a significant difference in the soil 15N retention rate with the increase of the N fertilizer input level.
In slightly salt-affected soil, the grain yields under different nitrogen levels increased relative to that of the CK treatment, with the rate increased in the range of 22.8%–49.2% with the increase of the N fertilizer input (Table 8). For the N300 treatment, the increased yield relative to that of CK was 128.1% in moderately salt-affected soil. In slightly salt-affected soil, the crop and soil RE was 67.8% in the N300 treatment. In the moderately salt-affected soil, the crop and soil RE showed no significant difference with increases of the N fertilizer input level. The apparent loss rate of nitrogen in the N300 treatment was 32.2% and was significantly different from that of other treatments in slightly salt-affected soil. The highest physiological efficiencies were recorded in the N225 treatment. The highest nitrogen agronomic efficiency was recorded in the N225 treatment and was 8.0 N·kg/kg in the slightly salt-affected soil. For the moderately salt-affected soil, the nitrogen agronomic efficiency reached maximum values in the N300 fertilizer application.

4. Discussion

4.1. Ammonia Volatilization, Nitrogen Absorption, and Distribution by Rice

Simulation experiments showed a decreasing trend in ammonia volatilization loss from AN and AS, but not that from urea, as the electrical conductivity gradient increased, whereas the reverse trend was found as the pH gradient increased. The previous study indicated that ammonia volatilization increases with pH and surface soil NH4+-N concentrations resulting from the hydrolysis of urea [14]. With regard to the relationship between soil pH and ammonia volatilization, Mandal et al. [23] showed that ammonia volatilization was higher in soil at a pH exceeding 8 as a result of the increased hydroxyl ions. In the present study, as shown in Figure 3, the ammonia volatilization losses in the urea treatments decreased after an initial increase. The peak appeared at pH 8.55. For the urea treatment, ammonia volatilization increased rapidly with increasing pH up to 8.55, which can be explained due to differences of soil types and the present study was simulated in the mixed solution. Further research to estimate ammonia volatilization losses at a field scale under a pH gradient is required. Considering the high ammonia volatilization losses in AN and AS (Figure 3), urea was a more suitable fertilizer type for application in alkaline salt-affected soil.
Ammonia volatilization loss increased in moderately salt-affected soil compared with that in slightly salt-affected soil, particularly during the tillering stage, regardless of the N fertilizer rate. The amount of ammonia volatilization showed a positive relationship with the nitrogen application level [24]. The peak ammonia volatilization level was observed on the third day after the application of N fertilizer [25]. This has once again been confirmed in the potted experiment (Figure 4). In the present study, the ammonia volatilization rates from two test soils were significantly affected by N fertilizer application. The highest ammonia volatilization rates were observed in slightly salt-affected soil and were reached on the third day after the fertilizer application. The peak ammonia volatilization rate reached almost 6.5 kg·N/ha a day in slightly salt-affected soil. Ammonia volatilization during the seasonal growing period accounted for 35.6%–38.0% of total N applied in the Taihu Lake region of Southeast China [26]. In the present study (Table 7), ammonia volatilization during the seasonal growing period accounted for 15.9%–40.8% of total N applied in alkaline salt-affected soil. The amounts of ammonia volatilization after nitrogen application differed according to the crop stage in the order of tiller fertilizer > first supplemental fertilizer > basal fertilizer > second supplemental fertilizer [24]. In comparison with the results obtained by Lin et al. [24], our result showed amounts of ammonia volatilization in the order of first supplemental fertilizer (tillering stage) > basal fertilizer (regreening stage) > second supplemental fertilizer (booting stage). The temperature at the tiller stage was relatively higher in the studied region, which led to higher surface water temperature. Additionally, the lesser surface cover in the tiller stage resulted in an increased potential for ammonia volatilization loss during this period. Moreover, the ammonia volatilization losses from June to July comprised most of the total ammonia volatilization losses throughout the rice growth season (Figure 4). The period of tiller stage was obviously crucial for mitigating the ammonia volatilization losses by application of lower amounts of fertilizer from alkaline salt-affected soil.
The high N fertilizer application increased the N uptake by rice derived from fertilizer and the amount of N from soil taken up by rice reduced correspondingly, which resulted in a higher N surplus in the soil. At the conventional irrigation and fertilizer management level, the recovery rate of 15N-labeled urea in the rice–soil system was 48%–49% [27]. However, in the present study, the soil 15N retention rate was reduced with high N fertilizer application. This is because a high N fertilizer application in alkaline salt-affected soil can improve the physiological efficiency of rice (Table 8). The present study also showed that rice uptake of nitrogen derived from the soil decreased, whereas that derived from fertilizer showed a positive relationship with the nitrogen application level. The recovery rate of 15N-labeled urea in the rice–soil system was 52.2%–55.2% in the present study (Figure 5a). Ndff in rice plants ranged from 18.7% to 40.0% in all plant tissues [28]. In the present study, rice plant uptake of Ndff ranged from 16.4% to 62.7% in all plant tissues (Figure 5b). At rice harvest, 4.7%–10.7% of the fertilizer 15N was found in the 0–20 cm soil profile, and the ratio of soil residue nitrogen in the crop field was in the order of low nitrogen > moderate nitrogen > high nitrogen [29]. In the present study, the average soil 15N retention rates under four kinds of nitrogen application levels of 75, 150, 225, and 300 kg·N/ha were 10.0%, 5.8%, 5.0%, and 4.1%, respectively (Figure 5d). The N retention rate in soil decreased as the amount of nitrogen added was increased in both salt-affected soil conditions.

4.2. Fair Balance among N Fertilizer Level, Ammonia Volatilization, and Productivity

The yield response to enhanced efficiency of nitrogen fertilizers increased to 10.2% in alkaline soils (pH ≥ 8.0) [30]. Duan et al. [31] estimated that an uptake increase of 1.0 kg·N/ha would result in a rice yield increase of 40 kg. In the present study, rice uptake per 1 kg nitrogen can increase grain yield from 24.8–55.8 kg in alkaline salt-affected soil (Table 8). Moreover, the agronomic fertilizer N use efficiency ranged from 3.8–8.5 kg grain/kg. This result was low compared with the values of 15–20 kg grain/kg reported in Bangladesh by Ahmed et al. [32]. This may be because the soil salt-affected NUE of rice plants (Table 8). Improving NUE together with reducing the application of N fertilizers is an important consideration for the protection of the environment and sustainable production of rice [33]. Many optimized nutrient management strategies have been applied to improve rice yield and NUE in China, most of which have achieved a higher yield and NUE than the usual fertilizer practices by farmers [34]. Rice planting regions and N rates have a significant influence on grain yield, N uptake, and NUE values. It has been shown that N rates of 200–250 kg/ha commonly achieved a higher rice grain yield in most rice planting regions [35]. However, the integrated high-efficiency agricultural practice was effective not only in increasing grain yields and improving NUE by the rice, but also in reducing the ammonia volatilization losses from alkaline salt-affected soil throughout the rice growth season. In the present experiment, the results (Table 8 and Table 9) showed that in slightly salt-affected soil, the recommended nitrogen application level was 225 kg·N/ha, and in moderately salt-affected soil, the recommended nitrogen application level was 300 kg·N/ha. Nevertheless, those treatments reflect high rates of fertilizer application, and an appropriate fertilizer application practice for sustainable rice production in alkaline salt-affected soil has not been determined in the present study, which will be further investigated in future research.

5. Conclusions

Our study results demonstrated that ammonia volatilization losses had an increasing trend with a positive relationship with EC for the urea treatment. The highest ammonia volatilization loss was recorded at the pH 8.55 stage in the urea treatment. The ammonia volatilization losses showed a positive relationship with the nitrogen application level. Ammonia volatilization loss increased in moderately salt-affected soil compared with that in slightly salt-affected soil, particularly during the tillering stage, regardless of the N fertilizer rate. The overall RE of rice ranged from 39.84% to 62.95% with increasing N fertilizer input in alkaline salt-affected soils. The highest overall RE was achieved in the high N treatment plants. The percentage of N absorbed by rice plants increased from urea, but decreased from the soil as the amount of nitrogen was increased.
The 15N content of grain parts was higher than stems and leaves in rice plants. The average soil 15N retention rates were 10.0%, 5.8%, 5.0%, and 4.1% under four kinds of nitrogen application levels of 75, 150, 225, and 300 kg·N/ha, respectively. The N retention rate decreased in the soil and rice grain yield and nitrogen agronomic efficiency increased as the amount of nitrogen increased in both salt-affected soil conditions. The highest of nitrogen physiological efficiencies were 55.8 and 50.5 N·kg/kg in the light and moderately salt-affected soils, respectively. The highest nitrogen agronomic efficiency was 8.0 N·kg/kg in the slightly salt-affected soil when nitrogen application rate was 225 kg N/ha.

Acknowledgments

This work was supported by a grant from National Key R&D Program (2016YFD0200303); the foundation of Natural Science of Jilin Province (20140101156JC); the Science and Technology Service Network Initiative of Chinese Academy of Sciences (Grant No. KFJ-SW-STS-141-01); the Strategic Priority Research Program of the Chinese Academy of Sciences (Grant No. XDA080X0X0X); 135 Program of Northeast Institute of Geography and Agroecology, Chinese Academy of Sciences (Grant No. Y6H2021001, IGA-135-01).

Author Contributions

Yangyang Li conceived and designed the experiments, performed the experiments, analyzed the data and wrote the paper; Lihua Huang conceived and designed the experiments, modified the paper; Huan Zhang performed part of the experiments; and Zhengwei Liang conceived and designed the experiments, and modified the paper; and Mingming Wang participated the experiment design and modified the paper. All authors have read and approved the final manuscript.

Conflicts of Interest

The authors declare no conflict of interest.

References

  1. Sutton, M.A.; Oenema, O.; Erisman, J.W.; Leip, A.; van Grinsven, H.; Winiwarter, W. Too much of a good thing. Nature 2011, 472, 159–161. [Google Scholar] [CrossRef] [PubMed]
  2. Vitousek, P.M.; Naylor, R.; Crews, T.; David, M.B.; Drinkwater, L.E.; Holland, E.; Johnes, P.J.; Katzenberger, J.; Martinelli, L.A.; Matson, P.A.; et al. Agriculture. Nutrient imbalances in agricultural development. Science 2009, 324, 1519–1520. [Google Scholar] [CrossRef] [PubMed]
  3. Cassman, K.G.; Dobermann, A.; Walters, D.T.; Yang, H. Meeting cereal demand while protecting natural resources and improving environmental quality. Annu. Rev. Environ. Resour. 2003, 28, 315–358. [Google Scholar] [CrossRef]
  4. Godinot, O.; Carof, M.; Vertès, F.; Leterme, P. Syne: An improved indicator to assess nitrogen efficiency of farming systems. Agric. Syst. 2014, 127, 41–52. [Google Scholar] [CrossRef]
  5. Duan, Y.; Xu, M.; Gao, S.; Yang, X.; Huang, S.; Liu, H.; Wang, B. Nitrogen use efficiency in a wheat–corn cropping system from 15 years of manure and fertilizer applications. Field Crops Res. 2014, 157, 47–56. [Google Scholar] [CrossRef]
  6. Salazar, F.; Martínez-Lagos, J.; Alfaro, M.; Misselbrook, T. Ammonia emissions from urea application to permanent pasture on a volcanic soil. Atmos. Environ. 2012, 61, 395–399. [Google Scholar] [CrossRef]
  7. Ni, K.; Pacholski, A.; Kage, H. Ammonia volatilization after application of urea to winter wheat over 3 years affected by novel urease and nitrification inhibitors. Agric. Ecosyst. Environ. 2014, 197, 184–194. [Google Scholar] [CrossRef]
  8. Xing, G.; Zhu, Z. An assessment of n loss from agricultural fields to the environment in china. Nutr. Cycl. Agroecosyst. 2000, 57, 67–73. [Google Scholar] [CrossRef]
  9. Zhu, Z.; Chen, D. Nitrogen fertilizer use in China—Contributions to food production, impacts on the environment and best management strategies. Nutr. Cycl. Agroecosyst. 2002, 63, 117–127. [Google Scholar] [CrossRef]
  10. Rochette, P.; Angers, D.A.; Chantigny, M.H.; MacDonald, J.D.; Bissonnette, N.; Bertrand, N. Ammonia volatilization following surface application of urea to tilled and no-till soils: A laboratory comparison. Soil Tillage Res. 2009, 103, 310–315. [Google Scholar] [CrossRef]
  11. Xu, J.; Liao, L.; Tan, J.; Shao, X. Ammonia volatilization in gemmiparous and early seedling stages from direct seeding rice fields with different nitrogen management strategies: A pots experiment. Soil Tillage Res. 2013, 126, 169–176. [Google Scholar] [CrossRef]
  12. Zhang, Y.; Luan, S.; Chen, L.; Shao, M. Estimating the volatilization of ammonia from synthetic nitrogenous fertilizers used in china. J. Environ. Manag. 2011, 92, 480–493. [Google Scholar] [CrossRef] [PubMed]
  13. Fillery, I.R.P.; Vlek, P.L.G. Reappraisal of the significance of ammonia volatilization as an N loss mechanism in flooded rice fields. In Nitrogen Economy of Flooded Rice Soils: Proceedings of a Symposium on the Nitrogen Economy of Flooded Rice Soils, Washington, DC, 1983; Datta, S.K., Patrick, W.H., Eds.; Springer: Dordrecht, The Netherlands, 1986; pp. 79–98. [Google Scholar]
  14. Sommer, S.G.; Schjoerring, J.K.; Denmead, O. Ammonia emission from mineral fertilizers and fertilized crops. Adv. Agron. 2004, 82, 557–622. [Google Scholar]
  15. Cao, Y.; Tian, Y.; Yin, B.; Zhu, Z. Assessment of ammonia volatilization from paddy fields under crop management practices aimed to increase grain yield and n efficiency. Field Crops Res. 2013, 147, 23–31. [Google Scholar] [CrossRef]
  16. Salazar, F.; Martínez-Lagos, J.; Alfaro, M.; Misselbrook, T. Ammonia emission from a permanent grassland on volcanic soil after the treatment with dairy slurry and urea. Atmos. Environ. 2014, 95, 591–597. [Google Scholar] [CrossRef]
  17. Chen, G.; Chen, Y.; Zhao, G.; Cheng, W.; Guo, S.; Zhang, H.; Shi, W. Do high nitrogen use efficiency rice cultivars reduce nitrogen losses from paddy fields? Agric. Ecosyst. Environ. 2015, 209, 26–33. [Google Scholar] [CrossRef]
  18. Liu, T.Q.; Fan, D.J.; Zhang, X.X.; Chen, J.; Li, C.F.; Cao, C.G. Deep placement of nitrogen fertilizers reduces ammonia volatilization and increases nitrogen utilization efficiency in no-tillage paddy fields in central china. Field Crops Res. 2015, 184, 80–90. [Google Scholar] [CrossRef]
  19. Sun, H.; Zhang, H.; Powlson, D.; Min, J.; Shi, W. Rice production, nitrous oxide emission and ammonia volatilization as impacted by the nitrification inhibitor 2-chloro-6-(trichloromethyl)-pyridine. Field Crops Res. 2015, 173, 1–7. [Google Scholar] [CrossRef]
  20. Kissel, D.; Brewer, H.; Arkin, G. Design and test of a field sampler for ammonia volatilization. Soil Sci. Soc. Am. J. 1977, 41, 1133–1138. [Google Scholar] [CrossRef]
  21. Shoji, T.; Nakamura, E. Collection of indonaphthol blue on a membrane filter for the spectrophotometric determination of ammonia with 1-naphthol and dichloroisocyanurate. Anal. Sci. 2010, 26, 779–783. [Google Scholar] [CrossRef] [PubMed]
  22. Hauck, R.; Bremner, J. Use of tracers for soil and fertilizer nitrogen research. Adv. Agron. 1976, 28, 219–266. [Google Scholar]
  23. Mandal, S.; Thangarajan, R.; Bolan, N.S.; Sarkar, B.; Khan, N.; Ok, Y.S.; Naidu, R. Biochar-induced concomitant decrease in ammonia volatilization and increase in nitrogen use efficiency by wheat. Chemosphere. 2016, 142, 120–127. [Google Scholar] [CrossRef] [PubMed]
  24. Lin, Z.-C.; Dai, Q.-G.; Ye, S.-C.; Wu, F.-G.; Jia, Y.-S.; Chen, J.-D.; Xu, L.-S.; Zhang, H.-C.; Huo, Z.-Y.; Xu, K.; et al. Effects of nitrogen application levels on ammonia volatilization and nitrogen utilization during rice growing season. Rice Sci. 2012, 19, 125–134. [Google Scholar] [CrossRef]
  25. Soares, J.R.; Cantarella, H.; Menegale, M.L.D.C. Ammonia volatilization losses from surface-applied urea with urease and nitrification inhibitors. Soil Biol. Biochem. 2012, 52, 82–89. [Google Scholar] [CrossRef]
  26. Xinqiang, L.; Junli, Y.; Miaomiao, H.; Hua, L.; Liang, L.; Guangming, T. Modeling the fate of fertilizer N in paddy rice systems receiving manure and urea. Geoderma 2014, 228–229, 54–61. [Google Scholar] [CrossRef]
  27. Zhang, Q.; Yang, Z.; Zhang, H.; Yi, J. Recovery efficiency and loss of 15N-labelled urea in a rice–soil system in the upper reaches of the yellow river basin. Agric. Ecosyst. Environ. 2012, 158, 118–126. [Google Scholar] [CrossRef]
  28. Hashim, M.M.A.; Yusop, M.K.; Othman, R.; Wahid, S.A. Characterization of nitrogen uptake pattern in malaysian rice MR219 at different growth stages using 15N isotope. Rice Sci. 2015, 22, 250–254. [Google Scholar] [CrossRef]
  29. Xu, H.; Zhong, G.; Lin, J.; Ding, Y.; Li, G.; Wang, S.; Liu, Z.; Tang, S.; Ding, C. Effect of nitrogen management during the panicle stage in rice on the nitrogen utilization of rice and succeeding wheat crops. Eur. J. Agron. 2015, 70, 41–47. [Google Scholar] [CrossRef]
  30. Linquist, B.A.; Liu, L.; van Kessel, C.; van Groenigen, K.J. Enhanced efficiency nitrogen fertilizers for rice systems: Meta-analysis of yield and nitrogen uptake. Field Crops Res. 2013, 154, 246–254. [Google Scholar] [CrossRef]
  31. Duan, Y.-H.; Shi, X.-J.; Li, S.-L.; Sun, X.-F.; He, X.-H. Nitrogen use efficiency as affected by phosphorus and potassium in long-term rice and wheat experiments. J. Integr. Agric. 2014, 13, 588–596. [Google Scholar] [CrossRef]
  32. Ahmed, S.; Humphreys, E.; Salim, M.; Chauhan, B.S. Growth, yield and nitrogen use efficiency of dry-seeded rice as influenced by nitrogen and seed rates in bangladesh. Field Crops Res. 2016, 186, 18–31. [Google Scholar] [CrossRef]
  33. Chen, Z.C.; Ma, J.F. Improving nitrogen use efficiency in rice through enhancing root nitrate uptake mediated by a nitrate transporter, NRT1.1B. J. Genet. Genom. 2015, 42, 463–465. [Google Scholar] [CrossRef] [PubMed]
  34. Sui, B.; Feng, X.; Tian, G.; Hu, X.; Shen, Q.; Guo, S. Optimizing nitrogen supply increases rice yield and nitrogen use efficiency by regulating yield formation factors. Field Crops Res. 2013, 150, 99–107. [Google Scholar] [CrossRef]
  35. Che, S.-G.; Zhao, B.-Q.; Li, Y.-T.; Yuan, L.; Li, W.; Lin, Z.-A.; Hu, S.-W.; Shen, B. Review grain yield and nitrogen use efficiency in rice production regions in china. J. Integr. Agric. 2015, 14, 2456–2466. [Google Scholar] [CrossRef]
Figure 1. Location of the experimental site, Da’an City, Jilin, China.
Sustainability 09 00132 g001
Figure 2. Changes in air temperature (a); soil surface temperature (b); wind speed (c); and rainfall (d) from 25 May to 20 July 2014, at the experimental site.
Sustainability 09 00132 g002
Figure 3. The fitting curves showing how ammonia volatilization losses varied in three kinds of fertilizer under different electrical conductivity (EC) and pH conditions. (a) Ammonia volatilization losses varied under different EC and at the same pH condition (pH 8.55); and (b) ammonia volatilization losses varied under different pH values at the same EC condition (EC: 700 μS/cm). The data for the ammonia volatilization are the averaged values from three experimental duplicates.
Sustainability 09 00132 g003
Figure 4. The ammonia volatilization losses varied in slightly salt-affected and moderately salt-affected soils. (a) Slightly salt-affected soil; and (b) moderately salt-affected soil; transplanting and basal fertilization (BF), first supplemental fertilization (SF1), and second supplemental fertilization (SF2); the corresponding phenological phases in rice were the regreening stage, tillering stage, and booting stage, respectively.
Sustainability 09 00132 g004
Figure 5. The distribution and transfer efficiency of 15N absorbed by rice in alkaline salt-affected soils. (a) Nitrogen recovery efficiencies of different parts of rice; (b) the proportion of nitrogen derived from fertilizer; (c) the proportion of nitrogen derived from soil; (d) the proportion of 15N retention in the soil; values of slightly salt-affected soil (rice grains), moderately salt-affected soil (rice grains), slightly salt-affected soil (rice stems and leaves), and moderately salt-affected soil (rice stems and leaves) in recovery efficiency or Ndff or Ndfs, followed by the same letter(s), are not significantly different at p < 0.05 for different N fertilizer input levels. Values of the 15N retention rate in slightly salt-affected soil and moderately salt-affected soil, followed by the same letter(s), are not significantly different at p < 0.05 for different N application levels. The different letter(s) indicate a significant difference.
Sustainability 09 00132 g005
Table 1. Adjustments of the mixed solution related to the pH required for chemical reagent dosage.
pHEC (μS/cm)NaCl (mL)Na2CO3 (mL) aNaHCO3 (mL) a
7.597000.750.050
7.857000.750.100
8.307000.7000.15
8.557000.3500.45
9.057000.750.150
9.587000.750.250
a In each of the columns related to the application concentration, “0”indicates that no chemical reagent was applied. The mixed solution required chemical reagents: (NaCl: 0.1 mol/L; Na2CO3: 0.1 mol/L; NaHCO3: 0.1 mol/L).
Table 2. Adjustments of the mixed solution related to the electrical conductivity (EC) required for chemical reagent dosage.
pHEC (μS/cm)NaCl (mL) aNa2CO3 (mL) aNaHCO3 (mL)
8.55250000.35
8.55528000.75
8.557540.5000.50
8.559340.5000.75
8.5511370.7500.75
8.5514151.0000.75
8.5517361.5000.75
a In each of the columns related to the application concentration, “0”indicates that no chemical reagent was applied. The mixed solution required chemical reagents: (NaCl: 0.1 mol/L; Na2CO3: 0.1 mol/L; NaHCO3: 0.1 mol/L).
Table 3. Treatment designation, pH, and N application rates for the treatments used in the simulation experiments.
FertilizersDaysControl Factors
pHEC (μS/cm)Fertilizer Amount (kg/ha)
(U/AN/AS)57.59700200
57.85700200
58.30700200
58.55700200
59.05700200
59.58700200
U: urea; AN: ammonium nitrate; AS: ammonium sulfate.
Table 4. Treatment designation, electrical conductivity (EC), and N application rates for the treatments used in the simulation experiments.
FertilizersDaysControl Factors
pHEC (μS/cm)Fertilizer Amount (kg/ha)
(U/AN/AS)58.55250200
58.55528200
58.55754200
58.55934200
58.551137200
58.551415200
58.551736200
U: urea; AN: ammonium nitrate; AS: ammonium sulfate.
Table 5. Properties of selected alkaline salt-affected soils used in the experiment.
ItemsSoil Type
Slightly Salt-Affected SoilModerately Salt-Affected Soil
Organic matter (g/kg)19.24 ± 0.4613.04 ± 0.59
Total nitrogen (g/kg)2.38 ± 0.311.48 ± 0.20
Available nitrogen (mg/kg)82.31 ± 4.2167.52 ± 3.76
Available phosphorus(mg/kg)39.44 ± 2.6233.62 ± 1.38
Available potassium(mg/kg)355.2 ± 8.44320.4 ± 6.30
EC(μS/cm)354 ± 37.81374 ± 54.94
pH7.91 ± 0.128.39 ± 0.23
±: Standard deviation (SD).
Table 6. Nitrogen application rates for treatments applied during the rice growing season.
Management PracticesAlkaline Salt-Affected Soils
BF (kg·N/ha) at the Regreening StageSF1 (kg·N/ha) at the Tillering StageSF2 (kg·N/ha) at the Booting Stage
CK000
N7537.522.515.0
N15075.045.030.0
N225112.567.545.0
N300150.090.060.0
Transplanting and basal fertilization (BF), first supplemental fertilization (SF1), second supplemental fertilization (SF2); control treatment (CK); nitrogen application rates were 75 (N75), 150 (N150), 225 (N225), and 300 (N300) kg·N/ha.
Table 7. Ammonia volatilization losses according to different fertilization periods and fertilizer levels in slightly and moderately salt-affected soils.
SoilCodeBFSF1SF2Seasonal Ammonia Losses
Amount (kg·N/ha)Seasonal Losses (%)Amount (kg·N/ha)Seasonal Losses (%)Amount (kg·N/ha)Seasonal Losses (%)Amount (kg·N/ha)Total Inputs (%)
LightCK7.65c44.53.84e22.45.69d33.117.18-
N758.90bc33.110.73d40.07.22c26.926.8535.8
N15010.02ab27.318.39c50.18.31b22.636.7224.5
N22510.03ab25.621.28b54.37.86bc20.139.1717.4
N30011.43a23.926.45a55.39.94a20.847.8215.9
ModerateCK6.55c41.25.04c31.74.32d27.215.91-
N7511.75b38.411.30b36.97.57c24.730.6240.8
N15011.23b32.114.38b41.19.34b26.734.9523.3
N22515.42a31.920.82a43.112.09a25.048.3321.5
N30015.27a30.422.95a45.711.95a23.850.1716.7
The means with the same letter in the same column have no statistical difference at a least significant difference (LSD) of 0.05.
Table 8. The influence of different nitrogen levels on the nitrogen use efficiency.
SoilTreatmentsGrains (g)Increase Yield Relative to CK (%)Crops and Soil Recovery Efficiency (%)Nitrogen Apparent Loss Rate (%)Physiological Efficiency (N·kg/kg)Nitrogen Agronomic Efficiency (N·kg/kg)
LightlyCK81.25c-----
N7599.75b22.857.1b42.9a35.9ab3.8b
N150101.25b24.658.5b43.1a31.3b6.4ab
N225115.75ab42.555.2b44.8a55.8a8.0a
N300121.25a49.267.8a32.2b50.7ab6.9ab
ModeratelyCK38.25e-----
N7545.75d19.649.5a50.5a24.8b5.2b
N15059.25c54.948.8a51.2a43.9ab7.3a
N22572.25b88.952.4a47.7a50.5a7.9a
N30087.25a128.151.5a48.5a48.1a8.5a
The means with the same letter in the same column have no statistical difference at a least significant difference (LSD) of 0.05.
Table 9. Relative increased rice grain yield and ammonia volatilization losses between treatments.
SoilTreatmentsGY-CK (g)GY-T (g)AV-CK (kg·N/ha)AV-T (kg·N/ha)
LightlyCK0 0
N7518.518.59.679.67
N150201.519.549.87
N22534.514.521.992.45
N300405.530.648.65
moderatelyCK0 0
N757.57.514.7114.71
N1502113.519.044.33
N225341332.4213.38
N300491534.261.84
GY-K: Increase yield relative to CK; GY-T: Relative increased rice grain yield between treatments; AV-CK: Increased ammonia volatilization losses relative to CK; AV-T: Relative increased ammonia volatilization losses between treatments. The data in the table are the averaged values. Control treatment (CK); nitrogen application rates were 75 (N75), 150 (N150), 225 (N225), and 300 (N300) kg·N/ha.

