Article

Multi-Objective Optimization for Equipment Capacity in Off-Grid Smart House

by
Yasuaki Miyazato
1,*,
Shota Tobaru
1,†,
Kosuke Uchida
2,†,
Cirio Celestino Muarapaz
1,†,
Abdul Motin Howlader
3,† and
Tomonobu Senjyu
1,†
1
Faculty of Engineering, University of the Ryukyus, 1 Senbaru Nishihara-cho Nakagami, Okinawa 903-0213, Japan
2
Department of Electrical Engineering, Faculty of Science and Technology, Tokyo University of Science, 2641 Yamazaki Noda, Chiba 278-8510, Japan
3
Hawaii Natural Energy Institute, University of Hawaii, Manoa Honolulu, HI 96822, USA
*
Author to whom correspondence should be addressed.
These authors contributed equally to this work.
Sustainability 2017, 9(1), 117; https://doi.org/10.3390/su9010117
Submission received: 16 August 2016 / Revised: 7 January 2017 / Accepted: 9 January 2017 / Published: 13 January 2017
(This article belongs to the Special Issue Sustainable Electric Power Systems Research)

Abstract

:
Recently, the off-grid smart house has been attracting attention in Japan for considering global warming. Moreover, the selling price of surplus power from the renewable energy system by Feed-In Tariff (FIT) has declined. Therefore, this paper proposes an off-grid smart house with the introduced Photovoltaic (PV) system, Solar Collector (SC) system, Hot Water Heat Pump (HWHP), fixed battery and Electric Vehicle (EV). In this research, a multi-objective optimization problem is considered to minimize the introduced capacity and shortage of the power supply in the smart house. It can perform the electric power procurement from the EV charging station for the compensation of a shortage of power supply. From the simulation results, it is shown that the shortage of the power supply can be reduced by the compensation of the EV power. Furthermore, considering the uncertainty for PV output power, reliable simulation results can be obtained.

1. Introduction

In recent years, as an alternative resource to replace fossil fuels, the development and spread of renewable energy have been deployed to suppress the temperature rise due to global warming [1]. It was agreed in the Conference of Parties 21 (COP21) in Paris in December 2015 that the average temperature rise of the world compared to before the Industrial Revolution has to be suppressed by less than two degrees. Therefore, further widespread usage of renewable energy needs to be world wide.
In Japan, the Feed-In Tariff (FIT) is performed, and renewable energy systems, such as Photovoltaic (PV) and Wind Generators (WG), are increasing. However, PV output power is limited because of the over adjustable amount. Furthermore, purchase price by FIT tends to reduce every year. Therefore, customers who are introducing PV are getting less from the sales of PV electric power.
On the other hand, the reduction of the electricity price is expected by competition between many electric power companies after liberalization of retail electricity sales by April 2016. However, in an area having a large number of remote islands, such as Okinawa in Japan, the transportation cost of fuel is high because there are mainly diesel electric power generation systems. Moreover, the entry of new electric power companies is difficult because of the small electric demand. Therefore, the electricity price is expensive, and it is considered that the price is kept after liberalization. Therefore, there is the need to introduce renewable energy, but that introduction is difficult because of the adjustable amount.
From the above analysis, buildings have introduced PV in these small islands that cannot utilize PV output power when connected to the power system of the electric power company. Additionally, electricity cost is high because the purchased power is high. Therefore, it is proposed that PV output power be only consumed in the building and not connected to the power system. Furthermore, if energy consumption of the building is supported by only renewable energy, the electricity cost tends to be zero, and carbon-dioxide emissions will be reduced. A house is not connected to the external power grid and gas line, the performances of which have been verified in [2]. Such a house is also effective when an electric outage occurs due to a natural disaster. Therefore, it is very effective in areas that have much typhoon damage, like Okinawa in Japan. However, there is very little research on the optimization of introduced capacity in an off-grid house, and multi-objective optimization for considering the procurement capability of energy by residents has not been studied yet [3]. On the other hand, there is research on the Net Zero Energy House (NZEH) [4,5]. NZEH has two good points. The first one is cost. Surplus power occurs by generating the same amount of purchased power. Therefore, the residents in NZEH can gain profits by selling surplus power. The second one is that the burden on the environment can be reduced. The consumption of primary energy can be reduced by using renewable energy without using fossil fuel. The off-grid house has these good points and the possibility to be better. Electricity bills have tended to increase in Japan since the Great East Japan Earthquake. However, PV panel costs and fixed battery costs are decreasing. Therefore, the off-grid house having PV and a fixed battery can result in decreasing operating costs and environmental burden compared with the conventional house.
This research proposes an off-grid smart house that includes PV, Solar Collector (SC), Hot Water Heat Pump (HWHP), fixed battery and Electric Vehicle (EV). For the off-grid house, there is a research of minimizing for operation cost [6]. In [6], the loads are operated, but the procurement of electricity is not discussed. Therefore, it is desired to operate the equipment considering the procurement capability of residents.
The SC is effective in areas where the amount of solar radiation is high, such as Okinawa, and it is possible to efficiently heat water using the HWHP [7,8]. Furthermore, by using the fixed battery in addition to the PV, the battery is charged when there is PV surplus power, and it discharges to the house when there is a shortage of power. Therefore, it is possible to regulate the power for a house-owner using the charging and discharging of the fixed battery. However, large equipment is needed because this method uses large PV output power and a fixed battery. Therefore, if it is possible to compensate the shortage of energy from the charging EV, it is possible to reduce the introduced equipment costs. In this research, it is possible to procure the needed energy from the charging EV at the EV charging station. In recent years, the EV charging station has been developed by the PV system; hence, it is possible to procure energy that comes from 100% renewable energy [9,10]. Therefore, in this research, the proposed smart house is required to solve a multi-objective optimization problem to minimize the amount of energy procurement from the EV and the capacity of PV and the fixed battery [11,12]. Here, the amount of energy procurement is equal to the shortage of power in the off-grid smart house, and it is the difference between the PV cost and the fixed battery cost per one unit.
Therefore, in this research, the problem addressed is to minimize the Rate of Supply Power Shortage(RSPS) and equipment costs of PV and the fixed battery in the smart house. A multi-objective optimization problem has been designed, and optimal equipment capacity has been shown for the off-grid house. Furthermore, It is shown that the proposed off-grid smart house can run without a shortage of power because it can compensate the shortage of power from the charging EV. Extensive simulation analyses have been done by MATLAB software.

Contributions of This Paper

This paper’s contributions are the HWHP model, the compensation model and simulation through a year considering uncertainty. Power consumption due to housing heat supply can be determined by using the HWHP model. The shortage of the power occurring for the off-grid smart house can be compensated by using the compensation model of EV. Simulation through a year considering uncertainty can indicate equipment capacity and the cost for operation. This paper discusses these models and the simulation results.

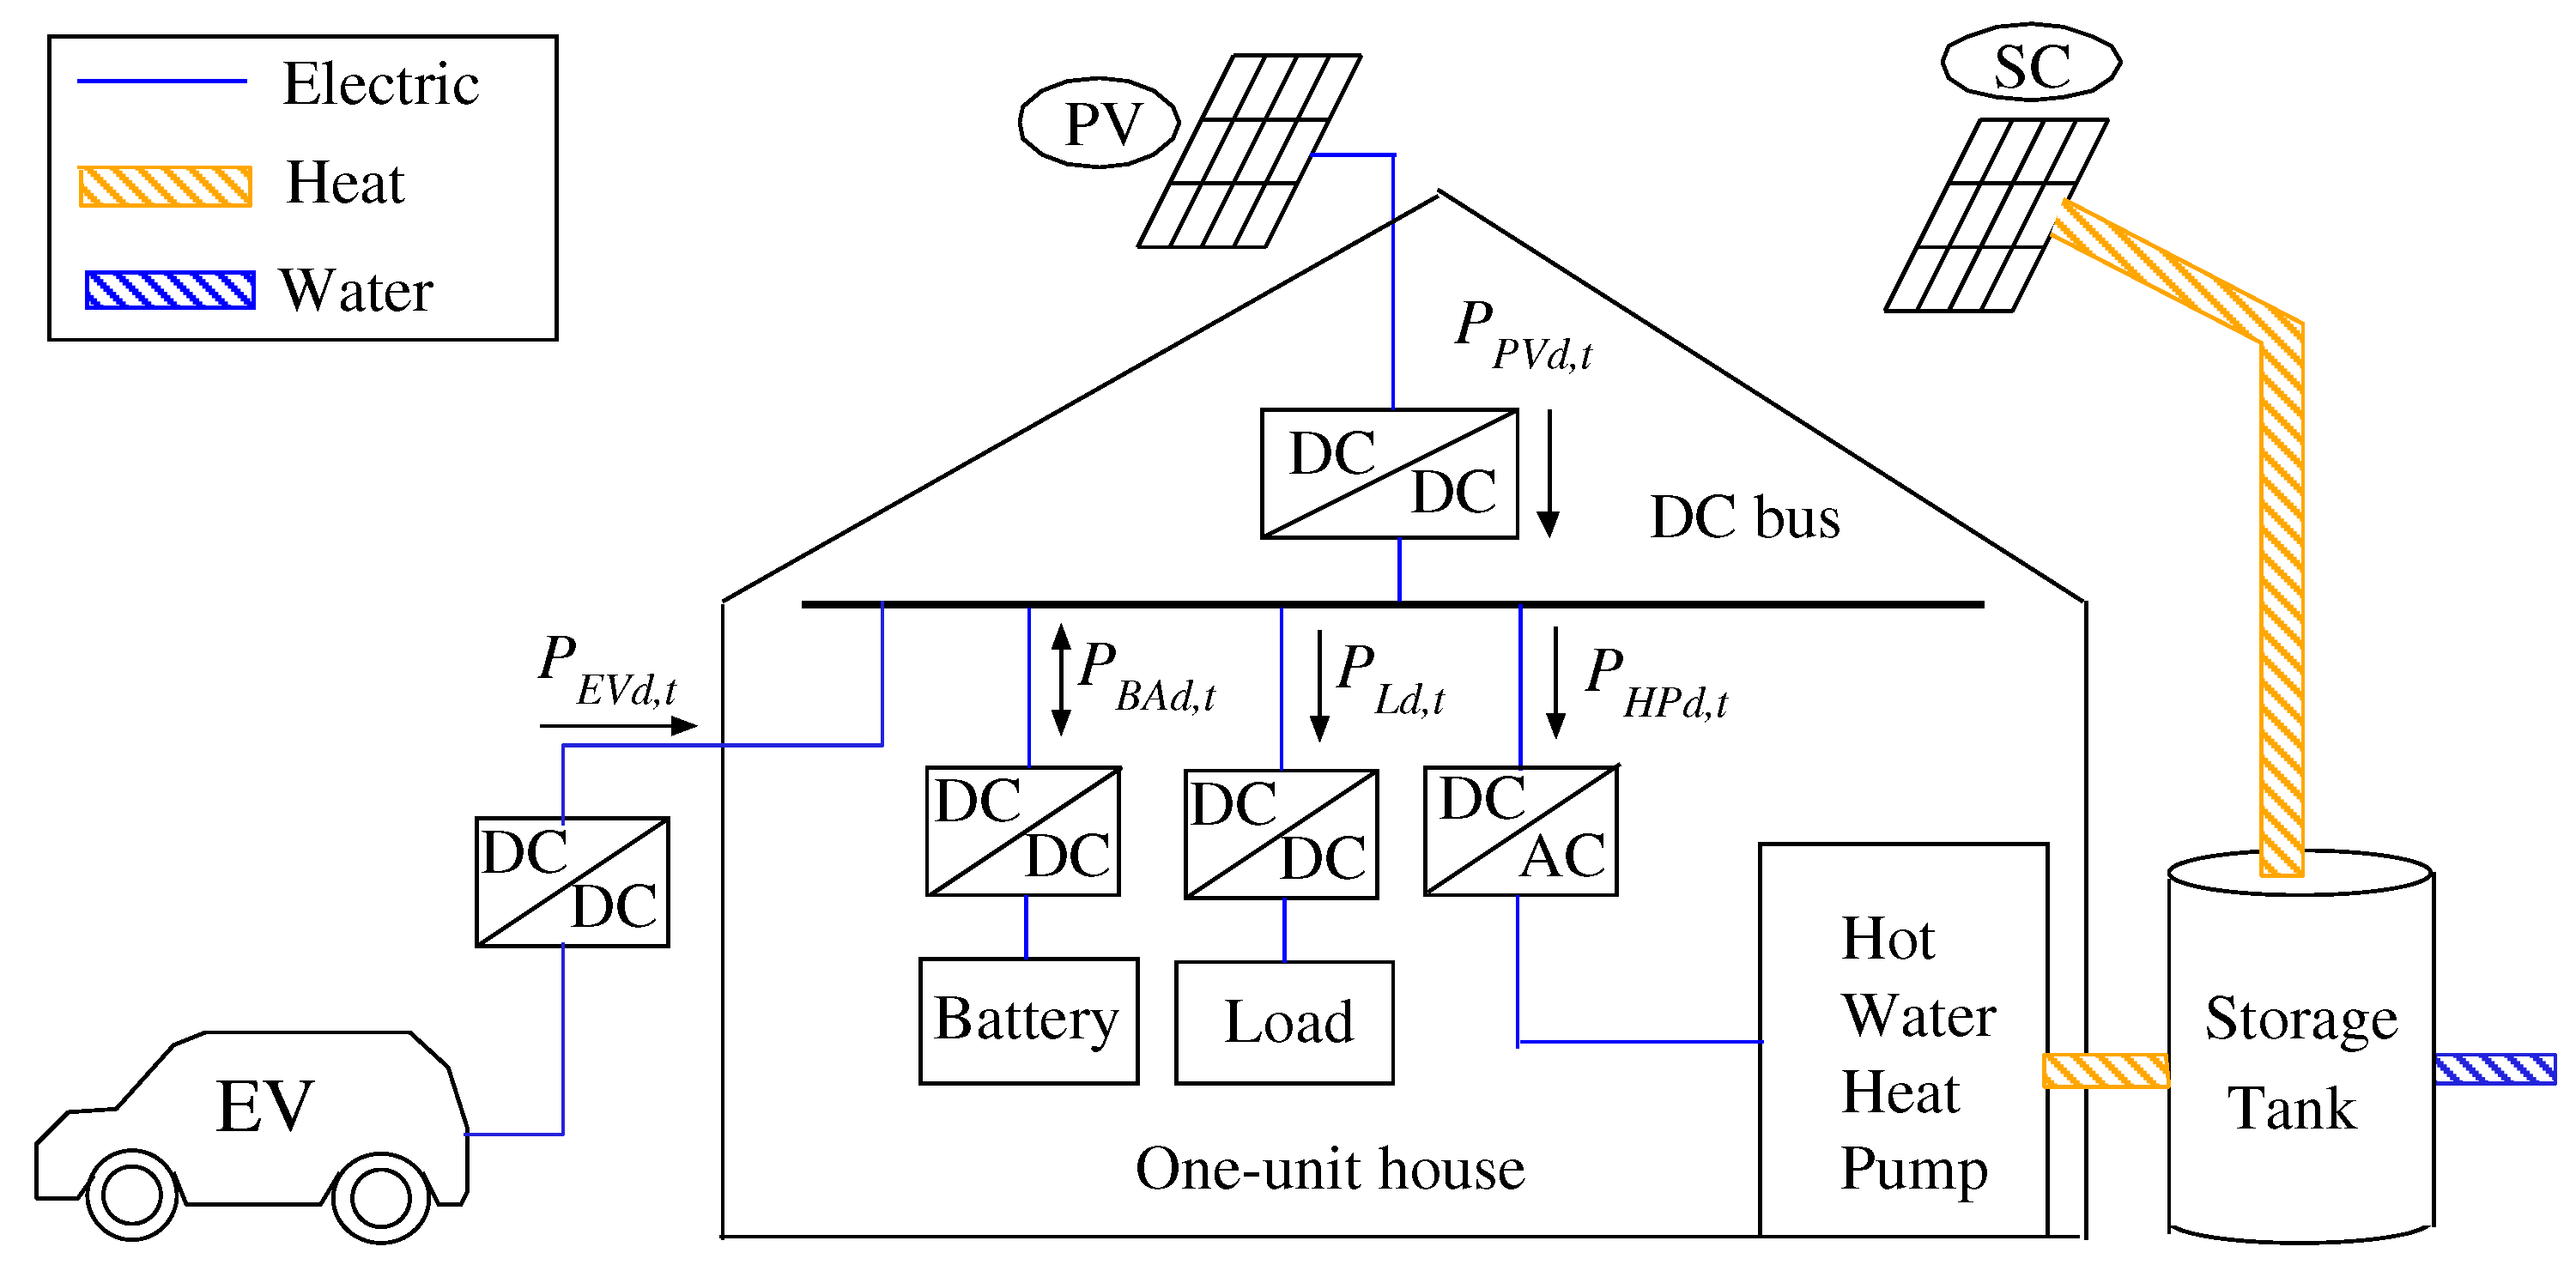
2. Off-Grid Smart House Model

The off-grid smart house model is illustrated in Figure 1. This model includes PV, SC, HWHP, the fixed battery and EV. P L d , t (kW), P H P d , t (kW), P P V d , t (kW), P B A d , t (kW) and P E 2 H d , t (kW) in Figure 1 are the power consumption of the house, the power consumption of HWHP, the PV power output, the charge and discharge power of the fixed battery and the discharge power from EV at time t of operation date d. The power supply from PV and the fixed battery is proportional to the magnitude of the capacity. The EV is used as a vehicle from 8:00 a.m.–18:00 p.m. every day and connected to the house at other times. Furthermore, the EV is charged at an EV charging station.
In this section, the mathematical model of each system is described. The photovoltaic system, solar collector system and fixed battery model are each explained in Section 2.1, Section 2.2 and Section 2.3, respectively.

2.1. Photovoltaic System

The output power of PV is calculated by the following equation [13]:
P P V = N P V η P V S P V I A t ( 1 0.005 ( T C R t 25 ) )
where P P V is output power of PV, η P V (%) is the conversion efficiency of the solar cell array, N P V is the number of panels, S P V (m2/panel) is the array area per panel, I A t (kW/m2) is the amount of solar radiation per panel and T C R t (°C) is the cell temperature. In this research, the cell temperature is the outside air temperature for simplicity. The output power of PV P P V d , t (kW) at time t of operation date d is proportional to the number of PV panels N P V .

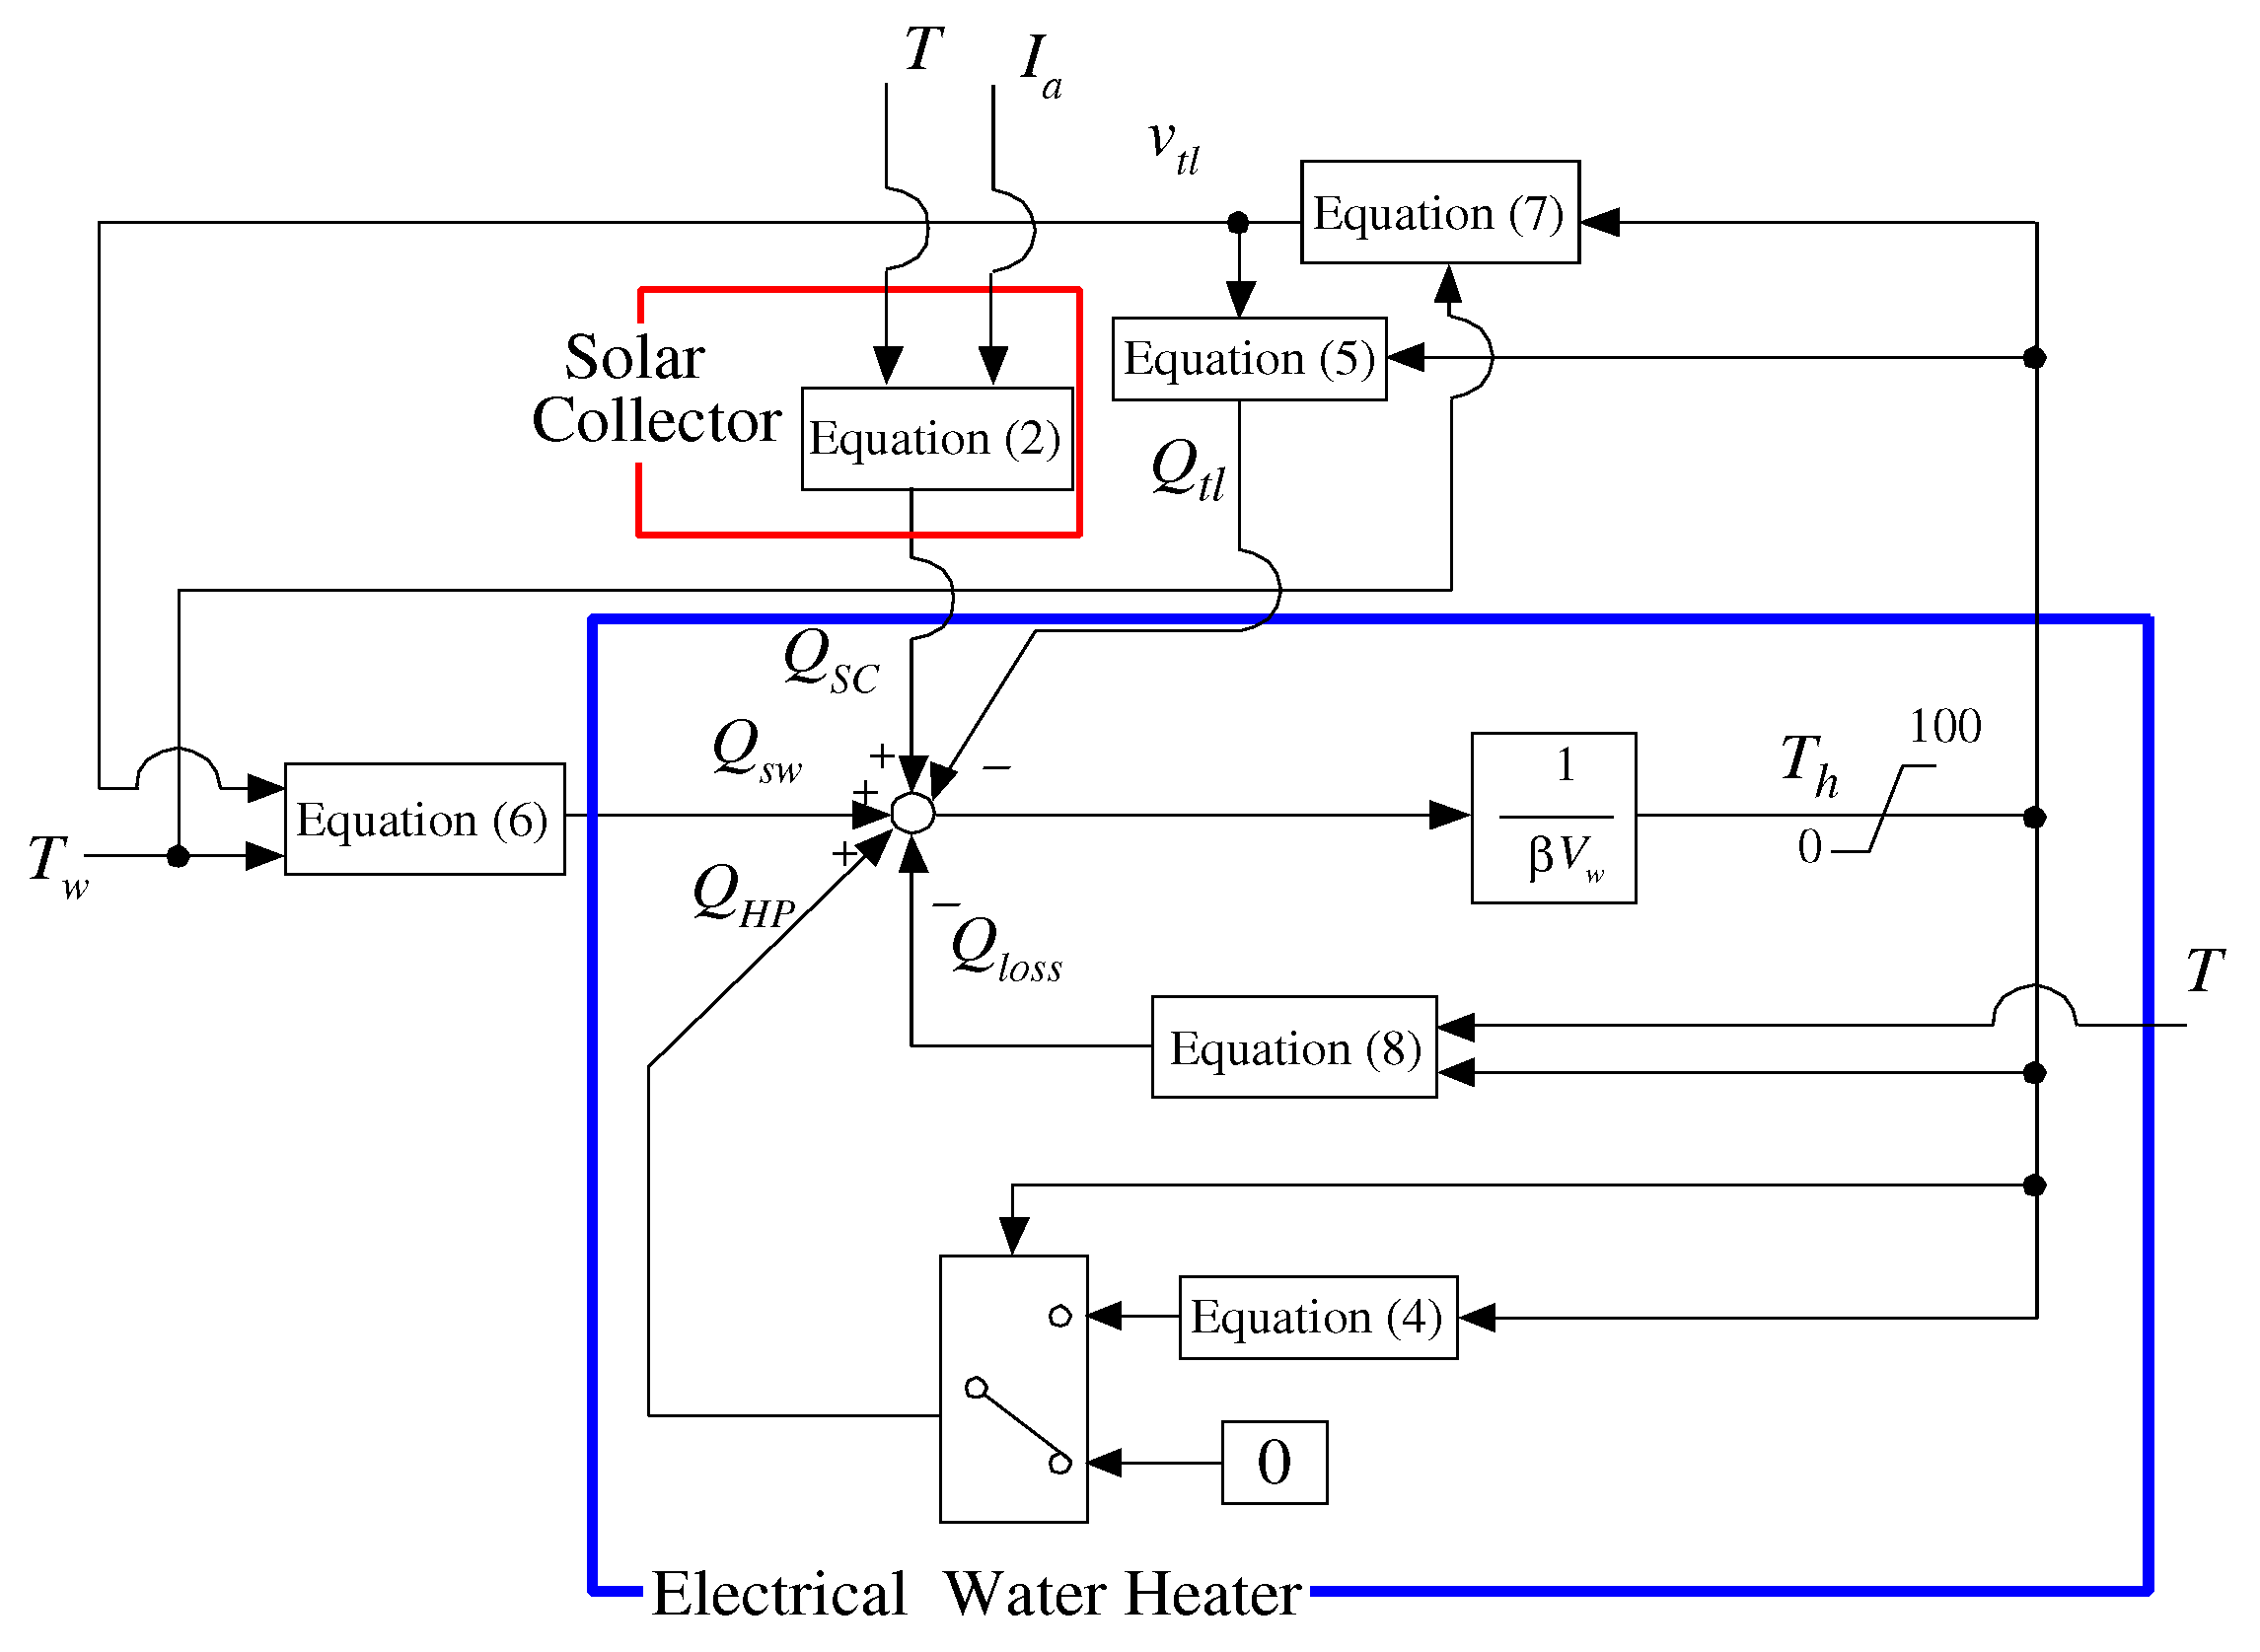
2.2. Solar Collector System

The mathematical model of the solar collector system is illustrated in Figure 2 [7]. The solar power is obtained by the solar collector Q S C (kW), which is calculated by the following equation:
Q S C = { F R ( τ α ) e I a F R U L ( T h T ) } S S C
where F R is heat removal efficiency, ( τ α ) e is the effective transmission absorption factor, U L (kW/(m2·°C)) is the integrated solar thermal loss coefficient, T h (°C) is the hot water temperature in the storage tank, T (°C) is the outdoor temperature and S S C (m2) is the solar collector area per collector ( S S C = 4.8 m2). In Equation (2), the value F R ( τ α ) e is 0.77, and the value F R U L is 5.0 × 10⁻³ (kW/(m2·°C)). Furthermore, the angle of inclination of the thermal collector panel is 30 degrees.
The dynamic characteristics and temperature change of the water in the storage tank can be expressed by the following equation:
( 3 ) Q S C + Q H P Q t l + Q s w Q l o s s = β A w d T h d t ( 4 ) Q H P = β A w ( T d T h ) ( 5 ) Q t l = β v t l T h ( 6 ) Q s w = β v s w T s w ( 7 ) v t l = v s w ( 8 ) Q l o s s = U s t ( T h T )
where Q H P (kW) is the thermal dose from HP, Q t l (kW) is the thermal energy for hot water supply, Q s w (kW) is the thermal energy from the water supply, Q l o s s (kW) is the thermal energy of heat transmission between the hot water temperature in the storage tank and the outside temperature, β (kW/(L·°C)) is the volumetric specific heat of water, A w (L) is the storage tank capacity, t (h) is time, T d (°C) is the target temperature, v t l (L/h) is the amount of used hot water from the storage tank, v t l (L/h) the amount of supplied water to the storage tank, T s w (°C) is the city water temperature, v t l (L/h) is the amount of supplied hot water to the house and U s t (kW/°C) is the heat loss coefficient of the storage tank between the storage tank and the outside temperature.
The flowchart for the HWHP of the annual operation plan is illustrated in Figure 3. In this research, the hot water is used every night throughout the year, and the target temperature, which is the hot water temperature in the storage tank, is 50 °C at 8:00 p.m. If the hot water is heated by the solar energy from the SC and it is less than the target temperature, the HWHP will be used to heat the water up to the target temperature. Here, the capacity of the storage tank is 370 L; the rated heating capacity is 1 kW/4 kW; and the value of COP is 4.0.

2.3. Fixed Battery Model

The charge and discharge power P B A d , t (kW) and the remaining energy amount C B A d , t (kWh) of the fixed battery at time t of operation date d are calculated by the remainder of the PV output power P P V d , t and total consumption power P L d , t + P H P d , t .
Case A1:
( P L d , t + P H P d , t < P P V d , t ): When the PV system of the smart house generates surplus power, according to the following equation, the fixed battery will be charged.
( 9 ) P P V 2 H d , t = P L d , t + P H P d , t ( 10 ) P P V 2 B d , t = P P V d , t P P V 2 H d , t ( 11 ) C B A d , t = C B A d , ( t 1 ) + P B A d , t η B A Δ t i f P P V 2 B d , t > 0
where P P V 2 H d , t (kW) is the power supply from PV to the fixed battery, P P V 2 B d , t (kW) is the power supply from PV to EV, η B A (%) is the charge and discharge efficiency of fixed battery and Δ t (hour) is length of time ( Δ t = 1 (hour)).
Case A2:
( P L d , t + P H P d , t P P V d , t ): When the PV system of the smart house generates a shortage of power, according to the following equation, the fixed battery will be discharged.
( 12 ) P B 2 H d , t = P L d , t + P H P d , t P P V d , t ( 13 ) C B A d , t = C B A d ( t 1 ) P P V d , t η B A Δ t i f P B 2 H d , t > 0
Here, P B 2 H d , t (kW) is the power supply from the fixed battery to the house.

3. Evaluation the Model of the System Capacity

In this section, the evaluation of the capacity of PV and the fixed battery model for the off-grid smart house is proposed. This model can calculate the Rate of Supply Power Shortage (RSPS) (%) of the house, the annual system cost of PV and the fixed battery and the power supply from EV to the house to compensate the shortage of power supply.
The calculation method of annual RSPS, the calculation method of annual system cost, the calculation method of the power supply from EV and the evaluation algorithm of equipment capacity are each described in Section 3.1, Section 3.2, Section 3.3 and Section 3.4, respectively.

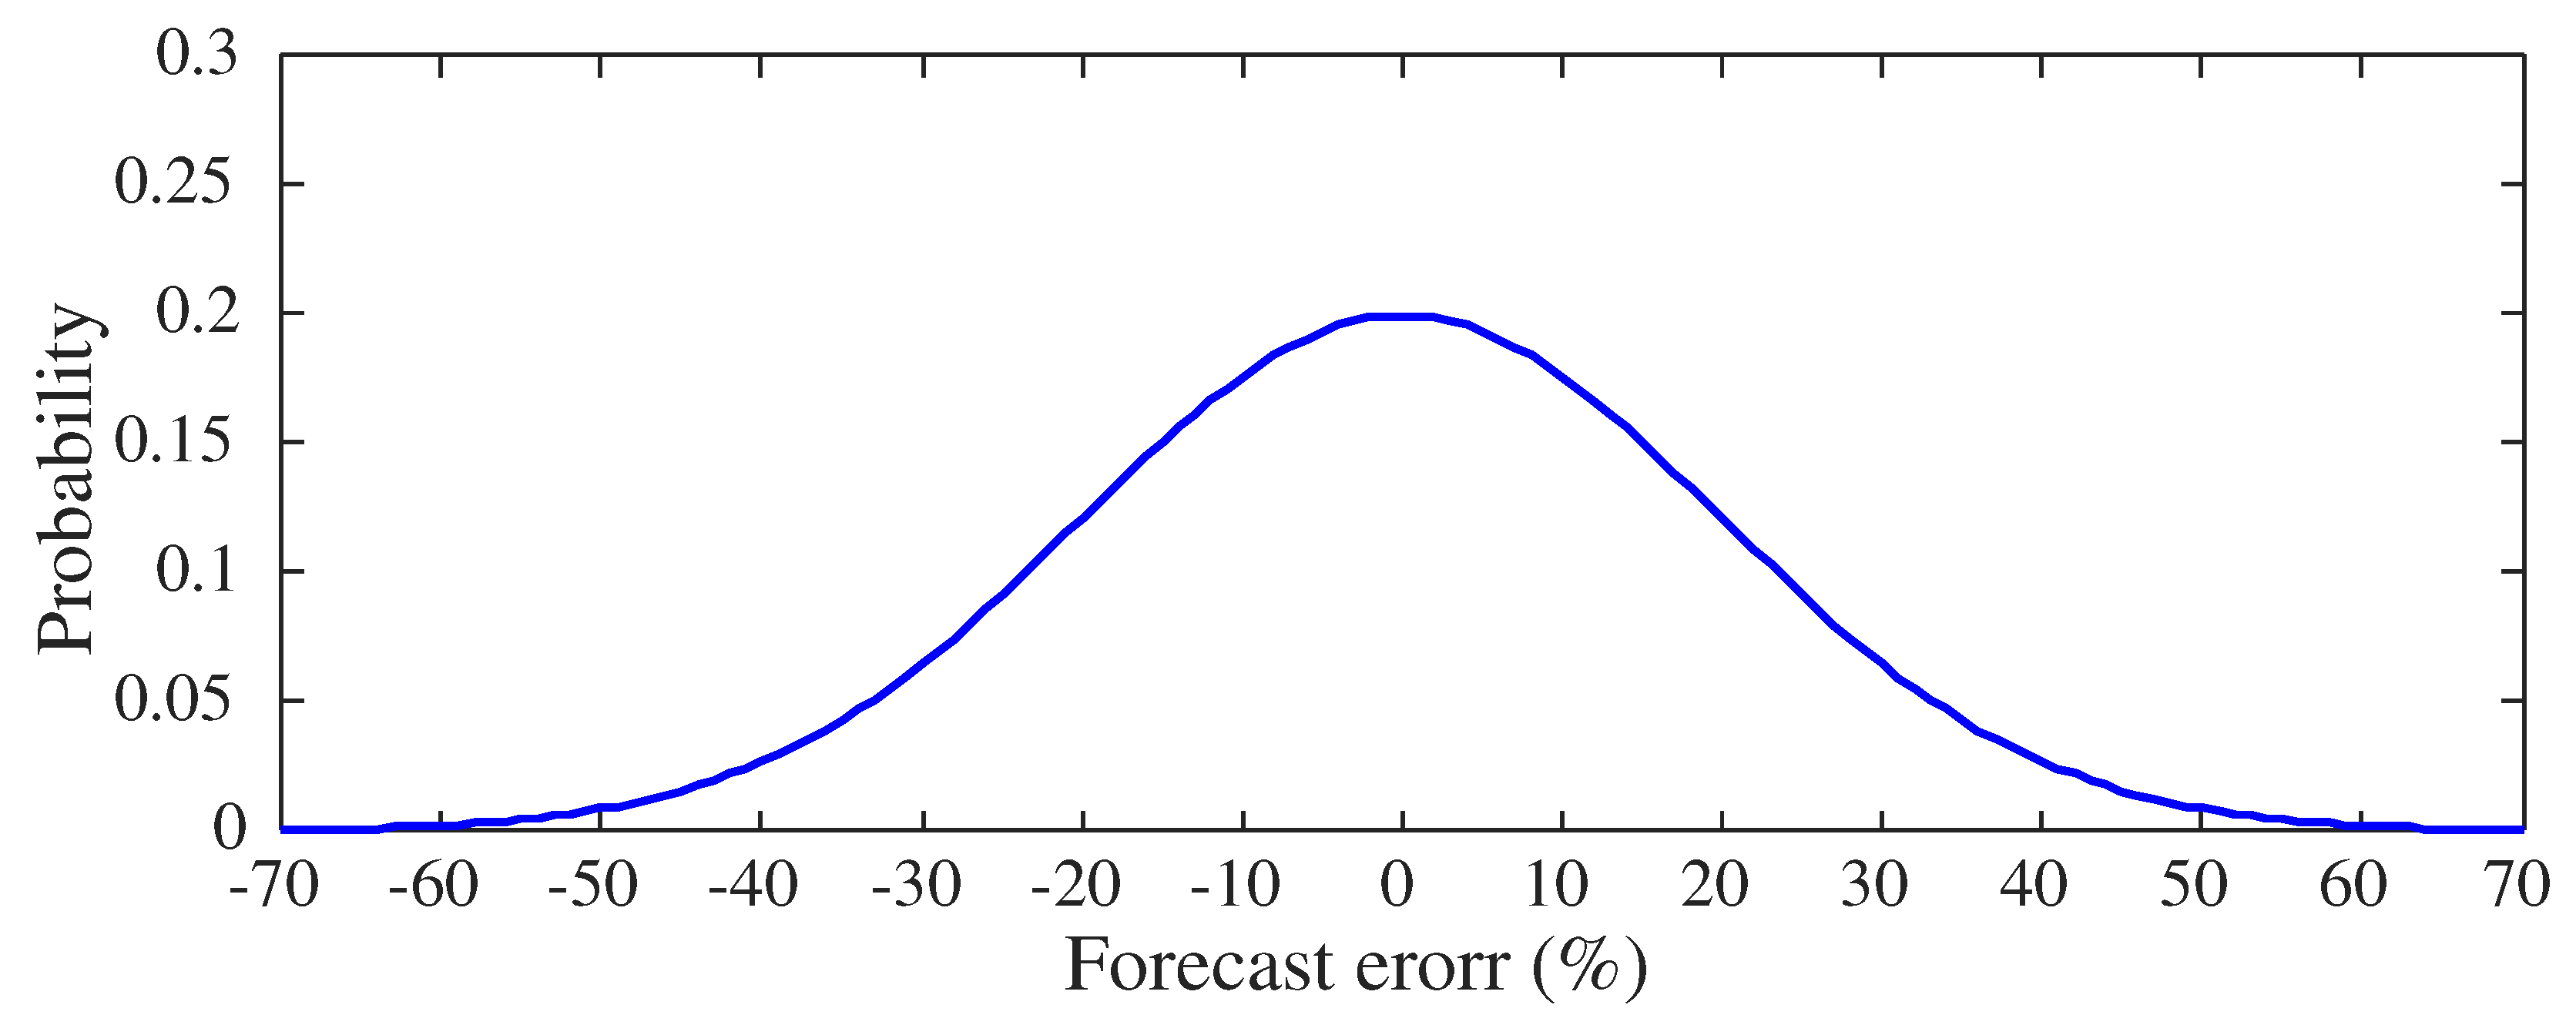
3.1. Estimation of the Shortage of Power Supply

When the shortage of the power supply occurs at time t of operation date d, the following equation is obtained from the relationship between the supply and demand balance:
P S d , t = P L d , t + P H P d , t P P V d , t P B 2 H d , t
Therefore, annual RSPS is calculated by the following equation:
R S P S = d = 1 365 t = 1 24 P S d , t P L d , t + P H P d , t Δ t × 100

3.2. Estimation of Annual System Cost

The annual system cost of PV and fixed battery C P B y (×104 Yen) is calculated by the following equation:
C P B y = C P V p a n e l N P V + C B A u n i t N B A Y l i f e
where C P V p a n e l × 104 (Yen/panel) is the system cost of PV, C B A u n i t × 104 (Yen/unit) is the system cost of fixed battery, N P V (panel) is the number of PV panels, N B A (unit) is the number of fixed batteries and Y l i f e (year) is the usable years.

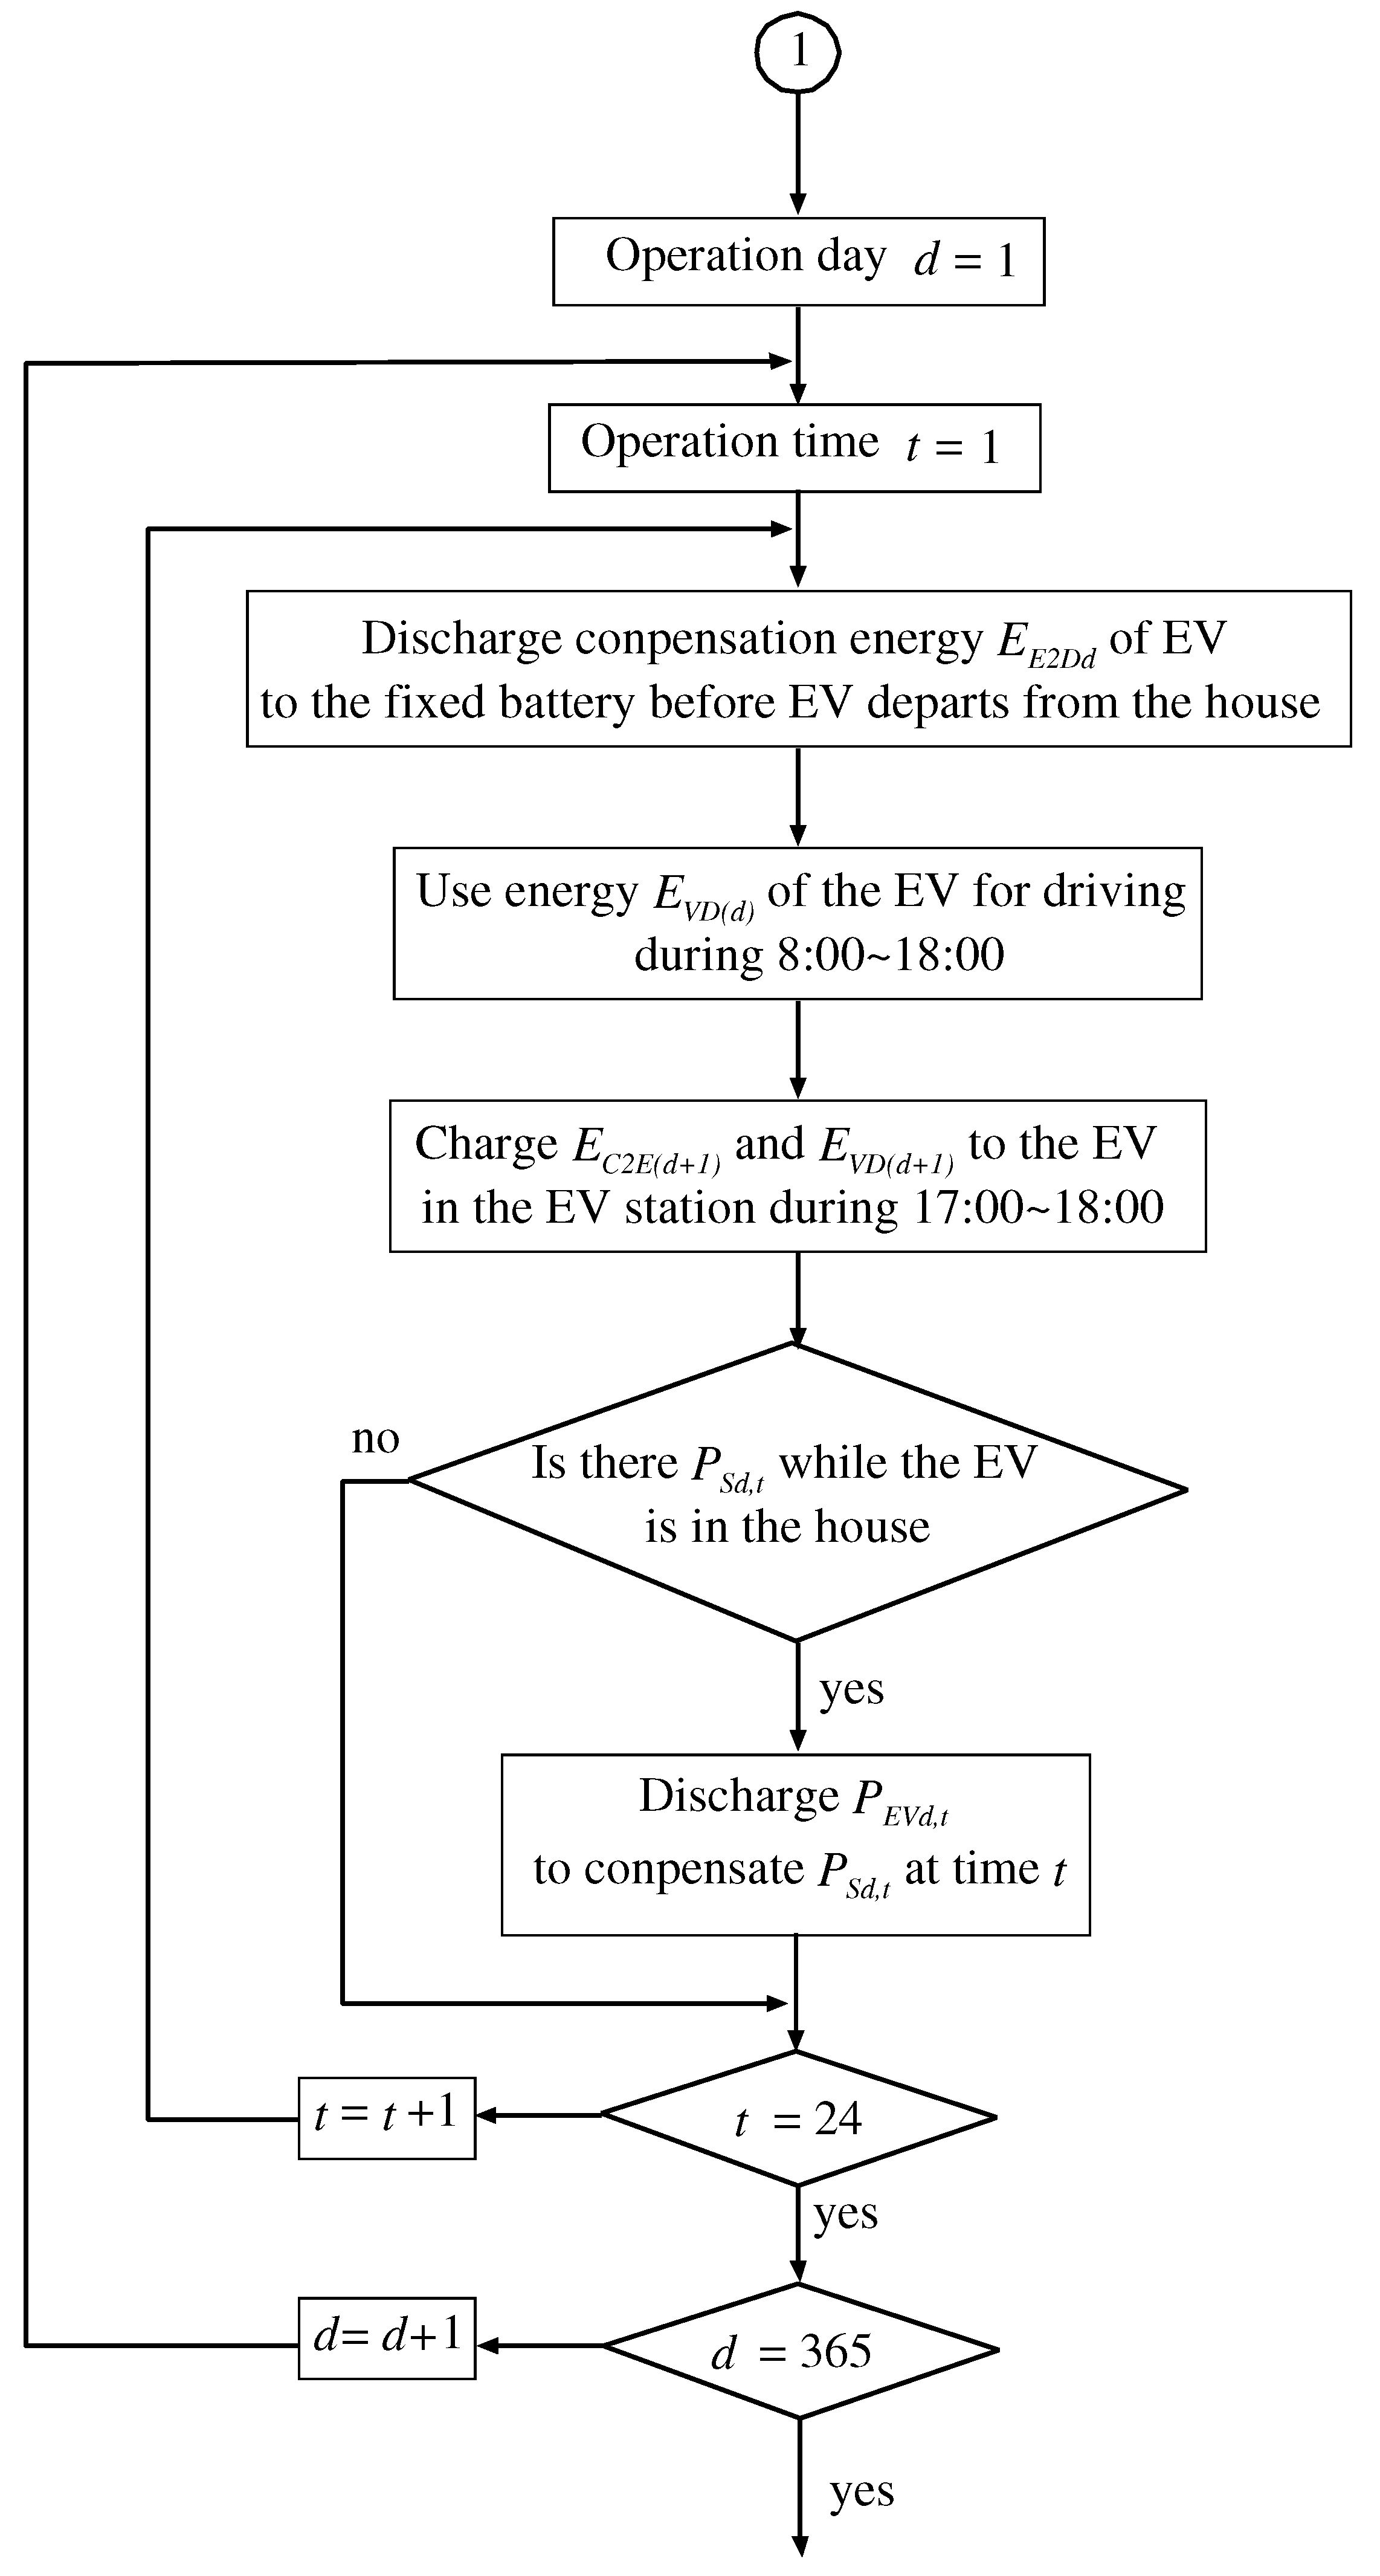
3.3. Shortage of the Power Supply Compensation Model Using EV

When power supply from EV P E V d , t ( P E V d , t > 0 ) (kW) compensates the shortage of power supply P S d , t , the power supply considers two cases depending on the time when this occurred P S d , t .
Case B1:
( P S d , t occurs when the EV is connected)
The power supply from EV to the house P E 2 H d , t (kW) compensates the shortage of the power supply P S d , t at time t of date d.
( 17 ) P E 2 H d , t = P E V d , t = P S d , t ( 18 ) P L d , t + P H P d , t = P P V d , t + P B A d , t + P E 2 H d , t i f P B A d , t > 0
Case B2:
( P S d , t occurs when EV is not connected)
Shortage of the power supply E E 2 B d (kWh) when EV is not connected to the house and the shortage of the power comes from the fixed battery at 8:00 a.m. of the operation date d, before EV leaves the house.
( 19 ) E E 2 B d = t = 9 18 P S d , t Δ t ( 20 ) C B A d , ( t = 9 ) = C B A d , ( t = 8 ) + E E 2 B d ( 21 ) C E V d , ( t = 9 ) = C E V d , ( t = 8 ) E E 2 B d η B A η E V
Here, C B A ( t = 9 ) and C B A ( t = 8 ) (kWh) are the amount of energy remaining at 9:00 a.m. and 8:00 a.m.
EV is charged with the compensation energy for the next day E C 2 B ( d + 1 ) at 17∼18 of the operation date d. The charging is conducted at the EV charging station.
( 22 ) E C 2 E ( d + 1 ) = t = 1 24 P S ( d + 1 ) , t Δ t ( 23 ) C E V d , ( t = 18 ) = C E V d , ( t = 17 ) + E C 2 E ( d + 1 ) + E V D ( d + 1 )
Here, E V D ( d + 1 ) (kWh) is the energy necessary to use it as a vehicle for the next day d + 1 .
From the above, shortage of the power supply after compensation P C S d , t (kW) is obtained by the following equation:
P C S d , t = P L d , t + P H P d , t P P V d , t P C B A d , t P E 2 H d , t
where P C B 2 H d , t is discharge power from the fixed battery to the house after compensation.

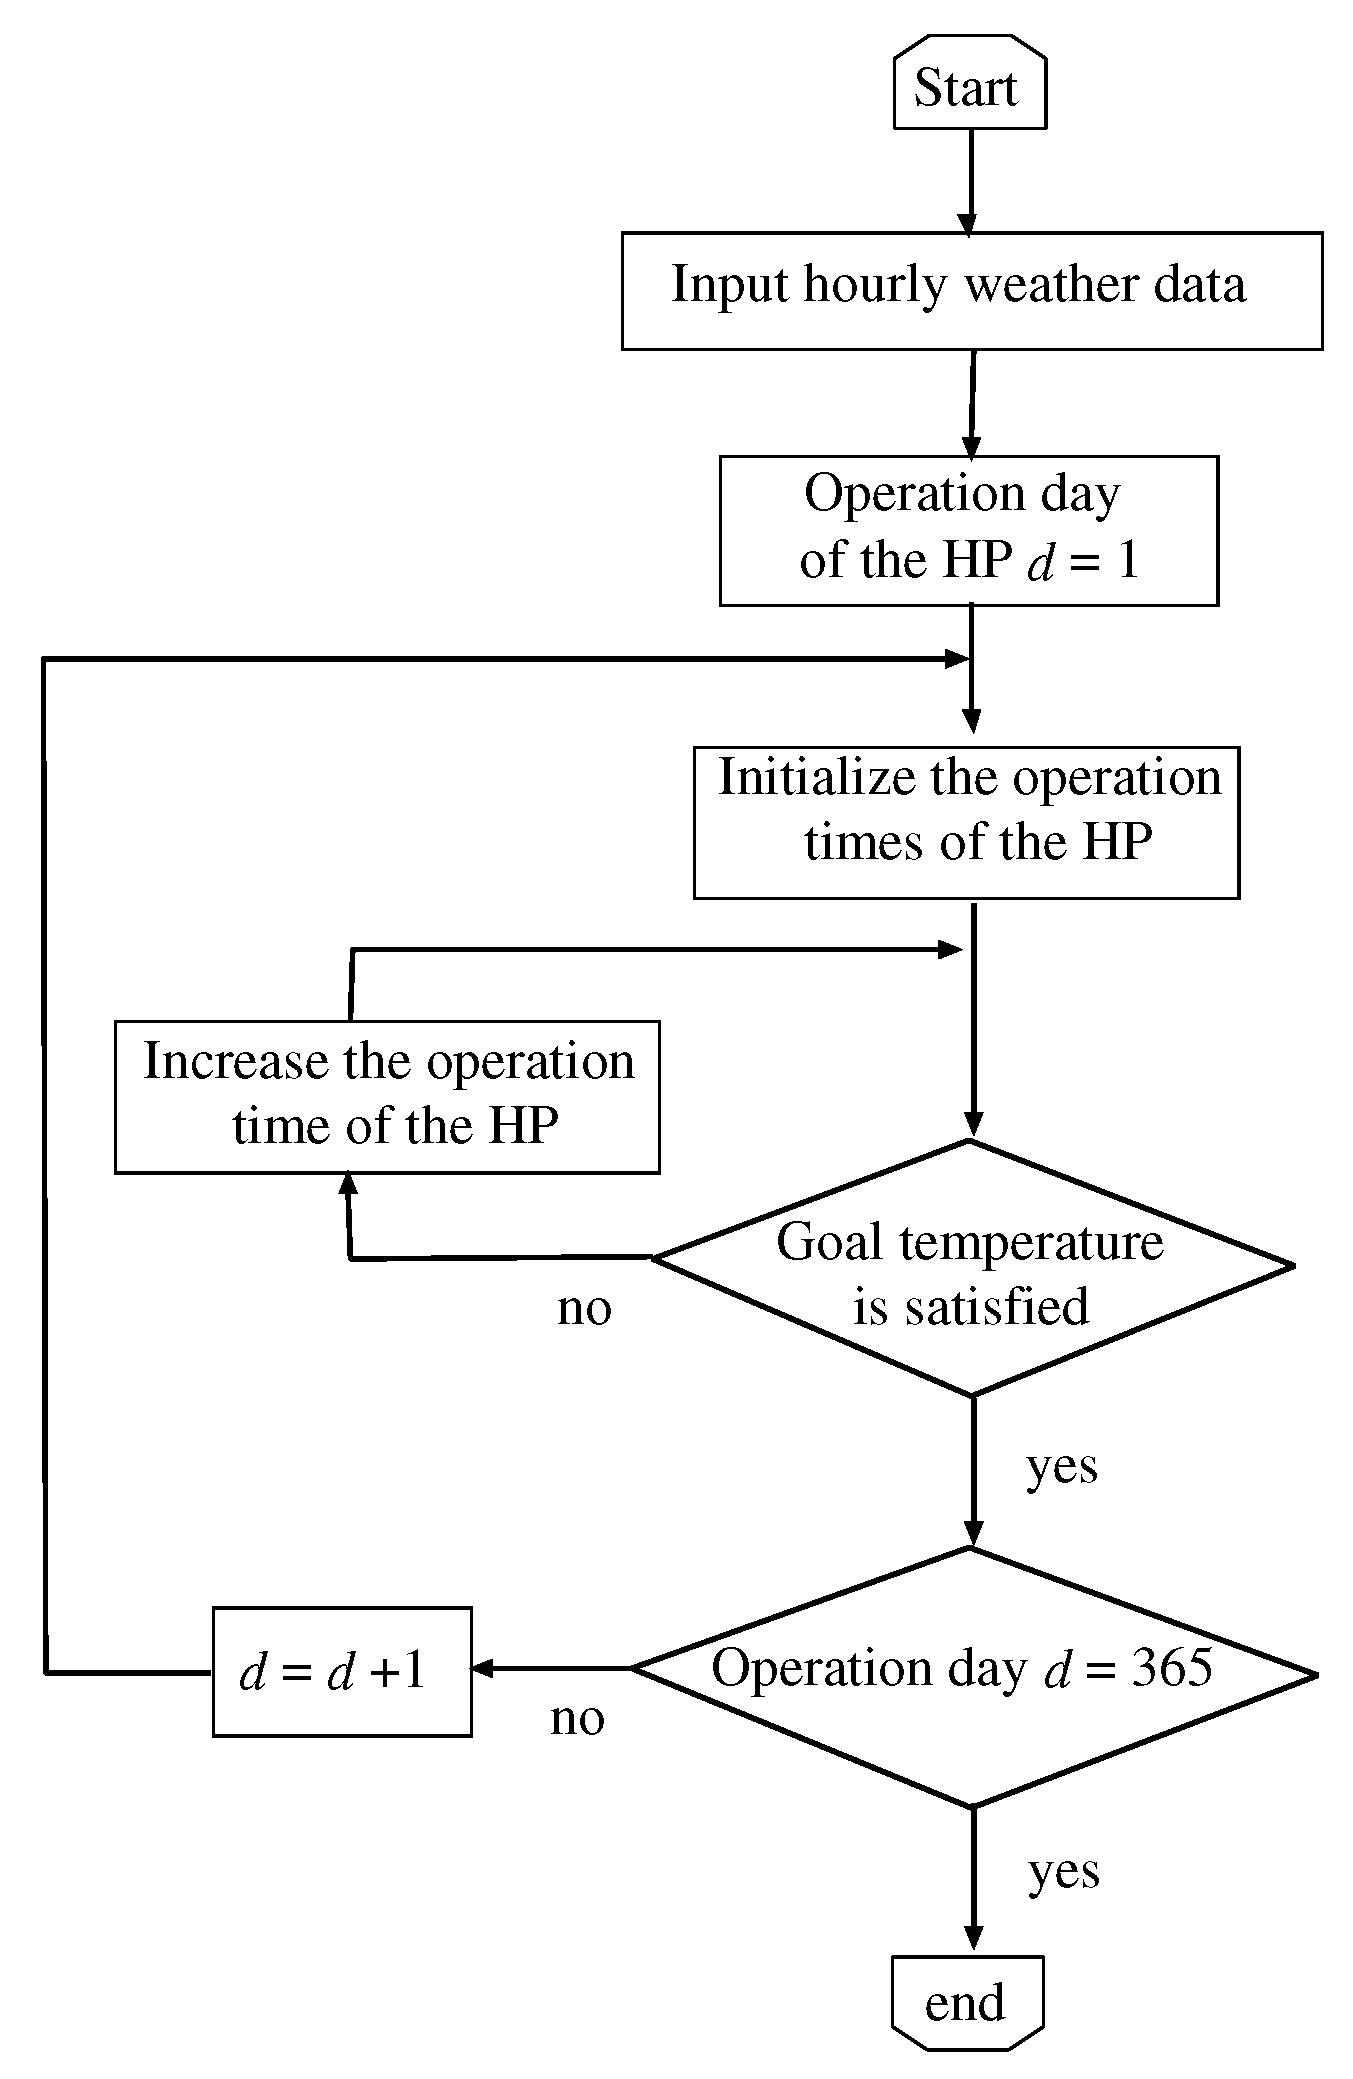
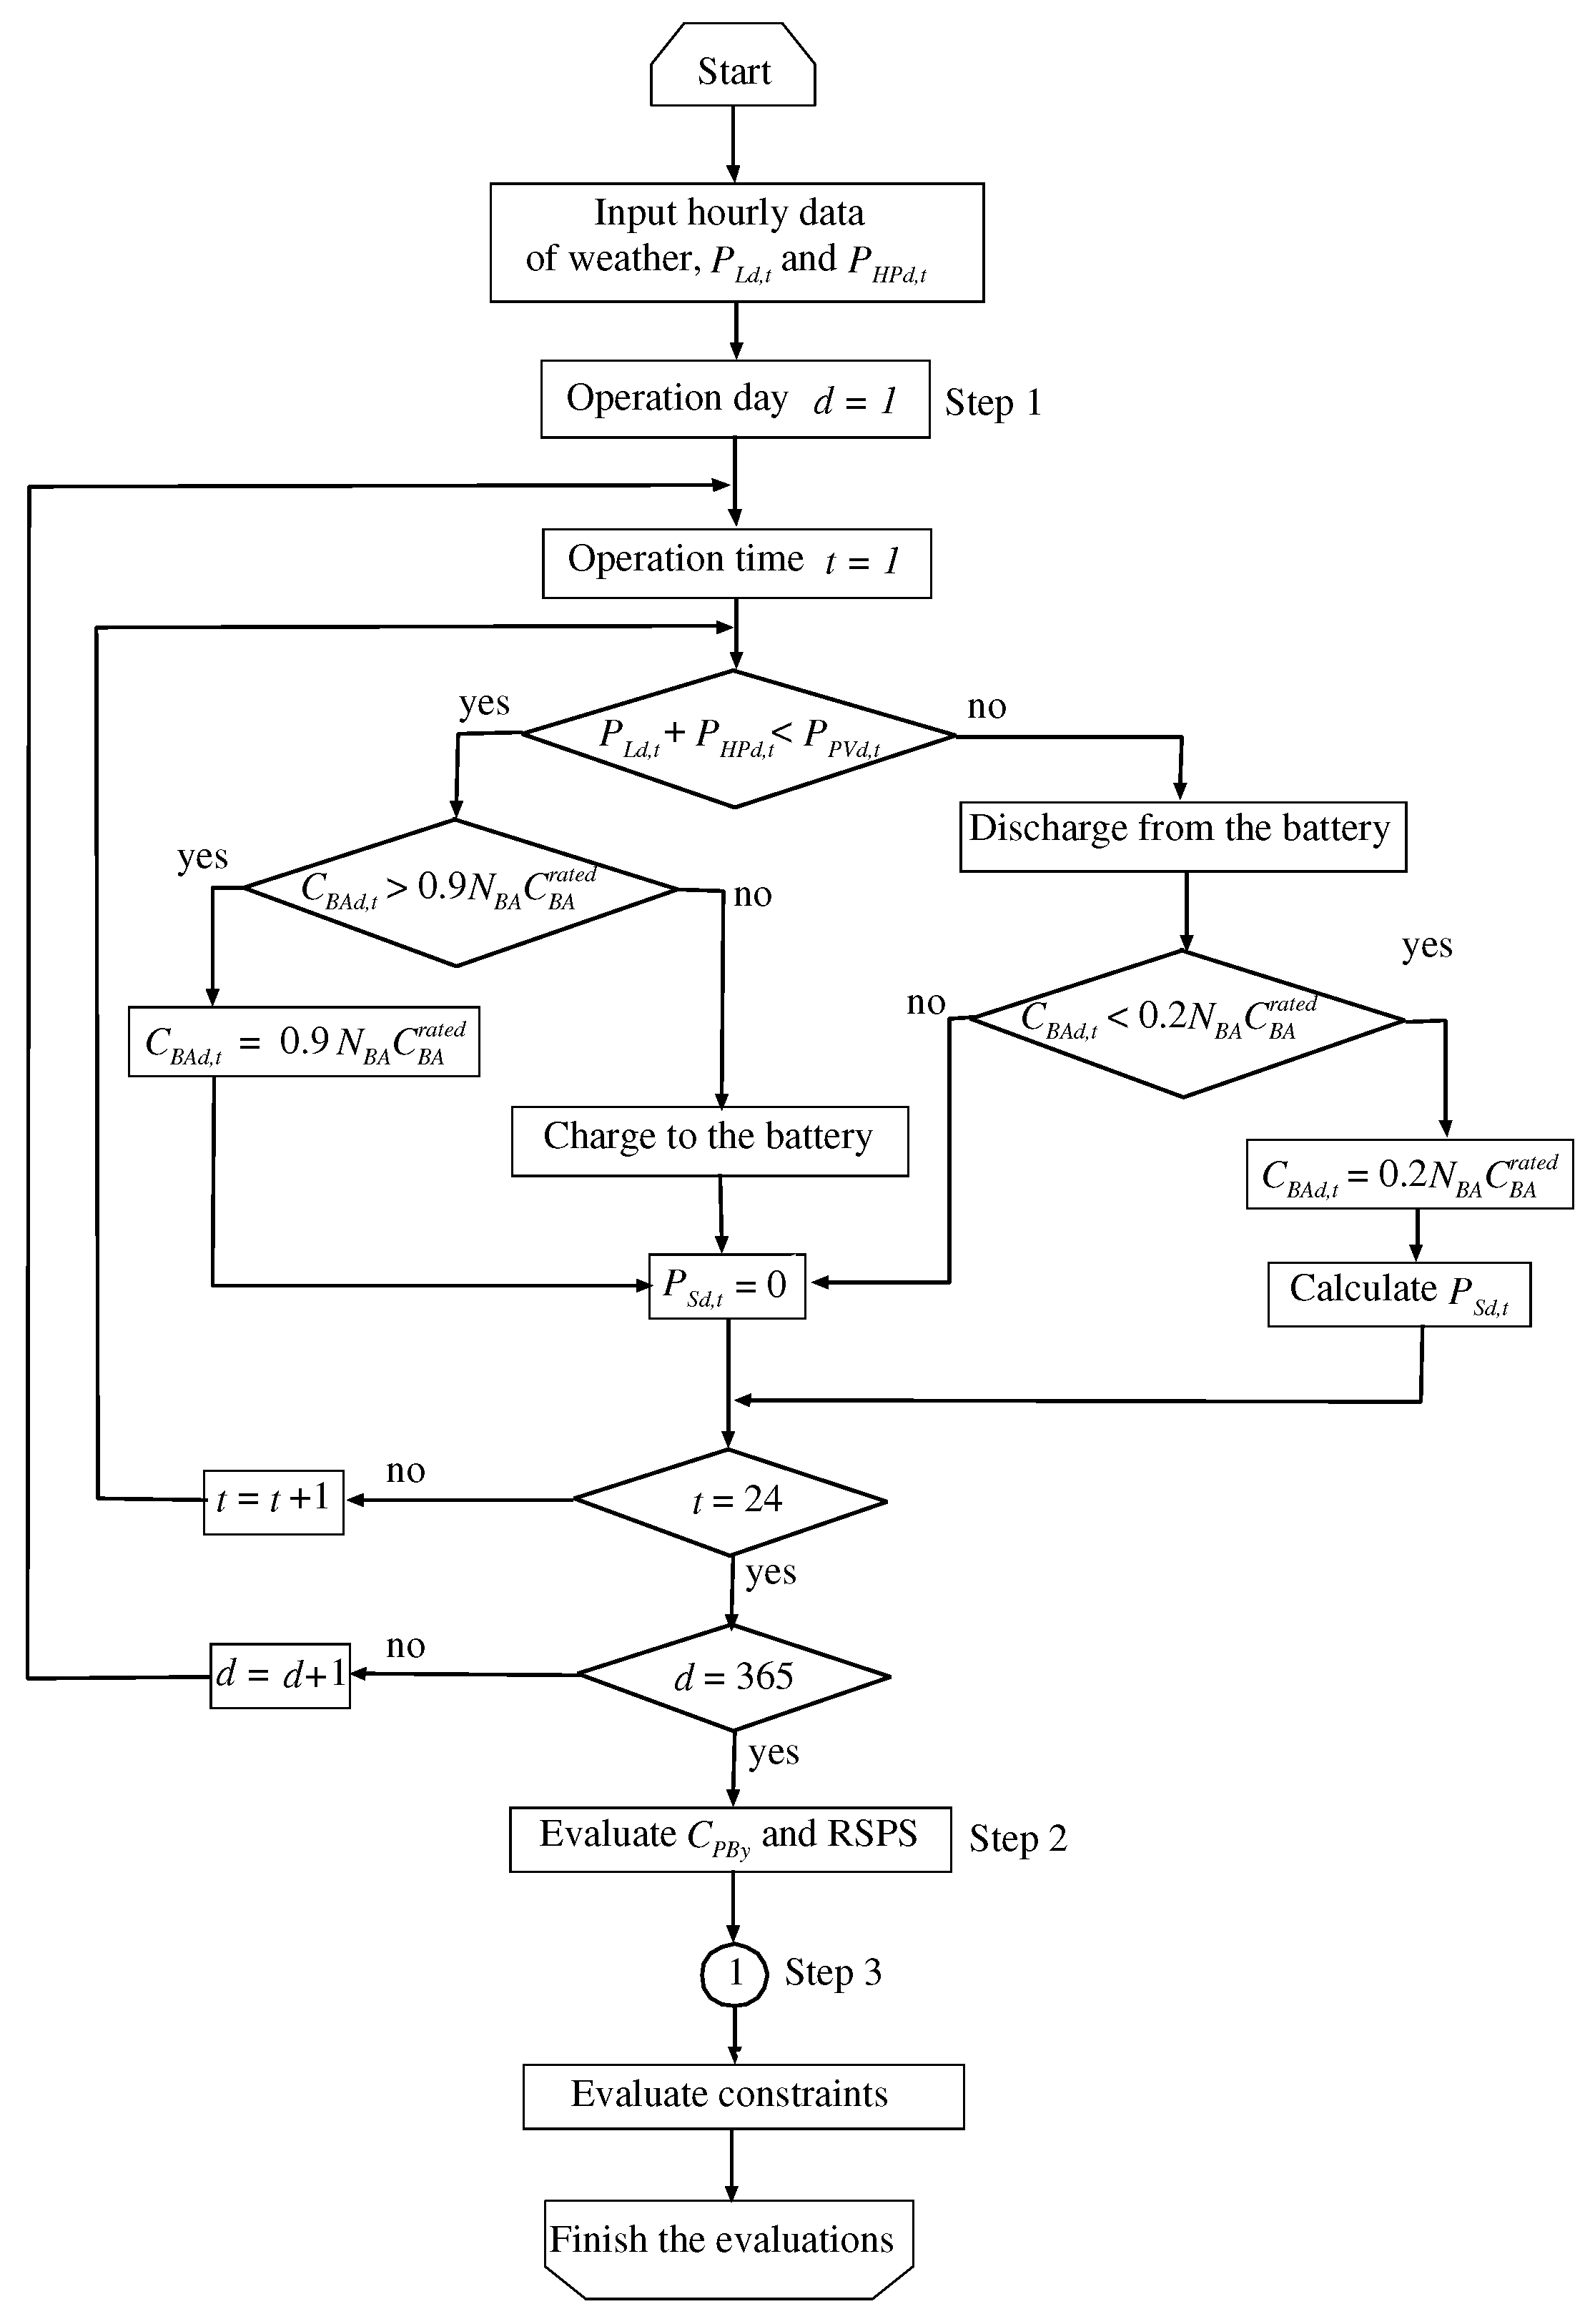
3.4. Capacity-Evaluating Algorithm

A flowchart of the capacity-evaluating algorithm is illustrated in Figure 4, and a flowchart of the shortage of the power supply compensation model is illustrated in Figure 5. The procedure of this algorithm is described below:
Step 1:
Calculate P P V d , t and P B A d , t from a given capacity.
Step 2:
Calculate system cost C P B y and the Rate of Supply Power Shortage R S P S .
Step 3:
Compensate annual shortage of the power supply from EV.

4. Problem Formulation and Optimization Method

In this section, the formulation of the multi-objective optimization problem and the optimization method of this research are described. Objective functions and constraints for this multi-objective optimization problem are described in Section 4.1, and the multi-objective optimization method is explained in Section 4.2.

4.1. Objective Function and Constraints

In this research, the minimization of the annual equipment costs of the PV system and the fixed battery C P B y (×104 Yen) is performed, and the Rate of Supply Power Shortage RSPS (%). Considering the prediction error of PV output power, it is possible to optimize this [14,15]. Therefore, PV output power has uncertainty, which is based on the normal distribution function, as illustrated in Figure 6, and several scenarios are considered. Objective functions minimize the expected value of the created scenarios.
Objective functions:
M i n i m i z e F { F 1 , F 2 }
( 26 ) F 1 = s = 1 S P s d = 1 365 t = 1 24 P S d , t s P L d , t + P H P d , t Δ t × 100 ( 27 ) F 2 = C P B y
Here, objective function F 1 is minimizing the expected value of RSPS, and objective function F 2 is minimizing the annual system cost.
Furthermore, P s is the probability of scenario s and P S D , t s (kW) is the shortage of the power supply of scenario s. Constraint conditions are as follows.
Constraint conditions:
( 28 ) P P V d , t N P V P P V r a t e d ( 29 ) | P B A d , t | N B A P B A , i n v r a t e d ( 30 ) P E 2 H d , t P E V i n v , 1 ( 31 ) E E 2 B d , t N B A P B A , i n v r a t e d Δ t ( 32 ) E C V E d , t P E V i n v , 2 Δ t ( 33 ) 0.2 N B A C B A r a t e d C B A d , t 0.9 N B A C B A r a t e d ( 34 ) 0.1 C E V m a x C E V d , t 0.9 C E V m a x ( 35 ) P C S d , t = 0
where P P V r a t e d (kW/panel) is the rated output of a PV panel, N P V (panel) is the number of PV panels, P B A , i n v r a t e d (kW/unit) is the inverter capacity of a fixed battery, N B A (unit) is the number of fixed batteries, P E V i n v , 1 (kW) is the inverter capacity of EV in the house, P E V i n v , 2 (kW) is the inverter capacity of EV in the EV charging station, C B A r a t e d (kWh/unit) is the rated energy storage capacity of a fixed battery and C E V max (kWh) is the maximum storage capacity of EV.
Equation (28) is the constraint of maximum PV output power; Equation (29) is the constraint of the maximum charge and discharge of the fixed battery; Equation (30) is the constraint of the maximum discharge from EV to the house; Equation (31) is the constraint of the maximum power from EV to the fixed battery; Equation (32) is the constraint of the maximum charge from the EV charging station to EV; Equation (33) is the state of charge for the fixed battery; and Equation (34) is the state of charge for EV. Equation (35) is the constraint when the shortage of the power supply is zero after compensation by EV.
From the above, since the prediction error of PV output power influences the magnitude of the shortage of the power supply, it is necessary to solve the multi-objective optimization problem. Comparing the case not considering the prediction error, it is possible to search for the optimal capacity satisfying the constraints.

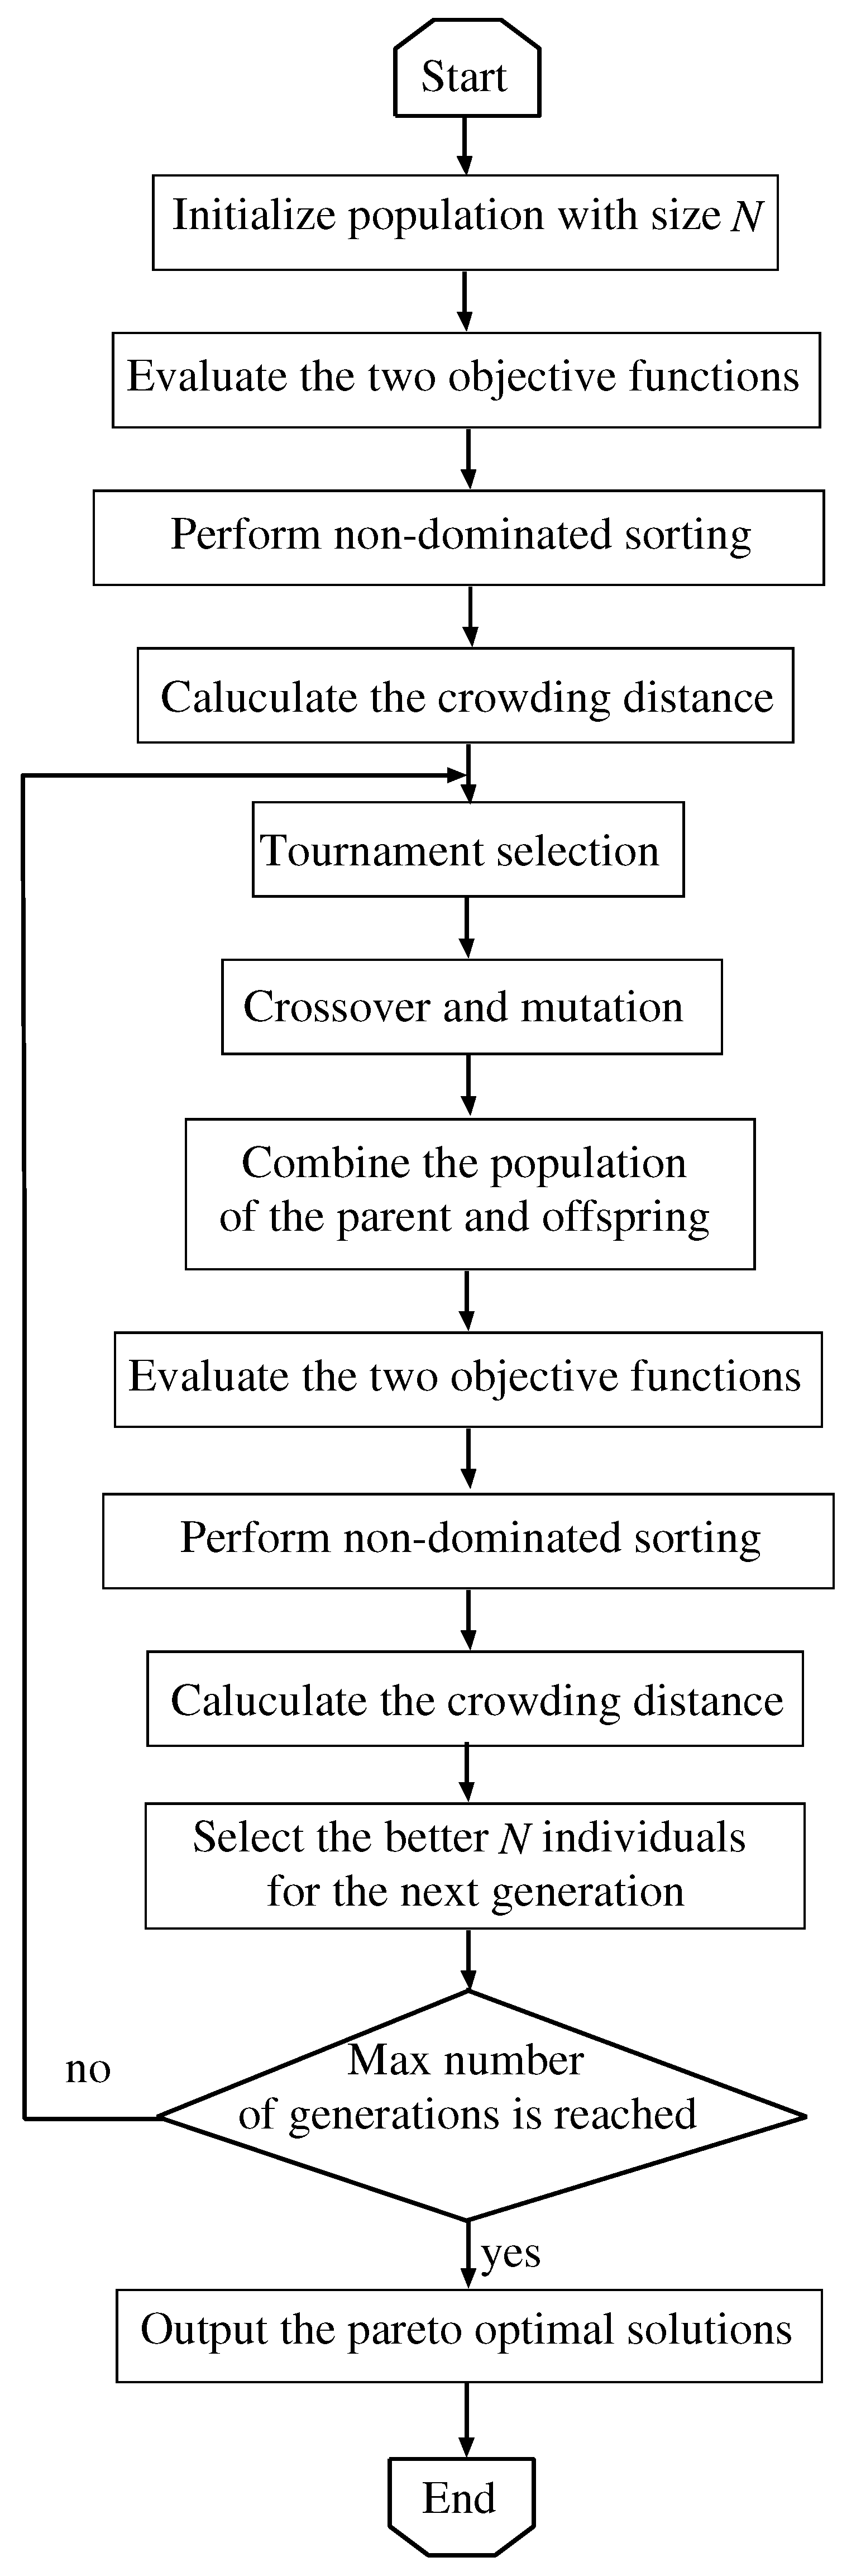
4.2. Multi-Objective Optimization Method

Since two objective functions in this multi-objective optimization problem have a relationship with trade-off, it is necessary to search for the Pareto solution to minimize both objective functions. In this research, NSGA2 is one of the multi-objective optimization techniques based on searching the Pareto solution. NSGA2 is adopted in many research works, and it is possible to perform an efficient search of the solutions [16,17,18,19,20]. NSGA2 performs the elitism strategy where the superior solution is left to the next generation, non-dominated sorting where the superior solution and the other solution are ranked and sorted and crowding-distance computation to choose the solution that is far in distance between the adjacent solution [21]. Here, the outline and flowchart of the NSGA2 algorithm are illustrated in Figure 7 and Figure 8, and the description is given below:
Step 1:
Making an initial population P of size N of solutions. P is the parent population.
Step 2:
Mutation and crossover are performed in the parent population to make offspring population Q of size N, and combining the parent population and the offspring population, R of size 2N is made.
Step 3:
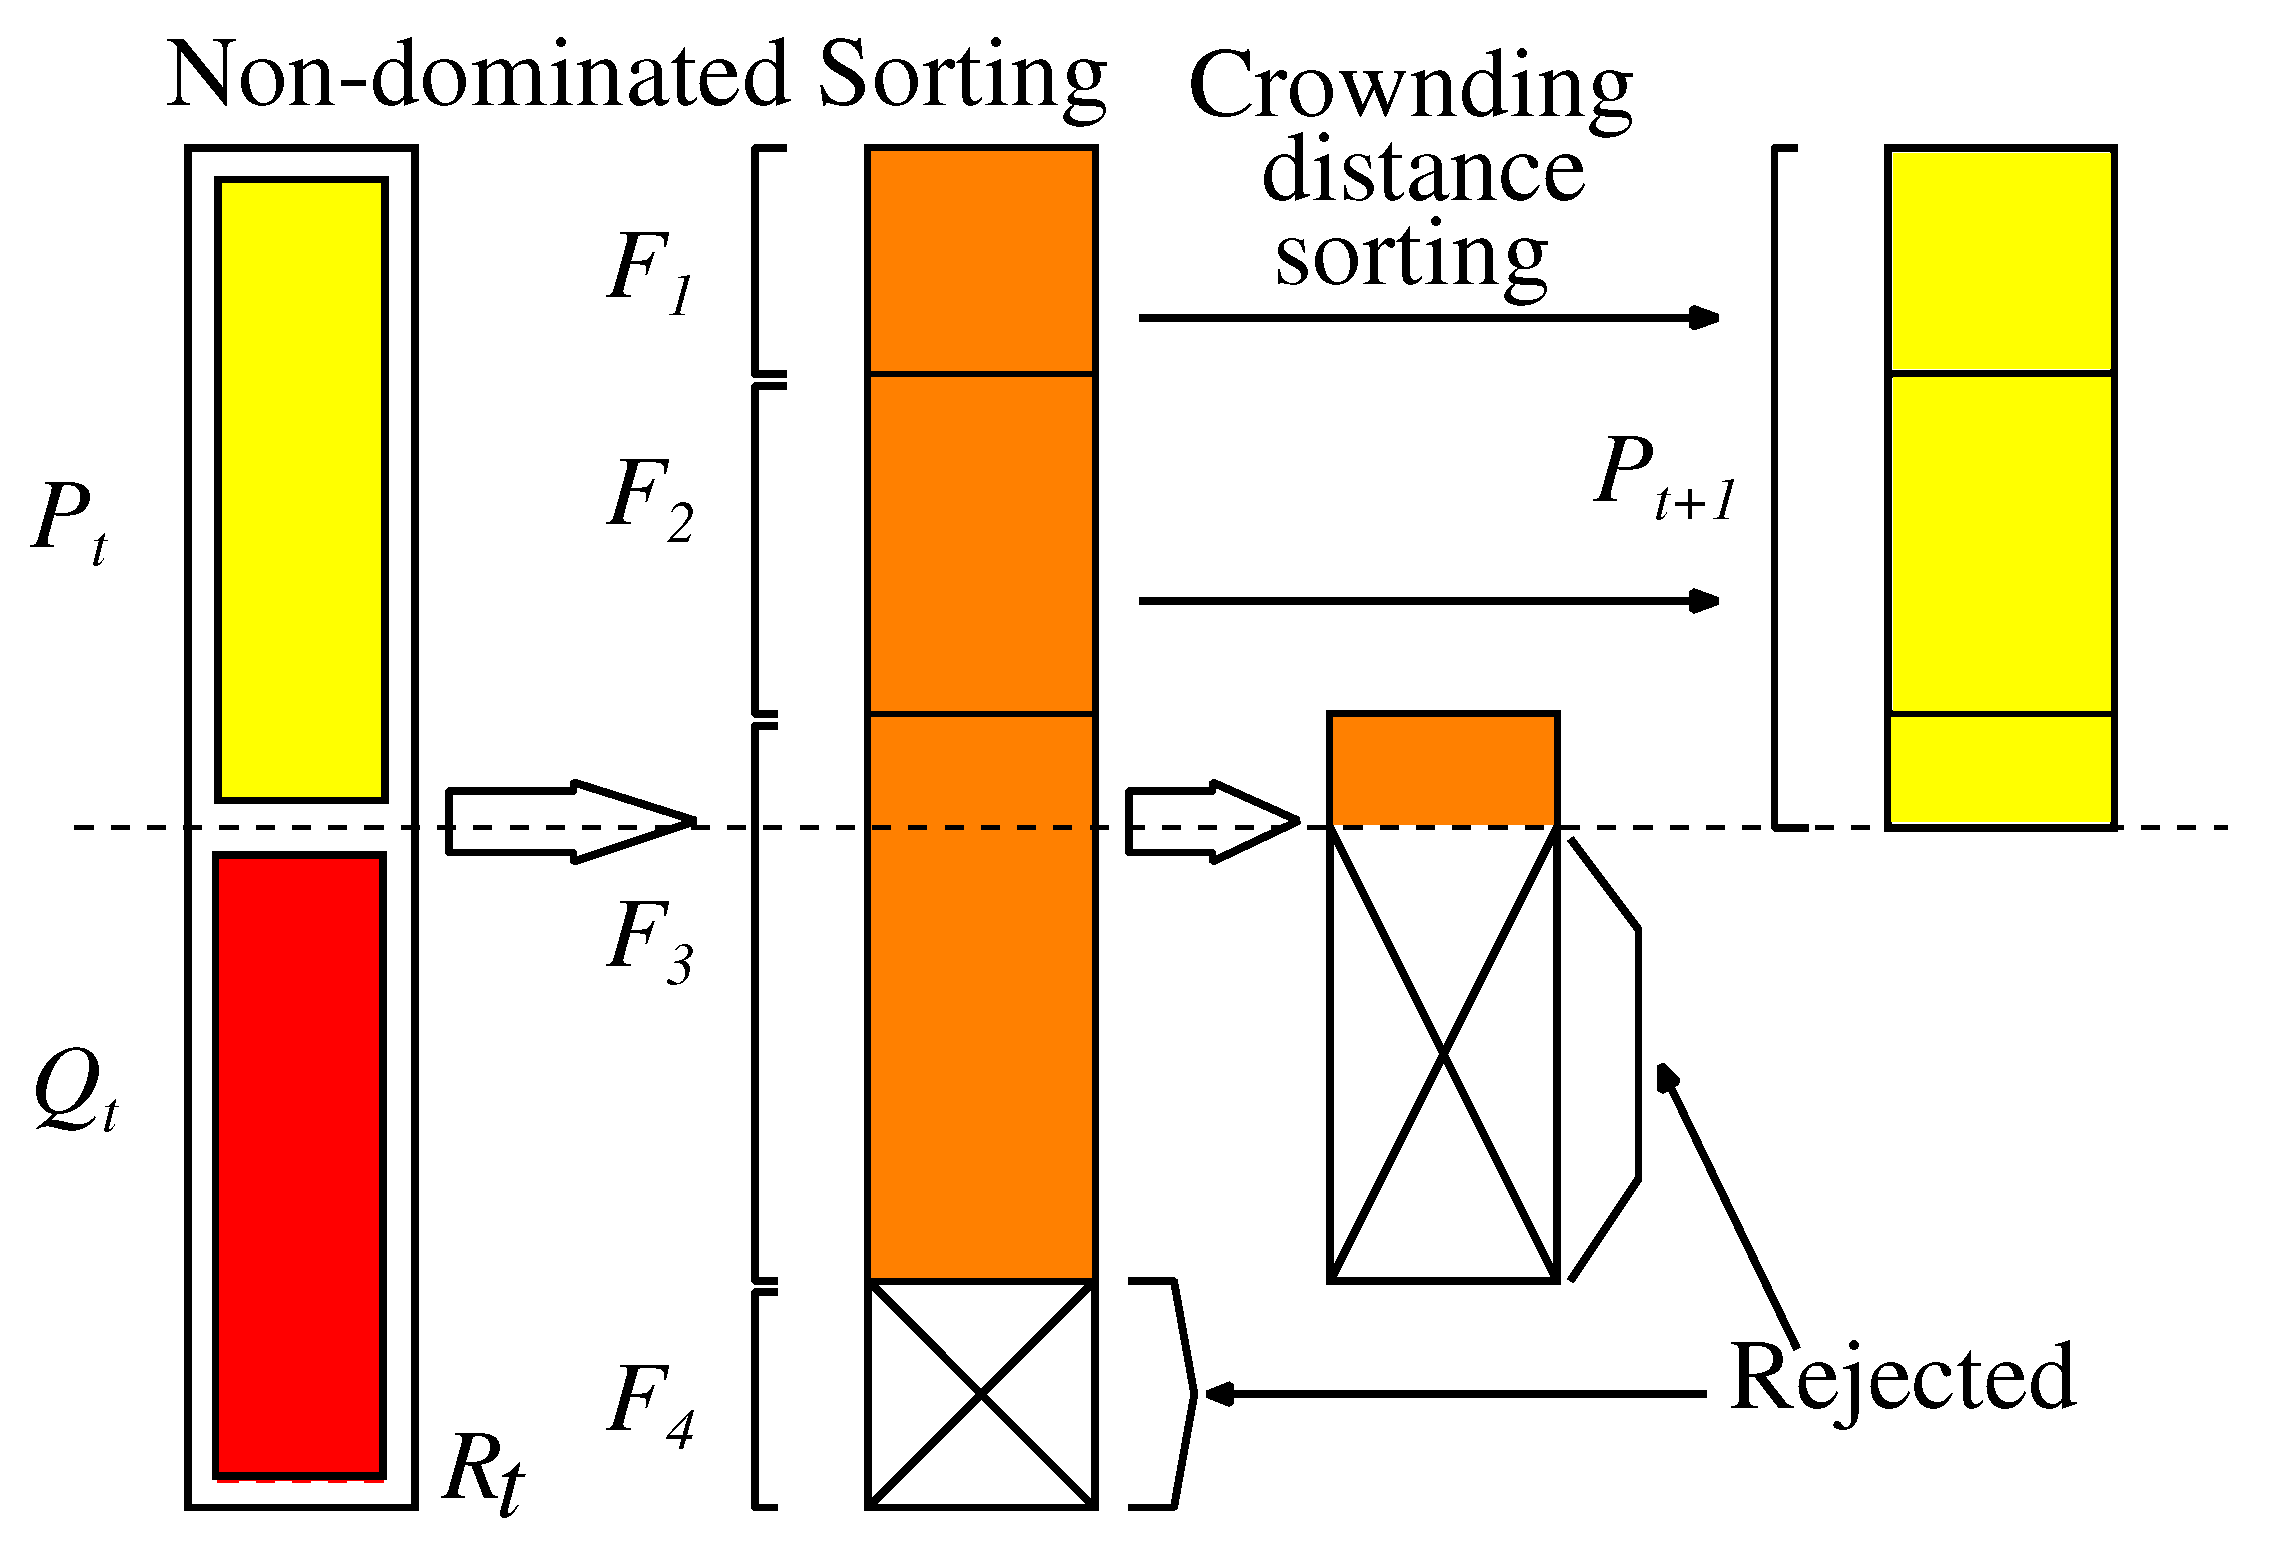
Evaluating the objective function, the Pareto solution is ranked by non-dominated sorting.
Step 4:
Individuals in the population are chosen till its size is N from the upper rank Pareto solution, and its population is the parent population in the next generation. If the number of individuals is over size N when the same rank population is chosen, crowding-distance computation is performed.
Step 5:
If the generation reaches the max generation, the search is finished. Otherwise, the process returns to Step 2.

5. Simulation Results

In this section, simulation results are analyzed extensively. The simulation conditions and results are described in Section 5.1 and Section 5.2, respectively.

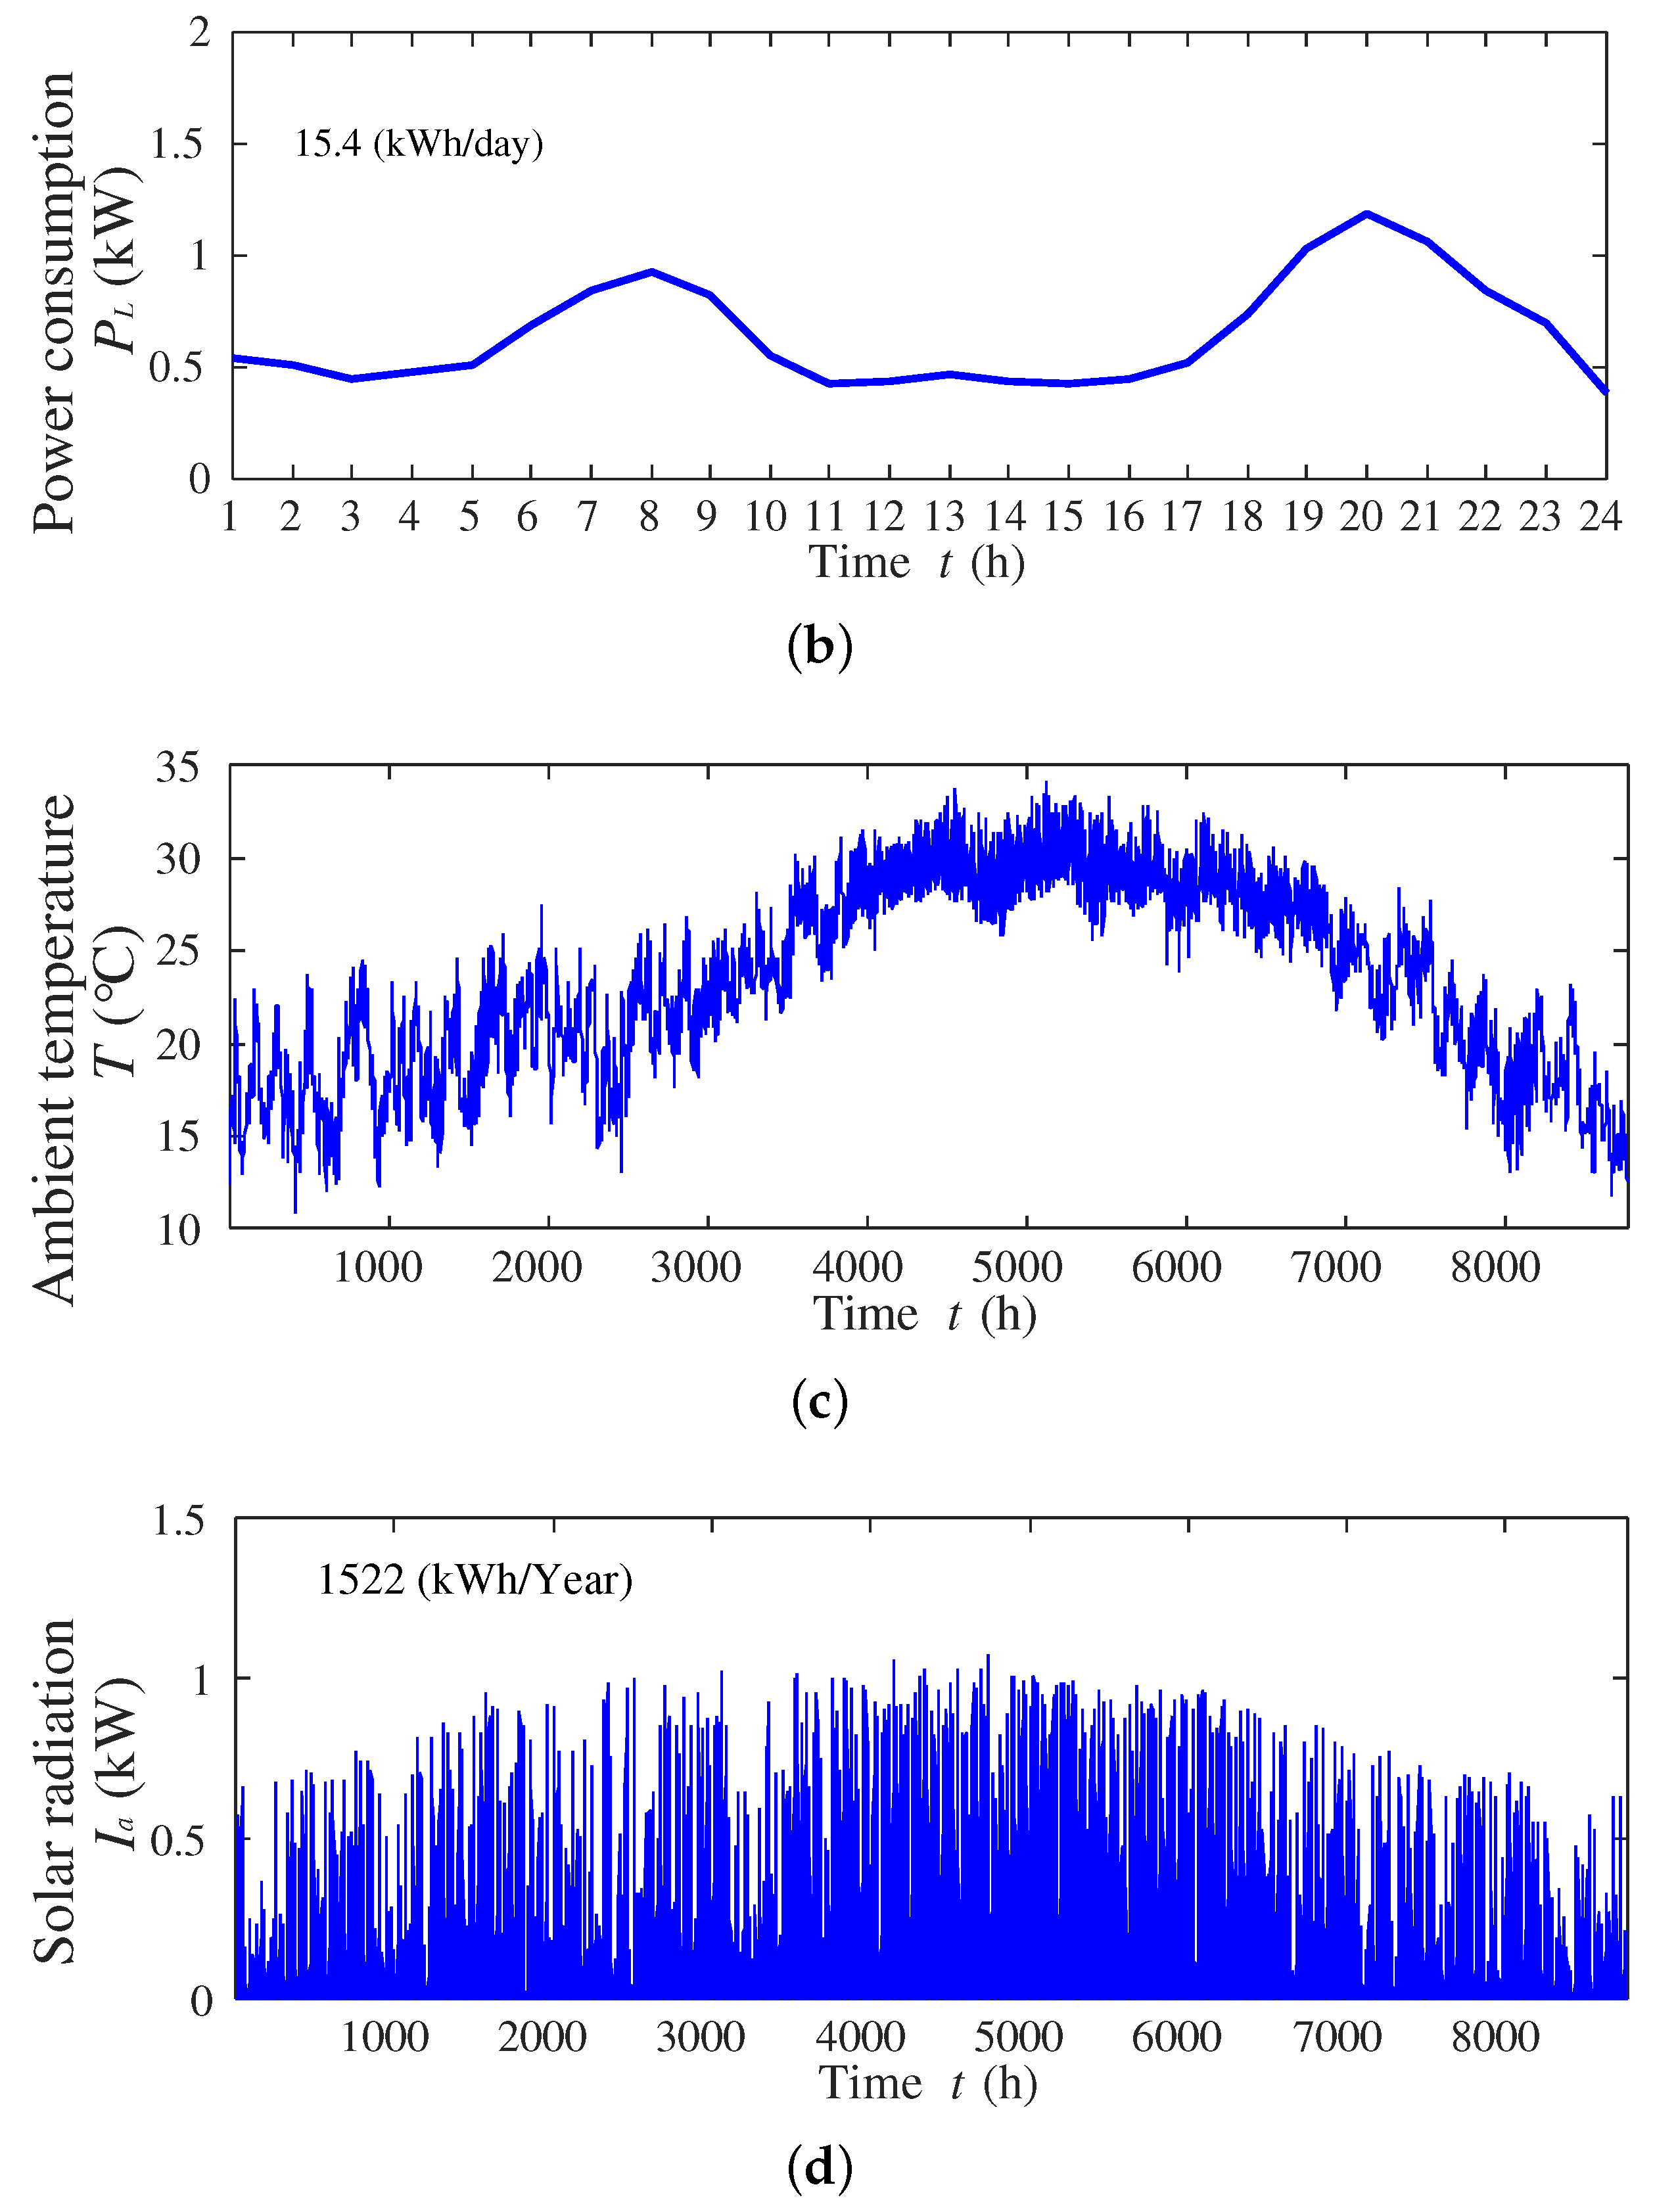
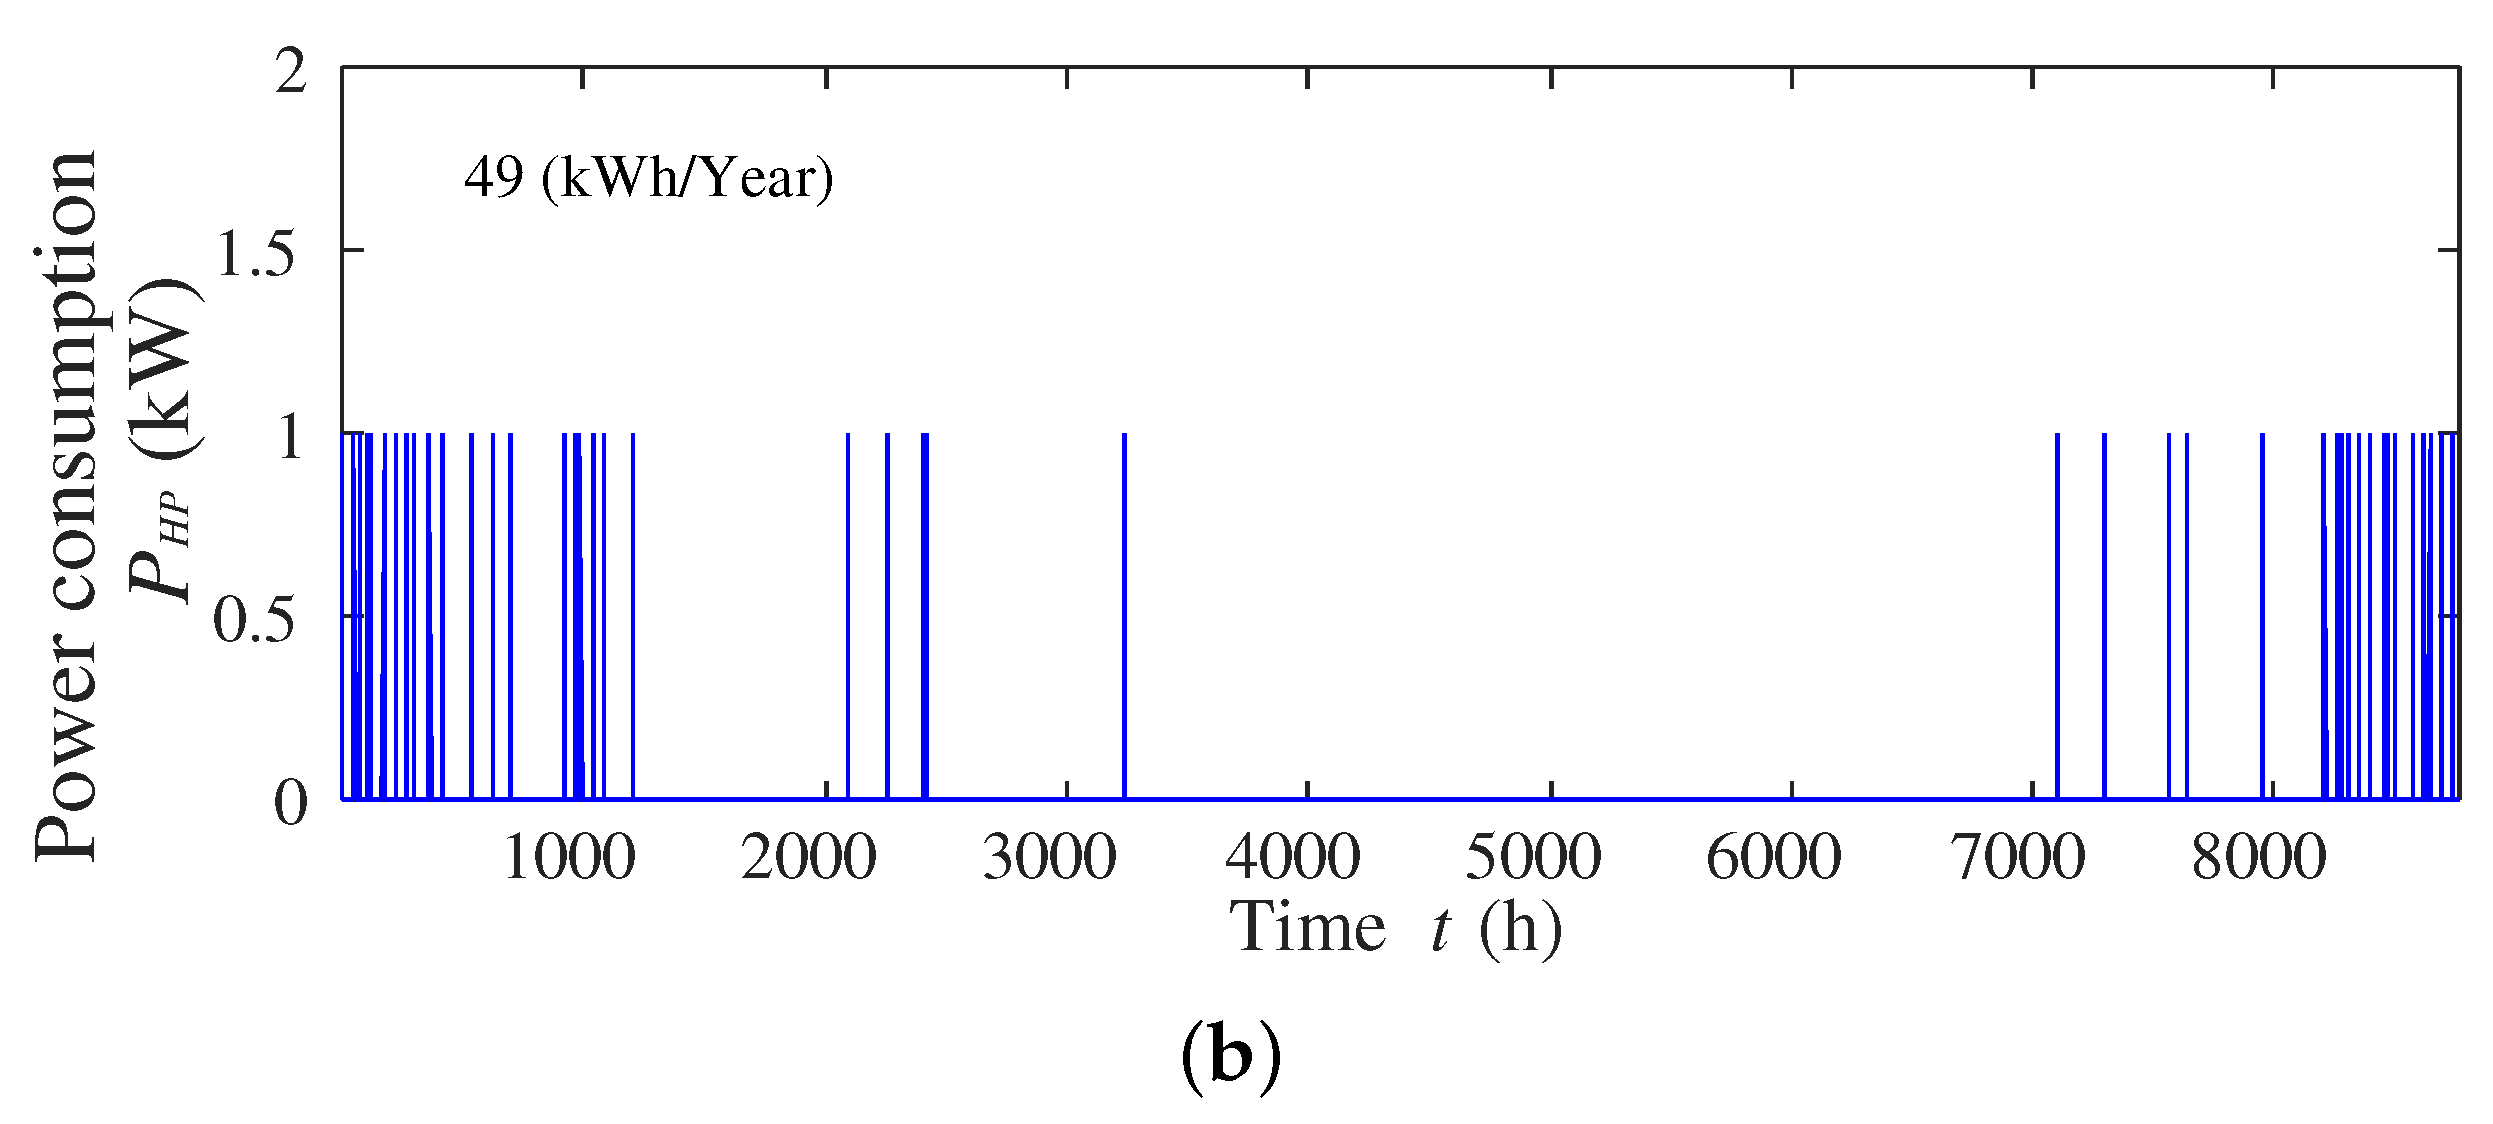
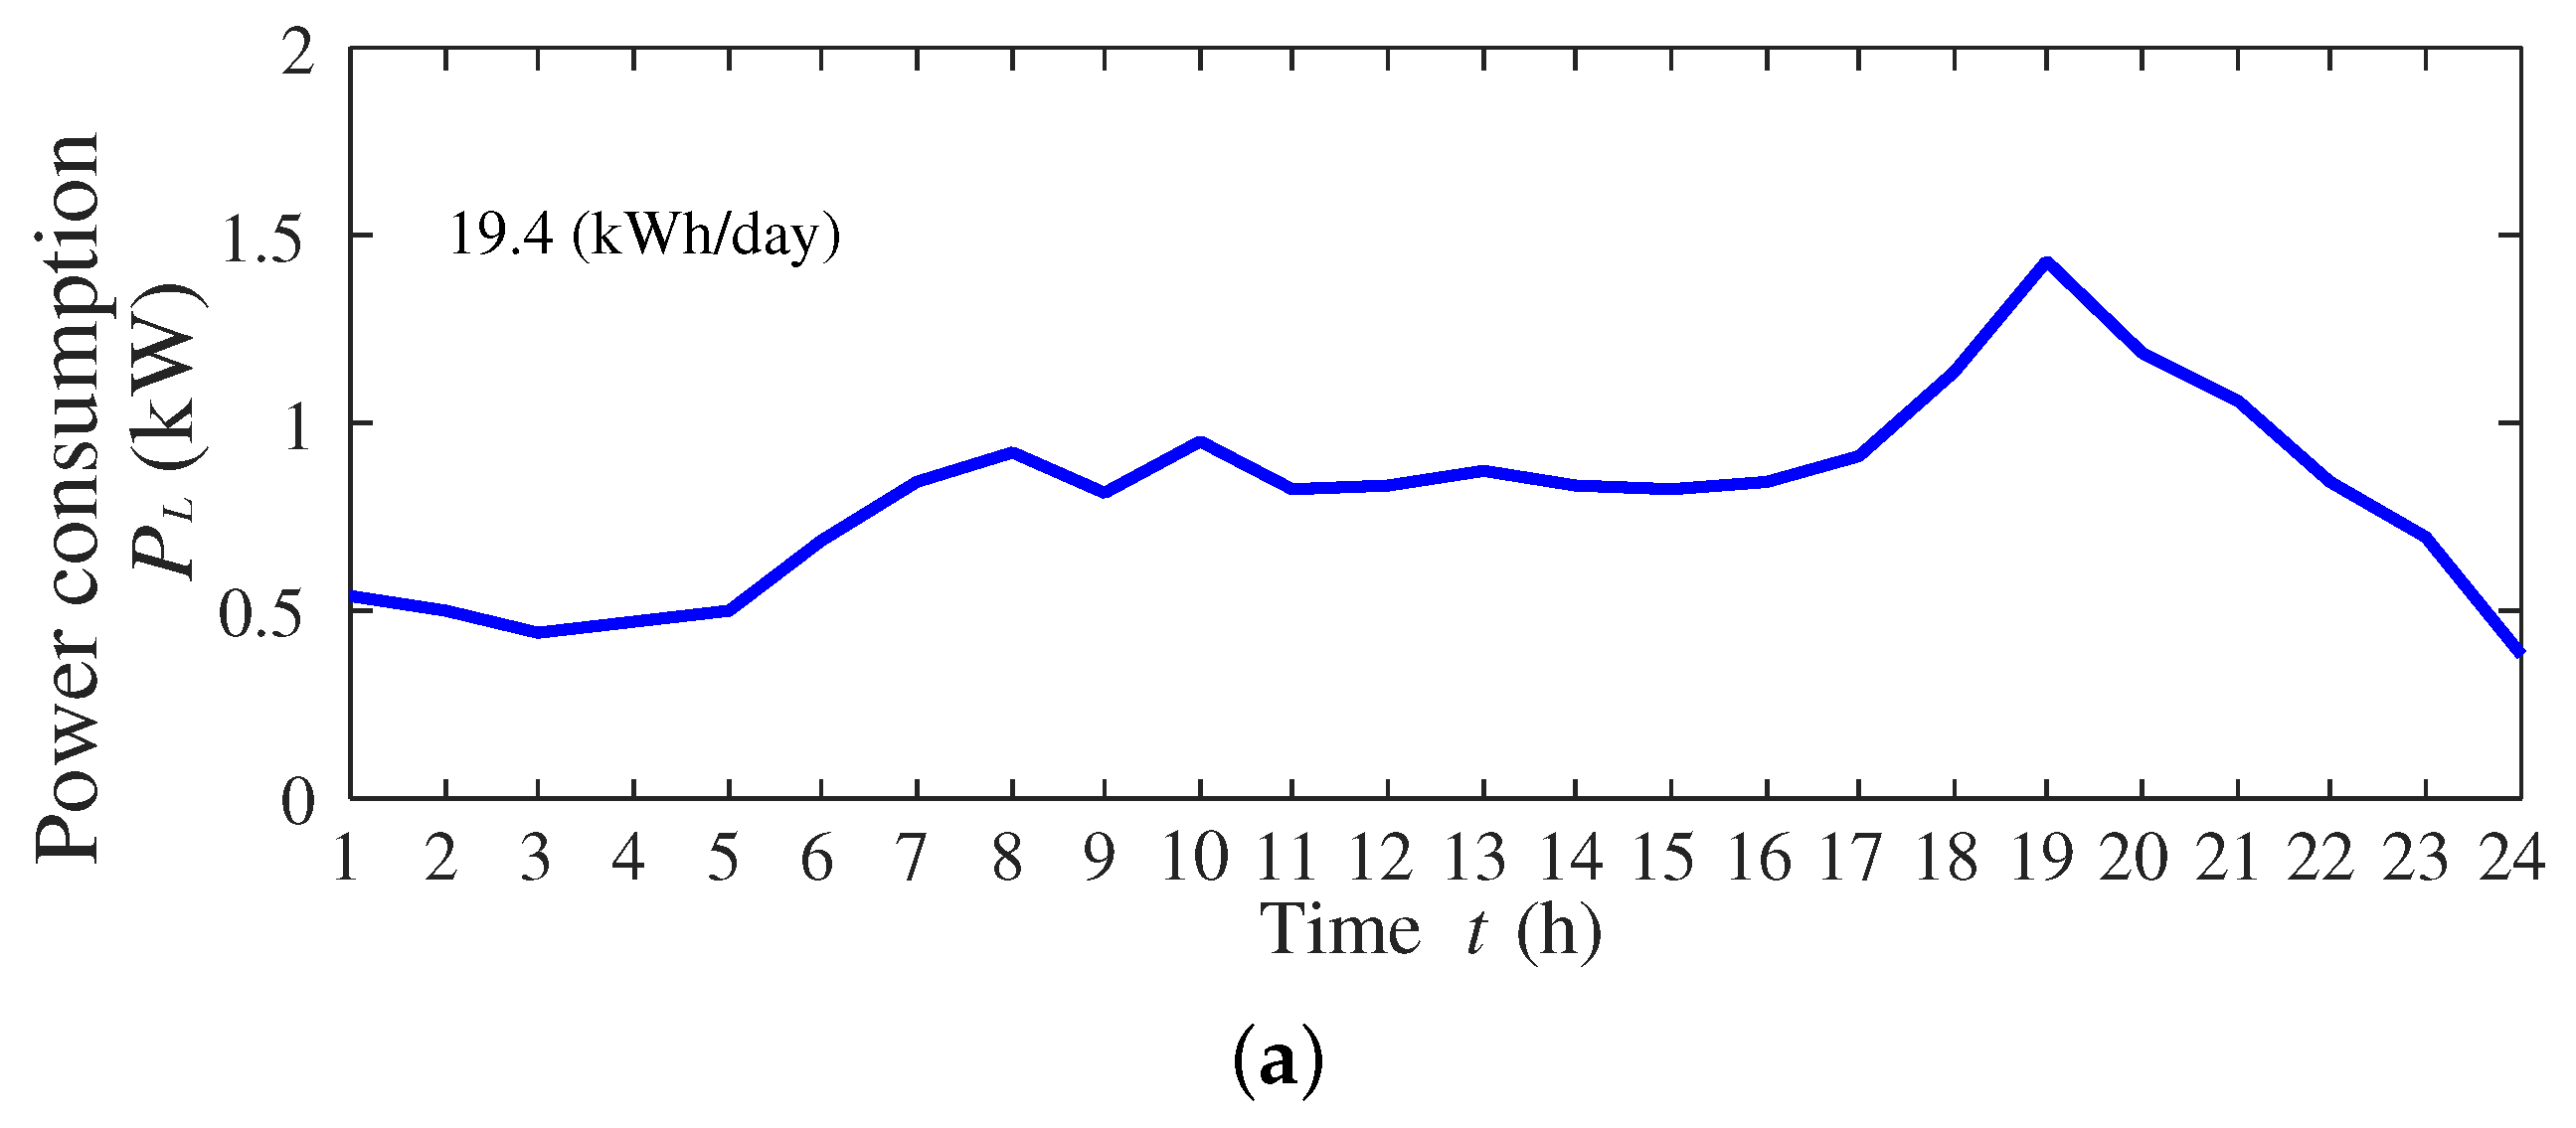
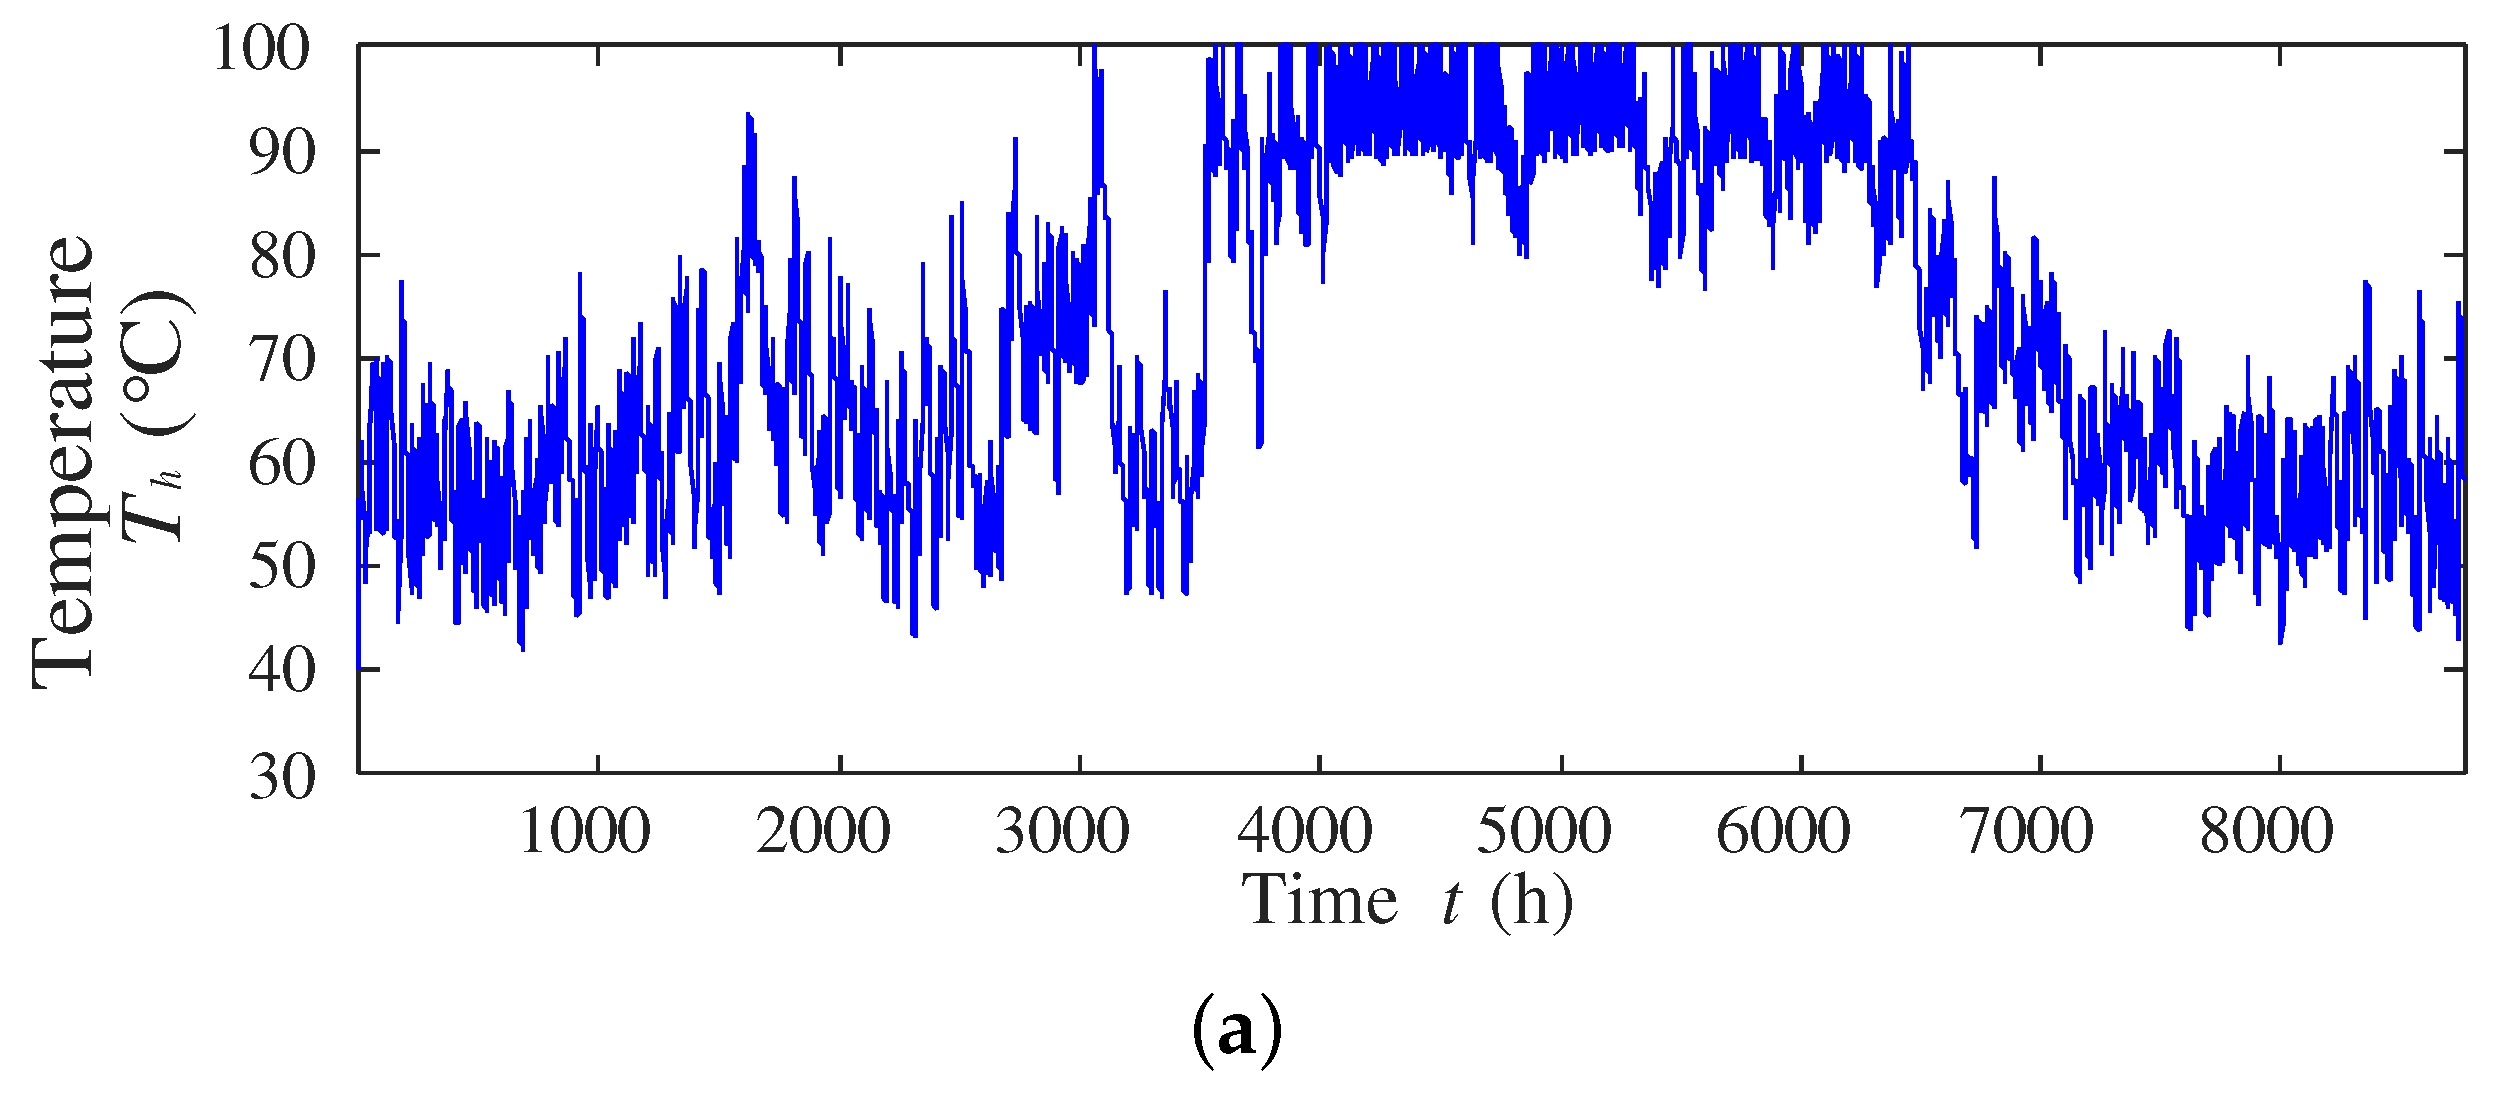
5.1. Simulation Conditions

In this simulation, weather data at Okinawa, Japan, are utilized, and the usage time of the off-grid smart house for one year is assumed. The parameters of the PV panel and fixed battery are listed in Table 1 and Table 2, respectively. In this research, the usable time of this system equipment is 20 years. With respect to the heat supply by the SC and HP, the hot water of 150 L is used at 8:00 8:00 a.m.∼10:00 p.m throughout the year. Furthermore, the target temperature of hot water in the storage tank at 8:00 p.m. is 50 °C, and if the hot water temperature is less than the target temperature, water is heated by HP. The structure of EV is shown in Table 3. EV is used at 8:00 a.m.∼6:00 p.m. and connected to the house at other times. Moreover, if shortage of the power supply occurs during no connection of the EV with the house, the amount of shortage energy is supplied to the fixed battery from EV at 8:00 a.m. Furthermore, there is a need for energy to charge the EV for operation in the whole day, and EV charging time is considered as 5:00∼6:00 p.m. Here, the power consumption on a summer day, power consumption other days, outdoor temperature and the solar radiation of a year are illustrated in Figure 9.

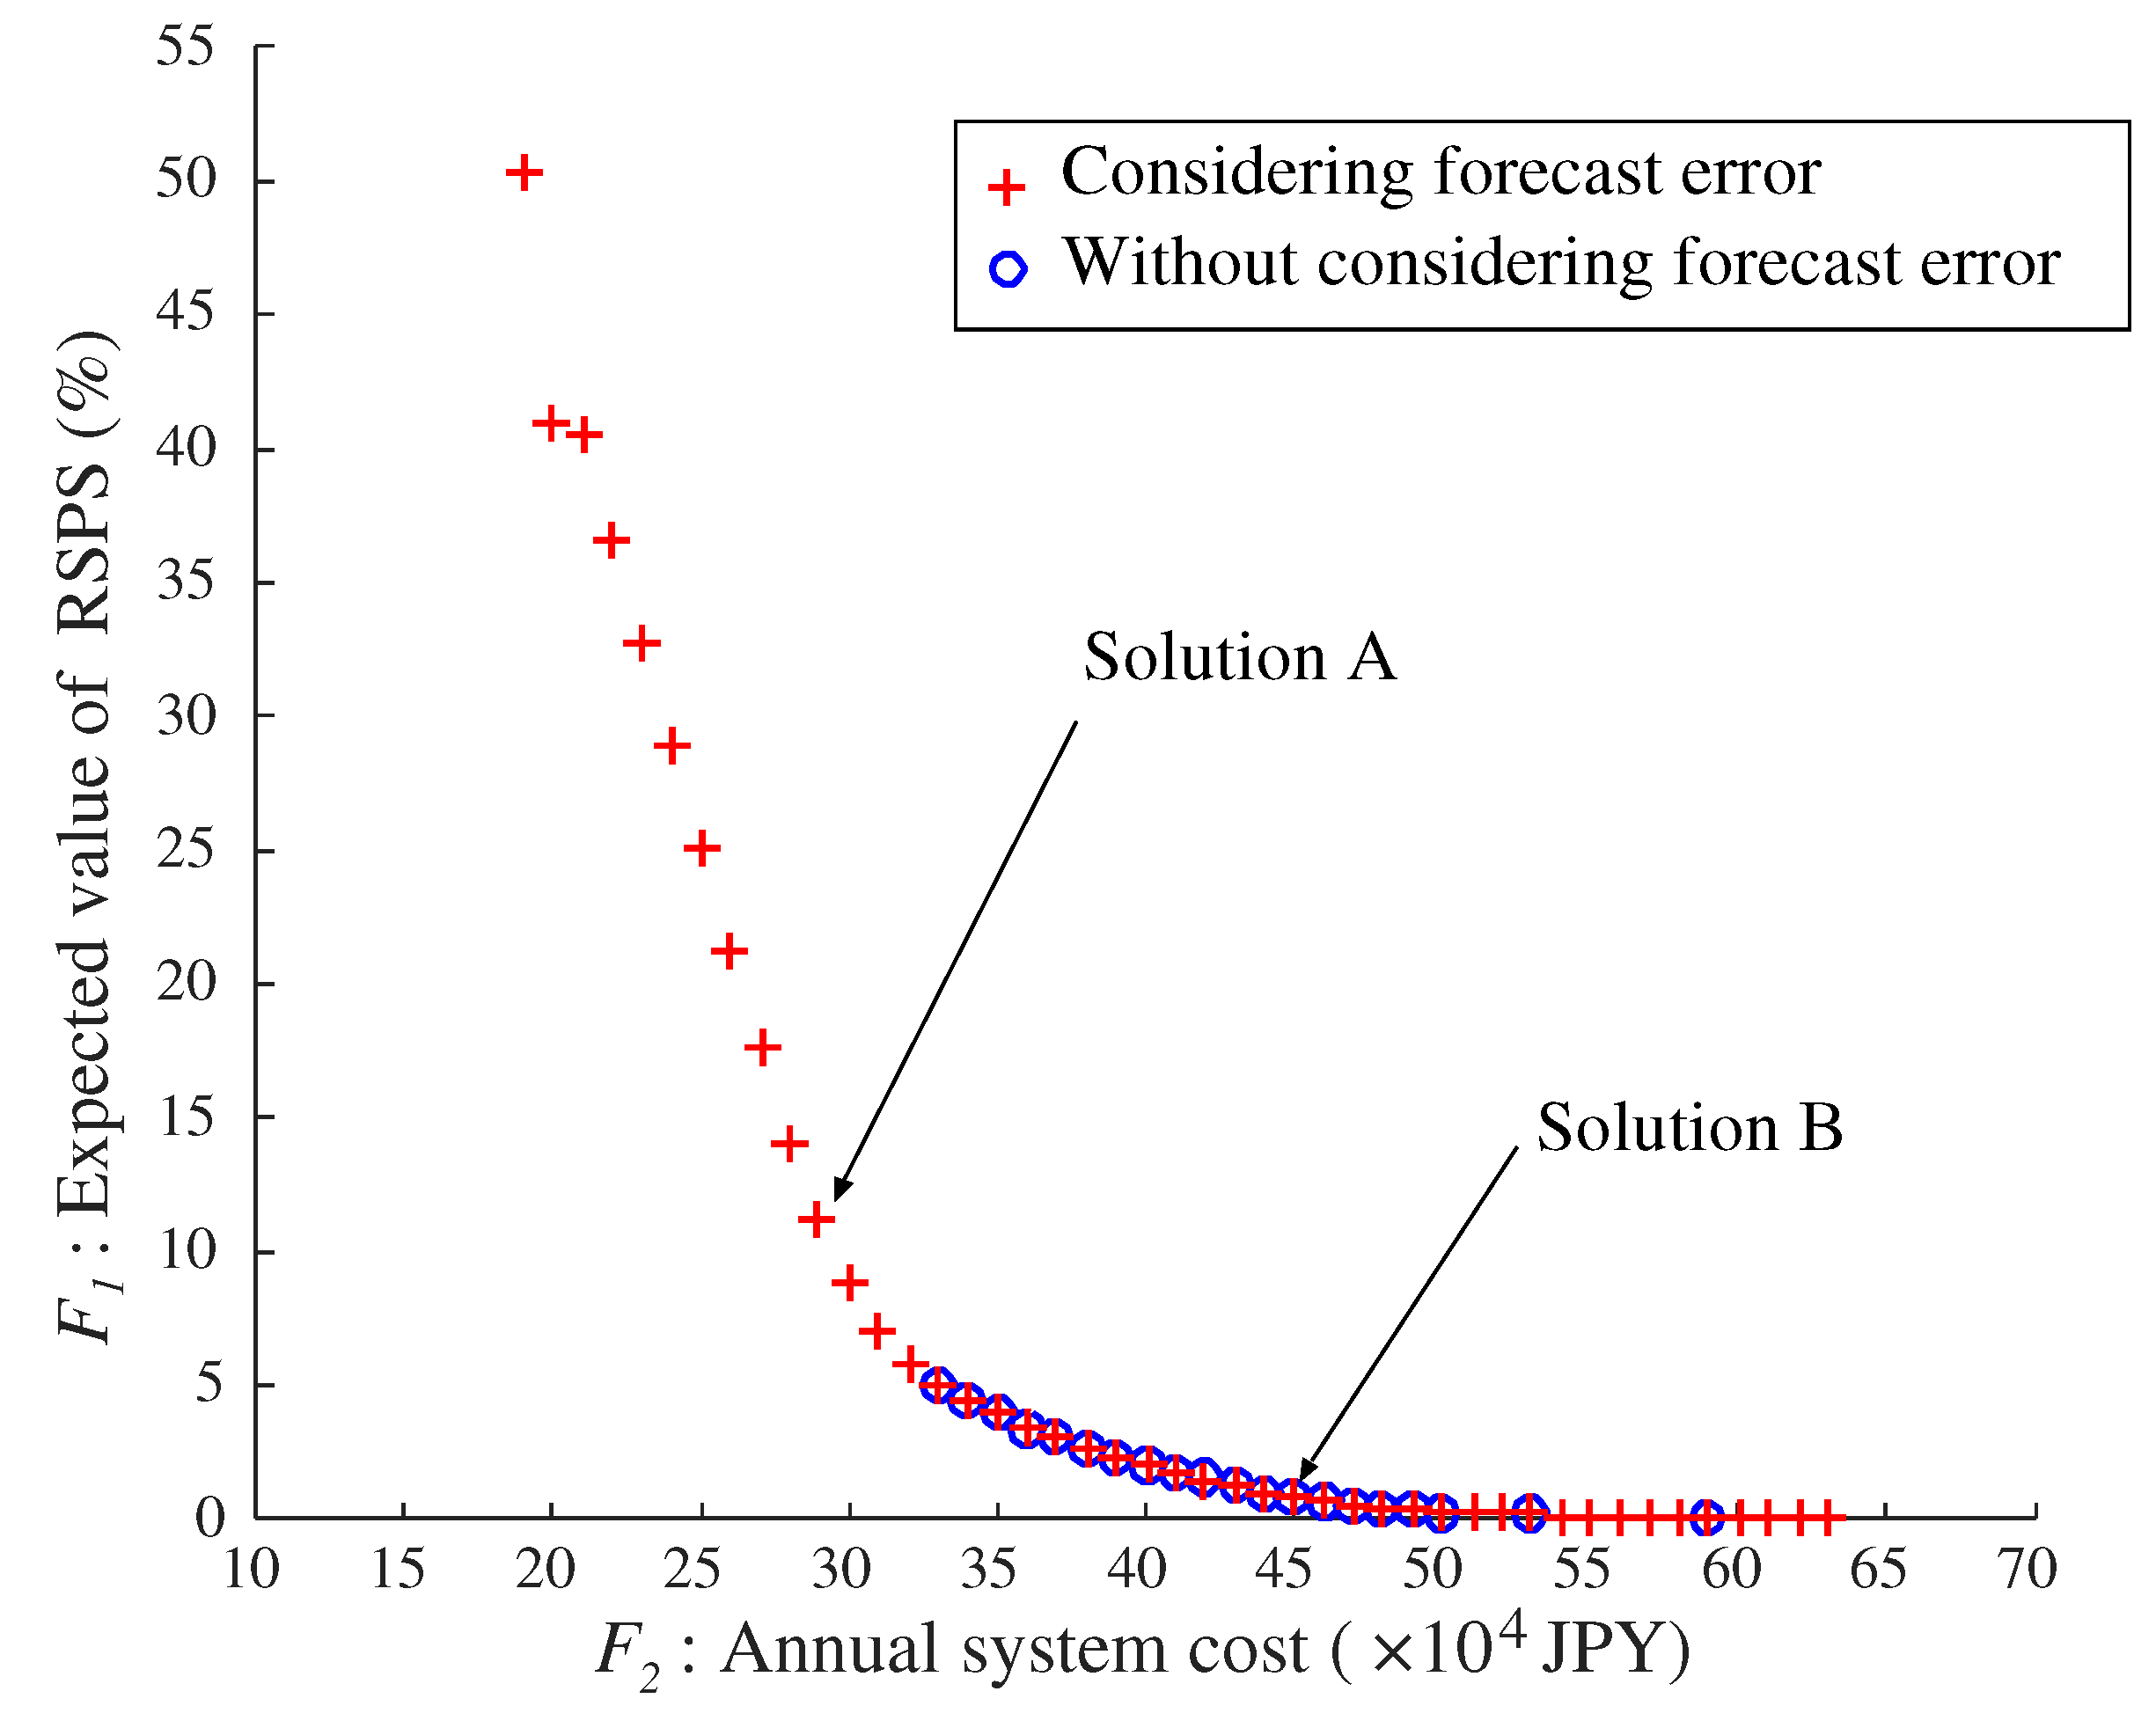
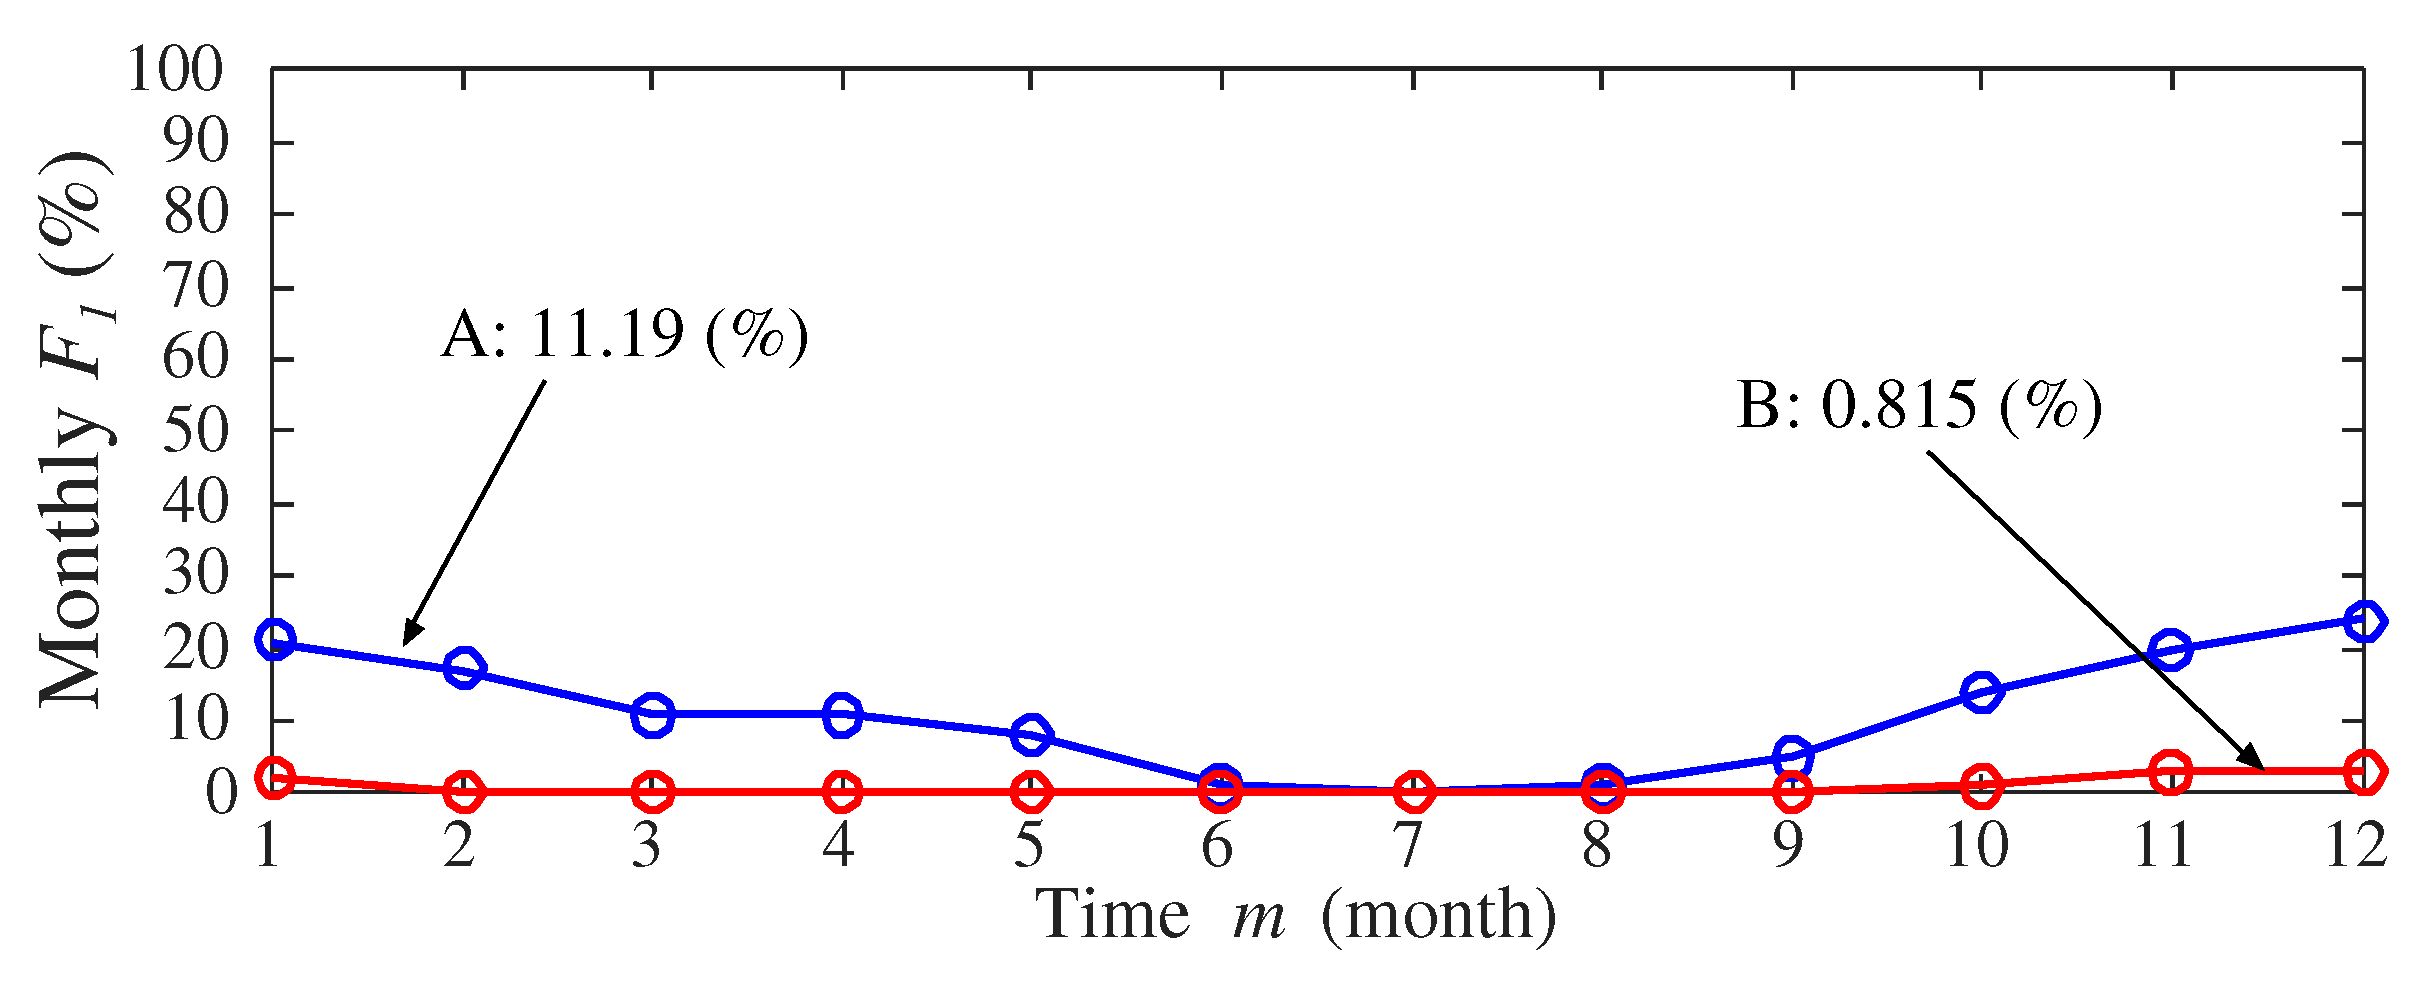
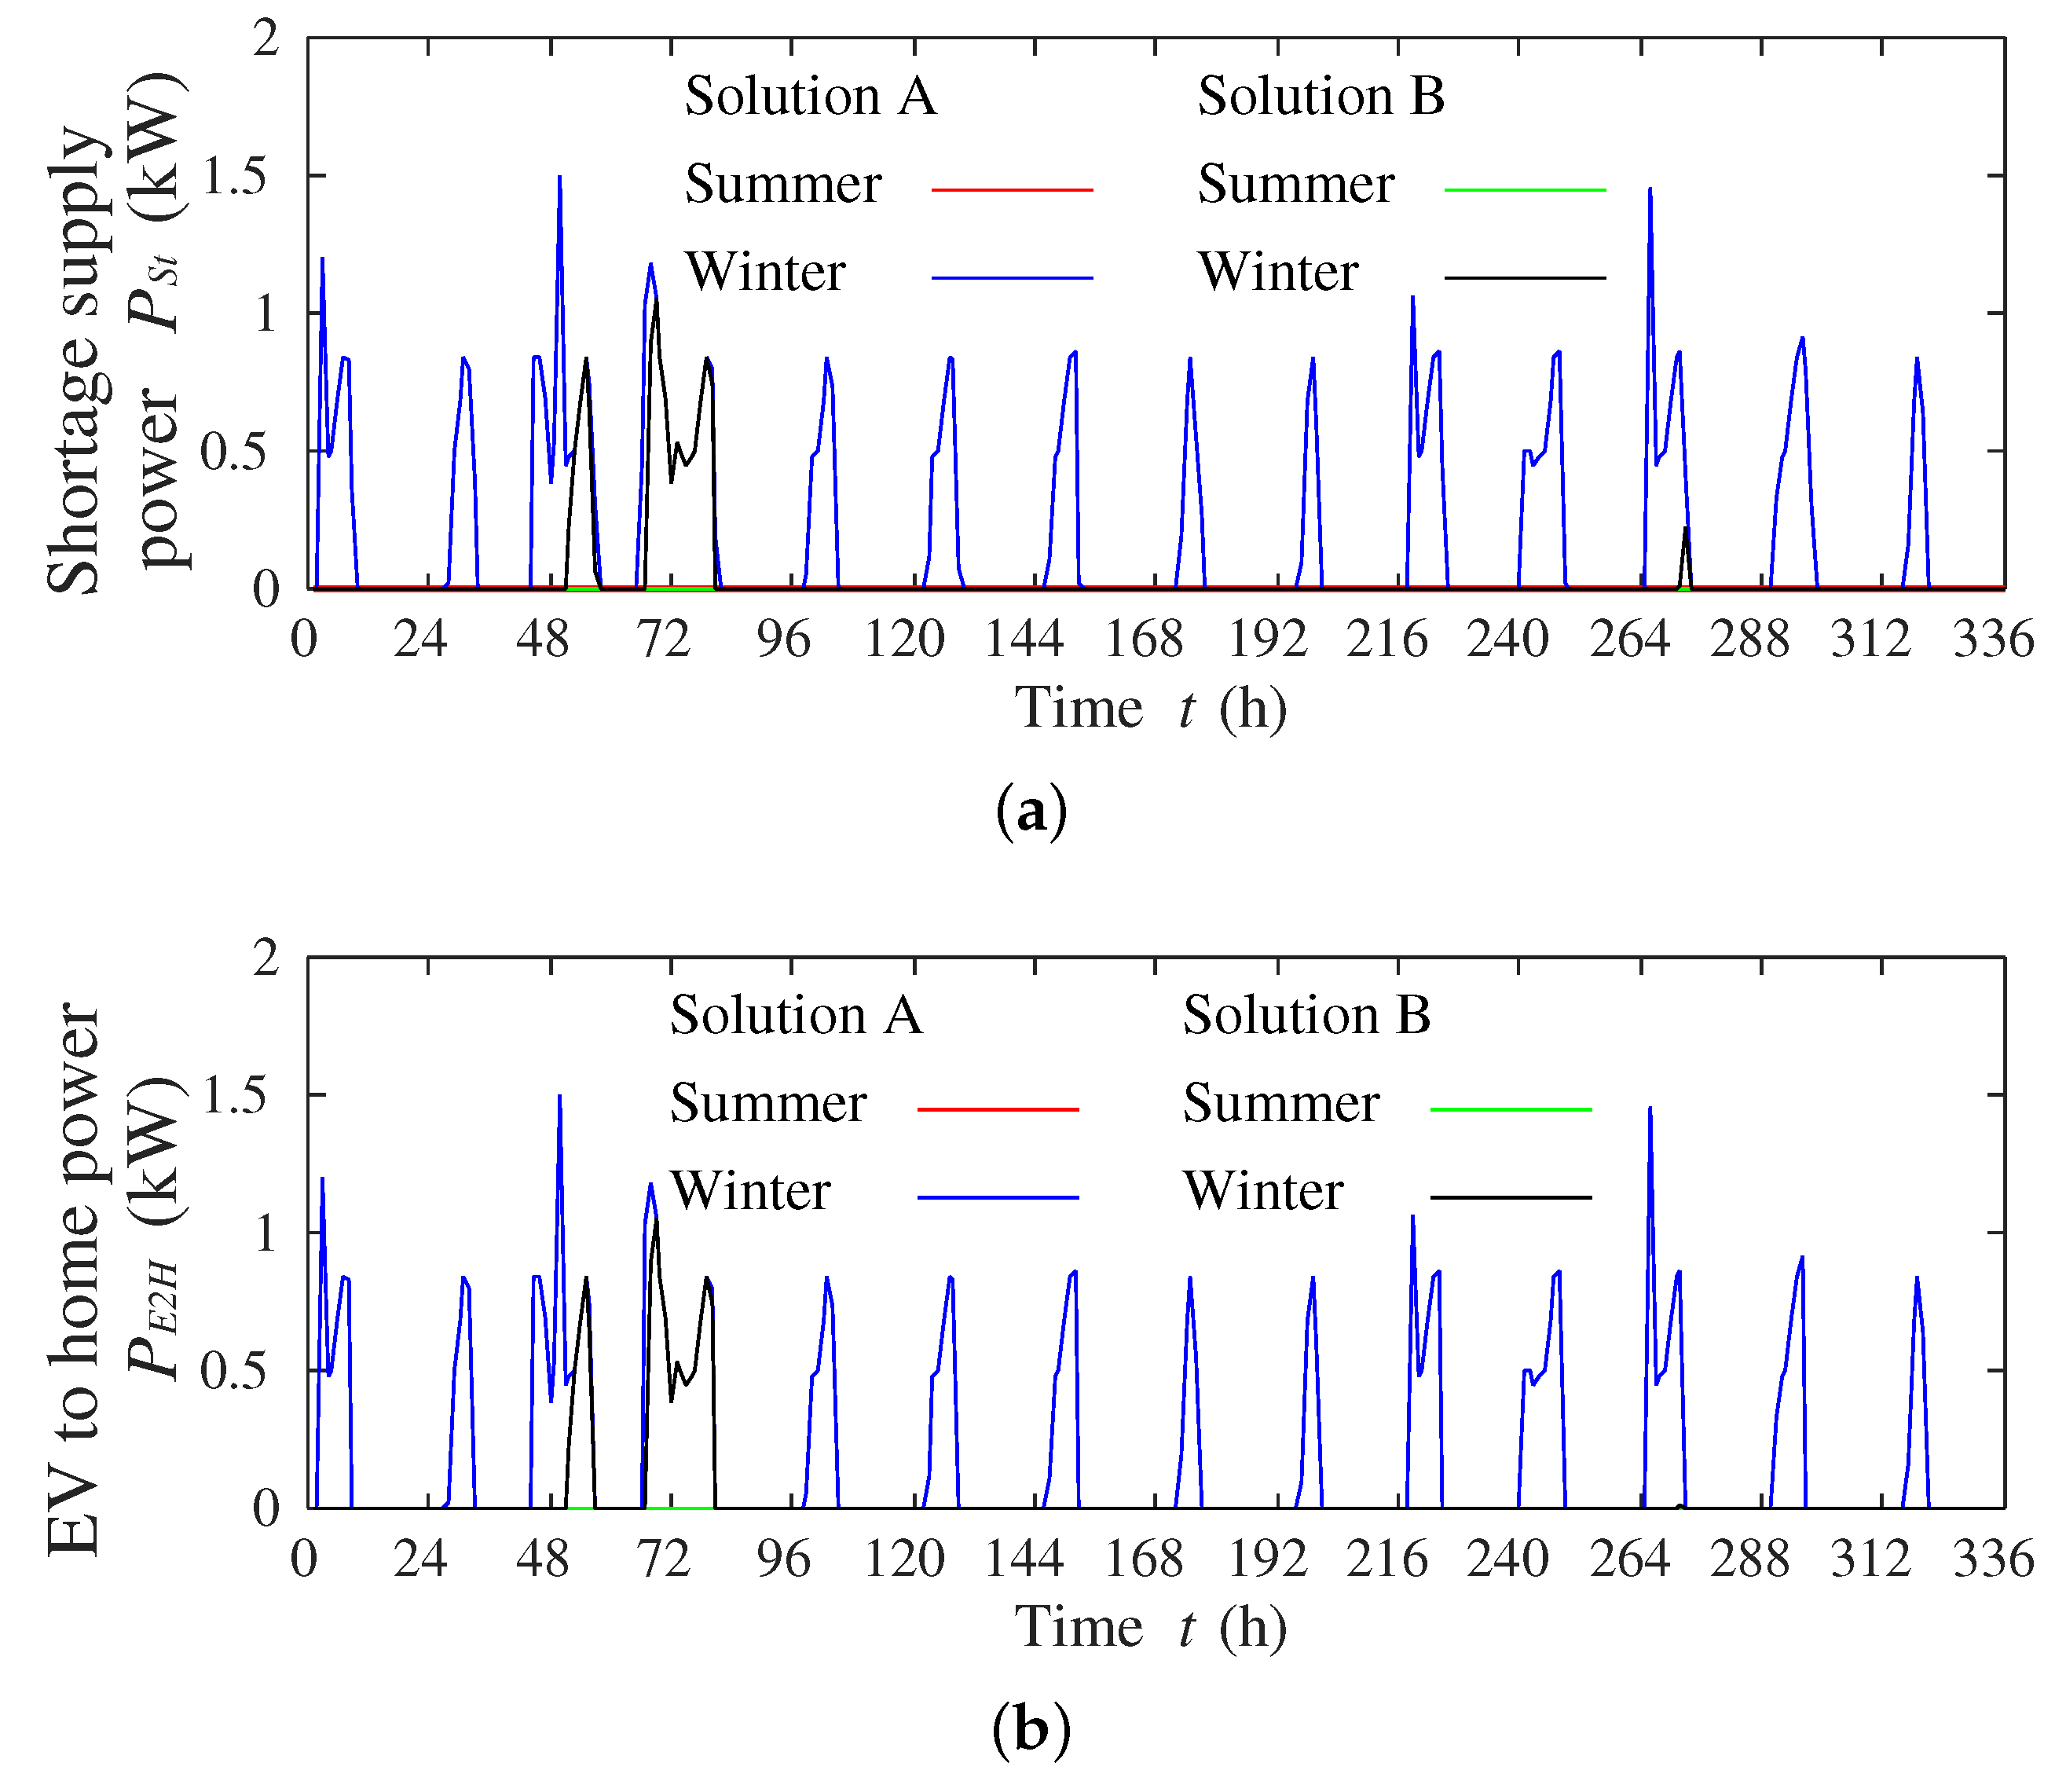
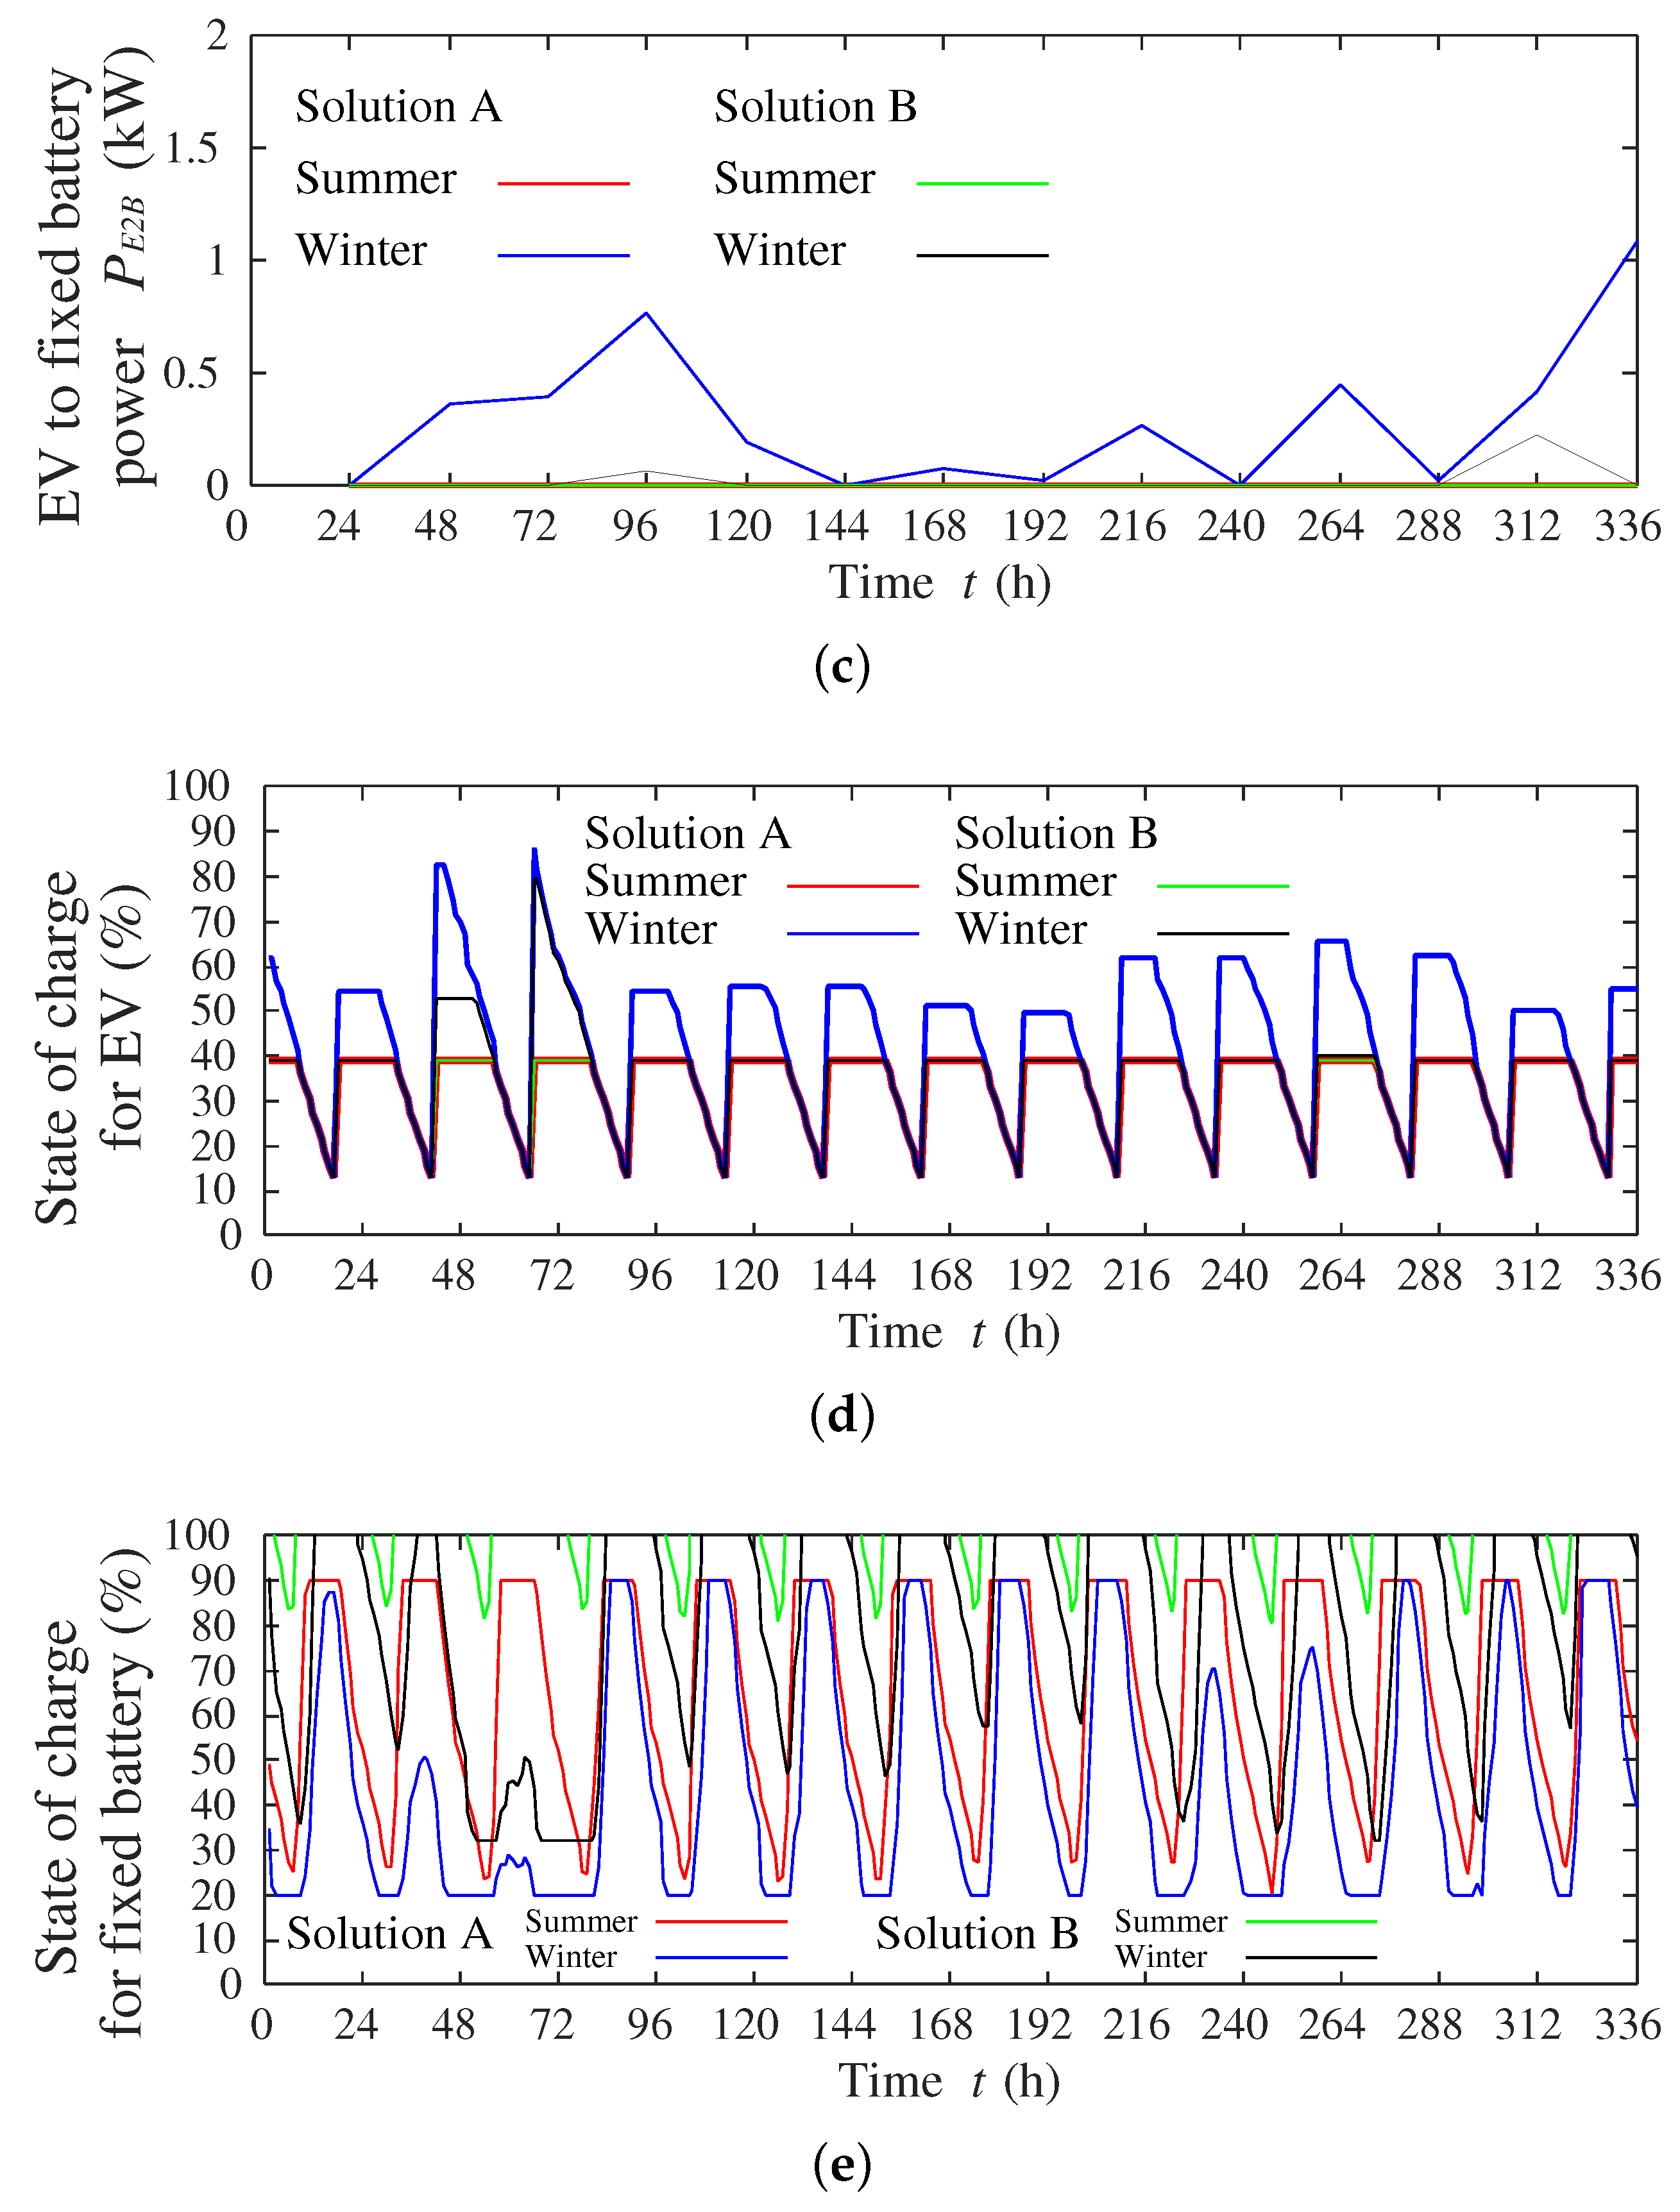
5.2. Simulation Results

An operation model of HP is illustrated in Figure 10. From Figure 10, it is found that since solar radiation and outdoor temperature are low in winter, the power consumption of HWHP is high.
Two Pareto solutions, one case considers the prediction error and the other is without considering the prediction error of PV output power, are shown in Figure 11. From Figure 11, it is possible to design a variety of installed capacity by considering the prediction error. The expected value of the RSPS F 1 , annual system cost F 2 , number of PV panels N P V , number of fixed batteries N B A , PV panel area N P V S P V , capacity of the fixed battery N B A C B A r a t e d and inverter capacity of the fixed battery N B A P B A , i n v r a t e d of Solutions A and B considering the prediction error (Figure 11) are shown in Table 4. From Table 4, if the resident of the smart house wants to limit the system cost, he/she may choose the introduced capacity of Solution A, and if the resident wants to limit the procurement energy of EV, he/she may choose Solution B. By this selection, it is possible to operate the smart house according to resident conditions. Monthly RSPS is shown in Figure 12. From Figure 12, RSPS in summer can be the smallest. It is considered that collecting heat by SC and PV output power is large, since the solar radiation and temperature are high in summer.
Dynamic responses for a smart house in summer and winter seasons of Solutions A and B are shown in Figure 13. Figure 13a–e show the shortage of the power supply, discharged power from EV to the house, supplied power from EV to the fixed battery, the state of charge for EV and the state of charge for the fixed battery. Comparing Solutions A and B in summer and winter seasons, in Figure 13a–c, it can be seen that most of the shortage of the power supply is compensated by EV. Furthermore, the total power from the EV to the home and the fixed battery is equal to the total of shortage power supply, and power supply to the fixed battery is used when the EV is not connected to the house and cannot supply power. In Figure 13d, EV is charging only for driving in summer, but EV is charging for the compensation of the shortage of the power supply in addition to driving in winter. This charging to compensate also occurs in Solution B with large equipment capacity, so even if large capacity is prepared, compensation by EV is necessary. In Figure 13e, with Solution B having sufficient equipment capacity, it is possible to possess sufficient energy in both summer and winter. However, in Solution A with small capacity, the lower limit is often reached in winter, and it is necessary to operate near the lower limit even in summer. Therefore, large compensation by EV is needed with small equipment capacity.

6. Conclusions

This paper analyzed the off-grid smart house that includes PV, SC, HWHP, fixed battery and EV. Models of HWHP, equipment capacity (e.g., PV panel, fixed battery, load) and the compensation of EV determine the optimal size of the off-grid smart house. There is a trade-off between the RSPS and annual system cost. If the annual system cost is increased, the RSPS will be decreased and vice versa. Therefore, this paper obtained a Pareto optimal solution for this problem using the multi-objective NSGA2 algorithm. This paper proposed two solutions: Solution A can limit the annual system cost, but RSPS is increased, and the shortage of the power of the smart house can be procured from the EV. Solution B increases the annual system cost, but RSPS is decreased. Depending on the availability of power from EV, PV, SC, HWHP and the fixed battery, a resident may choose any of the solutions. Dynamic responses of all devices are described in this paper. From the simulation analyses, the off-grid smart house can be operated without a shortage of power using EV and the fixed battery.

Author Contributions

Yasuaki Miyazato, Shota Tobaru and Kosuke Uchida conceived and designed the experiments; Shota Tobaru and Kosuke Uchida performed the experiments; Yasuaki Miyazato, Cirio Celestino Muarapaz and Abdul Motin Howlader analyzed the data; Tomonobu Senjyu contributed reagents/materials/analysis tools; Yasuaki Miyazato wrote the paper.

Conflicts of Interest

The authors declare no conflict of interest.

References

  1. Shimoji, T.; Tahara, H.; Matayoshi, H.; Yona, A.; Senjyu, T. Optimal Scheduling Method of Controllable Loads in DC Smart Apartment Building. Int. J. Emerg. Electr. Power Syst. 2015, 16, 579–589. [Google Scholar] [CrossRef]
  2. Yang, H.; Qiu, J.; Zhang, S.; Lai, M.; Dong, Z.Y. Interdependency Assessment of Coupled Natural Gas and Power Systems in Energy Market. Int. J. Emerg. Electr. Power Syst. 2015, 16, 525–536. [Google Scholar] [CrossRef]
  3. Akinyele, D.O.; Rayudu, R.K.; Nair, N.K.C. Grid-independent renewable energy solutions for residential use: The case of an off-grid house in wellington, New Zealand. In Proceedings of the 2015 IEEE PES Asia-Pacific Power and Energy Engineering Conference (APPEEC), Brisbane, Australia, 15–18 November 2015; pp. 1–5.
  4. Da Graça, G.C.; Augusto, A.; Lerer, M.M. Solar powered net zero energy houses for southern Europe: Feasibility study. Sol. Energy 2012, 86, 634–646. [Google Scholar] [CrossRef]
  5. Kapsalaki, M.; Leal, V.; Santamouris, M. A methodology for economic efficient design of Net Zero Energy Buildings. Energy Build. 2012, 55, 765–778. [Google Scholar] [CrossRef]
  6. Nedim, T. Minimization of operational cost for an off-grid renewable hybrid system to generate electricity in residential buildings through the SVM and the BCGA methods. Energy Build. 2014, 76, 470–475. [Google Scholar]
  7. Uchida, K.; Senjyu, T.; Urasaki, N.; Yona, A. Installation Effect by Solar Pool System Using Solar Insolation Forecasting. In Proceedings of the 2009 Annual Conference of Power & Energy Society, Tokyo, Japan, 18–20 August 2009; Volume 25, pp. 7–12. (In Japanese)
  8. Shimoji, T.; Tahara, H.; Matayoshi, H.; Yona, A.; Senjyu, T. Comparison and Validation of Operational Cost in Smart Houses with the Introduction of a Heat Pump or a Gas Engine. Int. J. Emerg. Electr. Power Syst. 2015, 16, 59–74. [Google Scholar] [CrossRef]
  9. Lu, X.; Liu, N.; Chen, Q.; Zhang, J. Multi-objective optimal scheduling of a DC micro-grid consisted of PV system and EV charging station. In Proceedings of the 2014 IEEE Innovative Smart Grid Technologies—Asia (ISGT Asia), Kuala Lumpur, Malaysia, 20–23 May 2014; pp. 487–491.
  10. Zhang, T.; Chen, W.; Han, Z.; Cao, Z. Charging Scheduling of Electric Vehicles With Local Renewable Energy Under Uncertain Electric Vehicle Arrival and Grid Power Price. IEEE Trans. Veh. Technol. 2014, 6, 2600–2612. [Google Scholar] [CrossRef]
  11. Reddy, S.S.; Abhyankar, A.R.; Bijwe, P.R. Co-optimization of Energy and Demand-Side Reserves in Day-Ahead Electricity Markets. Int. J. Emerg. Electr. Power Syst. 2015, 16, 195–206. [Google Scholar]
  12. Xia, S.; Ge, X. The Optimized Operation of Gas Turbine Combined Heat and Power Units Oriented for the Grid-Connected Control. Int. J. Emerg. Electr. Power Syst. 2016, 17, 143–150. [Google Scholar] [CrossRef]
  13. Tanaka, K.; Yoza, A.; Ogimi, K.; Yona, A.; Senjyu, T. Optimal operation of DC smart house system by controllable loads based on smart grid topology. Renew. Energy 2012, 39, 132–139. [Google Scholar] [CrossRef]
  14. Bracale, A.; Carpinelli, G.; Fazio, D.A.; Khormali, S. Advanced, Cost-Based Indices for Forecasting the Generation of Photovoltaic Power. Int. J. Emerg. Electr. Power Syst. 2014, 15, 77–91. [Google Scholar] [CrossRef]
  15. Nguyen, M.Y.; Nguyen, D.M. A Generalized Formulation of Demand Response under Market Environments. Int. J. Emerg. Electr. Power Syst. 2015, 16, 217–224. [Google Scholar]
  16. Li, Y.; Pedroni, N.; Zio, E. A Memetic Evolutionary Multi-Objective Optimization Method for Environmental Power Unit Commitment. IEEE Trans. Ower Syst. 2013, 28, 2660–2669. [Google Scholar] [CrossRef]
  17. Shadmand, M.B.; Balog, R.S. Multi-Objective Optimization and Design of Photovoltaic-Wind Hybrid System for Community Smart DC Microgrid. IEEE Trans. Smart Grid 2014, 5, 2635–2643. [Google Scholar] [CrossRef]
  18. Shi, Z.; Peng, Y.; Wei, W. Optimal sizing of DGs and storage for microgrid with interruptible load using improved NSGA-II. In Proceedings of the IEEE 2014 Congress on Evolutionary Computation (CEC), Beijing, China, 6–11 July 2014; pp. 2108–2115.
  19. Sheng, W.; Liu, K.; Liu, Y.; Meng, X.; Li, Y. Optimal Placement and Sizing of Distributed Generation via an Improved Nondominated Sorting Genetic Algorithm II. IEEE Trans. Power Deliv. 2015, 30, 569–578. [Google Scholar] [CrossRef]
  20. Kamjoo, A.; Maheri, A.; Dizqah, A.M.; Putrus, G.A. Multi-objective design under uncertainties of hybrid renewable energy system using NSGA-II and chance constrained programming. Int. J. Emerg. Electr. Power Syst. 2016, 74, 187–194. [Google Scholar] [CrossRef]
  21. Deb, K.; Pratap, A.; Agarwal, S.; Meyarivan, T. A fast and elitist multiobjective genetic algorithm: NSGA-II. IEEE Trans. Evol. Comput. 2002, 6, 182–197. [Google Scholar] [CrossRef]
Figure 1. Off-grid smart house model. SC, Solar Collector.
Sustainability 09 00117 g001
Figure 2. Model of the solar collector system.
Sustainability 09 00117 g002
Figure 3. Operation scheduling flowchart of the Hot Water Heat Pump (HWHP).
Sustainability 09 00117 g003
Figure 4. Flowchart evaluating the capacity of equipment. RSPS, Rate of Supply Power Shortage.
Sustainability 09 00117 g004
Figure 5. Compensation model by EV.
Sustainability 09 00117 g005
Figure 6. Forecast error probability distribution for PV output power.
Sustainability 09 00117 g006
Figure 7. Operation scheme of NSGA2.
Sustainability 09 00117 g007
Figure 8. Flowchart of NSGA2.
Sustainability 09 00117 g008
Figure 9. Power consumption and weather conditions: (a) power consumption on a summer day; (b) power consumption on the other days; (c) outdoor temperature of a year; (d) solar radiation of a year.
Sustainability 09 00117 g009aSustainability 09 00117 g009b
Figure 10. Result of HP operation scheduling model: (a) water temperature of storage tank; (b) power consumption of HP.
Sustainability 09 00117 g010aSustainability 09 00117 g010b
Figure 11. Simulation results.
Sustainability 09 00117 g011
Figure 12. Monthly expected value of RSPS for each solution.
Sustainability 09 00117 g012
Figure 13. Dynamic responses in the summer and winter seasons for Solutions A and B: (a) shortage of the power supply; (b) discharged power from EV to the house; (c) supplied power from EV to the fixed battery; (d) state of charge for EV; (e) state of charge for the fixed battery.
Sustainability 09 00117 g013aSustainability 09 00117 g013b
Table 1. Design parameters per one PV panel.
Rated output power P P V r a t e d = 0.260 kW/panel
Efficiency η P V = 18.8%
Area S P V = 1.65 m2/panel
Cost C P V p a n e l = 9.59 × 10⁴ Yen/panel
Table 2. Design parameters per one fixed battery.
Energy storage capacity C B A r a t e d = 1 kWh/unit
Efficiency η B A = 90%
Inverter capacity P B A , i n v r a t e d = 0.5 kW/unit
Cost C B A u n i t = 20 × 104 Yen/unit
Table 3. Constitution of EV.
Energy storage capacity C E V rated = 24 (kWh)
Inverter capacityHouse P E V i n v , 1 = 6.0 (kW)
EV charging station P E V i n v , 2 = 50 (kW)
Efficiency η E V = 90 %
Power consumption0.114 kWh/km
Mileage61.4 km/day
Table 4. Result of Pareto optimal solutions.
SolutionF1 (%)F2 × 104 (Yen)NPV (panel)NBA (unit)NPV SPV (m2) N B A C B A r a t e d (kWh) N B A P B A , i n v r a t e d (kW)
A11.229341356.1136.5
B0.8245512184.22110.5

